Embed Size (px)
Citation preview
P O S I V A O Y
Olk i luo to
F I -27160 EURAJOKI , F INLAND
Te l +358-2-8372 31
Fax +358-2-8372 3709
Mika S i l vas t
Bruce Wi l j anen
September 2008
Work ing Repor t 2008 -58
ONKALO EDZ-Measurements Using Ground Penetrating Radar (GPR) Method
September 2008
Working Reports contain information on work in progress
or pending completion.
The conclusions and viewpoints presented in the report
are those of author(s) and do not necessarily
coincide with those of Posiva.
Mika S i l vast
Bruce Wi l j anen
Roadscanne rs Oy
Work ing Report 2008 -58
ONKALO EDZ-Measurements Using Ground Penetrating Radar (GPR) Method
ONKALO EDZ-MEASUREMENTS USING GROUND PENETRATING RADAR (GPR) METHOD ABSTRACT This report presents pilot project results from various Ground Penetrating Radar (GPR)
tests performed on bedrock in ONKALO, the research tunnel system being built for the
final disposal of spent nuclear fuel. In recent years the GPR technology for structure
inspection has improved to faster systems and higher frequencies. Processing and
interpretation software has been developed for better visualization of processed data.
GPR is a powerful non-destructive testing method with major advantages such as fast
measurement speed and continuous survey lines.
The purpose of the tests was to determine the capacity of GPR in identifying the
Excavation Damaged or Disturbed Zone (EDZ). Topics included comparison of
different types of GPR systems and antennas in select locations in the tunnel system and
data presentation. High quality GPR data was obtained from all systems that were used
on surfaces without concrete or steel reinforcement. Data processed using Geo Doctor
software, which enables integrated analysis of available datasets on a single screen,
provided promising results.
Keywords: Ground Penetrating Radar (GPR), Excavation Damaged or Disturbed Zone
(EDZ), Electric Conductivity, Dielectric Value, Geophysics
ONKALON EDZ-VYÖHYKKEEN PILOTTITUTKIMUKSET MAATUTKAMENETELMÄLLÄ
TIIVISTELMÄ
Tämä raportti esittelee pilottihankkeen tuloksia, jossa tutkittiin erilaisia maatutka-
konfiguraatioita ONKALOn kallioperän tutkimuksissa. Maatutkateknologian avulla
voidaan tutkia ainetta rikkomatta jatkuvana profiilina kalliorakenteiden paksuuksia,
laatua ja sijaintia useiden metrien syvyyteen. Lisäksi maatutka-aineistoa voidaan käyttää
integroidusti muiden aineistojen, kuten digitaalivideon, kairatiedon sekä kartoitus-
tietojen kanssa, vaurioiden syiden analysoimiseksi. Viime vuosina maatutkatekniikka on
kehittynyt ja mittausnopeus ja taajuudet ovat kasvaneet. Lisäksi aineiston prosessointi-,
tulkinta- ja analysointiohjelmistot ovat huomattavasti kehittyneempiä kuin aikaisemmin.
Pilottihankkeen tavoitteena oli tutkia ja kehittää maatutka-aineiston mittaus- ja
analysointimenetelmiä erityisesti EDZ (Excavation Damaged Zone)-vyöhykkeen
havaitsemisessa. Työ sisälsi erilaisten maatutkalaitteistojen testausta ja mittaus-
järjestelmän suunnittelua, ja testimittauksia valituissa kohteissa ONKALOssa. Saatujen
tulosten perusteella kehitettiin Geo Doctor –ohjelmiston prosessointi- ja tulkinta-
algoritmeja, joilla EDZ-vyöhykkeen ulottuvuutta voitaisiin arvioida.
Avainsanat: Maatutkaluotaus, EDZ, sähkönjohtavuus, dielektrisyysarvo, geofysiikka
1
TABLE OF CONTENTS ABSTRACT TIIVISTELMÄ
1 INTRODUCTION ....................................................................................................... 2
1.1 EDZ-Programme ................................................................................................. 2 1.2 Objectives of the Verification Sub-Project ........................................................... 2 1.3 Objectives of the Pilot Tests with GPR ................................................................ 3
2 GROUND PENETRATING RADAR TECHNIQUE...................................................... 4
2.1 Principle of the Method ....................................................................................... 4 2.2 Basic Equations of GPR Theory .......................................................................... 5 2.3 Energy Loss and Attenuation .............................................................................. 6 2.4 Electric Conductivity and Dielectric Values of Rock ............................................. 7 2.5 GPR Equipment .................................................................................................. 9
3 PILOT TESTS .......................................................................................................... 11
3.1 Field Measurements .......................................................................................... 11 3.2 Data Processing and Interpretation ................................................................... 12 3.3 Pilot 1: 1500 MHz & 400 MHz Antenna Tests in Tunnel Walls and Floor ........... 16 3.4 Pilot 2: 3D-GPR Antenna Tests in Tunnel Walls and Exhaust Airshaft 1 .......... 20 3.5 Pilot 3: Air-Coupled Antenna Testing and Cross-Section Measurement ............ 28
4 CONCLUSIONS ...................................................................................................... 33 REFERENCES ........................................................................................................... 34
2
1 INTRODUCTION
1.1 EDZ-Programme
Posiva has started an EDZ (Excavation Disturbed Zone) -Programme in autumn 2007
according to TKS 2006 programme and to address issues concerning excavation of
access tunnel in ONKALO (Figure 1.1). The programme consists of three sub-projects
aiming at execution of the planned work within the programme. The outline of the
programme has been described in TKS-programme 2006 (Posiva, 2006).
The EDZ-programme has the following objectives:
- Development of verification methods for characterization of EDZ
- Development of excavation methods for control of EDZ
- Assessment of the significance of EDZ as a path for groundwater flow and transport
- Development of methods to eliminate or mitigate the impact of EDZ to an acceptable
level.
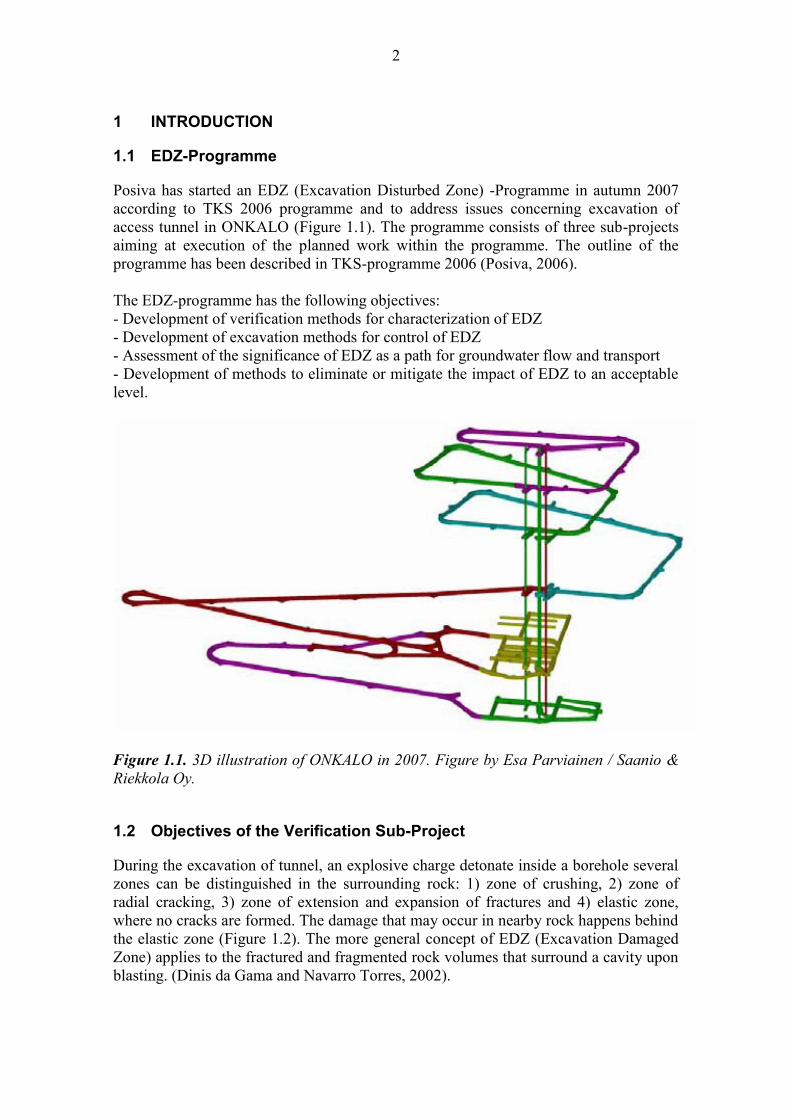
Figure 1.1. 3D illustration of ONKALO in 2007. Figure by Esa Parviainen / Saanio &
Riekkola Oy.
1.2 Objectives of the Verification Sub-Project
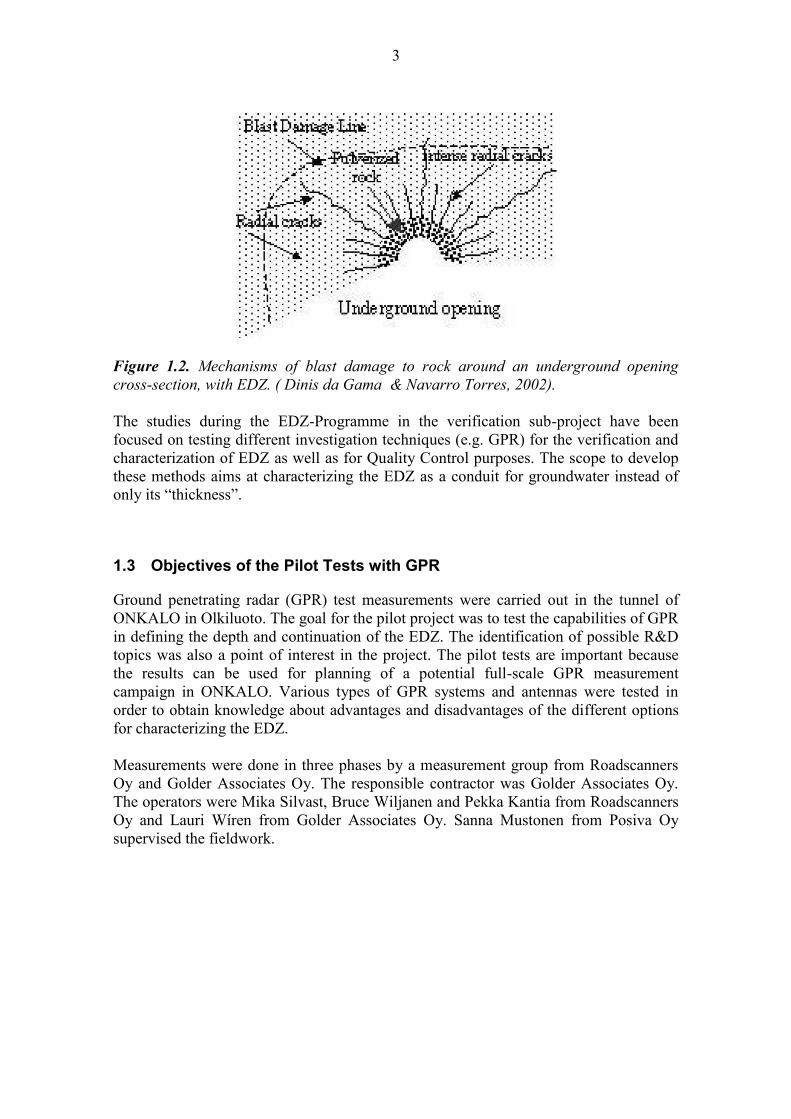
During the excavation of tunnel, an explosive charge detonate inside a borehole several
zones can be distinguished in the surrounding rock: 1) zone of crushing, 2) zone of
radial cracking, 3) zone of extension and expansion of fractures and 4) elastic zone,
where no cracks are formed. The damage that may occur in nearby rock happens behind
the elastic zone (Figure 1.2). The more general concept of EDZ (Excavation Damaged
Zone) applies to the fractured and fragmented rock volumes that surround a cavity upon
blasting. (Dinis da Gama and Navarro Torres, 2002).
3
Figure 1.2. Mechanisms of blast damage to rock around an underground opening
cross-section, with EDZ. ( Dinis da Gama & Navarro Torres, 2002).
The studies during the EDZ-Programme in the verification sub-project have been
focused on testing different investigation techniques (e.g. GPR) for the verification and
characterization of EDZ as well as for Quality Control purposes. The scope to develop
these methods aims at characterizing the EDZ as a conduit for groundwater instead of
only its “thickness”.
1.3 Objectives of the Pilot Tests with GPR
Ground penetrating radar (GPR) test measurements were carried out in the tunnel of
ONKALO in Olkiluoto. The goal for the pilot project was to test the capabilities of GPR
in defining the depth and continuation of the EDZ. The identification of possible R&D
topics was also a point of interest in the project. The pilot tests are important because
the results can be used for planning of a potential full-scale GPR measurement
campaign in ONKALO. Various types of GPR systems and antennas were tested in
order to obtain knowledge about advantages and disadvantages of the different options
for characterizing the EDZ.
Measurements were done in three phases by a measurement group from Roadscanners
Oy and Golder Associates Oy. The responsible contractor was Golder Associates Oy.
The operators were Mika Silvast, Bruce Wiljanen and Pekka Kantia from Roadscanners
Oy and Lauri Wíren from Golder Associates Oy. Sanna Mustonen from Posiva Oy
supervised the fieldwork.
4
2 GROUND PENETRATING RADAR TECHNIQUE
2.1 Principle of the Method
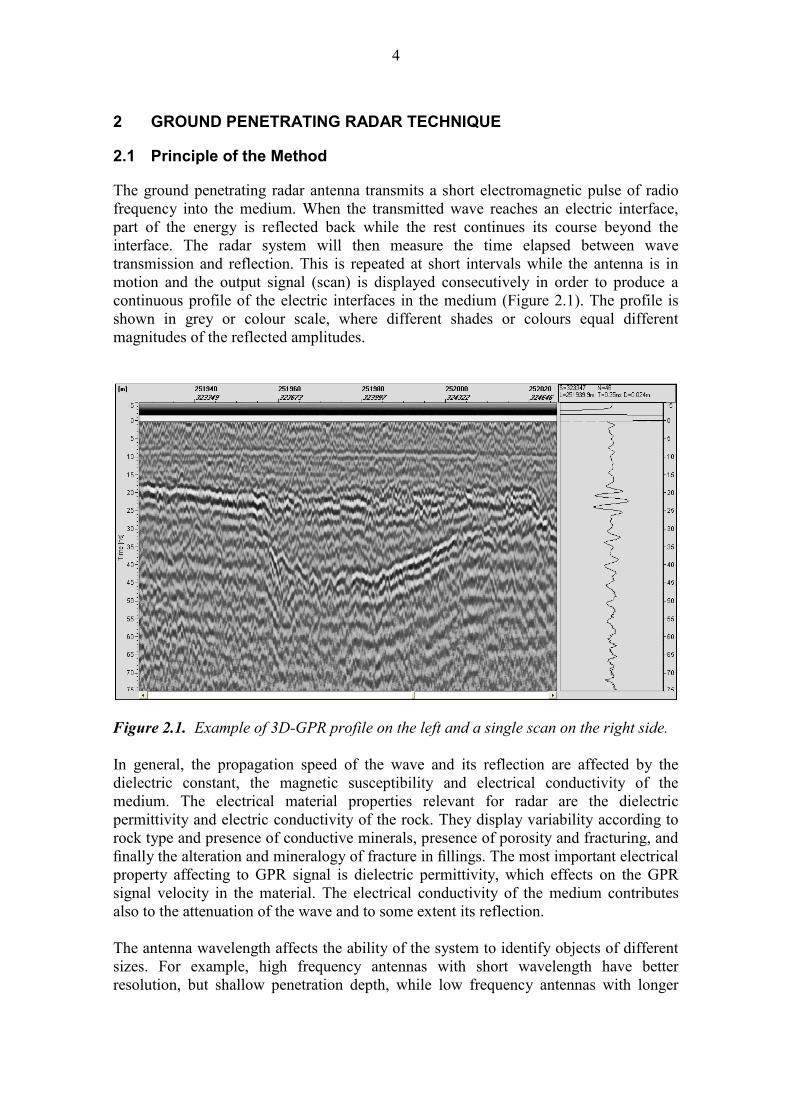
The ground penetrating radar antenna transmits a short electromagnetic pulse of radio
frequency into the medium. When the transmitted wave reaches an electric interface,
part of the energy is reflected back while the rest continues its course beyond the
interface. The radar system will then measure the time elapsed between wave
transmission and reflection. This is repeated at short intervals while the antenna is in
motion and the output signal (scan) is displayed consecutively in order to produce a
continuous profile of the electric interfaces in the medium (Figure 2.1). The profile is
shown in grey or colour scale, where different shades or colours equal different
magnitudes of the reflected amplitudes.
Figure 2.1. Example of 3D-GPR profile on the left and a single scan on the right side.
In general, the propagation speed of the wave and its reflection are affected by the
dielectric constant, the magnetic susceptibility and electrical conductivity of the
medium. The electrical material properties relevant for radar are the dielectric
permittivity and electric conductivity of the rock. They display variability according to
rock type and presence of conductive minerals, presence of porosity and fracturing, and
finally the alteration and mineralogy of fracture in fillings. The most important electrical
property affecting to GPR signal is dielectric permittivity, which effects on the GPR
signal velocity in the material. The electrical conductivity of the medium contributes
also to the attenuation of the wave and to some extent its reflection.
The antenna wavelength affects the ability of the system to identify objects of different
sizes. For example, high frequency antennas with short wavelength have better
resolution, but shallow penetration depth, while low frequency antennas with longer
5
wavelength have a coarser resolution, but penetrate deeper into the medium. The degree
of saturation with water, the salinity of water, and variation in porosity or fracturing
intensity will also affect to the net propagation of radar waves in the rock mass. Those
are considered as bulk properties of rock mass over intervals of several tens of meters.
The increase of water content in the rock mass will increase electrical permittivity (and
decrease wave velocity) as well as decrease resistivity (increase wave attenuation).
The electrical conductivity of a medium influences the degree of attenuation in the
amplitude of the electromagnetic waves. Significant attenuation takes place when
electrical conductivity becomes greater than 0,010 S/m. If the conductivity is low and
the number of electrical interfaces is high, multiple reflections will reduce penetration
depth, while poor conductivity combined with a small number of interfaces will cause
the wave to be attenuated as a function of the distance between the antenna and the
reflecting interface. (Momayez et al., 1998; Saarenketo, 2006; Saksa et al, 2005).
2.2 Basic Equations of GPR Theory
The electromagnetic pulse transmitted by GPR antenna travels in resistive material with
the speed v, which depends on dielectric permittivity εr and magnetic susceptibility μr
(~1) (Formula 2.1) (Saarenketo, 2006).
rrr
ccv
(2.1)
where v is propagation speed of the wave in medium [m/ns], c is speed of light in a
vacuum (0.3 m/ns).
The depth of the interface is possible to calculate using formula 2.2 (Saarenketo, 2006).
r
ctvts
22 (2.2)
where s is depth of the interface [m] and t is two-way travel time of the signal [ns].
The dielectric value can be calculated using formula 2.3, when the travel time t, speed
of light c and depth of the reflector s are known (Hänninen, 2000).
2
2
s
ctr (2.3)
The wavelength of the received signal is affected by the antenna central frequency and
the dielectric permittivity of the material. The wavelength can be calculated using
formula 2.4 (Hänninen, 1991).
6
rf
c
(2.4)
where λ is wavelength of the signal [m] and f is central frequency of the GPR antenna
[MHz].
According Saksa et al. (2005), when the crystalline rock mass is considered, a typical εr
value is between 5–10 and as a result the radar wave velocity is about one third of the
velocity in air and the wavelength is measured in centimeters or decimeters. In rock
mass with εr = 6 (or v=0.122 m/ns), wavelength is 1.2 m, 0.25 m, 0.12 m or 0.06m when
frequency is 100 MHz, 500 MHz, 1000 or 2000 MHz, respectively. Magnetic
susceptibility μr has been measured in deep boreholes of Olkiluoto. Relative magnetic
permeability is defined in terms of susceptibility as follows:
µr = 1 + κ (2.5)
For narrow sulphide-bearing sections in Olkiluoto the magnetic susceptibility can
exceed 10000 µSI, which will affect (reduce) the velocity more than 1 %. Remanent
magnetization is also present in the rock mass of the area.
2.3 Energy Loss and Attenuation
The radar waves are attenuated as they propagate through the rock. The amplitude of
each frequency decreases, greatest loss in high frequency energy. In time domain this
shows up as broadening of the pulses. Important phenomena having influence are the
dispersivity of electrical conductivity and dielectric permittivity. Dispersion means that
both parameters are varying with the applied frequency. According to the literature
electrical conductivity is increasing with frequency (e.g. Lambot et al, 2004). Dielectric
permittivity can decrease with increasing frequency as described by Saarenketo (2006).
Wave attenuation is an important parameter that can be utilized both in reflection and in
tomographic measurements (Saksa et al, 2005). Attenuation contains information on
permittivity and resistivity variations in rock.
The attenuation of the GPR signal can be calculated using formula 2.6 (SGY, 1991),
rr
r 5,16365,1636 (2.6)
where α is the wave attenuation in material [dB/m] and σ is electrical conductivity
[S/m].
7
The EDZ is assumed to cause dispersion in high frequency part of the signal in the same
analogy with the ultrasonic measurements (IAEA, 2002). By analyzing the reflection
signature and frequency information, the depth of the EDZ can be estimated.
The GPR antennas are sensitive for electromagnetic radio noise especially on high
frequency spectrums. In the tunnel environment the bedrock filters out the radio noise
and it cannot be detected in the data. The tunnel wall reflections, and reflections from
ventilation pipes and electricity installations, are isolated noise sources, possibly
causing anomalies in the data in certain time window, having certain frequency band or
varying in frequency and time. These sources of noise can be detected and filtered out
from the data. (Saksa et al., 2005).
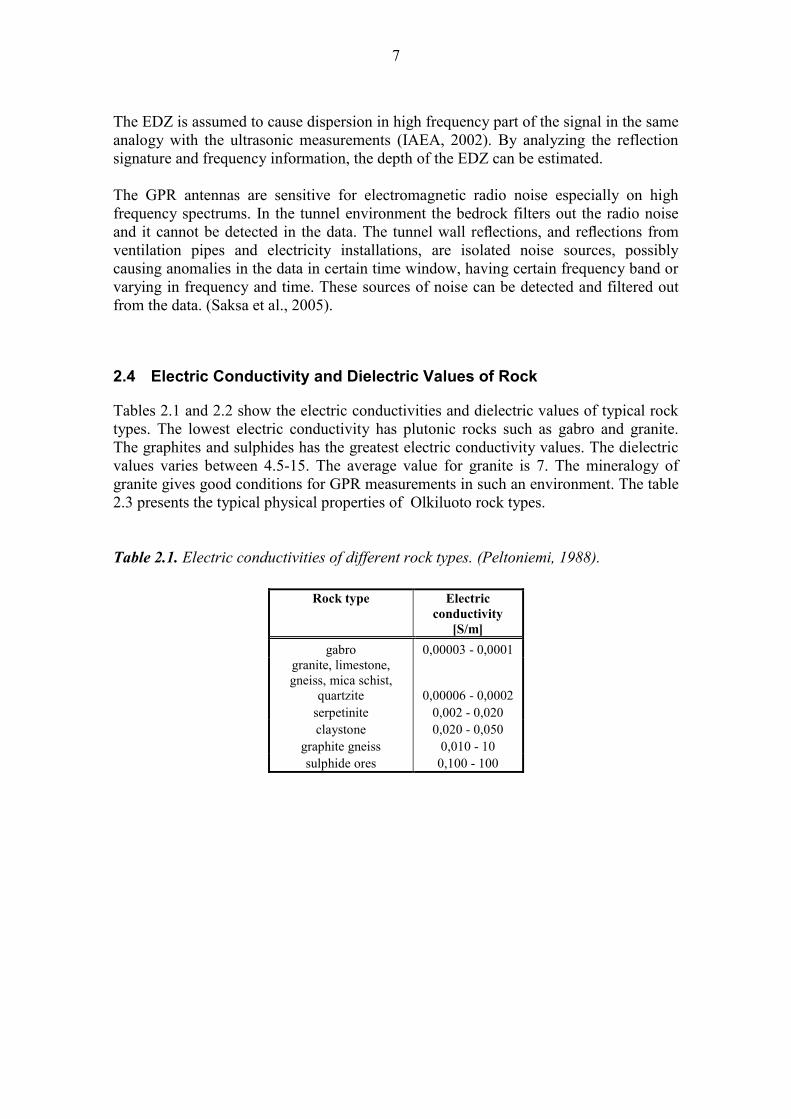
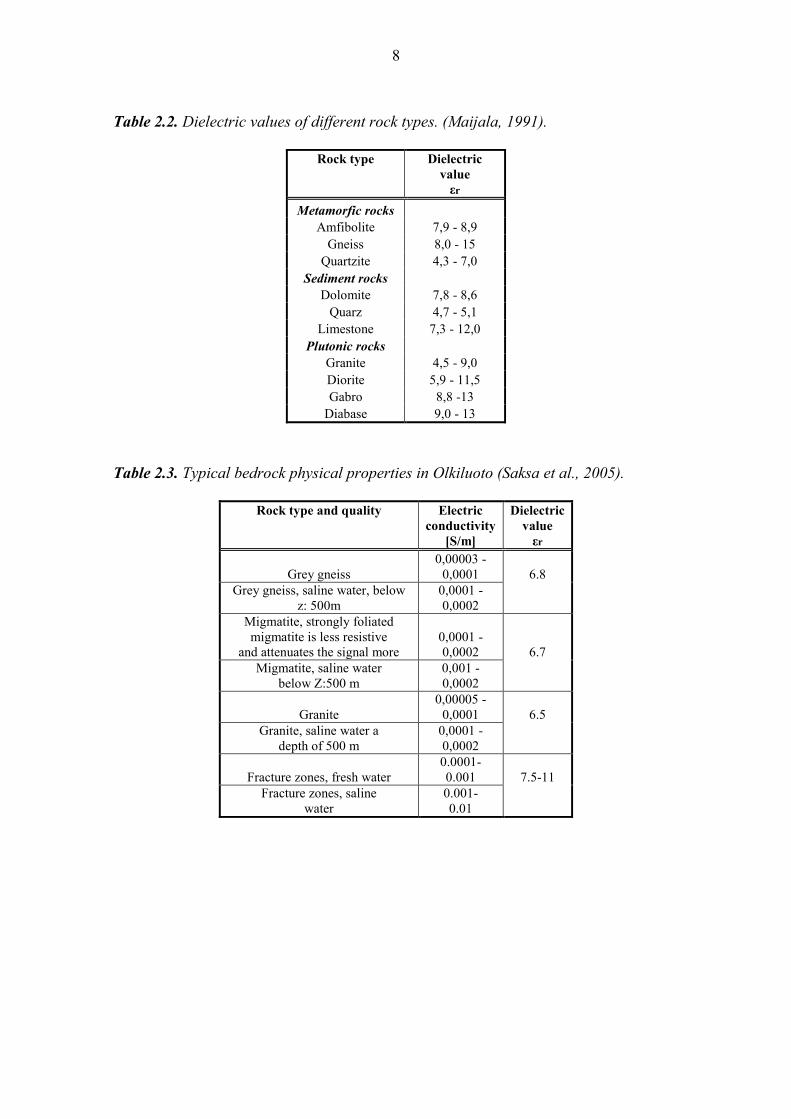
2.4 Electric Conductivity and Dielectric Values of Rock
Tables 2.1 and 2.2 show the electric conductivities and dielectric values of typical rock
types. The lowest electric conductivity has plutonic rocks such as gabro and granite.
The graphites and sulphides has the greatest electric conductivity values. The dielectric
values varies between 4.5-15. The average value for granite is 7. The mineralogy of
granite gives good conditions for GPR measurements in such an environment. The table
2.3 presents the typical physical properties of Olkiluoto rock types.
Table 2.1. Electric conductivities of different rock types. (Peltoniemi, 1988).
Rock type Electric
conductivity
[S/m]
gabro 0,00003 - 0,0001
granite, limestone,
gneiss, mica schist,
quartzite 0,00006 - 0,0002
serpetinite 0,002 - 0,020
claystone 0,020 - 0,050
graphite gneiss 0,010 - 10
sulphide ores 0,100 - 100
8
Table 2.2. Dielectric values of different rock types. (Maijala, 1991).
Rock type Dielectric
value
εr
Metamorfic rocks
Amfibolite 7,9 - 8,9
Gneiss 8,0 - 15
Quartzite 4,3 - 7,0
Sediment rocks
Dolomite 7,8 - 8,6
Quarz 4,7 - 5,1
Limestone 7,3 - 12,0
Plutonic rocks
Granite 4,5 - 9,0
Diorite 5,9 - 11,5
Gabro 8,8 -13
Diabase 9,0 - 13
Table 2.3. Typical bedrock physical properties in Olkiluoto (Saksa et al., 2005).
Rock type and quality Electric
conductivity
[S/m]
Dielectric
value
εr
Grey gneiss
0,00003 -
0,0001 6.8
Grey gneiss, saline water, below
z: 500m
0,0001 -
0,0002
Migmatite, strongly foliated
migmatite is less resistive
and attenuates the signal more
0,0001 -
0,0002 6.7
Migmatite, saline water
below Z:500 m
0,001 -
0,0002
Granite
0,00005 -
0,0001 6.5
Granite, saline water a
depth of 500 m
0,0001 -
0,0002
Fracture zones, fresh water
0.0001-
0.001 7.5-11
Fracture zones, saline
water
0.001-
0.01
9
2.5 GPR Equipment
GPR systems use discrete pulses of radar energy. These systems typically have the
following four components (e.g. Saarenketo & Scullion, 2000):
1) a pulse generator which generates a single pulse of a given frequency and power
2) a transmitter antenna, which transmits the pulse into the medium to be measured
3) a receiver antenna, which collects the reflected signals and amplifies the signal
4) a sampler which captures and stores the information from receiver antenna.
There are two main types of GPR systems: traditional time-domain pulse systems and
SFCW (stepped-frequency continuous- wave) frequency-domain systems. The radar
antennas are normally categorized in two groups: air-launched horn antennas and
ground-launched dipole antennas.
The air-launched systems operate around 1-2 GHz. The penetration depth of the horn
antennas is limited to approximately 1 m. During the data collection antennas are
suspended approximately 0.3-0.5 m above the measured surface. The speed of the
measurements is high, even up to 90 km/h.
On the contrary, the ground-coupled antennas operate in a wide range of frequencies
from 40-2500 MHz. The advantage of ground-coupled antennas are better penetration
depth and vertical resolution. The antennas need to be in contact with or near the surface
and therefore are not optimized on larger scale measurements due to slow measurement
speed.
The stepped-frequency 3D-GPR system can be considered as the air-coupled antenna.
3D-GPR antenna arrays may consist of several (up to 63) transmitter-receiver dipoles
with the 7.5 cm side distance between antenna elements. The antenna array can be lifted
up to 1 m distance from the measured surface. The frequency-domain 3D-GPR system
is efficient especially in applications where detailed information is required. The dense
measurement grid provides information both in longitudinal and transverse direction.
This makes it an optional system to measure large areas at a relatively fast speed. On the
other hand the post-processing software and interpretations is more time-consuming
than with the traditional measurements.
The 3D-GPR system emits a step-frequency continuous-wave (SFCW) waveform,
which is a sinewave with constant amplitude and stepwise frequency variation. Figure
2.2 shows an example of a SFCW waveform. The waveform is specified by determining
a start frequency (fmin), a stop frequency (fmax), a frequency step (∆f), and a dwell time
(Td). (3D-Radar, 2005.
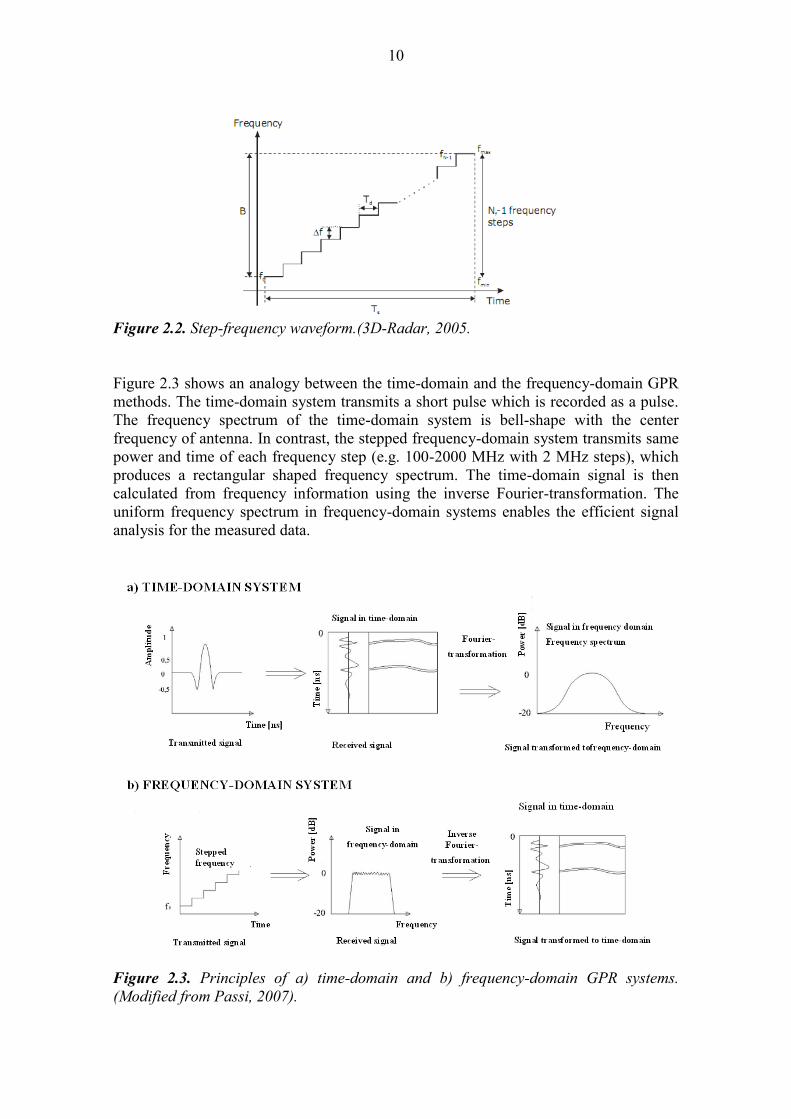
10
Figure 2.2. Step-frequency waveform.(3D-Radar, 2005.
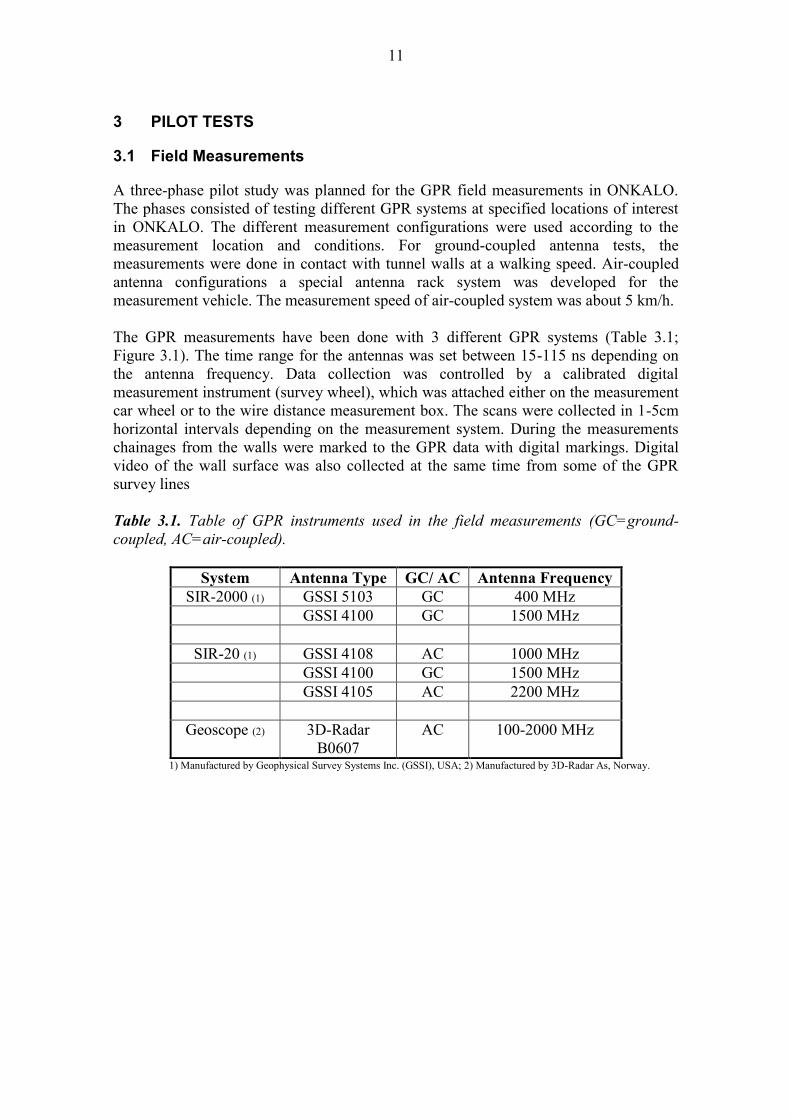
Figure 2.3 shows an analogy between the time-domain and the frequency-domain GPR
methods. The time-domain system transmits a short pulse which is recorded as a pulse.
The frequency spectrum of the time-domain system is bell-shape with the center
frequency of antenna. In contrast, the stepped frequency-domain system transmits same
power and time of each frequency step (e.g. 100-2000 MHz with 2 MHz steps), which
produces a rectangular shaped frequency spectrum. The time-domain signal is then
calculated from frequency information using the inverse Fourier-transformation. The
uniform frequency spectrum in frequency-domain systems enables the efficient signal
analysis for the measured data.
Figure 2.3. Principles of a) time-domain and b) frequency-domain GPR systems.
(Modified from Passi, 2007).
11
3 PILOT TESTS
3.1 Field Measurements
A three-phase pilot study was planned for the GPR field measurements in ONKALO.
The phases consisted of testing different GPR systems at specified locations of interest
in ONKALO. The different measurement configurations were used according to the
measurement location and conditions. For ground-coupled antenna tests, the
measurements were done in contact with tunnel walls at a walking speed. Air-coupled
antenna configurations a special antenna rack system was developed for the
measurement vehicle. The measurement speed of air-coupled system was about 5 km/h.
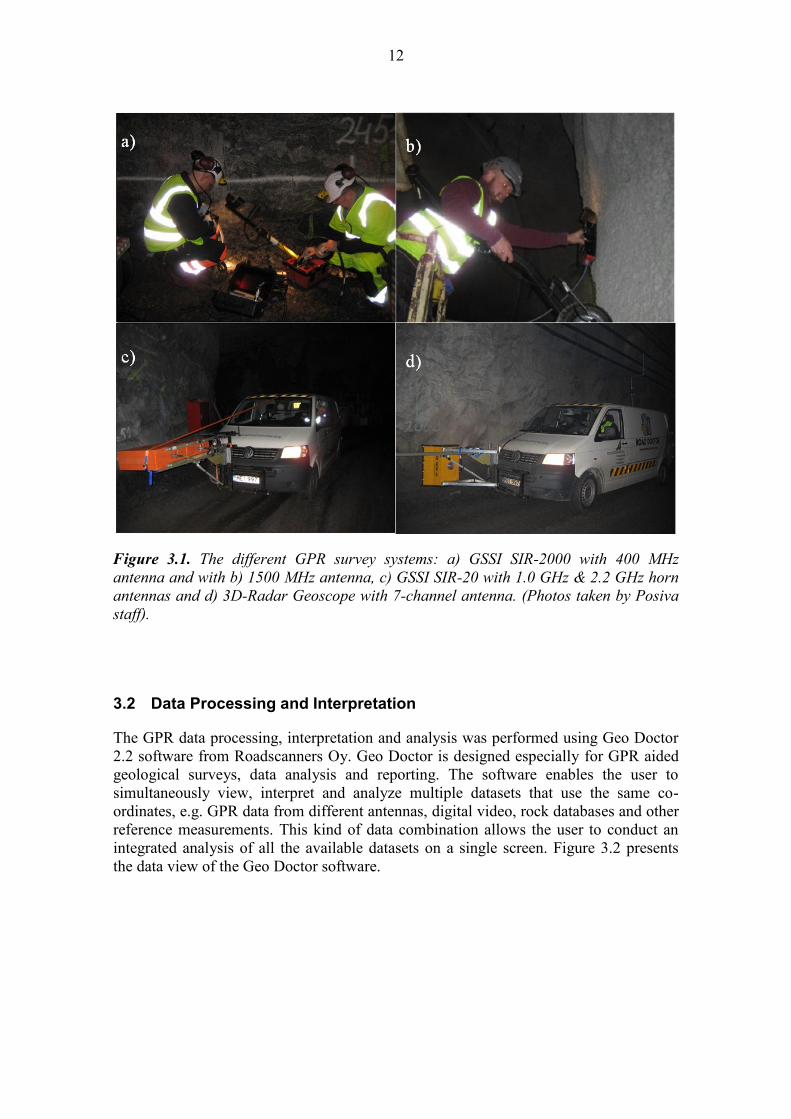
The GPR measurements have been done with 3 different GPR systems (Table 3.1;
Figure 3.1). The time range for the antennas was set between 15-115 ns depending on
the antenna frequency. Data collection was controlled by a calibrated digital
measurement instrument (survey wheel), which was attached either on the measurement
car wheel or to the wire distance measurement box. The scans were collected in 1-5cm
horizontal intervals depending on the measurement system. During the measurements
chainages from the walls were marked to the GPR data with digital markings. Digital
video of the wall surface was also collected at the same time from some of the GPR
survey lines
Table 3.1. Table of GPR instruments used in the field measurements (GC=ground-
coupled, AC=air-coupled).
System Antenna Type GC/ AC Antenna Frequency
SIR-2000 (1) GSSI 5103 GC 400 MHz
GSSI 4100 GC 1500 MHz
SIR-20 (1) GSSI 4108 AC 1000 MHz
GSSI 4100 GC 1500 MHz
GSSI 4105 AC 2200 MHz
Geoscope (2) 3D-Radar
B0607
AC 100-2000 MHz
1) Manufactured by Geophysical Survey Systems Inc. (GSSI), USA; 2) Manufactured by 3D-Radar As, Norway.
12
Figure 3.1. The different GPR survey systems: a) GSSI SIR-2000 with 400 MHz
antenna and with b) 1500 MHz antenna, c) GSSI SIR-20 with 1.0 GHz & 2.2 GHz horn
antennas and d) 3D-Radar Geoscope with 7-channel antenna. (Photos taken by Posiva
staff).
3.2 Data Processing and Interpretation
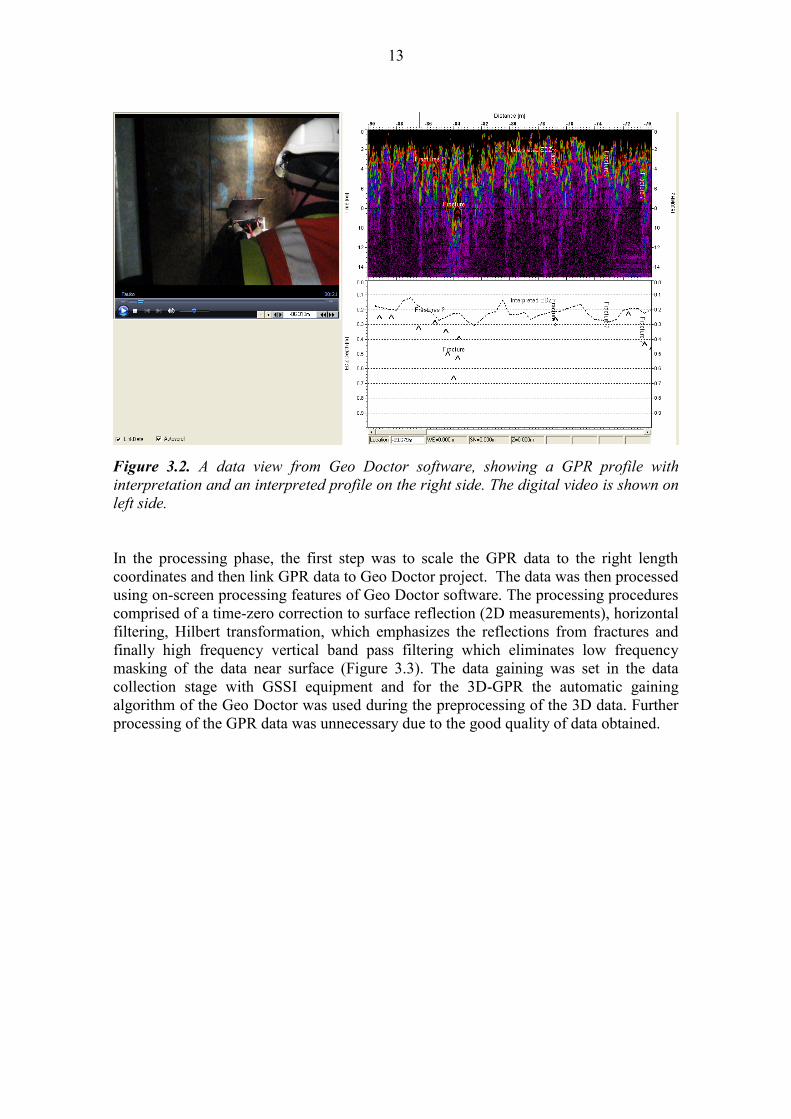
The GPR data processing, interpretation and analysis was performed using Geo Doctor
2.2 software from Roadscanners Oy. Geo Doctor is designed especially for GPR aided
geological surveys, data analysis and reporting. The software enables the user to
simultaneously view, interpret and analyze multiple datasets that use the same co-
ordinates, e.g. GPR data from different antennas, digital video, rock databases and other
reference measurements. This kind of data combination allows the user to conduct an
integrated analysis of all the available datasets on a single screen. Figure 3.2 presents
the data view of the Geo Doctor software.
13
Figure 3.2. A data view from Geo Doctor software, showing a GPR profile with
interpretation and an interpreted profile on the right side. The digital video is shown on
left side.
In the processing phase, the first step was to scale the GPR data to the right length
coordinates and then link GPR data to Geo Doctor project. The data was then processed
using on-screen processing features of Geo Doctor software. The processing procedures
comprised of a time-zero correction to surface reflection (2D measurements), horizontal
filtering, Hilbert transformation, which emphasizes the reflections from fractures and
finally high frequency vertical band pass filtering which eliminates low frequency
masking of the data near surface (Figure 3.3). The data gaining was set in the data
collection stage with GSSI equipment and for the 3D-GPR the automatic gaining
algorithm of the Geo Doctor was used during the preprocessing of the 3D data. Further
processing of the GPR data was unnecessary due to the good quality of data obtained.
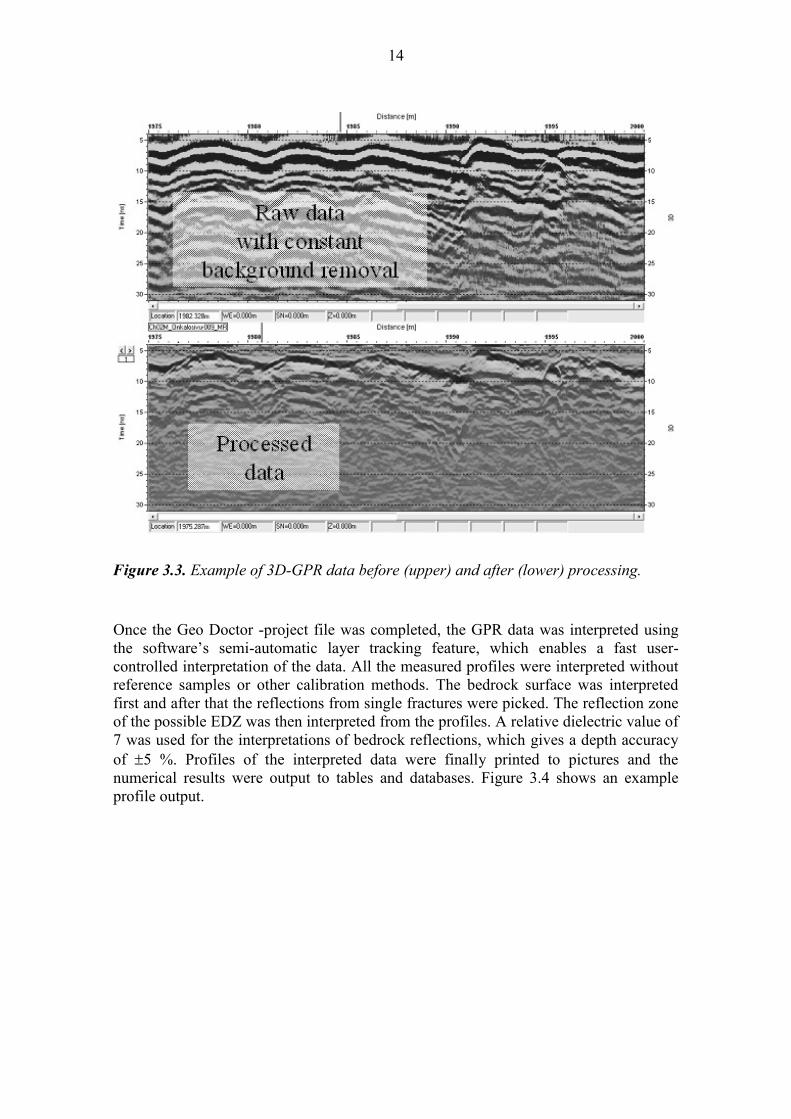
14
Figure 3.3. Example of 3D-GPR data before (upper) and after (lower) processing.
Once the Geo Doctor -project file was completed, the GPR data was interpreted using
the software’s semi-automatic layer tracking feature, which enables a fast user-
controlled interpretation of the data. All the measured profiles were interpreted without
reference samples or other calibration methods. The bedrock surface was interpreted
first and after that the reflections from single fractures were picked. The reflection zone
of the possible EDZ was then interpreted from the profiles. A relative dielectric value of
7 was used for the interpretations of bedrock reflections, which gives a depth accuracy
of 5 %. Profiles of the interpreted data were finally printed to pictures and the
numerical results were output to tables and databases. Figure 3.4 shows an example
profile output.
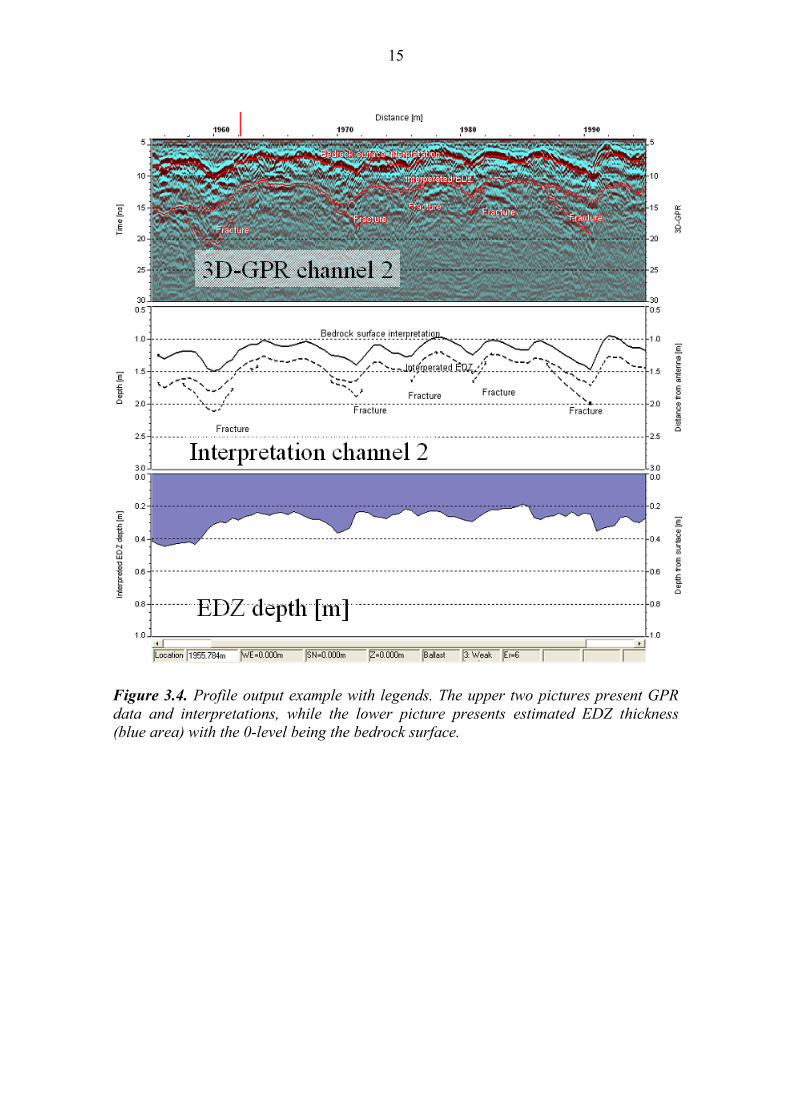
15
Figure 3.4. Profile output example with legends. The upper two pictures present GPR
data and interpretations, while the lower picture presents estimated EDZ thickness
(blue area) with the 0-level being the bedrock surface.
16
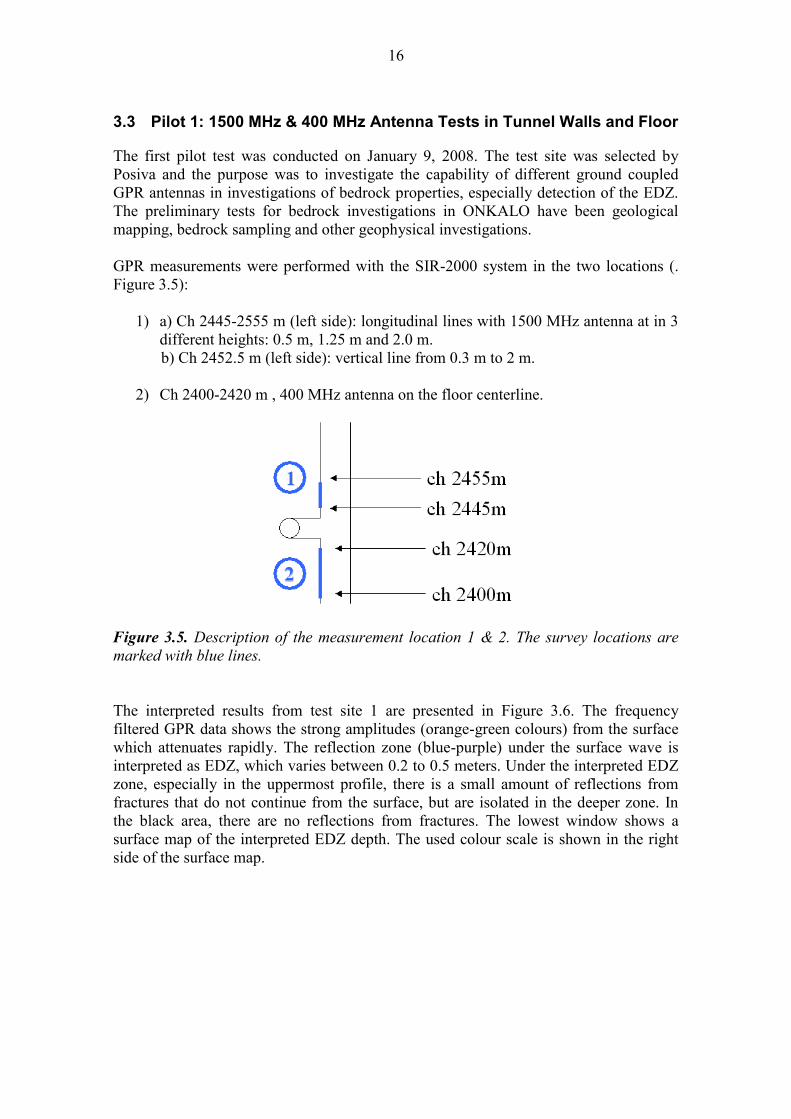
3.3 Pilot 1: 1500 MHz & 400 MHz Antenna Tests in Tunnel Walls and Floor
The first pilot test was conducted on January 9, 2008. The test site was selected by
Posiva and the purpose was to investigate the capability of different ground coupled
GPR antennas in investigations of bedrock properties, especially detection of the EDZ.
The preliminary tests for bedrock investigations in ONKALO have been geological
mapping, bedrock sampling and other geophysical investigations.
GPR measurements were performed with the SIR-2000 system in the two locations (.
Figure 3.5):
1) a) Ch 2445-2555 m (left side): longitudinal lines with 1500 MHz antenna at in 3
different heights: 0.5 m, 1.25 m and 2.0 m.
b) Ch 2452.5 m (left side): vertical line from 0.3 m to 2 m.
2) Ch 2400-2420 m , 400 MHz antenna on the floor centerline.
Figure 3.5. Description of the measurement location 1 & 2. The survey locations are
marked with blue lines.
The interpreted results from test site 1 are presented in Figure 3.6. The frequency
filtered GPR data shows the strong amplitudes (orange-green colours) from the surface
which attenuates rapidly. The reflection zone (blue-purple) under the surface wave is
interpreted as EDZ, which varies between 0.2 to 0.5 meters. Under the interpreted EDZ
zone, especially in the uppermost profile, there is a small amount of reflections from
fractures that do not continue from the surface, but are isolated in the deeper zone. In
the black area, there are no reflections from fractures. The lowest window shows a
surface map of the interpreted EDZ depth. The used colour scale is shown in the right
side of the surface map.
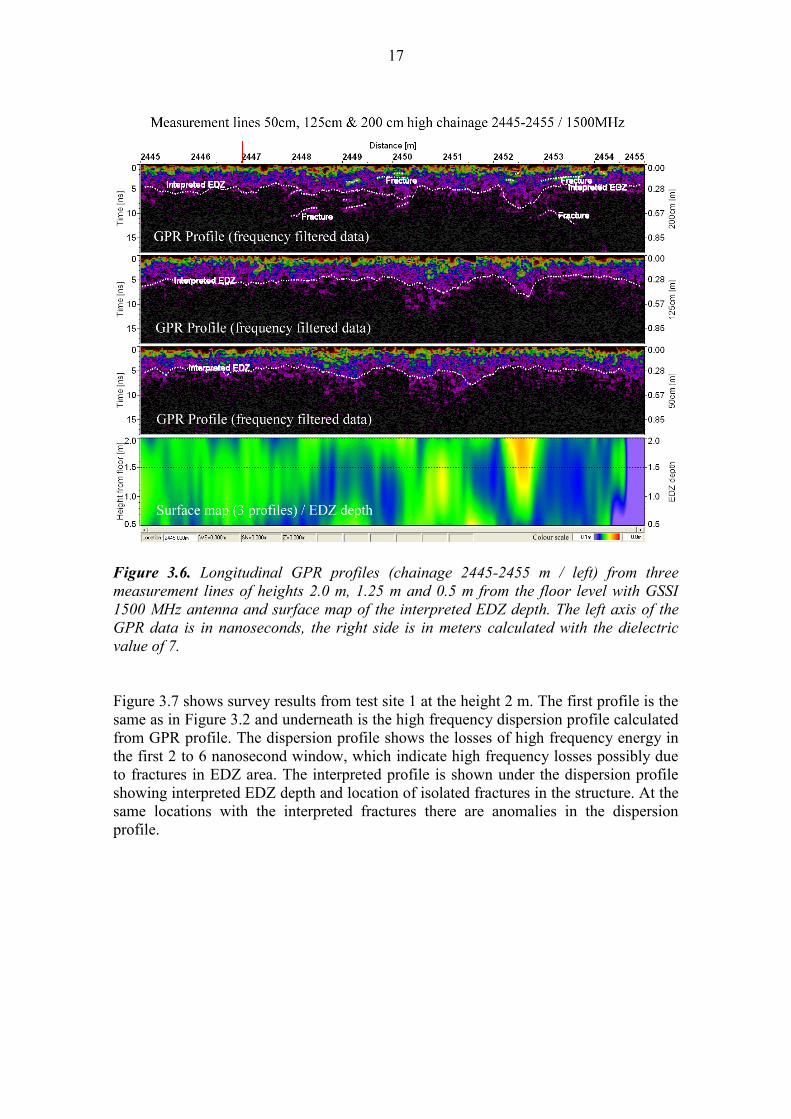
17
Figure 3.6. Longitudinal GPR profiles (chainage 2445-2455 m / left) from three
measurement lines of heights 2.0 m, 1.25 m and 0.5 m from the floor level with GSSI
1500 MHz antenna and surface map of the interpreted EDZ depth. The left axis of the
GPR data is in nanoseconds, the right side is in meters calculated with the dielectric
value of 7.
Figure 3.7 shows survey results from test site 1 at the height 2 m. The first profile is the
same as in Figure 3.2 and underneath is the high frequency dispersion profile calculated
from GPR profile. The dispersion profile shows the losses of high frequency energy in
the first 2 to 6 nanosecond window, which indicate high frequency losses possibly due
to fractures in EDZ area. The interpreted profile is shown under the dispersion profile
showing interpreted EDZ depth and location of isolated fractures in the structure. At the
same locations with the interpreted fractures there are anomalies in the dispersion
profile.
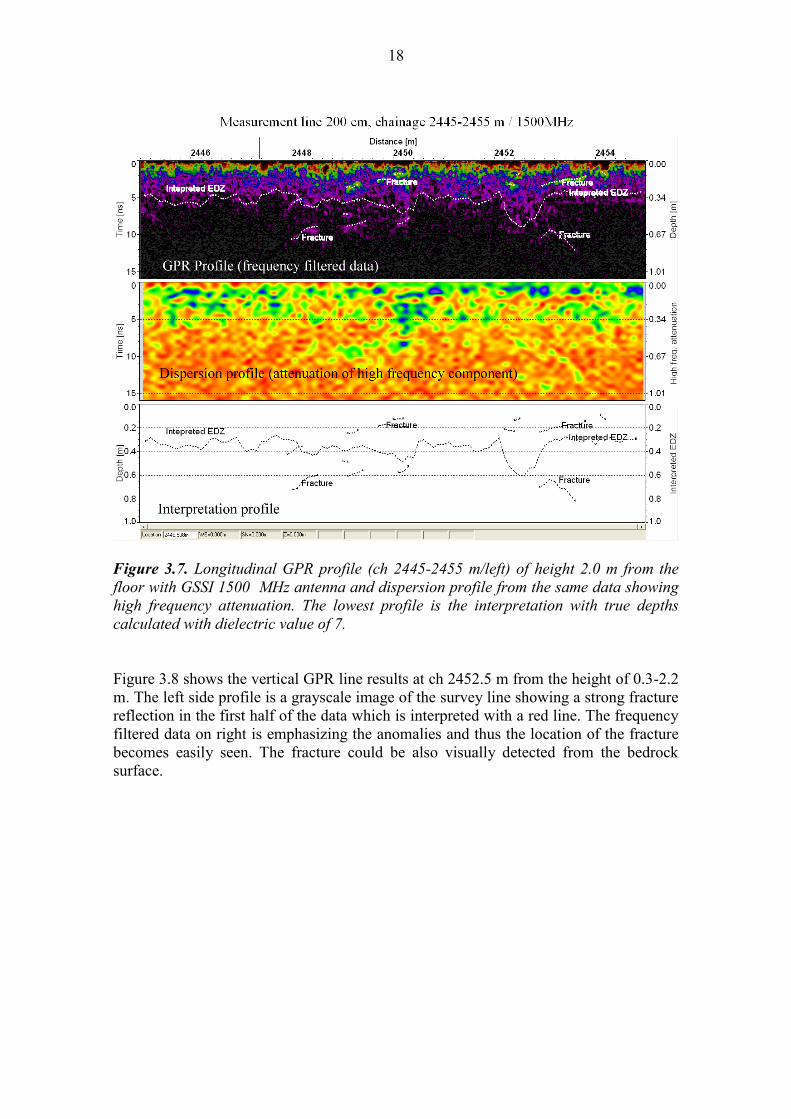
18
Figure 3.7. Longitudinal GPR profile (ch 2445-2455 m/left) of height 2.0 m from the
floor with GSSI 1500 MHz antenna and dispersion profile from the same data showing
high frequency attenuation. The lowest profile is the interpretation with true depths
calculated with dielectric value of 7.
Figure 3.8 shows the vertical GPR line results at ch 2452.5 m from the height of 0.3-2.2
m. The left side profile is a grayscale image of the survey line showing a strong fracture
reflection in the first half of the data which is interpreted with a red line. The frequency
filtered data on right is emphasizing the anomalies and thus the location of the fracture
becomes easily seen. The fracture could be also visually detected from the bedrock
surface.
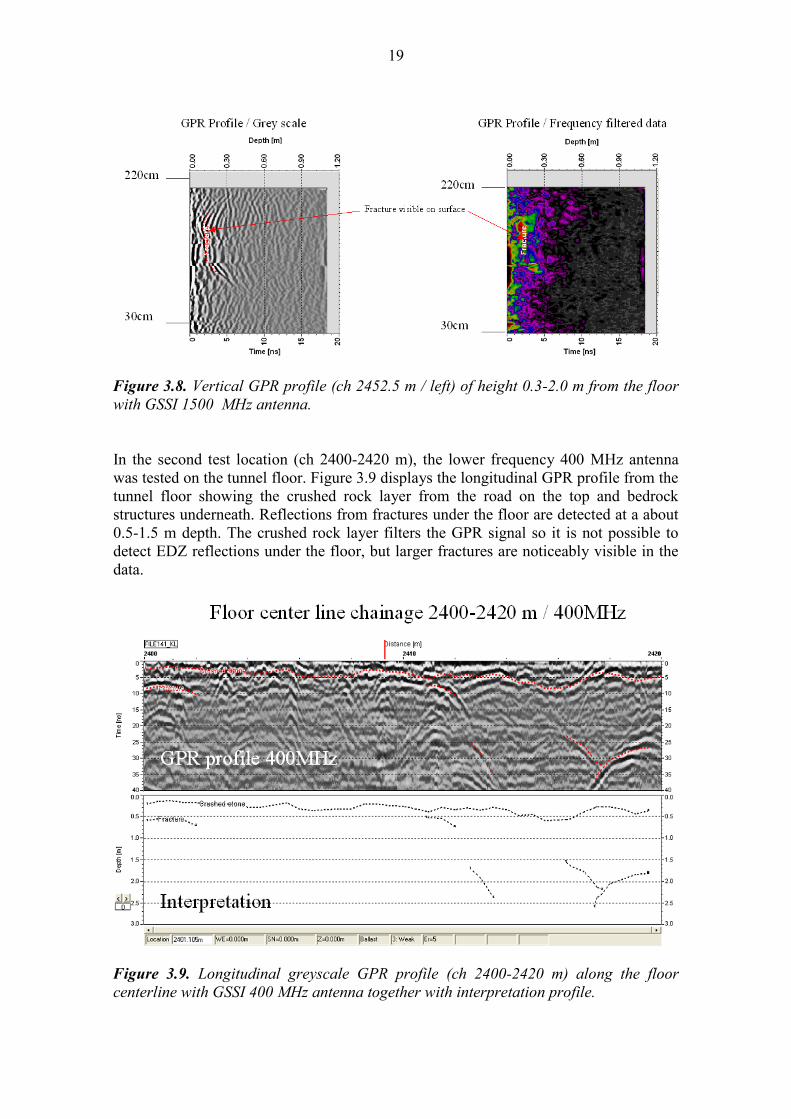
19
Figure 3.8. Vertical GPR profile (ch 2452.5 m / left) of height 0.3-2.0 m from the floor
with GSSI 1500 MHz antenna.
In the second test location (ch 2400-2420 m), the lower frequency 400 MHz antenna
was tested on the tunnel floor. Figure 3.9 displays the longitudinal GPR profile from the
tunnel floor showing the crushed rock layer from the road on the top and bedrock
structures underneath. Reflections from fractures under the floor are detected at a about
0.5-1.5 m depth. The crushed rock layer filters the GPR signal so it is not possible to
detect EDZ reflections under the floor, but larger fractures are noticeably visible in the
data.
Figure 3.9. Longitudinal greyscale GPR profile (ch 2400-2420 m) along the floor
centerline with GSSI 400 MHz antenna together with interpretation profile.
20
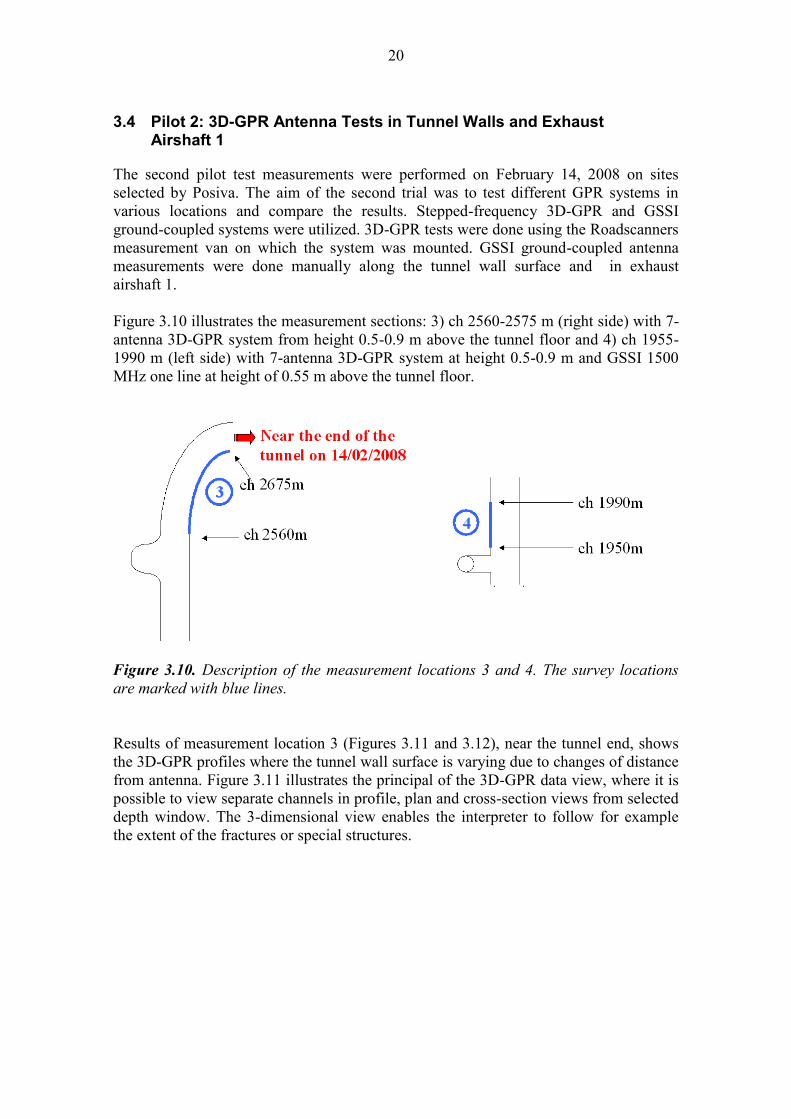
3.4 Pilot 2: 3D-GPR Antenna Tests in Tunnel Walls and Exhaust Airshaft 1
The second pilot test measurements were performed on February 14, 2008 on sites
selected by Posiva. The aim of the second trial was to test different GPR systems in
various locations and compare the results. Stepped-frequency 3D-GPR and GSSI
ground-coupled systems were utilized. 3D-GPR tests were done using the Roadscanners
measurement van on which the system was mounted. GSSI ground-coupled antenna
measurements were done manually along the tunnel wall surface and in exhaust
airshaft 1.
Figure 3.10 illustrates the measurement sections: 3) ch 2560-2575 m (right side) with 7-
antenna 3D-GPR system from height 0.5-0.9 m above the tunnel floor and 4) ch 1955-
1990 m (left side) with 7-antenna 3D-GPR system at height 0.5-0.9 m and GSSI 1500
MHz one line at height of 0.55 m above the tunnel floor.
Figure 3.10. Description of the measurement locations 3 and 4. The survey locations
are marked with blue lines.
Results of measurement location 3 (Figures 3.11 and 3.12), near the tunnel end, shows
the 3D-GPR profiles where the tunnel wall surface is varying due to changes of distance
from antenna. Figure 3.11 illustrates the principal of the 3D-GPR data view, where it is
possible to view separate channels in profile, plan and cross-section views from selected
depth window. The 3-dimensional view enables the interpreter to follow for example
the extent of the fractures or special structures.
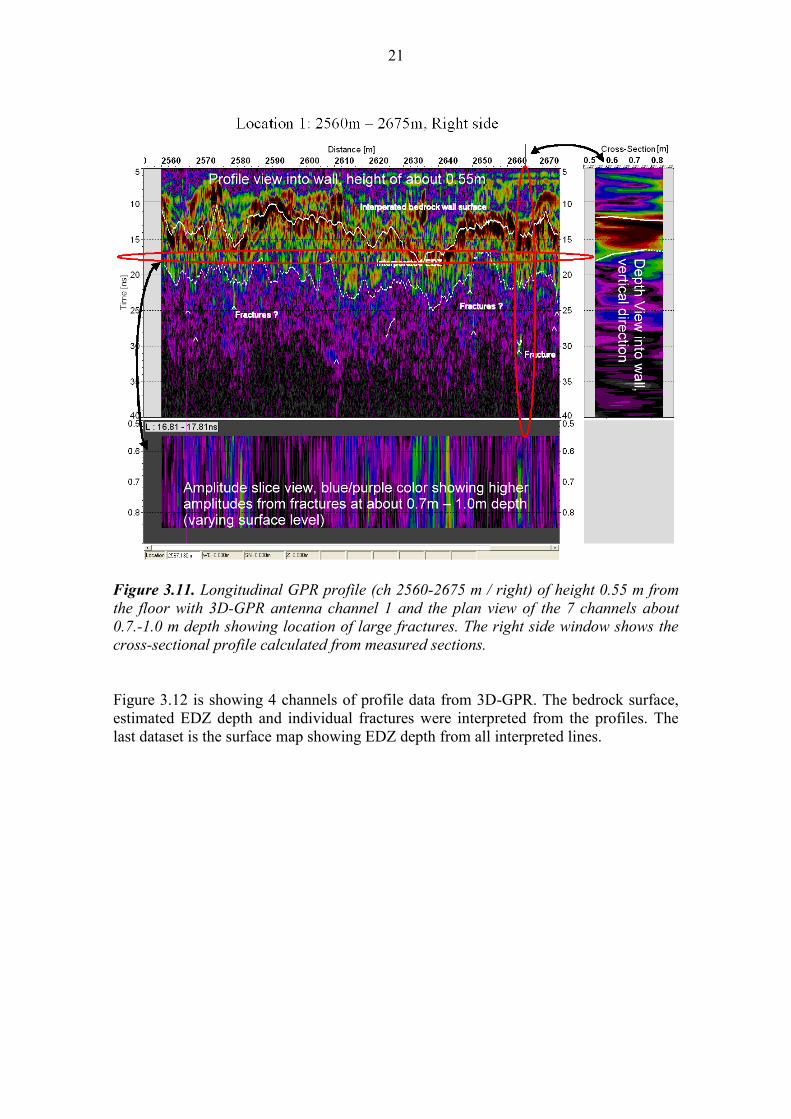
21
Figure 3.11. Longitudinal GPR profile (ch 2560-2675 m / right) of height 0.55 m from
the floor with 3D-GPR antenna channel 1 and the plan view of the 7 channels about
0.7.-1.0 m depth showing location of large fractures. The right side window shows the
cross-sectional profile calculated from measured sections.
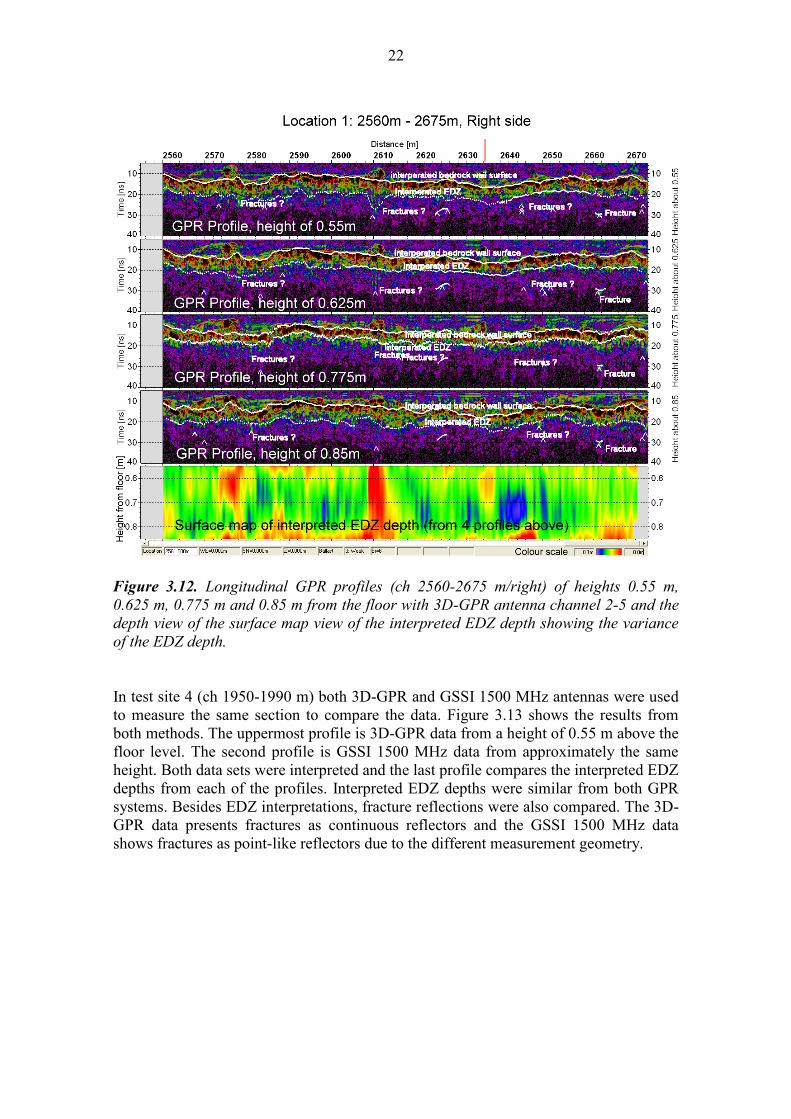
Figure 3.12 is showing 4 channels of profile data from 3D-GPR. The bedrock surface,
estimated EDZ depth and individual fractures were interpreted from the profiles. The
last dataset is the surface map showing EDZ depth from all interpreted lines.
22
Figure 3.12. Longitudinal GPR profiles (ch 2560-2675 m/right) of heights 0.55 m,
0.625 m, 0.775 m and 0.85 m from the floor with 3D-GPR antenna channel 2-5 and the
depth view of the surface map view of the interpreted EDZ depth showing the variance
of the EDZ depth.
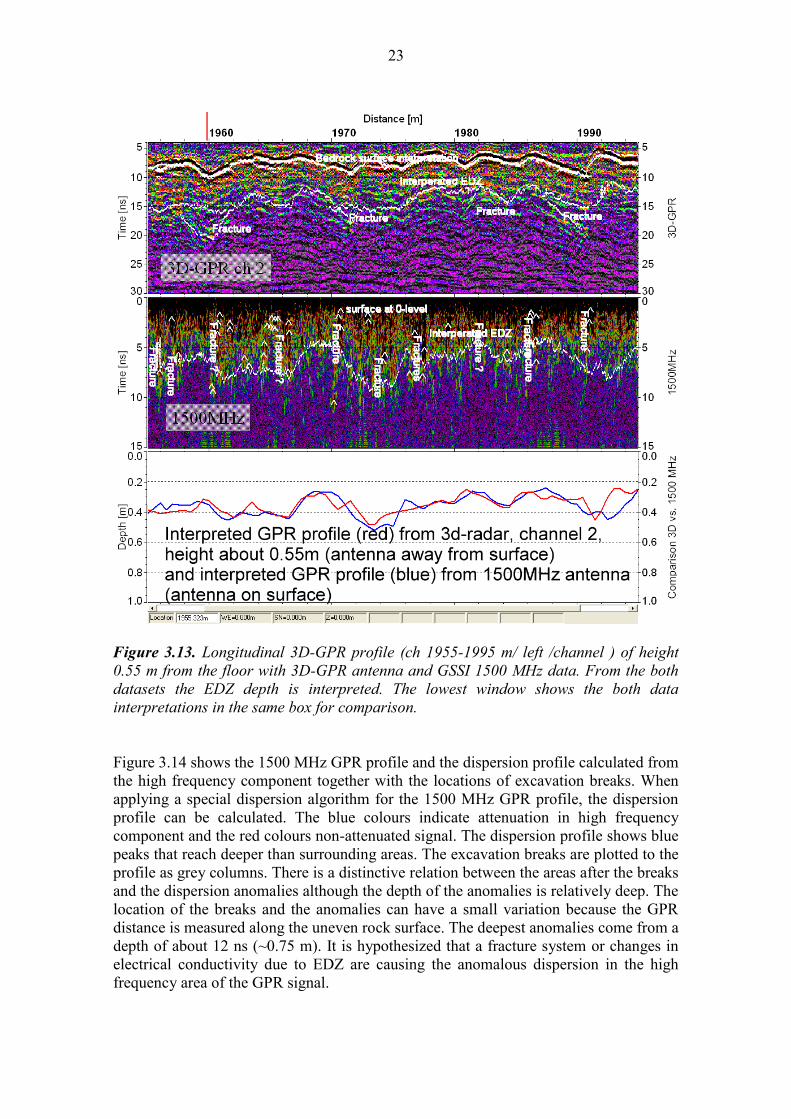
In test site 4 (ch 1950-1990 m) both 3D-GPR and GSSI 1500 MHz antennas were used
to measure the same section to compare the data. Figure 3.13 shows the results from
both methods. The uppermost profile is 3D-GPR data from a height of 0.55 m above the
floor level. The second profile is GSSI 1500 MHz data from approximately the same
height. Both data sets were interpreted and the last profile compares the interpreted EDZ
depths from each of the profiles. Interpreted EDZ depths were similar from both GPR
systems. Besides EDZ interpretations, fracture reflections were also compared. The 3D-
GPR data presents fractures as continuous reflectors and the GSSI 1500 MHz data
shows fractures as point-like reflectors due to the different measurement geometry.
23
Figure 3.13. Longitudinal 3D-GPR profile (ch 1955-1995 m/ left /channel ) of height
0.55 m from the floor with 3D-GPR antenna and GSSI 1500 MHz data. From the both
datasets the EDZ depth is interpreted. The lowest window shows the both data
interpretations in the same box for comparison.
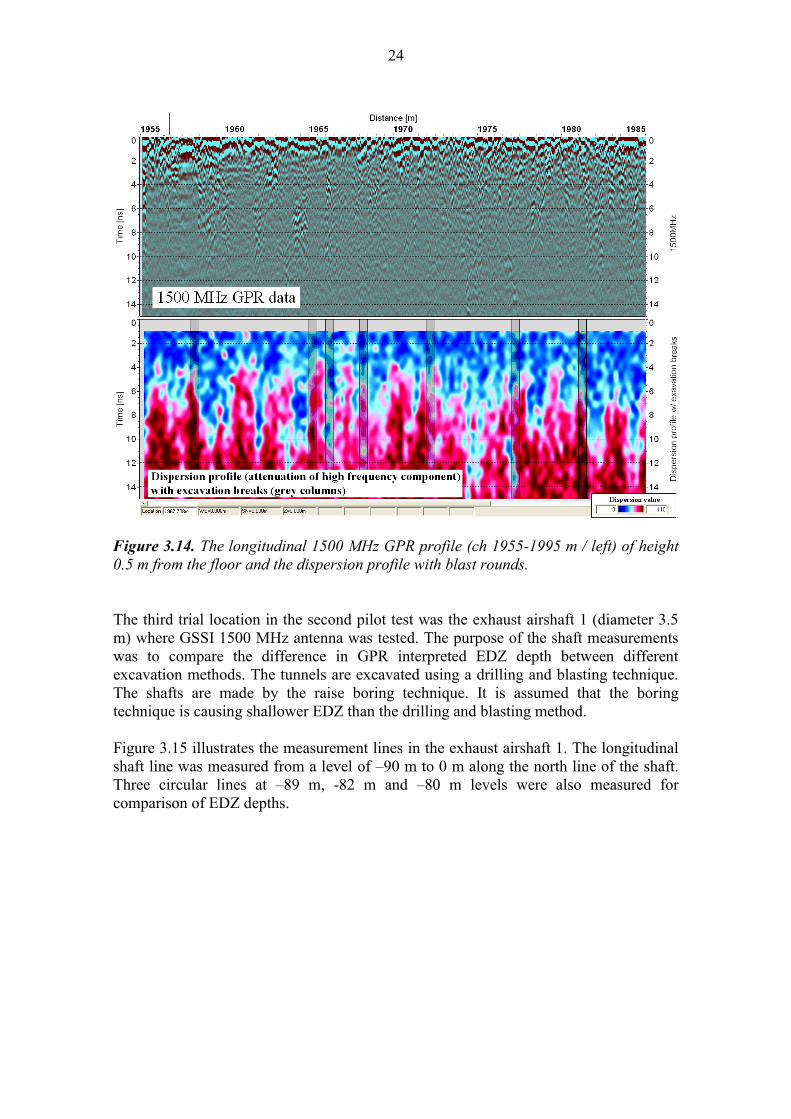
Figure 3.14 shows the 1500 MHz GPR profile and the dispersion profile calculated from
the high frequency component together with the locations of excavation breaks. When
applying a special dispersion algorithm for the 1500 MHz GPR profile, the dispersion
profile can be calculated. The blue colours indicate attenuation in high frequency
component and the red colours non-attenuated signal. The dispersion profile shows blue
peaks that reach deeper than surrounding areas. The excavation breaks are plotted to the
profile as grey columns. There is a distinctive relation between the areas after the breaks
and the dispersion anomalies although the depth of the anomalies is relatively deep. The
location of the breaks and the anomalies can have a small variation because the GPR
distance is measured along the uneven rock surface. The deepest anomalies come from a
depth of about 12 ns (~0.75 m). It is hypothesized that a fracture system or changes in
electrical conductivity due to EDZ are causing the anomalous dispersion in the high
frequency area of the GPR signal.
24
Figure 3.14. The longitudinal 1500 MHz GPR profile (ch 1955-1995 m / left) of height
0.5 m from the floor and the dispersion profile with blast rounds.
The third trial location in the second pilot test was the exhaust airshaft 1 (diameter 3.5
m) where GSSI 1500 MHz antenna was tested. The purpose of the shaft measurements
was to compare the difference in GPR interpreted EDZ depth between different
excavation methods. The tunnels are excavated using a drilling and blasting technique.
The shafts are made by the raise boring technique. It is assumed that the boring
technique is causing shallower EDZ than the drilling and blasting method.
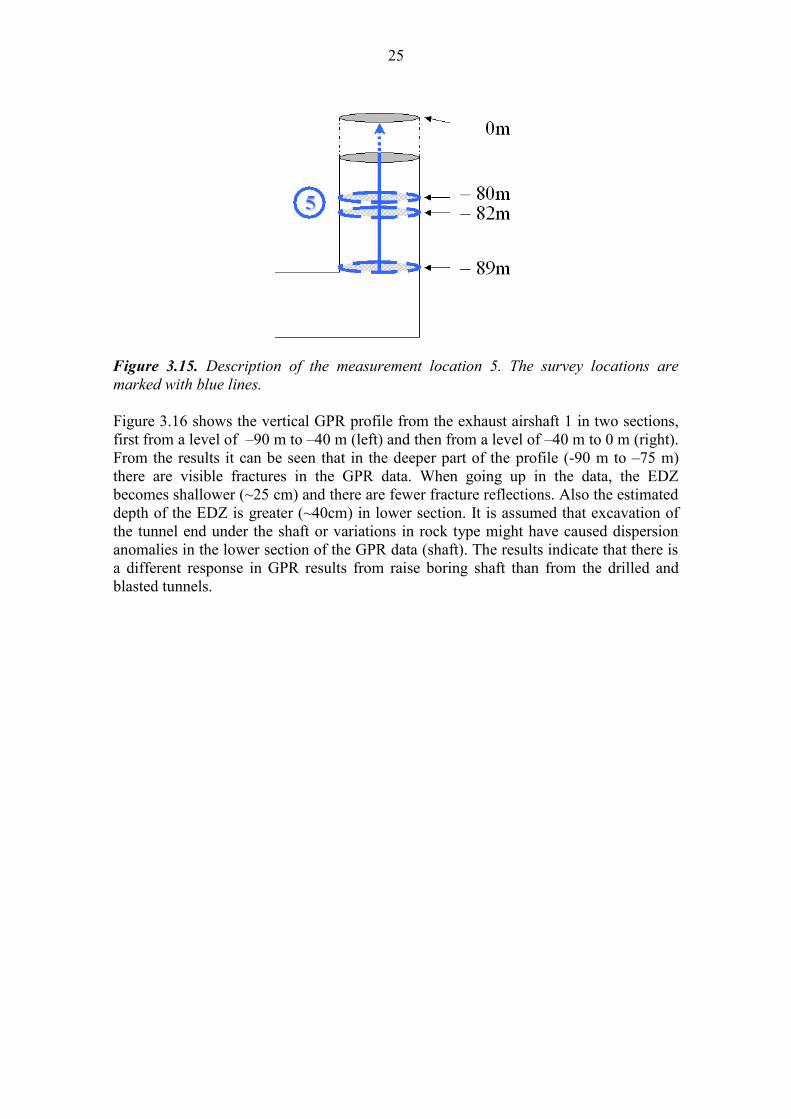
Figure 3.15 illustrates the measurement lines in the exhaust airshaft 1. The longitudinal
shaft line was measured from a level of –90 m to 0 m along the north line of the shaft.
Three circular lines at –89 m, -82 m and –80 m levels were also measured for
comparison of EDZ depths.
25
Figure 3.15. Description of the measurement location 5. The survey locations are
marked with blue lines.
Figure 3.16 shows the vertical GPR profile from the exhaust airshaft 1 in two sections,
first from a level of –90 m to –40 m (left) and then from a level of –40 m to 0 m (right).
From the results it can be seen that in the deeper part of the profile (-90 m to –75 m)
there are visible fractures in the GPR data. When going up in the data, the EDZ
becomes shallower (~25 cm) and there are fewer fracture reflections. Also the estimated
depth of the EDZ is greater (~40cm) in lower section. It is assumed that excavation of
the tunnel end under the shaft or variations in rock type might have caused dispersion
anomalies in the lower section of the GPR data (shaft). The results indicate that there is
a different response in GPR results from raise boring shaft than from the drilled and
blasted tunnels.
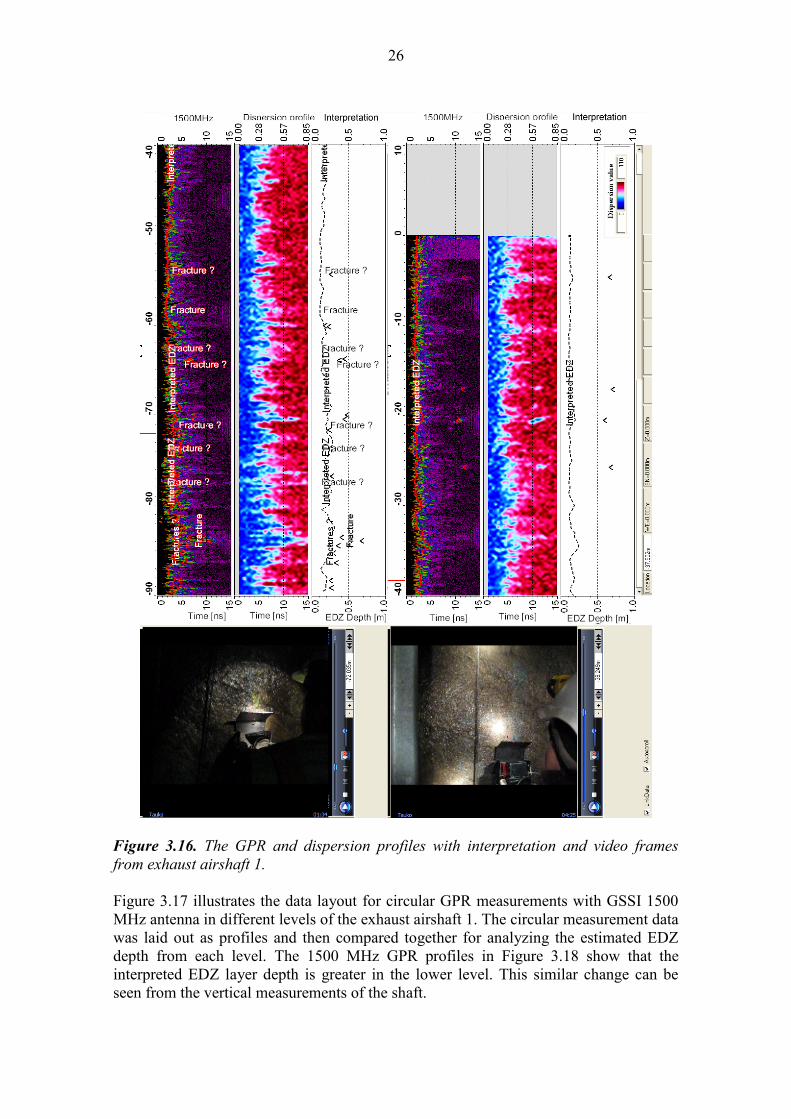
26
Figure 3.16. The GPR and dispersion profiles with interpretation and video frames
from exhaust airshaft 1.
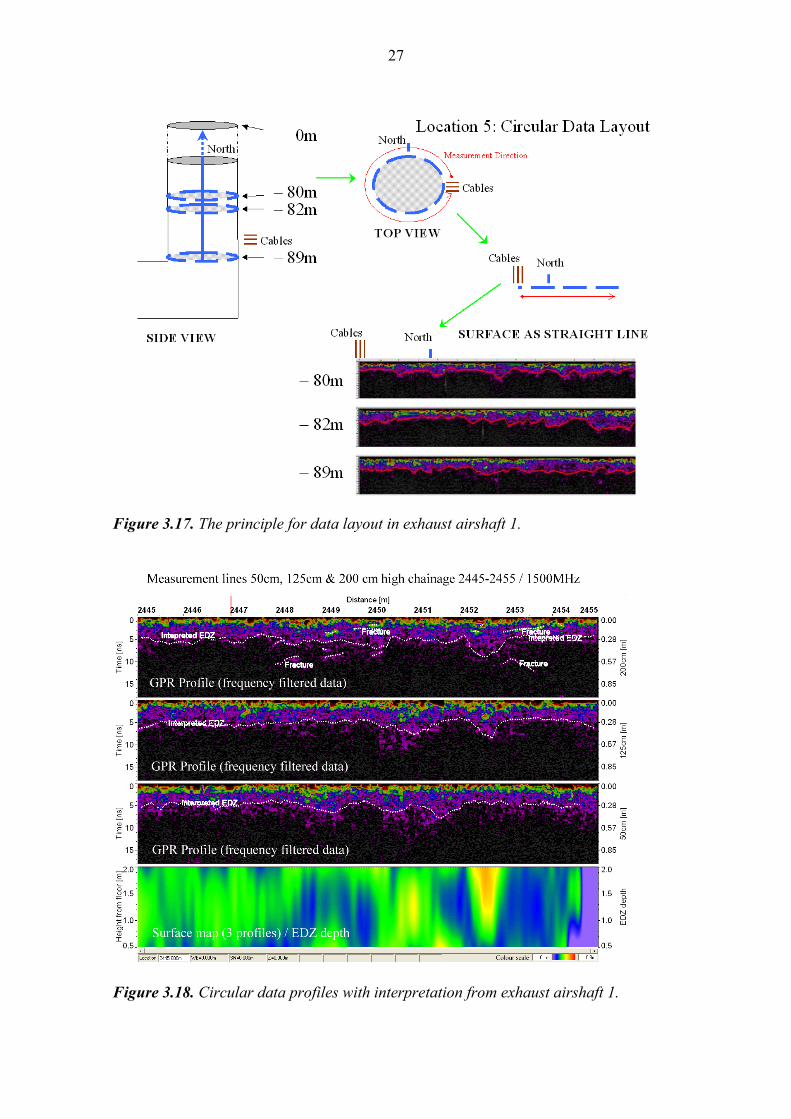
Figure 3.17 illustrates the data layout for circular GPR measurements with GSSI 1500
MHz antenna in different levels of the exhaust airshaft 1. The circular measurement data
was laid out as profiles and then compared together for analyzing the estimated EDZ
depth from each level. The 1500 MHz GPR profiles in Figure 3.18 show that the
interpreted EDZ layer depth is greater in the lower level. This similar change can be
seen from the vertical measurements of the shaft.
27
Figure 3.17. The principle for data layout in exhaust airshaft 1.
Figure 3.18. Circular data profiles with interpretation from exhaust airshaft 1.
28
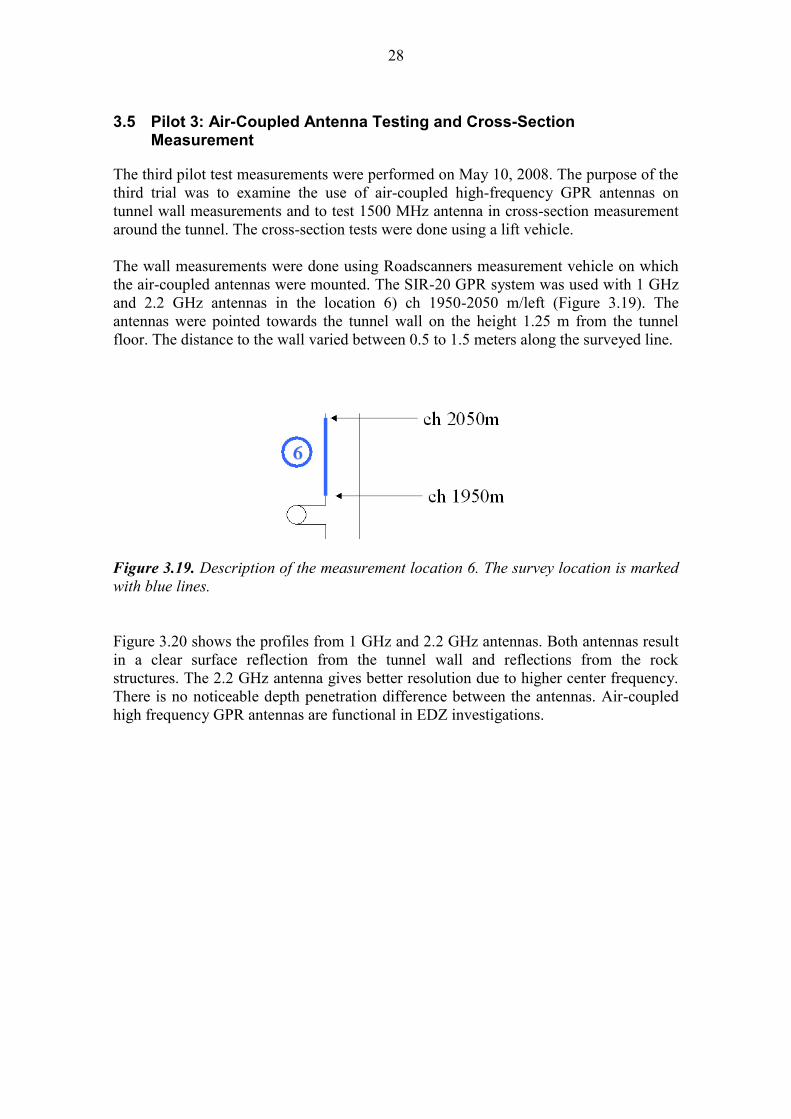
3.5 Pilot 3: Air-Coupled Antenna Testing and Cross-Section Measurement
The third pilot test measurements were performed on May 10, 2008. The purpose of the
third trial was to examine the use of air-coupled high-frequency GPR antennas on
tunnel wall measurements and to test 1500 MHz antenna in cross-section measurement
around the tunnel. The cross-section tests were done using a lift vehicle.
The wall measurements were done using Roadscanners measurement vehicle on which
the air-coupled antennas were mounted. The SIR-20 GPR system was used with 1 GHz
and 2.2 GHz antennas in the location 6) ch 1950-2050 m/left (Figure 3.19). The
antennas were pointed towards the tunnel wall on the height 1.25 m from the tunnel
floor. The distance to the wall varied between 0.5 to 1.5 meters along the surveyed line.
Figure 3.19. Description of the measurement location 6. The survey location is marked
with blue lines.
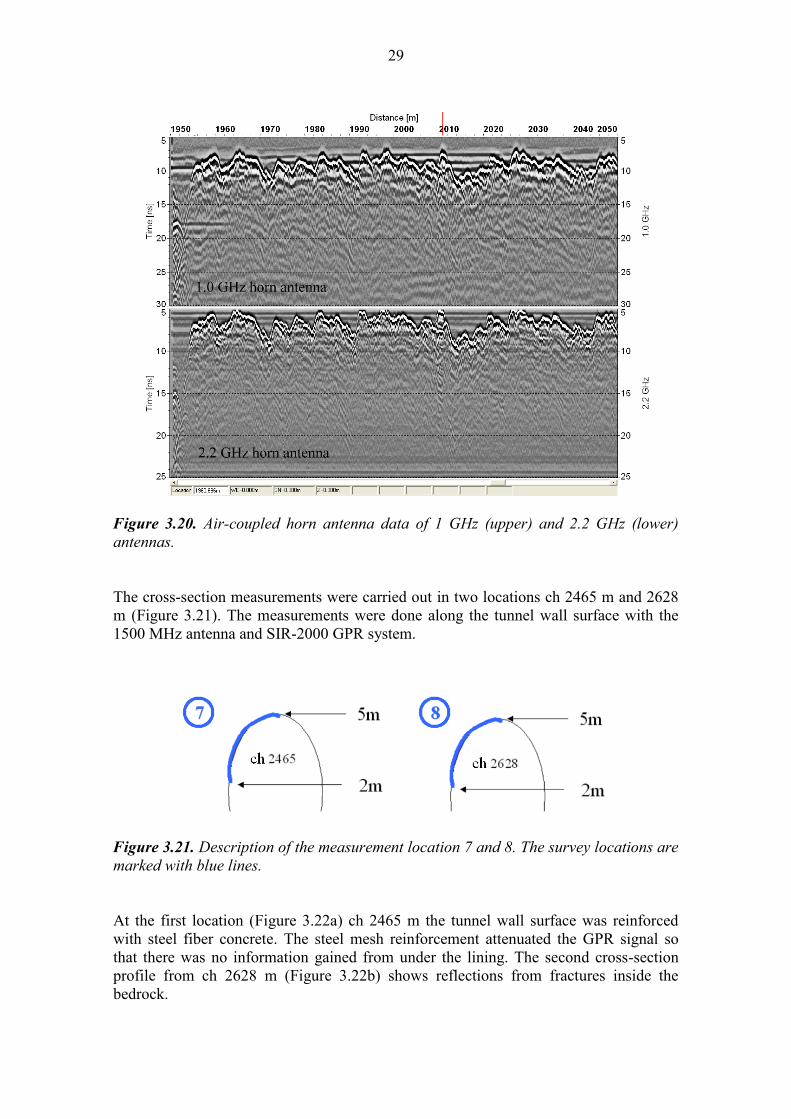
Figure 3.20 shows the profiles from 1 GHz and 2.2 GHz antennas. Both antennas result
in a clear surface reflection from the tunnel wall and reflections from the rock
structures. The 2.2 GHz antenna gives better resolution due to higher center frequency.
There is no noticeable depth penetration difference between the antennas. Air-coupled
high frequency GPR antennas are functional in EDZ investigations.
29
Figure 3.20. Air-coupled horn antenna data of 1 GHz (upper) and 2.2 GHz (lower)
antennas.
The cross-section measurements were carried out in two locations ch 2465 m and 2628
m (Figure 3.21). The measurements were done along the tunnel wall surface with the
1500 MHz antenna and SIR-2000 GPR system.
Figure 3.21. Description of the measurement location 7 and 8. The survey locations are
marked with blue lines.
At the first location (Figure 3.22a) ch 2465 m the tunnel wall surface was reinforced
with steel fiber concrete. The steel mesh reinforcement attenuated the GPR signal so
that there was no information gained from under the lining. The second cross-section
profile from ch 2628 m (Figure 3.22b) shows reflections from fractures inside the
bedrock.
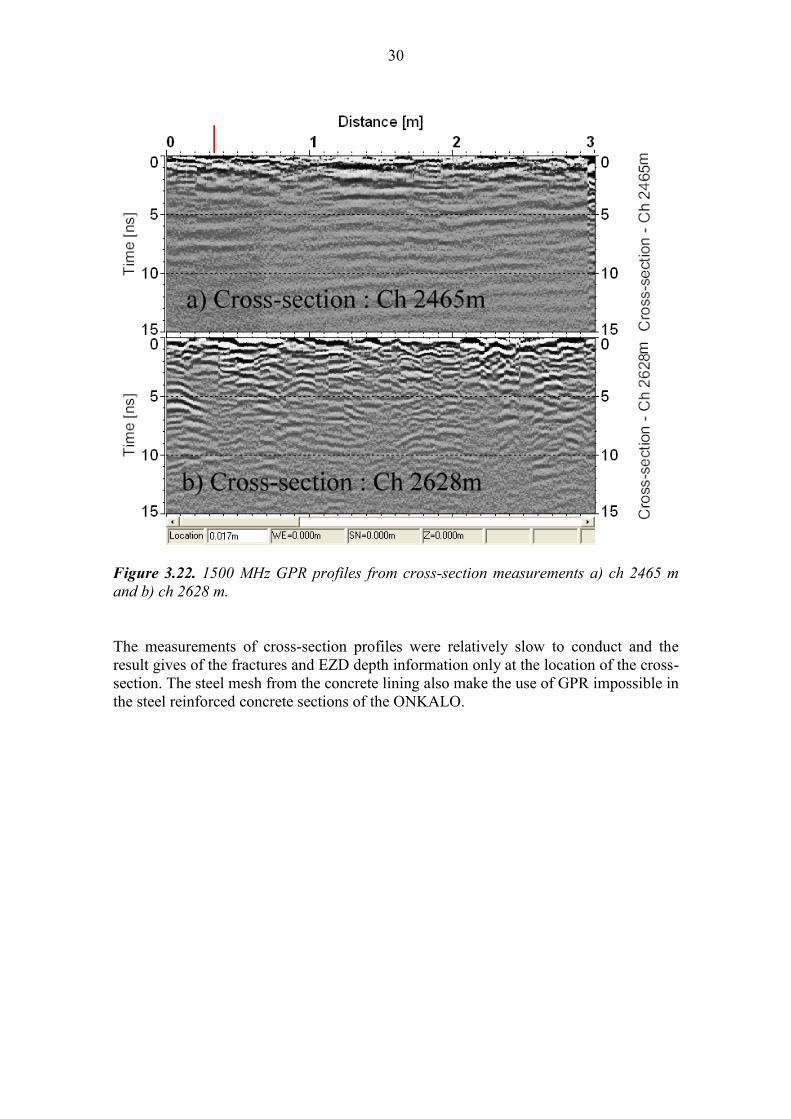
30
Figure 3.22. 1500 MHz GPR profiles from cross-section measurements a) ch 2465 m
and b) ch 2628 m.
The measurements of cross-section profiles were relatively slow to conduct and the
result gives of the fractures and EZD depth information only at the location of the cross-
section. The steel mesh from the concrete lining also make the use of GPR impossible in
the steel reinforced concrete sections of the ONKALO.
31
4 CONCLUSIONS
In the pilot projects, several different GPR measurement configurations were tested.
The test results proved that GPR is a potential tool for quick non-destructive surveys of
bedrock structures and properties. In the last years the GPR technology for structure
inspection has improved to faster systems and higher frequencies. The processing and
interpretation software has also been developed for better visualization of processed
data. GPR is a powerful non-destructive testing method with several major advantages
such as fast measurement speed and continuous survey lines.
The use of ground coupled 1500 MHz GPR in detecting EDZ proves to be promising.
Information from GPR data can be used to distinguish changes in electrical conductivity
of bedrock and finding fractures. Possible reasons for a change in electrical conductivity
is increased moisture or moisture flow in the fracture system possibly caused by
disturbances from excavation. This zone can then be interpreted from processed GPR
data as the potential EDZ.
Multi-channel stepped-frequency 3D-GPR provides similar results as ground coupled
1500 MHz GPR. Data collection with the multi-channel stepped-frequency 3D-GPR
system is fast and efficient, but the data analysis requires special processing, skilled
personnel, and more time. Fractures can be detected well from both systems. The 3D-
GPR data presents fractures as more continuous reflectors due to the different
measurement geometry.
The GPR signal dispersion profiles from shaft measurements proved to be different than
in tunnel wall measurements using the same GPR system. In the shaft results the
estimated EDZ was thinner than in tunnel walls. Different excavation methods or
changes in rock types can cause these variations.
Air-coupled high frequency GPR antennas are efficient in EDZ analysis. 1 GHz and 2.2
GHz antennas both gave clear data, with the 2.2 GHz data having better resolution.
Cross-section ground-coupled GPR measurements demand more time and a bedrock
surface without steel reinforced concrete lining.
All systems provided good quality GPR data useful to the investigations of bedrock
properties near the excavated surface. 3D and air-coupled GPR systems need to be
measured by vehicle and are therefore more compatible for large-scale measurements.
Ground coupled GPR systems are effective for smaller scale projects and for research
purposes.
In the future more tests, e.g. block tests with reference measurements such as ultra-
sound or spectral analysis of surface waves (SASW) method, should be done in order to
calibrate and verify GPR interpretations.
32
REFERENCES
Clark, M.R., Gillespie, R., Kemp, T., McCann, D.M., Forde, M.C., 2001.
Electromagnetic properties of railway ballast. NDT&E International 34 s. 305-311.
Dinis da Gama, C., Navarro Torres, V., 2002. Prediction of EDZ (excavation damaged
zone) from explosive detonation in underground openings. ISRM International
Symposium on Rock Engineering for Mountainous Regions – Eurock 2002, Funchal,
Portugal.
Hänninen, P., 1991. Maatutkaluotaus maaperägeologisissa tutkimuksissa. Tutkimus-
raportti 103. Espoo, Geologian tutkimuskeskus. 33 p. In Finnish.
Hänninen, P., 2000. Pintamaan dielektrisyys ja johtavuus. Maatutkarengas ry:n 10-
vuotisjuhlaseminaari. Kuopio, Maatutkarengas ry. (2000). 14 p.
Lambot, S., Van Den Bosch, I., Slob, E., 2004. Frequency domain GPR signal forward
and inverse modeling for identifying the subsurface dielectric properties. EARSel
eProceedings 3. p. 398 – 404.
Maijala, P., 1991. Maatutkaluotausaineisto ja sen käsittely. Oulun yliopisto,
Geofysiikan laitos. Master thesis. 120 p. In Finnish.
Momayez, M., Hassani, F.P., Hara, A. & Sadri, A., 1996. Application of GPR in
Canadian Mines. CIM Bulletin Vol 89 no 1001, 1996.
Passi, T., 2006. Maatutkatekniikan hyödyntäminen radan tukikerroksen kunnon
arvioinnissa. Diploma thesis. Technical University of Tampere, 80 p, 4 app.
Peltoniemi, M., 1988. Maa- ja kallioperän geofysikaaliset tutkimusmenetelmät.
Otakustantamo. 411p. In Finnish.
Posiva Oy, 2006. TKS-2006 Nuclear waste management of the Olkiluoto and Loviisa
power plants: Programme for research, development and technical design for 2007-
2009. Posiva Oy.
Saarenketo, T., Scullion T., 2000. Road evaluation with ground penetrating radar.
Journal of Applied Geophysics, vol. 43, 2000, pp. 119-138.
Saarenketo, T, 2006. Electrical properties of road materials and subgrade soils and the
use of ground penetrating radar in traffic infrastructure surveys. PhD thesis. University
of Oulu, 121 p., 5 app.
Saksa P, Heikkinen E, Lehtimäki T., 2005. Geophysical radar method for safeguards
application at Olkiluoto spent fuel disposal site in Finland. STUK-YTO-TR 213. STUK,
Helsinki
33
Sandnes, P-A, 2005. Geoscope user manual, v.1.0. 17 p. 3d-radar As. Norway.
SGY (Suomen geoteknillinen yhdistys ry), 1991. Geofysikaaliset menetelmät,
maatutkaluotaus. Tampere, Rakentajain kustannus. 68 p. In Finnish.
IAEA (International Atomic Energy Agency), 2002. Guidebook on non-destructive
testing of concrete structures. Vienna, IAEA–TCS–17, ISSN 1018–5518.
ATTACHMENTS
All the measurement data from pilot test sections will be delivered to the customer in
digital format on DVD. The data can be viewed with the appropriate viewer software.


![EdZ W ] v ] o](https://img.pdfslide.net/doc/110x75/619dd52cc4640562ea6947c3/edz-w-v-o.jpg)