Embed Size (px)
Citation preview
1
Online Energy Estimation of RelationalOperations in Database Systems
Zichen Xu #, Yi-Cheng Tu ∗, Xiaorui Wang #
#The Ohio State University, ∗University of South Florida
Abstract—Data centers are well known to consume a large amount of energy. As databases are one of the major applicationsin a data center, building energy-aware database systems has become an active research topic recently. The quantification ofthe energy cost of database systems is an important task in design. In this paper, we report our recent efforts on this issue,with a focus on the energy cost estimation of query plans during query optimization. We start from building a series of physicalmodels for energy estimation of individual relational operators based on their resource consumption patterns. As the execution ofa query plan is a combination of multiple relational operators, we use the physical models as a basis for a comprehensive energymodel for the entire query. To address the challenge of maintaining accuracy under system and workload dynamics, we developan online scheme that dynamically adjusts model parameters based on statistical signal modeling. Our models are implementedin a real database management system and evaluated on a physical test bed. The results show that our solution achieves a highaccuracy (worst-case error 13.7%) despite noises. Our models also help identify query plans with significantly higher energyefficiency.
Index Terms—Energy-aware Database System Design, Energy Estimation, Online Estimation, Query Optimization
✦
1 INTRODUCTION
Data centers (DCs) are known to be the “SUVs of the techworld” for their enormous energy consumption. Triggeredby this phenomenon, recently there are a lot of effortson energy management in data centers [1], [2], [3], [4],[5], [6], [7], [8]. However, by focusing on the operatingsystem (OS) level, such work cannot be directly appliedto application-level energy management, due to the lackof sufficient knowledge of the application behavior. In thispaper, we study energy management mechanisms in a veryimportant type of DC application – database managementsystems (DBMSs). The energy reduction in DBMSs areof high economical significance for DCs. In a typical DC,database servers consume the majority of the computingresources, making DBMS the largest application consumerof energy. For example, [9] reported a power consumptionratio of 11 : 9.9 for the back-end DBMS services to thefront-end web services.
Energy management has become an active research topicin the database research community. The main theme insuch endeavors is to design DBMSs with energy con-sumption as a first-class performance goal, as advocatedby the Claremont report [10]. Current work in energy-aware DBMS has focused on energy-aware query opti-mization that considers both processing time and energyconsumption ([11], [12]), and power management policiesin distributed databases ([4], [13]). Unlike other studiesthatfocus on the implementation of energy-aware DBMS, thispaper addresses on a key issue that has so far received littleattention – modeling the energy cost of database systems.In particular, we report the results of our study inenergycost estimation in DBMS during query optimization, with
a focus on the quantification of the energy consumption ofquery plans.
Energy cost in database operations carries high technicalsignificance in energy-aware database design. In databasesystems, the query optimizer evaluates different computa-tional paths (namedplans, as shown in Figure 1) by explic-itly labeling their resource consumption. The knowledgeof the energy consumption of query plans is indispensablein identifying those with a low energy profile [14]. Forexample, recent studies [11], [12] have shown that in atypical database, there exist many query plans that consumemuch less energy with little performance degradation. Thus,energy conservation can be achieved by selecting thosequery plans. Note that information needed for making thedecision is hidden inside the database system, thus cannotbe captured at the OS or the hardware level. To harness theenergy saving opportunities provided by energy-efficientplans, a practical approach is to provide accurate energycost estimation during the query optimization process.
Energy cost estimation in the DBMS serves two pur-poses. First, like the traditional cost estimation mechanismin the DBMS that helps select faster query plans, energycost estimation enables selection of query plans with lowerenergy cost [12]. Second, knowing the accurate energy costof each selected query plan helps quantify the energy costof the entire workload. Therefore, we believe our work isimportant for query optimization design in an energy-awareDBMS, and it also provides valuable insights for otherenergy management policies, such as energy consolidationand projection in DCs [3].
Specifically, we design and evaluate a two-level frame-work to fulfill the above design goals. In a DBMS, eachquery plan is a unique path to execute a series of re-
2
Query Energy
Cost
Sequential
Scan Cost
Index Scan
Cost
BitMap Scan
Cost
Hash Join
Cost
Sort Cost
CPU Oper.
Cost
IO Operation
Cost
Network
Trans. Cost
Estimated Energy Cost
For Query
Estimated Energy Cost
For Relational Operator
Estimated Energy Cost For Basic Operations
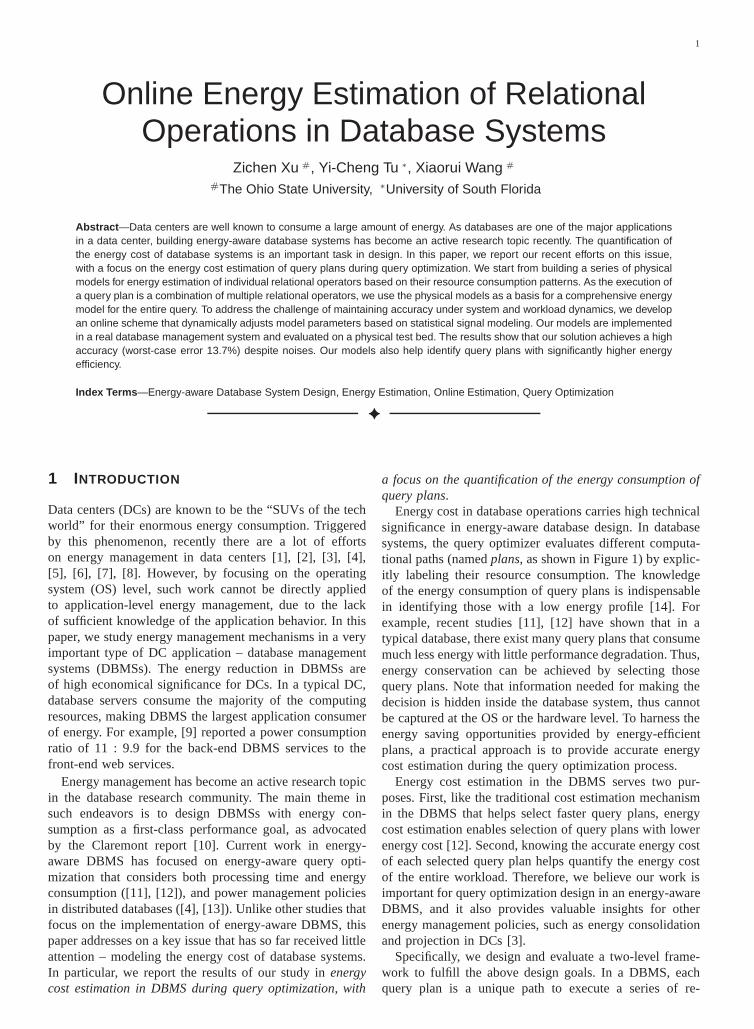
Fig. 1. The query plan of Q5 from the TPC-H bench-mark [15]
lational operators (Figure 1) and maintenance operations(e.g., update/delete), each of which encompasses a set ofbasic operations (e.g., processing a tuple in CPU). We firstintroduce our study on the energy consumption of eachbasic operation from the energy profile of hardware in atypical database server. Based on which, we build a staticmodel that describes the energy consumption of relationaloperators and maintenance operations according to theirestimated resource demand (i.e., the CPU cycles). Those re-source data are provided by the traditional DBMS optimizerand their energy cost coefficients are derived from a trainingprocess. Such models show a high accuracy in predictingenergy consumption in a static environment. However, theenergy cost coefficients (e.g., number of joules needed toprocess an indexed tuple) in the model depend on thesystem dynamic (e.g., CPU utilization) and the workloadstatistic (e.g., table cardinality). To further improve thestatic model by making it adaptable, we propose an onlinescheme that uses a Recursive Least Square (RLS) estimatorto periodically update the parameters in the static models.
The problem we tackle is to build a comprehensivemodel that can predict the energy cost of query plans ina DBMS. To be more specific, given one query, our goalis to accurately quantify the active energy consumption ifthat plan is executed. The desired energy cost model shouldpossess the following features:
- Accuracy: the model provides accurate prediction ofenergy consumption;
- Robustness: the model maintains high accuracy regard-less of variations from system states and workloadcharacteristics;
- Fast Response: the computational overhead is accept-able;
- Non-disruptive: the modeling process does not inter-fere with the normal operations of the DBMS.
Among the four, accuracy and robustnessare the keyrequirements, and thus the main metrics for evaluating ourmodels in this paper.
1.1 Contributions and Paper Organization
Previous studies on database energy management havefocused on either high-level ideas [11] or energy profiling
of hardware used in data processing [16]. In this paper,we introduce a systematic solution with all aforementionedproperties. The main technical contributions of this paperare:
- We propose a comprehensive mechanism to estimatethe energy cost of query processing at the DBMSlevel and develop a general energy model based onan extensive system identification study.
- We develop a series of physical models based onthe general model for evaluating the energy cost ofindividual relational operators in a static environment.
- We design an online scheme to automatically adjustparameters of the static model in response to thesystem dynamics and the workload variations;
- We implement our model in the kernel of a realDBMS, and evaluate it on a physical testbed with acomprehensive set of workloads generated from TPCbenchmarks and scientific database traces.
The remainder of this paper is organized as follows: wefirst compare our work with other projects in Section 2. Wethen provide our system identification studies in Section3. We describe the technical details of our static energyestimation models in Section 4, evaluate those models,and discuss their limitations in Section 5. We present theonline scheme to improve the applicability of the modeland evaluate it with many experiments in Section 6. Westudy the impact of the energy efficient query optimizationin Section 7. Finally, we conclude the paper in Section 8.
2 RELATED WORK
Energy modeling in operating systems:there are manyproposals that treat energy as a first class resource inthe operating system, such as [17], [18], [19]. The firstformal analytic energy model in the operating system isproposed by Heathet al. [20]. Following the similar idea,many other articles reported various models towards energyoptimization, such as [21], [22], [23], [24], [25]. Comparingwith our work, all such solutions focus on the operatingsystem level. As a result, none of the models can be directlyapplied to DBMSs, due to the lack of knowledge of theDBMS resource demand and the data processing patterns.
Energy management in database systems:work in energy-efficient database systems can be traced back to the early1990’s. In [26], query optimization with energy as one ofthe performance criterion was proposed within the contextof mobile databases. In this paper, we are interested in theenergy consumption of servers. Motivated by the increasingenergy-related cost of database servers, the database com-munity has only recently identified building energy-efficientdatabase systems as an worthy direction of exploration[10]. Early papers [27], [28] advocated query optimizationwith energy as the target, which implicitly argue for amechanism for estimating the energy cost of a query plan.Supported by initial experimental results, [14] presentedtwo specific techniques to save energy in databases: de-creasing CPU frequency and throttling user queries. Our
3
previous work [12] revealed the existence of many energy-efficient query plans that carry little/acceptable performancepenalty. By showing some plans of high energy efficiencycoincides with performance, a subsequent report [29] stirredup discussions on whether energy-aware query optimizationis a worthwhile approach towards green databases. Ouropinion is that, when the search space is sufficiently largeand energy/performance estimations are accurate enough,we would find energy-efficient plans that could most likelybe ignored by existing query optimizers. This standpointis supported by more recent evidence provided by [11]and [16], and verified by our experimental results shownin Section 6.2. Other related research in green databasesdiverges to several directions. The Transaction PerformanceCouncil (TPC) announced TPC-Energy [13] in 2007. Poessand Nambiar [9], [30], [31] reported extensive results onpower consumption patterns in typical database servers.
Modeling power/energy in databases:it is worth notic-ing that power/energy modeling has been addressed insome of the work mentioned above. As a position paper,[11] proposed a general formula for quantifying powercost of a query plan. Another work [16] delivered morecomprehensive results in modeling the peak power ofdatabase operations. As the peak power and the energyare very different concepts, the modeling processes (andapparently the models) are also different. A shorter versionof this paper [32] focuses on building physical models onenergy consumption and significantly improves the staticmodels from [12]. Aiming at a robust solution with highaccuracy in realistic relational database environment, weuse a dynamic modeling approach to continuously updatekey parameters of our model so that it adapts quicklyto system dynamics and workload variations. Comparedto [32], this paper provides a broader discussion on theenergy profile of important relational operations and manydatabase maintenance operations. We also present our studyon the energy efficiency of popular join algorithms basedon our understanding of their energy consumption patterns.Furthermore, we highlight our online solution with a studyon how accurate energy estimation helps save more energyby altering query plan selection, and share insights on queryoptimization towards low energy cost.
Other related work:there are numerous reports on dynamicpower management (DPM) at the operating system level,and many DPM techniques are summarized in the survey[3]. Cost modeling of relational operators is a well-studiedproblem in the database field. Work related to this topiccan be traced back to the late 1970’s. Initially, Astrahanand co-workers presented some critical ideas implementedin System R [33]. Christodoulakis [34] summarized theearly work and well-accepted assumptions for query costestimation. In [35], the authors extend the work to adistributed environment. Standing on their shoulders, webuild up our physical models based on similar assumptionsand techniques. However, as we attempt to model a differentcost, variants and constraints are no longer the same.
3 OVERVIEW OF MODELING PROCESS
In a traditional DBMS [35], query execution cost is treatedas a linear combination of three components: CPU cost,I/O cost, and communication cost. Such costs are normallymeasured as the product of the number of basic operationsin the query plan and the resource consumption of each ba-sic operation. The operations involved are: number of tuples(Ntuples) to be processed in the CPU, number of pages tobe retrieved from disks (Npages), and the number of bytesto be transmitted via networking system (Nmsg). With thederived energy coefficients from experiments, an intuitivemodel can be built to describe the energy consumption ofthe query plan. This heuristic model follows the intuitionof treating energy as a resource consumed by the internalprocessing in the DBMS, and can be treated as the startingpoint of our work in energy cost estimation. Specifically,the energy costE of a query plan can be expressed as
E = WcpuNtuples +WI/ONpages +WmsgNmsg (1)
whereWcpu, WI/O andWmsg are the energy coefficientsof one tuple processed in CPU, one page obtained fromdisks and one byte processed in network, respectively. Ourwork focuses on modeling energy consumption of process-ing relational operators on a single-node database server,therefore we do not consider the network transmission costin this paper. However, our model could be easily mergedwith other state-of-art network power models, such as thosedescribed in [36] and [37], to provide an overall energyprofile in a distributed database system. As a result, theabove model becomes:
E = WcpuNtuples +WI/ONpages (2)
As a general linear model, parameters of Equation (2) areobtained by a series ofsystem identification studiesonenergy consumption of hardware components and typicaldatabase workloads. In the experiments, we build a set ofqueries, each of which performs a single table scan ora two-table join, to examine the energy profile of eachrelational operator. At the same time, the query optimizeris modified to only pick the algorithms we specify forprocessing a relational operator. We pick the scaling factorof TPC-H tool from 1 to 1000, which leads to 1GB to 1TBdata stored in our local drive. The system identificationstudy picks the number of tuples as the metric for the datasize. Each tuple represents a row in the data table. Queriesare based on the TPC-H query generator using the standard22 query templates. We collect the runtime statistics (e.g.,resource consumption) and energy consumption data ofmost relational operators at a frequency of 1000Hz usingthe multi-meter and the Linux system monitor. Based onthose data, we calculate the coefficients of the physicalmodels using the solvers from GAMS1. More details ofour experimental setup can be found in Section 5.1.
1. http://www.gams.com
4
TABLE 1The maximum active power consumption of majorhardware components in a R710 Dell 2U server.
Component Active Power (Watt) Citation
CPU: Xeon E5645 118.9 [29]Memory: 32 GB 20.5 [21]HDD: Seag. 2TB 7200RPM 0.42 [30]Other parts 0.23 N/ATotal 140.05
3.1 Observations on Hardware
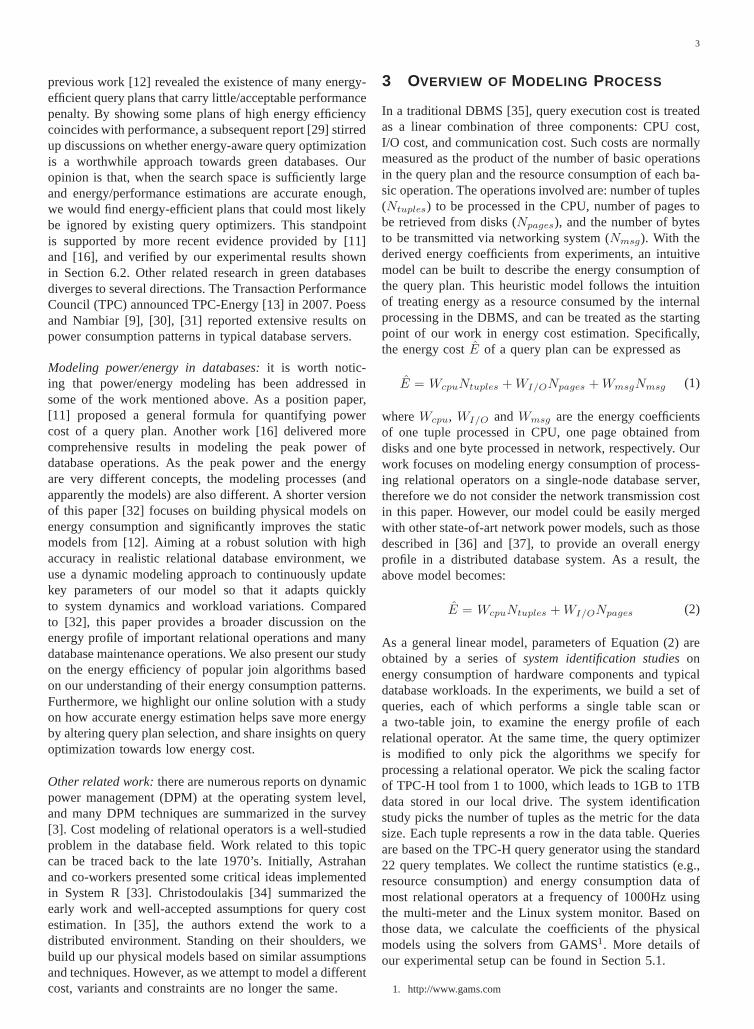
First, we start to explore the energy profile of the hardware,as part of the system identification study. To that purpose,we measure active power consumptions of major hardwarecomponents (shown in Table 1) of a database server asour testbed. The results exhibit the fact that CPU andmemory contribute the most to the active power (about99%), as shown in Figure 2. The active power consumptioncontributed by other components (e.g., hard disk) are negli-gible. From Figure 2, we found that (1) the CPU power costis proportional with the workload density, which indicatesthe system utilization, (2) memory rarely stays idle, thusits energy consumption is only related to the processingtime. Meanwhile, as shown in Figure 2b, the disk poweris not affected by data access patterns – both sequentialand random access consume the same power. This is dueto an important physical feature of commonly-used storagehardware for database servers – their leakage power costalways dominates (solid-state drives could be different butthey are rarely used for storing large databases).
To estimate the energy cost of a query plan, we areessentially interested in itsmarginal energy consumption(namely active energy) if we assume the baseline poweris always the same as the leakage power.2 Note that,without specification, the energy consumption discussedthroughout this paper is the active energy consumption. Inthe experiment, we have confirmed our intuition that themarginal energy consumption of a query plan is propor-tional to its resource demand (i.e., number of operationsNtuples), which captures the processing time of such query.Thus, to estimate the energy consumption of a databaseoperation, we need to know the total resource demand (e.g.,Ntuples andNpages), and the energy coefficient parameters,which represent the processing time and the power cost ofexecuting such query plan, respectively.
3.2 Observations on Relational Operators
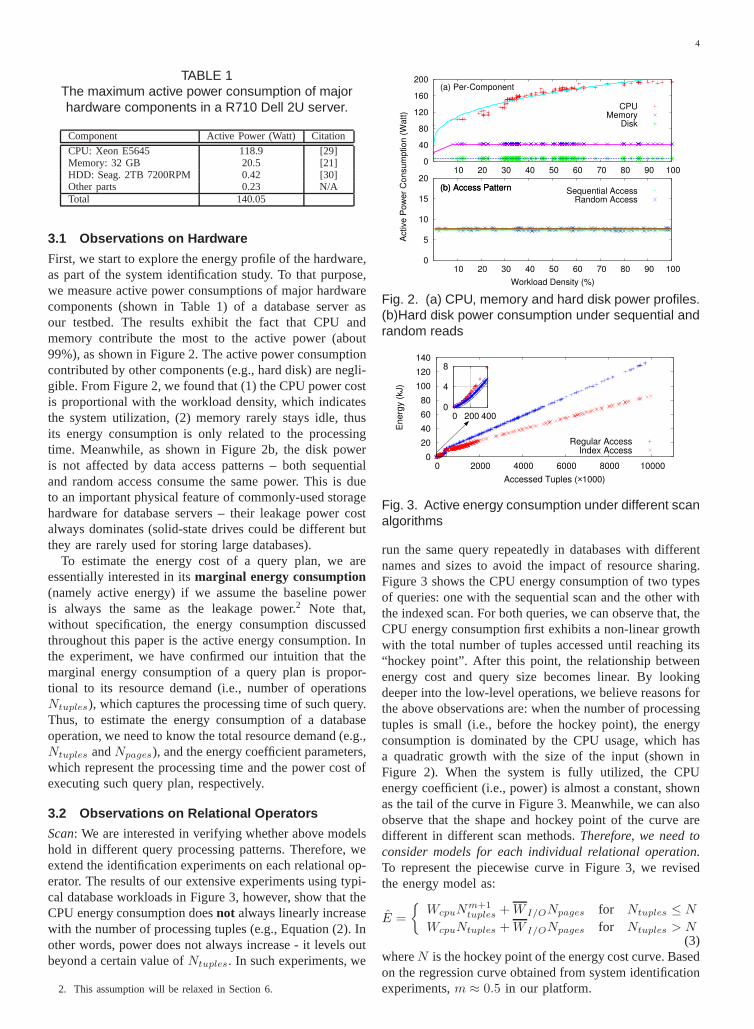
Scan: We are interested in verifying whether above modelshold in different query processing patterns. Therefore, weextend the identification experiments on each relational op-erator. The results of our extensive experiments using typi-cal database workloads in Figure 3, however, show that theCPU energy consumption doesnot always linearly increasewith the number of processing tuples (e.g., Equation (2). Inother words, power does not always increase - it levels outbeyond a certain value ofNtuples. In such experiments, we
2. This assumption will be relaxed in Section 6.
0
5
10
15
20
10 20 30 40 50 60 70 80 90 100
Workload Density (%)
(b) Access Pattern Sequential AccessRandom Access
0
40
80
120
160
200
10 20 30 40 50 60 70 80 90 100
Active
Po
we
r C
on
su
mp
tio
n (
Wa
tt)
(b) Access Pattern
(a) Per-Component
CPUMemory
Disk
Fig. 2. (a) CPU, memory and hard disk power profiles.(b)Hard disk power consumption under sequential andrandom reads
0
20
40
60
80
100
120
140
0 2000 4000 6000 8000 10000
En
erg
y (
kJ)
Accessed Tuples (×1000)
Regular AccessIndex Access
0
4
8
0 200 400
Fig. 3. Active energy consumption under different scanalgorithms
run the same query repeatedly in databases with differentnames and sizes to avoid the impact of resource sharing.Figure 3 shows the CPU energy consumption of two typesof queries: one with the sequential scan and the other withthe indexed scan. For both queries, we can observe that, theCPU energy consumption first exhibits a non-linear growthwith the total number of tuples accessed until reaching its“hockey point”. After this point, the relationship betweenenergy cost and query size becomes linear. By lookingdeeper into the low-level operations, we believe reasons forthe above observations are: when the number of processingtuples is small (i.e., before the hockey point), the energyconsumption is dominated by the CPU usage, which hasa quadratic growth with the size of the input (shown inFigure 2). When the system is fully utilized, the CPUenergy coefficient (i.e., power) is almost a constant, shownas the tail of the curve in Figure 3. Meanwhile, we can alsoobserve that the shape and hockey point of the curve aredifferent in different scan methods.Therefore, we need toconsider models for each individual relational operation.To represent the piecewise curve in Figure 3, we revisedthe energy model as:
E =
{
WcpuNm+1tuples +W I/ONpages for Ntuples ≤ N
WcpuNtuples +W I/ONpages for Ntuples > N(3)
whereN is the hockey point of the energy cost curve. Basedon the regression curve obtained from system identificationexperiments,m ≈ 0.5 in our platform.
5
200
400
600
800
1000
1200
1400
1600
0 2000 4000 6000 8000 10000
En
erg
y (
kJ)
Accessed Tuples (X1000)
Hash JoinMerge Join
Nested Loop Join
800
1000
6000 6200
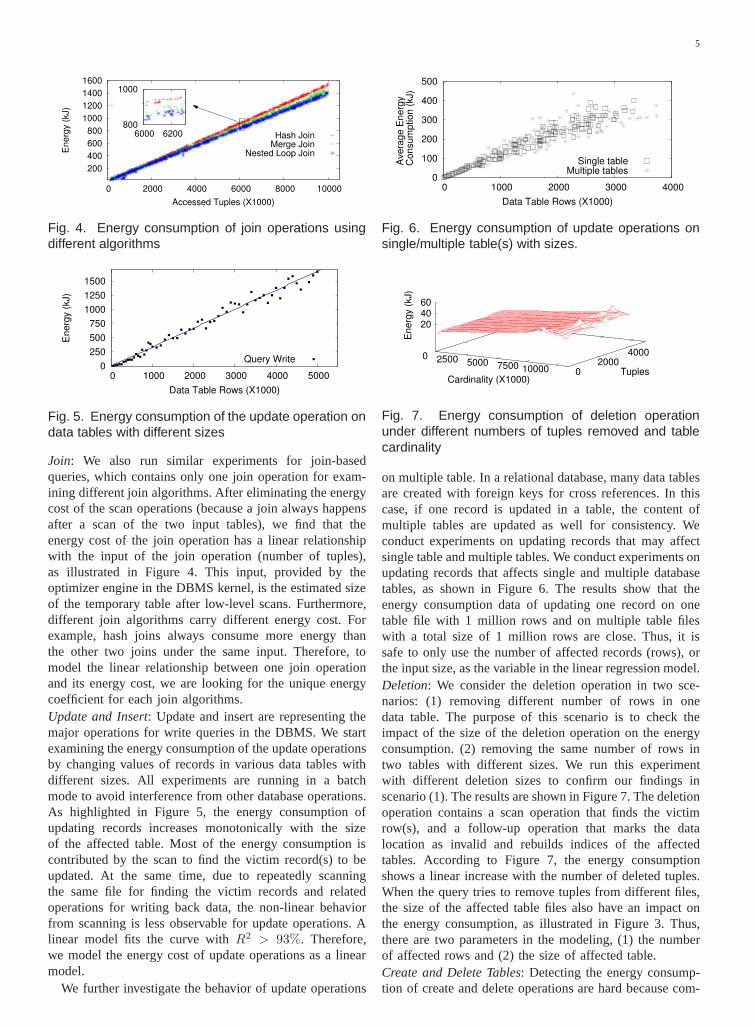
Fig. 4. Energy consumption of join operations usingdifferent algorithms
0
250
500
750
1000
1250
1500
0 1000 2000 3000 4000 5000
Energ
y (
kJ)
Data Table Rows (X1000)
Query Write
Fig. 5. Energy consumption of the update operation ondata tables with different sizes
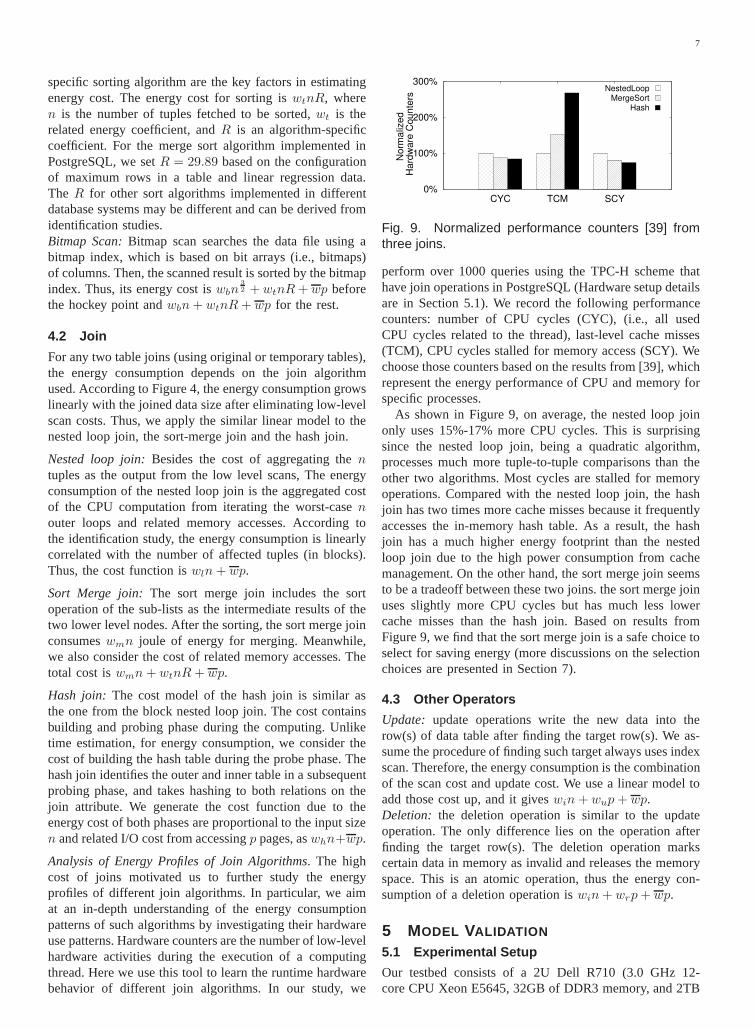
Join: We also run similar experiments for join-basedqueries, which contains only one join operation for exam-ining different join algorithms. After eliminating the energycost of the scan operations (because a join always happensafter a scan of the two input tables), we find that theenergy cost of the join operation has a linear relationshipwith the input of the join operation (number of tuples),as illustrated in Figure 4. This input, provided by theoptimizer engine in the DBMS kernel, is the estimated sizeof the temporary table after low-level scans. Furthermore,different join algorithms carry different energy cost. Forexample, hash joins always consume more energy thanthe other two joins under the same input. Therefore, tomodel the linear relationship between one join operationand its energy cost, we are looking for the unique energycoefficient for each join algorithms.Update and Insert: Update and insert are representing themajor operations for write queries in the DBMS. We startexamining the energy consumption of the update operationsby changing values of records in various data tables withdifferent sizes. All experiments are running in a batchmode to avoid interference from other database operations.As highlighted in Figure 5, the energy consumption ofupdating records increases monotonically with the sizeof the affected table. Most of the energy consumption iscontributed by the scan to find the victim record(s) to beupdated. At the same time, due to repeatedly scanningthe same file for finding the victim records and relatedoperations for writing back data, the non-linear behaviorfrom scanning is less observable for update operations. Alinear model fits the curve withR2 > 93%. Therefore,we model the energy cost of update operations as a linearmodel.
We further investigate the behavior of update operations
0
100
200
300
400
500
0 1000 2000 3000 4000
Avera
ge E
nerg
y
Consum
ption (
kJ)
Data Table Rows (X1000)
Single tableMultiple tables
Fig. 6. Energy consumption of update operations onsingle/multiple table(s) with sizes.
0 2500 5000 7500 10000Cardinality (X1000)
0 2000
4000
Tuples
20 40 60
Energ
y (
kJ)
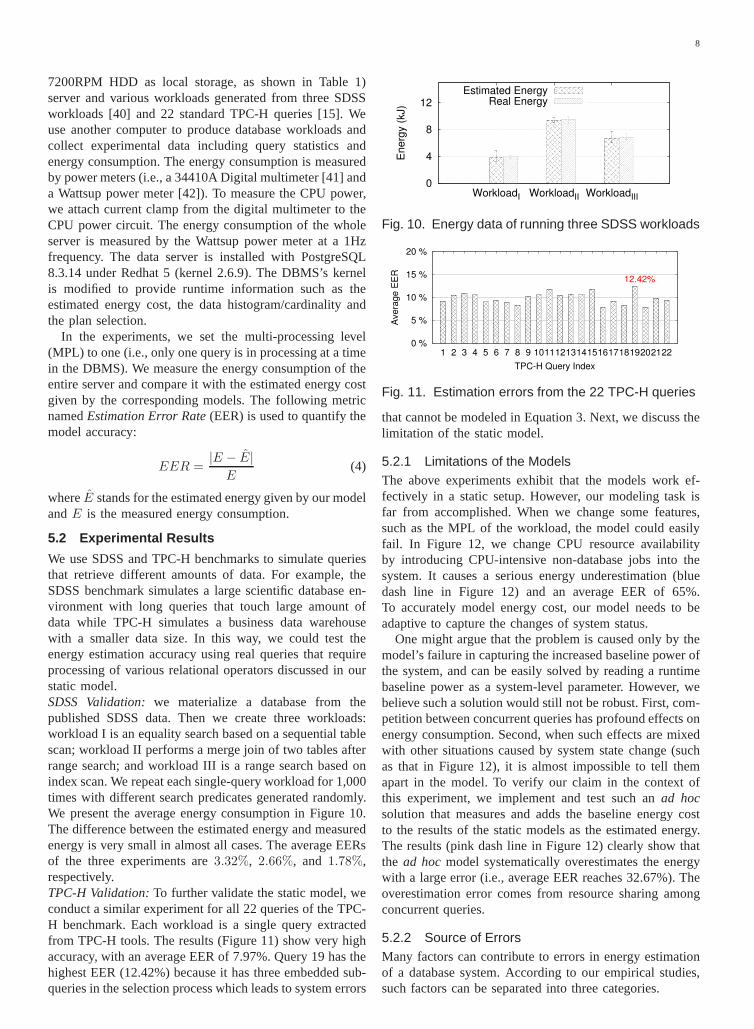
Fig. 7. Energy consumption of deletion operationunder different numbers of tuples removed and tablecardinality
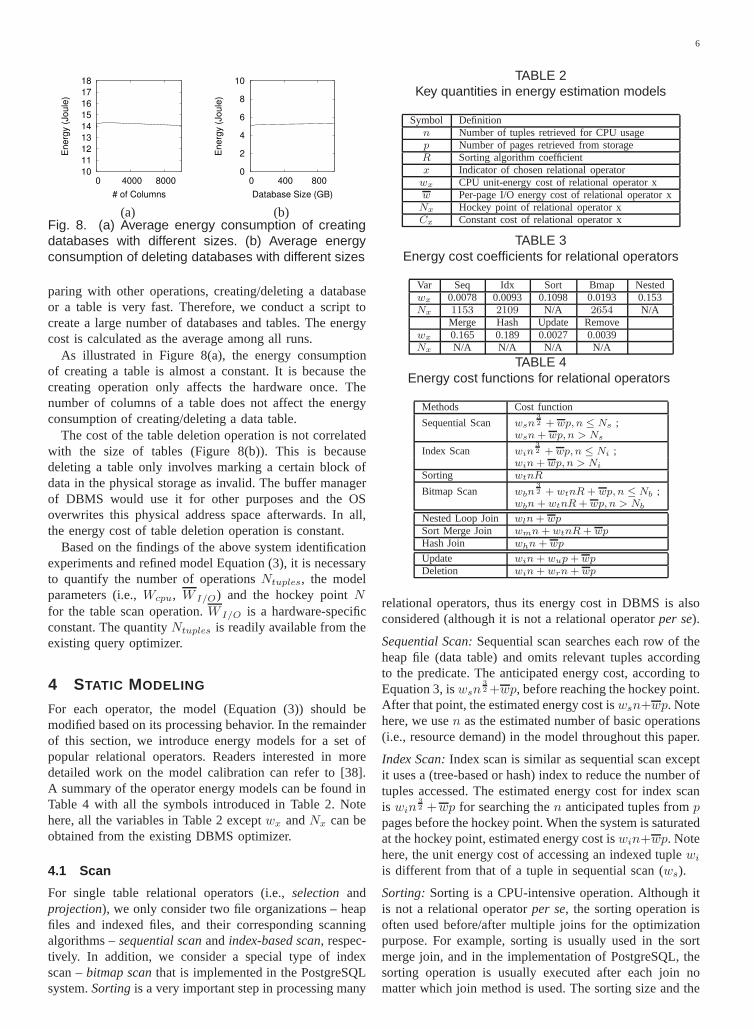
on multiple table. In a relational database, many data tablesare created with foreign keys for cross references. In thiscase, if one record is updated in a table, the content ofmultiple tables are updated as well for consistency. Weconduct experiments on updating records that may affectsingle table and multiple tables. We conduct experiments onupdating records that affects single and multiple databasetables, as shown in Figure 6. The results show that theenergy consumption data of updating one record on onetable file with 1 million rows and on multiple table fileswith a total size of 1 million rows are close. Thus, it issafe to only use the number of affected records (rows), orthe input size, as the variable in the linear regression model.Deletion: We consider the deletion operation in two sce-narios: (1) removing different number of rows in onedata table. The purpose of this scenario is to check theimpact of the size of the deletion operation on the energyconsumption. (2) removing the same number of rows intwo tables with different sizes. We run this experimentwith different deletion sizes to confirm our findings inscenario (1). The results are shown in Figure 7. The deletionoperation contains a scan operation that finds the victimrow(s), and a follow-up operation that marks the datalocation as invalid and rebuilds indices of the affectedtables. According to Figure 7, the energy consumptionshows a linear increase with the number of deleted tuples.When the query tries to remove tuples from different files,the size of the affected table files also have an impact onthe energy consumption, as illustrated in Figure 3. Thus,there are two parameters in the modeling, (1) the numberof affected rows and (2) the size of affected table.Create and Delete Tables: Detecting the energy consump-tion of create and delete operations are hard because com-
6
10
11
12
13
14
15
16
17
18
0 4000 8000
En
erg
y (
Jo
ule
)
# of Columns
0
2
4
6
8
10
0 400 800
En
erg
y (
Jo
ule
)
Database Size (GB)
(a) (b)Fig. 8. (a) Average energy consumption of creatingdatabases with different sizes. (b) Average energyconsumption of deleting databases with different sizes
paring with other operations, creating/deleting a databaseor a table is very fast. Therefore, we conduct a script tocreate a large number of databases and tables. The energycost is calculated as the average among all runs.
As illustrated in Figure 8(a), the energy consumptionof creating a table is almost a constant. It is because thecreating operation only affects the hardware once. Thenumber of columns of a table does not affect the energyconsumption of creating/deleting a data table.
The cost of the table deletion operation is not correlatedwith the size of tables (Figure 8(b)). This is becausedeleting a table only involves marking a certain block ofdata in the physical storage as invalid. The buffer managerof DBMS would use it for other purposes and the OSoverwrites this physical address space afterwards. In all,the energy cost of table deletion operation is constant.
Based on the findings of the above system identificationexperiments and refined model Equation (3), it is necessaryto quantify the number of operationsNtuples, the modelparameters (i.e.,Wcpu, W I/O) and the hockey pointNfor the table scan operation.W I/O is a hardware-specificconstant. The quantityNtuples is readily available from theexisting query optimizer.
4 STATIC MODELING
For each operator, the model (Equation (3)) should bemodified based on its processing behavior. In the remainderof this section, we introduce energy models for a set ofpopular relational operators. Readers interested in moredetailed work on the model calibration can refer to [38].A summary of the operator energy models can be found inTable 4 with all the symbols introduced in Table 2. Notehere, all the variables in Table 2 exceptwx andNx can beobtained from the existing DBMS optimizer.
4.1 Scan
For single table relational operators (i.e.,selection andprojection), we only consider two file organizations – heapfiles and indexed files, and their corresponding scanningalgorithms –sequential scanandindex-based scan, respec-tively. In addition, we consider a special type of indexscan –bitmap scanthat is implemented in the PostgreSQLsystem.Sortingis a very important step in processing many
TABLE 2Key quantities in energy estimation models
Symbol Definitionn Number of tuples retrieved for CPU usagep Number of pages retrieved from storageR Sorting algorithm coefficientx Indicator of chosen relational operatorwx CPU unit-energy cost of relational operator xw Per-page I/O energy cost of relational operator xNx Hockey point of relational operator xCx Constant cost of relational operator x
TABLE 3Energy cost coefficients for relational operators
Var Seq Idx Sort Bmap Nestedwx 0.0078 0.0093 0.1098 0.0193 0.153Nx 1153 2109 N/A 2654 N/A
Merge Hash Update Removewx 0.165 0.189 0.0027 0.0039Nx N/A N/A N/A N/A
TABLE 4Energy cost functions for relational operators
Methods Cost function
Sequential Scan wsn3
2 +wp, n ≤ Ns ;wsn+wp,n > Ns
Index Scan win3
2 + wp, n ≤ Ni ;win+wp, n > Ni
Sorting wtnR
Bitmap Scan wbn3
2 + wtnR+ wp, n ≤ Nb ;wbn+wtnR+wp, n > Nb
Nested Loop Join wln+ wp
Sort Merge Join wmn+wtnR+ wp
Hash Join whn+wp
Update win+wup+wp
Deletion win+wrn+ wp
relational operators, thus its energy cost in DBMS is alsoconsidered (although it is not a relational operatorper se).
Sequential Scan:Sequential scan searches each row of theheap file (data table) and omits relevant tuples accordingto the predicate. The anticipated energy cost, according toEquation 3, iswsn
3
2+wp, before reaching the hockey point.After that point, the estimated energy cost iswsn+wp. Notehere, we usen as the estimated number of basic operations(i.e., resource demand) in the model throughout this paper.
Index Scan:Index scan is similar as sequential scan exceptit uses a (tree-based or hash) index to reduce the number oftuples accessed. The estimated energy cost for index scanis win
3
2 +wp for searching then anticipated tuples fromppages before the hockey point. When the system is saturatedat the hockey point, estimated energy cost iswin+wp. Notehere, the unit energy cost of accessing an indexed tuplewi
is different from that of a tuple in sequential scan (ws).
Sorting: Sorting is a CPU-intensive operation. Although itis not a relational operatorper se, the sorting operation isoften used before/after multiple joins for the optimizationpurpose. For example, sorting is usually used in the sortmerge join, and in the implementation of PostgreSQL, thesorting operation is usually executed after each join nomatter which join method is used. The sorting size and the
7
specific sorting algorithm are the key factors in estimatingenergy cost. The energy cost for sorting iswtnR, wheren is the number of tuples fetched to be sorted,wt is therelated energy coefficient, andR is an algorithm-specificcoefficient. For the merge sort algorithm implemented inPostgreSQL, we setR = 29.89 based on the configurationof maximum rows in a table and linear regression data.The R for other sort algorithms implemented in differentdatabase systems may be different and can be derived fromidentification studies.Bitmap Scan:Bitmap scan searches the data file using abitmap index, which is based on bit arrays (i.e., bitmaps)of columns. Then, the scanned result is sorted by the bitmapindex. Thus, its energy cost iswbn
3
2 +wtnR+wp beforethe hockey point andwbn+ wtnR+ wp for the rest.
4.2 Join
For any two table joins (using original or temporary tables),the energy consumption depends on the join algorithmused. According to Figure 4, the energy consumption growslinearly with the joined data size after eliminating low-levelscan costs. Thus, we apply the similar linear model to thenested loop join, the sort-merge join and the hash join.
Nested loop join:Besides the cost of aggregating thentuples as the output from the low level scans, The energyconsumption of the nested loop join is the aggregated costof the CPU computation from iterating the worst-casenouter loops and related memory accesses. According tothe identification study, the energy consumption is linearlycorrelated with the number of affected tuples (in blocks).Thus, the cost function iswln+ wp.
Sort Merge join: The sort merge join includes the sortoperation of the sub-lists as the intermediate results of thetwo lower level nodes. After the sorting, the sort merge joinconsumeswmn joule of energy for merging. Meanwhile,we also consider the cost of related memory accesses. Thetotal cost iswmn+ wtnR+ wp.
Hash join: The cost model of the hash join is similar asthe one from the block nested loop join. The cost containsbuilding and probing phase during the computing. Unliketime estimation, for energy consumption, we consider thecost of building the hash table during the probe phase. Thehash join identifies the outer and inner table in a subsequentprobing phase, and takes hashing to both relations on thejoin attribute. We generate the cost function due to theenergy cost of both phases are proportional to the input sizen and related I/O cost from accessingp pages, aswhn+wp.
Analysis of Energy Profiles of Join Algorithms. The highcost of joins motivated us to further study the energyprofiles of different join algorithms. In particular, we aimat an in-depth understanding of the energy consumptionpatterns of such algorithms by investigating their hardwareuse patterns. Hardware counters are the number of low-levelhardware activities during the execution of a computingthread. Here we use this tool to learn the runtime hardwarebehavior of different join algorithms. In our study, we
0%
100%
200%
300%
CYC TCM SCY
Norm
aliz
ed
Hard
ware
Counte
rs
NestedLoopMergeSort
Hash
Fig. 9. Normalized performance counters [39] fromthree joins.
perform over 1000 queries using the TPC-H scheme thathave join operations in PostgreSQL (Hardware setup detailsare in Section 5.1). We record the following performancecounters: number of CPU cycles (CYC), (i.e., all usedCPU cycles related to the thread), last-level cache misses(TCM), CPU cycles stalled for memory access (SCY). Wechoose those counters based on the results from [39], whichrepresent the energy performance of CPU and memory forspecific processes.
As shown in Figure 9, on average, the nested loop joinonly uses 15%-17% more CPU cycles. This is surprisingsince the nested loop join, being a quadratic algorithm,processes much more tuple-to-tuple comparisons than theother two algorithms. Most cycles are stalled for memoryoperations. Compared with the nested loop join, the hashjoin has two times more cache misses because it frequentlyaccesses the in-memory hash table. As a result, the hashjoin has a much higher energy footprint than the nestedloop join due to the high power consumption from cachemanagement. On the other hand, the sort merge join seemsto be a tradeoff between these two joins. the sort merge joinuses slightly more CPU cycles but has much less lowercache misses than the hash join. Based on results fromFigure 9, we find that the sort merge join is a safe choice toselect for saving energy (more discussions on the selectionchoices are presented in Section 7).
4.3 Other Operators
Update: update operations write the new data into therow(s) of data table after finding the target row(s). We as-sume the procedure of finding such target always uses indexscan. Therefore, the energy consumption is the combinationof the scan cost and update cost. We use a linear model toadd those cost up, and it giveswin+ wup+ wp.Deletion: the deletion operation is similar to the updateoperation. The only difference lies on the operation afterfinding the target row(s). The deletion operation markscertain data in memory as invalid and releases the memoryspace. This is an atomic operation, thus the energy con-sumption of a deletion operation iswin+ wrp+ wp.
5 MODEL VALIDATION
5.1 Experimental Setup
Our testbed consists of a 2U Dell R710 (3.0 GHz 12-core CPU Xeon E5645, 32GB of DDR3 memory, and 2TB
8
7200RPM HDD as local storage, as shown in Table 1)server and various workloads generated from three SDSSworkloads [40] and 22 standard TPC-H queries [15]. Weuse another computer to produce database workloads andcollect experimental data including query statistics andenergy consumption. The energy consumption is measuredby power meters (i.e., a 34410A Digital multimeter [41] anda Wattsup power meter [42]). To measure the CPU power,we attach current clamp from the digital multimeter to theCPU power circuit. The energy consumption of the wholeserver is measured by the Wattsup power meter at a 1Hzfrequency. The data server is installed with PostgreSQL8.3.14 under Redhat 5 (kernel 2.6.9). The DBMS’s kernelis modified to provide runtime information such as theestimated energy cost, the data histogram/cardinality andthe plan selection.
In the experiments, we set the multi-processing level(MPL) to one (i.e., only one query is in processing at a timein the DBMS). We measure the energy consumption of theentire server and compare it with the estimated energy costgiven by the corresponding models. The following metricnamedEstimation Error Rate(EER) is used to quantify themodel accuracy:
EER =|E − E|
E(4)
whereE stands for the estimated energy given by our modelandE is the measured energy consumption.
5.2 Experimental Results
We use SDSS and TPC-H benchmarks to simulate queriesthat retrieve different amounts of data. For example, theSDSS benchmark simulates a large scientific database en-vironment with long queries that touch large amount ofdata while TPC-H simulates a business data warehousewith a smaller data size. In this way, we could test theenergy estimation accuracy using real queries that requireprocessing of various relational operators discussed in ourstatic model.SDSS Validation:we materialize a database from thepublished SDSS data. Then we create three workloads:workload I is an equality search based on a sequential tablescan; workload II performs a merge join of two tables afterrange search; and workload III is a range search based onindex scan. We repeat each single-query workload for 1,000times with different search predicates generated randomly.We present the average energy consumption in Figure 10.The difference between the estimated energy and measuredenergy is very small in almost all cases. The average EERsof the three experiments are3.32%, 2.66%, and 1.78%,respectively.TPC-H Validation:To further validate the static model, weconduct a similar experiment for all 22 queries of the TPC-H benchmark. Each workload is a single query extractedfrom TPC-H tools. The results (Figure 11) show very highaccuracy, with an average EER of 7.97%. Query 19 has thehighest EER (12.42%) because it has three embedded sub-queries in the selection process which leads to system errors
0
4
8
12
WorkloadI WorkloadII WorkloadIII
En
erg
y (
kJ)
Estimated EnergyReal Energy
Fig. 10. Energy data of running three SDSS workloads
0 %
5 %
10 %
15 %
20 %
1 2 3 4 5 6 7 8 9 10111213141516171819202122
Ave
rag
e E
ER
TPC-H Query Index
12.42%
Fig. 11. Estimation errors from the 22 TPC-H queries
that cannot be modeled in Equation 3. Next, we discuss thelimitation of the static model.
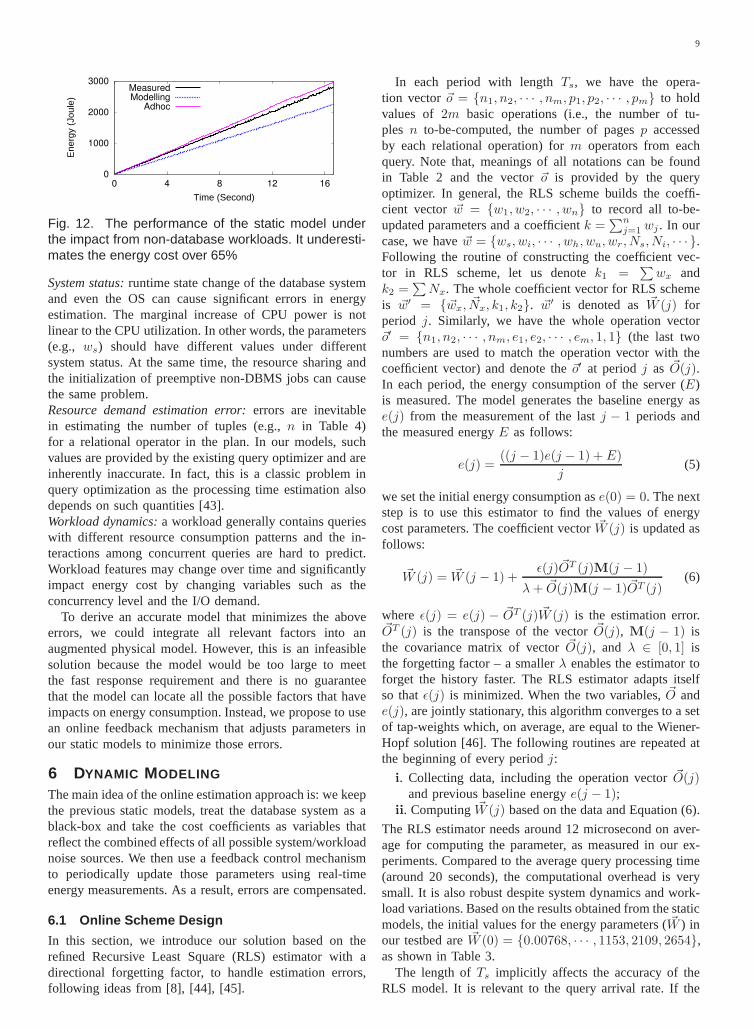
5.2.1 Limitations of the ModelsThe above experiments exhibit that the models work ef-fectively in a static setup. However, our modeling task isfar from accomplished. When we change some features,such as the MPL of the workload, the model could easilyfail. In Figure 12, we change CPU resource availabilityby introducing CPU-intensive non-database jobs into thesystem. It causes a serious energy underestimation (bluedash line in Figure 12) and an average EER of 65%.To accurately model energy cost, our model needs to beadaptive to capture the changes of system status.
One might argue that the problem is caused only by themodel’s failure in capturing the increased baseline power ofthe system, and can be easily solved by reading a runtimebaseline power as a system-level parameter. However, webelieve such a solution would still not be robust. First, com-petition between concurrent queries has profound effects onenergy consumption. Second, when such effects are mixedwith other situations caused by system state change (suchas that in Figure 12), it is almost impossible to tell themapart in the model. To verify our claim in the context ofthis experiment, we implement and test such anad hocsolution that measures and adds the baseline energy costto the results of the static models as the estimated energy.The results (pink dash line in Figure 12) clearly show thatthe ad hocmodel systematically overestimates the energywith a large error (i.e., average EER reaches 32.67%). Theoverestimation error comes from resource sharing amongconcurrent queries.
5.2.2 Source of ErrorsMany factors can contribute to errors in energy estimationof a database system. According to our empirical studies,such factors can be separated into three categories.
9
0
1000
2000
3000
0 4 8 12 16
Ene
rgy
(Jou
le)
Time (Second)
MeasuredModelling
Adhoc
Fig. 12. The performance of the static model underthe impact from non-database workloads. It underesti-mates the energy cost over 65%
System status:runtime state change of the database systemand even the OS can cause significant errors in energyestimation. The marginal increase of CPU power is notlinear to the CPU utilization. In other words, the parameters(e.g., ws) should have different values under differentsystem status. At the same time, the resource sharing andthe initialization of preemptive non-DBMS jobs can causethe same problem.Resource demand estimation error:errors are inevitablein estimating the number of tuples (e.g.,n in Table 4)for a relational operator in the plan. In our models, suchvalues are provided by the existing query optimizer and areinherently inaccurate. In fact, this is a classic problem inquery optimization as the processing time estimation alsodepends on such quantities [43].Workload dynamics:a workload generally contains querieswith different resource consumption patterns and the in-teractions among concurrent queries are hard to predict.Workload features may change over time and significantlyimpact energy cost by changing variables such as theconcurrency level and the I/O demand.
To derive an accurate model that minimizes the aboveerrors, we could integrate all relevant factors into anaugmented physical model. However, this is an infeasiblesolution because the model would be too large to meetthe fast response requirement and there is no guaranteethat the model can locate all the possible factors that haveimpacts on energy consumption. Instead, we propose to usean online feedback mechanism that adjusts parameters inour static models to minimize those errors.
6 DYNAMIC MODELING
The main idea of the online estimation approach is: we keepthe previous static models, treat the database system as ablack-box and take the cost coefficients as variables thatreflect the combined effects of all possible system/workloadnoise sources. We then use a feedback control mechanismto periodically update those parameters using real-timeenergy measurements. As a result, errors are compensated.
6.1 Online Scheme Design
In this section, we introduce our solution based on therefined Recursive Least Square (RLS) estimator with adirectional forgetting factor, to handle estimation errors,following ideas from [8], [44], [45].
In each period with lengthTs, we have the opera-tion vector~o = {n1, n2, · · · , nm, p1, p2, · · · , pm} to holdvalues of 2m basic operations (i.e., the number of tu-ples n to-be-computed, the number of pagesp accessedby each relational operation) form operators from eachquery. Note that, meanings of all notations can be foundin Table 2 and the vector~o is provided by the queryoptimizer. In general, the RLS scheme builds the coeffi-cient vector ~w = {w1, w2, · · · , wn} to record all to-be-updated parameters and a coefficientk =
∑nj=1 wj . In our
case, we have~w = {ws, wi, · · · , wh, wu, wr, Ns, Ni, · · · }.Following the routine of constructing the coefficient vec-tor in RLS scheme, let us denotek1 =
∑
wx andk2 =
∑
Nx. The whole coefficient vector for RLS schemeis ~w′ = {~wx, ~Nx, k1, k2}. ~w′ is denoted as~W (j) forperiod j. Similarly, we have the whole operation vector~o′ = {n1, n2, · · · , nm, e1, e2, · · · , em, 1, 1} (the last twonumbers are used to match the operation vector with thecoefficient vector) and denote the~o′ at periodj as ~O(j).In each period, the energy consumption of the server (E)is measured. The model generates the baseline energy ase(j) from the measurement of the lastj − 1 periods andthe measured energyE as follows:
e(j) =((j − 1)e(j − 1) + E)
j(5)
we set the initial energy consumption ase(0) = 0. The nextstep is to use this estimator to find the values of energycost parameters. The coefficient vector~W (j) is updated asfollows:
~W (j) = ~W (j − 1) +ǫ(j) ~OT (j)M(j − 1)
λ+ ~O(j)M(j − 1) ~OT (j)(6)
where ǫ(j) = e(j) − ~OT (j) ~W (j) is the estimation error.~OT (j) is the transpose of the vector~O(j), M(j − 1) isthe covariance matrix of vector~O(j), and λ ∈ [0, 1] isthe forgetting factor – a smallerλ enables the estimator toforget the history faster. The RLS estimator adapts itselfso thatǫ(j) is minimized. When the two variables,~O ande(j), are jointly stationary, this algorithm converges to a setof tap-weights which, on average, are equal to the Wiener-Hopf solution [46]. The following routines are repeated atthe beginning of every periodj:
i. Collecting data, including the operation vector~O(j)and previous baseline energye(j − 1);
ii. Computing~W (j) based on the data and Equation (6).
The RLS estimator needs around 12 microsecond on aver-age for computing the parameter, as measured in our ex-periments. Compared to the average query processing time(around 20 seconds), the computational overhead is verysmall. It is also robust despite system dynamics and work-load variations. Based on the results obtained from the staticmodels, the initial values for the energy parameters (~W ) inour testbed are~W (0) = {0.00768, · · · , 1153, 2109, 2654},as shown in Table 3.
The length ofTs implicitly affects the accuracy of theRLS model. It is relevant to the query arrival rate. If the
10
query arrival rate is high,Ts needs to be set smaller tosample sufficient variance. Otherwise, we could make itlonger to avoid excessive computational overhead. In ourexperiment, we set it to be1/9 seconds, the same samplingfrequency as the energy cost measurement. In all, we builda two-layer estimation model called RLS model.
6.2 Experimental Setup
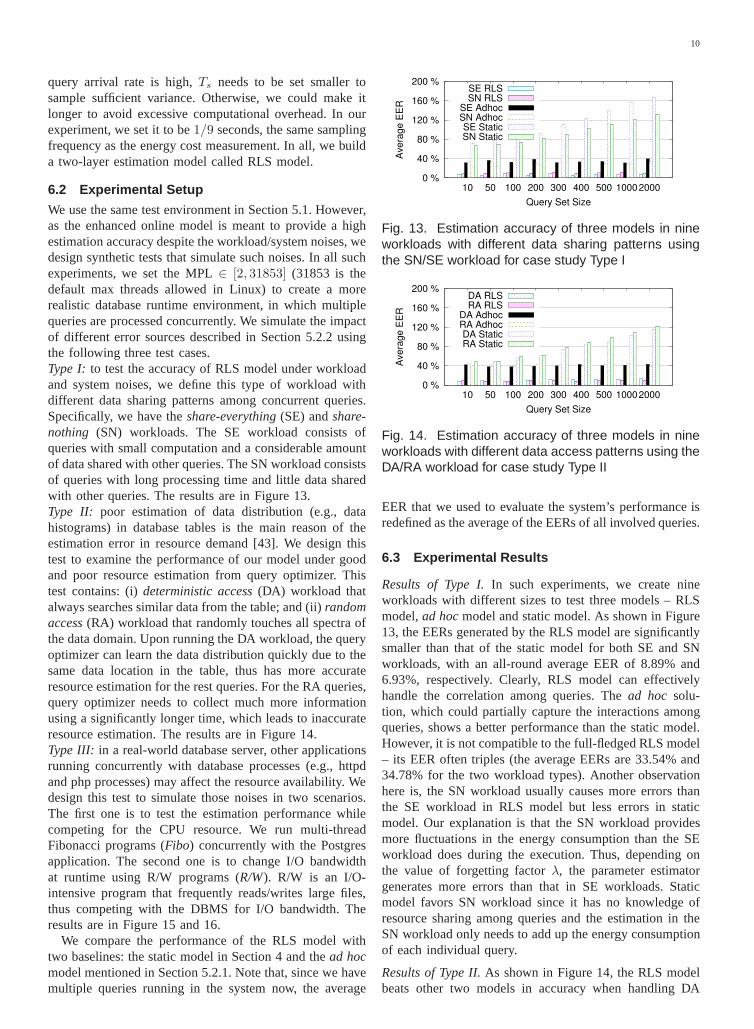
We use the same test environment in Section 5.1. However,as the enhanced online model is meant to provide a highestimation accuracy despite the workload/system noises, wedesign synthetic tests that simulate such noises. In all suchexperiments, we set the MPL∈ [2, 31853] (31853 is thedefault max threads allowed in Linux) to create a morerealistic database runtime environment, in which multiplequeries are processed concurrently. We simulate the impactof different error sources described in Section 5.2.2 usingthe following three test cases.Type I: to test the accuracy of RLS model under workloadand system noises, we define this type of workload withdifferent data sharing patterns among concurrent queries.Specifically, we have theshare-everything(SE) andshare-nothing (SN) workloads. The SE workload consists ofqueries with small computation and a considerable amountof data shared with other queries. The SN workload consistsof queries with long processing time and little data sharedwith other queries. The results are in Figure 13.Type II: poor estimation of data distribution (e.g., datahistograms) in database tables is the main reason of theestimation error in resource demand [43]. We design thistest to examine the performance of our model under goodand poor resource estimation from query optimizer. Thistest contains: (i)deterministic access(DA) workload thatalways searches similar data from the table; and (ii)randomaccess(RA) workload that randomly touches all spectra ofthe data domain. Upon running the DA workload, the queryoptimizer can learn the data distribution quickly due to thesame data location in the table, thus has more accurateresource estimation for the rest queries. For the RA queries,query optimizer needs to collect much more informationusing a significantly longer time, which leads to inaccurateresource estimation. The results are in Figure 14.Type III: in a real-world database server, other applicationsrunning concurrently with database processes (e.g., httpdand php processes) may affect the resource availability. Wedesign this test to simulate those noises in two scenarios.The first one is to test the estimation performance whilecompeting for the CPU resource. We run multi-threadFibonacci programs (Fibo) concurrently with the Postgresapplication. The second one is to change I/O bandwidthat runtime using R/W programs (R/W). R/W is an I/O-intensive program that frequently reads/writes large files,thus competing with the DBMS for I/O bandwidth. Theresults are in Figure 15 and 16.
We compare the performance of the RLS model withtwo baselines: the static model in Section 4 and thead hocmodel mentioned in Section 5.2.1. Note that, since we havemultiple queries running in the system now, the average
0 %
40 %
80 %
120 %
160 %
200 %
10 50 100 200 300 400 500 10002000
Ave
rag
e E
ER
Query Set Size
SE RLSSN RLS
SE AdhocSN AdhocSE StaticSN Static
Fig. 13. Estimation accuracy of three models in nineworkloads with different data sharing patterns usingthe SN/SE workload for case study Type I
0 %
40 %
80 %
120 %
160 %
200 %
10 50 100 200 300 400 500 10002000A
ve
rag
e E
ER
Query Set Size
DA RLSRA RLS
DA AdhocRA AdhocDA StaticRA Static
Fig. 14. Estimation accuracy of three models in nineworkloads with different data access patterns using theDA/RA workload for case study Type II
EER that we used to evaluate the system’s performance isredefined as the average of the EERs of all involved queries.
6.3 Experimental Results
Results of Type I.In such experiments, we create nineworkloads with different sizes to test three models – RLSmodel,ad hocmodel and static model. As shown in Figure13, the EERs generated by the RLS model are significantlysmaller than that of the static model for both SE and SNworkloads, with an all-round average EER of 8.89% and6.93%, respectively. Clearly, RLS model can effectivelyhandle the correlation among queries. Thead hoc solu-tion, which could partially capture the interactions amongqueries, shows a better performance than the static model.However, it is not compatible to the full-fledged RLS model– its EER often triples (the average EERs are 33.54% and34.78% for the two workload types). Another observationhere is, the SN workload usually causes more errors thanthe SE workload in RLS model but less errors in staticmodel. Our explanation is that the SN workload providesmore fluctuations in the energy consumption than the SEworkload does during the execution. Thus, depending onthe value of forgetting factorλ, the parameter estimatorgenerates more errors than that in SE workloads. Staticmodel favors SN workload since it has no knowledge ofresource sharing among queries and the estimation in theSN workload only needs to add up the energy consumptionof each individual query.
Results of Type II.As shown in Figure 14, the RLS modelbeats other two models in accuracy when handling DA
11
0 %
20 %
40 %
60 %
80 %
0 5 10 15 20 25 30 35 40 0
20
40
60
80
Ave
rag
e E
ER
# o
f T
hre
ad
s
Time (second)
Fibo ThreadsRLS Performance
Fig. 15. Model performance in case study Type IIIusing the workload Fibo
workload – the average EER is 7.13% with the highestbeing 11.9%. For the DA workload, queries always visit thesame part of the table therefore it leads to very high cachehit rate. That is likely to be the reason why the estimationerrors of static model show (roughly) a linear increasein Figure 13. For the RA workload, although the queryoptimizer could produce large error in resource estimation,our dynamic model can capture the trend of such errors andcompensate them. The EERs are lower than 10% for mostcases – the average EER is 7.26% with the highest EERbeing 11.07%. For both workloads, the performance of RLSmodel is good as it is designed to capture the variationsfrom resource estimation.
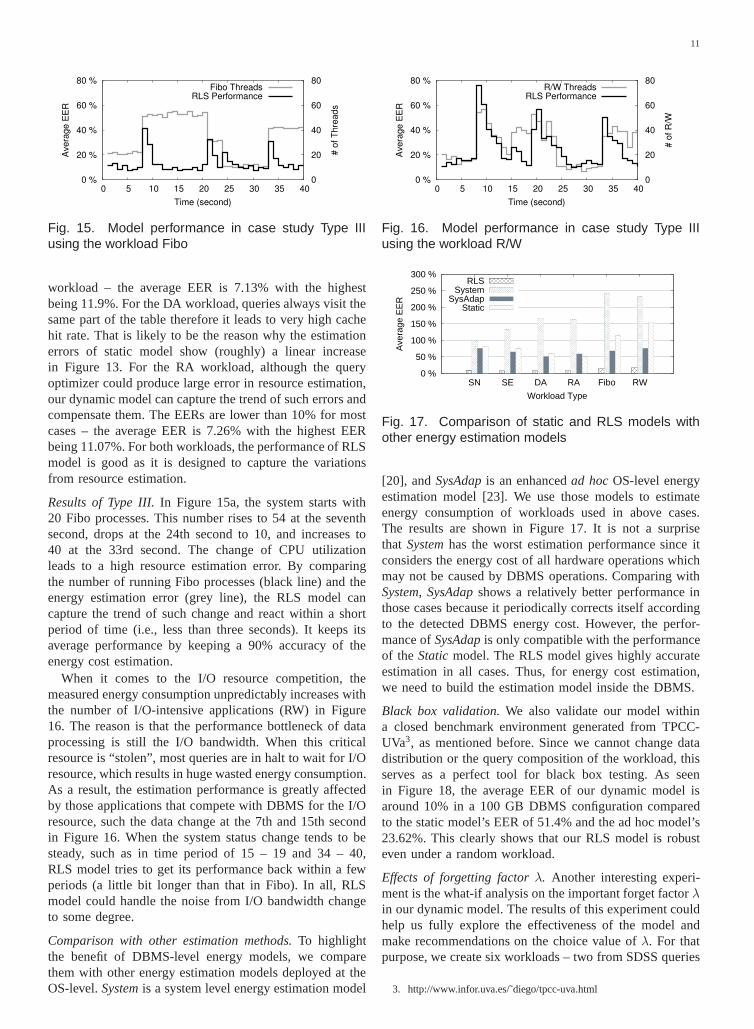
Results of Type III.In Figure 15a, the system starts with20 Fibo processes. This number rises to 54 at the seventhsecond, drops at the 24th second to 10, and increases to40 at the 33rd second. The change of CPU utilizationleads to a high resource estimation error. By comparingthe number of running Fibo processes (black line) and theenergy estimation error (grey line), the RLS model cancapture the trend of such change and react within a shortperiod of time (i.e., less than three seconds). It keeps itsaverage performance by keeping a 90% accuracy of theenergy cost estimation.
When it comes to the I/O resource competition, themeasured energy consumption unpredictably increases withthe number of I/O-intensive applications (RW) in Figure16. The reason is that the performance bottleneck of dataprocessing is still the I/O bandwidth. When this criticalresource is “stolen”, most queries are in halt to wait for I/Oresource, which results in huge wasted energy consumption.As a result, the estimation performance is greatly affectedby those applications that compete with DBMS for the I/Oresource, such the data change at the 7th and 15th secondin Figure 16. When the system status change tends to besteady, such as in time period of 15 – 19 and 34 – 40,RLS model tries to get its performance back within a fewperiods (a little bit longer than that in Fibo). In all, RLSmodel could handle the noise from I/O bandwidth changeto some degree.
Comparison with other estimation methods.To highlightthe benefit of DBMS-level energy models, we comparethem with other energy estimation models deployed at theOS-level.Systemis a system level energy estimation model
0 %
20 %
40 %
60 %
80 %
0 5 10 15 20 25 30 35 40 0
20
40
60
80
Ave
rag
e E
ER
# o
f R
/W
Time (second)
R/W ThreadsRLS Performance
Fig. 16. Model performance in case study Type IIIusing the workload R/W
0 %
50 %
100 %
150 %
200 %
250 %
300 %
SN SE DA RA Fibo RW
Ave
rage
EE
RWorkload Type
RLSSystem
SysAdapStatic
Fig. 17. Comparison of static and RLS models withother energy estimation models
[20], andSysAdapis an enhancedad hocOS-level energyestimation model [23]. We use those models to estimateenergy consumption of workloads used in above cases.The results are shown in Figure 17. It is not a surprisethat Systemhas the worst estimation performance since itconsiders the energy cost of all hardware operations whichmay not be caused by DBMS operations. Comparing withSystem, SysAdapshows a relatively better performance inthose cases because it periodically corrects itself accordingto the detected DBMS energy cost. However, the perfor-mance ofSysAdapis only compatible with the performanceof the Staticmodel. The RLS model gives highly accurateestimation in all cases. Thus, for energy cost estimation,we need to build the estimation model inside the DBMS.
Black box validation.We also validate our model withina closed benchmark environment generated from TPCC-UVa3, as mentioned before. Since we cannot change datadistribution or the query composition of the workload, thisserves as a perfect tool for black box testing. As seenin Figure 18, the average EER of our dynamic model isaround 10% in a 100 GB DBMS configuration comparedto the static model’s EER of 51.4% and the ad hoc model’s23.62%. This clearly shows that our RLS model is robusteven under a random workload.
Effects of forgetting factorλ. Another interesting experi-ment is the what-if analysis on the important forget factorλin our dynamic model. The results of this experiment couldhelp us fully explore the effectiveness of the model andmake recommendations on the choice value ofλ. For thatpurpose, we create six workloads – two from SDSS queries
3. http://www.infor.uva.es/˜diego/tpcc-uva.html
12
0 %
20 %
40 %
60 %
80 %
1 2 3 4 5 6 7 8 9
Avera
ge E
ER
Workload Index
RLSAdhocStatic
Fig. 18. The average EER of running multiple TPC-Cworkloads in TPCC-Uva
0 %
5 %
10 %
15 %
20 %
SDSS100 SDSS200 TPCH100 TPCH200 TPCH300 TPCH400
Ave
rag
e E
ER
Query Set
λ=0λ=0.1λ=0.5
λ=1
Fig. 19. Accuracy of the RLS model under six differentworkload sets and four different λ values
and four with various combinations of TPC-H queries – toprovide a diversified testing environment. As seen in Figure19, a smaller forgetting factor has more negative effects onthe accuracy of the RLS model. For the SDSS workloads(the first two histogram clusters in Figure 19), the resultsare stable without showing much difference under differentλ. Our explanation is: most queries in SDSS are I/O-bounddue to the sheer size of the database table - this creates avery static situation in terms of the energy consumption.However, in a dynamic environment, if the system statesfollow a historical trend (e.g., those of coarse-grained paral-lel workload or a deterministic access workload), increasingthe value ofλ gains significant benefits in terms of modelaccuracy. Thus, we suggest the maximum value (i.e., 1.0)of λ be used in order to obtain more historical data andhigher accuracy of the model.
7 IMPACT OF ENERGY-AWARE QUERY OP-TIMIZATION
Our previous work [12] proposed a composite query costmodel that considers both latency and energy of the queryplans. Furthermore, the model can be configured to reflectthe energy/performance tradeoff the DB Administer wishesto adopt. Obviously, the effectiveness of such a cost modeldepends on how accurately we estimate the energy/latencyof the visited plans. In this section, we explore the impactof our energy models on query optimization towards energyconsumption. First, we provide an energy efficiency studybased on the energy consumption data of executing queriesoptimized by three different query optimizers. Workloadsare processed by a PostgreSQL system with three differ-ent flavors of query cost model in its query optimizer– Traditional (the original PostgreSQL cost model thatonly considers query latency),Power-aware(the optimizer
0
50
100
150
200
250
500MB 1GB 10GB 100GB
Ene
rgy
(KJ)
Database Size
RLS ModelPower-aware
Traditional
Fig. 21. The energy consumption of different queryplans with different optimization goals
with a query cost model towards maximal power efficiencybut with a simple energy estimation scheme), andRLSmodel(same optimizer as in ‘Power-aware’ but the dynamicenergy estimation model proposed in this paper). To furtherexplore what exactly changed in the plan selection, wefirst reveal the detailed processing paths from those threeoptimizers for one query (Q10 from the standard TPC-H benchmark). We then present results of other affectedqueries, and finally discuss the rationale behind the results.
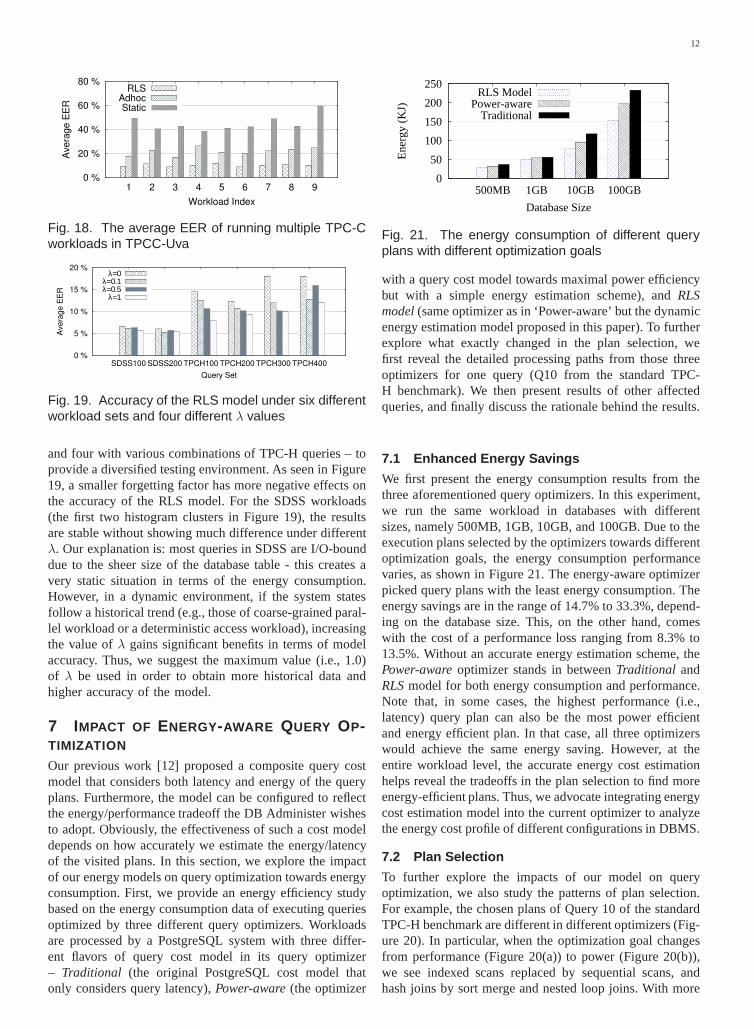
7.1 Enhanced Energy Savings
We first present the energy consumption results from thethree aforementioned query optimizers. In this experiment,we run the same workload in databases with differentsizes, namely 500MB, 1GB, 10GB, and 100GB. Due to theexecution plans selected by the optimizers towards differentoptimization goals, the energy consumption performancevaries, as shown in Figure 21. The energy-aware optimizerpicked query plans with the least energy consumption. Theenergy savings are in the range of 14.7% to 33.3%, depend-ing on the database size. This, on the other hand, comeswith the cost of a performance loss ranging from 8.3% to13.5%. Without an accurate energy estimation scheme, thePower-awareoptimizer stands in betweenTraditional andRLSmodel for both energy consumption and performance.Note that, in some cases, the highest performance (i.e.,latency) query plan can also be the most power efficientand energy efficient plan. In that case, all three optimizerswould achieve the same energy saving. However, at theentire workload level, the accurate energy cost estimationhelps reveal the tradeoffs in the plan selection to find moreenergy-efficient plans. Thus, we advocate integrating energycost estimation model into the current optimizer to analyzethe energy cost profile of different configurations in DBMS.
7.2 Plan Selection
To further explore the impacts of our model on queryoptimization, we also study the patterns of plan selection.For example, the chosen plans of Query 10 of the standardTPC-H benchmark are different in different optimizers (Fig-ure 20). In particular, when the optimization goal changesfrom performance (Figure 20(a)) to power (Figure 20(b)),we see indexed scans replaced by sequential scans, andhash joins by sort merge and nested loop joins. With more
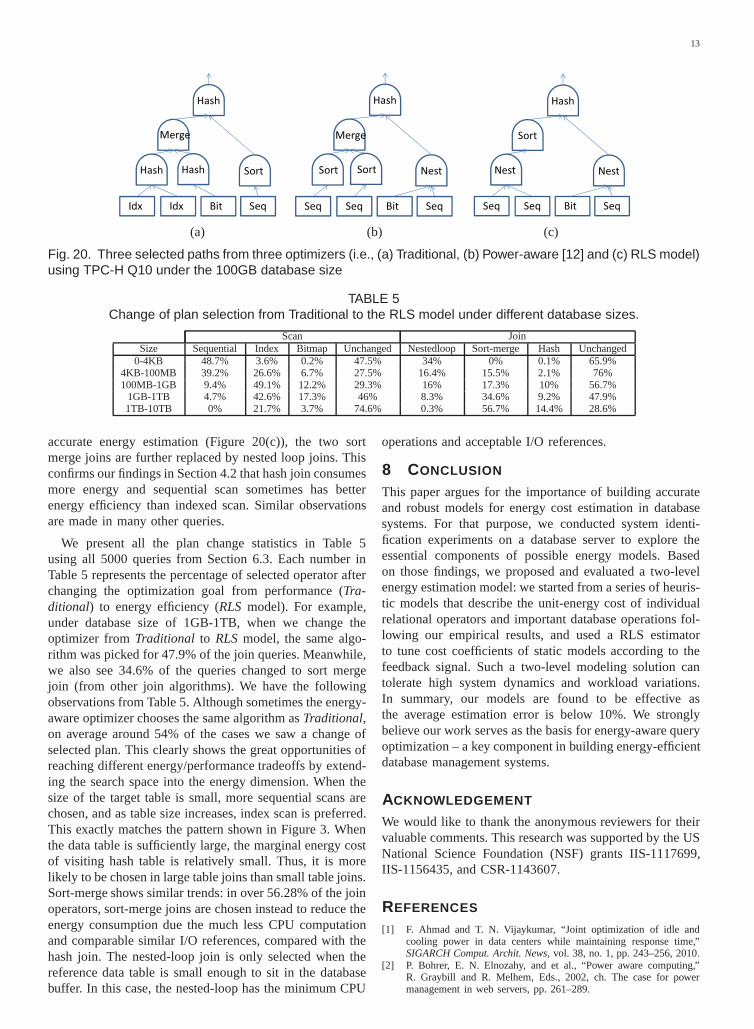
13
����
�����
� � � � ���
���� ����
����
�����
��� ��� �� ���
�� ���
���
��
����
��� ��� ��� ���
�� ��
��
(a) (b) (c)
Fig. 20. Three selected paths from three optimizers (i.e., (a) Traditional, (b) Power-aware [12] and (c) RLS model)using TPC-H Q10 under the 100GB database size
TABLE 5Change of plan selection from Traditional to the RLS model under different database sizes.
Scan JoinSize Sequential Index Bitmap Unchanged Nestedloop Sort-merge Hash Unchanged
0-4KB 48.7% 3.6% 0.2% 47.5% 34% 0% 0.1% 65.9%4KB-100MB 39.2% 26.6% 6.7% 27.5% 16.4% 15.5% 2.1% 76%100MB-1GB 9.4% 49.1% 12.2% 29.3% 16% 17.3% 10% 56.7%
1GB-1TB 4.7% 42.6% 17.3% 46% 8.3% 34.6% 9.2% 47.9%1TB-10TB 0% 21.7% 3.7% 74.6% 0.3% 56.7% 14.4% 28.6%
accurate energy estimation (Figure 20(c)), the two sortmerge joins are further replaced by nested loop joins. Thisconfirms our findings in Section 4.2 that hash join consumesmore energy and sequential scan sometimes has betterenergy efficiency than indexed scan. Similar observationsare made in many other queries.
We present all the plan change statistics in Table 5using all 5000 queries from Section 6.3. Each number inTable 5 represents the percentage of selected operator afterchanging the optimization goal from performance (Tra-ditional) to energy efficiency (RLS model). For example,under database size of 1GB-1TB, when we change theoptimizer fromTraditional to RLSmodel, the same algo-rithm was picked for 47.9% of the join queries. Meanwhile,we also see 34.6% of the queries changed to sort mergejoin (from other join algorithms). We have the followingobservations from Table 5. Although sometimes the energy-aware optimizer chooses the same algorithm asTraditional,on average around 54% of the cases we saw a change ofselected plan. This clearly shows the great opportunities ofreaching different energy/performance tradeoffs by extend-ing the search space into the energy dimension. When thesize of the target table is small, more sequential scans arechosen, and as table size increases, index scan is preferred.This exactly matches the pattern shown in Figure 3. Whenthe data table is sufficiently large, the marginal energy costof visiting hash table is relatively small. Thus, it is morelikely to be chosen in large table joins than small table joins.Sort-merge shows similar trends: in over 56.28% of the joinoperators, sort-merge joins are chosen instead to reduce theenergy consumption due the much less CPU computationand comparable similar I/O references, compared with thehash join. The nested-loop join is only selected when thereference data table is small enough to sit in the databasebuffer. In this case, the nested-loop has the minimum CPU
operations and acceptable I/O references.
8 CONCLUSION
This paper argues for the importance of building accurateand robust models for energy cost estimation in databasesystems. For that purpose, we conducted system identi-fication experiments on a database server to explore theessential components of possible energy models. Basedon those findings, we proposed and evaluated a two-levelenergy estimation model: we started from a series of heuris-tic models that describe the unit-energy cost of individualrelational operators and important database operations fol-lowing our empirical results, and used a RLS estimatorto tune cost coefficients of static models according to thefeedback signal. Such a two-level modeling solution cantolerate high system dynamics and workload variations.In summary, our models are found to be effective asthe average estimation error is below 10%. We stronglybelieve our work serves as the basis for energy-aware queryoptimization – a key component in building energy-efficientdatabase management systems.
ACKNOWLEDGEMENT
We would like to thank the anonymous reviewers for theirvaluable comments. This research was supported by the USNational Science Foundation (NSF) grants IIS-1117699,IIS-1156435, and CSR-1143607.
REFERENCES
[1] F. Ahmad and T. N. Vijaykumar, “Joint optimization of idle andcooling power in data centers while maintaining response time,”SIGARCH Comput. Archit. News, vol. 38, no. 1, pp. 243–256, 2010.
[2] P. Bohrer, E. N. Elnozahy, and et al., “Power aware computing,”R. Graybill and R. Melhem, Eds., 2002, ch. The case for powermanagement in web servers, pp. 261–289.

14
[3] L. Benini, R. Bogliolo, and G. D. Micheli, “A survey of designtechniques for system-level dynamic power management,”IEEETransactions on VLSI Systems, vol. 8, pp. 299–316, 2000.
[4] A. Berl, E. Gelenbe, M. D. Girolamo, G. Giuliani, H. de Meer,M. Q. Dang, and K. Pentikousis, “Energy-efficient cloud computing,”Comput. J., vol. 53, no. 7, pp. 1045–1051, 2010.
[5] C. Isci and M. Martonosi, “Runtime power monitoring in high-end processors: Methodology and empirical data,” inProc. of theMICRO, 2003, pp. 93–105.
[6] B. Chandramouli, W. C. Hsieh, J. B. Carter, and S. A. McKee, “Acost model for integrated restructuring optimizations,”J. Instruction-Level Parallelism, vol. 5, 2003.
[7] A. Kansal, F. Zhao, J. Liu, N. Kothari, and A. A. Bhattacharya,“Virtual machine power metering and provisioning,” inSoCC, 2010,pp. 39–50.
[8] Y. Wang, X. Wang, M. Chen, and X. Zhu, “Power-efficient responsetime guarantees for virtualized enterprise servers,” inIEEE Real-Time Systems Symposium, 2008, pp. 303–312.
[9] M. Poess and R. O. Nambiar, “Energy cost, the key challengeof today’s data centers: a power consumption analysis of TPC-Cresults,”PVLDB, vol. 1, no. 2, pp. 1229–1240, 2008.
[10] R. Agrawal, A. Ailamaki, and et al., “The Claremont Report onDatabase Research,”Communications of ACM, vol. 52, pp. 56–65,Jun. 2009.
[11] W. Lang, R. Kandhan, and J. M. Patel, “Rethinking Query Processingfor Energy Efficiency: Slowing Down to Win the Race,”IEEE DataEngineering Bulletin, vol. 34, no. 1, pp. 12–23, 2011.
[12] Z. Xu, Y. Tu, and X. Wang, “Exploring power- performancetradeoffsin database systems,” inProc. of ICDE, 2010.
[13] M. Poess, R. O. Nambiar, K. Vaid, J. M. Stephens, K. Huppler, andE. Haines, “Energy benchmarks: a detailed analysis,” ine-Energy,2010, pp. 131–140.
[14] W. Lang and J. M. Patel, “Towards eco-friendly databasemanage-ment systems,” inCIDR, 2009.
[15] Transaction Processing Performance Council, http://www.tpc.org.[16] M. Kunjir, P. Birwa, and J. Haritsa, “Peak Power Plays inDatabase
Engines,” inProc. of the EDBT, 2012.[17] J. S. Chase, D. C. Anderson, P. N. Thakar, A. M. Vahdat, and R. P.
Doyle, “Managing energy and server resources in hosting centers,”SIGOPS Oper. Syst. Rev., vol. 35, no. 5, pp. 103–116, Oct. 2001.
[18] H. Zeng, C. S. Ellis, A. R. Lebeck, and A. Vahdat, “Ecosystem:managing energy as a first class operating system resource,”SIGOPSOper. Syst. Rev., vol. 36, no. 5, pp. 123–132, Oct. 2002.
[19] R. Bianchini and R. Rajamony, “Power and energy management forserver systems,”Computer, vol. 37, no. 11, pp. 68–74, Nov. 2004.
[20] T. Heath, B. Diniz, E. V. Carrera, W. Meira, Jr., and R. Bianchini,“Energy conservation in heterogeneous server clusters,” in Proceed-ings of PPoPP’05. New York, NY, USA: ACM, 2005, pp. 186–195.
[21] D. Meisner, C. M. Sadler, L. A. Barroso, W.-D. Weber, andT. F.Wenisch, “Power management of online data-intensive services,” inProc. of the ISCA. New York, NY, USA: ACM, 2011, pp. 319–330.
[22] A. Verma, G. Dasgupta, T. K. Nayak, P. De, and R. Kothari,“Serverworkload analysis for power minimization using consolidation,” inProceedings of the USENIX’09, 2009, pp. 28–28.
[23] X. Wang, K. Ma, and Y. Wang, “Adaptive power control withonlinemodel estimation for chip multiprocessors,”IEEE Trans. ParallelDistrib. Syst., vol. 22, no. 10, pp. 1681–1696, Oct. 2011.
[24] J. B. Carter and K. Rajamani, “Designing energy-efficient serversand data centers,”IEEE Computer, vol. 43, no. 7, pp. 76–78, 2010.
[25] Z. Abbasi, G. Varsamopoulos, and S. K. S. Gupta, “Tacoma:Server and workload management in internet data centers consider-ing cooling-computing power trade-off and energy proportionality,”ACM Trans. Archit. Code Optim., vol. 9, no. 2, pp. 11:1–11:37, Jun.2012.
[26] R. Alonso and S. Ganguly, “Energy Efficient Query Optimization,”Matsushita Info Tech Lab, Tech. Rep., 1992.
[27] G. Graefe, “Database servers tailored to improve energy efficiency,”in Proc. of EDBT Workshop, ser. SETMDM ’08, 2008, pp. 24–28.
[28] S. Harizopoulos, M. A. Shah, J. Meza, and P. Ranganathan, “En-ergy efficiency: The new holy grail of data management systemsresearch,” inCIDR, 2009.
[29] D. Tsirogiannis, S. Harizopoulos, and M. A. Shah, “Analyzing theenergy efficiency of a database server,” inProc. of the internationalconf. on management of data, ser. SIGMOD ’10, 2010, pp. 231–242.
[30] M. Poess and R. O. Nambiar, “Tuning servers, storage anddatabasefor energy efficient data warehouses,” inICDE, 2010.
[31] ——, “Power Based Performance and Capacity Estimation Modelsfor Enterprise Information Systems,”IEEE Data Engineering Bul-letin, vol. 34, no. 1, pp. 34–49, 2011.
[32] Z. Xu, Y. Tu, and X. Wang, “Dynamic energy estimation of queryplans in database systems,” inProc. of ICDCS, 2013.
[33] M. M. Astrahan, H. W. Blasgen, and et al., “System r: Relationalapproach to database management,”ACM Transactions on DatabaseSystems, vol. 1, pp. 97–137, 1976.
[34] S. Christodoulakis, “Implications of certain assumptions in databaseperformance evaluation,”ACM Trans. Database Syst., vol. 9, no. 2,pp. 163–186, 1984.
[35] L. F. Mackert and G. M. Lohman, “R* optimizer validationandperformance evaluation for distributed queries,” inVLDB, 1986, pp.149–159.
[36] W. Lang, S. Harizopoulos, J. M. Patel, M. A. Shah, and D. Tsirogian-nis, “Towards energy-efficient database cluster design,”PVLDB,vol. 5, no. 11, pp. 1684–1695, 2012.
[37] P. Mahadevan, P. Sharma, and et al., “A power benchmarkingframework for network devices,” inProc. of the NETWORKING,2009, pp. 795–808.
[38] Z. Xu, “Power cost estimation in dbms, a comprehensive study,”Department of Electrical and Computer Engineering, The Ohio StateUniversity, Tech. Rep. OSU-ECE-12-002, June 2012.
[39] K. Shen, A. Shriraman, S. Dwarkadas, X. Zhang, and Z. Chen,“Power containers: an os facility for fine-grained power andenergymanagement on multicore servers,” inProc. of ASPLOS, 2013, pp.65–76.
[40] Sloan Digital Sky Survey, http://cas.sdss.org/dr7/en/.[41] “34410a digital multimeter,” http://goo.gl/0GUX7.[42] “Watts up power meter,” http://goo.gl/AI7so.[43] S. Chaudhuri, “An overview of query optimization in relational
systems,” inPODS, 1998, pp. 34–43.[44] A. Vahidi, A. Stefanopoulou, and H. Peng, “Recursive least squares
with forgetting for online estimation of vehicle mass and road grade:theory and experiments,”Vehicle System Dynamics, vol. 43, no. 1,pp. 31–55(25), 2005.
[45] Y. Wang, K. Ma, and X. Wang, “Temperature-constrained powercontrol for chip multiprocessors with online model estimation,”SIGARCH Comput., vol. 37, pp. 314–324, June 2009.
[46] J. B. Lawrie, “A brief historical perspective of the Wiener–Hopftechnique,” 2007.
Zichen Xu received his BE degree in Computer Technology fromBeijing University of Posts and Telecommunications, China (2007),and his MS degree in Computer Science from University of SouthFlorida (2009). He is currently a PhD candidate in the depart-ment of Electrical and Computer Engineering at the Ohio StateUniversity. His research spans in energy efficient data processing,energy/performance modeling, and power-performance balancedcomputing system.
Yi-Cheng Tu received a Bachelor’s degree in horticulture fromBeijing Agricultural University, China, and MS and PhD degrees incomputer science from Purdue University (2003; 2007). He is cur-rently an associate professor in the department of Computer Science& Engineering at the University of South Florida. His research is inenergy-efficient database systems, scientific data management, highperformance computing and data stream management systems. Hereceived a CAREER award from US National Science Foundation(NSF) in 2013.
Xiaorui Wang received the D.Sc. degree in computer science fromWashington University in St. Louis in 2006. He is currently anassociate professor in the Department of Electrical and ComputerEngineering at the Ohio State University. He is the recipient of theUS Office of Naval Research (ONR) Young Investigator (YIP) Awardin 2011 and the US National Science Foundation (NSF) CAREERAward in 2009. His research interests include computer architectureand systems. He is a member of the IEEE and the IEEE ComputerSociety.