Embed Size (px)
Citation preview
HAL Id: hal-01503366https://hal.inria.fr/hal-01503366
Submitted on 7 Apr 2017
HAL is a multi-disciplinary open accessarchive for the deposit and dissemination of sci-entific research documents, whether they are pub-lished or not. The documents may come fromteaching and research institutions in France orabroad, or from public or private research centers.
L’archive ouverte pluridisciplinaire HAL, estdestinée au dépôt et à la diffusion de documentsscientifiques de niveau recherche, publiés ou non,émanant des établissements d’enseignement et derecherche français ou étrangers, des laboratoirespublics ou privés.
Online flowchart understanding by combiningmax-margin Markov random field with grammatical
analysisChengcheng Wang, Harold Mouchère, Aurélie Lemaitre, Christian
Viard-Gaudin
To cite this version:Chengcheng Wang, Harold Mouchère, Aurélie Lemaitre, Christian Viard-Gaudin. Online flowchartunderstanding by combining max-margin Markov random field with grammatical analysis. Interna-tional Journal on Document Analysis and Recognition, Springer Verlag, 2017, 20 (2), pp.123-136.�10.1007/s10032-017-0284-8�. �hal-01503366�
Noname manuscript No.(will be inserted by the editor)
Online Flowchart Understanding by Combining Max-marginMarkov Random Field with Grammatical Analysis1
Chengcheng Wang · Harold Mouchere · Aurelie Lemaitre ·Christian Viard-Gaudin
Abstract Flowcharts are considered in this work as
a specific 2D handwritten language where the basic
strokes are the terminal symbols of a graphical lan-
guage governed by a 2D grammar. In this way, they
can be regarded as structured objects, and we propose
to use a MRF to model them, and to allow assign-
ing a label to each of the strokes. We use structured
SVM as learning algorithm, maximizing the margin be-
tween true labels and incorrect labels. The model would
automatically learn the implicit grammatical informa-
tion encoded among strokes, which greatly improves
the stroke labeling accuracy compared to previous re-
searches that incorporated human prior knowledge of
flowchart structure. We further complete the recogni-
tion by using grammatical analysis, which finally brings
coherence to the whole flowchart recognition by label-
ing the relations between the detected objects.
1 Introduction
Sketched diagram is a powerful language that can help
illustrating people’s ideas. They contain self-explanatory
Chengcheng WangMicrosoft (China) Co. Ltd.Suzhou, ChinaE-mail: [email protected]
H. Mouchere and C. Viard-GaudinUBL/University of Nantes/LS2N, rue Christian Pauc, 44306Nantes, FRANCETel.: (+33) 2-40-68-30-82 E-mail: [email protected] / [email protected]
Aurelie LemaitreIRISA - Universite de Rennes 2, Campus de Beaulieu, 35042Rennes Cedex, FRANCEE-mail: [email protected]
1 The final publication is available at Springer viahttp://dx.doi.org/10.1007/s10032-017-0284-8
symbols and can expand their styles freely. One typi-
cal example of such diagram is flowchart, which makes
the illustrations of programs or structural objects very
intuitive. With the emergence of electronic devices, the
situations are becoming more common that people have
to record their diagrams in their tablets and hopefully,
the applications would facilitate the process of diagram
parsing. Understanding and processing diagrams by ma-
chine learning techniques is also becoming a hot re-
search topic, and fortunate enough, as a 2D handwrit-
ten language, the task of recognizing sketched diagram
is similar to recognizing handwritten mathematical ex-
pressions and the latter can be referenced.
A traditional workflow of parsing 2D handwritten
language is a trilogy: grouping strokes into symbols,
recognizing symbols, and then analyzing structures [9].
We can follow this process in diagram recognition in
a broad way, however, the properties differ from one
specific 2D language to another. Cases are rare that
one symbol is contained in another except square root
operator in mathematical expressions, but it is common
in flowchart that texts are contained in terminal nodes.
Sketched diagrams also have a more flexible grammar
in that they can almost expand their symbols in all
directions, but in mathematical expressions, rules are
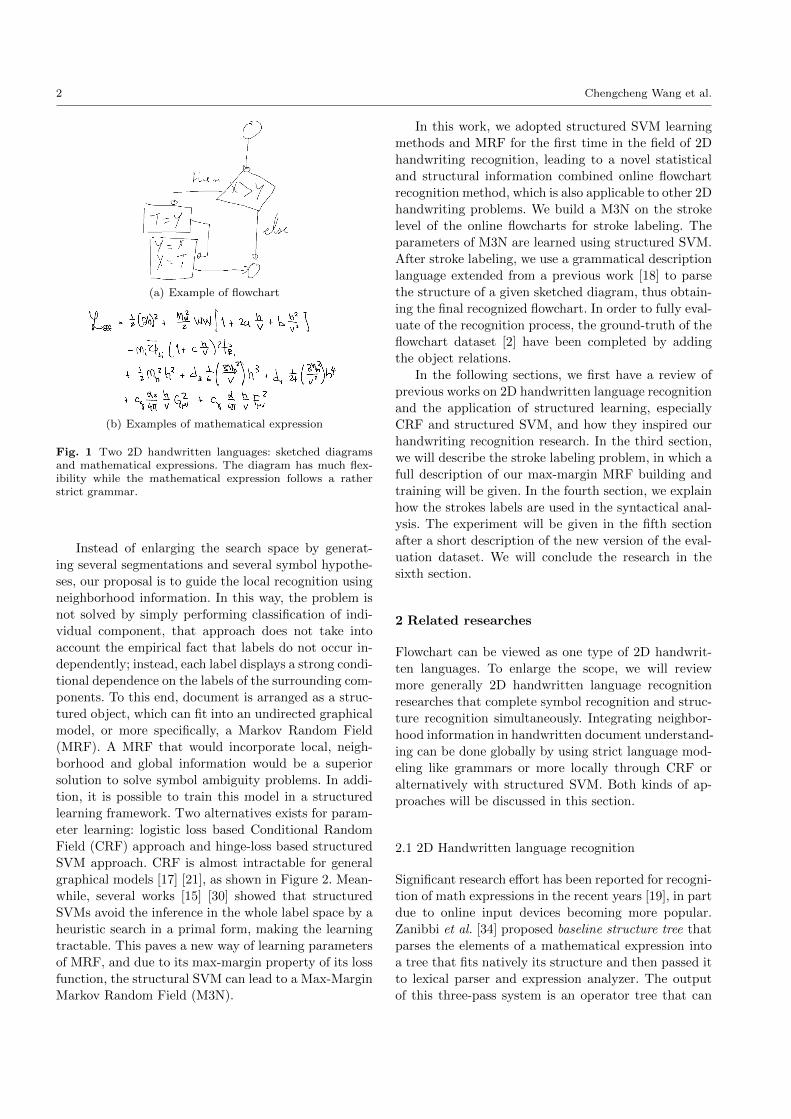
settled so that there is less variability. From Figure 1
we can see that arrows in a flowchart can have various
shapes, and can point to almost everywhere. Flowchart
also cover a larger scope than mathematical expressions
[9, 19]. All these add difficulties in sketched diagram
recognition.
Although most of the 2D handwritten languages can
be interpreted as the trilogy that has been mentioned
above, recent researches tend to use a global method
to avoid the propagation of errors, which decrease the
recognition rate by feeding the misinterpreted symbols
or structures into the following steps [9, 19].
2 Chengcheng Wang et al.
(a) Example of flowchart
(b) Examples of mathematical expression
Fig. 1 Two 2D handwritten languages: sketched diagramsand mathematical expressions. The diagram has much flex-ibility while the mathematical expression follows a ratherstrict grammar.
Instead of enlarging the search space by generat-
ing several segmentations and several symbol hypothe-
ses, our proposal is to guide the local recognition using
neighborhood information. In this way, the problem is
not solved by simply performing classification of indi-
vidual component, that approach does not take into
account the empirical fact that labels do not occur in-
dependently; instead, each label displays a strong condi-
tional dependence on the labels of the surrounding com-
ponents. To this end, document is arranged as a struc-
tured object, which can fit into an undirected graphical
model, or more specifically, a Markov Random Field
(MRF). A MRF that would incorporate local, neigh-
borhood and global information would be a superior
solution to solve symbol ambiguity problems. In addi-
tion, it is possible to train this model in a structured
learning framework. Two alternatives exists for param-
eter learning: logistic loss based Conditional Random
Field (CRF) approach and hinge-loss based structured
SVM approach. CRF is almost intractable for general
graphical models [17] [21], as shown in Figure 2. Mean-
while, several works [15] [30] showed that structured
SVMs avoid the inference in the whole label space by a
heuristic search in a primal form, making the learning
tractable. This paves a new way of learning parameters
of MRF, and due to its max-margin property of its loss
function, the structural SVM can lead to a Max-Margin
Markov Random Field (M3N).
In this work, we adopted structured SVM learning
methods and MRF for the first time in the field of 2D
handwriting recognition, leading to a novel statistical
and structural information combined online flowchart
recognition method, which is also applicable to other 2D
handwriting problems. We build a M3N on the stroke
level of the online flowcharts for stroke labeling. The
parameters of M3N are learned using structured SVM.
After stroke labeling, we use a grammatical description
language extended from a previous work [18] to parse
the structure of a given sketched diagram, thus obtain-
ing the final recognized flowchart. In order to fully eval-
uate of the recognition process, the ground-truth of the
flowchart dataset [2] have been completed by adding
the object relations.
In the following sections, we first have a review of
previous works on 2D handwritten language recognition
and the application of structured learning, especially
CRF and structured SVM, and how they inspired our
handwriting recognition research. In the third section,
we will describe the stroke labeling problem, in which a
full description of our max-margin MRF building and
training will be given. In the fourth section, we explain
how the strokes labels are used in the syntactical anal-
ysis. The experiment will be given in the fifth section
after a short description of the new version of the eval-
uation dataset. We will conclude the research in the
sixth section.
2 Related researches
Flowchart can be viewed as one type of 2D handwrit-
ten languages. To enlarge the scope, we will review
more generally 2D handwritten language recognition
researches that complete symbol recognition and struc-
ture recognition simultaneously. Integrating neighbor-
hood information in handwritten document understand-
ing can be done globally by using strict language mod-
eling like grammars or more locally through CRF or
alternatively with structured SVM. Both kinds of ap-
proaches will be discussed in this section.
2.1 2D Handwritten language recognition
Significant research effort has been reported for recogni-
tion of math expressions in the recent years [19], in part
due to online input devices becoming more popular.
Zanibbi et al. [34] proposed baseline structure tree that
parses the elements of a mathematical expression into
a tree that fits natively its structure and then passed it
to lexical parser and expression analyzer. The output
of this three-pass system is an operator tree that can
Online Flowchart Understanding by Combining Max-margin Markov Random Field with Grammatical Analysis1 3
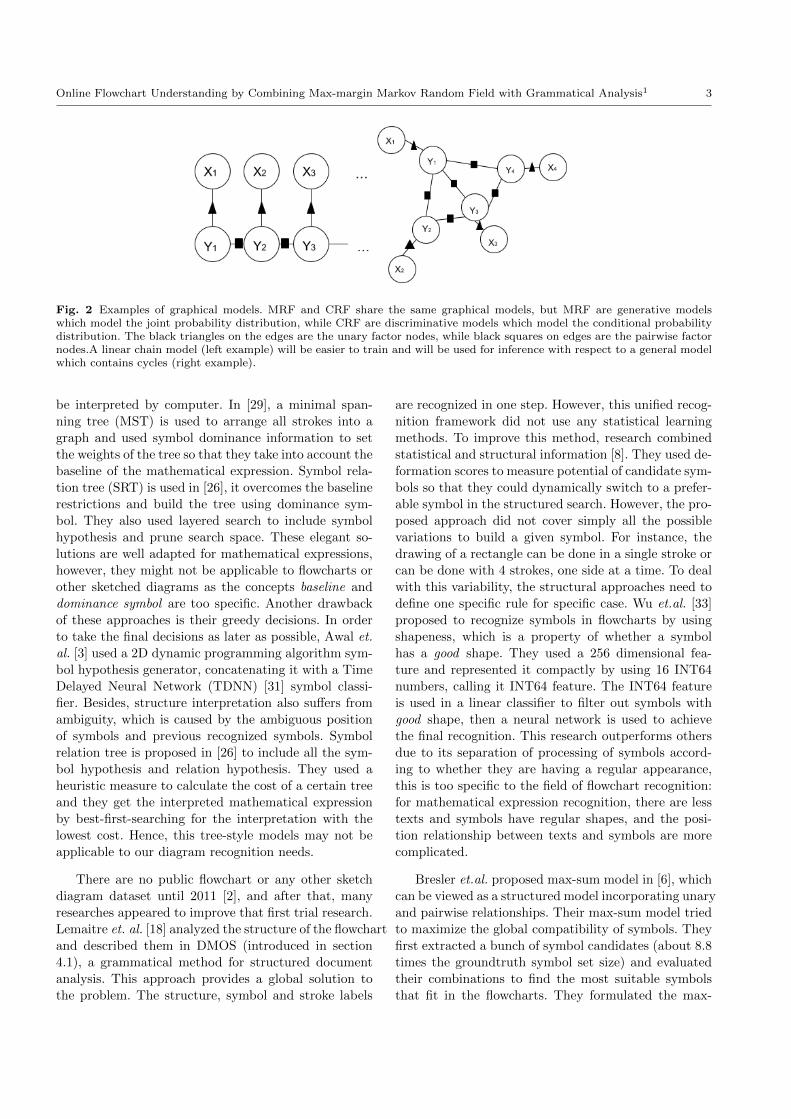
Fig. 2 Examples of graphical models. MRF and CRF share the same graphical models, but MRF are generative modelswhich model the joint probability distribution, while CRF are discriminative models which model the conditional probabilitydistribution. The black triangles on the edges are the unary factor nodes, while black squares on edges are the pairwise factornodes.A linear chain model (left example) will be easier to train and will be used for inference with respect to a general modelwhich contains cycles (right example).
be interpreted by computer. In [29], a minimal span-
ning tree (MST) is used to arrange all strokes into a
graph and used symbol dominance information to set
the weights of the tree so that they take into account the
baseline of the mathematical expression. Symbol rela-
tion tree (SRT) is used in [26], it overcomes the baseline
restrictions and build the tree using dominance sym-
bol. They also used layered search to include symbol
hypothesis and prune search space. These elegant so-
lutions are well adapted for mathematical expressions,
however, they might not be applicable to flowcharts or
other sketched diagrams as the concepts baseline and
dominance symbol are too specific. Another drawback
of these approaches is their greedy decisions. In order
to take the final decisions as later as possible, Awal et.
al. [3] used a 2D dynamic programming algorithm sym-
bol hypothesis generator, concatenating it with a Time
Delayed Neural Network (TDNN) [31] symbol classi-
fier. Besides, structure interpretation also suffers from
ambiguity, which is caused by the ambiguous position
of symbols and previous recognized symbols. Symbol
relation tree is proposed in [26] to include all the sym-
bol hypothesis and relation hypothesis. They used a
heuristic measure to calculate the cost of a certain tree
and they get the interpreted mathematical expression
by best-first-searching for the interpretation with the
lowest cost. Hence, this tree-style models may not be
applicable to our diagram recognition needs.
There are no public flowchart or any other sketch
diagram dataset until 2011 [2], and after that, many
researches appeared to improve that first trial research.
Lemaitre et. al. [18] analyzed the structure of the flowchart
and described them in DMOS (introduced in section
4.1), a grammatical method for structured document
analysis. This approach provides a global solution to
the problem. The structure, symbol and stroke labels
are recognized in one step. However, this unified recog-
nition framework did not use any statistical learning
methods. To improve this method, research combined
statistical and structural information [8]. They used de-
formation scores to measure potential of candidate sym-
bols so that they could dynamically switch to a prefer-
able symbol in the structured search. However, the pro-
posed approach did not cover simply all the possible
variations to build a given symbol. For instance, the
drawing of a rectangle can be done in a single stroke or
can be done with 4 strokes, one side at a time. To deal
with this variability, the structural approaches need to
define one specific rule for specific case. Wu et.al. [33]
proposed to recognize symbols in flowcharts by using
shapeness, which is a property of whether a symbol
has a good shape. They used a 256 dimensional fea-
ture and represented it compactly by using 16 INT64
numbers, calling it INT64 feature. The INT64 feature
is used in a linear classifier to filter out symbols with
good shape, then a neural network is used to achieve
the final recognition. This research outperforms others
due to its separation of processing of symbols accord-
ing to whether they are having a regular appearance,
this is too specific to the field of flowchart recognition:
for mathematical expression recognition, there are less
texts and symbols have regular shapes, and the posi-
tion relationship between texts and symbols are more
complicated.
Bresler et.al. proposed max-sum model in [6], which
can be viewed as a structured model incorporating unary
and pairwise relationships. Their max-sum model tried
to maximize the global compatibility of symbols. They
first extracted a bunch of symbol candidates (about 8.8
times the groundtruth symbol set size) and evaluated
their combinations to find the most suitable symbols
that fit in the flowcharts. They formulated the max-
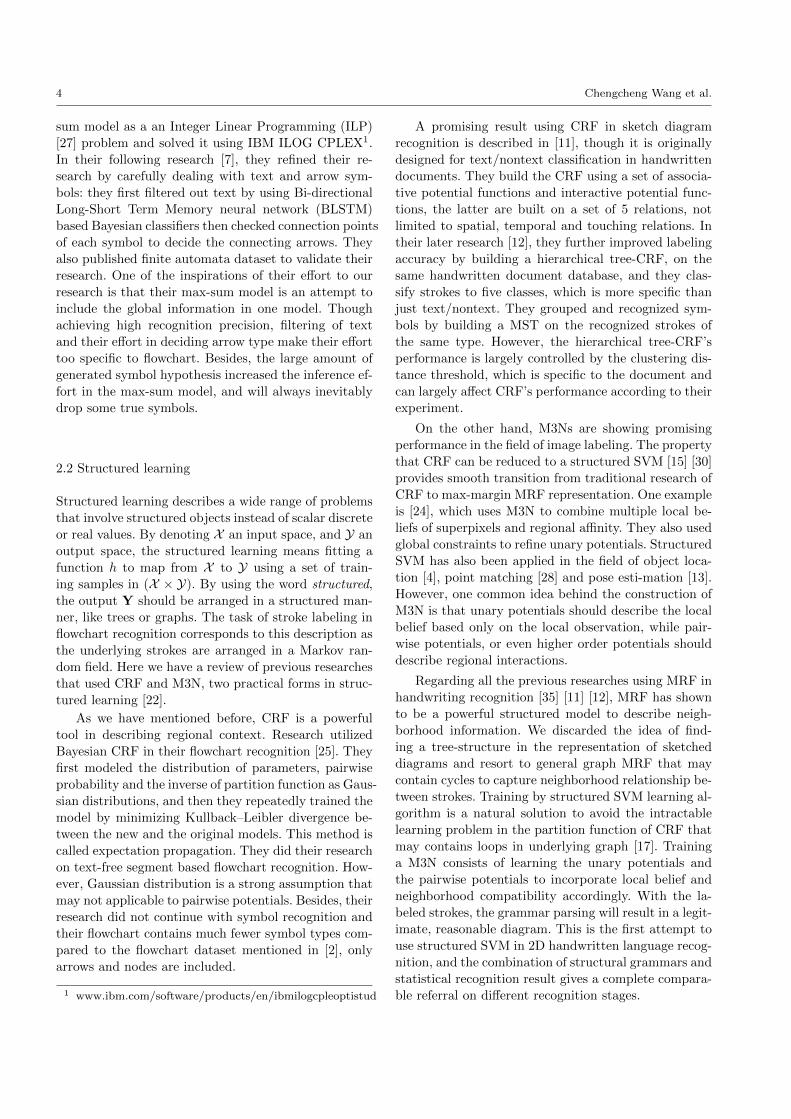
4 Chengcheng Wang et al.
sum model as a an Integer Linear Programming (ILP)
[27] problem and solved it using IBM ILOG CPLEX1.
In their following research [7], they refined their re-
search by carefully dealing with text and arrow sym-
bols: they first filtered out text by using Bi-directional
Long-Short Term Memory neural network (BLSTM)
based Bayesian classifiers then checked connection points
of each symbol to decide the connecting arrows. They
also published finite automata dataset to validate their
research. One of the inspirations of their effort to our
research is that their max-sum model is an attempt to
include the global information in one model. Though
achieving high recognition precision, filtering of text
and their effort in deciding arrow type make their effort
too specific to flowchart. Besides, the large amount of
generated symbol hypothesis increased the inference ef-
fort in the max-sum model, and will always inevitably
drop some true symbols.
2.2 Structured learning
Structured learning describes a wide range of problems
that involve structured objects instead of scalar discrete
or real values. By denoting X an input space, and Y an
output space, the structured learning means fitting a
function h to map from X to Y using a set of train-
ing samples in (X × Y). By using the word structured,
the output Y should be arranged in a structured man-
ner, like trees or graphs. The task of stroke labeling in
flowchart recognition corresponds to this description as
the underlying strokes are arranged in a Markov ran-
dom field. Here we have a review of previous researches
that used CRF and M3N, two practical forms in struc-
tured learning [22].
As we have mentioned before, CRF is a powerful
tool in describing regional context. Research utilized
Bayesian CRF in their flowchart recognition [25]. They
first modeled the distribution of parameters, pairwise
probability and the inverse of partition function as Gaus-
sian distributions, and then they repeatedly trained the
model by minimizing Kullback–Leibler divergence be-
tween the new and the original models. This method is
called expectation propagation. They did their research
on text-free segment based flowchart recognition. How-
ever, Gaussian distribution is a strong assumption that
may not applicable to pairwise potentials. Besides, their
research did not continue with symbol recognition and
their flowchart contains much fewer symbol types com-
pared to the flowchart dataset mentioned in [2], only
arrows and nodes are included.
1 www.ibm.com/software/products/en/ibmilogcpleoptistud
A promising result using CRF in sketch diagram
recognition is described in [11], though it is originally
designed for text/nontext classification in handwritten
documents. They build the CRF using a set of associa-
tive potential functions and interactive potential func-
tions, the latter are built on a set of 5 relations, not
limited to spatial, temporal and touching relations. In
their later research [12], they further improved labeling
accuracy by building a hierarchical tree-CRF, on the
same handwritten document database, and they clas-
sify strokes to five classes, which is more specific than
just text/nontext. They grouped and recognized sym-
bols by building a MST on the recognized strokes of
the same type. However, the hierarchical tree-CRF’s
performance is largely controlled by the clustering dis-
tance threshold, which is specific to the document and
can largely affect CRF’s performance according to their
experiment.
On the other hand, M3Ns are showing promising
performance in the field of image labeling. The property
that CRF can be reduced to a structured SVM [15] [30]
provides smooth transition from traditional research of
CRF to max-margin MRF representation. One example
is [24], which uses M3N to combine multiple local be-
liefs of superpixels and regional affinity. They also used
global constraints to refine unary potentials. Structured
SVM has also been applied in the field of object loca-
tion [4], point matching [28] and pose esti-mation [13].
However, one common idea behind the construction of
M3N is that unary potentials should describe the local
belief based only on the local observation, while pair-
wise potentials, or even higher order potentials should
describe regional interactions.
Regarding all the previous researches using MRF in
handwriting recognition [35] [11] [12], MRF has shown
to be a powerful structured model to describe neigh-
borhood information. We discarded the idea of find-
ing a tree-structure in the representation of sketched
diagrams and resort to general graph MRF that may
contain cycles to capture neighborhood relationship be-
tween strokes. Training by structured SVM learning al-
gorithm is a natural solution to avoid the intractable
learning problem in the partition function of CRF that
may contains loops in underlying graph [17]. Training
a M3N consists of learning the unary potentials and
the pairwise potentials to incorporate local belief and
neighborhood compatibility accordingly. With the la-
beled strokes, the grammar parsing will result in a legit-
imate, reasonable diagram. This is the first attempt to
use structured SVM in 2D handwritten language recog-
nition, and the combination of structural grammars and
statistical recognition result gives a complete compara-
ble referral on different recognition stages.
Online Flowchart Understanding by Combining Max-margin Markov Random Field with Grammatical Analysis1 5
3 Stroke labeling using max-margin MRF
Suppose we haveN diagrams, then we denote the stroke
observation set as X(n) for each diagram, which is in-
dexed by n. We denote strokes{X
(n)1 , X
(n)2 , . . . , X
(n)Mn
}=
X(n) that belong to the observation set. Mn is the num-
ber of strokes in an observation set. The topic of this
section is stroke labeling problem, so each of the stroke
observation has a corresponding label Y(n)i , which takes
discrete labels such as Arrow, Terminal and so on, de-
pending on the diagram. In the following, in case of no
ambiguity, we simply define the observation set of a spe-
cific sample of diagram X and its corresponding label
set as Y, each strokes will be indexed by subscripts.
Classically, we use an energy function to describe
the whole compatibility of the flowchart. It is composed
of a set of unary energy functions and pairwise energy
functions:
E(X,Y)
=
∑i
ε(Xi, Yi) +∑
<i,j>∈Eε(Xi, Xj , Yi, Yj)
(1)
In the energy function in equation (1), the unary
energy function describes the local belief Yi given only
the isolated observation Xi. The pairwise energy func-
tion ε(Xi, Xj , Yi, Yj) provides regional compatibility. In
many image segmentation researches, pairwise energy
functions try to fix the local belief by smoothing re-
gional labels given the regional observations. That en-
ergy function, under the assumption of Gibbs distri-
bution [17], can be incorporated into a MRF:
P (X,Y) = exp [−E(X,Y)]
=∏i
e−ε(Xi,Yi)∏
<i,j>∈Ee−ε(Xi,Xj ,Yi,Yj)
=∏i
Φ(Xi, Yi)∏
<i,j>∈EΦ(Xi, Xj , Yi, Yj)
(2)
Here in formula (2), we use exponential form of po-
tential function to ensure potential function are always
positive, which is a requirement of MRF [17]. The infer-
ence problem is to solve Y = argmaxY
P (X,Y), which
can also be interpreted in the form of energy function
as Y = argminY
E(X,Y). In the following subsections,
we will describe the feature selection, inference problem
and learning problem separately.
3.1 Potential functions
The potential functions should be built to exhibit the
relevant features from the raw data. Here we discuss
the selected features for unary potential functions and
pairwise potential functions, then describe the mathe-
matical expressions.
3.1.1 Raw feature selection
Considering that diagrams drawn by different people
have different scales, as a preprocessing step, we rescaled
all the diagrams to a [-1, 1] bounding box and kept its
height/width ratio. For the convenience of uniform fea-
ture extraction, we sampled each stroke to equal count
of points with a constant spatial step. Our trial on the
number of points per stroke showed that the denser
the sampling the better the feature extraction ability,
but performance is hard to improve after 30 points per
stroke. For the balance between performance and pro-
cessing time complexity, we set sampling point on each
stroke to 30.
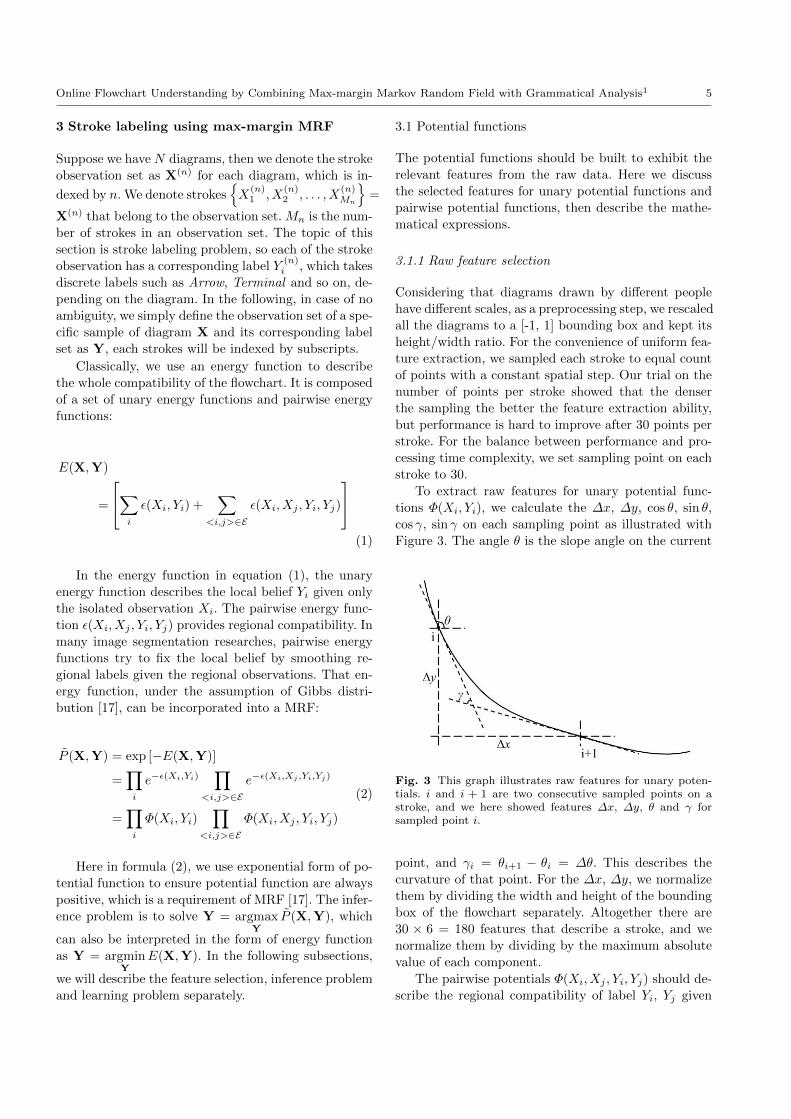
To extract raw features for unary potential func-
tions Φ(Xi, Yi), we calculate the ∆x, ∆y, cos θ, sin θ,
cos γ, sin γ on each sampling point as illustrated with
Figure 3. The angle θ is the slope angle on the current
Fig. 3 This graph illustrates raw features for unary poten-tials. i and i + 1 are two consecutive sampled points on astroke, and we here showed features ∆x, ∆y, θ and γ forsampled point i.
point, and γi = θi+1 − θi = ∆θ. This describes the
curvature of that point. For the ∆x, ∆y, we normalize
them by dividing the width and height of the bounding
box of the flowchart separately. Altogether there are
30 × 6 = 180 features that describe a stroke, and we
normalize them by dividing by the maximum absolute
value of each component.
The pairwise potentials Φ(Xi, Xj , Yi, Yj) should de-
scribe the regional compatibility of label Yi, Yj given
6 Chengcheng Wang et al.
observation Xi, Xj . We focus on two types of neighbor-
hood in pairwise function: temporal neighborhood and
spatial neighborhood. Hence, from the time domain, Xi
and Xi+1 are considered as neighbors, so there is a po-
tential function that describes their affinity. For the spa-
tial neighborhood, we define a threshold distance. If the
stroke pairs’ minimal distance is below that threshold,
they are considered as neighbors. To decide the thresh-
old, we tested thresholds from 0.01 to 0.07 and eval-
uated stroke labeling accuracy and training time, and
we took 0.03 as a preferable threshold in the following
experiments. The detail of this spatial threshold deci-
sion can be referred in section 5. The pairwise potential
function is undirected, which means Φ(Xi, Xj , Yi, Yj) is
equivalent to Φ(Xj , Xi, Yj , Yi). The Figure 4 shows an
example of sketch with its set of unary and pairwise
potential functions.
(a) Example sketchdiagram
(b) Underlying Markov randomfield
Fig. 4 A sample sketch diagram and its corresponding MRF.Unary potential functions are represented by a solid trianglebetween X and Y, and pairwise potential functions are rep-resented by a solid square between Ys. Those links indicatethey are regarded as neighbors temporally or spatially.
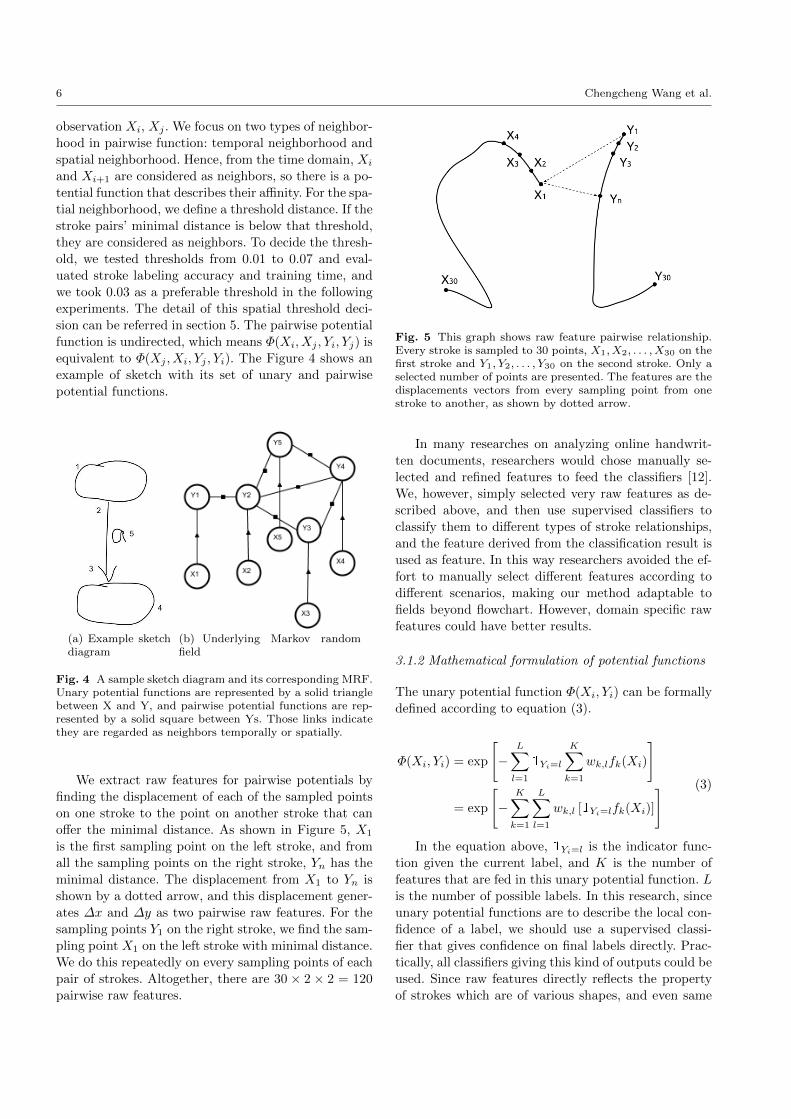
We extract raw features for pairwise potentials by
finding the displacement of each of the sampled points
on one stroke to the point on another stroke that can
offer the minimal distance. As shown in Figure 5, X1
is the first sampling point on the left stroke, and from
all the sampling points on the right stroke, Yn has the
minimal distance. The displacement from X1 to Yn is
shown by a dotted arrow, and this displacement gener-
ates ∆x and ∆y as two pairwise raw features. For the
sampling points Y1 on the right stroke, we find the sam-
pling point X1 on the left stroke with minimal distance.
We do this repeatedly on every sampling points of each
pair of strokes. Altogether, there are 30 × 2 × 2 = 120
pairwise raw features.
Fig. 5 This graph shows raw feature pairwise relationship.Every stroke is sampled to 30 points, X1, X2, . . . , X30 on thefirst stroke and Y1, Y2, . . . , Y30 on the second stroke. Only aselected number of points are presented. The features are thedisplacements vectors from every sampling point from onestroke to another, as shown by dotted arrow.
In many researches on analyzing online handwrit-
ten documents, researchers would chose manually se-
lected and refined features to feed the classifiers [12].
We, however, simply selected very raw features as de-
scribed above, and then use supervised classifiers to
classify them to different types of stroke relationships,
and the feature derived from the classification result is
used as feature. In this way researchers avoided the ef-
fort to manually select different features according to
different scenarios, making our method adaptable to
fields beyond flowchart. However, domain specific raw
features could have better results.
3.1.2 Mathematical formulation of potential functions
The unary potential function Φ(Xi, Yi) can be formally
defined according to equation (3).
Φ(Xi, Yi) = exp
[−
L∑l=1
1Yi=l
K∑k=1
wk,lfk(Xi)
]
= exp
[−
K∑k=1
L∑l=1
wk,l [1Yi=lfk(Xi)]
] (3)
In the equation above, 1Yi=l is the indicator func-
tion given the current label, and K is the number of
features that are fed in this unary potential function. L
is the number of possible labels. In this research, since
unary potential functions are to describe the local con-
fidence of a label, we should use a supervised classi-
fier that gives confidence on final labels directly. Prac-
tically, all classifiers giving this kind of outputs could be
used. Since raw features directly reflects the property
of strokes which are of various shapes, and even same
Online Flowchart Understanding by Combining Max-margin Markov Random Field with Grammatical Analysis1 7
type of stroke is having various shapes in flowchart, we
choose ensemble methods to improve robustness of the
feature extraction. We selected random forest [5], which
uses averaging methods to combine different decision
trees to prevent over-fitting, and GBDT [23], which is
using boosting to combine several weak classifier to a
strong one. The refined features are the probability of
each label given the observation. Both classifiers give
the probability of predicted class, and here we concate-
nated them to form refined feature. Since the fk(Xi)
describe the probability of different labels based on two
pre-trained classifiers, K = 2 × L. The classifiers are
trained on raw features of observations.
Following the idea of unary potential functions, the
formulation of pairwise potential functions in equation
4 also used an indicator and a feature descriptor.
Φ(Xi, Xj , Yi, Yj)
= exp
− l1,l2∈L∑l1=1,l2=1
1Yi=l1,Yi=l2
K∑k
wl1,l2,kfk(Xi, Xj)
= exp
− K∑k
l1,l2∈L∑l1=1,l2=1
wl1,l2,k [1Yi=l1,Yi=l2fk(Xi, Xj)]
(4)
That feature descriptor should describe local proper-
ties that reflect local relationship of two neighboring
strokes, thus completing local compatibility description.
We continue using random forest and GBDT, taking
pairwise raw features and classify them into given stroke
relationships. For within-symbol strokes, the symbol la-
bel is used as stroke relationship label, and for inter-
symbol strokes, stroke relationship inherits from sym-
bol relationship (for a concrete example, section 5.1 de-
scribes possible symbol relationships for flowchart database).
By adding ”no relationship” for other situations, all
possible stroke relationships are included.
Though there are choices for a more sophisticated
and advanced classifier, we simply disregarded the abun-
dant choice for other researchers to push our boundary
further. Whatever classifier one would use, the auto-
matic feature extraction process from raw features to
the classified class enables one to use this identical pro-
cess in their own handwriting recognition task is one
contribution in our work, which greatly facilitated the
transplanting of our system to other problems.
3.2 Model inference
Inference problem has been a main focus of probabilis-
tic graphical model research. Here in this research, we
adopt Alpha-Expansion-Fusion algorithm [14]. This is
a graph-cut based algorithm so it is faster than belief
propagation. Besides, this algorithm adopts Quadratic
Pseudo-Boolean Optimization (QPBO) so that its en-
ergy does not have to be submodular.
3.3 Parameter learning
In the structured SVM framework, a discriminant func-
tion F (X,Y; w) exists describing the compatibility of
label Y and observation X. The dot product of the
feature vector f(X,Y) and parameter w can give a
good description of F (X,Y; w), in which the parse fea-
ture function reflects the property of the structured
objects itself. As formulas (3) and (4) indicate, po-
tential function can be reorganized in the format as
exp [−w · f(X,Y )], so by aggregating (2), (3) and (4) we
can get the feature vector representation and parameter
vector w, expressed in formula (5). Inference problem
in the form of discriminant function can be expressed
as Y = argmaxY
F (X,Y). The MRF expression formula
(2) is not a linear representation of features, however,
minimizing the energy function is equivalent to max-
imizing the structured learning discriminant function,
as shown in formula (5):
F (X,Y) = −E(X,Y) = w · f(X,Y) (5)
A solution to generalize normal SVM training to
structured outputs is presented in [15]. All the things
to do in training is to find a cutting-plane, described
by w, that separates right labels from those inferredby the models but with wrong labels. In this research,
we use margin-scale problem formulation and solve the
problem by using one-slack structural SVM learning al-
gorithm [16]. The problem can be formulated as follows:
min1
2||w||2 + Cξ, (6)
with the constraints
1
N
N∑i=1
{∆(Y(i), Y(i))
−w ·[f(X(i),Y(i))− f(X(i), Y(i))
]}≤ ξ
∀(Y(1), Y(2), . . . , Y(N)) ∈ YN . (7)
In formula (7) Y(i) is the predicted labels for sam-
ple i, while the true labels is denoted as Y(i). The
structural loss ∆(Y(i), Y(i)) defined in this loss func-
tion specifies the margin between true label and the
8 Chengcheng Wang et al.
incorrect label in our max-margin MRF training. The
one common form of structural loss is Hamming dis-
tance between true labels and predicted labels, and we
continue use that in this paper. The difficulty of struc-
tural SVM is that the label space Y(n) may be tremen-
dously large: it takes LMn possible label combinations,
so the constraints in the QP may be very large, which
could not be handled easily. For this problem, [16] pro-
poses N-slack and one-slack structural SVM training
algorithm that uses a heuristic search strategy to add
constraints dynamically. The main idea is to get the
most violated instance in each iteration and to add that
into constraints set W, replacing the constraints in (7),
then solve the QP in primal space. The iteration will
stop when the constraint set remains unchanged after
a certain iteration. The majority of constraints are be-
hind the most violated one, so it is unnecessary to add
all the constraints. For the completeness of this paper,
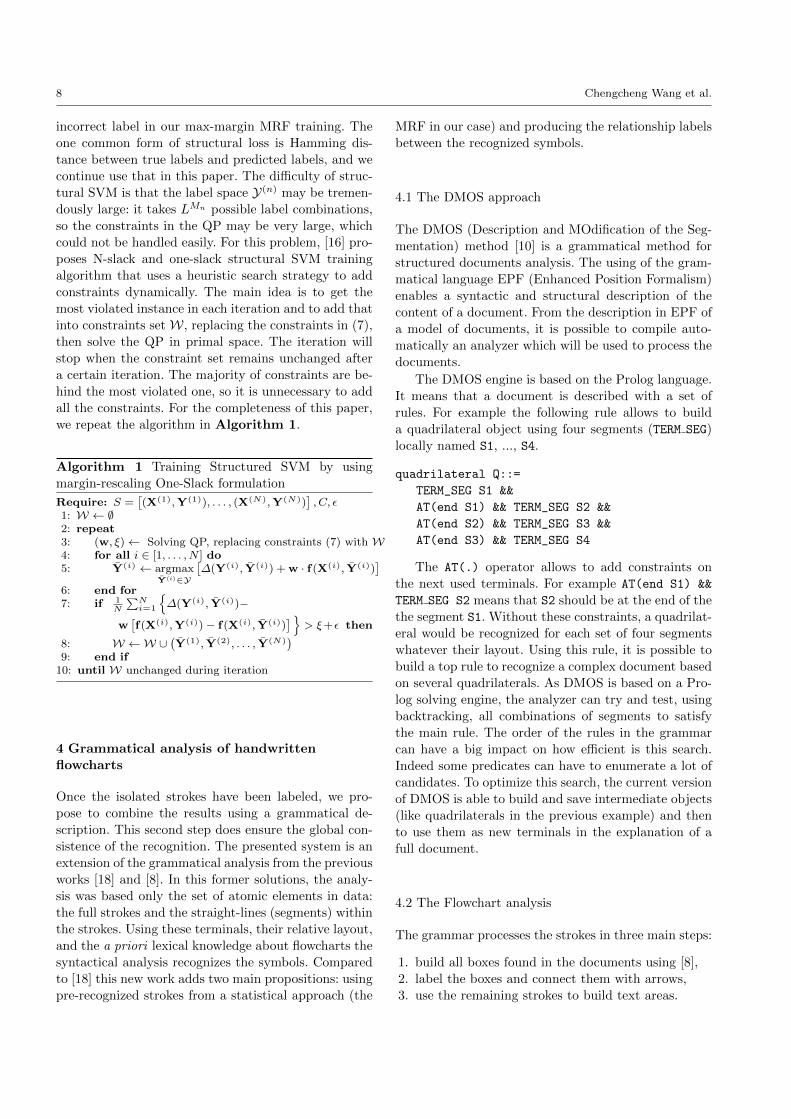
we repeat the algorithm in Algorithm 1.
Algorithm 1 Training Structured SVM by using
margin-rescaling One-Slack formulation
Require: S =[(X(1),Y(1)), . . . , (X(N),Y(N))
], C, ε
1: W ← ∅2: repeat3: (w, ξ)← Solving QP, replacing constraints (7) with W4: for all i ∈ [1, . . . , N ] do5: Y(i) ← argmax
Y(i)∈Y
[∆(Y(i), Y(i)) + w · f(X(i), Y(i))
]6: end for7: if 1
N
∑Ni=1
{∆(Y(i), Y(i))−
w[f(X(i),Y(i))− f(X(i), Y(i))
] }> ξ+ε then
8: W ←W ∪(Y(1), Y(2), . . . , Y(N)
)9: end if
10: until W unchanged during iteration
4 Grammatical analysis of handwritten
flowcharts
Once the isolated strokes have been labeled, we pro-
pose to combine the results using a grammatical de-
scription. This second step does ensure the global con-
sistence of the recognition. The presented system is an
extension of the grammatical analysis from the previous
works [18] and [8]. In this former solutions, the analy-
sis was based only the set of atomic elements in data:
the full strokes and the straight-lines (segments) within
the strokes. Using these terminals, their relative layout,
and the a priori lexical knowledge about flowcharts the
syntactical analysis recognizes the symbols. Compared
to [18] this new work adds two main propositions: using
pre-recognized strokes from a statistical approach (the
MRF in our case) and producing the relationship labels
between the recognized symbols.
4.1 The DMOS approach
The DMOS (Description and MOdification of the Seg-
mentation) method [10] is a grammatical method for
structured documents analysis. The using of the gram-
matical language EPF (Enhanced Position Formalism)
enables a syntactic and structural description of the
content of a document. From the description in EPF of
a model of documents, it is possible to compile auto-
matically an analyzer which will be used to process the
documents.
The DMOS engine is based on the Prolog language.
It means that a document is described with a set of
rules. For example the following rule allows to build
a quadrilateral object using four segments (TERM SEG)
locally named S1, ..., S4.
quadrilateral Q::=
TERM_SEG S1 &&
AT(end S1) && TERM_SEG S2 &&
AT(end S2) && TERM_SEG S3 &&
AT(end S3) && TERM_SEG S4
The AT(.) operator allows to add constraints on
the next used terminals. For example AT(end S1) &&
TERM SEG S2 means that S2 should be at the end of the
the segment S1. Without these constraints, a quadrilat-
eral would be recognized for each set of four segments
whatever their layout. Using this rule, it is possible to
build a top rule to recognize a complex document based
on several quadrilaterals. As DMOS is based on a Pro-
log solving engine, the analyzer can try and test, using
backtracking, all combinations of segments to satisfy
the main rule. The order of the rules in the grammar
can have a big impact on how efficient is this search.
Indeed some predicates can have to enumerate a lot of
candidates. To optimize this search, the current version
of DMOS is able to build and save intermediate objects
(like quadrilaterals in the previous example) and then
to use them as new terminals in the explanation of a
full document.
4.2 The Flowchart analysis
The grammar processes the strokes in three main steps:
1. build all boxes found in the documents using [8],
2. label the boxes and connect them with arrows,
3. use the remaining strokes to build text areas.
Online Flowchart Understanding by Combining Max-margin Markov Random Field with Grammatical Analysis1 9
The second step follows a simple flowchart gram-
mar: start with a terminator or a connection symbol,
then continue with an arrow to the next box; each box
(terminator, connection, process or data) is followed by
an arrow which ends on a box; decision boxes are fol-
lowed by two arrows; . . .
The next rule illustrates in a simplified EPF lan-
guage how an arrow follows a process box. This re-
cursive predicate builds a list of symbols starting by
a process named Pr (of course the real rules deal also
with the other types of boxes) and an arrow named
Arr. The first step is to check if the box Pr satisfies
the graphical conditions to be a Process. The predicate
ProcessCond can be seen as a binary classifier of Pro-
cess boxes. Then the arrow candidates are selected in
an area closed to the box Pr. At the end of the arrow,
another box among the previously found boxes should
exist. If these conditions are satisfied the link between
the arrow Arr and the next box B is saved and the
recursion is called to build the remaining parts of the
flowchart. If the new box B is also a Process, the same
version of recursiveDiag will be used to look for the
new arrow. The second part of the predicate is an ex-
ample of ending predicate: the last box should be a
connection box.
recursiveDiag [Pr, Arr|Remaining]::=
ProcessCond Pr && Pr == Process &&
AT(closeTo Pr) && anArrow Arr &&
AT(end Arr) && Box B in savedBoxes &&
save Arr B &&
recursiveDiag [B|Remaining]
recursiveDiag [LastBox]::=
LastBox == Connection
It should be noticed that the real grammar should
accept flowcharts which are not perfectly drawn. For
example in Figure 10 an arrow is missing to connect
the ”Input n,m” box and the ”r= n%m” box.
The grammar is designed to force the explanation of
all available strokes. Thus if some strokes are remained
at the end of the analysis and if they can not be in-
cluded in a text area in the last step, then the predicate
fails and thanks to the backtracking, another solution
is explored.
In the previous work [18] the system was based only
on the syntactic description of the document based on
the relative positions of the strokes. In [8] some statis-
tical information based on the boxes shapes are used to
first detect the boxes and then, using the same struc-
tural grammar as in [18], build the flowchart.
In this work the labels obtained from the MRF are
used to improve the syntactical analysis at three points:
– box labeling: in the first step of the analysis, if all
strokes of a box have the same label, then the box
will have this label, otherwise criteria from [8] are
used;
– arrow ending: during the third step, if a remaining
stroke labeled as an arrow is close to a detected
arrow, then they are merged;
– text detection: during the third step, the text areas
start with a stroke labeled as text and then they are
expanded horizontally with the unused strokes.
5 Experiments
We performed our sketch diagram parsing experiments
on the updated publicly available dataset Flowchart
Dataset [2].
5.1 Data description
The flowchart dataset consists of handwritten flowcharts
of various complexity. Some are complex algorithms
with descriptive texts while some are just simple and
straightforward sequential operations. The used sam-
ples are the same as in the already published Flowchart
dataset [2] but the ground-truth has been updated. The
symbols in the flowchart dataset are divided into 7
classes: Data, Terminator, Process, Decision, Connec-
tion, Arrows and Text. Strokes inherit their belong-
ing symbol label. Compared to the initial version, the
ground-truth contains the symbol segmentation and la-bels but also their relationships in the flowchart. Thus,
the latest version includes three directional relation-
ships between symbols: i) Associated Text between node
or arrow and their associated texts; ii) Source and iii)
Target, which clarify the relationships between arrow
and linked nodes. This opens the possibility for re-
searches to utilize and recognize these relationships.
The flowcharts have been collected using digital pens
from university students of the research laboratory. This
dataset is split into train set and test set. However,
we further manually divided the training set into three
folds to perform 3 fold cross-validation for parameter
tunning. We divide the training set in such a way that
each fold has no flowchart writers overlapped with the
writers in other folders. We sacrificed the equality of
each divided size for no overlapped writer, to avoid the
situation where the writers’ writing habits contributes
to the recognition result on validation set. For the de-
tailed statistics of flowchart dataset, please refer to Ta-
ble 1.
10 Chengcheng Wang et al.
Table 1 Flowchart database statistical overview. 10 writersof the Test part appear also in the Train part.
Writers Patterns Flowcharts Strokes SymbolsTraining 30 14 248 23355 5540Training fold 1 11 14 76 6896 1688Training fold 2 11 14 83 7898 1861Training fold 3 8 14 89 8561 1991
Test 15 14 other 171 15696 3791
5.2 Parameter tuning by cross-validation
Our model has several hyper-parameters to be decided,
and that can be done by cross-validation using our di-
vided 3-fold training set. Here in this subsection, we
briefly explain how to decide the spatial distance thresh-
old mentioned in 3.1.1. Spatial distance threshold would
affect the graphical model’s structure, and the smaller
the spatial distance is, the sparser the graphical model
would be, which may effect the training and inference
time, and stroke labeling performance. In each round of
training, we select one fold as validation set, and train
on the combination of the other 2 folds. Then we take
the average on each fold as current parameter’s perfor-
mance measure. In this research, we use pystruct [20]
back-ended by OpenGM [1] to perform structured SVM
parameter learning and M3N inference.
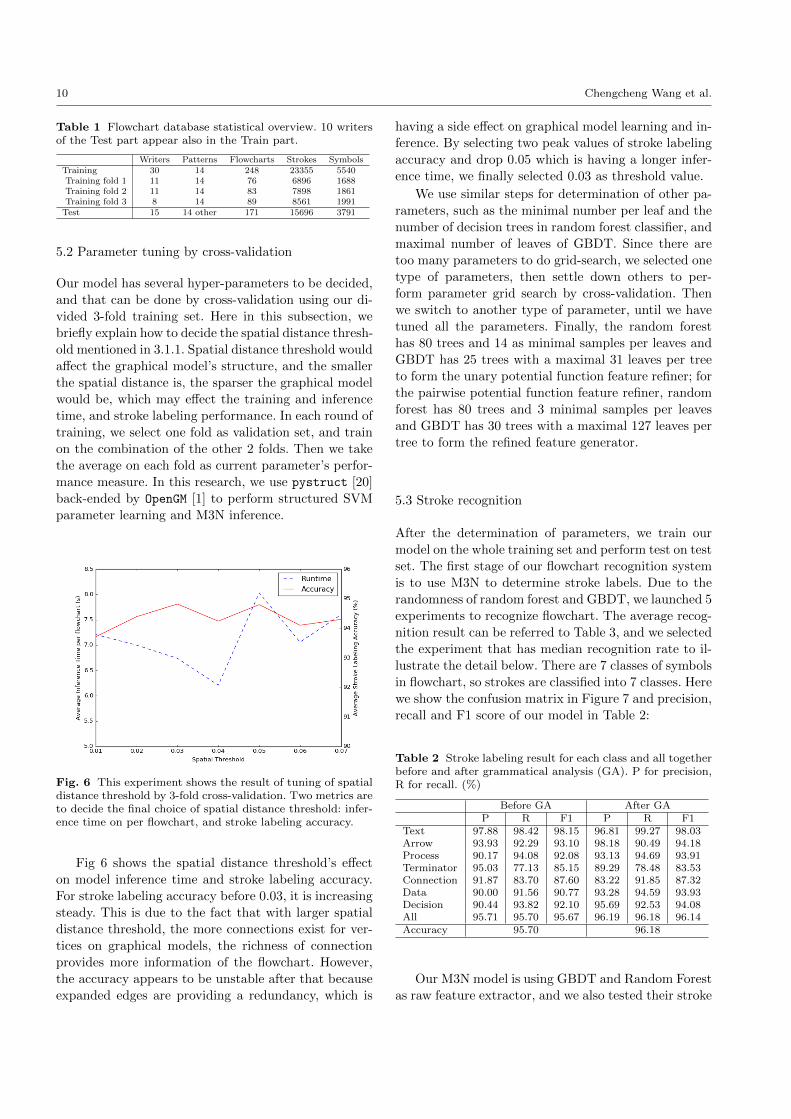
Fig. 6 This experiment shows the result of tuning of spatialdistance threshold by 3-fold cross-validation. Two metrics areto decide the final choice of spatial distance threshold: infer-ence time on per flowchart, and stroke labeling accuracy.
Fig 6 shows the spatial distance threshold’s effect
on model inference time and stroke labeling accuracy.
For stroke labeling accuracy before 0.03, it is increasing
steady. This is due to the fact that with larger spatial
distance threshold, the more connections exist for ver-
tices on graphical models, the richness of connection
provides more information of the flowchart. However,
the accuracy appears to be unstable after that because
expanded edges are providing a redundancy, which is
having a side effect on graphical model learning and in-
ference. By selecting two peak values of stroke labeling
accuracy and drop 0.05 which is having a longer infer-
ence time, we finally selected 0.03 as threshold value.
We use similar steps for determination of other pa-
rameters, such as the minimal number per leaf and the
number of decision trees in random forest classifier, and
maximal number of leaves of GBDT. Since there are
too many parameters to do grid-search, we selected one
type of parameters, then settle down others to per-
form parameter grid search by cross-validation. Then
we switch to another type of parameter, until we have
tuned all the parameters. Finally, the random forest
has 80 trees and 14 as minimal samples per leaves and
GBDT has 25 trees with a maximal 31 leaves per tree
to form the unary potential function feature refiner; for
the pairwise potential function feature refiner, random
forest has 80 trees and 3 minimal samples per leaves
and GBDT has 30 trees with a maximal 127 leaves per
tree to form the refined feature generator.
5.3 Stroke recognition
After the determination of parameters, we train our
model on the whole training set and perform test on test
set. The first stage of our flowchart recognition system
is to use M3N to determine stroke labels. Due to the
randomness of random forest and GBDT, we launched 5
experiments to recognize flowchart. The average recog-
nition result can be referred to Table 3, and we selected
the experiment that has median recognition rate to il-
lustrate the detail below. There are 7 classes of symbols
in flowchart, so strokes are classified into 7 classes. Here
we show the confusion matrix in Figure 7 and precision,
recall and F1 score of our model in Table 2:
Table 2 Stroke labeling result for each class and all togetherbefore and after grammatical analysis (GA). P for precision,R for recall. (%)
Before GA After GAP R F1 P R F1
Text 97.88 98.42 98.15 96.81 99.27 98.03Arrow 93.93 92.29 93.10 98.18 90.49 94.18Process 90.17 94.08 92.08 93.13 94.69 93.91Terminator 95.03 77.13 85.15 89.29 78.48 83.53Connection 91.87 83.70 87.60 83.22 91.85 87.32Data 90.00 91.56 90.77 93.28 94.59 93.93Decision 90.44 93.82 92.10 95.69 92.53 94.08All 95.71 95.70 95.67 96.19 96.18 96.14Accuracy 95.70 96.18
Our M3N model is using GBDT and Random Forest
as raw feature extractor, and we also tested their stroke
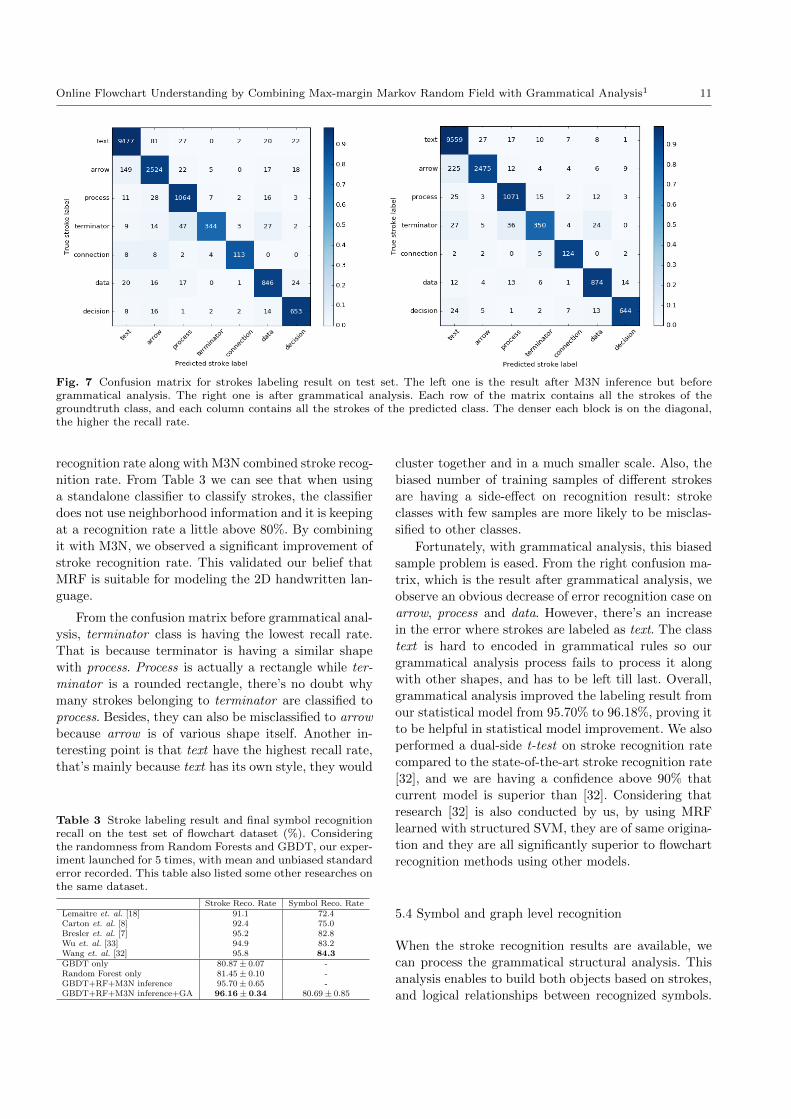
Online Flowchart Understanding by Combining Max-margin Markov Random Field with Grammatical Analysis1 11
Fig. 7 Confusion matrix for strokes labeling result on test set. The left one is the result after M3N inference but beforegrammatical analysis. The right one is after grammatical analysis. Each row of the matrix contains all the strokes of thegroundtruth class, and each column contains all the strokes of the predicted class. The denser each block is on the diagonal,the higher the recall rate.
recognition rate along with M3N combined stroke recog-
nition rate. From Table 3 we can see that when using
a standalone classifier to classify strokes, the classifier
does not use neighborhood information and it is keeping
at a recognition rate a little above 80%. By combining
it with M3N, we observed a significant improvement of
stroke recognition rate. This validated our belief that
MRF is suitable for modeling the 2D handwritten lan-
guage.
From the confusion matrix before grammatical anal-
ysis, terminator class is having the lowest recall rate.
That is because terminator is having a similar shape
with process. Process is actually a rectangle while ter-
minator is a rounded rectangle, there’s no doubt why
many strokes belonging to terminator are classified to
process. Besides, they can also be misclassified to arrow
because arrow is of various shape itself. Another in-
teresting point is that text have the highest recall rate,
that’s mainly because text has its own style, they would
Table 3 Stroke labeling result and final symbol recognitionrecall on the test set of flowchart dataset (%). Consideringthe randomness from Random Forests and GBDT, our exper-iment launched for 5 times, with mean and unbiased standarderror recorded. This table also listed some other researches onthe same dataset.
Stroke Reco. Rate Symbol Reco. RateLemaitre et. al. [18] 91.1 72.4Carton et. al. [8] 92.4 75.0Bresler et. al. [7] 95.2 82.8Wu et. al. [33] 94.9 83.2Wang et. al. [32] 95.8 84.3GBDT only 80.87± 0.07 -Random Forest only 81.45± 0.10 -GBDT+RF+M3N inference 95.70± 0.65 -GBDT+RF+M3N inference+GA 96.16± 0.34 80.69± 0.85
cluster together and in a much smaller scale. Also, the
biased number of training samples of different strokes
are having a side-effect on recognition result: stroke
classes with few samples are more likely to be misclas-
sified to other classes.
Fortunately, with grammatical analysis, this biased
sample problem is eased. From the right confusion ma-
trix, which is the result after grammatical analysis, we
observe an obvious decrease of error recognition case on
arrow, process and data. However, there’s an increase
in the error where strokes are labeled as text. The class
text is hard to encoded in grammatical rules so our
grammatical analysis process fails to process it along
with other shapes, and has to be left till last. Overall,
grammatical analysis improved the labeling result from
our statistical model from 95.70% to 96.18%, proving it
to be helpful in statistical model improvement. We also
performed a dual-side t-test on stroke recognition rate
compared to the state-of-the-art stroke recognition rate
[32], and we are having a confidence above 90% that
current model is superior than [32]. Considering that
research [32] is also conducted by us, by using MRF
learned with structured SVM, they are of same origina-
tion and they are all significantly superior to flowchart
recognition methods using other models.
5.4 Symbol and graph level recognition
When the stroke recognition results are available, we
can process the grammatical structural analysis. This
analysis enables to build both objects based on strokes,
and logical relationships between recognized symbols.

12 Chengcheng Wang et al.
(a) Flowchart recognized without error. (b) Correctly segmented flowchart but with one recog-nition error: one terminator is recognized as process.
(c) Legend
Fig. 8 Typical examples of flowchart recognition, with max-margin MRF stroke labeling and grammatical analysis. Thestrokes are colored to indicate their recognition result. The legend of Figures is shown in 8(c).
(a) An incorrectly recognized flowchart, recognized withmax-margin MRF only without grammatical analysis.
(b) Same flowchart recognized after grammatical analysis.
Fig. 9 A flowchart’s recognition result in two stages: 9(a)for after max-margin MRF stroke labeling and 9(b)after strokelabeling and grammatical analysis. Grammatical description would eliminate some stroke labeling errors, for example theprocess is confused with data symbol before grammatical analysis. Most of this type of errors are corrected after grammaticalanalysis step.
The novelty of our experiments is that the database
now includes relationships in the ground truth. Conse-
quently, we can evaluate structural correctness in our
graph level recognition analysis. Our graphical level
evaluation is done using the tools mentioned in [19].
Table 4 gives object level recognition result, specif-
ically symbol segmentation results and symbol recog-
nition results. Traditional recall and precision metrics
compute the ratio of correctly recognized symbols to
groundtruth symbols and correctly recognized symbols
to all recognized symbols respectively. We can notice
a higher rate for symbol segmentation than for sym-
Table 4 Symbol segmentation and recognition result aftergrammatical analysis (%)
Precision Recall F1Text 71.06 78.93 74.79Arrow 72.89 76.89 74.84Process 84.95 89.95 87.38Terminator 78.21 77.83 78.02Connection 85.18 92.74 88.80Data 92.63 89.80 91.19Decision 82.86 82.07 82.46Object overall 76.13 80.85 78.42
Segmentation 78.21 83.06 80.57
Online Flowchart Understanding by Combining Max-margin Markov Random Field with Grammatical Analysis1 13
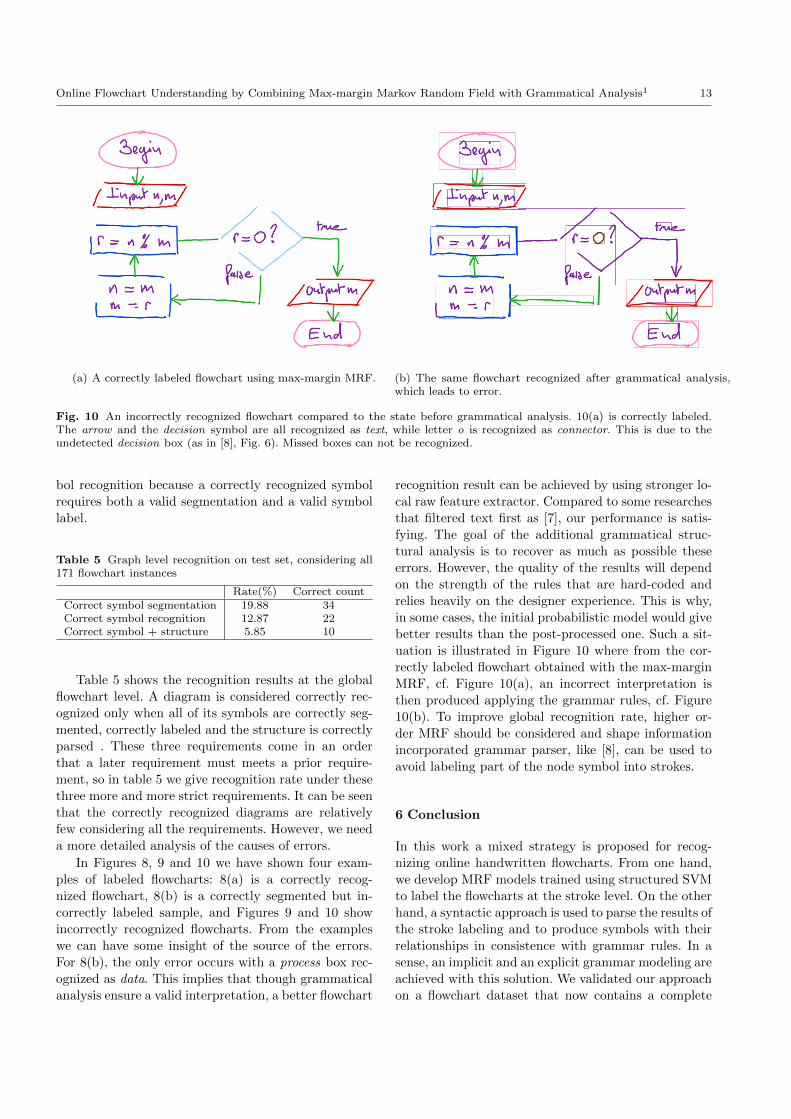
(a) A correctly labeled flowchart using max-margin MRF. (b) The same flowchart recognized after grammatical analysis,which leads to error.
Fig. 10 An incorrectly recognized flowchart compared to the state before grammatical analysis. 10(a) is correctly labeled.The arrow and the decision symbol are all recognized as text, while letter o is recognized as connector. This is due to theundetected decision box (as in [8], Fig. 6). Missed boxes can not be recognized.
bol recognition because a correctly recognized symbol
requires both a valid segmentation and a valid symbol
label.
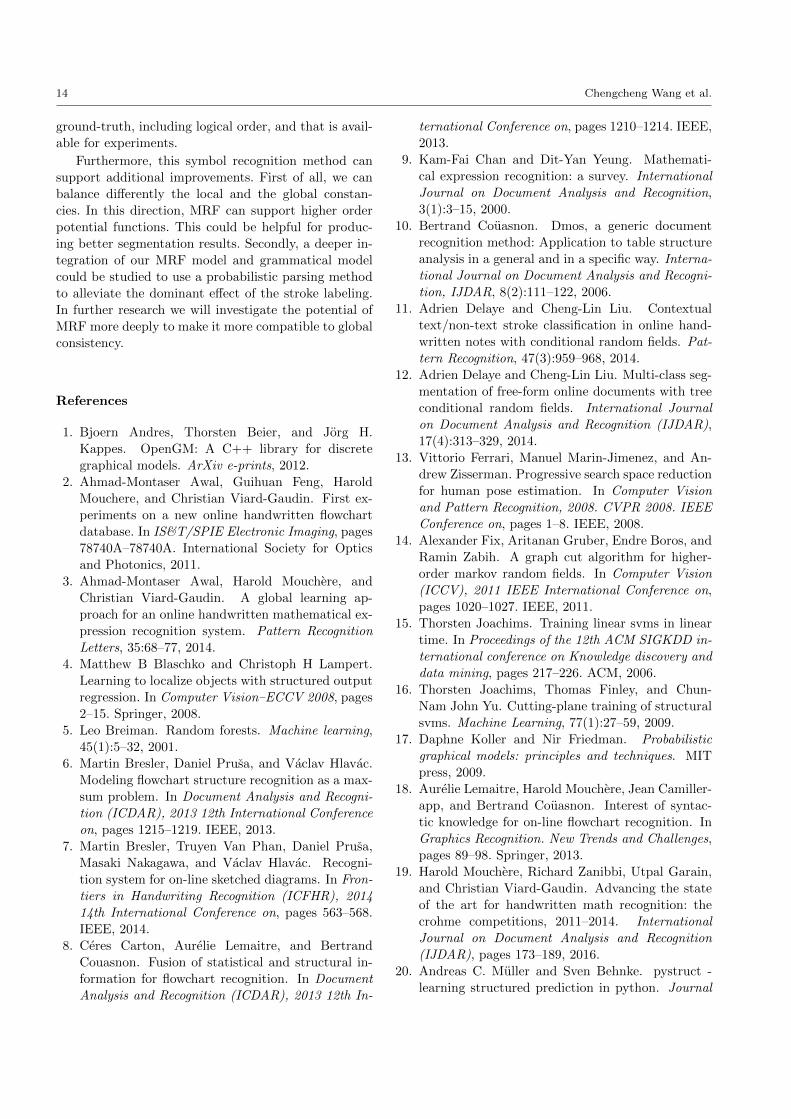
Table 5 Graph level recognition on test set, considering all171 flowchart instances
Rate(%) Correct countCorrect symbol segmentation 19.88 34Correct symbol recognition 12.87 22Correct symbol + structure 5.85 10
Table 5 shows the recognition results at the global
flowchart level. A diagram is considered correctly rec-
ognized only when all of its symbols are correctly seg-
mented, correctly labeled and the structure is correctly
parsed . These three requirements come in an order
that a later requirement must meets a prior require-
ment, so in table 5 we give recognition rate under these
three more and more strict requirements. It can be seen
that the correctly recognized diagrams are relatively
few considering all the requirements. However, we need
a more detailed analysis of the causes of errors.
In Figures 8, 9 and 10 we have shown four exam-
ples of labeled flowcharts: 8(a) is a correctly recog-
nized flowchart, 8(b) is a correctly segmented but in-
correctly labeled sample, and Figures 9 and 10 show
incorrectly recognized flowcharts. From the examples
we can have some insight of the source of the errors.
For 8(b), the only error occurs with a process box rec-
ognized as data. This implies that though grammatical
analysis ensure a valid interpretation, a better flowchart
recognition result can be achieved by using stronger lo-
cal raw feature extractor. Compared to some researches
that filtered text first as [7], our performance is satis-
fying. The goal of the additional grammatical struc-
tural analysis is to recover as much as possible these
errors. However, the quality of the results will depend
on the strength of the rules that are hard-coded and
relies heavily on the designer experience. This is why,
in some cases, the initial probabilistic model would give
better results than the post-processed one. Such a sit-
uation is illustrated in Figure 10 where from the cor-
rectly labeled flowchart obtained with the max-margin
MRF, cf. Figure 10(a), an incorrect interpretation is
then produced applying the grammar rules, cf. Figure
10(b). To improve global recognition rate, higher or-
der MRF should be considered and shape information
incorporated grammar parser, like [8], can be used to
avoid labeling part of the node symbol into strokes.
6 Conclusion
In this work a mixed strategy is proposed for recog-
nizing online handwritten flowcharts. From one hand,
we develop MRF models trained using structured SVM
to label the flowcharts at the stroke level. On the other
hand, a syntactic approach is used to parse the results of
the stroke labeling and to produce symbols with their
relationships in consistence with grammar rules. In a
sense, an implicit and an explicit grammar modeling are
achieved with this solution. We validated our approach
on a flowchart dataset that now contains a complete
14 Chengcheng Wang et al.
ground-truth, including logical order, and that is avail-
able for experiments.
Furthermore, this symbol recognition method can
support additional improvements. First of all, we can
balance differently the local and the global constan-
cies. In this direction, MRF can support higher order
potential functions. This could be helpful for produc-
ing better segmentation results. Secondly, a deeper in-
tegration of our MRF model and grammatical model
could be studied to use a probabilistic parsing method
to alleviate the dominant effect of the stroke labeling.
In further research we will investigate the potential of
MRF more deeply to make it more compatible to global
consistency.
References
1. Bjoern Andres, Thorsten Beier, and Jorg H.
Kappes. OpenGM: A C++ library for discrete
graphical models. ArXiv e-prints, 2012.
2. Ahmad-Montaser Awal, Guihuan Feng, Harold
Mouchere, and Christian Viard-Gaudin. First ex-
periments on a new online handwritten flowchart
database. In IS&T/SPIE Electronic Imaging, pages
78740A–78740A. International Society for Optics
and Photonics, 2011.
3. Ahmad-Montaser Awal, Harold Mouchere, and
Christian Viard-Gaudin. A global learning ap-
proach for an online handwritten mathematical ex-
pression recognition system. Pattern Recognition
Letters, 35:68–77, 2014.
4. Matthew B Blaschko and Christoph H Lampert.
Learning to localize objects with structured output
regression. In Computer Vision–ECCV 2008, pages
2–15. Springer, 2008.
5. Leo Breiman. Random forests. Machine learning,
45(1):5–32, 2001.
6. Martin Bresler, Daniel Prusa, and Vaclav Hlavac.
Modeling flowchart structure recognition as a max-
sum problem. In Document Analysis and Recogni-
tion (ICDAR), 2013 12th International Conference
on, pages 1215–1219. IEEE, 2013.
7. Martin Bresler, Truyen Van Phan, Daniel Prusa,
Masaki Nakagawa, and Vaclav Hlavac. Recogni-
tion system for on-line sketched diagrams. In Fron-
tiers in Handwriting Recognition (ICFHR), 2014
14th International Conference on, pages 563–568.
IEEE, 2014.
8. Ceres Carton, Aurelie Lemaitre, and Bertrand
Couasnon. Fusion of statistical and structural in-
formation for flowchart recognition. In Document
Analysis and Recognition (ICDAR), 2013 12th In-
ternational Conference on, pages 1210–1214. IEEE,
2013.
9. Kam-Fai Chan and Dit-Yan Yeung. Mathemati-
cal expression recognition: a survey. International
Journal on Document Analysis and Recognition,
3(1):3–15, 2000.
10. Bertrand Couasnon. Dmos, a generic document
recognition method: Application to table structure
analysis in a general and in a specific way. Interna-
tional Journal on Document Analysis and Recogni-
tion, IJDAR, 8(2):111–122, 2006.
11. Adrien Delaye and Cheng-Lin Liu. Contextual
text/non-text stroke classification in online hand-
written notes with conditional random fields. Pat-
tern Recognition, 47(3):959–968, 2014.
12. Adrien Delaye and Cheng-Lin Liu. Multi-class seg-
mentation of free-form online documents with tree
conditional random fields. International Journal
on Document Analysis and Recognition (IJDAR),
17(4):313–329, 2014.
13. Vittorio Ferrari, Manuel Marin-Jimenez, and An-
drew Zisserman. Progressive search space reduction
for human pose estimation. In Computer Vision
and Pattern Recognition, 2008. CVPR 2008. IEEE
Conference on, pages 1–8. IEEE, 2008.
14. Alexander Fix, Aritanan Gruber, Endre Boros, and
Ramin Zabih. A graph cut algorithm for higher-
order markov random fields. In Computer Vision
(ICCV), 2011 IEEE International Conference on,
pages 1020–1027. IEEE, 2011.
15. Thorsten Joachims. Training linear svms in linear
time. In Proceedings of the 12th ACM SIGKDD in-
ternational conference on Knowledge discovery and
data mining, pages 217–226. ACM, 2006.
16. Thorsten Joachims, Thomas Finley, and Chun-
Nam John Yu. Cutting-plane training of structural
svms. Machine Learning, 77(1):27–59, 2009.
17. Daphne Koller and Nir Friedman. Probabilistic
graphical models: principles and techniques. MIT
press, 2009.
18. Aurelie Lemaitre, Harold Mouchere, Jean Camiller-
app, and Bertrand Couasnon. Interest of syntac-
tic knowledge for on-line flowchart recognition. In
Graphics Recognition. New Trends and Challenges,
pages 89–98. Springer, 2013.
19. Harold Mouchere, Richard Zanibbi, Utpal Garain,
and Christian Viard-Gaudin. Advancing the state
of the art for handwritten math recognition: the
crohme competitions, 2011–2014. International
Journal on Document Analysis and Recognition
(IJDAR), pages 173–189, 2016.
20. Andreas C. Muller and Sven Behnke. pystruct -
learning structured prediction in python. Journal

Online Flowchart Understanding by Combining Max-margin Markov Random Field with Grammatical Analysis1 15
of Machine Learning Research, 15:2055–2060, 2014.
21. Sebastian Nowozin, Peter V Gehler, and
Christoph H Lampert. On parameter learn-
ing in crf-based approaches to object class image
segmentation. In Computer Vision–ECCV 2010,
pages 98–111. Springer, 2010.
22. Sebastian Nowozin and Christoph H Lampert.
Structured learning and prediction in computer
vision. Foundations and Trends R© in Computer
Graphics and Vision, 6(3–4):185–365, 2011.
23. Artificial Intelligence Group of Microsoft Re-
search Asia. Github - microsoft/lightgbm, 2016.
https://github.com/Microsoft/LightGBM.
24. Deli Pei, Zhenguo Li, Rongrong Ji, and Fuchun
Sun. Efficient semantic image segmentation with
multi-class ranking prior. Computer Vision and
Image Understanding, 120:81–90, 2014.
25. Yuan Qi, Martin Szummer, and Thomas P Minka.
Diagram structure recognition by bayesian condi-
tional random fields. In Computer Vision and Pat-
tern Recognition, 2005. CVPR 2005. IEEE Com-
puter Society Conference on, volume 2, pages 191–
196. IEEE, 2005.
26. Taik Heon Rhee and Jin Hyung Kim. Efficient
search strategy in structural analysis for handwrit-
ten mathematical expression recognition. Pattern
Recognition, 42(12):3192–3201, 2009.
27. Dan Roth and Wen-tau Yih. Integer linear pro-
gramming inference for conditional random fields.
In Proceedings of the 22nd international conference
on Machine learning, pages 736–743. ACM, 2005.
28. Alex J Smola, Julian J Mcauley, and Tiberio S Cae-
tano. Robust near-isometric matching via struc-
tured learning of graphical models. In Advances
in Neural Information Processing Systems, pages
1057–1064, 2009.
29. Ernesto Tapia and Raul Rojas. Recognition of on-
line handwritten mathematical expressions using a
minimum spanning tree construction and symbol
dominance. In Graphics recognition. Recent ad-
vances and perspectives, pages 329–340. Springer,
2003.
30. Choon Hui Teo, Alex Smola, SVN Vishwanathan,
and Quoc Viet Le. A scalable modular convex
solver for regularized risk minimization. In Pro-
ceedings of the 13th ACM SIGKDD international
conference on Knowledge discovery and data min-
ing, pages 727–736. ACM, 2007.
31. Alex Waibel, Toshiyuki Hanazawa, Geoffrey Hin-
ton, Kiyohiro Shikano, and Kevin J Lang. Phoneme
recognition using time-delay neural networks.
IEEE transactions on acoustics, speech, and signal
processing, 37(3):328–339, 1989.
32. Chengcheng Wang, Harold Mouchere, Christian
Viard-Gaudin, and Lianwen Jin. Combined seg-
mentation and recognition of online handwritten
diagrams with high order markov random field. In
International Conference on Frontiers in Handwrit-
ing Recognition (ICFHR), 2016.
33. Jie Wu, Changhu Wang, Liqing Zhang, and Yong
Rui. Offline sketch parsing via shapeness estima-
tion. In Proceedings of the 24th International Joint
Conference on Artificial Intelligence, pages 1200–
1206. AAAI Press, 2015.
34. Richard Zanibbi, Dorothea Blostein, and James R
Cordy. Recognizing mathematical expressions
using tree transformation. Pattern Analysis
and Machine Intelligence, IEEE Transactions on,
24(11):1455–1467, 2002.
35. Bilan Zhu and Masaki Nakagawa. On-line hand-
written japanese characters recognition using a mrf
model with parameter optimization by crf. In Docu-
ment Analysis and Recognition (ICDAR), 2011 In-
ternational Conference on, pages 603–607. IEEE,
2011.


![Online flowchart understanding by combining max-margin ... · Online Flowchart Understanding by Combining Max-margin ... recognizing symbols, and then analyzing structures [9]. We](https://img.pdfslide.net/doc/110x75/6057731a5a52fa66dd63a3bc/online-flowchart-understanding-by-combining-max-margin-online-flowchart-understanding.jpg)