Embed Size (px)
Citation preview
Key Concepts of L
ean
Onlin
e W
ebcast
© Copyright 2013 Lean Enterprise Institu
te, Joe Murli A
ll rights re
served.
Lean Enterprise Institu
te and the leaper im
age are registered trademarks of Lean Enterprise Institu
te, Inc.
Instru
ctor: J
oe Murli
For W
ebexassistance and tro
ubleshootin
g please use th
is lin
k:
http
s://sup
po
rt.we
be
x.com
/MyA
ccou
ntW
eb
/sup
po
rtho
me
.do
?ro
ot=
Too
ls
2
The program consists of fo
ur 2
-hour m
odules conducted over a
2-w
eek
perio
d. A
t the end of e
ach m
odule, you will re
ceive an assignment to
help you practic
e what y
ou have learned and develop skills
and
behaviors re
quire
d to
support a
cultu
re of contin
uous im
provement.
Each m
odule will b
e re
corded and available to
view at le
an.org
Welcome to
this Onlin
e W
ebcast
Key Concepts of L
ean
Course Schedule (1
:00pm-3:00pm EST):
•Module One-March 25
•Module Two-March 27
•Module Three-April 1
•Module Four-April 3
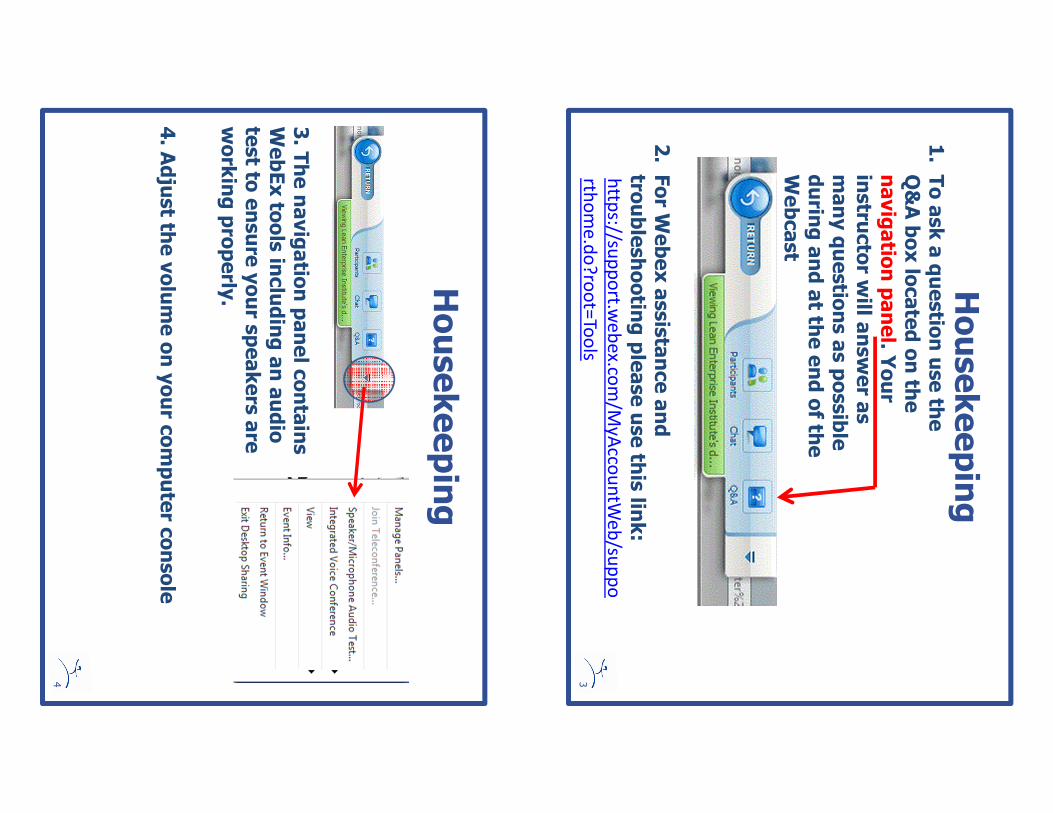
Housekeeping
1. T
o ask a questio
n use th
e
Q&A box located on th
e
navigatio
n panel. Y
our
instru
ctor w
ill answer a
s
many questio
ns as possible
durin
g and at th
e end of th
e
Webcast
2.For W
ebexassistance and
troubleshootin
g please use th
is lin
k:
http
s://sup
po
rt.we
be
x.com
/My
Acco
un
tWe
b/su
pp
o
rtho
me
.do
?ro
ot=
Too
ls3
Housekeeping
3. The navigatio
n panel contains
WebEx to
ols in
cluding an audio
test to
ensure your s
peakers are
working properly
.
4. A
djust th
e volume on your c
omputer c
onsole
4
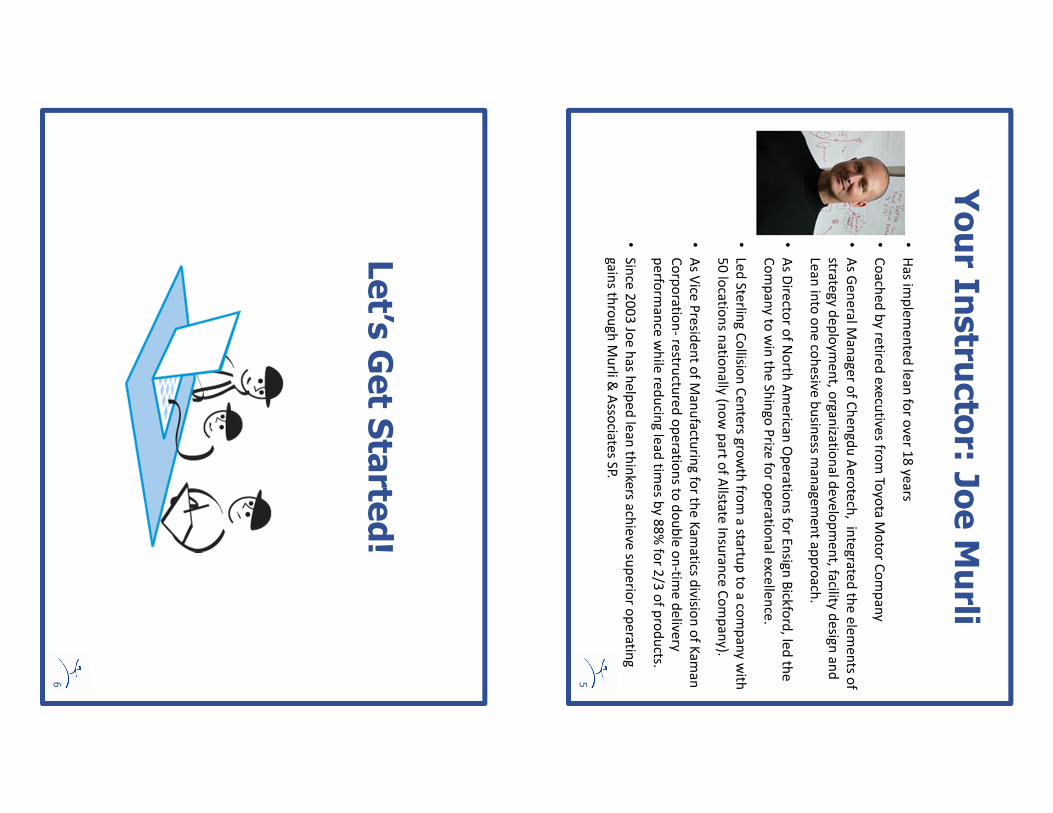
Your In
stru
ctor: J
oe Murli
•H
as im
ple
me
nte
d le
an
for o
ver 1
8 ye
ars
•C
oa
che
d b
y re
tired
exe
cutive
s from
Toyo
ta M
oto
r Co
mp
an
y
•A
s Ge
ne
ral M
an
ag
er o
f Ch
en
gd
u A
ero
tech
, inte
gra
ted
the
ele
me
nts o
f
strate
gy
de
plo
ym
en
t, org
an
izatio
na
l de
velo
pm
en
t, facility
de
sign
an
d
Lea
n in
to o
ne
coh
esive
bu
sine
ss ma
na
ge
me
nt a
pp
roa
ch.
•A
s Dire
ctor o
f No
rth A
me
rican
Op
era
tion
s for E
nsig
n B
ickfo
rd, le
d th
e
Co
mp
an
y to
win
the
Sh
ing
o P
rize fo
r op
era
tion
al e
xcelle
nce
.
•Le
d S
terlin
g C
ollisio
n C
en
ters g
row
th fro
m a
startu
p to
a co
mp
an
y w
ith
50
loca
tion
s na
tion
ally
(no
w p
art o
f Allsta
te In
sura
nce
Co
mp
an
y).
•A
s Vice
Pre
side
nt o
f Ma
nu
factu
ring
for th
e K
am
atics
div
ision
of K
am
an
Co
rpo
ratio
n-
restru
cture
d o
pe
ratio
ns to
do
ub
le o
n-tim
e d
elive
ry
pe
rform
an
ce w
hile
red
ucin
g le
ad
time
s by
88
% fo
r 2/3
of p
rod
ucts.
•S
ince
20
03
Joe
ha
s he
lpe
d le
an
thin
kers a
chie
ve su
pe
rior o
pe
ratin
g
ga
ins th
rou
gh
Mu
rli & A
ssocia
tes S
P.
5
Let’s Get S
tarte
d!
6
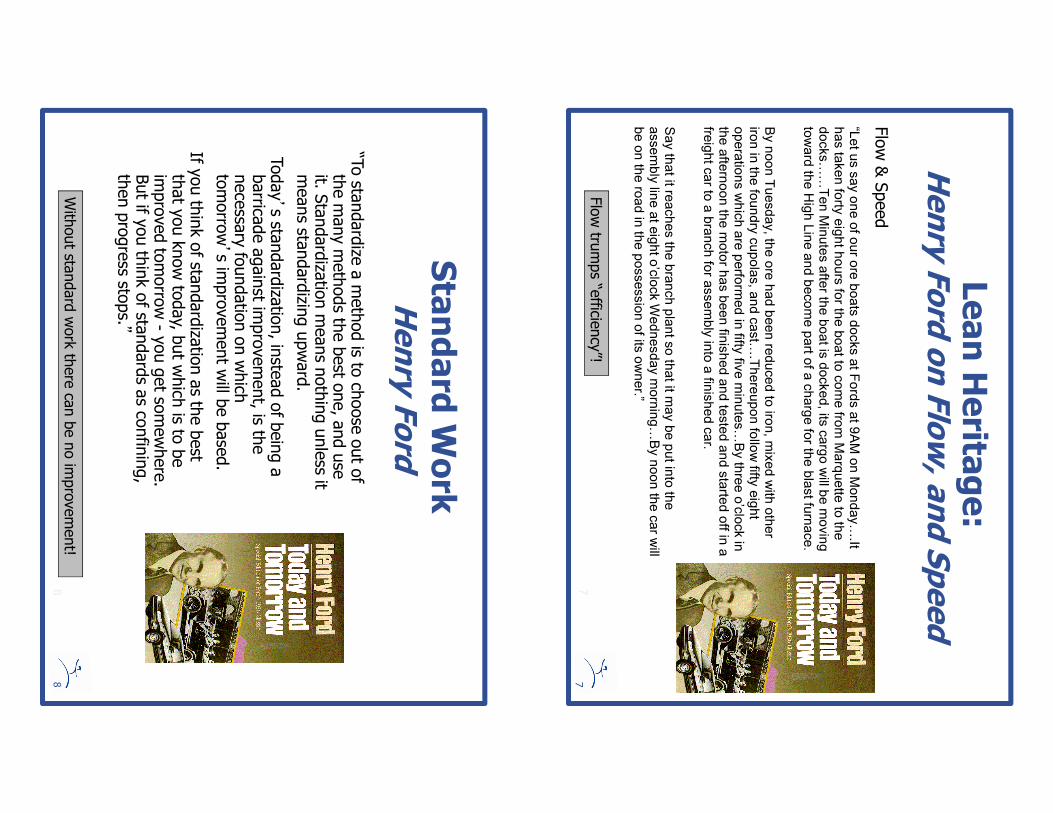
Lean Herita
ge:
Henry Ford on Flow, and Speed
“Let us say one of our ore boats docks at Fords at 9AM on Monday….It
has taken forty eight hours for the boat to come from Marquette to the docks…
…Ten Minutes after the boat is docked, its cargo will be moving
toward the High Line and become part of a charge for the blast furnace.
By noon Tuesday, the ore had been reduced to iron, mixed with other iron in the foundry cupolas, and cast…
.Thereupon follow fifty eight operations which are performed in fifty five minutes…
By three o’clock in the afternoon the motor has been finished and tested and started off in a freight car to a branch for assembly into a finished car.
Say that it reaches the branch plant so that it may be put into the assembly line at eight o’clock Wednesday morning…
By noon the car will be on the road in the possession of its owner.”
Flow & Speed
7Flow trumps “efficie
ncy”!
7
Standard W
ork
Henry Ford
“To standardize a method is to
choose out of
the many methods the best one, and use
it. Standardization means nothing unless it
means sta
ndardizing upward.
Today’s sta
ndardization, instead of being a
barrica
de against im
provement, is th
e
necessary foundation on which
tomorrow’s im
provement will be based.
If you think of sta
ndardization as the best
that you know today, but which is to
be
improved tomorrow -you get somewhere.
But if y
ou think of sta
ndards as co
nfining,
then progress sto
ps.”
8Without sta
ndard work there can be no improvement!
8
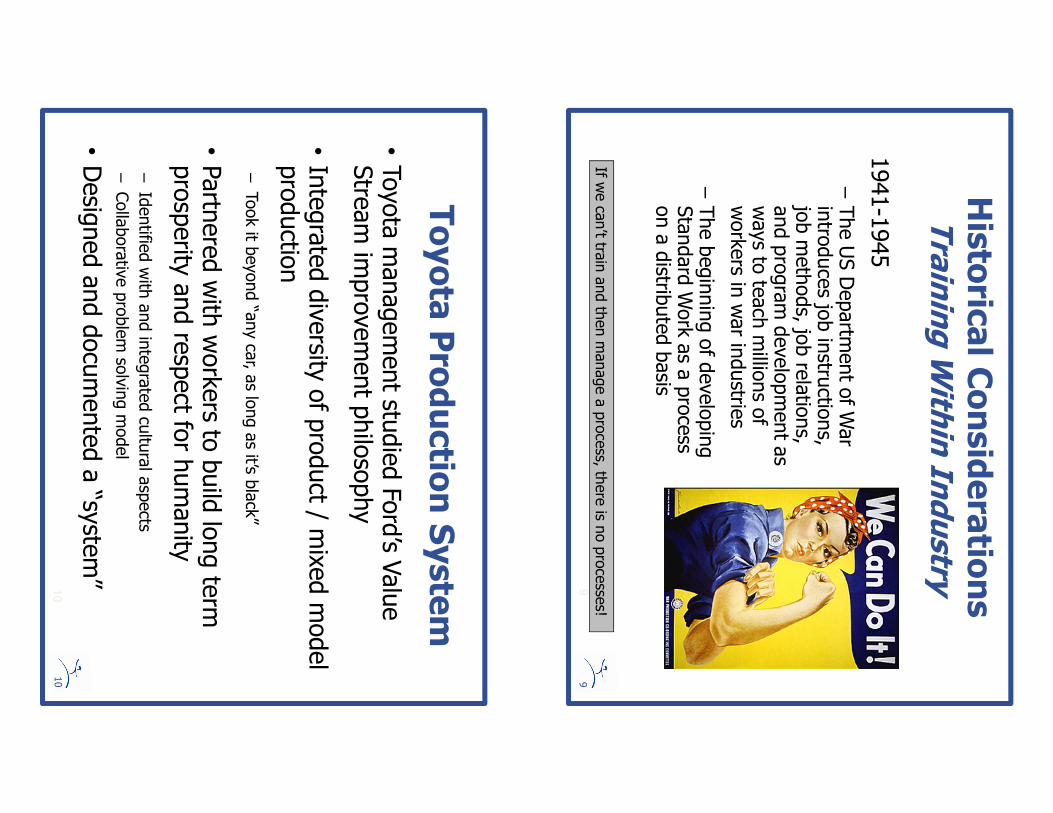
Historic
al C
onsideratio
ns
Training W
ithin In
dustry
1941-1945
–The US Department of War
introduces job instru
ctions,
job methods, jo
b relations,
and program development as
ways to teach millions of
workers in
war industrie
s
–The beginning of developing
Standard Work as a process
on a distrib
uted basis
9If w
e can’t tra
in and then manage a process, th
ere is n
o processes!
9
•Toyota management stu
died Ford’s Value
Stream improvement philosophy
•Integrated diversity
of product / m
ixed model
production
–Took it b
eyond “any car, as long as it’s b
lack”
•Partnered with workers to
build long term
prosperity and respect fo
r humanity
–Identified with and integrated cultural aspects
–Collaborative problem solving model
•Designed and documented a “system”10
Toyota Productio
n System
10
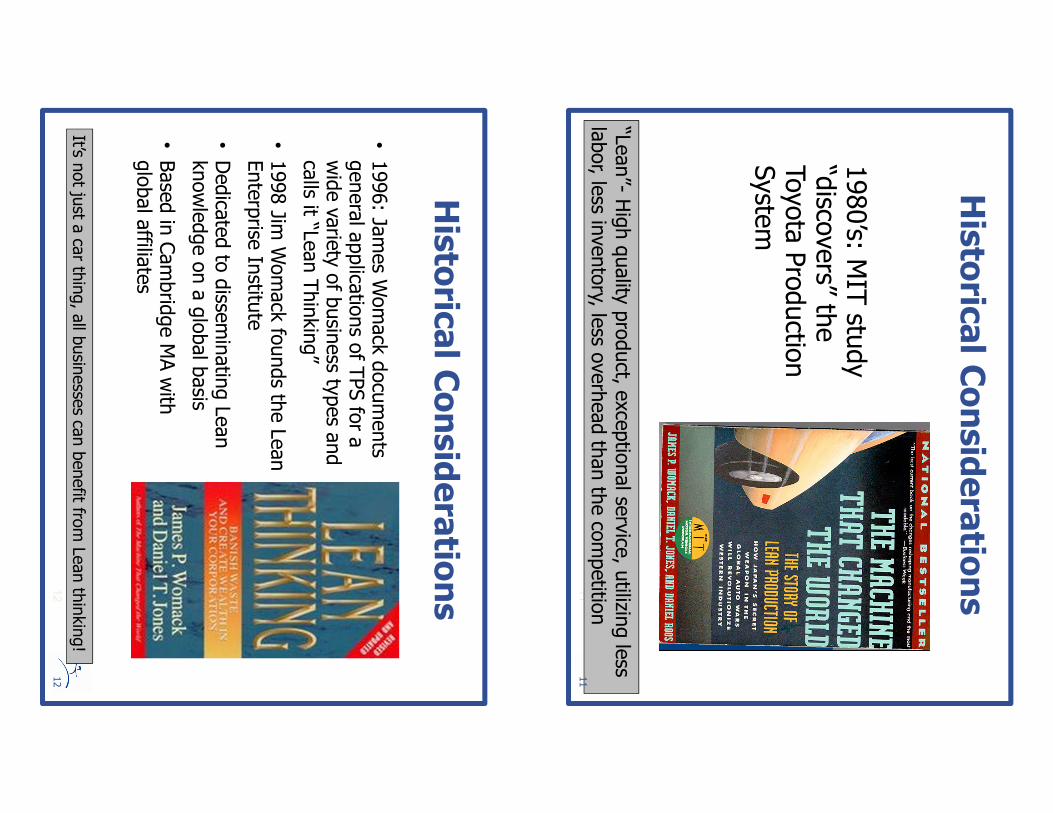
Historic
al C
onsideratio
ns
1980’s: M
IT study
“discovers” th
e
Toyota Production
System
11
“Lean”-High quality product, e
xceptional service, utilizin
g less
labor, less in
ventory, le
ss overhead than the competition
11
•1996: James Womack documents
general applications of TPS for a
wide variety of business ty
pes and
calls it “L
ean Thinking”
•1998 Jim
Womack founds the Lean
Enterprise Institu
te
•Dedicated to disseminating Lean
knowledge on a global basis
•Based in Cambridge MA with
global affilia
tes
12
Historic
al C
onsideratio
ns
It’s not just a car thing, all businesses ca
n benefit fro
m Lean thinking!
12
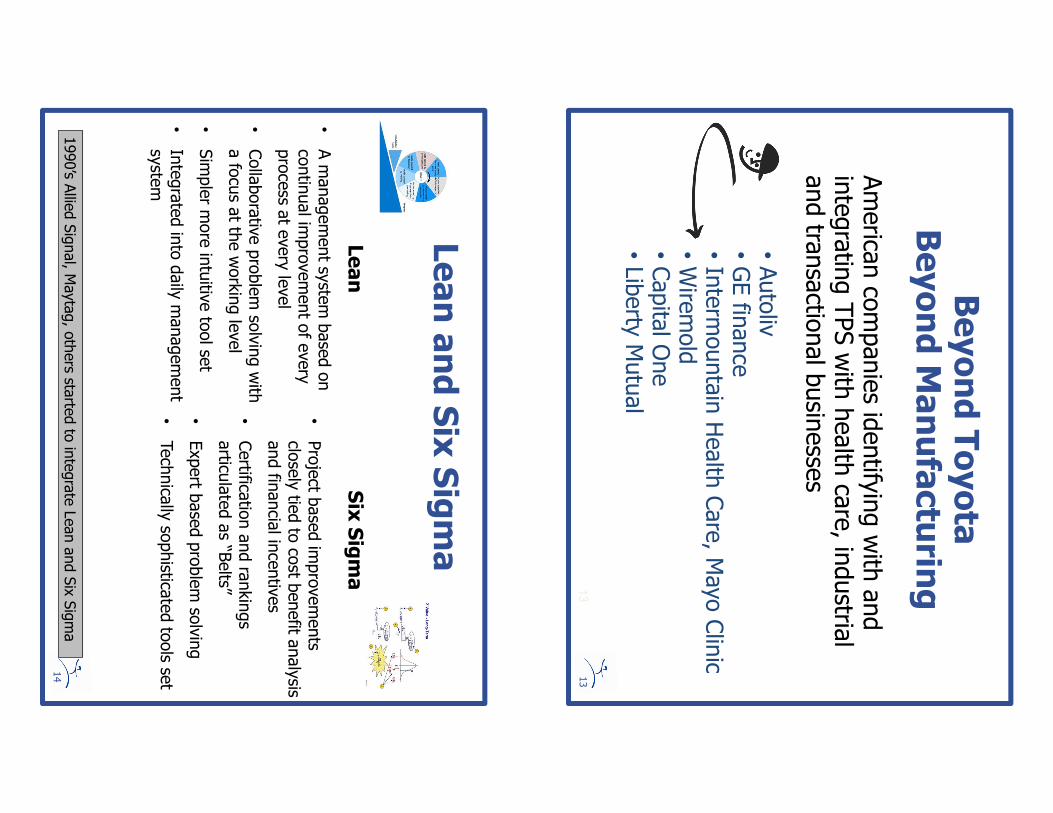
American companies identifying with and
integrating TPS with health care, industria
l and transactional businesses
13
Beyond Toyota
Beyond Manufacturin
g
13
•Autoliv
•GE finance
•Intermountain Health Care, Mayo Clinic
•Wiremold
•Capital One
•Liberty Mutual
Lean and Six Sigma
Lean
•A management system based on
continual improvement of every
process a
t every level
•Collaborative problem solving with
a focus at the working level
•Simpler more intuitive tool set
•Integrated into daily management
system
Six Sigma
•Project based improvements
closely tied to cost benefit a
nalysis
and financial incentives
•Certifica
tion and rankings
articu
lated as “B
elts”
•Expert based problem solving
•Technically sophistica
ted tools se
t
14
1990’s Allied Signal, Maytag, others sta
rted to integrate Lean and Six Sigma
15
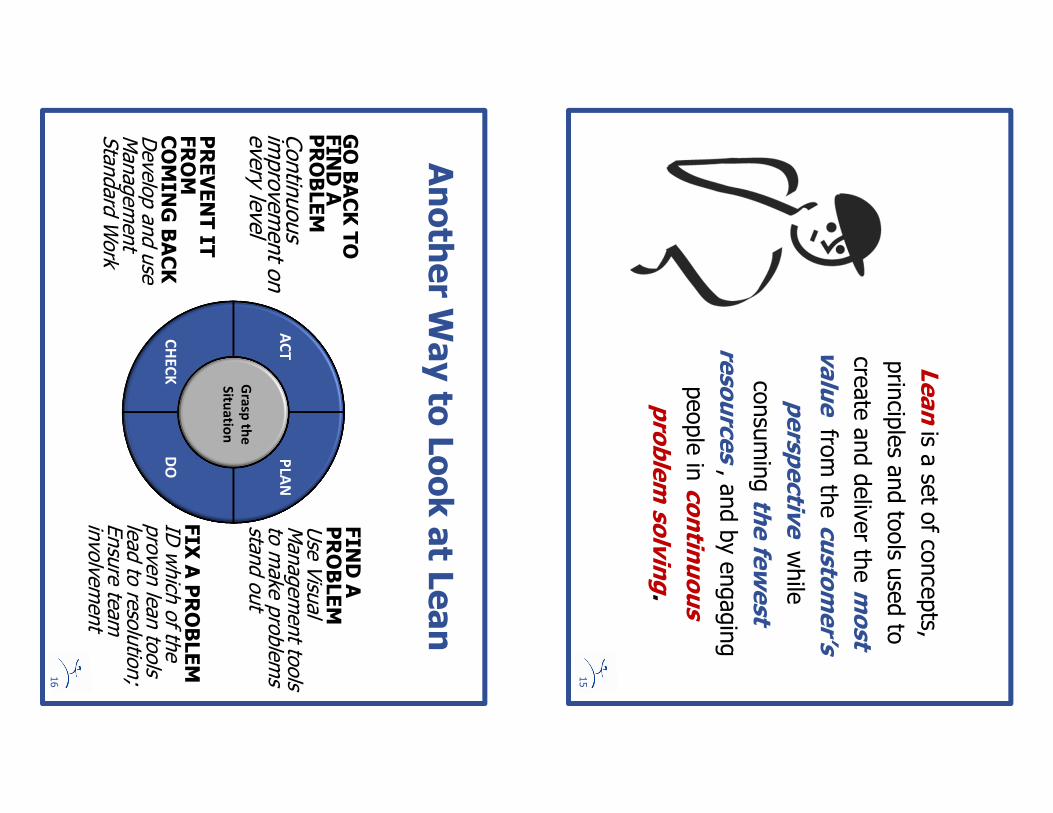
Leanis a set of concepts,
principles and tools used to
create and deliver the m
ost
value from the customer’s
perspectiv
e while
consuming th
e fe
west
resources , and by engaging
people in contin
uous
problem solving.
AC
T
CH
EC
KD
O
AC
TP
LAN
CH
EC
KD
O
Gra
sp th
e
Situ
atio
n
Another W
ay to
Look at L
ean
16
GO BACK TO
FIN
D A
PROBLEM
Continuous
improvement on
every le
vel
FIN
D A
PROBLEM
Use Visual
Management tools
to make problems
stand out
FIX A PROBLEM
ID which of the
proven lean tools
lead to resolution;
Ensure team
involvement
PREVENT IT
FROM
COMIN
G BACK
Develop and use
Management
Standard Work
What is
“Lean”
and where did it
come fro
m?
17
Questio
ns
& Refle
ctio
n
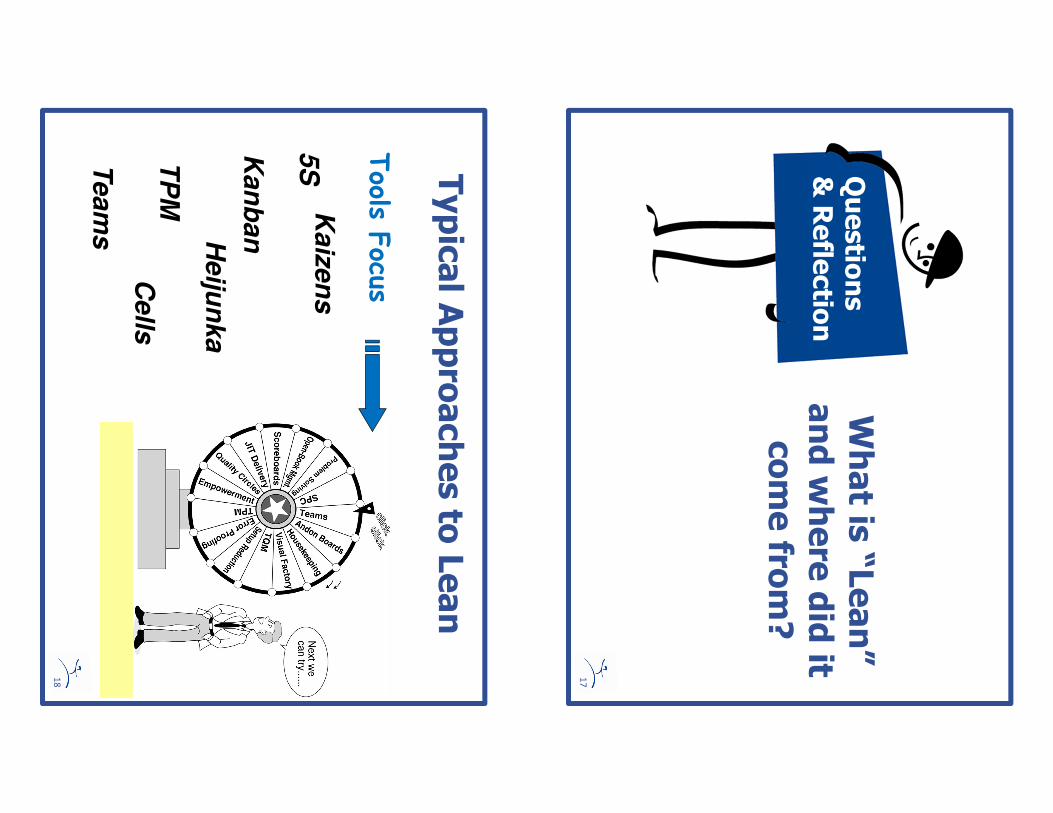
Typical A
pproaches to
Lean
18
Tools F
ocus
5SKan
ban
TP
M
Heiju
nka
Kaiz
en
s
Cells
Team
s
“Syste
m” F
ocus
“C
om
pa
ny
X”
Pro
du
ctio
n
Sy
ste
m
Le
an
Six
Sig
ma
Su
bje
ctiv
e A
ssessm
en
ts,
Co
mp
licate
d G
rap
hic
s,
Co
rpo
rate
Sta
ff Driv
en
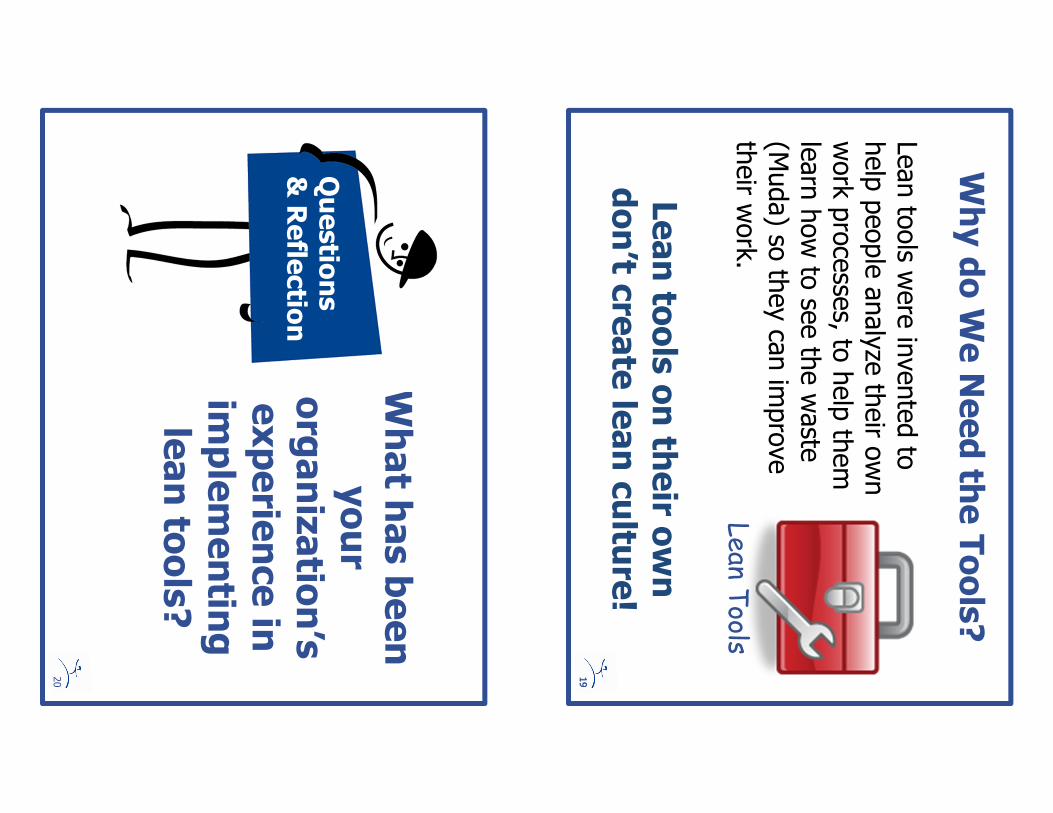
Why do W
e Need th
e Tools?
Lean tools w
ere invented to
help people analyze their own
work processes, to
help them
learn how to see the waste
(Muda) so they can improve
their work.
Lean Tools
19
Lean to
ols on th
eir o
wn
don’t c
reate lean cultu
re!
19
20
What h
as been
your
organizatio
n’s
experie
nce in
im
plementin
g
lean to
ols?
Questio
ns
& Refle
ctio
n
21
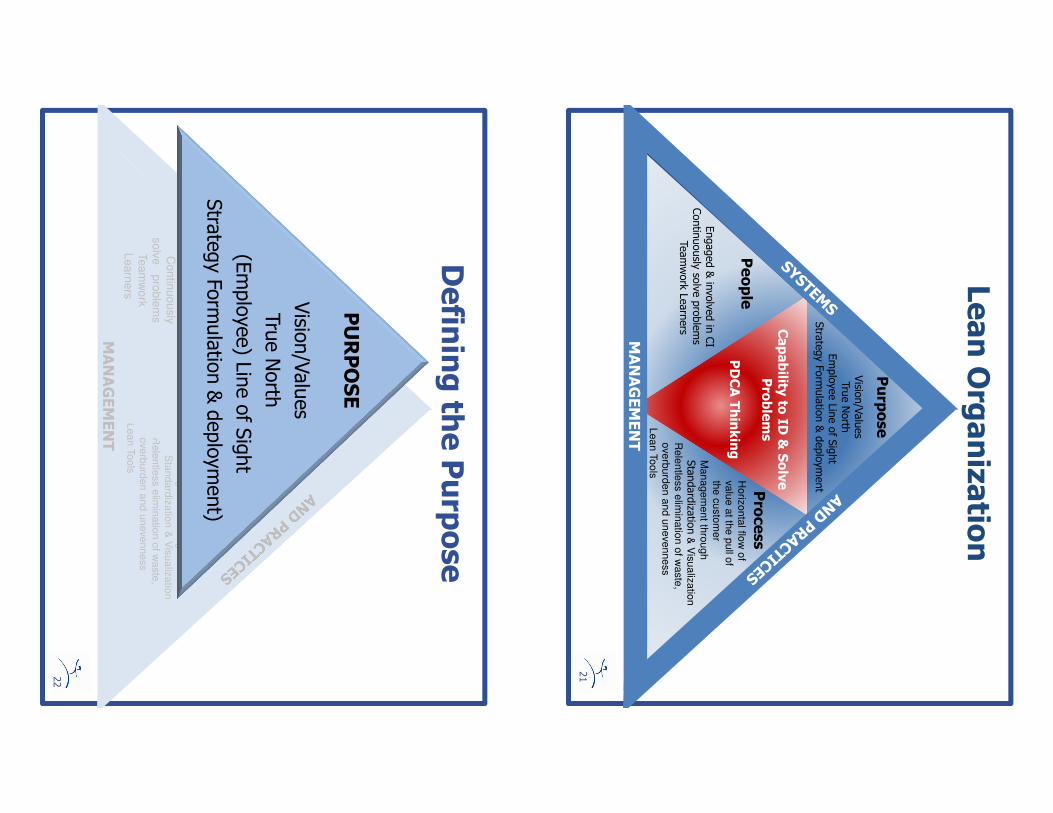
Purpose
Vision/Values
True North
Employee Line of Sight
Strategy Formulation & deploymentProcess
People
Lean Organizatio
n
Ho
rizo
nta
l flow
of
va
lue
at th
e p
ull o
f
the
cu
sto
me
r
Ma
na
ge
me
nt th
rou
gh
Standardization
& V
isu
aliz
atio
nR
ele
ntle
ss e
limin
atio
n o
f wa
ste
,
ove
rbu
rde
n a
nd
un
eve
nn
ess
Le
an
To
ols
Capability
to ID
& Solve
Problems
PDCA Thinking
Engaged & involved in CI
Continuously solve problems
Teamwork Learners
MANAGEMENT
22
Defin
ing th
e Purpose
Ho
rizo
nta
l flow
of
va
lue
at th
e p
ull o
f
the
cu
sto
me
r
Ma
na
ge
me
nt th
rou
gh
Sta
nd
ard
iza
tion
& V
isu
aliz
atio
n
Re
len
tless e
limin
atio
n o
f wa
ste
,
ove
rbu
rde
n a
nd
un
eve
nn
ess
Le
an
To
ols
Capability
to ID
& Solve
Problems
PDCA Thinking
Engaged a
nd
involv
ed in
CI
Contin
uously
solv
e p
roble
ms
Team
work
Learn
ers
MANAGEMENT
PURPOSE
Vision/Values
True North
(Employee) Line of Sight
Strategy Formulation & deployment)
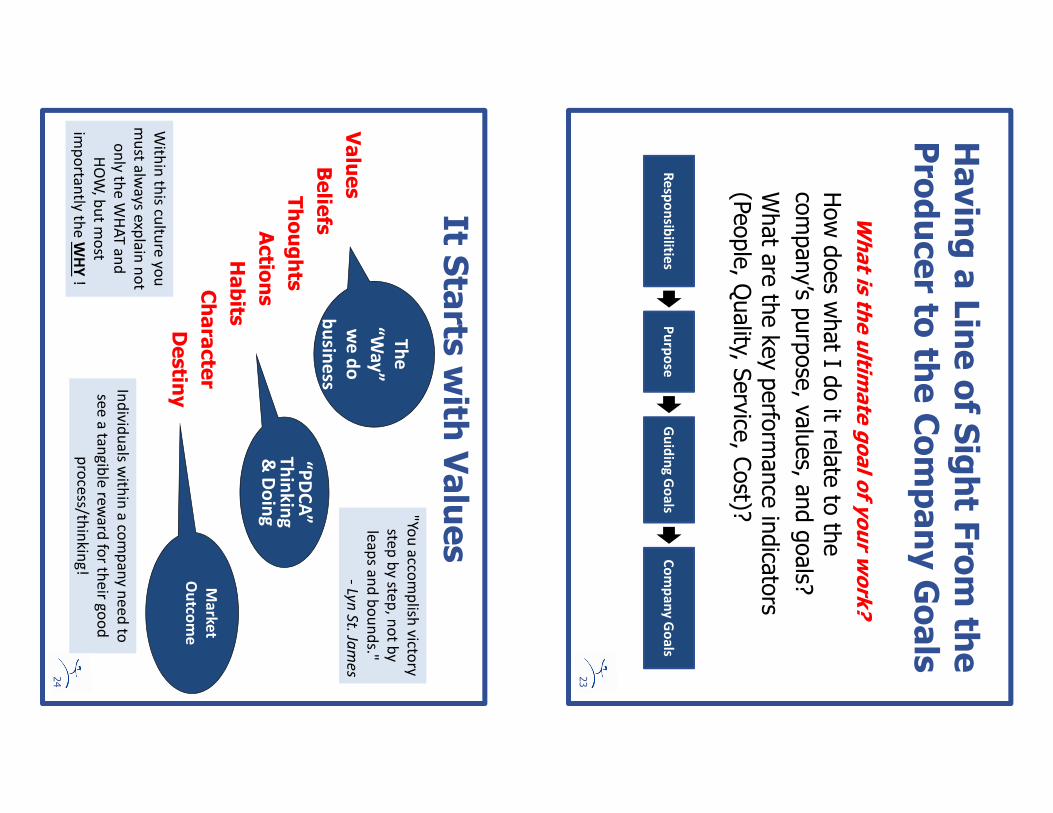
Having a Line of S
ight F
rom th
e
Producer to
the Company Goals
What is
the ultim
ate goal of y
our w
ork?
How does what I d
o it re
late to the
company’s purpose, values, and goals?
What are the key performance indicators
(People, Quality, S
ervice, Cost)?
Re
spo
nsib
ilities
Pu
rpo
seG
uid
ing
Go
als
Co
mp
an
y G
oa
ls
23
It Starts
with
Values
Values
Beliefs
Thoughts
Actio
ns
Habits
Character
Destin
y
Th
e
“Wa
y”
we
do
bu
sine
ss
“PD
CA
”T
hin
kin
g&
Do
ing
Ma
rket
Ou
tcom
e
"You
acco
mp
lish v
ictory
step
by
step
, no
t by
lea
ps a
nd
bo
un
ds."
-Ly
n S
t. Jam
es
With
in th
is cultu
re yo
u
mu
st alw
ays e
xpla
in n
ot
on
ly th
e W
HA
T a
nd
HO
W, b
ut m
ost
imp
orta
ntly
the
WH
Y!
Ind
ivid
ua
ls with
in a
com
pa
ny
ne
ed
to
see
a ta
ng
ible
rew
ard
for th
eir g
oo
d
pro
cess/th
ink
ing
!
24
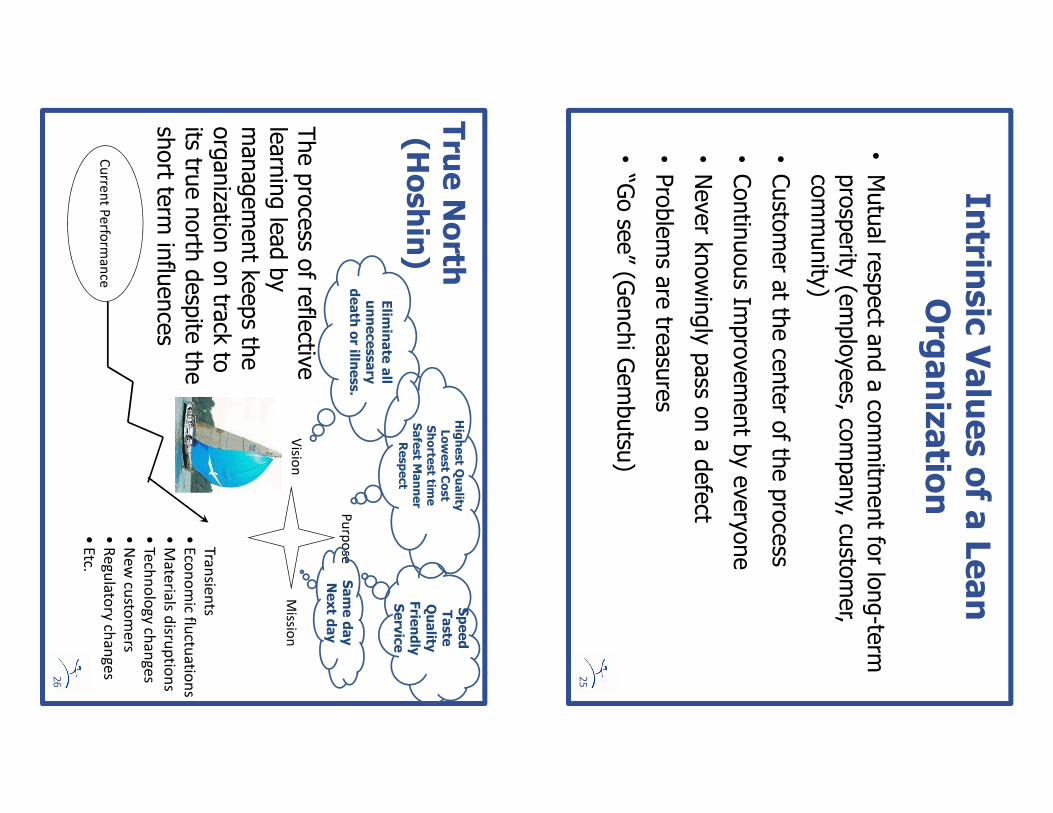
Intrin
sic Values of a
Lean
Organizatio
n
•Mutual respect anda commitment for long-term
prosperity (employees, co
mpany, cu
stomer,
community)
•Customer at the center of the process
•Continuous Im
provement by everyone
•Never knowingly pass o
n a defect
•Problems are treasures
•“Go see” (G
enchiGembutsu)
25
True North
(Hoshin)
Pu
rpo
se
Visio
nM
ission
Cu
rren
t Pe
rform
an
ce
The process o
f reflective
learning lead by
management keeps the
organization on track to
its true north despite the
short te
rm influences
Tran
sien
ts
•E
con
om
ic fluctu
atio
ns
•M
ate
rials d
isrup
tion
s
•Te
chn
olo
gy
cha
ng
es
•N
ew
custo
me
rs
•R
eg
ula
tory
cha
ng
es
•E
tc.
26
Highest Q
uality
Lowest C
ost
Shorte
st tim
eSafest M
anner
Respect
Speed
Taste
Quality
Frie
ndly
Service
Elim
inate all
unnecessary
death or illn
ess.
Same day
Next d
ay
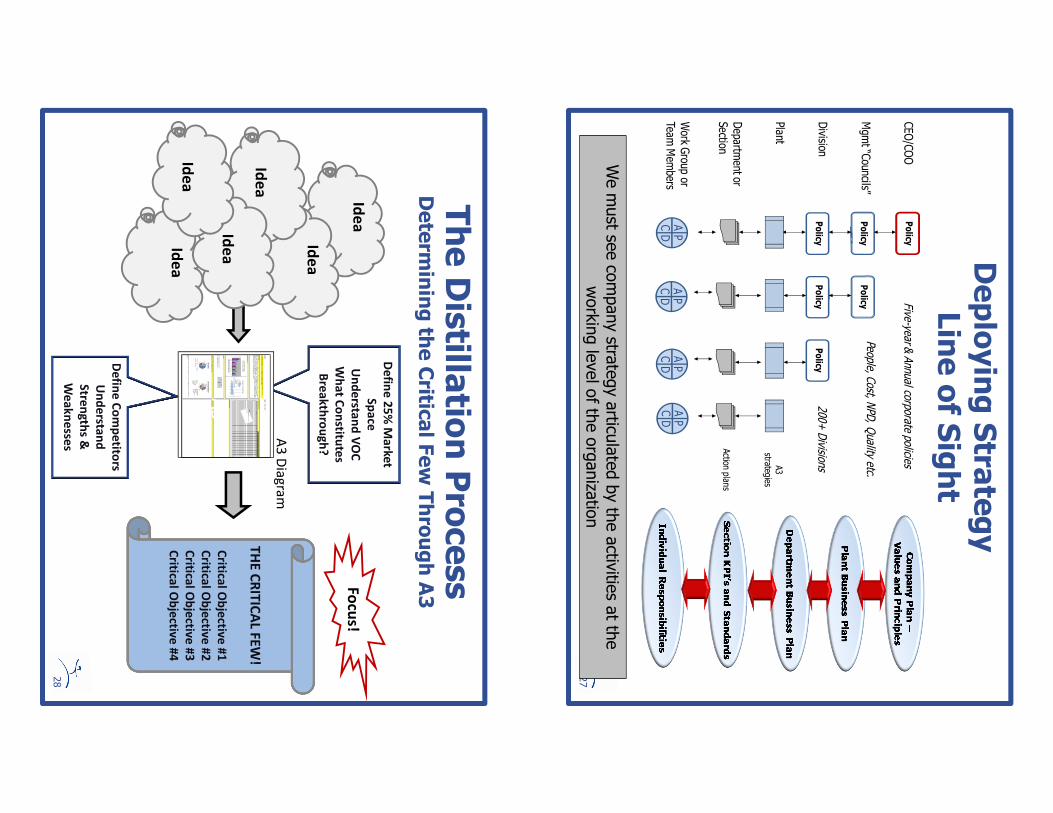
Deploying Stra
tegy
Line of S
ight
27
CEO/COO
Mgmt“Councils”
Division
Plant
Departm
ent or Section
Work G
roup or Team
Members
Policy
Policy
Policy
Policy
Policy
Policy
A3
strategies
Action
plans
Five-year & Annual corporate policies
People, Cost, NPD, Quality etc.
200+ Divisions
PDAC
PDAC
PDAC
PDAC
We must se
e company stra
tegy articu
lated by the activities at the
working level of the organization
The Distilla
tion Process
Determ
ining th
e Critic
al Few Through A3
De
fine
25
% M
arke
t
Sp
ace
Un
de
rstan
d V
OC
Wh
at C
on
stitute
s
Bre
ak
thro
ug
h?
De
fine
Co
mp
etito
rs
Un
de
rstan
d
Stre
ng
ths &
We
ak
ne
sses
TH
E C
RIT
ICA
L FE
W!
Critica
l Ob
jectiv
e #
1
Critica
l Ob
jectiv
e #
2
Critica
l Ob
jectiv
e #
3
Critica
l Ob
jectiv
e #
4Id
ea
Focu
s!
Ow
ner:D
ate:F
eb 12, 2009
123456789101112131415161718192021
a.R
educe # of I/B
status ca
lls by 35%
.
b.
Re
duce I/B w
ork content b
y 25%.
c.R
educe aban
donm
ent rate
by __%
.
Start
Targ
et
Wee
k of:
ED
M, p
ayme
nt and IS
O w
ork co
ntent redu
ction will be
pursued as p
art of the 60 day qua
lity "Blitz." S
ee relevant A
3 report
for detail.
6. Co
un
terme
asures
/Plan
7. Effec
ts C
on
firmation
8. Follo
w-u
p A
ction
2. Bac
kgro
und
1. Them
e: W
estboroug
h capacity is co
nstrained due
to season
al and w
eekly dem
and varia
tion a
nd the relate
d work
content. Inbound
status calls co
mp
rise a sig
nificant portion of to
tal claim w
ork content.
Expa
nsion from sing
le pilo
t cell to eig
ht additiona
l cells w
ithin Westb
orough
opera
tions (initial deploym
ent) was con
ducted
during O
ctober a
nd Nove
mb
er (pre
-Tha
nksgiving). P
ost-T
hanksgiving w
eather driven claim
volume, com
bined w
ith
seasonal F
TO
requirem
ents and le
arning curve
challenges, as w
ell as the ad
dition of F
NO
L dem
and (previously han
dled
with
in the
call centers) have
generated
capacity issues. T
he ove
rcapacity situation
has genera
ted increa
sed status calls th
us
further stra
inin
g resources and re
sultin
g in hig
h aband
onment ra
tes.
3. Cu
rrent C
on
dition
5. Ro
ot C
ause
An
alysis (In
bo
und
Statu
s Calls
)
4. Targe
t
Wh
oW
hat
I/B C
allers
51%
24%
14%
7%4%
Insured
ShopC
laimant
3P CarrierR
ental Co.
I/B Call Distrib
ution
19%
15%
14%12%
11%
6% 6% 5% 4% 4%4%
Other
App Sched/Resched
Pmt Info
Rental IssueLiab Decision
App Issues
Supplement
Status/Next Steps
Policy InfoSettlem
entFirst C
all
Daily D
em
and Variatio
n
& S
taffing Surp
lus/(Shortfall)
0
0.05
0.1
0.15
0.2
0.25
0.3
0.35
0.4
Mo
nday
Tue
sday
Wed
nesda
yT
hursda
yF
riday
% FN
OLs
% I/B
Status C
alls
Avera
ge Wo
rk Co
nte
nt/C
laim
05
1015
20
FNO
L
I/B
Outboun
d Calls
EXT In Calls
COA
Payments
EDM
's
ISO
@3.4 I/B
per FN
OL
Inclu
de:
DTP
, appraisal kaizen
, supp
lemen
ts
kaizen, e
tc.
A3
A3
Dia
gra
m
28
Ide
a
Ide
a
Ide
a
Ide
a
Ide
a
29
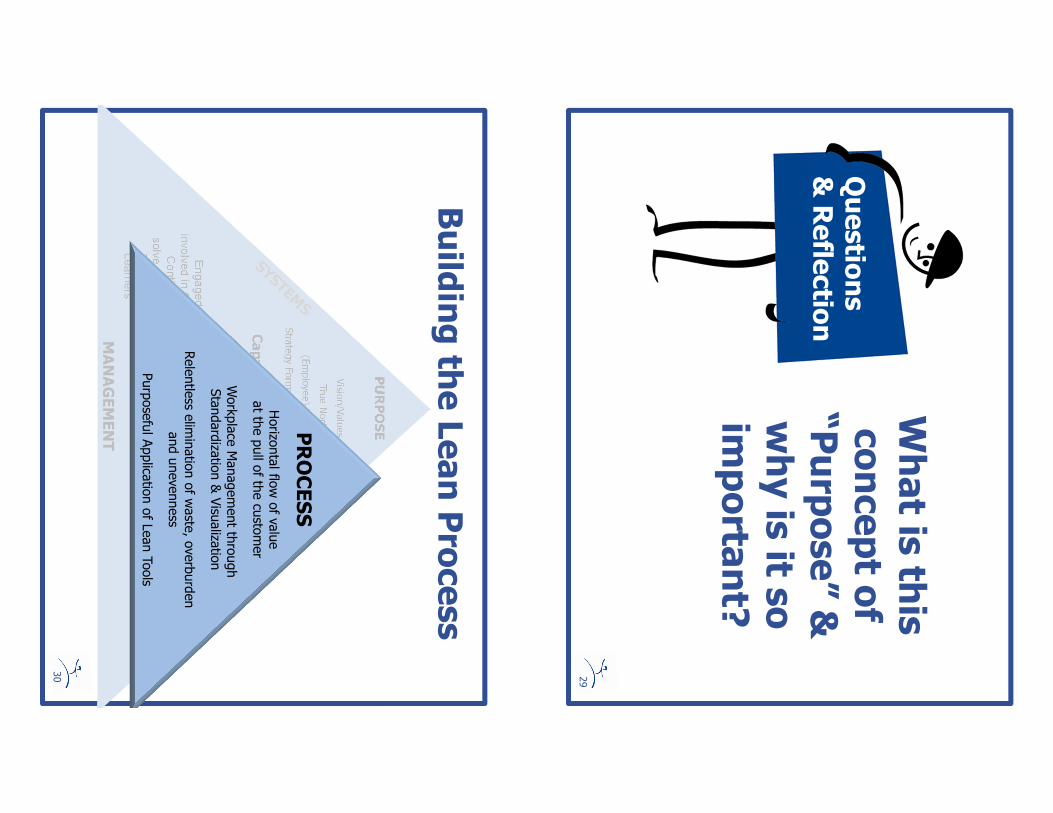
What is
this
concept o
f “Purpose” &
why is it s
o
importa
nt?
Questio
ns
& Refle
ctio
n
30
Build
ing th
e Lean Process
Capability
to ID
& Solve
Problems
PDCA Thinking
Engaged a
nd
involv
ed in
CI
Contin
uously
solv
e p
roble
ms
Team
work
Learn
ers
MANAGEMENT
PURPOSE
Vision/Values
True North
(Employee) Line of Sight
Strategy Formulation & deployment)
PROCESS
Horizontal flow of value
at the pull of the customer
Workplace Management through
Standardization & Visualization
Relentless e
limination of waste, overburden
and unevenness
Purposeful Application of Lean Tools
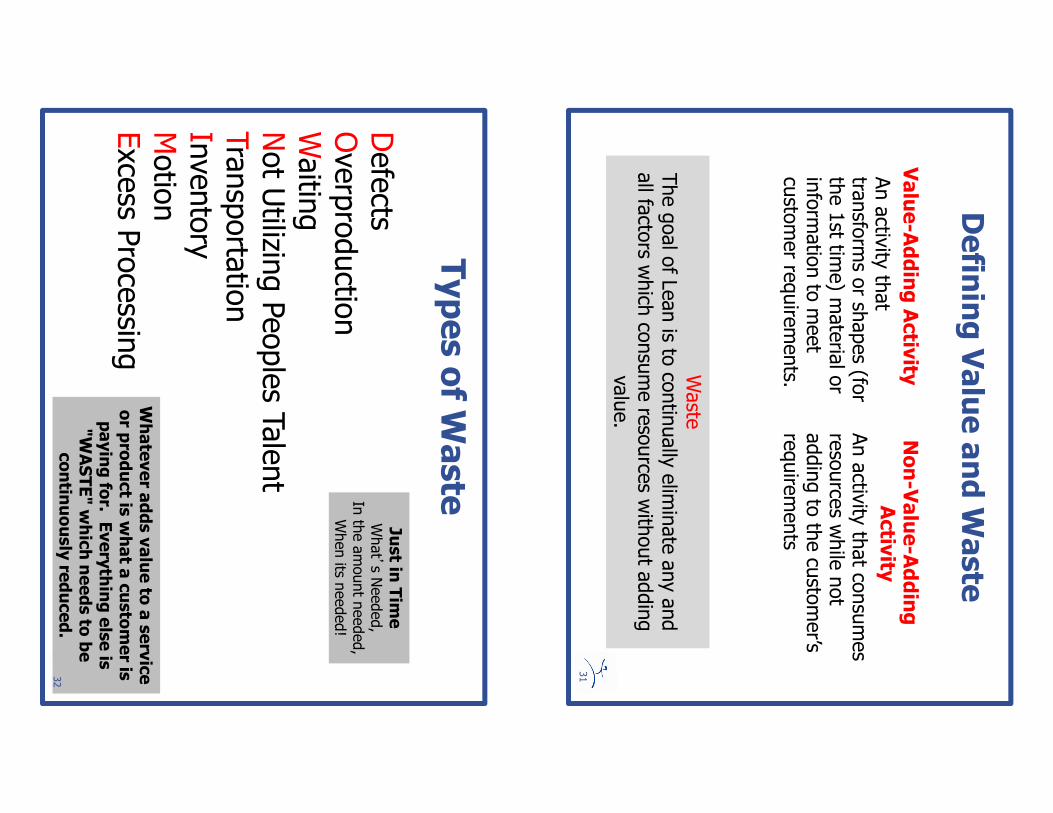
Defin
ing Value and W
aste
Value-Adding Activ
ity
An activity that
transforms or shapes (fo
r the 1st tim
e) material or
information to meet
customer requirements.
Non-Value-Adding
Activ
ity
An activity that consumes
resources while not
adding to the customer’s
requirements
Waste
The goal of Lean is to
continually eliminate any and
all factors w
hich consume resources without adding
value.
31
Types of W
aste
Defects
Overproduction
Waiting
NotUtilizin
g Peoples Ta
lent
Transportation
Inventory
Motion
ExcessProcessin
gWhatever a
dds value to
a service
or p
roduct is
what a
customer is
paying fo
r. Everything else is
"WASTE"which needs to
be
contin
uously re
duced.
Just in
Tim
eWhat’s Needed,
In the amount needed,
When its n
eeded!
32
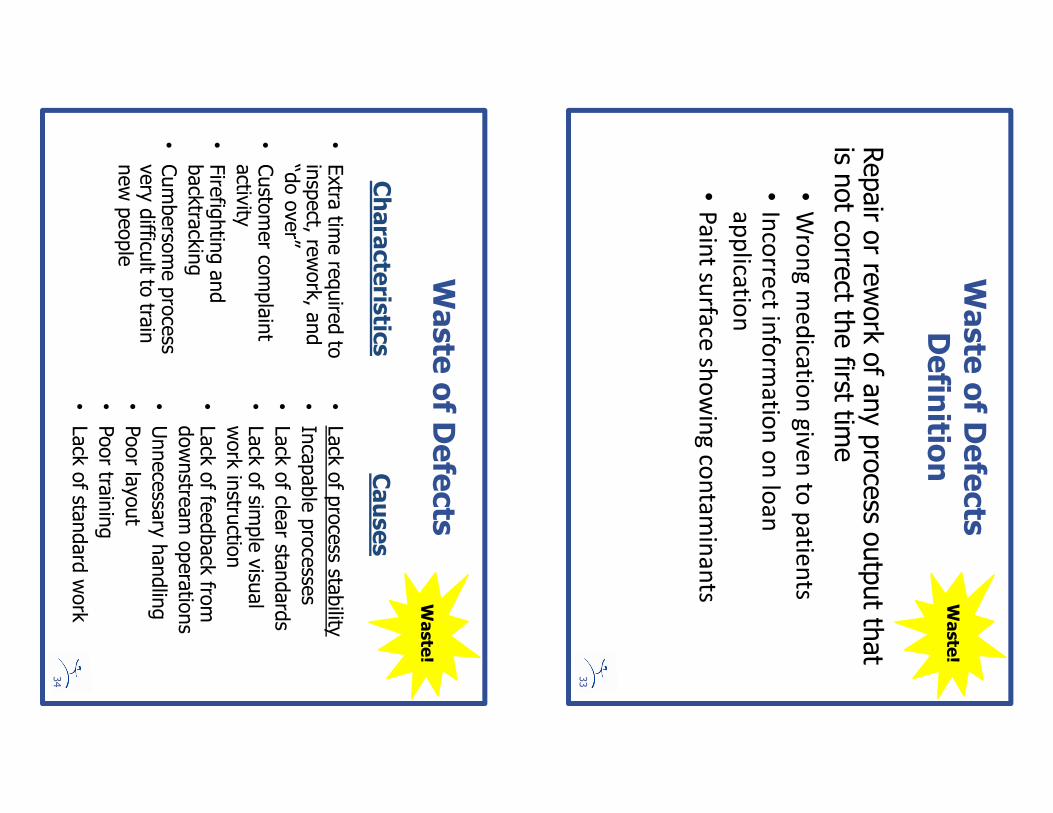
Waste of D
efects
Defin
ition
Repair or rework of any process o
utput that
is not correct th
e first tim
e
33
Waste!
•W
ron
g m
ed
icatio
n g
iven
to p
atie
nts
•In
corre
ct info
rma
tion
on
loa
n
ap
plica
tion
•P
ain
t surfa
ce sh
ow
ing
con
tam
ina
nts
Waste of D
efects
•Extra tim
e required to
inspect, re
work, and
“do over”
•Customer complaint
activity
•Firefighting and
backtracking
•Cumbersome process
very difficu
lt to train
new people
•Lack of process sta
bility
•Incapable processes
•Lack of cle
ar sta
ndards
•Lack of sim
ple visual
work instru
ction
•Lack of feedback from
downstream operations
•Unnecessary handling
•Poor layout
•Poor tra
ining
•Lack of sta
ndard work
Characteris
tics
Causes
34
Waste!
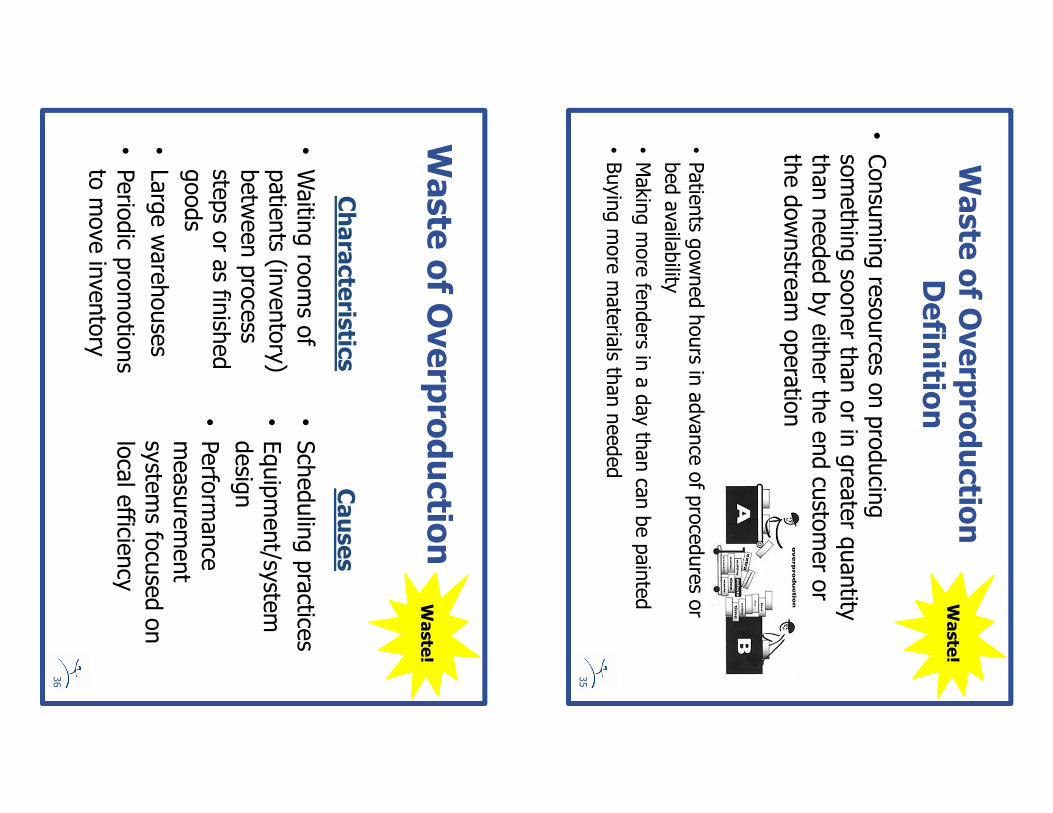
Waste of O
verproductio
nDefin
ition
•Consuming resources on producing
something sooner than or in greater quantity
than needed by either the end customer or
the downstream operation
35
Waste!
•Patients gowned hours in
advance of procedures or
bed availability
•Making more fenders in
a day than can be painted
•Buying more materials th
an needed
Waste of O
verproductio
n
•Waiting rooms of
patients (in
ventory)
between process
steps or as fin
ished
goods
•Large warehouses
•Periodic promotions
to move inventory
•Scheduling practice
s
•Equipment/system
design
•Performance
measurement
systems focused on
local efficie
ncy
Characteris
tics
Causes
36
Waste!
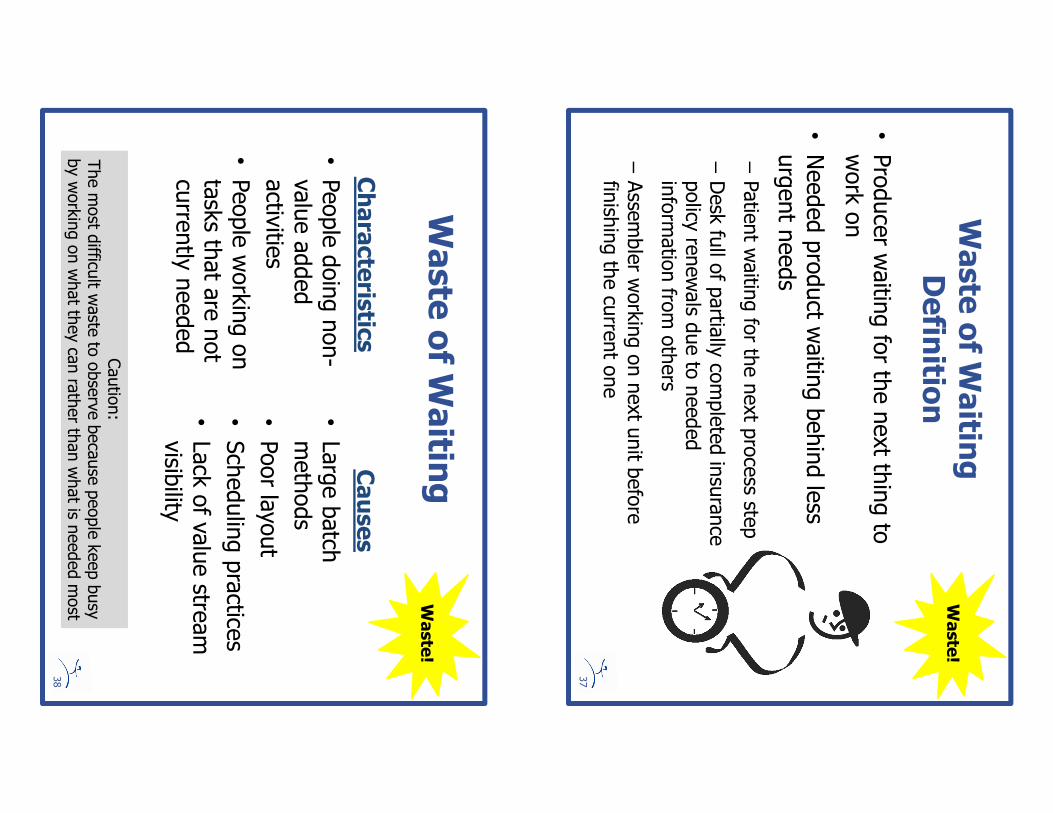
Waste of W
aitin
gDefin
ition
•Producer waiting for the next thing to
work on
•Needed product w
aiting behind less
urgent needs
–Patient waiting for the next process ste
p
–Desk full of partially completed insurance
policy renewals due to needed
information from others
–Assembler working on next unit before
finishing the current one
37
Waste!
Waste of W
aitin
g
•People doing non-
value added
activities
•People working on
tasks that are not
currently needed
•Large batch
methods
•Poor layout
•Scheduling practice
s
•Lack of value stre
am
visibility
Characteris
tics
Causes
Caution:
The most difficu
lt waste to observe because people keep busy
by working on what they can rather than what is n
eeded most
38
Waste!
Not U
tilizing Talent
Defin
ition
People not enabled to improve the value
stream because of lack of
–Visual work place
–Customer information
–Training
39
Waste!
Not U
tilizing Talent
•Lack of ongoing and recent
value stre
am improvements
that involve everyone
•Lack of awareness to
customer service levels
•Lack of awareness o
f waste
between process ste
ps
•Limited employee authority,
management command and
control
•Producers la
cking value
stream information
•Work stations iso
lated
from one another
•Lack of a visual work
place clearly
communicating value
stream performance
•Lack of sta
ndard work
•Poor tra
ining practice
s
•Sub optimized
performance
measurement systems
Characteris
tics
Causes
40
Waste!
Waste of T
ransporta
tion
Defin
ition
•Material movement between process ste
ps
that consume resources
–People
–Equipment
–Excess flo
or space
–Patients w
alking long distances between oncology
and radiology or ch
emotherapy
–Moving paper file
s from office
to office
–Moving parts to
a warehouse between operations
41
Waste!
Waste of T
ransporta
tion
•Parts m
oving from
process to
process
through “mass
transportation”
•Operations that can’t
see the final result due
to visual separation
•Excessive email
attachments, m
ultiple
hand-offs, m
ultiple
approvals
•Multiple staging
locations between steps
•Facility
layouts
•Workspace design
•Specialized Process
centers
•Sub optimized
performance
measurements
emphasizin
g local
efficie
ncy
•Scheduling practice
s
•Large batch processin
g
Characteris
tics
Causes
42
Waste!
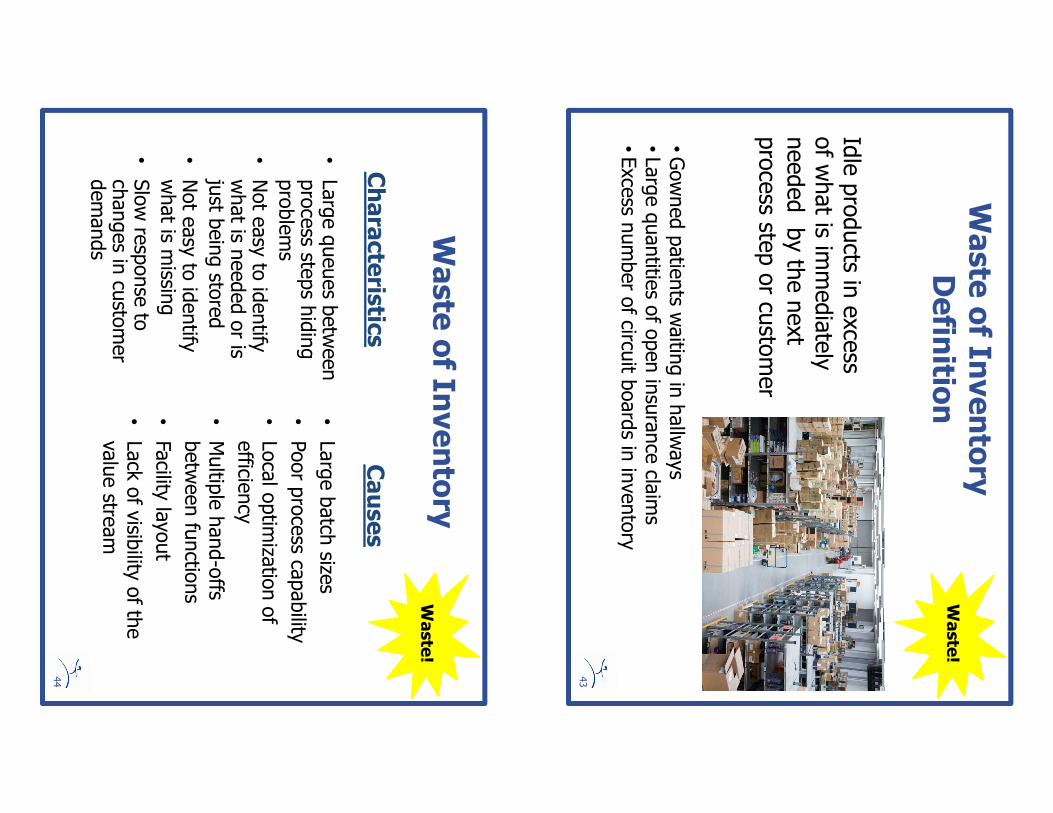
Waste of In
ventory
Defin
ition
Idle products in
excess
of what is im
mediately
needed by the next
process ste
p or cu
stomer
43
Waste!
•Gowned patients w
aiting in hallways
•Large quantities of open insurance claims
•Excess n
umber of circu
it boards in inventory
Waste of In
ventory
•Large queues between
process ste
ps hiding
problems
•Not easy to identify
what is n
eeded or is
just being stored
•Not easy to identify
what is m
issing
•Slow response to
changes in customer
demands
•Large batch size
s
•Poor process ca
pability
•Local optimization of
efficie
ncy
•Multiple hand-offs
between functions
•Facility
layout
•Lack of visibility of the
value stre
am
Characteris
tics
Causes
44
Waste!
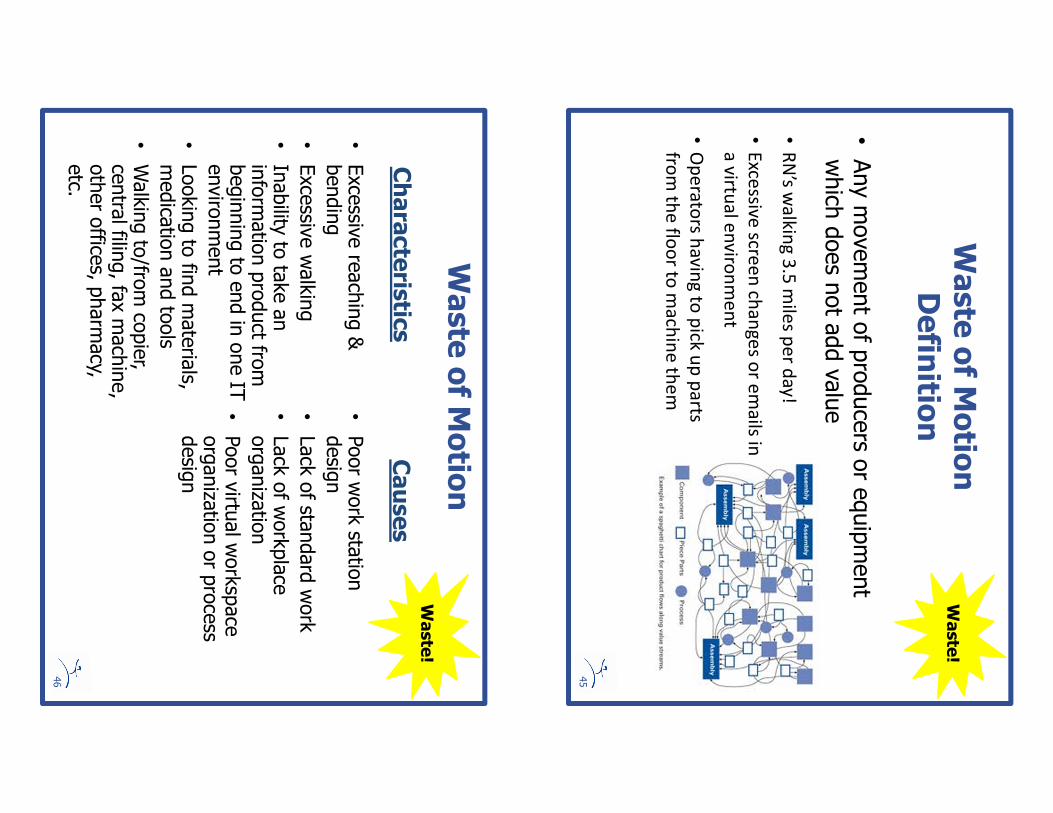
Waste of M
otio
nDefin
ition
•Any movement of producers or equipment
which does not add value
45
Waste!
•R
N’s w
alk
ing
3.5
mile
s pe
r da
y!
•E
xcessive
scree
n ch
an
ge
s or e
ma
ils in
a v
irtua
l en
viro
nm
en
t
•O
pe
rato
rs ha
vin
g to
pick
up
pa
rts
from
the
floo
r to m
ach
ine
the
m
Waste of M
otio
n
•Excessive reaching &
bending
•Excessive walking
•Inability to take an
information product fro
m
beginning to end in one IT
environment
•Looking to find materials,
medication and tools
•Walking to/from copier,
central filin
g, fax machine,
other office
s, pharmacy,
etc.
•Poor work station
design
•Lack of sta
ndard work
•Lack of workplace
organization
•Poor virtual workspace
organization or process
design
Characteris
tics
Causes
46
Waste!
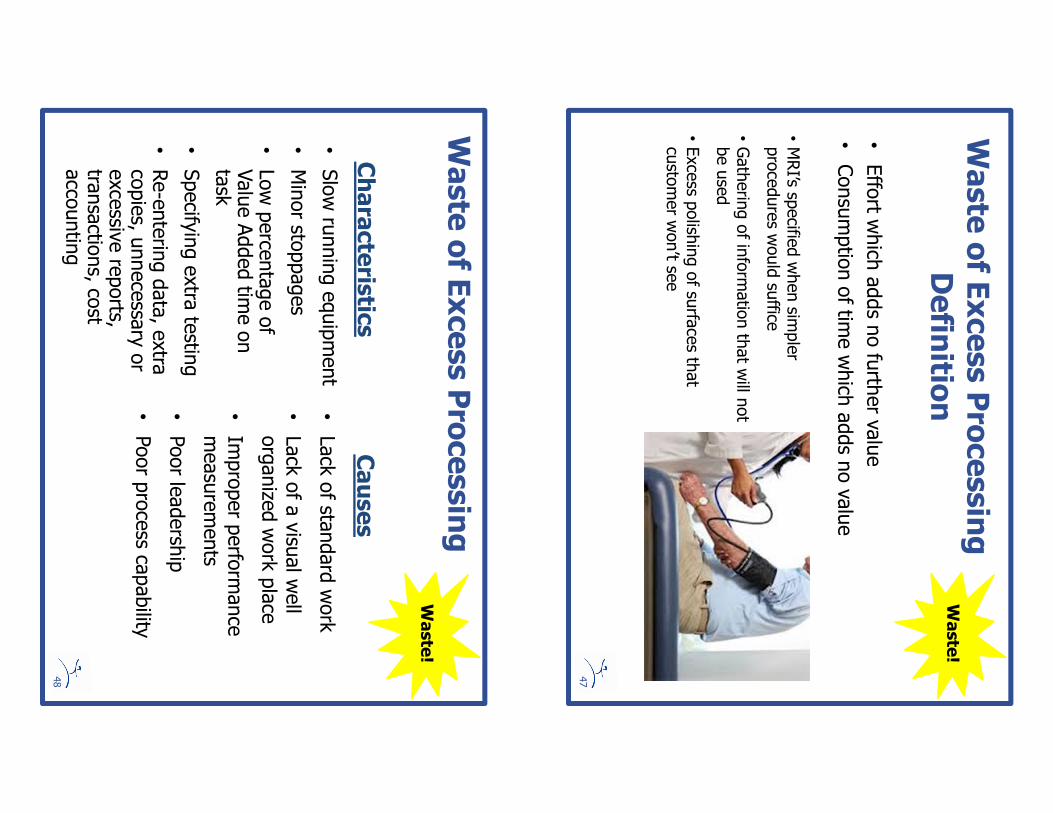
Waste of E
xcess Processing
Defin
ition
•Effort w
hich adds no further value
•Consumption of tim
e which adds no value
47
Waste!
•MRI’s sp
ecifie
d when sim
pler
procedures would suffice
•Gathering of information that will not
be used
•Excess p
olishing of surfaces that
customer won’t se
e
Waste of E
xcess Processing
•Slow running equipment
•Minor sto
ppages
•Low percentage of
Value Added tim
e on
task
•Specifying extra testing
•Re-entering data, extra
copies, unnecessary or
excessive reports,
transactions, co
st accounting
•Lack of sta
ndard work
•Lack of a visual well
organized work place
•Improper performance
measurements
•Poor leadership
•Poor process ca
pability
Characteris
tics
Causes
48
Waste!
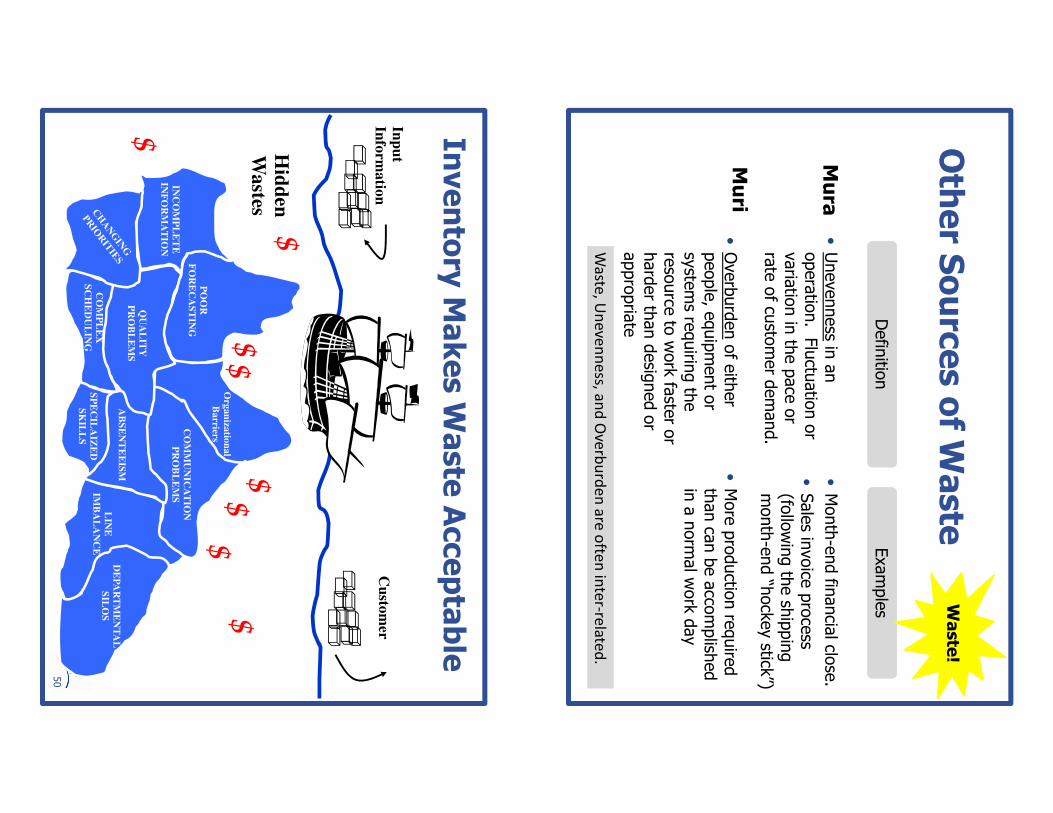
Other S
ources of W
aste
Mura
Definition
Definition
Examples
Examples
•Unevennessin an
operation. Fluctuation or
variation in the pace or
rate of customer demand.
•Overburdenof either
people, equipment or
systems requiring the
resource to work faster or
harder than designed or
appropriate
Muri
•More production required
than can be accomplished
in a normal work day
•Month-end financial clo
se.
•Sales invoice process
(following the shipping
month-end “hockey stick
”)
Wa
ste, U
ne
ven
ne
ss, an
d O
verb
urd
en
are
ofte
n in
ter-re
late
d.
Waste!
Inventory Makes W
aste Acceptable
Hid
den
Wastes
$$
$
$
$
Fin
ished
Pro
du
ctto
Cu
stom
er
$
$
$$
PO
OR
FO
RE
CA
ST
ING
CO
MM
UN
ICA
TIO
N
PR
OB
LE
MS
INC
OM
PL
ET
E
INF
OR
MA
TIO
N
QU
AL
ITY
PR
OB
LE
MS
CO
MP
LE
X
SC
HE
DU
LIN
G
AB
SE
NT
EE
ISM
SP
EC
ILA
IZE
D
SK
ILL
S
LIN
E
IMB
AL
AN
CE
DE
PA
RT
ME
NT
AL
SIL
OS
Org
an
izatio
na
l
Ba
rriers
Inp
ut
Info
rma
tion
50
51
What is
waste?
How do we
recognize it?
Why is th
is
concept
importa
nt?
Questio
ns
& Refle
ctio
nHomework
1.Refle
cton what youdo every day on your own job and identify
activities that youcarry out for each of the 8 wastes:
•Producing defects
•Overproductio
n
•Waitin
g
•Not u
tilizing others ta
lents
2. B
riefly
describ
e each of these wastes in your process a
nd email
your observations to me on Wednesday before the next webcast.
Also, we welcome your feedback that will help us im
prove this
online webcast!
Please send to your e-mails to
Joe.Murli@
TheMurligroup.com
52
•Transportin
g
product/inform
atio
n
•Creatin
g in
ventory
•Going th
rough excess m
otio
n
•Processing something m
ore
than should be necessary
Contin
ue Your L
earning on lean.org
After cla
ss, visit le
an.orgfor LEI’s p
ractica
l how-to resources:
•Learning Materials: b
ooks, w
orkbooks, le
ader guides, tra
ining materials
•Education: courses on tools, cu
lture change, coaching, leadership.
Join us for Public W
orkshops in Chicago, IL May 13-16, 2014
•Lean Health
care Transform
atio
n Summit –
Los Angeles, CA June
4-5, 2014
•Knowledge Center: Jo
hn Shook and Jim
Womack e-letters, w
ebinars,
case studies, fo
rums, tra
ining Road Map, and much more
•Connection Center: N
ow it’s e
asy to stay connected with your LEI
instru
ctor and other lean thinkers by joining our connection center on
lean.org.
See you next c
lass!