Embed Size (px)
Citation preview

IGHEM 2018, Beijing, China, September 10-13, 2018 Page 1
Onsite calibration of flow meters by ATT reference
with wetted transducers
Heming Hu1, Hang Cui1, Zhuo Yang2, Peter Gruber3
1National Institute of Metrology, Beijing, China;
2Beijing hydrological monitoring station, Beijing, China; 3pgconsult, Switzerland
E-mail: [email protected]
Abstract
South-to-North Water Diversion Project aims to channel billions of cubic meters of fresh water annually from the Yangtze
River in southern China to the more arid and industrialized north through canal systems. Water transfer billing from South-
to-North Company to local companies depends on flow rate measurements and they show considerable inconsistency. A
typical branch pipeline from the main channel to a water factory includes a sluice chamber, a short square closed fully
filled channel, a balance tank, and several kilometers of circular pipe with some valves and other pipe fittings. There are at
least three flowmeters installed: 2-path ultrasonic flowmeter on square channel owned by the South-to-North Company,
two or three magnetic or ultrasonic flowmeters on different positions of circular pipe by the local water transportation
company and water factory. More than ten percent of the water imbalance exists among those flowmeters. We have installed
8-path acoustic reference flowmeter with 16 wetted ultrasonic transducers on a circular tube and used state-of-the-art
techniques to make an accurate and traceable flowrate reference accepted by the three parties mutually. The installation
and data analysis of our reference flowmeter is described in detail, and troubleshooting of other flowmeters will be done
based on the reference flowrate.
1 Introduction
With the development of society and economy, water resources have been being strategically important in China. To
alleviate the mismatch of regional economic development and water resources distribution in China, a large amount of
studies, researches and projects were conducted and a series of great hydraulic projects, such as Three Gorges Project and
Inter-Basin Water Transfer Project, were finished.
The South-to-North Water Diversion Project is a multi-decade infrastructure mega-project in China. Ultimately it aims to
channel 44.8 billion cubic meters of fresh water annually from the Yangtze River in southern China to the more arid and
industrialized north through three canal systems. The central route runs from Danjiangkou Reservoir on the Han River, a
tributary of the Yangtze River, to Beijing and Tianjin. This project involved raising the height of the Danjiangkou dam by
increasing the dam crest elevation from 162 m to 176.6 m above the sea level. And this allowed the flow into the water
diversion canal to begin "downhill", pulled by gravity, to the lower elevation of the canals, without the need for pump
stations. The whole project was completed around 2014. Fig. 1 shows the headwork project and Yellow river crossing
project separately.
(a) headwork project (b) Yellow river crossing project
Fig. 1: Central route of South-to-North Water Transfer Project

IGHEM 2018, Beijing, China, September 10-13, 2018 Page 2
Flow rate is the base of the water resources adjusting and distribution, thus its accurate measuring was in great need,
especially in the situation that the most strict water management system was proposed and implemented in China. Besides,
as water fee is settled and paid according to the cumulative flow, therefore accurate flow rate measuring is in great need to
avoid unnecessary economic disputes.
There are many flowmeters installed for the South-to-North project. They belong to three different parties including the
main line company (water seller), the local branch company (water delivery) and the water factory who will do the water
treatment and supply water for every terminal user. A typical arrangement is shown in Fig. 2. From the main channel to
the right a closed fully filled pipe (often a square shaped channel Fig. 2c)) takes water out perpendicular to the canal flow
direction to the intermediate water tank. From there, water is pumped or flow by gravity in circular pipes (Fig 2d)) via the
water delivery company to the water factory to the right in the picture. Flow meters are installed at different locations
indicated by oval red signs with a cross. The diversion gate flow meter in the square shaped channel from the main canal
to the water tank, is usually a 1E2P (1 plane 2 paths) ATT flow meter, while the others are either MID or ATT flow meter.
The main line company installed more than 200 ATT flow meters. The main channel has intake gate facility which can
control flow rate and water level theoretically. In practice, the flow control is usually done by the pump station or the water
factory. The water velocity in the square shaped channels is very low, from 0.1m/s up to 1m/s, and it is one of the difficulties
of an accurate flow measurement there.
(a) Flowmeters in series for delivery branch line
(b) main channel (c) intake gate flowmeter (d) local branch flowmeters
Fig. 2: Flow measurement for a typical water delivery branch line
2 NIM reference
2.1 Laboratory test of NIM reference flowmeter
The reference ATT flow meter of NIM is a 8 path meter in 2 crossed planes. The uncertainty of the ATT method used for
large pipe flow measurement stems mainly from the fact, that there is: 1) not a high enough precision of the transit time
measurement, and uncorrected zero point especially for low velocity measurement; 2) not an accurate enough geometric
parameter measurement; 3) a flow field influence related to transducer protrusion / recession and not enough upstream /
downstream straight pipe length. To provide an accurate reference flow rate value, all above three points have to be dealt
with carefully. A FARO arm (Figure 3b) was used to get accurate geometric parameters, several experiments were carried
out to test the transducer protrusion effect using a gravimetric flow rate facility (Figure 3a).
IGHEM 2018, Beijing, China, September 10-13, 2018 Page 3
(a) large-diameter flowrate standard facility (b) geometrical measurement using FARO arm
Fig. 3: photos of laboratory test
The gravimetric method is used to get a reference flow rate, and the NIM ATT flow meter with a DN400 pipe is tested at
three different transducer positions. Figure 4 shows the differences of flow rate deviation at the three positions. It is clear
that the recessed position can provide a stable flow rate without influence of the velocity. So it was decided to use the
recessed positions as the best choice for the onsite installation positions of the transducers.
Fig. 4: flowrate bias at different probe installation positions (DN400)
To get an accurate correction factor for larger pipe, an experiment was conducted for a DN1000 pipe using the same
gravimetric facility. The result shows a stable bias of negative 1.6%. After the implementation of a correction factor of
1.016, the flow rate error of this DN1000 flow meter is in Figure 5. There are four circles for each velocity step, and we
calculate the standard deviation for each step. They are all smaller than 0.5%. We will use this corrector factor for the
onsite flow calibration because they have the similar pipe diameter.

IGHEM 2018, Beijing, China, September 10-13, 2018 Page 4
Fig 5: flowrate error after correction (DN1000)
2.2 Online calibration of local flowmeters
After the calibration of the flowmeter in the laboratory, the transducers used in the calibration are removed and taken
together with the signal processing unit to the field site. At the site, the positions of the transducers are marked first with
the help of strip cloth and a tape measure. Then the holes are drilled under filled pipe conditions, where it must be noted
that the water pressure is not very high. A kind of valve mechanism prevents the water to leak through the hole while
drilling. After the drilling is completed, the transducers are inserted in the prepared holes. The exact positions of the
transducer pills are then measured again by the FARO arm, and also the outer pipe points which are used to fit a cylinder.
The thickness of the pipe can be measured point by point by an ultrasonic thickness gauge. With all this information, all
the geometric parameters needed can precisely calculated, including path lengths, path angles, path heights and also the
inner diameter of the pipe. Then the transducers can be connected to the signal processing unit, and from the transit times
of every path, a reference value of the current flow rate in the pipe is obtained. Figure 6 shows the procedures in pictures.
Fig 6: Field work procedure (orientation / alignment / drilling with flow)
IGHEM 2018, Beijing, China, September 10-13, 2018 Page 5
3 Case 1: Delivery branch line with ATT 2-path/ MID/MID meters in series
3.1 History
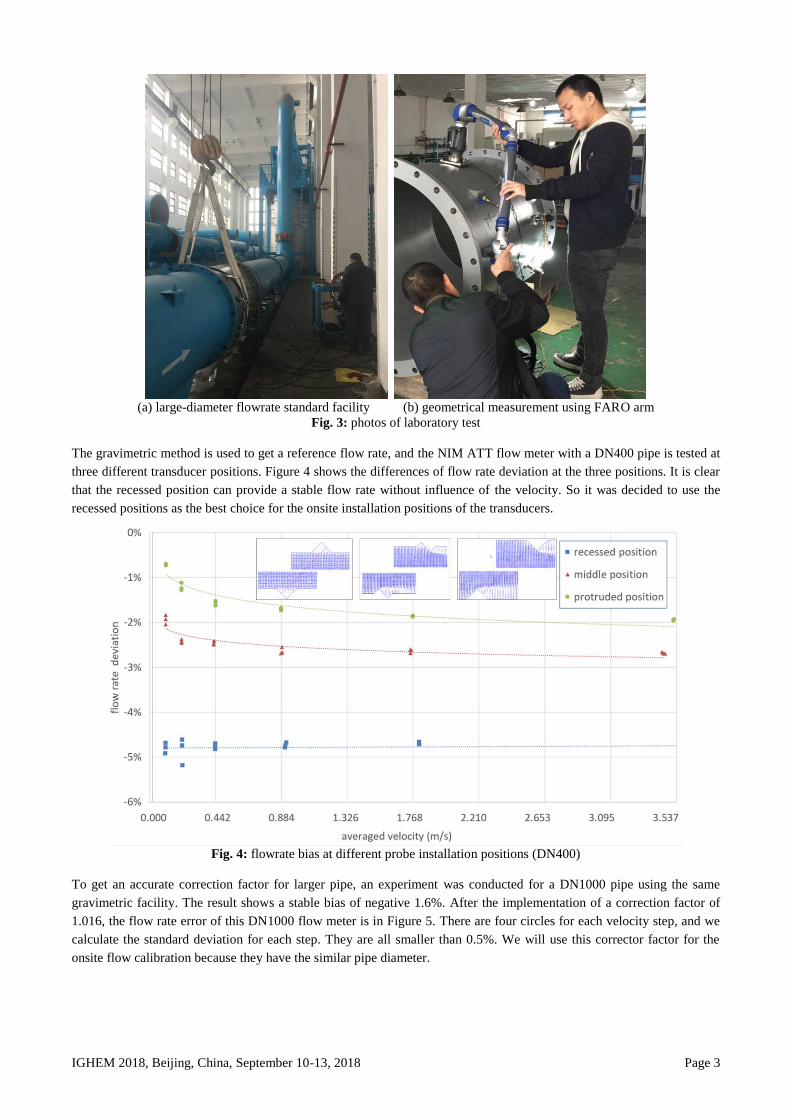
The first case considers a delivery branch similar to the one shown in Figure 2: a square fully filled channel equipped with
ATT 2-path in one plane flow meter of the water seller (intake gate), followed by an MID flow meter of the water delivery
company after the tank (pipeline) and finally another MID flow meter of the water factory. Historical data of the flow
readings of all instruments were available at a monthly rate (see Figure 7).
Fig. 7: monthly accumulative flow
It can be seen, that the ATT meter at the intake gate has a deviation of around 20% compared to the other two MID meters.
The parties involved in the billing of the water quantities were not satisfied with his situations and asked therefore a third
party (NIM) to carry out a reference measurement. The regular flow rate is about 0.7 m3/s, so the flow velocity is 0.35 m/s
in the square pipe with a dimension of 1.4m*1.4m and 0.62 m/s in the circular pipe with a diameter of 1.2 m. low velocity
should be one of the reasons for bad performance of the three flowmeters.
3.2 Comparison with the reference measurements
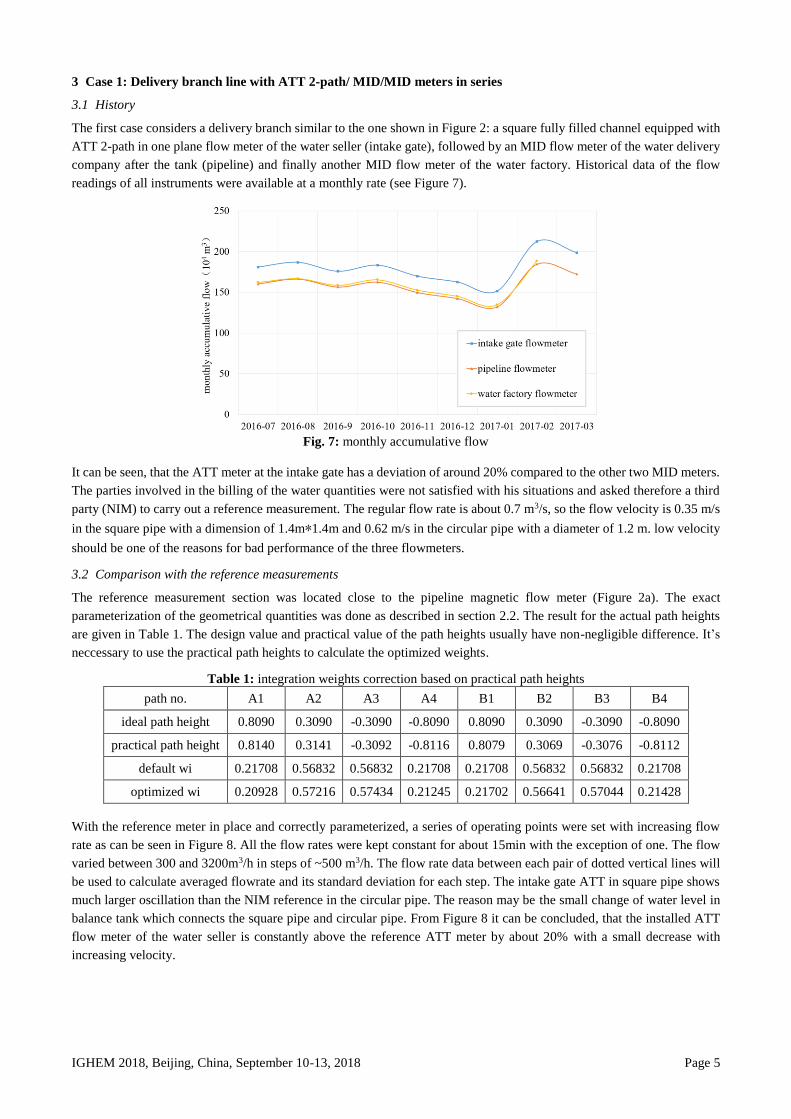
The reference measurement section was located close to the pipeline magnetic flow meter (Figure 2a). The exact
parameterization of the geometrical quantities was done as described in section 2.2. The result for the actual path heights
are given in Table 1. The design value and practical value of the path heights usually have non-negligible difference. It’s
neccessary to use the practical path heights to calculate the optimized weights.
Table 1: integration weights correction based on practical path heights
path no. A1 A2 A3 A4 B1 B2 B3 B4
ideal path height 0.8090 0.3090 -0.3090 -0.8090 0.8090 0.3090 -0.3090 -0.8090
practical path height 0.8140 0.3141 -0.3092 -0.8116 0.8079 0.3069 -0.3076 -0.8112
default wi 0.21708 0.56832 0.56832 0.21708 0.21708 0.56832 0.56832 0.21708
optimized wi 0.20928 0.57216 0.57434 0.21245 0.21702 0.56641 0.57044 0.21428
With the reference meter in place and correctly parameterized, a series of operating points were set with increasing flow
rate as can be seen in Figure 8. All the flow rates were kept constant for about 15min with the exception of one. The flow
varied between 300 and 3200m3/h in steps of ~500 m3/h. The flow rate data between each pair of dotted vertical lines will
be used to calculate averaged flowrate and its standard deviation for each step. The intake gate ATT in square pipe shows
much larger oscillation than the NIM reference in the circular pipe. The reason may be the small change of water level in
balance tank which connects the square pipe and circular pipe. From Figure 8 it can be concluded, that the installed ATT
flow meter of the water seller is constantly above the reference ATT meter by about 20% with a small decrease with
increasing velocity.
IGHEM 2018, Beijing, China, September 10-13, 2018 Page 6
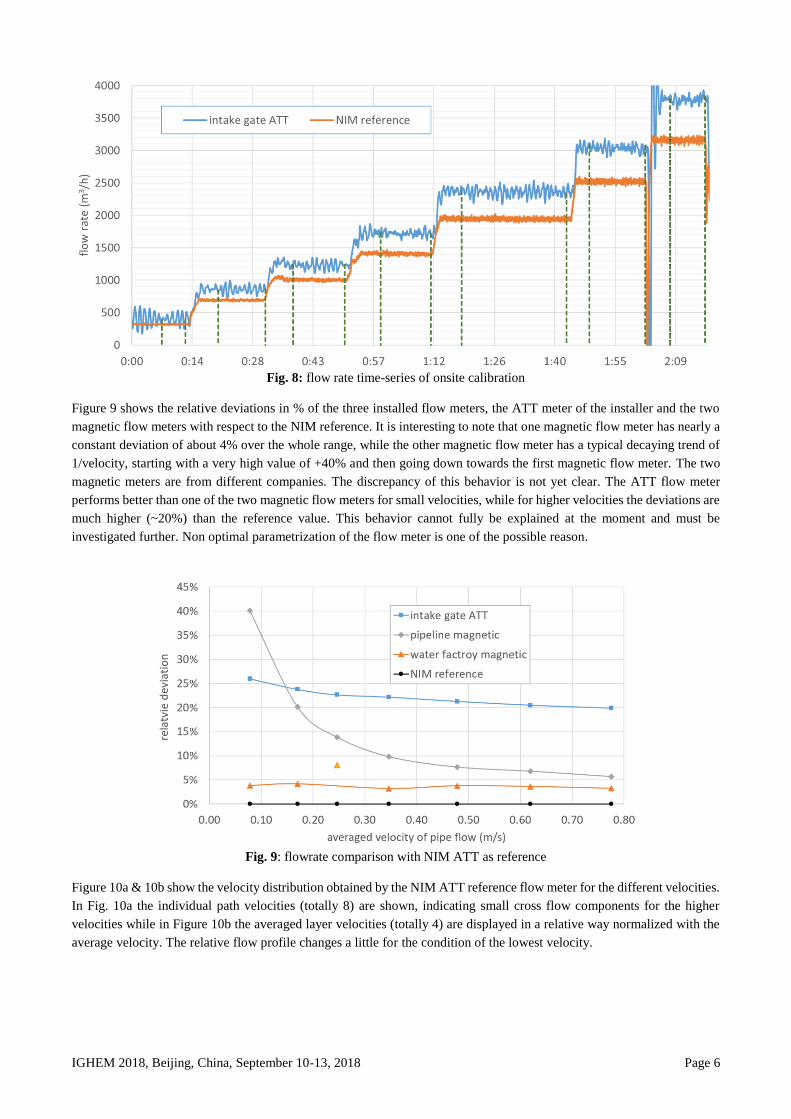
Fig. 8: flow rate time-series of onsite calibration
Figure 9 shows the relative deviations in % of the three installed flow meters, the ATT meter of the installer and the two
magnetic flow meters with respect to the NIM reference. It is interesting to note that one magnetic flow meter has nearly a
constant deviation of about 4% over the whole range, while the other magnetic flow meter has a typical decaying trend of
1/velocity, starting with a very high value of +40% and then going down towards the first magnetic flow meter. The two
magnetic meters are from different companies. The discrepancy of this behavior is not yet clear. The ATT flow meter
performs better than one of the two magnetic flow meters for small velocities, while for higher velocities the deviations are
much higher (~20%) than the reference value. This behavior cannot fully be explained at the moment and must be
investigated further. Non optimal parametrization of the flow meter is one of the possible reason.
Fig. 9: flowrate comparison with NIM ATT as reference
Figure 10a & 10b show the velocity distribution obtained by the NIM ATT reference flow meter for the different velocities.
In Fig. 10a the individual path velocities (totally 8) are shown, indicating small cross flow components for the higher
velocities while in Figure 10b the averaged layer velocities (totally 4) are displayed in a relative way normalized with the
average velocity. The relative flow profile changes a little for the condition of the lowest velocity.

IGHEM 2018, Beijing, China, September 10-13, 2018 Page 7
(a) absolute velocity profile
(b) relative velocity profile
Fig. 10: velocity profile of NIM ATT
4 Case 2: Delivery branch line with ATT 2-path/ MID/ATT 1-path meters in series
4.1 History
The second case deals with a similar situation as the first one. The difference from the flow measuring point of view is the
1E1P ATT flow meter of the water factory. The detailed installation is shown in Figure 11. From the main canal the
delivery branch square shaped channel leads to the water tank. At the entrance to the delivery channel there are a
maintenance gate and a control gate, which is in normal operation at 60% open. Before the water enters the water tank
there is a trash rack, which has additionally a fine mesh reducing sand deposits in the tank (see Figure 12). The deposits
stick however to the mesh and get also deposited near the trash rack. The trash rack itself is located only a short distance
down-stream of the 1E2P ATT flow meter. The locations of the MID, the reference flow meter of NIM and the 1E1P ATT
meter can be read out from Figure 11. All three meters are downstream of the tank, while the ATT 1E2P meter is upstream
of the tank. The influence of the tank is considered to be small, as in steady state the height of canal and tank are nearly
identical. Unfortunately, the water level measurement of tank and canal were not available at the time of the investigation.
The velocity covers a small range of values from around 0.15m/s to 0.35m/s, that means really small flow rates. The pump
station was put into operation in 2016 and in 2017 complaints from the companies were reported that the meters are drifting
away, especially the 1E2P ATT flow meter.
Fig. 11: flow meter installation sketch diagram, side view
IGHEM 2018, Beijing, China, September 10-13, 2018 Page 8
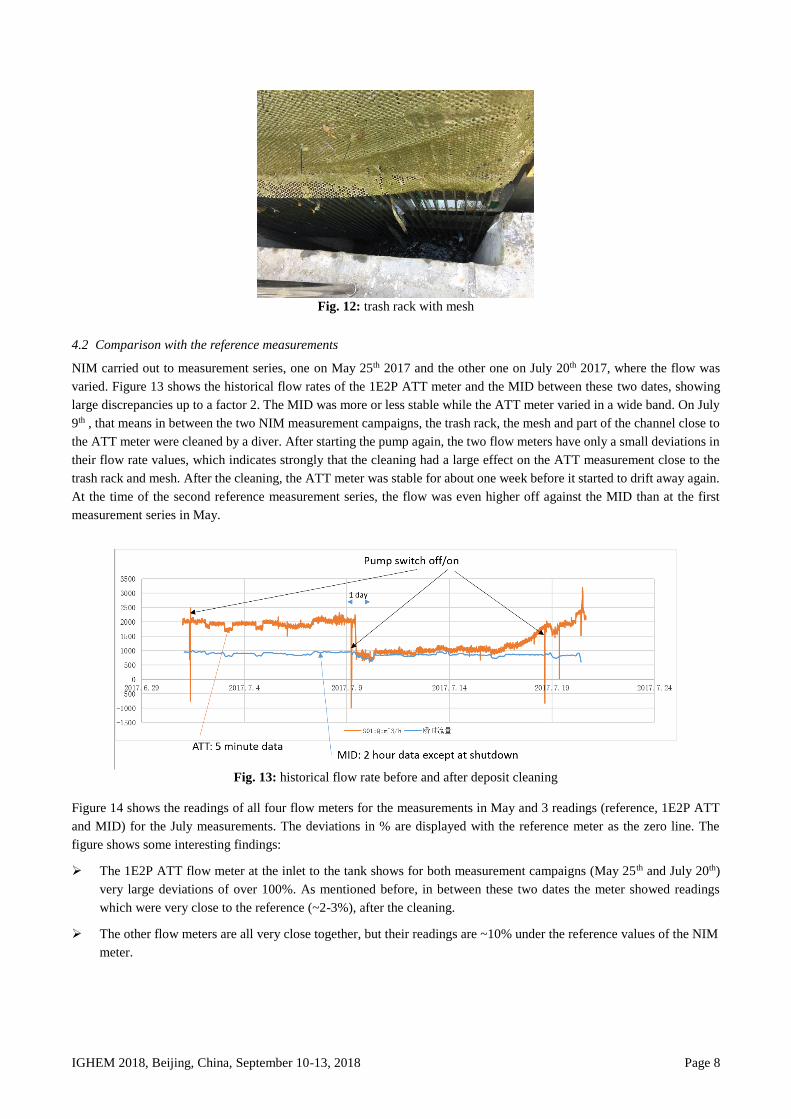
Fig. 12: trash rack with mesh
4.2 Comparison with the reference measurements
NIM carried out to measurement series, one on May 25th 2017 and the other one on July 20th 2017, where the flow was
varied. Figure 13 shows the historical flow rates of the 1E2P ATT meter and the MID between these two dates, showing
large discrepancies up to a factor 2. The MID was more or less stable while the ATT meter varied in a wide band. On July
9th , that means in between the two NIM measurement campaigns, the trash rack, the mesh and part of the channel close to
the ATT meter were cleaned by a diver. After starting the pump again, the two flow meters have only a small deviations in
their flow rate values, which indicates strongly that the cleaning had a large effect on the ATT measurement close to the
trash rack and mesh. After the cleaning, the ATT meter was stable for about one week before it started to drift away again.
At the time of the second reference measurement series, the flow was even higher off against the MID than at the first
measurement series in May.
Fig. 13: historical flow rate before and after deposit cleaning
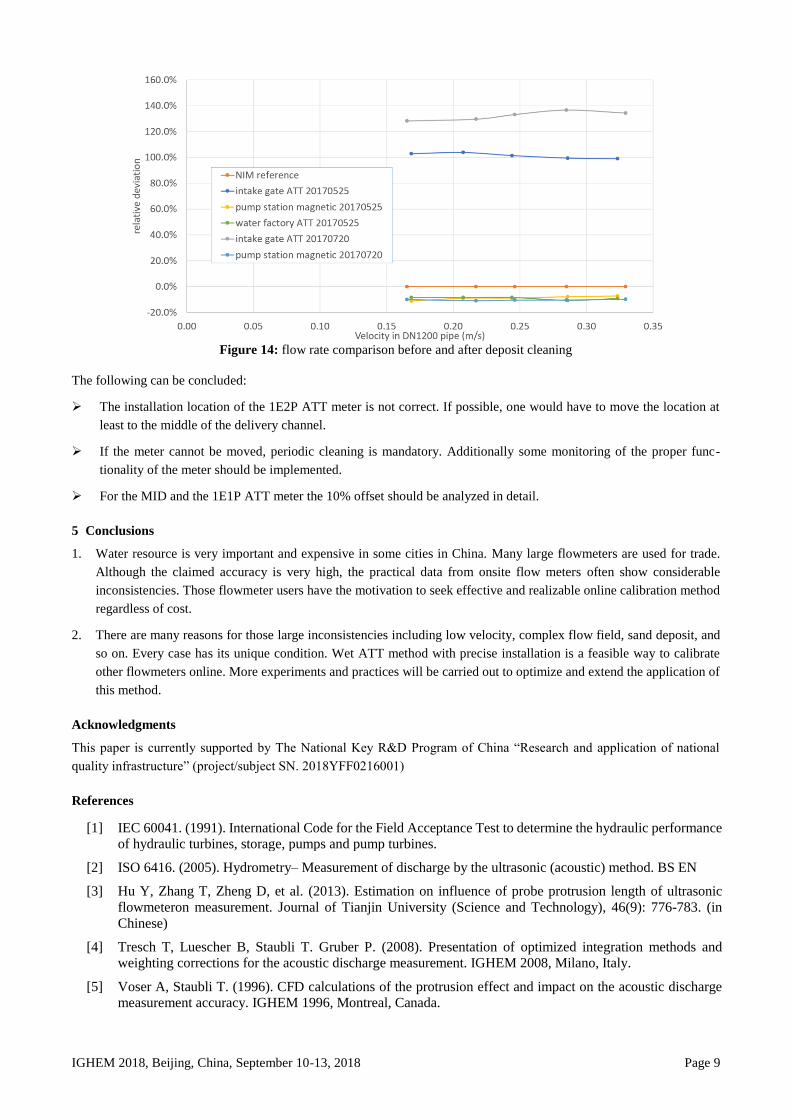
Figure 14 shows the readings of all four flow meters for the measurements in May and 3 readings (reference, 1E2P ATT
and MID) for the July measurements. The deviations in % are displayed with the reference meter as the zero line. The
figure shows some interesting findings:
The 1E2P ATT flow meter at the inlet to the tank shows for both measurement campaigns (May 25th and July 20th)
very large deviations of over 100%. As mentioned before, in between these two dates the meter showed readings
which were very close to the reference (~2-3%), after the cleaning.
The other flow meters are all very close together, but their readings are ~10% under the reference values of the NIM
meter.
IGHEM 2018, Beijing, China, September 10-13, 2018 Page 9
Figure 14: flow rate comparison before and after deposit cleaning
The following can be concluded:
The installation location of the 1E2P ATT meter is not correct. If possible, one would have to move the location at
least to the middle of the delivery channel.
If the meter cannot be moved, periodic cleaning is mandatory. Additionally some monitoring of the proper func-
tionality of the meter should be implemented.
For the MID and the 1E1P ATT meter the 10% offset should be analyzed in detail.
5 Conclusions
1. Water resource is very important and expensive in some cities in China. Many large flowmeters are used for trade.
Although the claimed accuracy is very high, the practical data from onsite flow meters often show considerable
inconsistencies. Those flowmeter users have the motivation to seek effective and realizable online calibration method
regardless of cost.
2. There are many reasons for those large inconsistencies including low velocity, complex flow field, sand deposit, and
so on. Every case has its unique condition. Wet ATT method with precise installation is a feasible way to calibrate
other flowmeters online. More experiments and practices will be carried out to optimize and extend the application of
this method.
Acknowledgments
This paper is currently supported by The National Key R&D Program of China “Research and application of national
quality infrastructure” (project/subject SN. 2018YFF0216001)
References
[1] IEC 60041. (1991). International Code for the Field Acceptance Test to determine the hydraulic performance
of hydraulic turbines, storage, pumps and pump turbines.
[2] ISO 6416. (2005). Hydrometry– Measurement of discharge by the ultrasonic (acoustic) method. BS EN
[3] Hu Y, Zhang T, Zheng D, et al. (2013). Estimation on influence of probe protrusion length of ultrasonic
flowmeteron measurement. Journal of Tianjin University (Science and Technology), 46(9): 776-783. (in
Chinese)
[4] Tresch T, Luescher B, Staubli T. Gruber P. (2008). Presentation of optimized integration methods and
weighting corrections for the acoustic discharge measurement. IGHEM 2008, Milano, Italy.
[5] Voser A, Staubli T. (1996). CFD calculations of the protrusion effect and impact on the acoustic discharge
measurement accuracy. IGHEM 1996, Montreal, Canada.