Embed Size (px)
Citation preview
Ontario Sheep Economic Workbook Annual Spring Lambing Flock
Ontario Sheep Marketing Agency 2012 09 30 version

2
3
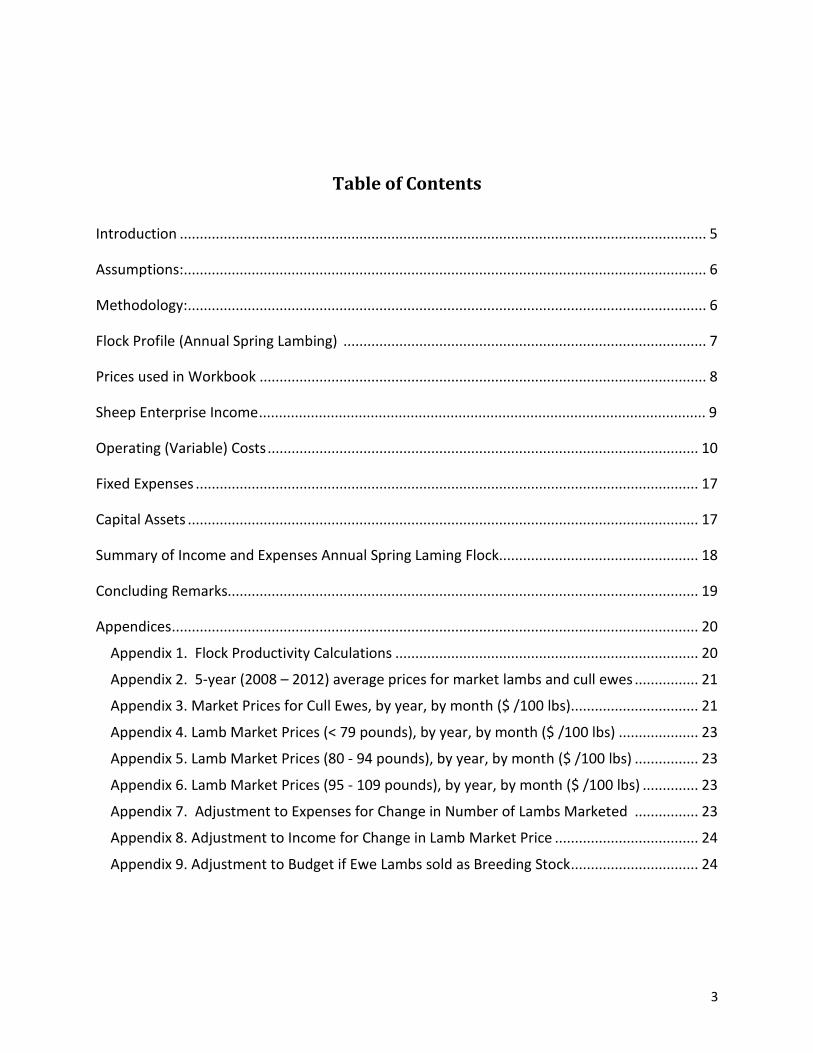
Table of Contents
Introduction .................................................................................................................................... 5
Assumptions: ................................................................................................................................... 6
Methodology: .................................................................................................................................. 6
Flock Profile (Annual Spring Lambing) ........................................................................................... 7
Prices used in Workbook ................................................................................................................ 8
Sheep Enterprise Income ................................................................................................................ 9
Operating (Variable) Costs ............................................................................................................ 10
Fixed Expenses .............................................................................................................................. 17
Capital Assets ................................................................................................................................ 17
Summary of Income and Expenses Annual Spring Laming Flock .................................................. 18
Concluding Remarks...................................................................................................................... 19
Appendices .................................................................................................................................... 20
Appendix 1. Flock Productivity Calculations ............................................................................ 20
Appendix 2. 5-year (2008 – 2012) average prices for market lambs and cull ewes ................ 21
Appendix 3. Market Prices for Cull Ewes, by year, by month ($ /100 lbs)................................ 21
Appendix 4. Lamb Market Prices (< 79 pounds), by year, by month ($ /100 lbs) .................... 23
Appendix 5. Lamb Market Prices (80 - 94 pounds), by year, by month ($ /100 lbs) ................ 23
Appendix 6. Lamb Market Prices (95 - 109 pounds), by year, by month ($ /100 lbs) .............. 23
Appendix 7. Adjustment to Expenses for Change in Number of Lambs Marketed ................ 23
Appendix 8. Adjustment to Income for Change in Lamb Market Price .................................... 24
Appendix 9. Adjustment to Budget if Ewe Lambs sold as Breeding Stock................................ 24

4
5
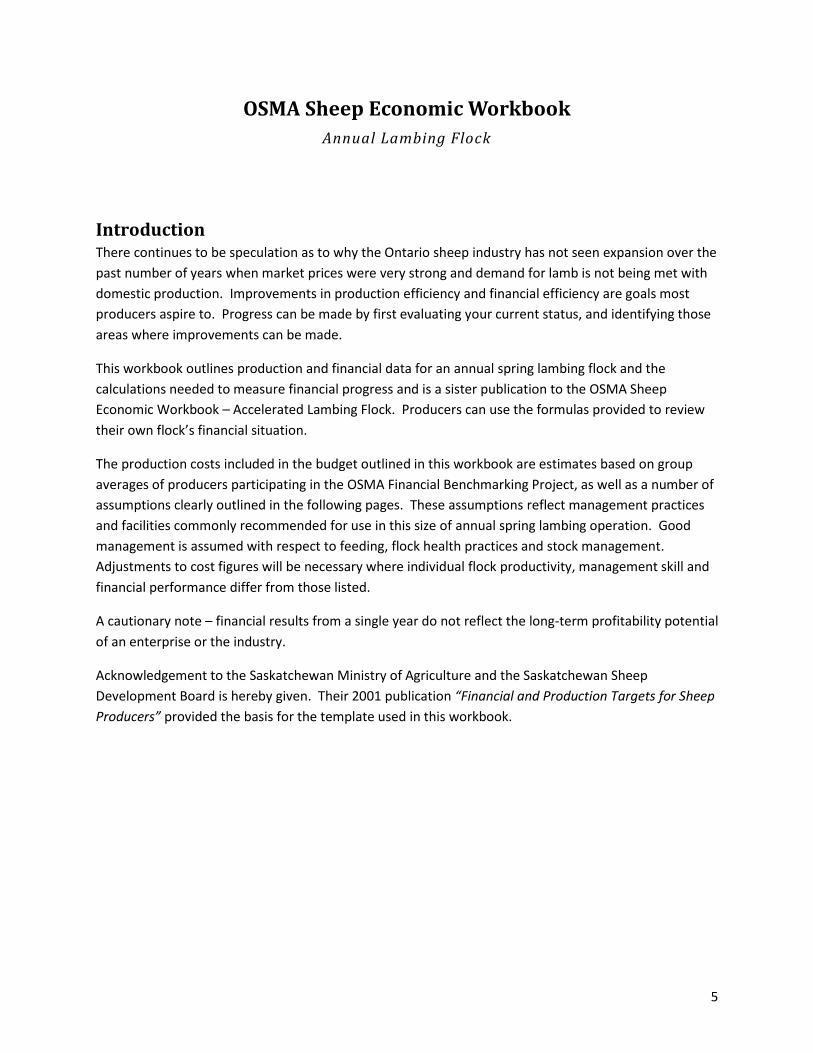
OSMA Sheep Economic Workbook
Annual Lambing Flock
Introduction There continues to be speculation as to why the Ontario sheep industry has not seen expansion over the
past number of years when market prices were very strong and demand for lamb is not being met with
domestic production. Improvements in production efficiency and financial efficiency are goals most
producers aspire to. Progress can be made by first evaluating your current status, and identifying those
areas where improvements can be made.
This workbook outlines production and financial data for an annual spring lambing flock and the
calculations needed to measure financial progress and is a sister publication to the OSMA Sheep
Economic Workbook – Accelerated Lambing Flock. Producers can use the formulas provided to review
their own flock’s financial situation.
The production costs included in the budget outlined in this workbook are estimates based on group
averages of producers participating in the OSMA Financial Benchmarking Project, as well as a number of
assumptions clearly outlined in the following pages. These assumptions reflect management practices
and facilities commonly recommended for use in this size of annual spring lambing operation. Good
management is assumed with respect to feeding, flock health practices and stock management.
Adjustments to cost figures will be necessary where individual flock productivity, management skill and
financial performance differ from those listed.
A cautionary note – financial results from a single year do not reflect the long-term profitability potential
of an enterprise or the industry.
Acknowledgement to the Saskatchewan Ministry of Agriculture and the Saskatchewan Sheep
Development Board is hereby given. Their 2001 publication “Financial and Production Targets for Sheep
Producers” provided the basis for the template used in this workbook.
6
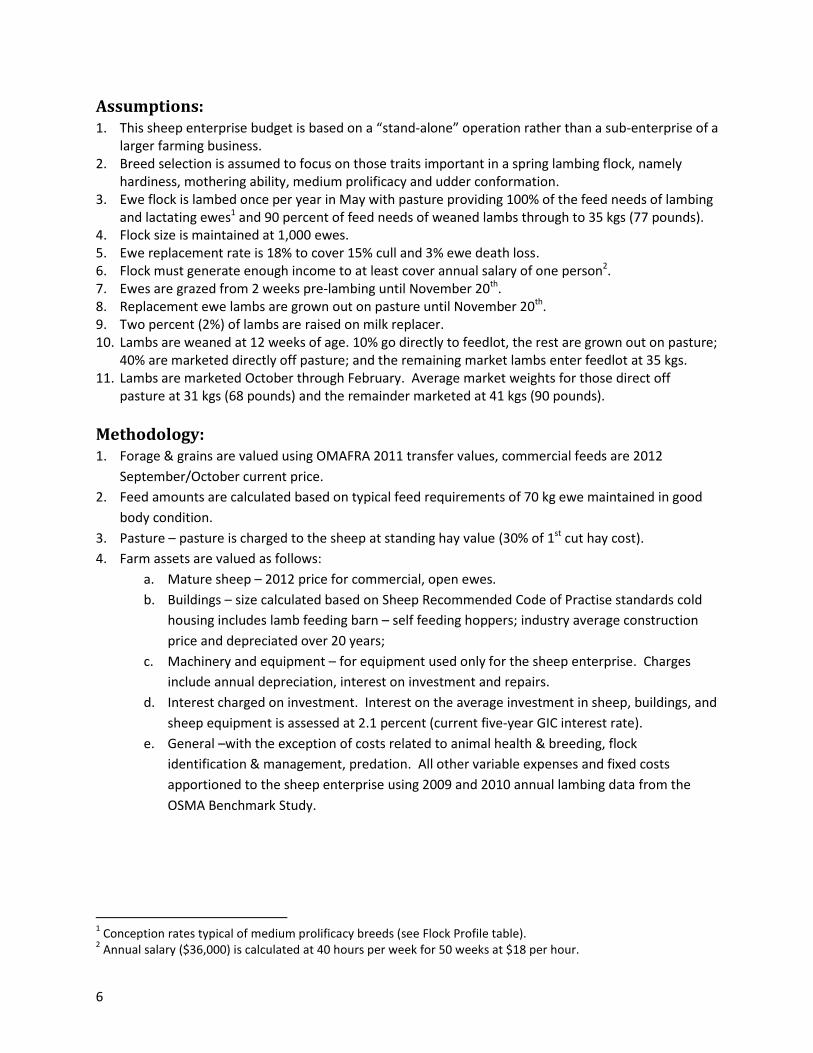
Assumptions: 1. This sheep enterprise budget is based on a “stand-alone” operation rather than a sub-enterprise of a
larger farming business. 2. Breed selection is assumed to focus on those traits important in a spring lambing flock, namely
hardiness, mothering ability, medium prolificacy and udder conformation. 3. Ewe flock is lambed once per year in May with pasture providing 100% of the feed needs of lambing
and lactating ewes1 and 90 percent of feed needs of weaned lambs through to 35 kgs (77 pounds). 4. Flock size is maintained at 1,000 ewes. 5. Ewe replacement rate is 18% to cover 15% cull and 3% ewe death loss. 6. Flock must generate enough income to at least cover annual salary of one person2. 7. Ewes are grazed from 2 weeks pre-lambing until November 20th. 8. Replacement ewe lambs are grown out on pasture until November 20th. 9. Two percent (2%) of lambs are raised on milk replacer. 10. Lambs are weaned at 12 weeks of age. 10% go directly to feedlot, the rest are grown out on pasture;
40% are marketed directly off pasture; and the remaining market lambs enter feedlot at 35 kgs. 11. Lambs are marketed October through February. Average market weights for those direct off
pasture at 31 kgs (68 pounds) and the remainder marketed at 41 kgs (90 pounds).
Methodology: 1. Forage & grains are valued using OMAFRA 2011 transfer values, commercial feeds are 2012
September/October current price.
2. Feed amounts are calculated based on typical feed requirements of 70 kg ewe maintained in good
body condition.
3. Pasture – pasture is charged to the sheep at standing hay value (30% of 1st cut hay cost).
4. Farm assets are valued as follows:
a. Mature sheep – 2012 price for commercial, open ewes.
b. Buildings – size calculated based on Sheep Recommended Code of Practise standards cold
housing includes lamb feeding barn – self feeding hoppers; industry average construction
price and depreciated over 20 years;
c. Machinery and equipment – for equipment used only for the sheep enterprise. Charges
include annual depreciation, interest on investment and repairs.
d. Interest charged on investment. Interest on the average investment in sheep, buildings, and
sheep equipment is assessed at 2.1 percent (current five-year GIC interest rate).
e. General –with the exception of costs related to animal health & breeding, flock
identification & management, predation. All other variable expenses and fixed costs
apportioned to the sheep enterprise using 2009 and 2010 annual lambing data from the
OSMA Benchmark Study.
1 Conception rates typical of medium prolificacy breeds (see Flock Profile table).
2 Annual salary ($36,000) is calculated at 40 hours per week for 50 weeks at $18 per hour.
7
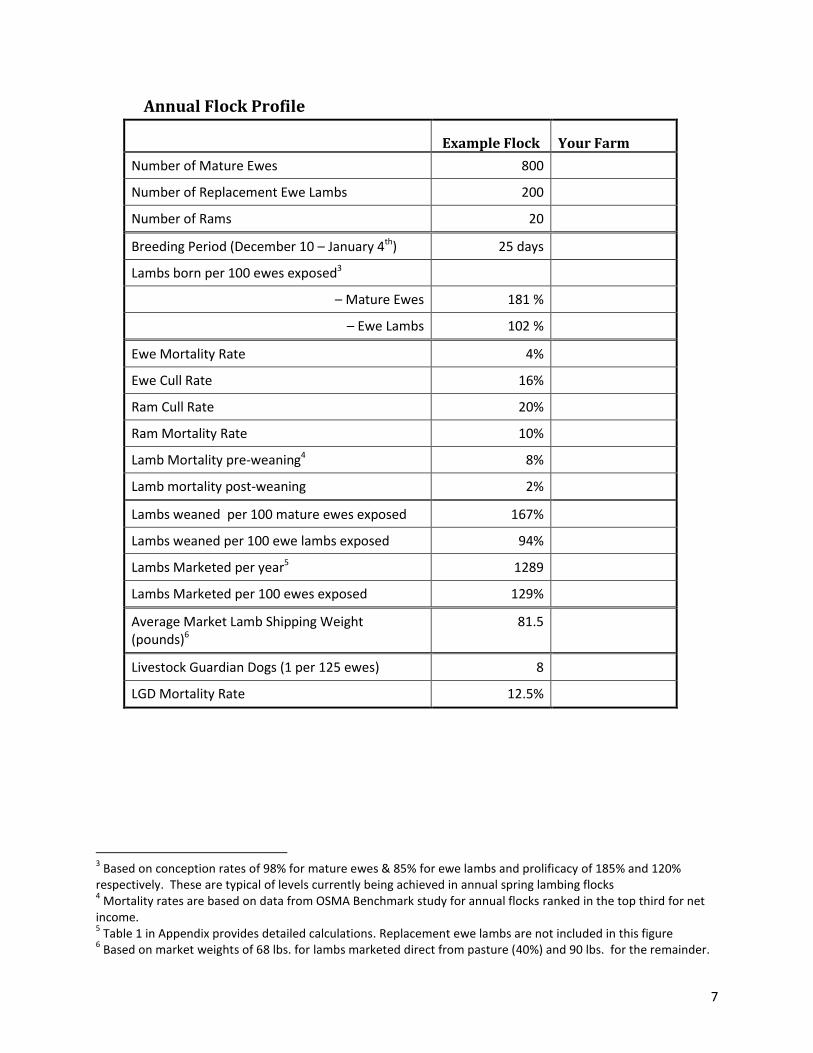
Annual Flock Profile
Example Flock Your Farm
Number of Mature Ewes 800
Number of Replacement Ewe Lambs 200
Number of Rams 20
Breeding Period (December 10 – January 4th) 25 days
Lambs born per 100 ewes exposed3
– Mature Ewes 181 %
– Ewe Lambs 102 %
Ewe Mortality Rate 4%
Ewe Cull Rate 16%
Ram Cull Rate 20%
Ram Mortality Rate 10%
Lamb Mortality pre-weaning4 8%
Lamb mortality post-weaning 2%
Lambs weaned per 100 mature ewes exposed 167%
Lambs weaned per 100 ewe lambs exposed 94%
Lambs Marketed per year5 1289
Lambs Marketed per 100 ewes exposed 129%
Average Market Lamb Shipping Weight (pounds)6
81.5
Livestock Guardian Dogs (1 per 125 ewes) 8
LGD Mortality Rate 12.5%
3 Based on conception rates of 98% for mature ewes & 85% for ewe lambs and prolificacy of 185% and 120%
respectively. These are typical of levels currently being achieved in annual spring lambing flocks 4 Mortality rates are based on data from OSMA Benchmark study for annual flocks ranked in the top third for net
income. 5 Table 1 in Appendix provides detailed calculations. Replacement ewe lambs are not included in this figure
6 Based on market weights of 68 lbs. for lambs marketed direct from pasture (40%) and 90 lbs. for the remainder.
8
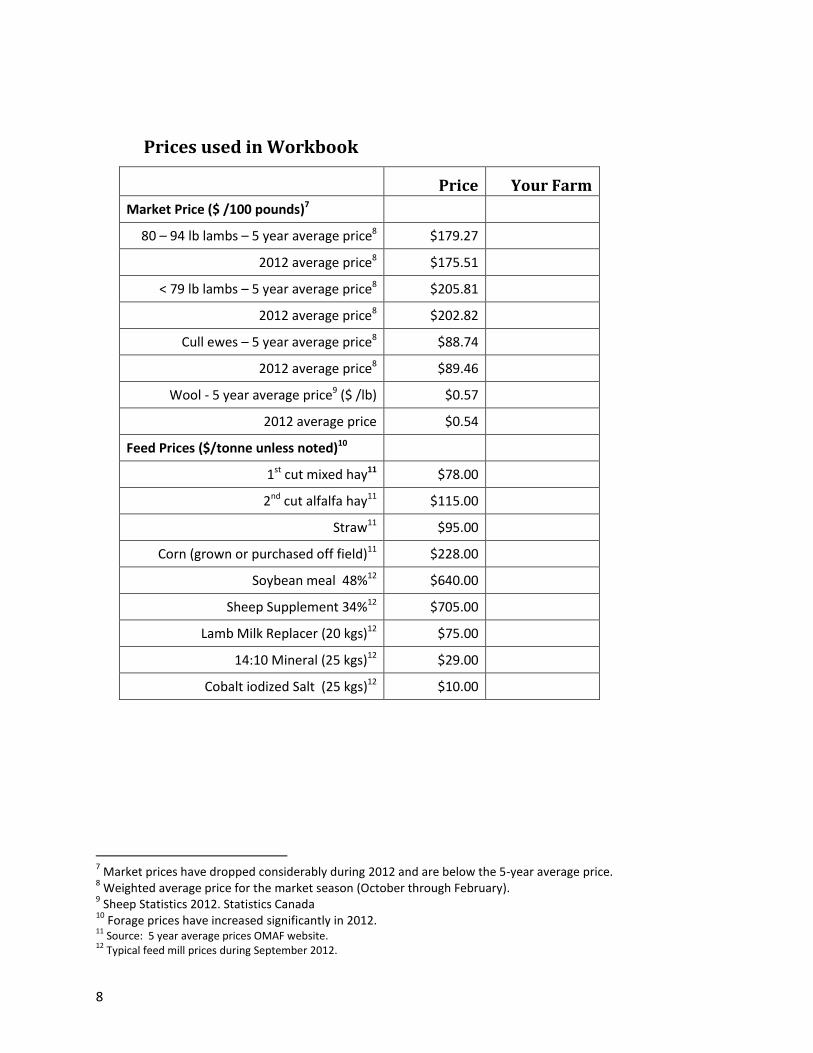
Prices used in Workbook
Price Your Farm
Market Price ($ /100 pounds)7
80 – 94 lb lambs – 5 year average price8 $179.27
2012 average price8 $175.51
< 79 lb lambs – 5 year average price8 $205.81
2012 average price8 $202.82
Cull ewes – 5 year average price8 $88.74
2012 average price8 $89.46
Wool - 5 year average price9 ($ /lb) $0.57
2012 average price $0.54
Feed Prices ($/tonne unless noted)10
1st cut mixed hay11 $78.00
2nd cut alfalfa hay11 $115.00
Straw11 $95.00
Corn (grown or purchased off field)11 $228.00
Soybean meal 48%12 $640.00
Sheep Supplement 34%12 $705.00
Lamb Milk Replacer (20 kgs)12 $75.00
14:10 Mineral (25 kgs)12 $29.00
Cobalt iodized Salt (25 kgs)12 $10.00
7 Market prices have dropped considerably during 2012 and are below the 5-year average price.
8 Weighted average price for the market season (October through February).
9 Sheep Statistics 2012. Statistics Canada
10 Forage prices have increased significantly in 2012.
11 Source: 5 year average prices OMAF website.
12 Typical feed mill prices during September 2012.
9
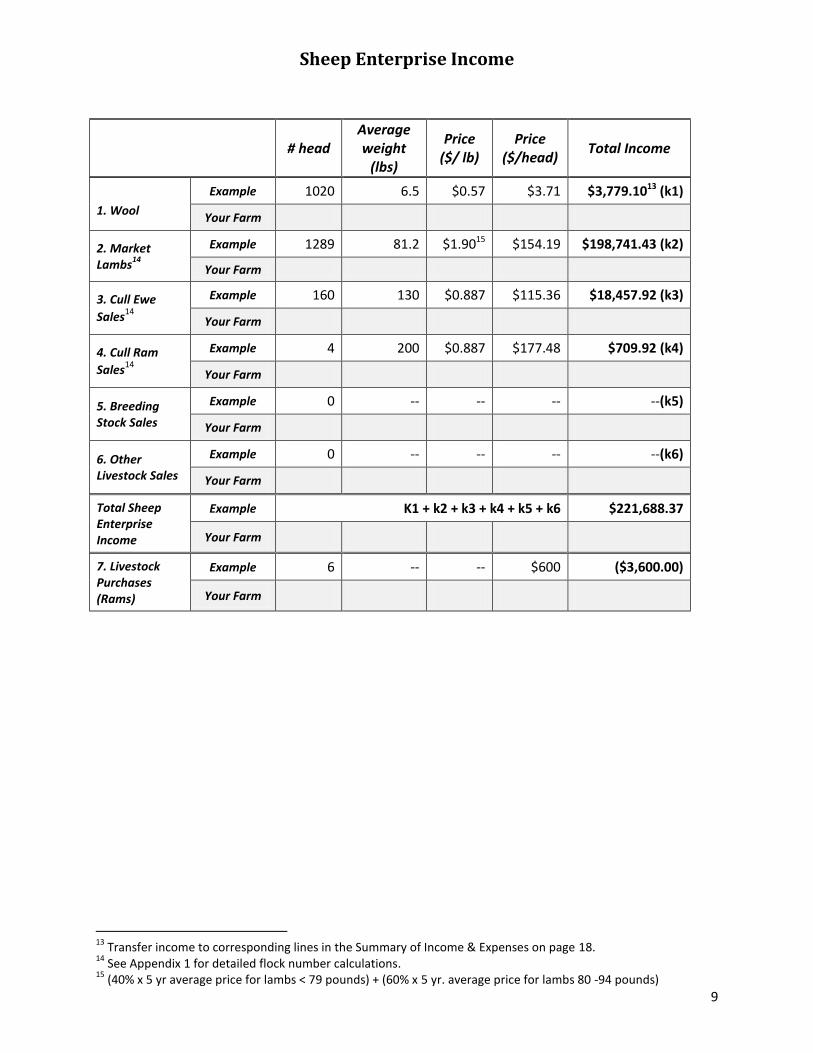
Sheep Enterprise Income
13
Transfer income to corresponding lines in the Summary of Income & Expenses on page 18. 14
See Appendix 1 for detailed flock number calculations. 15
(40% x 5 yr average price for lambs < 79 pounds) + (60% x 5 yr. average price for lambs 80 -94 pounds)
# head Average weight
(lbs)
Price ($/ lb)
Price ($/head)
Total Income
1. Wool
Example 1020 6.5 $0.57 $3.71 $3,779.1013 (k1)
Your Farm
2. Market Lambs
14
Example 1289 81.2 $1.9015 $154.19 $198,741.43 (k2)
Your Farm
3. Cull Ewe
Sales14
Example 160 130 $0.887 $115.36 $18,457.92 (k3)
Your Farm
4. Cull Ram
Sales14
Example 4 200 $0.887 $177.48 $709.92 (k4)
Your Farm
5. Breeding Stock Sales
Example 0 -- -- -- --(k5)
Your Farm
6. Other Livestock Sales
Example 0 -- -- -- --(k6)
Your Farm
Total Sheep Enterprise Income
Example K1 + k2 + k3 + k4 + k5 + k6 $221,688.37
Your Farm
7. Livestock Purchases (Rams)
Example 6 -- -- $600 ($3,600.00)
Your Farm
10
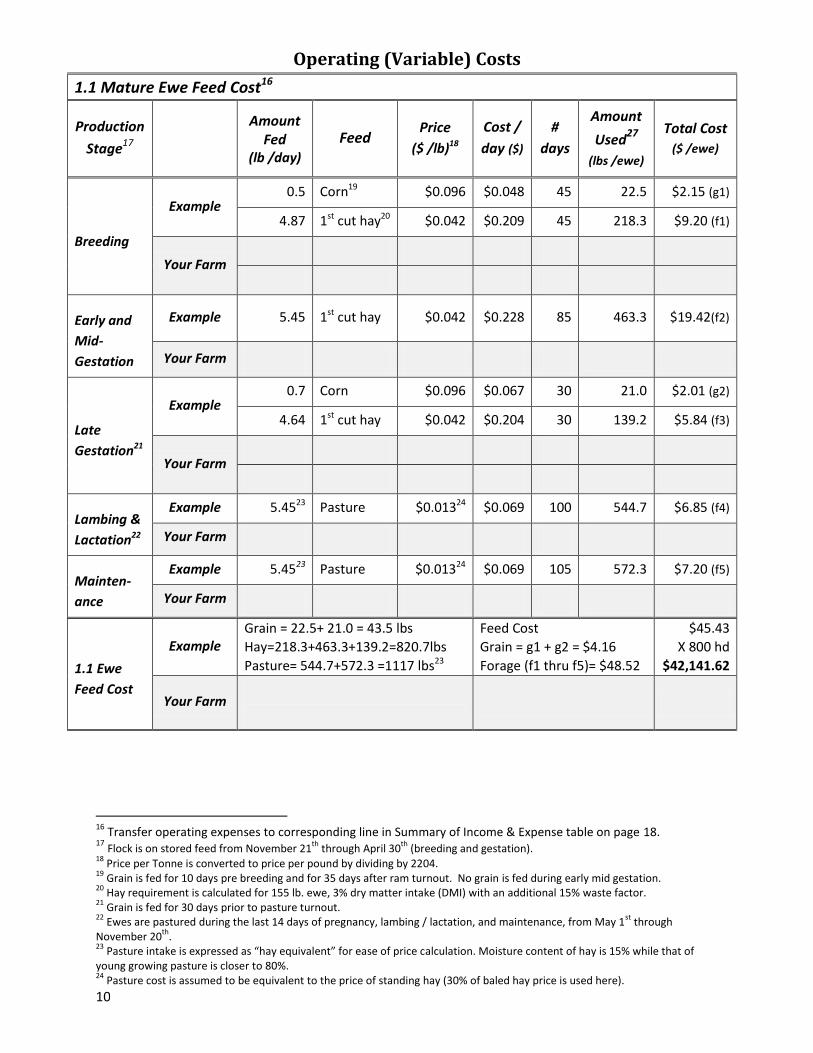
Operating (Variable) Costs
1.1 Mature Ewe Feed Cost16
Production
Stage17
Amount Fed
(lb /day)
Feed Price
($ /lb)18
Cost /
day ($)
#
days
Amount
Used27
(lbs /ewe)
Total Cost ($ /ewe)
Breeding
Example 0.5 Corn19 $0.096 $0.048 45 22.5 $2.15 (g1)
4.87 1st cut hay20 $0.042 $0.209 45 218.3 $9.20 (f1)
Your Farm
Early and
Mid-
Gestation
Example 5.45 1st cut hay $0.042 $0.228 85 463.3 $19.42(f2)
Your Farm
Late
Gestation21
Example 0.7 Corn $0.096 $0.067 30 21.0 $2.01 (g2)
4.64 1st cut hay $0.042 $0.204 30 139.2 $5.84 (f3)
Your Farm
Lambing &
Lactation22
Example 5.4523 Pasture $0.01324 $0.069 100 544.7 $6.85 (f4)
Your Farm
Mainten-
ance
Example 5.4523 Pasture $0.01324 $0.069 105 572.3 $7.20 (f5)
Your Farm
1.1 Ewe
Feed Cost
Example Grain = 22.5+ 21.0 = 43.5 lbs
Hay=218.3+463.3+139.2=820.7lbs
Pasture= 544.7+572.3 =1117 lbs23
Feed Cost
Grain = g1 + g2 = $4.16
Forage (f1 thru f5)= $48.52
$45.43
X 800 hd
$42,141.62
Your Farm
16
Transfer operating expenses to corresponding line in Summary of Income & Expense table on page 18. 17
Flock is on stored feed from November 21th
through April 30th
(breeding and gestation). 18
Price per Tonne is converted to price per pound by dividing by 2204. 19
Grain is fed for 10 days pre breeding and for 35 days after ram turnout. No grain is fed during early mid gestation. 20
Hay requirement is calculated for 155 lb. ewe, 3% dry matter intake (DMI) with an additional 15% waste factor. 21
Grain is fed for 30 days prior to pasture turnout. 22
Ewes are pastured during the last 14 days of pregnancy, lambing / lactation, and maintenance, from May 1st
through November 20
th.
23 Pasture intake is expressed as “hay equivalent” for ease of price calculation. Moisture content of hay is 15% while that of
young growing pasture is closer to 80%. 24
Pasture cost is assumed to be equivalent to the price of standing hay (30% of baled hay price is used here).
11
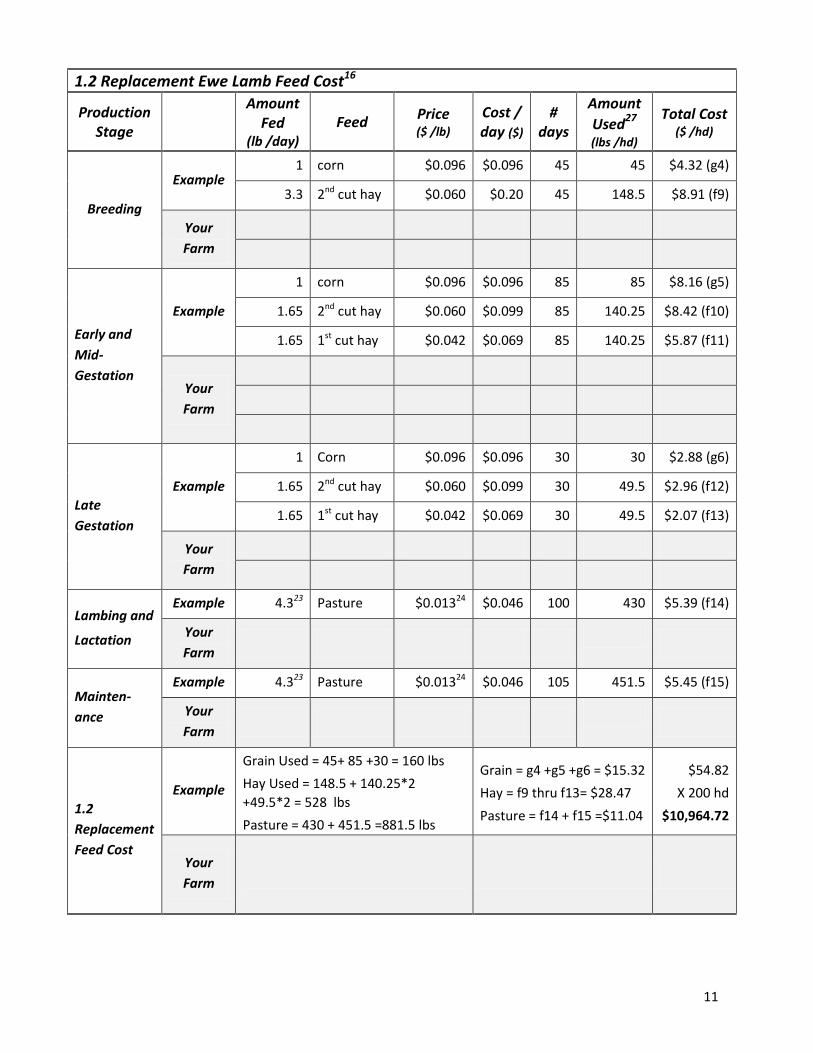
1.2 Replacement Ewe Lamb Feed Cost16
Production Stage
Amount Fed
(lb /day)
Feed Price ($ /lb)
Cost / day ($)
# days
Amount
Used27 (lbs /hd)
Total Cost ($ /hd)
Breeding
Example 1 corn $0.096 $0.096 45 45 $4.32 (g4)
3.3 2nd cut hay $0.060 $0.20 45 148.5 $8.91 (f9)
Your
Farm
Early and
Mid-
Gestation
Example
1 corn $0.096 $0.096 85 85 $8.16 (g5)
1.65 2nd cut hay $0.060 $0.099 85 140.25 $8.42 (f10)
1.65 1st cut hay $0.042 $0.069 85 140.25 $5.87 (f11)
Your
Farm
Late
Gestation
Example
1 Corn $0.096 $0.096 30 30 $2.88 (g6)
1.65 2nd cut hay $0.060 $0.099 30 49.5 $2.96 (f12)
1.65 1st cut hay $0.042 $0.069 30 49.5 $2.07 (f13)
Your
Farm
Lambing and
Lactation
Example 4.323 Pasture $0.01324 $0.046 100 430 $5.39 (f14)
Your
Farm
Mainten-
ance
Example 4.323 Pasture $0.01324 $0.046 105 451.5 $5.45 (f15)
Your
Farm
1.2
Replacement
Feed Cost
Example
Grain Used = 45+ 85 +30 = 160 lbs
Hay Used = 148.5 + 140.25*2
+49.5*2 = 528 lbs
Pasture = 430 + 451.5 =881.5 lbs
Grain = g4 +g5 +g6 = $15.32
Hay = f9 thru f13= $28.47
Pasture = f14 + f15 =$11.04
$54.82
X 200 hd
$10,964.72
Your
Farm
12
25
Transfer to corresponding operating expense line in Summary of Income and Expense table on page 18.
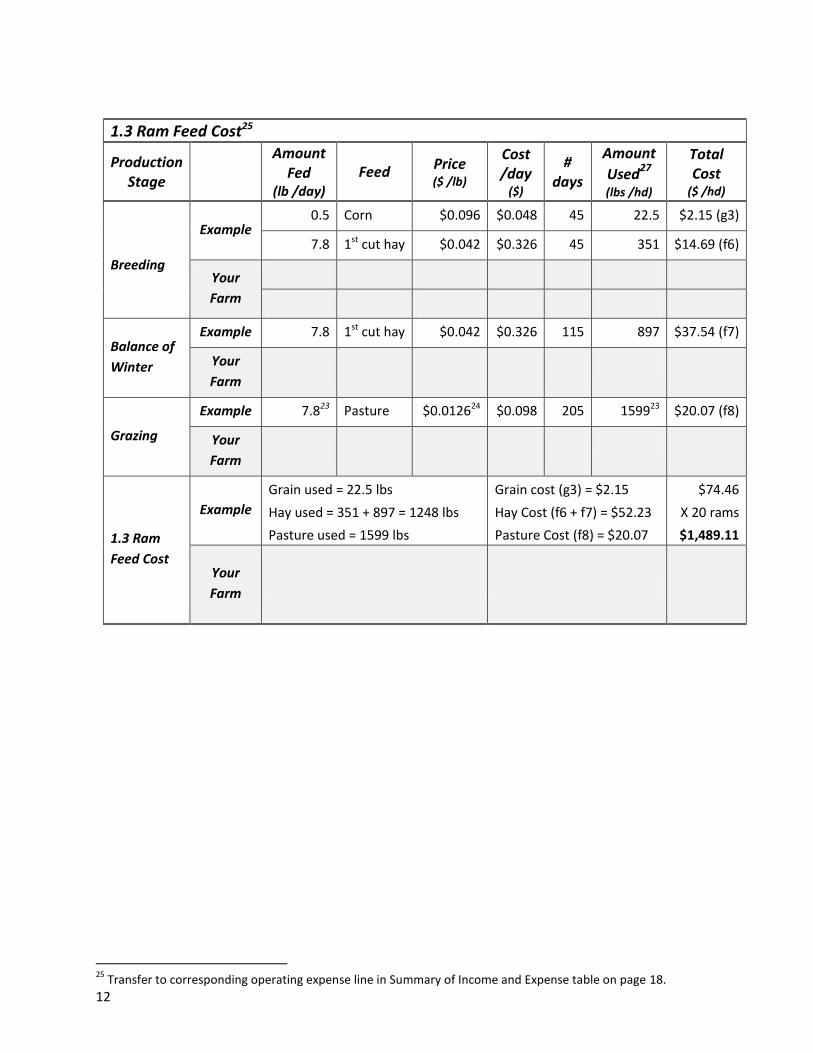
1.3 Ram Feed Cost25
Production Stage
Amount Fed
(lb /day)
Feed Price ($ /lb)
Cost /day
($)
# days
Amount
Used27 (lbs /hd)
Total Cost
($ /hd)
Breeding
Example 0.5 Corn $0.096 $0.048 45 22.5 $2.15 (g3)
7.8 1st cut hay $0.042 $0.326 45 351 $14.69 (f6)
Your
Farm
Balance of
Winter
Example 7.8 1st cut hay $0.042 $0.326 115 897 $37.54 (f7)
Your
Farm
Grazing
Example 7.823 Pasture $0.012624 $0.098 205 159923 $20.07 (f8)
Your
Farm
1.3 Ram
Feed Cost
Example
Grain used = 22.5 lbs
Hay used = 351 + 897 = 1248 lbs
Pasture used = 1599 lbs
Grain cost (g3) = $2.15
Hay Cost (f6 + f7) = $52.23
Pasture Cost (f8) = $20.07
$74.46
X 20 rams
$1,489.11
Your
Farm
13
26
Price is converted from unit prices (found on page7) to pounds by multiplying kilograms by 2.2046. 27
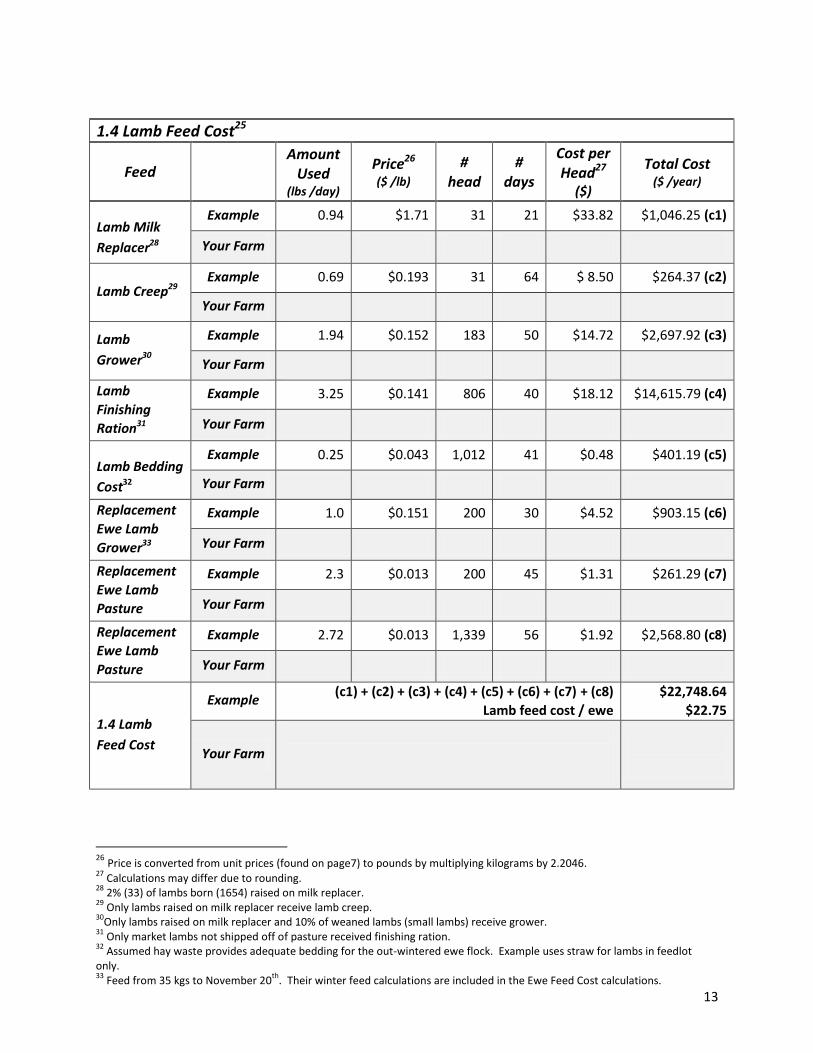
Calculations may differ due to rounding. 28
2% (33) of lambs born (1654) raised on milk replacer. 29
Only lambs raised on milk replacer receive lamb creep. 30
Only lambs raised on milk replacer and 10% of weaned lambs (small lambs) receive grower. 31
Only market lambs not shipped off of pasture received finishing ration. 32
Assumed hay waste provides adequate bedding for the out-wintered ewe flock. Example uses straw for lambs in feedlot only. 33
Feed from 35 kgs to November 20th
. Their winter feed calculations are included in the Ewe Feed Cost calculations.
1.4 Lamb Feed Cost25
Feed Amount
Used (lbs /day)
Price26 ($ /lb)
# head
# days
Cost per Head27
($)
Total Cost ($ /year)
Lamb Milk
Replacer28
Example 0.94 $1.71 31 21 $33.82 $1,046.25 (c1)
Your Farm
Lamb Creep29 Example 0.69 $0.193 31 64 $ 8.50 $264.37 (c2)
Your Farm
Lamb
Grower30
Example 1.94 $0.152 183 50 $14.72 $2,697.92 (c3)
Your Farm
Lamb
Finishing
Ration31
Example 3.25 $0.141 806 40 $18.12 $14,615.79 (c4)
Your Farm
Lamb Bedding
Cost32
Example 0.25 $0.043 1,012 41 $0.48 $401.19 (c5)
Your Farm
Replacement
Ewe Lamb
Grower33
Example 1.0 $0.151 200 30 $4.52 $903.15 (c6)
Your Farm
Replacement
Ewe Lamb
Pasture
Example 2.3 $0.013 200 45 $1.31 $261.29 (c7)
Your Farm
Replacement
Ewe Lamb
Pasture
Example 2.72 $0.013 1,339 56 $1.92 $2,568.80 (c8)
Your Farm
1.4 Lamb
Feed Cost
Example (c1) + (c2) + (c3) + (c4) + (c5) + (c6) + (c7) + (c8)
Lamb feed cost / ewe
$22,748.64
$22.75
Your Farm
14
34
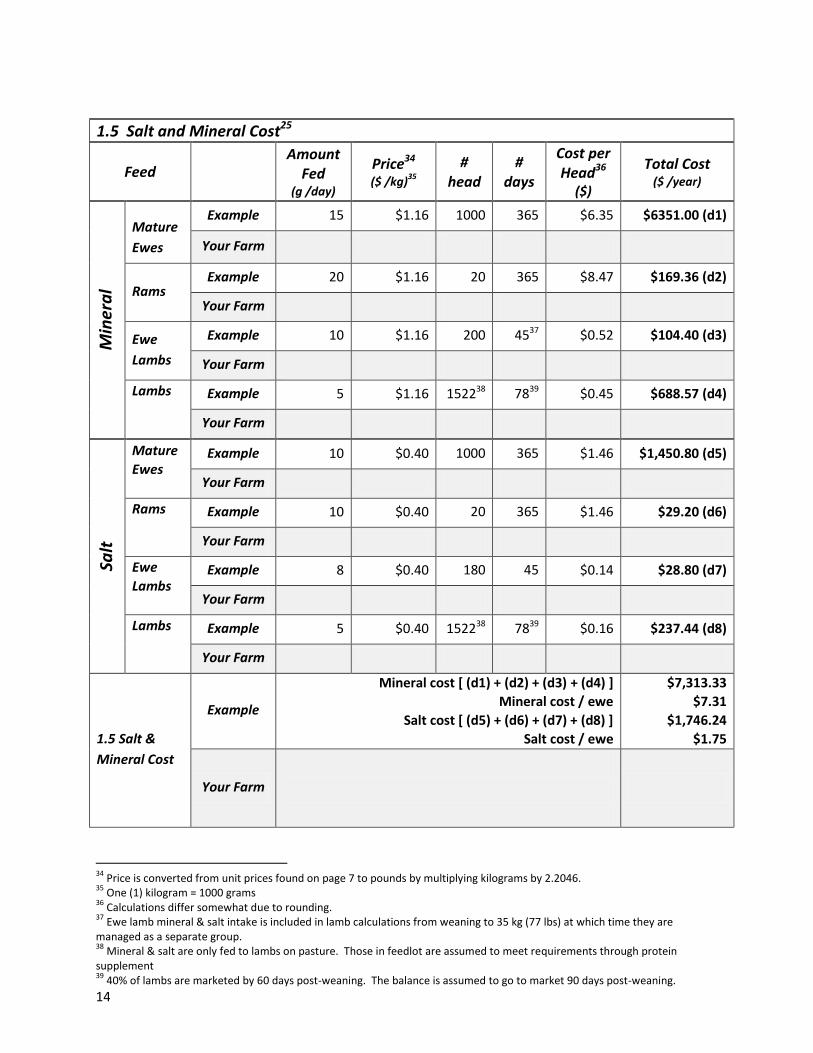
Price is converted from unit prices found on page 7 to pounds by multiplying kilograms by 2.2046. 35
One (1) kilogram = 1000 grams 36
Calculations differ somewhat due to rounding. 37
Ewe lamb mineral & salt intake is included in lamb calculations from weaning to 35 kg (77 lbs) at which time they are managed as a separate group. 38
Mineral & salt are only fed to lambs on pasture. Those in feedlot are assumed to meet requirements through protein supplement 39
40% of lambs are marketed by 60 days post-weaning. The balance is assumed to go to market 90 days post-weaning.
1.5 Salt and Mineral Cost25
Feed Amount
Fed (g /day)
Price34 ($ /kg)
35 #
head #
days
Cost per Head36
($)
Total Cost ($ /year)
Min
era
l
Mature
Ewes
Example 15 $1.16 1000 365 $6.35 $6351.00 (d1)
Your Farm
Rams Example 20 $1.16 20 365 $8.47 $169.36 (d2)
Your Farm
Ewe
Lambs
Example 10 $1.16 200 4537 $0.52 $104.40 (d3)
Your Farm
Lambs Example 5 $1.16 152238 7839 $0.45 $688.57 (d4)
Your Farm
Salt
Mature
Ewes Example 10 $0.40 1000 365 $1.46 $1,450.80 (d5)
Your Farm
Rams Example 10 $0.40 20 365 $1.46 $29.20 (d6)
Your Farm
Ewe
Lambs Example 8 $0.40 180 45 $0.14 $28.80 (d7)
Your Farm
Lambs Example 5 $0.40 152238 7839 $0.16 $237.44 (d8)
Your Farm
1.5 Salt &
Mineral Cost
Example
Mineral cost [ (d1) + (d2) + (d3) + (d4) ]
Mineral cost / ewe
Salt cost [ (d5) + (d6) + (d7) + (d8) ]
Salt cost / ewe
$7,313.33
$7.31
$1,746.24
$1.75
Your Farm
15
40
Price is converted from unit prices found on page 7 to pounds by multiplying kilograms by 2.2046. 41
One (1) kilogram = 1000 grams; 1 litre = 1000 millilitres. 42
Calculations differ somewhat due to rounding. 43
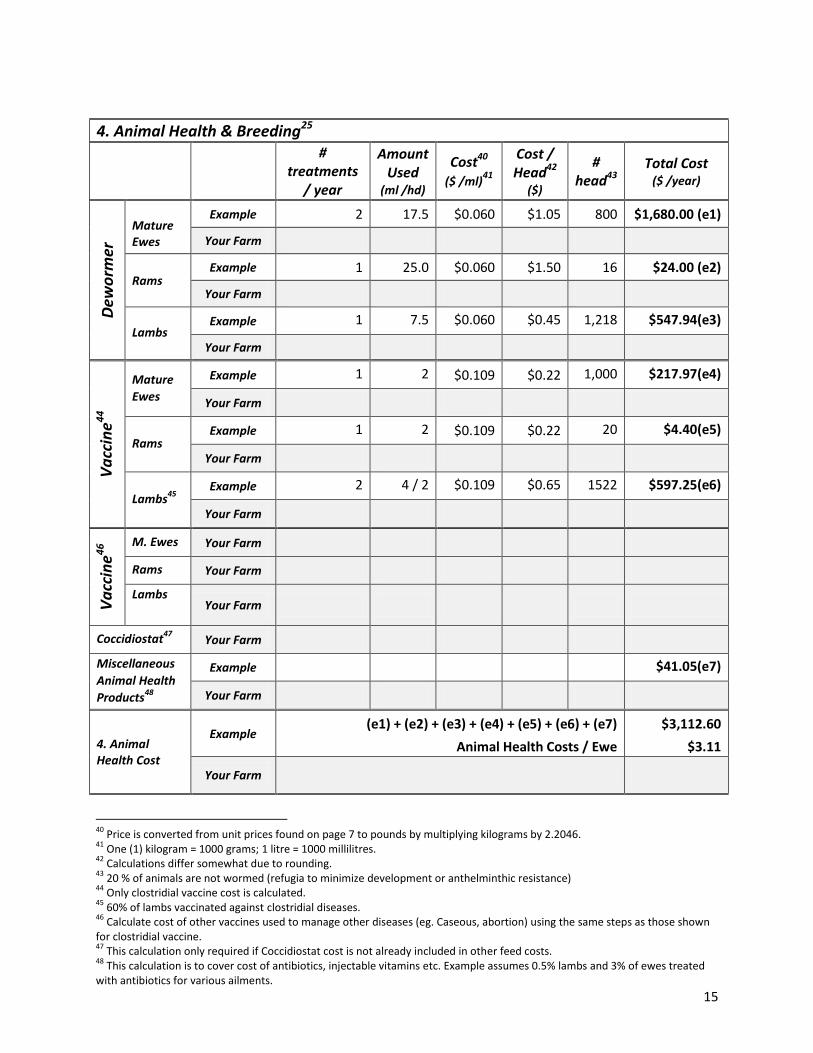
20 % of animals are not wormed (refugia to minimize development or anthelminthic resistance) 44
Only clostridial vaccine cost is calculated. 45
60% of lambs vaccinated against clostridial diseases. 46
Calculate cost of other vaccines used to manage other diseases (eg. Caseous, abortion) using the same steps as those shown for clostridial vaccine. 47
This calculation only required if Coccidiostat cost is not already included in other feed costs. 48
This calculation is to cover cost of antibiotics, injectable vitamins etc. Example assumes 0.5% lambs and 3% of ewes treated with antibiotics for various ailments.
4. Animal Health & Breeding25
#
treatments / year
Amount Used
(ml /hd)
Cost40 ($ /ml)
41
Cost / Head42
($)
# head43
Total Cost ($ /year)
Dew
orm
er
Mature Ewes
Example 2 17.5 $0.060 $1.05 800 $1,680.00 (e1)
Your Farm
Rams Example 1 25.0 $0.060 $1.50 16 $24.00 (e2)
Your Farm
Lambs Example 1 7.5 $0.060 $0.45 1,218 $547.94(e3)
Your Farm
Va
ccin
e4
4
Mature
Ewes
Example 1 2 $0.109 $0.22 1,000 $217.97(e4)
Your Farm
Rams Example 1 2 $0.109 $0.22 20 $4.40(e5)
Your Farm
Lambs45
Example 2 4 / 2 $0.109 $0.65 1522 $597.25(e6)
Your Farm
Va
ccin
e4
6 M. Ewes Your Farm
Rams Your Farm
Lambs
Your Farm
Coccidiostat47
Your Farm
Miscellaneous
Animal Health
Products48
Example $41.05(e7)
Your Farm
4. Animal Health Cost
Example (e1) + (e2) + (e3) + (e4) + (e5) + (e6) + (e7)
Animal Health Costs / Ewe
$3,112.60
$3.11
Your Farm
16
49
Transfer to corresponding operating expense line in Summary of Income and Expense table on page 18. 50
Assumed 2% tag loss in ewe flock. 51
mandatory RFID tagging is anticipated to be required under the Canadian Sheep Identification Program (CSIP) at some point in 2013. 52
Tags applied to each year’s lamb crop, ewe flock assumed tagged. 53
Annual service fee for participation in genetic improvement program such as Genovis and flock management program. 54
Assumed one dog per 130 ewes
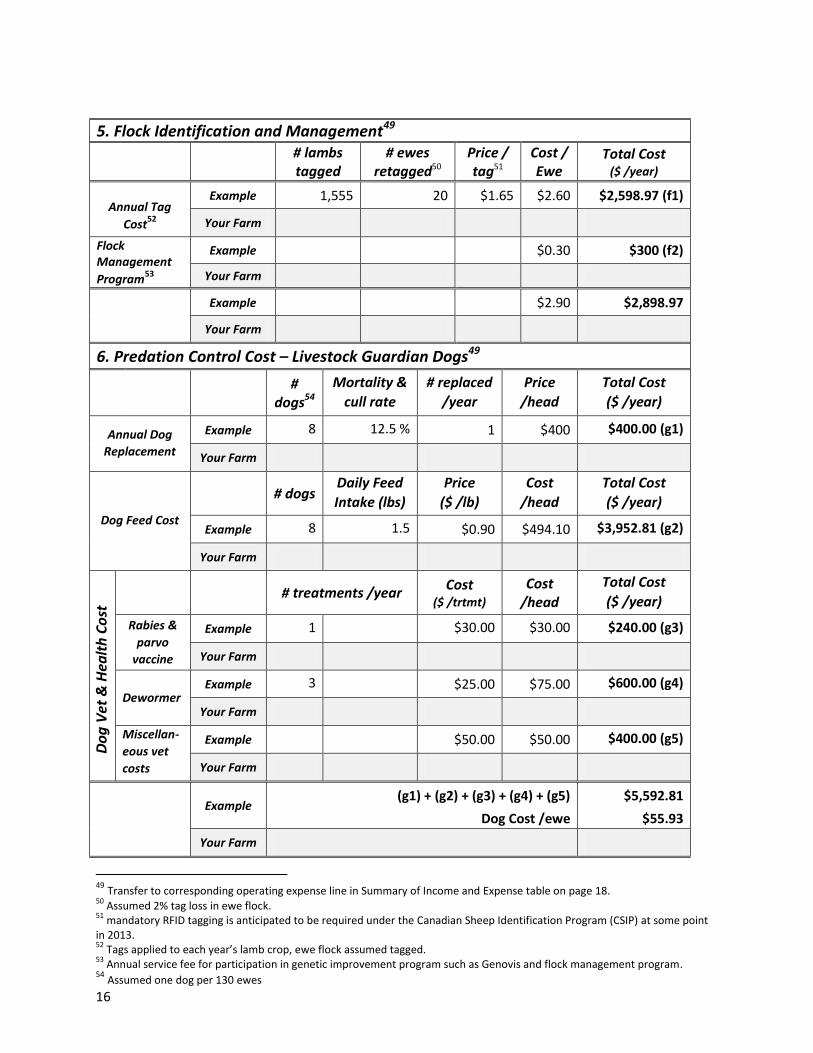
5. Flock Identification and Management49
# lambs tagged
# ewes retagged50
Price / tag51
Cost / Ewe
Total Cost ($ /year)
Annual Tag
Cost52
Example 1,555 20 $1.65 $2.60 $2,598.97 (f1)
Your Farm
Flock Management
Program53
Example $0.30 $300 (f2)
Your Farm
Example $2.90 $2,898.97
Your Farm
6. Predation Control Cost – Livestock Guardian Dogs49
#
dogs54
Mortality &
cull rate
# replaced
/year
Price
/head
Total Cost
($ /year)
Annual Dog
Replacement
Example 8 12.5 % 1 $400 $400.00 (g1)
Your Farm
Dog Feed Cost
# dogs Daily Feed
Intake (lbs)
Price
($ /lb)
Cost
/head
Total Cost
($ /year)
Example 8 1.5 $0.90 $494.10 $3,952.81 (g2)
Your Farm
Do
g V
et &
Hea
lth
Co
st
# treatments /year Cost
($ /trtmt) Cost
/head
Total Cost
($ /year)
Rabies &
parvo
vaccine
Example 1 $30.00 $30.00 $240.00 (g3)
Your Farm
Dewormer Example 3 $25.00 $75.00 $600.00 (g4)
Your Farm
Miscellan-
eous vet
costs
Example $50.00 $50.00 $400.00 (g5)
Your Farm
Example
(g1) + (g2) + (g3) + (g4) + (g5)
Dog Cost /ewe
$5,592.81
$55.93
Your Farm
17
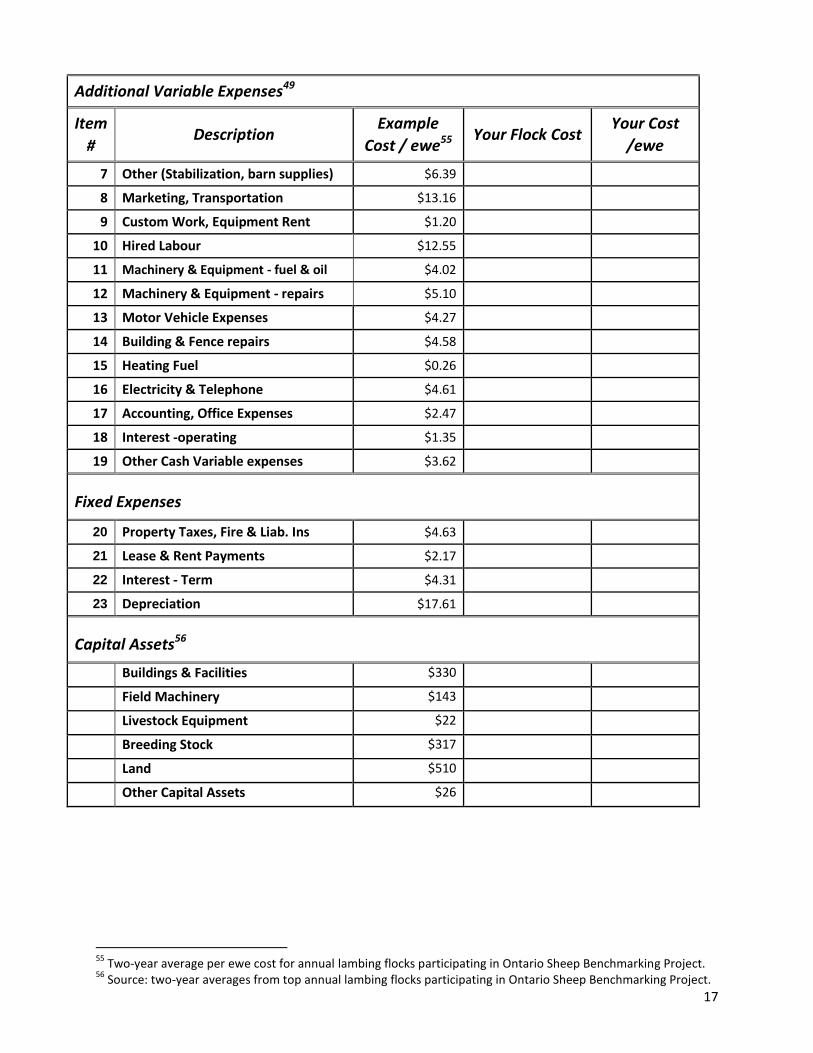
Additional Variable Expenses49
Item
# Description
Example
Cost / ewe55 Your Flock Cost
Your Cost
/ewe
7 Other (Stabilization, barn supplies) $6.39
8 Marketing, Transportation $13.16
9 Custom Work, Equipment Rent $1.20
10 Hired Labour $12.55
11 Machinery & Equipment - fuel & oil $4.02
12 Machinery & Equipment - repairs $5.10
13 Motor Vehicle Expenses $4.27
14 Building & Fence repairs $4.58
15 Heating Fuel $0.26
16 Electricity & Telephone $4.61
17 Accounting, Office Expenses $2.47
18 Interest -operating $1.35
19 Other Cash Variable expenses $3.62
Fixed Expenses
20 Property Taxes, Fire & Liab. Ins $4.63
21 Lease & Rent Payments $2.17
22 Interest - Term $4.31
23 Depreciation $17.61
Capital Assets56
Buildings & Facilities $330
Field Machinery $143
Livestock Equipment $22
Breeding Stock $317
Land $510
Other Capital Assets $26
55
Two-year average per ewe cost for annual lambing flocks participating in Ontario Sheep Benchmarking Project. 56
Source: two-year averages from top annual lambing flocks participating in Ontario Sheep Benchmarking Project.
18
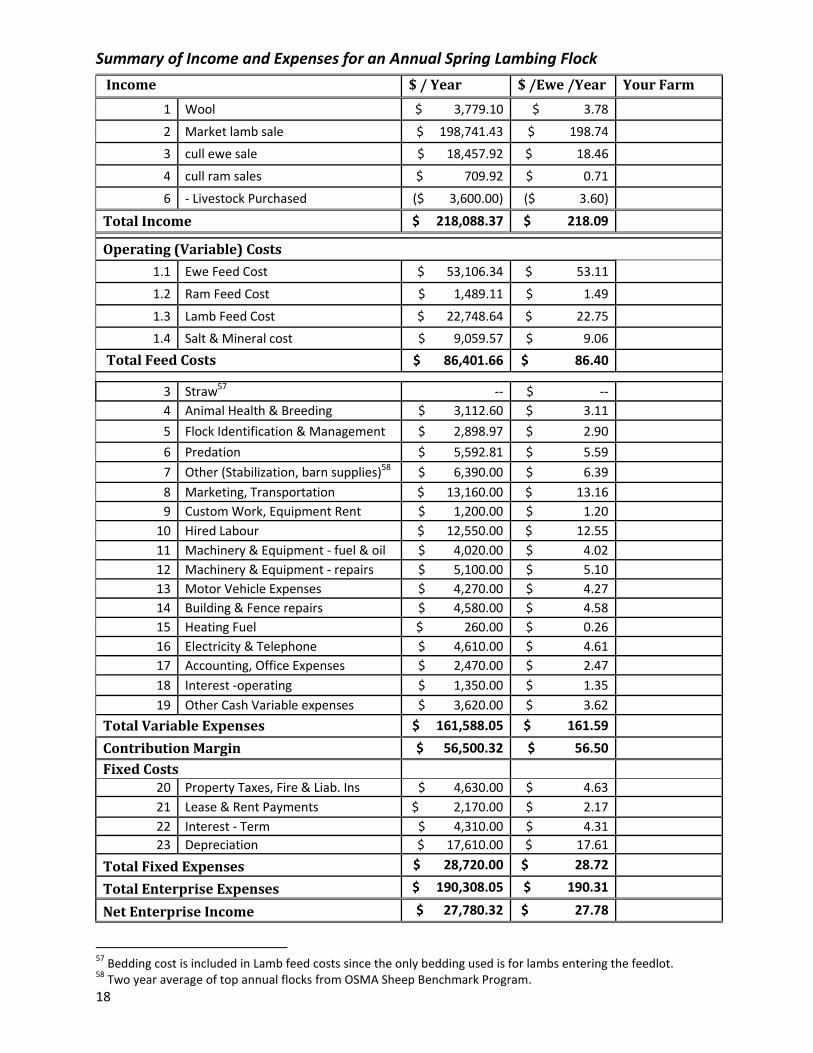
Summary of Income and Expenses for an Annual Spring Lambing Flock
Income $ / Year $ /Ewe /Year Your Farm
1 Wool $ 3,779.10 $ 3.78
2 Market lamb sale $ 198,741.43 $ 198.74
3 cull ewe sale $ 18,457.92 $ 18.46
4 cull ram sales $ 709.92 $ 0.71
6 - Livestock Purchased ($ 3,600.00) ($ 3.60)
Total Income $ 218,088.37 $ 218.09
Operating (Variable) Costs
1.1 Ewe Feed Cost $ 53,106.34 $ 53.11
1.2 Ram Feed Cost $ 1,489.11 $ 1.49
1.3 Lamb Feed Cost $ 22,748.64 $ 22.75
1.4 Salt & Mineral cost $ 9,059.57 $ 9.06
Total Feed Costs $ 86,401.66 $ 86.40
3 Straw57 -- $ --
4 Animal Health & Breeding $ 3,112.60 $ 3.11
5 Flock Identification & Management $ 2,898.97 $ 2.90
6 Predation $ 5,592.81 $ 5.59
7 Other (Stabilization, barn supplies)58 $ 6,390.00 $ 6.39
8 Marketing, Transportation $ 13,160.00 $ 13.16
9 Custom Work, Equipment Rent $ 1,200.00 $ 1.20
10 Hired Labour $ 12,550.00 $ 12.55
11 Machinery & Equipment - fuel & oil $ 4,020.00 $ 4.02
12 Machinery & Equipment - repairs $ 5,100.00 $ 5.10
13 Motor Vehicle Expenses $ 4,270.00 $ 4.27
14 Building & Fence repairs $ 4,580.00 $ 4.58
15 Heating Fuel $ 260.00 $ 0.26
16 Electricity & Telephone $ 4,610.00 $ 4.61
17 Accounting, Office Expenses $ 2,470.00 $ 2.47
18 Interest -operating $ 1,350.00 $ 1.35
19 Other Cash Variable expenses $ 3,620.00 $ 3.62
Total Variable Expenses $ 161,588.05 $ 161.59
Contribution Margin $ 56,500.32 $ 56.50
Fixed Costs
20 Property Taxes, Fire & Liab. Ins $ 4,630.00 $ 4.63
21 Lease & Rent Payments $ 2,170.00 $ 2.17
22 Interest - Term $ 4,310.00 $ 4.31
23 Depreciation $ 17,610.00 $ 17.61
Total Fixed Expenses $ 28,720.00 $ 28.72
Total Enterprise Expenses $ 190,308.05 $ 190.31
Net Enterprise Income $ 27,780.32 $ 27.78
57
Bedding cost is included in Lamb feed costs since the only bedding used is for lambs entering the feedlot. 58
Two year average of top annual flocks from OSMA Sheep Benchmark Program.
19
Concluding Remarks As with most agriculture enterprises, profitability hinges on many factors, with management ability playing a
significant role. Within this budget there are areas where efficiencies can be found. These include:
Feed cost savings through feeding management that improves forage utilization.
Consider options to reduce days on stored feed.
Increasing number of lambs marketed by improving ewe reproductive performance (including
replacement ewe lamb reproductive performance) through feeding and management.
Increasing number of lambs marketed by lowering lamb mortality.
Consider option to enable marketing more lambs direct from pasture.
Achieving above average prices for market lambs and cull animals.
At least a portion of grain purchases at below average prices.
Increase number of ewes to fully realise economies of scale.
20
Appendices
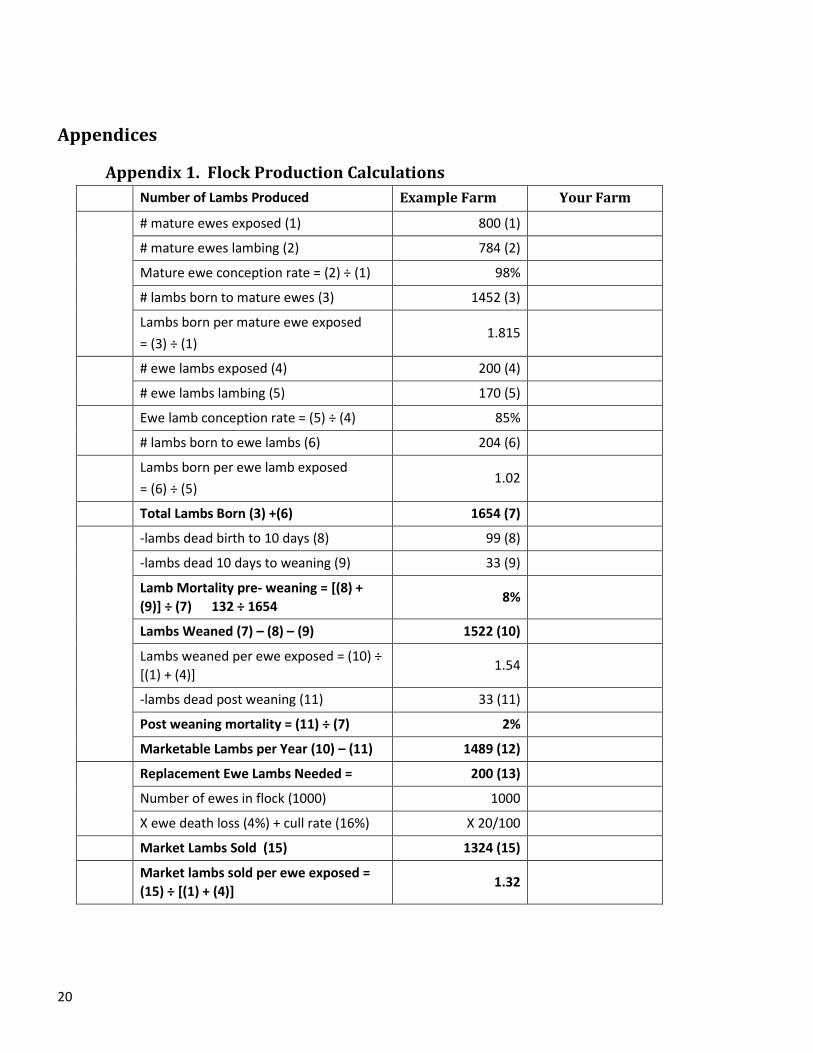
Appendix 1. Flock Production Calculations
Number of Lambs Produced Example Farm Your Farm
# mature ewes exposed (1) 800 (1)
# mature ewes lambing (2) 784 (2)
Mature ewe conception rate = (2) ÷ (1) 98%
# lambs born to mature ewes (3) 1452 (3)
Lambs born per mature ewe exposed
= (3) ÷ (1) 1.815
# ewe lambs exposed (4) 200 (4)
# ewe lambs lambing (5) 170 (5)
Ewe lamb conception rate = (5) ÷ (4) 85%
# lambs born to ewe lambs (6) 204 (6)
Lambs born per ewe lamb exposed
= (6) ÷ (5) 1.02
Total Lambs Born (3) +(6) 1654 (7)
-lambs dead birth to 10 days (8) 99 (8)
-lambs dead 10 days to weaning (9) 33 (9)
Lamb Mortality pre- weaning = [(8) +
(9)] ÷ (7) 132 ÷ 1654 8%
Lambs Weaned (7) – (8) – (9) 1522 (10)
Lambs weaned per ewe exposed = (10) ÷
[(1) + (4)] 1.54
-lambs dead post weaning (11) 33 (11)
Post weaning mortality = (11) ÷ (7) 2%
Marketable Lambs per Year (10) – (11) 1489 (12)
Replacement Ewe Lambs Needed = 200 (13)
Number of ewes in flock (1000) 1000
X ewe death loss (4%) + cull rate (16%) X 20/100
Market Lambs Sold (15) 1324 (15)
Market lambs sold per ewe exposed =
(15) ÷ [(1) + (4)] 1.32
21
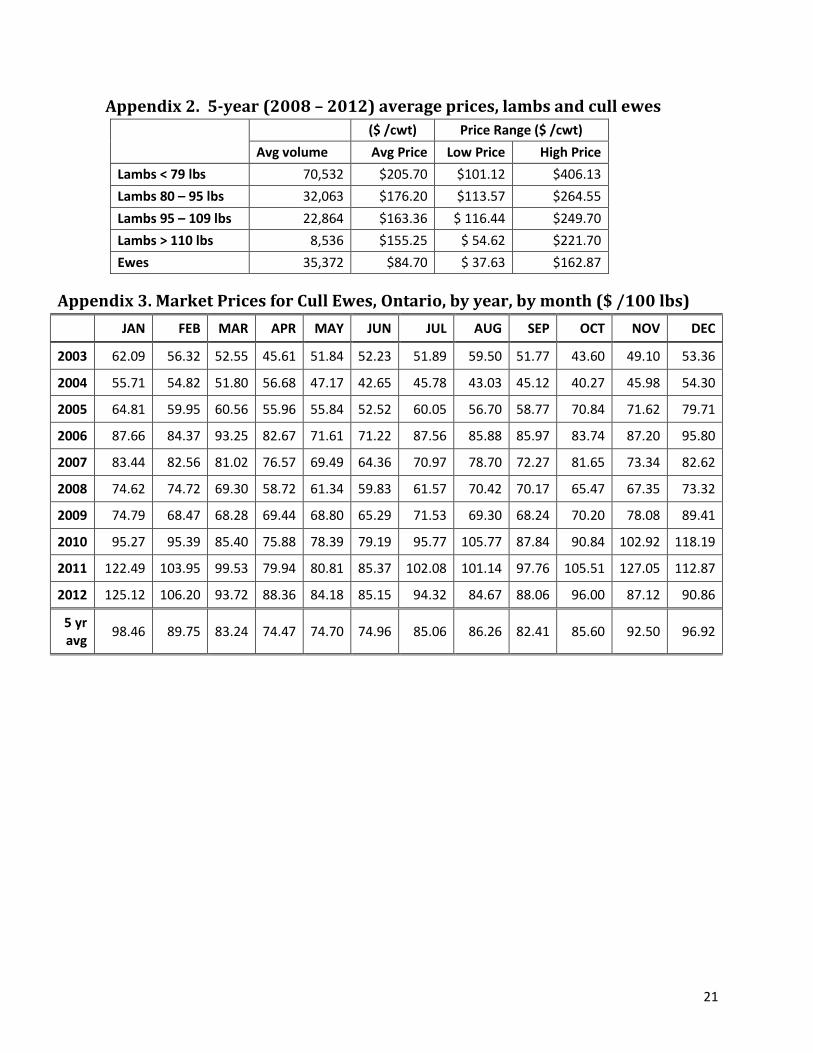
Appendix 2. 5-year (2008 – 2012) average prices, lambs and cull ewes
($ /cwt) Price Range ($ /cwt)
Avg volume Avg Price Low Price High Price
Lambs < 79 lbs 70,532 $205.70 $101.12 $406.13
Lambs 80 – 95 lbs 32,063 $176.20 $113.57 $264.55
Lambs 95 – 109 lbs 22,864 $163.36 $ 116.44 $249.70
Lambs > 110 lbs 8,536 $155.25 $ 54.62 $221.70
Ewes 35,372 $84.70 $ 37.63 $162.87
Appendix 3. Market Prices for Cull Ewes, Ontario, by year, by month ($ /100 lbs)
JAN FEB MAR APR MAY JUN JUL AUG SEP OCT NOV DEC
2003 62.09 56.32 52.55 45.61 51.84 52.23 51.89 59.50 51.77 43.60 49.10 53.36
2004 55.71 54.82 51.80 56.68 47.17 42.65 45.78 43.03 45.12 40.27 45.98 54.30
2005 64.81 59.95 60.56 55.96 55.84 52.52 60.05 56.70 58.77 70.84 71.62 79.71
2006 87.66 84.37 93.25 82.67 71.61 71.22 87.56 85.88 85.97 83.74 87.20 95.80
2007 83.44 82.56 81.02 76.57 69.49 64.36 70.97 78.70 72.27 81.65 73.34 82.62
2008 74.62 74.72 69.30 58.72 61.34 59.83 61.57 70.42 70.17 65.47 67.35 73.32
2009 74.79 68.47 68.28 69.44 68.80 65.29 71.53 69.30 68.24 70.20 78.08 89.41
2010 95.27 95.39 85.40 75.88 78.39 79.19 95.77 105.77 87.84 90.84 102.92 118.19
2011 122.49 103.95 99.53 79.94 80.81 85.37 102.08 101.14 97.76 105.51 127.05 112.87
2012 125.12 106.20 93.72 88.36 84.18 85.15 94.32 84.67 88.06 96.00 87.12 90.86
5 yr avg
98.46 89.75 83.24 74.47 74.70 74.96 85.06 86.26 82.41 85.60 92.50 96.92
22
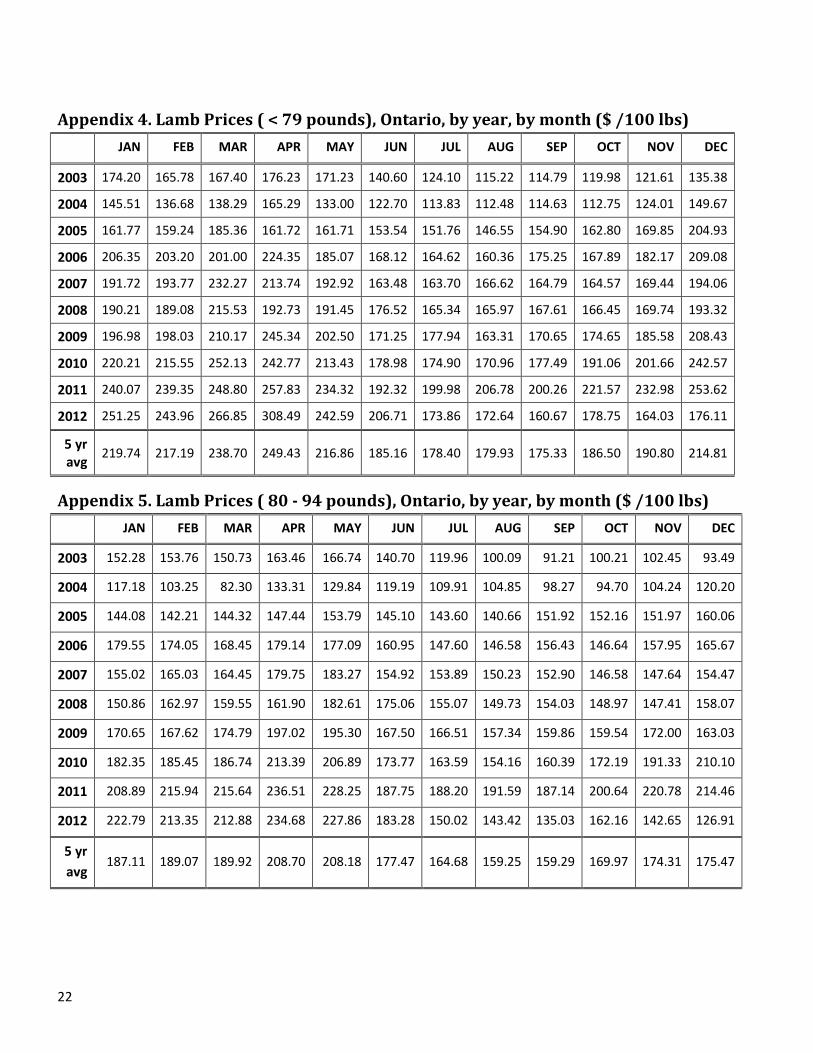
Appendix 4. Lamb Prices ( < 79 pounds), Ontario, by year, by month ($ /100 lbs)
JAN FEB MAR APR MAY JUN JUL AUG SEP OCT NOV DEC
2003 174.20 165.78 167.40 176.23 171.23 140.60 124.10 115.22 114.79 119.98 121.61 135.38
2004 145.51 136.68 138.29 165.29 133.00 122.70 113.83 112.48 114.63 112.75 124.01 149.67
2005 161.77 159.24 185.36 161.72 161.71 153.54 151.76 146.55 154.90 162.80 169.85 204.93
2006 206.35 203.20 201.00 224.35 185.07 168.12 164.62 160.36 175.25 167.89 182.17 209.08
2007 191.72 193.77 232.27 213.74 192.92 163.48 163.70 166.62 164.79 164.57 169.44 194.06
2008 190.21 189.08 215.53 192.73 191.45 176.52 165.34 165.97 167.61 166.45 169.74 193.32
2009 196.98 198.03 210.17 245.34 202.50 171.25 177.94 163.31 170.65 174.65 185.58 208.43
2010 220.21 215.55 252.13 242.77 213.43 178.98 174.90 170.96 177.49 191.06 201.66 242.57
2011 240.07 239.35 248.80 257.83 234.32 192.32 199.98 206.78 200.26 221.57 232.98 253.62
2012 251.25 243.96 266.85 308.49 242.59 206.71 173.86 172.64 160.67 178.75 164.03 176.11
5 yr avg
219.74 217.19 238.70 249.43 216.86 185.16 178.40 179.93 175.33 186.50 190.80 214.81
Appendix 5. Lamb Prices ( 80 - 94 pounds), Ontario, by year, by month ($ /100 lbs)
JAN FEB MAR APR MAY JUN JUL AUG SEP OCT NOV DEC
2003 152.28 153.76 150.73 163.46 166.74 140.70 119.96 100.09 91.21 100.21 102.45 93.49
2004 117.18 103.25 82.30 133.31 129.84 119.19 109.91 104.85 98.27 94.70 104.24 120.20
2005 144.08 142.21 144.32 147.44 153.79 145.10 143.60 140.66 151.92 152.16 151.97 160.06
2006 179.55 174.05 168.45 179.14 177.09 160.95 147.60 146.58 156.43 146.64 157.95 165.67
2007 155.02 165.03 164.45 179.75 183.27 154.92 153.89 150.23 152.90 146.58 147.64 154.47
2008 150.86 162.97 159.55 161.90 182.61 175.06 155.07 149.73 154.03 148.97 147.41 158.07
2009 170.65 167.62 174.79 197.02 195.30 167.50 166.51 157.34 159.86 159.54 172.00 163.03
2010 182.35 185.45 186.74 213.39 206.89 173.77 163.59 154.16 160.39 172.19 191.33 210.10
2011 208.89 215.94 215.64 236.51 228.25 187.75 188.20 191.59 187.14 200.64 220.78 214.46
2012 222.79 213.35 212.88 234.68 227.86 183.28 150.02 143.42 135.03 162.16 142.65 126.91
5 yr
avg 187.11 189.07 189.92 208.70 208.18 177.47 164.68 159.25 159.29 169.97 174.31 175.47
23
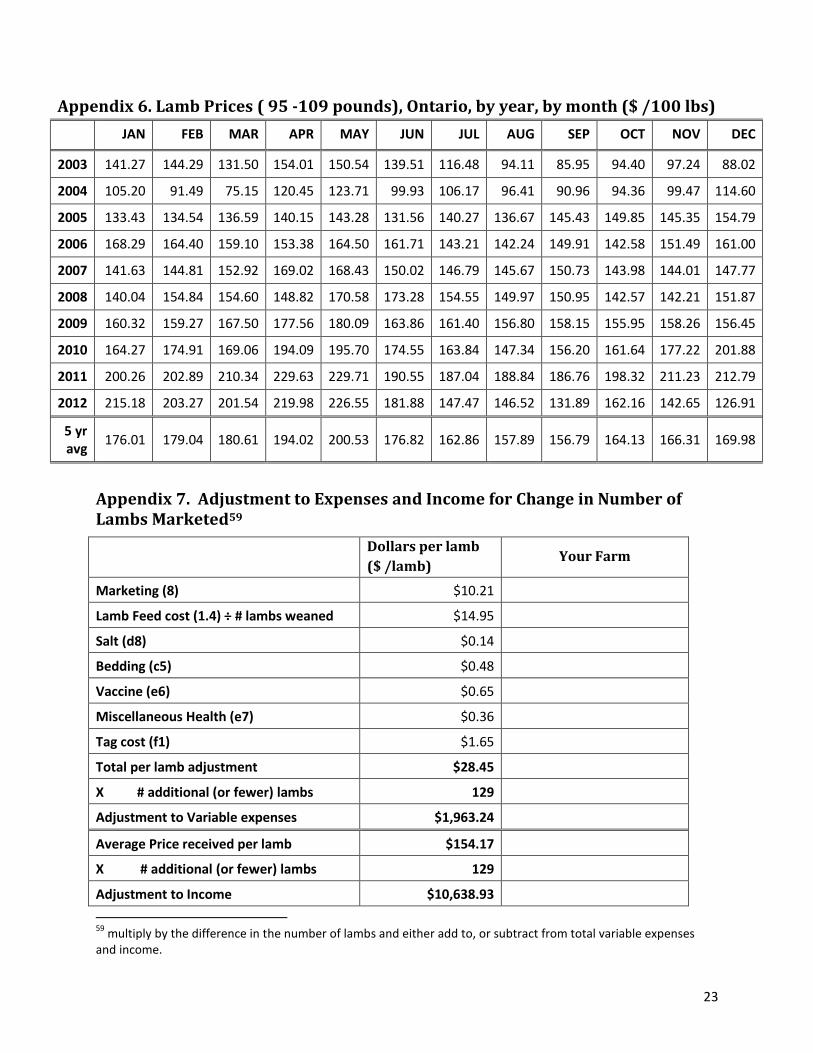
Appendix 6. Lamb Prices ( 95 -109 pounds), Ontario, by year, by month ($ /100 lbs)
JAN FEB MAR APR MAY JUN JUL AUG SEP OCT NOV DEC
2003 141.27 144.29 131.50 154.01 150.54 139.51 116.48 94.11 85.95 94.40 97.24 88.02
2004 105.20 91.49 75.15 120.45 123.71 99.93 106.17 96.41 90.96 94.36 99.47 114.60
2005 133.43 134.54 136.59 140.15 143.28 131.56 140.27 136.67 145.43 149.85 145.35 154.79
2006 168.29 164.40 159.10 153.38 164.50 161.71 143.21 142.24 149.91 142.58 151.49 161.00
2007 141.63 144.81 152.92 169.02 168.43 150.02 146.79 145.67 150.73 143.98 144.01 147.77
2008 140.04 154.84 154.60 148.82 170.58 173.28 154.55 149.97 150.95 142.57 142.21 151.87
2009 160.32 159.27 167.50 177.56 180.09 163.86 161.40 156.80 158.15 155.95 158.26 156.45
2010 164.27 174.91 169.06 194.09 195.70 174.55 163.84 147.34 156.20 161.64 177.22 201.88
2011 200.26 202.89 210.34 229.63 229.71 190.55 187.04 188.84 186.76 198.32 211.23 212.79
2012 215.18 203.27 201.54 219.98 226.55 181.88 147.47 146.52 131.89 162.16 142.65 126.91
5 yr avg
176.01 179.04 180.61 194.02 200.53 176.82 162.86 157.89 156.79 164.13 166.31 169.98
Appendix 7. Adjustment to Expenses and Income for Change in Number of Lambs Marketed59
Dollars per lamb
($ /lamb) Your Farm
Marketing (8) $10.21
Lamb Feed cost (1.4) ÷ # lambs weaned $14.95
Salt (d8) $0.14
Bedding (c5) $0.48
Vaccine (e6) $0.65
Miscellaneous Health (e7) $0.36
Tag cost (f1) $1.65
Total per lamb adjustment $28.45
X # additional (or fewer) lambs 129
Adjustment to Variable expenses $1,963.24
Average Price received per lamb $154.17
X # additional (or fewer) lambs 129
Adjustment to Income $10,638.93
59
multiply by the difference in the number of lambs and either add to, or subtract from total variable expenses and income.
24
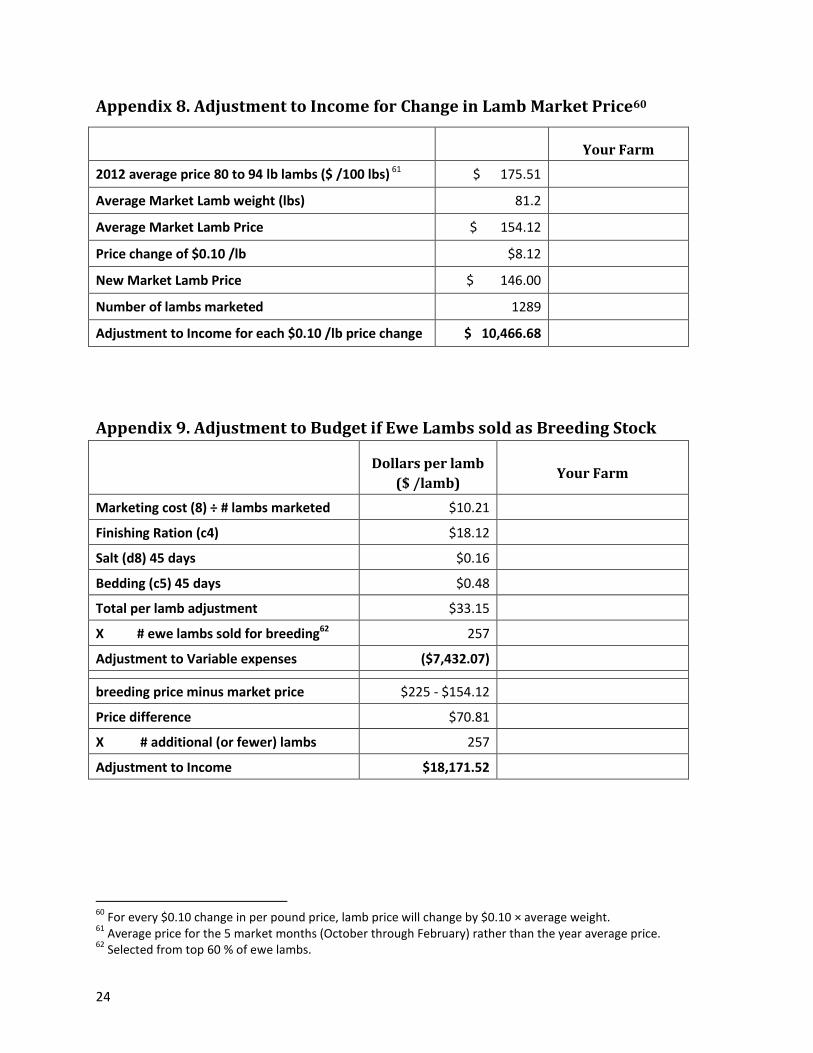
Appendix 8. Adjustment to Income for Change in Lamb Market Price60
Your Farm
2012 average price 80 to 94 lb lambs ($ /100 lbs) 61 $ 175.51
Average Market Lamb weight (lbs) 81.2
Average Market Lamb Price $ 154.12
Price change of $0.10 /lb $8.12
New Market Lamb Price $ 146.00
Number of lambs marketed 1289
Adjustment to Income for each $0.10 /lb price change $ 10,466.68
Appendix 9. Adjustment to Budget if Ewe Lambs sold as Breeding Stock
Dollars per lamb
($ /lamb) Your Farm
Marketing cost (8) ÷ # lambs marketed $10.21
Finishing Ration (c4) $18.12
Salt (d8) 45 days $0.16
Bedding (c5) 45 days $0.48
Total per lamb adjustment $33.15
X # ewe lambs sold for breeding62 257
Adjustment to Variable expenses ($7,432.07)
breeding price minus market price $225 - $154.12
Price difference $70.81
X # additional (or fewer) lambs 257
Adjustment to Income $18,171.52
60
For every $0.10 change in per pound price, lamb price will change by $0.10 × average weight. 61
Average price for the 5 market months (October through February) rather than the year average price. 62
Selected from top 60 % of ewe lambs.