Embed Size (px)
Citation preview

Ontario Wholesale Electricity
Market Price Forecast
For the Period
May 1, 2014 through October 31, 2015
Presented to
Ontario Energy Board
April 10, 2014
Navigant Consulting Ltd.
333 Bay Street, Suite 1250
Toronto, Ontario M5H 2R2
www.navigant.com

Notice of Confidentia l i ty
NOTICE OF CONFIDENTIALITY
Copyright
This report is protected by copyright. Any copying, reproduction, performance or publication in
any form outside the client organization without the express written consent of Navigant
Consulting Inc. is prohibited.
No Warranties or Representations
Some of the assumptions used in the preparation of this wholesale electricity market price
forecast, although considered reasonable at the time of preparation, inevitably will not
materialize as forecasted as unanticipated events and circumstances occur subsequent to the
date of the forecast. Accordingly, actual electricity market prices will vary from the electricity
market price forecast and the variations may be material. There is no representation that our
Ontario electricity market price forecast will be realized. Important factors that could cause
actual electricity market prices to vary from the forecast are disclosed throughout the report.

Table of Contents i i i
EXECUTIVE SUMMARY
Navigant Consulting Ltd. (Navigant) was retained by the Ontario Energy Board (OEB or the
Board) to provide an independent market price forecast for the Ontario wholesale electricity
market. This wholesale electricity price forecast will be used, as one of a number of inputs, to set
the price for eligible consumers under the Regulated Price Plan (RPP).
Navigant used a statistical model of the Ontario electricity market to develop our hourly
Ontario electricity price (HOEP) forecast. Navigant’s Ontario model draws on our Ontario
database, which reflects the Ontario hourly load shape, all committed new entrant generation,
best available information regarding the operating profile of Ontario’s hydroelectric generation
(baseload and peaking resources), and operating characteristics and fuel prices for Ontario’s
thermal generation. Our assumptions and their sources are discussed in detail in Chapter 3 of
this report.
The table below presents the results of our base case market price forecast. The on-peak and off-
peak prices presented are simple averages, i.e., not load weighted.
Table ES-1: HOEP Forecast ($ CAD per MWh)
Source: Navigant Consulting
Notes
1) The price forecast reflects an average exchange rate of $1.155 CAD between May 2014 and October 2015. The
exchange rate forecast is taken from the Bank of Montreal’s “Canadian Economic Outlook”, issued March 28, 2014.
2) On-peak hours include the hours ending at 8 a.m. through 11 p.m. Eastern Time (EST) on working weekdays and
off-peak hours include all other hours.
Term Quarter Calendar Period On-Peak Off-Peak Average Term Average
RP
P Y
ea
r Q1 May 14 - Jul 14 $33.12 $21.55 $26.89
Q2 Aug 14 - Oct 14 $31.25 $20.03 $25.13
Q3 Nov 14 - Jan 15 $35.34 $25.15 $29.79
Q4 Feb 15 - Apr 15 $28.16 $18.98 $23.21 $26.28
RP
P Y
ea
rO
ther
Q1 May 15 - Jul 15 $26.95 $16.42 $21.29
Q2 Aug 15 - Oct 15 $28.17 $17.90 $22.57 $21.93Oth
er
Table of Contents iv
TABLE OF CONTENTS
EXECUTIVE SUMMARY .............................................................................................................................. III
1. INTRODUCTION .................................................................................................................................. 1
1.1 Contents of This Report ......................................................................................................... 1
2. PRICE FORECASTING METHODOLOGY ............................................................................................ 2
2.1 Overview of the Forecasting Model .................................................................................... 2
2.2 Treatment of “OPG Regulated Assets” in the Model Specification ................................ 3
2.3 Recognizing Market Pricing Volatility ................................................................................ 3
3. SHORT-TERM FORECAST ASSUMPTIONS ........................................................................................ 4
3.1 Demand Forecast .................................................................................................................... 4
3.2 Supply Assumptions ............................................................................................................. 5
3.3 Nuclear Capacity .................................................................................................................... 7
3.4 Transmission Capabilities and Constraints ........................................................................ 8
3.5 Fuel Prices ............................................................................................................................... 8
3.6 Coal Prices and Output ....................................................................................................... 10
3.7 Hydro Resources .................................................................................................................. 10
4. REVIEW OF FORECAST RESULTS ..................................................................................................... 11
5. ASSESSMENT OF FORECAST RISKS ................................................................................................. 14
5.1 Load Forecast Risk ............................................................................................................... 14
5.2 Fuel Price Forecast Risk ....................................................................................................... 14
5.3 Generator Availability Price Risks ..................................................................................... 17

Table of Contents v
LIST OF FIGURES & TABLES
List of Figures
Figure 1: Historic Distribution of Hourly HOEP ......................................................................................... 12
Figure 2: Historic Distribution of Monthly Average HOEP ...................................................................... 13
Figure 3: Historical September 2013 Futures Prices (US$/MMBtu) ......................................................... 15
Figure 4: Comparison of Monthly Average HOEP with ±20% Change in Henry Hub Gas Price ........ 16
List of Tables
Table 1: Forecast Monthly Energy Consumption and Peak Demand ........................................................ 4
Table 2: Major Generation Capacity Additions ............................................................................................. 6
Table 3: Historical and Forecast Nuclear Capacity Factors .......................................................................... 7
Table 4: Ontario Interconnection Limits ......................................................................................................... 8
Table 5: Natural Gas Price Forecast ................................................................................................................. 9
Table 6: HOEP Forecast (CAD $ per MWh) ................................................................................................. 11

Introduction 1
1. INTRODUCTION
Navigant Consulting Ltd. (Navigant) was retained by the Ontario Energy Board (OEB or the
Board) to provide an independent market price forecast for the Ontario wholesale electricity
market. This wholesale electricity price forecast will be used, among other inputs, to set the
price for eligible consumers under the Regulated Price Plan (RPP).
This report presents the results of our forecast of the Hourly Ontario Energy Price (HOEP) for
the period from May 1, 2014 through October 31, 2015 and describes the major economic and
energy market assumptions and inputs for the forecast, as well the sources of information. In
addition, given that this forecast is based on a specific set of assumptions, the report evaluates
major risk factors in the forecast.
This forecast of the HOEP will be used along with the following to establish the price for the
RPP:
the regulated payment amounts for Ontario Power Generation’s (OPG’s) prescribed
assets,
the cost of non-utility generation (NUG) contracts administered by the Ontario
Electricity Financial Corporation,
the cost of renewable energy supply (RES) and clean energy supply (CES) contracts
administered by the Ontario Power Authority (OPA),
the cost of renewable energy standard offer program (RESOP) and Feed-In tariff (FIT)
program contracts administered by the Ontario Power Authority,
the cost of the “Early Mover”, Combined Heat and Power and Bruce Power contracts
administered by the OPA; and
the balance in the variance account held by the OPA.
This forecast will also be used to determine the estimated value of the Global Adjustment as
part of the RPP price.
1.1 Contents of This Report
This report contains five chapters. The first is this Introduction. The second reviews the
forecasting methodology, including the framework used for evaluating forecast uncertainty.
The third chapter reviews the key forecast assumptions and identifies the information source.
The fourth chapter reviews the forecast results. The final chapter discusses the forecast risks.

Pr ice Forecas ting Methodology 2
2. PRICE FORECASTING METHODOLOGY
The major factors driving the equilibrium of supply and demand are reflected in our statistical
forecast model. The model draws on the history of the Ontario electricity market to determine
the relationship between the drivers of market prices and the resulting market prices. This
relationship is then extended forward to produce a forecast of expected wholesale electricity
prices.
2.1 Overview of the Forecasting Model
Navigant used our statistical price forecasting model to develop the HOEP forecast. Navigant’s
Ontario electricity database reflects all committed new entrant generation, best available
information regarding the operating profile of Ontario’s hydroelectric fleet (baseload and
peaking resources), and operating characteristics and fuel prices for Ontario’s thermal
generation. The sources of our assumptions are reviewed in the next chapter. Presented below is
a brief review of our electricity price forecasting model.
The Ontario electricity market features a mandatory competitive wholesale pool. Any
generator wishing to supply electricity to the Ontario market must offer its output to the system
operator – the Independent Electricity System Operator (IESO) – as a series of hourly
price/quantity pairs. The IESO then chooses the least-cost combination of generation resources
which can meet the demand in each hour, subject to technical factors such as ramp rates (for
fossil resources) and transmission constraints. The cost of the most expensive generation
dispatched then becomes the market-clearing price which each generator located within the
same market area (i.e., Ontario) receives for its energy output, regardless of its actual offer price.
The hourly electricity price in Ontario is therefore determined by the interaction of supply and
demand as reflected in the information provided to the IESO. A statistical model will represent
these factors.
The Navigant statistical model was developed using our extensive historical database for the
Ontario electricity market. The data include a complete history of HOEP, historical electricity
output by fuel type of plants in Ontario and historical electricity demand in Ontario. The
database also includes information on market prices for the important fuels (natural gas and
uranium) used for electricity generation in Ontario. In the development of the model, all of
these factors were considered. The model was selected as that which best represents the actual
history of Ontario electricity prices.
The model considers HOEP to be determined by several important factors.
Hourly demand for electricity is an important determinant of demand, as noted above.
The demand variable included in the model is the total energy demand over the time
period.
The amount of nuclear and hydroelectric energy available to the Ontario market has a
strong influence on the hourly electricity price, due to their low operating costs. The
more such low-cost energy is available, the less the IESO has to rely on relatively high-

Pr ice Forecas ting Methodolog y 3
cost sources like natural gas generation. The availability of these two forms of low-cost
energy is treated in the model as a determinant of electricity price.
The price of natural gas is also an important determinant of electricity price in Ontario,
because it is likely to be the marginal fuel (that is, the resource that sets the market-
clearing price) in times when supplies from lower-priced resources (hydroelectric, and
nuclear) are insufficient. The outcome of an increase in Ontario’s fleet of natural-gas
fired generators combined with the retirement of Ontario’s coal generation will be to
further increase the importance of natural gas generation. Natural gas is also important
in setting the price in neighbouring markets, which can influence prices in Ontario.
Therefore, natural gas prices have a strong role in explaining HOEP and the model
includes the price of natural gas as a determinant of the Ontario electricity price.
2.2 Treatment of “OPG Regulated Assets” in the Model Specification
A significant portion of Ontario’s generation, i.e., OPG’s nuclear and major baseload
hydroelectric generating units (Saunders, Beck, and DeCew Falls) have been designated as
regulated assets. The price for the output of these plants is set by the Board. While the price for
the output of these plants is regulated, their value in the Ontario market will be established by
the same market dynamics that are in place currently, i.e., a bid-based pool where participating
generators receive a uniform price. Specifically, the party responsible for operating this
generation would seek to ensure that it is available to the maximum degree possible,
particularly during periods when market prices are high and the value of the generation is the
greatest. Furthermore, if the scheduling and dispatch of these units does not change given that
OPG’s regulated assets do not establish the market-clearing price for the vast majority of hours,
we expect that the treatment of these generating stations as regulated assets will not affect the
HOEP.
2.3 Recognizing Market Pricing Volatility
Experience demonstrates that electricity market prices are inherently volatile. Any wholesale
market price forecast should reflect this volatility or, at a minimum, acknowledge it as a source
of risk to the price forecast. To determine the volatility of power prices and reflect the
uncertainty around any forecast one needs to properly characterize how power prices behave
and reflect the shape of the power price probability distribution.
However, each price forecast is itself subject to random (or apparently random) variation. That
variation can be measured as the variance of price around the expected value. Variance is a
statistical measure of random variation around an expected value. This type of price volatility is
not fully captured by the statistical model. Therefore, in determining the RPP price for eligible
consumers, Navigant and the OEB have developed a methodology that captures and reflects
this potential price volatility. It is referred to as the stochastic adjustment. A discussion of this
methodology and the results of the analysis are presented in the RPP Price Report (May 2014 –
April 2015).
Shor t-Term Forecas t Assumptions 4
3. SHORT-TERM FORECAST ASSUMPTIONS
As discussed above, Navigant has used our statistical model as the primary price forecasting
tool. The sources of the primary modeling assumptions as well as a review of the key
assumptions are presented below.
Broadly, three classes of primary assumptions underpin our short-term HOEP forecast:
1. Demand forecast
2. Supply forecast
3. Fuel Prices
The forecast U.S. - Canada currency exchange rate1 also influences the short term HOEP forecast
indirectly by affecting the price of fuel in Ontario and the price of electricity in neighbouring
U.S. markets. The following sections present the data sources for each of the primary
assumptions in the base case scenario which represents the expected forecast.
3.1 Demand Forecast
The demand forecast is comprised of an energy forecast for each month over the forecast
period. The energy forecast defines the total (sum over all hours) hourly consumption in each
month. The energy forecast is taken from the IESO’s 18-Month Outlook Update: An Assessment of
the Reliability and Operability of the Ontario Electricity System From March 2014 to August 2015
(dated February 28, 2014).
The IESO’s 18-Month Outlook Update bases the energy forecast on “normal weather”. The
“normal weather” forecast assumes that each day in a year experiences weather conditions that
are representative of normal weather conditions for that day.
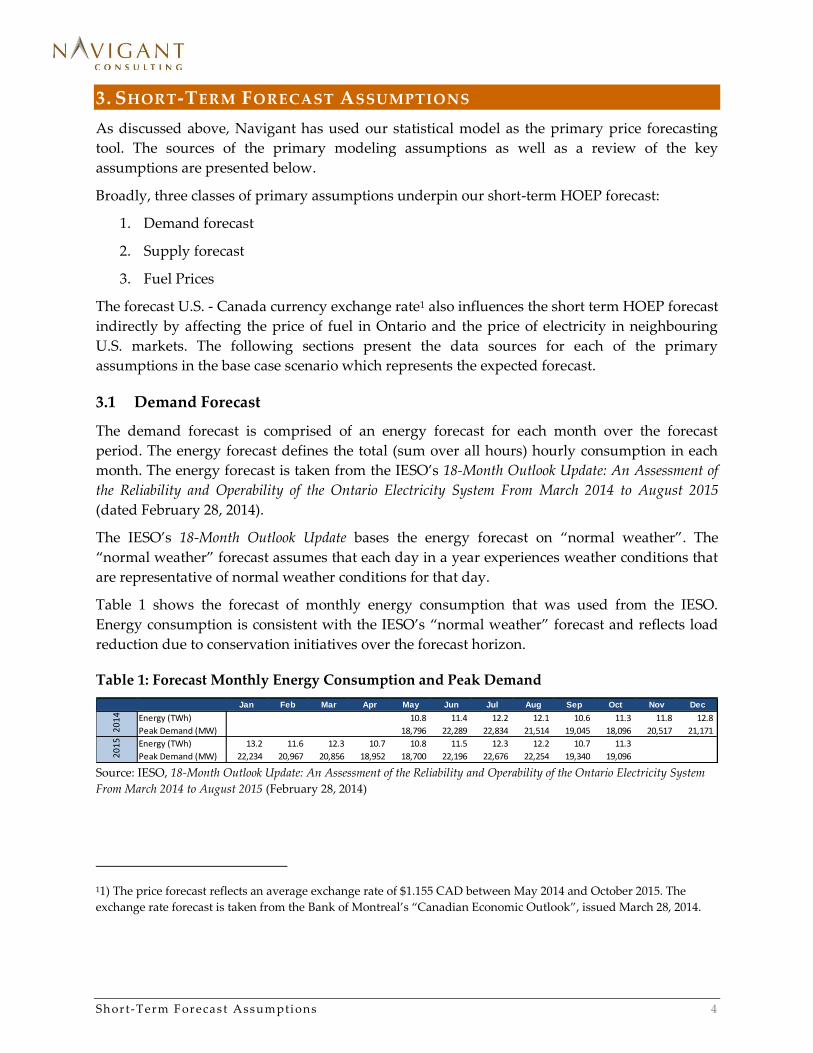
Table 1 shows the forecast of monthly energy consumption that was used from the IESO.
Energy consumption is consistent with the IESO’s “normal weather” forecast and reflects load
reduction due to conservation initiatives over the forecast horizon.
Table 1: Forecast Monthly Energy Consumption and Peak Demand
Source: IESO, 18-Month Outlook Update: An Assessment of the Reliability and Operability of the Ontario Electricity System
From March 2014 to August 2015 (February 28, 2014)
11) The price forecast reflects an average exchange rate of $1.155 CAD between May 2014 and October 2015. The
exchange rate forecast is taken from the Bank of Montreal’s “Canadian Economic Outlook”, issued March 28, 2014.
Jan Feb Mar Apr May Jun Jul Aug Sep Oct Nov Dec
Energy (TWh) 10.8 11.4 12.2 12.1 10.6 11.3 11.8 12.8
Peak Demand (MW) 18,796 22,289 22,834 21,514 19,045 18,096 20,517 21,171
Energy (TWh) 13.2 11.6 12.3 10.7 10.8 11.5 12.3 12.2 10.7 11.3
Peak Demand (MW) 22,234 20,967 20,856 18,952 18,700 22,196 22,676 22,254 19,340 19,096
20
14
20
15

Shor t-Term Forecas t Assumptions 5
3.2 Supply Assumptions
The existing generation capacity assumptions are consistent with the IESO’s 18-Month Outlook
Update (February 28, 2014). This includes the retirement of the remaining coal units at Lambton
and Nanticoke, as well as the retirement of the coal units at Thunder Bay by year end 2014. In
addition to the existing supply resources, several major projects are expected to come on-line
during the forecast horizon, as listed in the IESO’s 18-Month Outlook Update. These projects are
listed in Table 2 and have been included in the model specification. The IESO capacity
additions include the Atikokan conversion to biomass, the South Kent wind project, and a
number of renewable generation projects amounting to 2,417 MW of wind and 280 MW of solar.

Shor t-Term Forecas t Assumptions 6
Table 2: Major Generation Capacity Additions
Source: IESO, 18-Month Outlook Update: An Assessment of the Reliability and Operability of the Ontario Electricity System
From March 2014 to August 2015 (February 28, 2014)
Term Project Name Resource Type Capacity (MW) In-service date
New Third Unit at Harmon Water 78 2014-Q2
Bornish Wind Energy Centre Wind 74 2014-Q3
Silvercreek Solar Park Solar 10 2014-Q3
Cedar Point Wind Power Project Phase II Wind 100 2014-Q3
Adelaide Wind Energy Centre Wind 60 2014-Q3
Jericho Wind Energy Centre Wind 150 2014-Q3
Atikokan conversion to biomass Biomass 205 2014-Q3
White Pines Wind Farm Wind 60 2014-Q3
Thunder Bay Unit 3 Shutdown Coal -153 2014-Q3
Northland Power Solar Abitibi Solar 10 2014-Q3
Northland Power Solar Empire Solar 10 2014-Q3
Northland Power Solar Long Lake Solar 10 2014-Q3
Northland Power Solar Martin's Meadows Solar 10 2014-Q3
Goshen Wind Energy Centre Wind 102 2014-Q3
South Kent Wind Project Wind 270 2014-Q3
Haldimand Wind Project Wind 149 2014-Q4
Leamington Pollution Control Plant Oil 2 2014-Q4
Thunder Bay Unit 2 Shutdown Coal -153 2014-Q4
Adelaide Wind Power Project Wind 40 2014-Q4
Bluewater Wind Energy Centre Wind 60 2014-Q4
Grand Valley Wind Farms (Phase 3) Wind 40 2014-Q4
McLean's Mountain Wind Farm Wind 60 2014-Q4
Kingston Solar Project Solar 100 2014-Q4
Liskeard 1 Solar 10 2014-Q4
Liskeard 3 Solar 10 2014-Q4
Liskeard 4 Solar 10 2014-Q4
Armow Wind Project Wind 180 2014-Q4
New Unit at Smoky Falls Water 89 2014-Q4
Twin Falls Water 5 2014-Q4
Peeshoo Project Water 7 2015-Q1
Wahpeestan Project Water 7 2015-Q1
Wapoose Project Water 7 2015-Q1
Neeskah Project Water 7 2015-Q1
Thunder Bay Unit 3 conversion to biomass Biomass 153 2015-Q1
New Third Unit at Kipling Water 78 2015-Q1
Trout Lake River Hydroelectric Project Water 4 2015-Q1
Second New Unit at Smoky Falls Water 89 2015-Q1
Dufferin Wind Farm Wind 100 2015-Q1
Third New Unit at Smoky Falls Water 89 2015-Q2
Goulais Wind Farm Wind 25 2015-Q2
Gitchi Animki Bezhig Generating Station Water 9 2015-Q2
Gitchi Animki Niizh Generating Station Water 10 2015-Q2
Niagara Region Wind Farm Wind 230 2015-Q2
Bow Lake Phase 1 Wind 20 2015-Q2
Haldimand Solar Project Solar 100 2015-Q2
K2 Wind Project Wind 270 2015-Q2
High Falls Hydropower Development Water 5 2015-Q2
Namewaminikan Waterpower Project Water 10 2015-Q2
Decommission the existing Smoky Falls Units Water -52 2015-Q4
RP
P P
eri
od

Shor t-Term Forecas t Assumption s 7
In addition to the projects in Table 2, the OPA has contracted with renewable energy power
producers under the Renewable Energy Standard Offer Program (RESOP) and the Feed-in
Tariff (FIT) program. Although there was some attrition of RESOP contract holders who
subsequently applied to the FIT program, as of the last quarterly report published by the OPA,
updated for the third quarter of 2013, 851 MW remain under contract, of which 803 MW were
in commercial operation2. Of the 49 MW under development, 36 MW are wind projects, 9 MW
are solar PV projects and 4 MW are bio-energy.
As of September 30, 2013, the OPA had executed 2,066 FIT contracts with a total capacity of
4,541 MW. Of these, 800 contracts representing 950 MW have reached commercial operation
with the remaining balance being under development. About 68% of the total FIT MWs
approved to date are for wind projects, 27% are for solar PV projects, 4% are for hydroelectricity
and 1% is bio-energy projects.
There are over 17,350 microFIT projects that have achieved commercial operation, representing
151 MW of capacity. The government allocated another 200 MW of small FIT projects and 50
MW of microFIT projects to the FIT 2.0 procurement. The FIT 3.0 procurement is also now in
effect, targeting 124MW for 2014. Renewable generation under contract with the OPA supplied
generation equivalent to approximately 9% of Ontario demand in 2013. This is estimated to
increase to 13% by 2014 and 19% in 2015. The effect of this increase in supply is to decrease
Ontario wholesale electricity prices.
3.3 Nuclear Capacity
The statistical model finds that the performance of the nuclear generation fleet is an important
factor in influencing HOEP, so the HOEP forecast needs a forecast of nuclear output. Historical
generation patterns were used to estimate monthly capacity factors for each plant. Average
annual capacity factors range from 74% for Pickering to 90% for Darlington, but all plants show
higher capacity factors during summer and winter and lower capacity factors during the
shoulder seasons (spring and fall). Capacity factors are multiplied by the available capacity
(taking into account capacity additions such as the return to service of Bruce Units 1 and 2) and
the number of hours in each month to estimate monthly nuclear generation.
Table 3: Historical and Forecast Nuclear Capacity Factors
Source: Navigant Consulting analysis of IESO generator disclosure reports.
2 OPA – A Progress Report on Contracted Electricity Supply 2013 Third Quarter
2010 2011 2012 2013 2014 RPP Year 18 Months
Average monthly MW 9,461 9,739 9,689 10,344 11,080 11,326 11,335
Average monthly capacity 11,378 11,378 11,628 12,878 12,878 12,878 12,878
Annual capacity factor 83.1% 85.6% 83.3% 80.3% 86.0% 88.0% 88.0%

Shor t-Term Forecas t Assumptions 8
3.4 Transmission Capabilities and Constraints
Given that the HOEP is based on a uniform price which does not reflect transmission
congestion within Ontario, internal Ontario transmission constraints are not tracked in the
forecast model. The transfer capabilities of transmission interconnections with adjacent markets
are shown in the IESO’s Ontario Transmission System (May 24, 2013) report, differentiated by
season and direction of flow. Table 4 shows the ratings of Ontario’s interconnections with
adjacent markets based on the information presented in this report.
Table 4: Ontario Interconnection Limits
Source: IESO, Ontario Transmission System, November 22, 2013
3.5 Fuel Prices
Given the uncertainty associated with fuel price forecasts, Navigant typically relies on liquid
financial and physical markets to specify the underlying fuel forecasts we use in power market
modeling, unless our clients derive their own forecasts. Since we forecast prices in US dollars,
we specify fuel prices within the model in US dollars.
Natural Gas
For short-term forecasts, we use the futures prices as reported publicly on the NYMEX website
in US$/MMBtu. Sufficient liquidity exists through the end of the forecast period to justify this
source. To reduce the volatility associated with taking a snap-shot of future prices on a single
day, an average of settlement prices over the past three week period is used. This is similar to
the process that Enbridge Gas Distribution and Union Gas use in determining forecast natural
gas prices as part of their quarterly rate adjustment mechanism (QRAM) applications to the
OEB.
Interconnection Flows Out of Ontario Flows Into
Manitoba
Summer 288 288
Winter 300 300
Minnesota
Summer 150 100
Winter 150 100
Michigan
Summer 1,700 1,550
Winter 1,750 1,550
New York
Summer 1,800 1,800
Winter 2,390 1,870
Quebec
Summer 2,135 2,775
Winter 2,170 2,795

Shor t-Term Forecas t Assumptions 9
To these futures prices, we apply a basis differential. For natural gas this basis differential is
from Henry Hub to the Dawn trading hub in South-western Ontario. This basis differential is
based on Navigant’s North American gas price forecast.
Natural gas price assumptions are presented in Table 5 below. All prices are in dollars per
MMBtu – US dollars for Henry Hub, Canadian dollars for Dawn. The forecast average Dawn
natural gas price for the twelve months commencing May 2014 is C$5.40/MMBtu. The forecast
average price over the entire 18-month period is C$5.24/MMBtu. The twelve-month forecast
was used to establish the RPP prices in the RPP Price Report (May 2014 – April 2015).
Table 5: Natural Gas Price Forecast
Source: NYMEX, Navigant Consulting
Term MonthHenry Hub
(US $/MMBtu)
Dawn
(C$/MMBtu)
May-14 $4.43 $5.19
Jun-14 $4.46 $5.22
Jul-14 $4.50 $5.21
Aug-14 $4.49 $5.21
Sep-14 $4.46 $5.22
Oct-14 $4.47 $5.30
Nov-14 $4.52 $5.43
Dec-14 $4.63 $5.66
Jan-15 $4.71 $5.84
Feb-15 $4.67 $5.82
Mar-15 $4.56 $5.73
Apr-15 $4.09 $4.95
May-15 $4.06 $4.95
Jun-15 $4.08 $4.96
Jul-15 $4.10 $4.91
Aug-15 $4.10 $4.91
Sep-15 $4.07 $4.91
Oct-15 $4.09 $4.94
RP
P Y
ear
Oth
er

Shor t-Term Forecas t Assumptions 10
3.6 Coal Prices and Output
With the closure of OPG’s remaining coal units at both Nanticoke and Lambton at year end
2013, the influence of coal generation on market prices is expected to be neutral. Generation
supplied from the last remaining coal unit at Thunder Bay is not expected to impact market
prices.
3.7 Hydro Resources
Navigant’s statistical model for Ontario requires a specification of the monthly average
hydroelectric output for the province. In our base case, we assume a normal hydroelectric
resource level. Our forecast of hydroelectric generation is based on a statistical analysis of
historical monthly generation and its seasonality pattern. Generation has been modestly lower
than average over the last six months (October 2013 – March 2014). For the forecast, we have
assumed a normal output over the forecast period.

Review of Forecast Results 11
4. REVIEW OF FORECAST RESULTS
Table 6 presents the results of our base case market price forecast based on our statistical model.
The prices presented are simple (i.e., not load-weighted) averages.
The seasonal price distribution is reasonably reflective of the seasonal pattern of prices that we
would expect given that the highest loads are experienced in the summer and winter months
and lower loads are experienced in the “shoulder” months of April, May, October and
November. An additional factor contributing to the seasonal price pattern is the typical output
profile of Ontario’s hydroelectric generation. September is generally the lowest hydro output
month, with May and June representing the highest output based on the spring freshet.3
Nuclear and thermal maintenance outages tend to be scheduled in the shoulder seasons,
reducing the price impact of lower demand in the shoulder seasons and the spring freshet.
Table 6: HOEP Forecast (CAD $ per MWh)
Source: Navigant Consulting
Notes:
1) The price forecast reflects an average exchange rate of $1.155 CAD between May 2014 and October 2015. The
exchange rate forecast is taken from the Bank of Montreal’s “Canadian Economic Outlook”, issued March 28, 2014.
2) On-peak hours include the hours ending at 8 a.m. through 11 p.m. Eastern Time (EST) on working weekdays and
off-peak hours include all other hours.
This price forecast is based on market fundamentals and reflects the assumptions used for the
forecast from the statistical model. To the degree that actual market variables (gas prices, hourly
loads and generator availabilities) are different from our forecast assumptions, market prices
are likely to differ from our forecast. As an example of the variability of electricity prices over
time, Figure 1 presents the distribution of the hourly HOEP since market opening, and
Figure 2 presents the distribution of monthly average prices since market opening. The HOEP is
captured on the x-axis and the number of times that the HOEP occurred is reflected in the
3 Freshet is the period during which melted snow causes the rise or overflowing of streams in Ontario.
Term Quarter Calendar Period On-Peak Off-Peak Average Term Average
RP
P Y
ea
r Q1 May 14 - Jul 14 $33.12 $21.55 $26.89
Q2 Aug 14 - Oct 14 $31.25 $20.03 $25.13
Q3 Nov 14 - Jan 15 $35.34 $25.15 $29.79
Q4 Feb 15 - Apr 15 $28.16 $18.98 $23.21 $26.28
RP
P Y
ea
rO
ther
Q1 May 15 - Jul 15 $26.95 $16.42 $21.29
Q2 Aug 15 - Oct 15 $28.17 $17.90 $22.57 $21.93Oth
er

Review of Forecast Results 12
height of the bars. A key takeaway from these curves is that both are skewed to the right,
indicating that the average value is higher than the median or 50% percentile value.
Not surprisingly, the hourly price distribution is significantly more skewed to the right than the
monthly price distribution, reflecting the averaging that occurs for the monthly prices. While
not as skewed as the distribution of hourly prices,
Figure 2 demonstrates that even the distribution of monthly prices is skewed to the right.
Figure 1: Historic Distribution of Hourly HOEP
0%
5%
10%
15%
20%
25%
30%
$0 $30 $60 $90 $120 $150 $180
Pro
bab
ility
of
Occ
ura
nce
HOEP ($/MWh)
Cumulative Probability
5% 90% 5%
$11.80 $95.61

Review of Forecast Results 13
Source: Navigant Consulting analysis of IESO data (May 2002 to March 2014)
Figure 2: Historic Distribution of Monthly Average HOEP
Source: Navigant Consulting analysis of IESO data (May 2002 to March 2014)
-5%
0%
5%
10%
15%
20%
25%
30%
$0 $30 $60 $90
Pro
bab
ility
of
Occ
ura
nce
Monthly Simple AverageHOEP ($/MWh)
Cumulative Probability
5% 90% 5%
$20.04 $76.04

Assessment of Forecas t Risks 14
5. ASSESSMENT OF FORECAST RISKS
As discussed above, the foundation of our HOEP forecast is a statistical model of the Ontario
electricity market. This forecast is developed using single point forecasts for each of the
determinants of price. There could be considerable variability in each of these assumptions. In
setting the RPP price, Navigant and the OEB have used statistical analysis to evaluate the
uncertainty around this market price forecast and the impact on the RPP price. We believe that
this probability analysis allows the OEB to adequately evaluate forecast risks when determining
the RPP price. In this chapter we review the factors that present the greatest forecast risk and
assess, in qualitative terms, the degree to which the forecast has addressed them.
Navigant believes that there are three major risks that a specific electricity price forecast will not
be realized. These stem from differences between forecast and actual: (1) load; (2) fuel prices;
and (3) generator availabilities. Each of these forecast risks are assessed below.
5.1 Load Forecast Risk
As discussed, the energy demand forecast used by Navigant was developed by the IESO. Their
energy consumption forecast is based on a forecast of economic activity in Ontario and the
assumption that weather conditions will be “normal”, i.e., reflective of 30-year average weather
over the entire forecast period. To the degree that this economic forecast is wrong or weather
conditions depart significantly from normal, as was experienced in the summer of 2005, actual
energy consumption would be expected to vary from forecast consumption. In addition, other
factors, such as economic activity or consumer behaviour, will cause actual loads to vary from
the forecast. For our short-term forecast, Navigant believes that the greatest source of load
forecast risk is weather. The IESO’s February 28, 2014 18-Month Outlook Update forecasts a
normal weather summer peak of 22,808 MW and an extreme weather peak of 24,675 MW for the
summer of 2015, reflecting how load is forecast to increase under more extreme weather
conditions. The variability in loads was specifically considered in the analysis which is
reviewed in the companion report, RPP Price Report (May 2014 – April 2015). Analysis of
historical price and demand levels clearly demonstrates that load variability is a major
contributor to spot market price volatility. Therefore, Navigant believes that this risk has been
considered in our price forecasting approach.
5.2 Fuel Price Forecast Risk
In general, the fuel price with the greatest impact on electricity market prices is the gas price.
Currently, Ontario has a moderate amount of natural gas-fired generation that is likely to set
the HOEP. However, natural gas-fired generation in the Ontario market will grow over time.
The largest natural gas facilities include Lennox (2,140 MW) which is also capable of burning
residual oil, the Greenfield Energy Centre (1,005 MW), Goreway Station (839 MW), Halton Hills
Generating Station (632 MW), St. Clair Energy Centre (577 MW), Brighton Beach Power Station
(550 MW), Portlands Energy Centre (550 MW), the Sarnia Regional Cogeneration Plant (505
MW), Thorold Cogeneration Plant (287 MW), GTAA Cogeneration Plant (90 MW) and the York
Energy Center (393 MW). The total gas-fired generation operating under contract is
approximately 5,570 MW. There is also a considerable amount of natural gas-fired generation

Assessment of Forecas t Risks 15
in interconnected markets, i.e., primarily New York and Michigan. While generation from these
markets cannot set the HOEP under the IESO’s Intertie Offer Guarantee rule, it nonetheless has
an influence on Ontario market prices.
The gas prices used by Navigant for this forecast were based on NYMEX futures prices. While
we believe that the NYMEX futures represent an appropriate fuel price outlook, as with any
forecast there is a significant degree of risk that forecast fuel prices will not be realized.
The most obvious risk associated with natural gas prices is the inherent price volatility of the
commodity itself. Figure 3 illustrates the trend in forward prices for natural gas for March 2014
delivery since January 2008. When using futures prices for forecasting purposes, the point in
time when the natural gas price outlook is cast is another source of risk. To minimize the RPP
exposure to this risk, Navigant and the OEB have used an average of settlement prices for
futures contracts over a three-week period. This averaging approach mitigates some of the
short-term volatility in natural gas prices. Nonetheless, there is a risk that the natural gas price
forecast will be wrong, leading to higher or lower electricity prices than forecast.
Figure 3: Historical March 2014 Futures Prices (US$/MMBtu)
Source: NYMEX
Lennox is the only major Ontario generator which burns oil, but generally residual oil is not its
primary fuel. Furthermore, there is a relatively limited amount of oil-fired generation in

Assessment of Forecas t Risks 16
Ontario’s interconnected markets. Therefore, Ontario electricity market prices are not
significantly influenced by oil prices.
Based on this assessment and the experience of the late summer and fall of 2005 (when both gas
and electricity prices were very high), and the winter of 2006/2007 (when prices were low),
Navigant believes that the most significant fuel price forecast risk remains natural gas. A cold
winter or hot summer that increases the demand for natural gas-fired generation can result in
significant increases in natural gas prices. Conversely, a warm winter or cool summer can result
in a softening of near-term natural gas prices.
Navigant has evaluated the impact of a ±20% change in Henry Hub natural gas prices on the
HOEP. The results of this analysis are shown in Figure 4 which shows the monthly average
HOEP for the base case as well as high and low natural gas price sensitivities. This analysis
indicates that the forecast of HOEP increased by an average of 15% when natural gas prices
were assumed to be 20% higher than forecast, and decreased by an average of 15% when
natural gas prices were assumed to be 20% lower than forecast. HOEP has become more
sensitive to increases in gas prices as the amount of coal generation available declines and the
amount of gas generation increases.
Figure 4: Comparison of Monthly Average HOEP with ±20% Change in Henry Hub Gas Price
Source: Navigant Consulting
$0
$5
$10
$15
$20
$25
$30
$35
$40
HO
EP
($
/MW
h)
Impact of Gas Price on HOEP
20% Increase in Gas Price
Base Case
20% Decrease in Gas Price

Assessment of Forecas t Risks 17
5.3 Generator Availability Price Risks
The third major source of electricity price forecast risk pertains to the availability of Ontario
generation. Changes in the availability of Ontario’s nuclear fleet are likely to have the most
dramatic impact on market prices. A 2% change in capacity factor for Ontario’s nuclear fleet
results in a 2.3 TWh change in the availability of low variable cost energy from nuclear capacity.
This change in nuclear output is most likely to affect the requirements for Ontario fossil
generation.