Embed Size (px)
Citation preview
Biogeosciences, 10, 5681–5689, 2013www.biogeosciences.net/10/5681/2013/doi:10.5194/bg-10-5681-2013© Author(s) 2013. CC Attribution 3.0 License.
EGU Journal Logos (RGB)
Advances in Geosciences
Open A
ccess
Natural Hazards and Earth System
Sciences
Open A
ccess
Annales Geophysicae
Open A
ccess
Nonlinear Processes in Geophysics
Open A
ccess
Atmospheric Chemistry
and Physics
Open A
ccess
Atmospheric Chemistry
and Physics
Open A
ccess
Discussions
Atmospheric Measurement
Techniques
Open A
ccess
Atmospheric Measurement
Techniques
Open A
ccess
Discussions
Biogeosciences
Open A
ccess
Open A
ccess
BiogeosciencesDiscussions
Climate of the Past
Open A
ccess
Open A
ccess
Climate of the Past
Discussions
Earth System Dynamics
Open A
ccess
Open A
ccess
Earth System Dynamics
Discussions
GeoscientificInstrumentation
Methods andData Systems
Open A
ccess
GeoscientificInstrumentation
Methods andData Systems
Open A
ccess
Discussions
GeoscientificModel Development
Open A
ccess
Open A
ccess
GeoscientificModel Development
Discussions
Hydrology and Earth System
Sciences
Open A
ccess
Hydrology and Earth System
Sciences
Open A
ccess
Discussions
Ocean Science
Open A
ccess
Open A
ccess
Ocean ScienceDiscussions
Solid Earth
Open A
ccess
Open A
ccess
Solid EarthDiscussions
The Cryosphere
Open A
ccess
Open A
ccess
The CryosphereDiscussions
Natural Hazards and Earth System
SciencesO
pen Access
Discussions
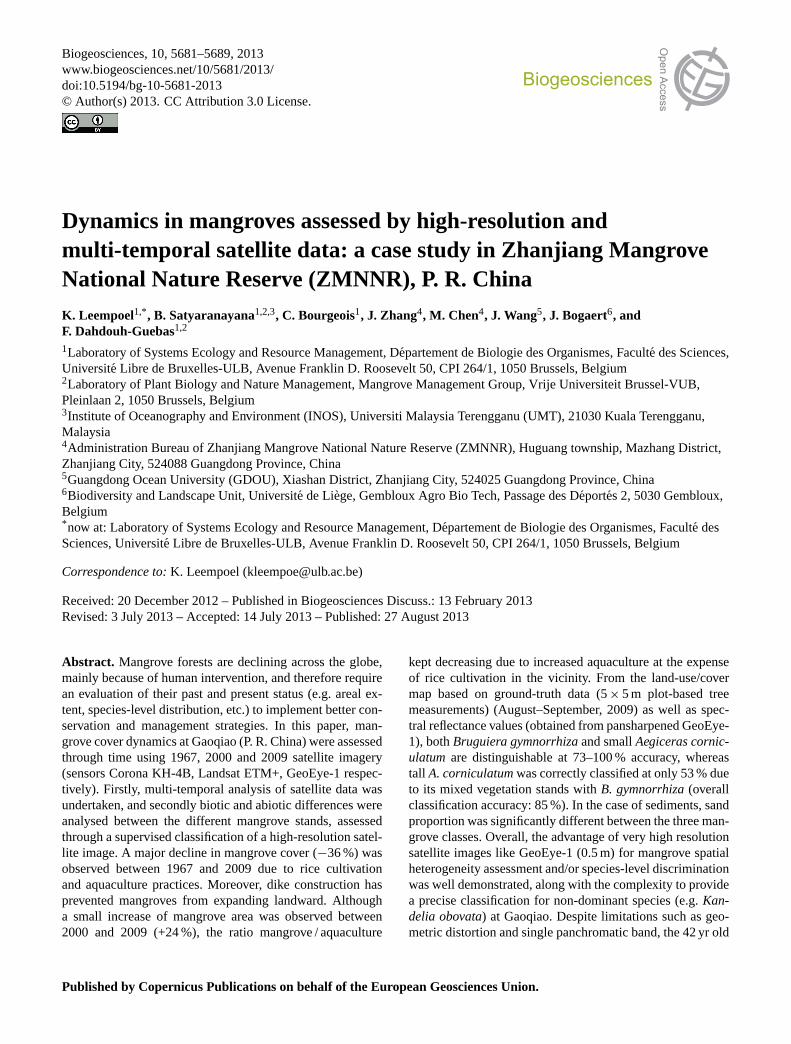
Dynamics in mangroves assessed by high-resolution andmulti-temporal satellite data: a case study in Zhanjiang MangroveNational Nature Reserve (ZMNNR), P. R. China
K. Leempoel1,*, B. Satyaranayana1,2,3, C. Bourgeois1, J. Zhang4, M. Chen4, J. Wang5, J. Bogaert6, andF. Dahdouh-Guebas1,2
1Laboratory of Systems Ecology and Resource Management, Departement de Biologie des Organismes, Faculte des Sciences,Universite Libre de Bruxelles-ULB, Avenue Franklin D. Roosevelt 50, CPI 264/1, 1050 Brussels, Belgium2Laboratory of Plant Biology and Nature Management, Mangrove Management Group, Vrije Universiteit Brussel-VUB,Pleinlaan 2, 1050 Brussels, Belgium3Institute of Oceanography and Environment (INOS), Universiti Malaysia Terengganu (UMT), 21030 Kuala Terengganu,Malaysia4Administration Bureau of Zhanjiang Mangrove National Nature Reserve (ZMNNR), Huguang township, Mazhang District,Zhanjiang City, 524088 Guangdong Province, China5Guangdong Ocean University (GDOU), Xiashan District, Zhanjiang City, 524025 Guangdong Province, China6Biodiversity and Landscape Unit, Universite de Liege, Gembloux Agro Bio Tech, Passage des Deportes 2, 5030 Gembloux,Belgium* now at: Laboratory of Systems Ecology and Resource Management, Departement de Biologie des Organismes, Faculte desSciences, Universite Libre de Bruxelles-ULB, Avenue Franklin D. Roosevelt 50, CPI 264/1, 1050 Brussels, Belgium
Correspondence to:K. Leempoel ([email protected])
Received: 20 December 2012 – Published in Biogeosciences Discuss.: 13 February 2013Revised: 3 July 2013 – Accepted: 14 July 2013 – Published: 27 August 2013
Abstract. Mangrove forests are declining across the globe,mainly because of human intervention, and therefore requirean evaluation of their past and present status (e.g. areal ex-tent, species-level distribution, etc.) to implement better con-servation and management strategies. In this paper, man-grove cover dynamics at Gaoqiao (P. R. China) were assessedthrough time using 1967, 2000 and 2009 satellite imagery(sensors Corona KH-4B, Landsat ETM+, GeoEye-1 respec-tively). Firstly, multi-temporal analysis of satellite data wasundertaken, and secondly biotic and abiotic differences wereanalysed between the different mangrove stands, assessedthrough a supervised classification of a high-resolution satel-lite image. A major decline in mangrove cover (−36 %) wasobserved between 1967 and 2009 due to rice cultivationand aquaculture practices. Moreover, dike construction hasprevented mangroves from expanding landward. Althougha small increase of mangrove area was observed between2000 and 2009 (+24 %), the ratio mangrove / aquaculture
kept decreasing due to increased aquaculture at the expenseof rice cultivation in the vicinity. From the land-use/covermap based on ground-truth data (5× 5 m plot-based treemeasurements) (August–September, 2009) as well as spec-tral reflectance values (obtained from pansharpened GeoEye-1), bothBruguiera gymnorrhizaand smallAegiceras cornic-ulatum are distinguishable at 73–100 % accuracy, whereastall A. corniculatumwas correctly classified at only 53 % dueto its mixed vegetation stands withB. gymnorrhiza(overallclassification accuracy: 85 %). In the case of sediments, sandproportion was significantly different between the three man-grove classes. Overall, the advantage of very high resolutionsatellite images like GeoEye-1 (0.5 m) for mangrove spatialheterogeneity assessment and/or species-level discriminationwas well demonstrated, along with the complexity to providea precise classification for non-dominant species (e.g.Kan-delia obovata) at Gaoqiao. Despite limitations such as geo-metric distortion and single panchromatic band, the 42 yr old
Published by Copernicus Publications on behalf of the European Geosciences Union.
5682 K. Leempoel et al.: Dynamics in mangroves assessed by satellite data in Gaoqiao, China
Corona declassified images are invaluable for land-use/coverchange detections when compared to recent satellite datasets.
1 Introduction
Mangroves provide a wide array of ecological and economicbenefits (Dahdouh-Guebas and Koedam, 2006a; Dahdouh-Guebas et al., 2006a; Nagelkerken et al., 2008; Walters etal., 2008). However, they are presently considered as one ofthe most threatened ecosystems in the world (Duke et al.,2007). In fact, mangroves once fringing∼ 75 % of tropicalcoasts (Chapman, 1976) are reduced to about 25 % mainlydue to human intervention (Ronnback, 1999); recent esti-mates on global mangrove cover indicate between 137 760and 152 000 km2 of mangrove forest remaining in 123 coun-tries and territories (Giri et al., 2011; Spalding et al., 2010).In general, mangrove denudation at the rate of 2.1 % annu-ally is much higher than the loss of tropical forests and coralreefs (Valiela et al., 2001).
This constant pressure on mangrove ecosystems under-lines the demand for mangrove biogeographical data andvegetation maps (produced at species level and areal extent)that can ultimately be used by local authorities for better con-servation and management practices (Masso i Aleman et al.,2010). With the difficulty of conventional monitoring tech-niques in mangrove environments, the data obtained fromaerial and/or satellite remote sensing sensors became essen-tial, particularly when analysing vegetation history and dy-namics (Dahdouh-Guebas and Koedam, 2008). The coarseresolution of most remote sensors (e.g. Landsat, SPOT, etc.)provides enough information to discriminate mangroves atthe species level but only for large and homogeneous stands.In mangrove research, both spatial and spectral resolutionneed to be high to enable delineation of small patch size ofcertain species. In this context, modern sensors like IKONOS(1 m), QuickBird (2.4 m) and GeoEye-1 (0.5 m) provide veryhigh resolution (VHR) images that enable spotting volumi-nous single trees on the ground (Dahdouh-Guebas et al.,2004). Overall, remote sensing, combined with ground-truthobservations in a GIS environment, remains time-saving aswell as cost-effective for qualitative and quantitative assess-ment of the mangrove vegetation (Dahdouh-Guebas, 2002;Dahdouh-Guebas et al., 2006b; Satyanarayana et al., 2011;Green et al., 2000).
The main objective of the present study was to analysethe spatial heterogeneity of different mangrove species atGaoqiao (Leizhou Peninsula, China) using ground-truth andhigh-resolution satellite imagery (GeoEye-1 data). Firstly,a diachronic observation of three satellite images (obtainedfrom Corona KH-4B, Landsat ETM+ and GeoEye-1) en-abled the assessment of land cover change and mangroveextent over a 42 yr period (1967–2000–2009). Secondly, abi-
otic and biotic factors influencing local mangrove distribu-tion were compared between the different mangrove stands,assessed through a supervised classification of the very highresolution GeoEye-1 satellite image.
2 Materials and methods
2.1 Study area
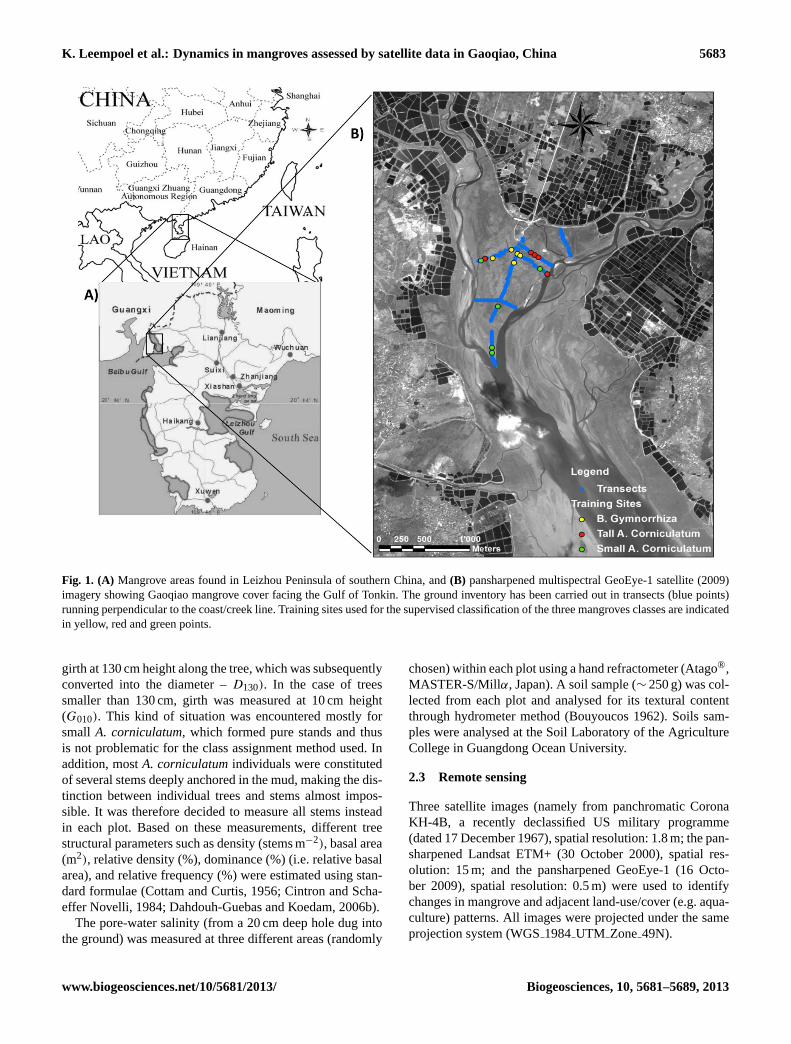
The study was conducted near Gaoqiao (facing the Gulf ofTonkin on Leizhou Peninsula) in southern China (Fig. 1),where the mangroves are managed by the Zhanjiang Man-grove National Nature Reserve (ZMNNR). The conservationarea in Leizhou Peninsula has been estimated to be 20 000 haof which 12 375 ha consist of the actual mangrove vegeta-tion that occurs in discontinuous patches and fringes alongthe coast, mostly because of aquaculture activities. The re-maining area (7625 ha) consists of mudflats potentially suit-able for mangrove propagation (Chen et al., 2009; ZMNNR,2010). The historic extent of mangroves on Leizhou Penin-sula was estimated at 14 027 ha in 1957 (Gao et al., 2009).Being the largest mangrove wetland in China (Li and Lee,1997; Chen et al., 2009), its rich biodiversity was repre-sented by 22 mangrove species (Gao et al., 2009), 82 birdspecies, 48 gastropods and shellfish species, and 11 finfishspecies (Ramsar, 2009). The study zone of Gaoqiao con-sidered for the present investigation comprises 2000 ha ofmangrove (21◦33′55′′ N and 109◦45′17′′ E), represented byseven mangrove species includingAegiceras corniculatum(L.) Blanco, Avicennia marina(Forssk.) Vierh.,Bruguieragymnorrhiza(L.) Lamk.,Excoecaria agallochaL., Kandeliaobovata(Sheue),Rhizophora stylosaGriff., and Sonneratiaapetala(Buch.-Ham). A Ramsar status (no. 1157) was con-ferred to the whole ZMNNR in January 2002. Plantations inopen areas are mostly constituted ofB. gymnorrhiza.
The study area is influenced by a northern tropical climatewith the mean annual temperature of 23◦C and precipitationof 1500 mm (Gao et al., 2009). The coldest and hottest daysare during January and July, respectively. The rainfall, withuneven rates of precipitation, lasts from May to September.The tides are diurnal with a salinity between 20 and 23 ‰,and pH from 7.6 to 7.8 (Liang and Dong, 2004).
2.2 Fieldwork
Data on mangrove vegetation, pore-water salinity and sedi-ment characteristics were collected along nine transects (run-ning perpendicular to the coast/creek line) in 5 m× 5 m areaplots at 50 m intervals (Fig. 1). A total number of 70 plots,located in the main stands of the high tide area, were studiedbetween 6 August and 8 September, 2009. The geographi-cal coordinates of all plots were obtained using a handheldglobal positioning system (Garmin, GPS 60™, USA) (accu-racy< 6 m). In each plot, the vegetation data consisted of treeidentification, height (m) and girthG130 measurements (the
Biogeosciences, 10, 5681–5689, 2013 www.biogeosciences.net/10/5681/2013/
K. Leempoel et al.: Dynamics in mangroves assessed by satellite data in Gaoqiao, China 5683
Fig. 1. (A) Mangrove areas found in Leizhou Peninsula of southern China, and(B) pansharpened multispectral GeoEye-1 satellite (2009)imagery showing Gaoqiao mangrove cover facing the Gulf of Tonkin. The ground inventory has been carried out in transects (blue points)running perpendicular to the coast/creek line. Training sites used for the supervised classification of the three mangroves classes are indicatedin yellow, red and green points.
girth at 130 cm height along the tree, which was subsequentlyconverted into the diameter –D130). In the case of treessmaller than 130 cm, girth was measured at 10 cm height(G010). This kind of situation was encountered mostly forsmall A. corniculatum, which formed pure stands and thusis not problematic for the class assignment method used. Inaddition, mostA. corniculatumindividuals were constitutedof several stems deeply anchored in the mud, making the dis-tinction between individual trees and stems almost impos-sible. It was therefore decided to measure all stems insteadin each plot. Based on these measurements, different treestructural parameters such as density (stems m−2), basal area(m2), relative density (%), dominance (%) (i.e. relative basalarea), and relative frequency (%) were estimated using stan-dard formulae (Cottam and Curtis, 1956; Cintron and Scha-effer Novelli, 1984; Dahdouh-Guebas and Koedam, 2006b).
The pore-water salinity (from a 20 cm deep hole dug intothe ground) was measured at three different areas (randomly
chosen) within each plot using a hand refractometer (Atago®,MASTER-S/Millα, Japan). A soil sample (∼ 250 g) was col-lected from each plot and analysed for its textural contentthrough hydrometer method (Bouyoucos 1962). Soils sam-ples were analysed at the Soil Laboratory of the AgricultureCollege in Guangdong Ocean University.
2.3 Remote sensing
Three satellite images (namely from panchromatic CoronaKH-4B, a recently declassified US military programme(dated 17 December 1967), spatial resolution: 1.8 m; the pan-sharpened Landsat ETM+ (30 October 2000), spatial res-olution: 15 m; and the pansharpened GeoEye-1 (16 Octo-ber 2009), spatial resolution: 0.5 m) were used to identifychanges in mangrove and adjacent land-use/cover (e.g. aqua-culture) patterns. All images were projected under the sameprojection system (WGS1984UTM Zone49N).
www.biogeosciences.net/10/5681/2013/ Biogeosciences, 10, 5681–5689, 2013
5684 K. Leempoel et al.: Dynamics in mangroves assessed by satellite data in Gaoqiao, China
The panchromatic Corona image was obtained from theUnited States Geological Survey (USGS), and georeferencedusing ground control points (GCPs) against the GeoEye-1(ArcMap v. 9.3.1). Since it contains only single-band in-formation, the supervised and/or un-supervised classificationtechniques were not supported. Instead, the mangrove area in1967 was extracted by on-screen digitization. As the aqua-culture ponds were not easily recognizable in 1967, the man-grove / aquaculture ratio was calculated only for 2000 and2009.
Both GeoEye-1 (satellite image produced by GeoEye) andLandsat ETM+ (courtesy of the U.S. Geological Survey)images were subjected to pansharpening (applying Broveytransformation and nearest-neighbour resampling techniquein ERDAS IMAGINE® v. 8.5) for clear identification of thefeatures. In the case of recent (2009) data, the pansharp-ened NDVI (normalized difference vegetation index) layerof GeoEye-1 was added to the pansharpened multispectralimage of GeoEye-1 as a band. Supervised classifications ofmangrove and aquaculture cover were carried out on bothimages using maximum likelihood classification to achievebetter accuracy (Green et al., 2000).
Discrimination of current mangrove stands was only per-formed on GeoEye-1 image. All aforementioned specieswere sampled during fieldwork; however, onlyB. gymnor-rhiza andA. corniculatumformed large pure stands. Withinmangroves, three different classes were defined by five man-grove plots each through the training sets of the signature ed-itor (Fig. 1) (Neukermans et al., 2008; Satyanarayana et al.,2011).Bruguiera gymnorrhizatraining sites were defined bythe five highest values of dominance while the two classes ofA. corniculatum(i.e. tall A. corniculatumand smallA. cor-niculatum) were defined by high dominance as well as av-erage tree height (five highest and five smallest respectively)(Table 1). Other classes in the supervised classification in-cluded water, sand, open area (i.e. grassland), and aquacul-ture ponds (in total seven classes including mangroves). Fi-nally, the accuracy assessment of the land-use/cover map wascarried out using confusion matrix with 113 GCPs scatteredacross mangrove and non-mangrove areas.
2.4 Correlation between dominant vegetation andabiotic factors
Information on soil texture and pore-water salinity for eachplot was regrouped according to the mangrove class of theplot. One-way analysis of variance (ANOVA) was appliedto test whether the means of the groups were equal, whileStudent’st tests (with Bonferroni correction) were used tocompare two groups. For some data sets, however, conditionsof application for using ANOVA were not observed. In suchcases, the Kruskal–Wallis test substituted the ANOVA, andthe Wilcoxon rank sum test replaced the Student’st test. Allstatistical tests were computed using R (R Development CoreTeam, 2010).
Table 1.Relative dominance and average height ofA. corniculatumandB. gymnorrhizain sample plots used to define mangrove classesfor supervised classification (maximum likelihood classification) inZMNNR, Gaoqiao, China.
Relative dominance (%)
Plot Aegiceras Bruguiera TreeID corniculatum gymnorrhiza height
(cm)
Bruguiera A07 0.00 0.96 304gymnorrhiza B02 0.04 0.96 244
B06 0.01 0.95 234D01 0.04 0.92 332A05 0.06 0.89 302
Aegiceras C05 0.80 0.20 313corniculatum C03 0.62 0.38 311(tall) D08 1.00 0.00 308
C04 0.68 0.29 292B07 0.68 0.32 265
Aegiceras F04 0.80 0.06 89corniculatum B08 1.00 0.00 83(small) D06 1.00 0.00 74
AE04 1.00 0.00 66F05 1.00 0.00 61
3 Results
3.1 Mangrove cover dynamics
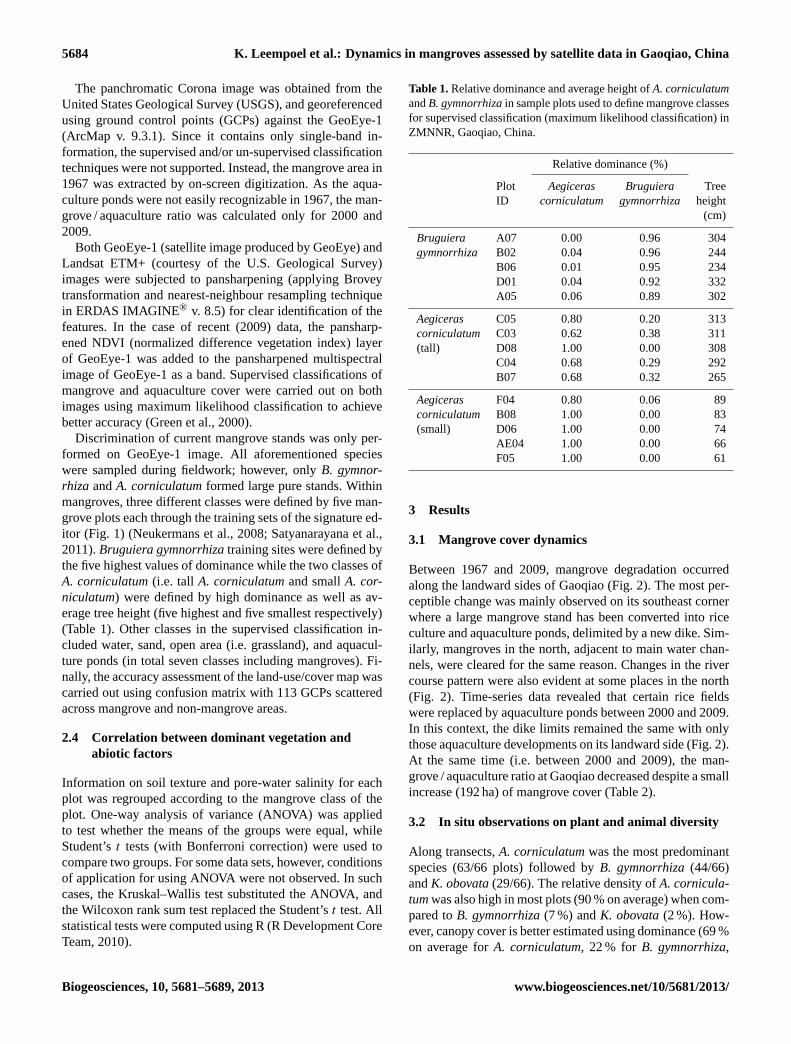
Between 1967 and 2009, mangrove degradation occurredalong the landward sides of Gaoqiao (Fig. 2). The most per-ceptible change was mainly observed on its southeast cornerwhere a large mangrove stand has been converted into riceculture and aquaculture ponds, delimited by a new dike. Sim-ilarly, mangroves in the north, adjacent to main water chan-nels, were cleared for the same reason. Changes in the rivercourse pattern were also evident at some places in the north(Fig. 2). Time-series data revealed that certain rice fieldswere replaced by aquaculture ponds between 2000 and 2009.In this context, the dike limits remained the same with onlythose aquaculture developments on its landward side (Fig. 2).At the same time (i.e. between 2000 and 2009), the man-grove / aquaculture ratio at Gaoqiao decreased despite a smallincrease (192 ha) of mangrove cover (Table 2).
3.2 In situ observations on plant and animal diversity
Along transects,A. corniculatumwas the most predominantspecies (63/66 plots) followed byB. gymnorrhiza(44/66)andK. obovata(29/66). The relative density ofA. cornicula-tumwas also high in most plots (90 % on average) when com-pared toB. gymnorrhiza(7 %) andK. obovata(2 %). How-ever, canopy cover is better estimated using dominance (69 %on average forA. corniculatum, 22 % for B. gymnorrhiza,
Biogeosciences, 10, 5681–5689, 2013 www.biogeosciences.net/10/5681/2013/

K. Leempoel et al.: Dynamics in mangroves assessed by satellite data in Gaoqiao, China 5685
20
1
Figure 2. Changes in Gaoqiao mangrove cover observed from 1967 (Corona), 2000 (Landsat) 2
and 2009 (GeoEye-1) satellite data and expansion of aquaculture ponds observed from 2000 3
(Landsat) and 2009 (GeoEye-1) satellite data (background: 1967 Corona imagery). 4
Fig. 2. Changes in Gaoqiao mangrove cover observed from 1967(Corona), 2000 (Landsat) and 2009 (GeoEye-1) satellite data andexpansion of aquaculture ponds observed from 2000 (Landsat)and 2009 (GeoEye-1) satellite data (background: 1967 Corona im-agery).
and 6 % forK. obovata) than with relative density, makingdominance, in this case, more appropriate for a supervisedclassification of remote sensing imagery. No understory wasobserved, except for seedlings.E. agallochawas seen rarelybut always surrounded by a circle of 2–3 m, clear of vegeta-tion. Three crab species (Sesarma bidens(De Haan, 1835),Parasesarma affinis(De Man, 1895) andUca arcuata(DeHaan, 1833)) which may have a role in nutrient dynamics insoil were identified. The overload of barnacles on the leafand stems ofA. corniculatumand Avicennia marina(treespresent along the major water channels) might be also an im-portant growth-affecting factor at Gaoqiao.
3.3 Land-use/cover classification
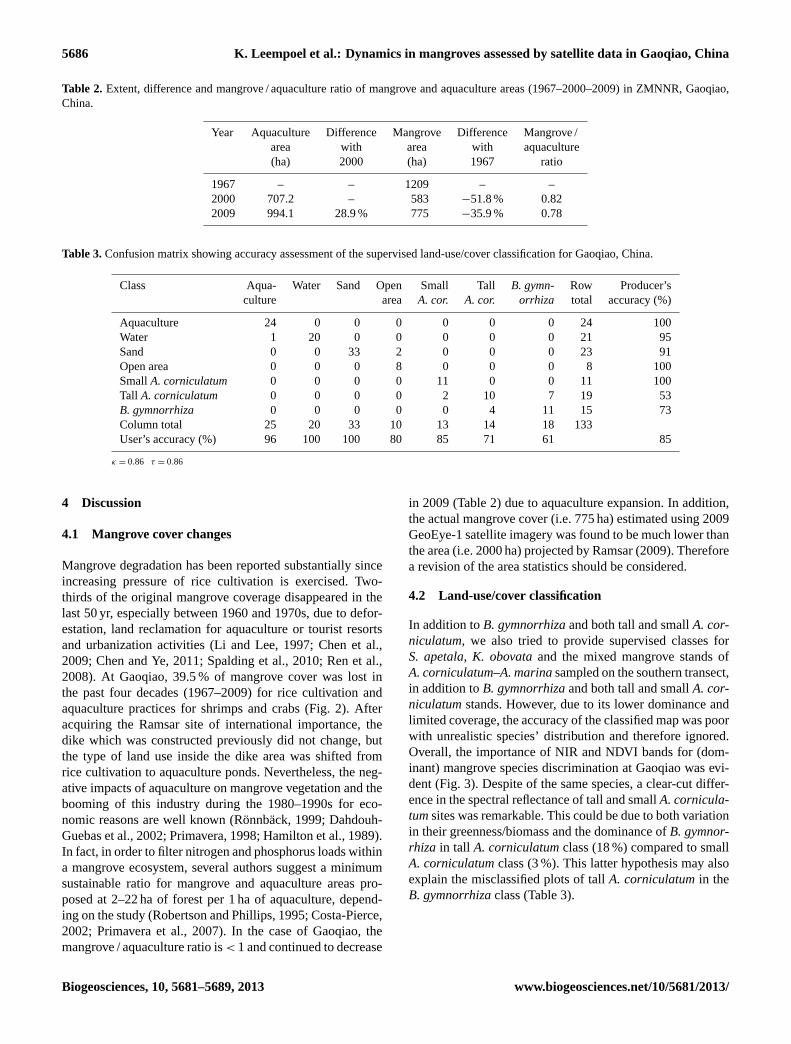
Spectral reflectance values of the seven land-use/coverclasses were separable (Fig. 3). Aquaculture and water
21
1 Figure 3. Spectral reflectance (intensity of each band) of the land-use/cover classes used for 2
supervised classification of Gaoqiao mangrove and adjacent areas. 3
Fig. 3. Spectral reflectance (intensity of each band) of the land-use/cover classes used for supervised classification of Gaoqiaomangrove and adjacent areas.
classes were distinguished primarily by the blue and NDVIbands. In contrast, differences between open areas and sandclasses were found to be small. For the mangrove classes, al-though values were similar for the blue and green bands, theirdifferentiation in the red, near infrared (NIR), and NDVIbands was considerably high. The highest value for NDVIwas found forB. gymnorrhiza, followed by tallA. cornicula-tumand smallA. corniculatum(Fig. 3).
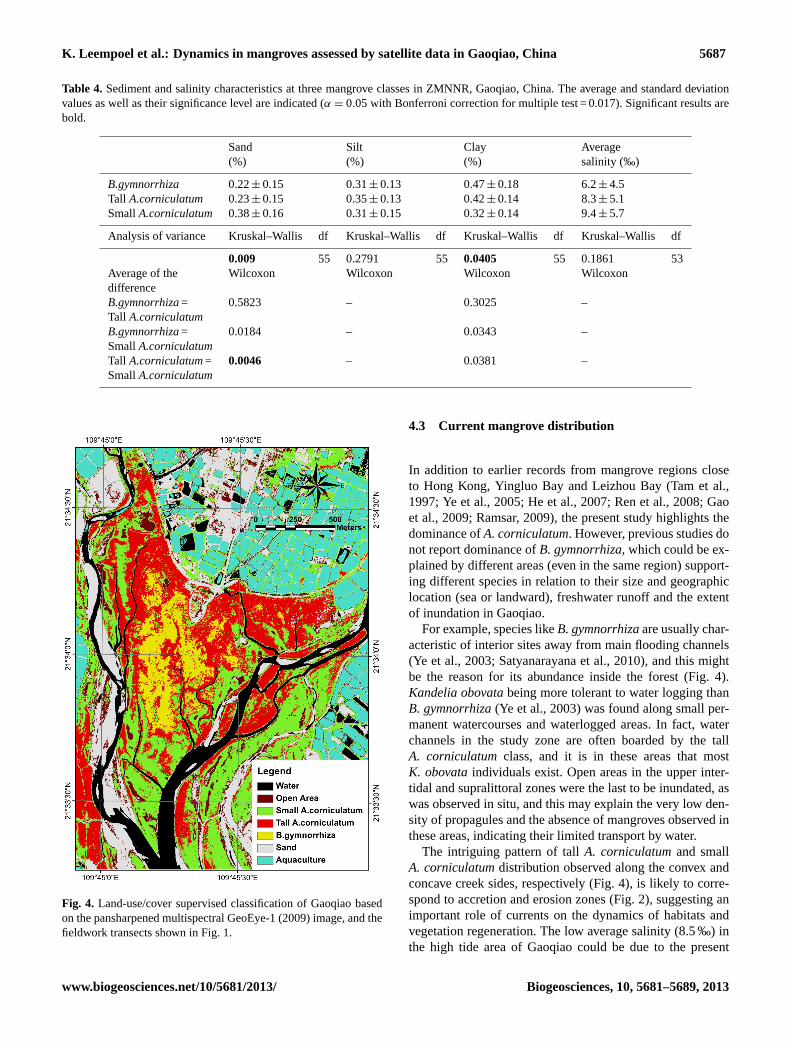
3.4 Mangrove distribution
In agreement with the aforementioned spectral characteris-tics, the supervised classification (Fig. 4) provided satisfac-tory results. The interior position ofB. gymnorrhizacould benoticed as a single patch with a few smaller ones nearby. TallA. corniculatumwas present in the northern part of the studyzone and along the major water channels, whereas smallA. corniculatumwas mostly distributed in the peripheralmargins and close to open areas. While aquaculture, openarea and smallA. corniculatumclasses were representedby higher accuracy, others such as water and dike/sand, in-cluding two mangrove classes (i.e. tallA.corniculatumandB. gymnorrhiza), were less well delineated. TallA. cornicu-latumhad a low accuracy (53 %) owing to the fact that nearlyseven plots were misclassified fromB. gymnorrhizato tallA. corniculatum(Table 3).
The sediments at Gaoqiao were predominantly of a clayey-silt nature (Table 4). Sand content was high at smallA. cor-niculatumsites, and it also revealed significant differencesbetween the mangrove classes. In contrast, clay and silt con-tent as well as salinity varied less and remained insignificantamong classes.
www.biogeosciences.net/10/5681/2013/ Biogeosciences, 10, 5681–5689, 2013
5686 K. Leempoel et al.: Dynamics in mangroves assessed by satellite data in Gaoqiao, China
Table 2. Extent, difference and mangrove / aquaculture ratio of mangrove and aquaculture areas (1967–2000–2009) in ZMNNR, Gaoqiao,China.
Year Aquaculture Difference Mangrove Difference Mangrove /area with area with aquaculture(ha) 2000 (ha) 1967 ratio
1967 – – 1209 – –2000 707.2 – 583 −51.8 % 0.822009 994.1 28.9 % 775 −35.9 % 0.78
Table 3.Confusion matrix showing accuracy assessment of the supervised land-use/cover classification for Gaoqiao, China.
Class Aqua- Water Sand Open Small TallB. gymn- Row Producer’sculture area A. cor. A. cor. orrhiza total accuracy (%)
Aquaculture 24 0 0 0 0 0 0 24 100Water 1 20 0 0 0 0 0 21 95Sand 0 0 33 2 0 0 0 23 91Open area 0 0 0 8 0 0 0 8 100SmallA. corniculatum 0 0 0 0 11 0 0 11 100Tall A. corniculatum 0 0 0 0 2 10 7 19 53B. gymnorrhiza 0 0 0 0 0 4 11 15 73Column total 25 20 33 10 13 14 18 133User’s accuracy (%) 96 100 100 80 85 71 61 85
κ = 0.86 τ = 0.86
4 Discussion
4.1 Mangrove cover changes
Mangrove degradation has been reported substantially sinceincreasing pressure of rice cultivation is exercised. Two-thirds of the original mangrove coverage disappeared in thelast 50 yr, especially between 1960 and 1970s, due to defor-estation, land reclamation for aquaculture or tourist resortsand urbanization activities (Li and Lee, 1997; Chen et al.,2009; Chen and Ye, 2011; Spalding et al., 2010; Ren et al.,2008). At Gaoqiao, 39.5 % of mangrove cover was lost inthe past four decades (1967–2009) for rice cultivation andaquaculture practices for shrimps and crabs (Fig. 2). Afteracquiring the Ramsar site of international importance, thedike which was constructed previously did not change, butthe type of land use inside the dike area was shifted fromrice cultivation to aquaculture ponds. Nevertheless, the neg-ative impacts of aquaculture on mangrove vegetation and thebooming of this industry during the 1980–1990s for eco-nomic reasons are well known (Ronnback, 1999; Dahdouh-Guebas et al., 2002; Primavera, 1998; Hamilton et al., 1989).In fact, in order to filter nitrogen and phosphorus loads withina mangrove ecosystem, several authors suggest a minimumsustainable ratio for mangrove and aquaculture areas pro-posed at 2–22 ha of forest per 1 ha of aquaculture, depend-ing on the study (Robertson and Phillips, 1995; Costa-Pierce,2002; Primavera et al., 2007). In the case of Gaoqiao, themangrove / aquaculture ratio is< 1 and continued to decrease
in 2009 (Table 2) due to aquaculture expansion. In addition,the actual mangrove cover (i.e. 775 ha) estimated using 2009GeoEye-1 satellite imagery was found to be much lower thanthe area (i.e. 2000 ha) projected by Ramsar (2009). Thereforea revision of the area statistics should be considered.
4.2 Land-use/cover classification
In addition toB. gymnorrhizaand both tall and smallA. cor-niculatum, we also tried to provide supervised classes forS. apetala, K. obovataand the mixed mangrove stands ofA. corniculatum–A. marinasampled on the southern transect,in addition toB. gymnorrhizaand both tall and smallA. cor-niculatumstands. However, due to its lower dominance andlimited coverage, the accuracy of the classified map was poorwith unrealistic species’ distribution and therefore ignored.Overall, the importance of NIR and NDVI bands for (dom-inant) mangrove species discrimination at Gaoqiao was evi-dent (Fig. 3). Despite of the same species, a clear-cut differ-ence in the spectral reflectance of tall and smallA. cornicula-tumsites was remarkable. This could be due to both variationin their greenness/biomass and the dominance ofB. gymnor-rhiza in tall A. corniculatumclass (18 %) compared to smallA. corniculatumclass (3 %). This latter hypothesis may alsoexplain the misclassified plots of tallA. corniculatumin theB. gymnorrhizaclass (Table 3).
Biogeosciences, 10, 5681–5689, 2013 www.biogeosciences.net/10/5681/2013/
K. Leempoel et al.: Dynamics in mangroves assessed by satellite data in Gaoqiao, China 5687
Table 4. Sediment and salinity characteristics at three mangrove classes in ZMNNR, Gaoqiao, China. The average and standard deviationvalues as well as their significance level are indicated (α = 0.05 with Bonferroni correction for multiple test = 0.017). Significant results arebold.
Sand Silt Clay Average(%) (%) (%) salinity (‰)
B.gymnorrhiza 0.22± 0.15 0.31± 0.13 0.47± 0.18 6.2± 4.5Tall A.corniculatum 0.23± 0.15 0.35± 0.13 0.42± 0.14 8.3± 5.1SmallA.corniculatum 0.38± 0.16 0.31± 0.15 0.32± 0.14 9.4± 5.7
Analysis of variance Kruskal–Wallis df Kruskal–Wallis df Kruskal–Wallis df Kruskal–Wallis df
0.009 55 0.2791 55 0.0405 55 0.1861 53Average of the Wilcoxon Wilcoxon Wilcoxon WilcoxondifferenceB.gymnorrhiza= 0.5823 – 0.3025 –Tall A.corniculatumB.gymnorrhiza= 0.0184 – 0.0343 –SmallA.corniculatumTall A.corniculatum= 0.0046 – 0.0381 –SmallA.corniculatum
22
1
2
Figure 4. Land-use/cover supervised classification of Gaoqiao based on the pansharpened 3
multispectral GeoEye-1 (2009) image, and the fieldwork transects shown in figure 1. 4
Fig. 4. Land-use/cover supervised classification of Gaoqiao basedon the pansharpened multispectral GeoEye-1 (2009) image, and thefieldwork transects shown in Fig. 1.
4.3 Current mangrove distribution
In addition to earlier records from mangrove regions closeto Hong Kong, Yingluo Bay and Leizhou Bay (Tam et al.,1997; Ye et al., 2005; He et al., 2007; Ren et al., 2008; Gaoet al., 2009; Ramsar, 2009), the present study highlights thedominance ofA. corniculatum. However, previous studies donot report dominance ofB. gymnorrhiza, which could be ex-plained by different areas (even in the same region) support-ing different species in relation to their size and geographiclocation (sea or landward), freshwater runoff and the extentof inundation in Gaoqiao.
For example, species likeB. gymnorrhizaare usually char-acteristic of interior sites away from main flooding channels(Ye et al., 2003; Satyanarayana et al., 2010), and this mightbe the reason for its abundance inside the forest (Fig. 4).Kandelia obovatabeing more tolerant to water logging thanB. gymnorrhiza(Ye et al., 2003) was found along small per-manent watercourses and waterlogged areas. In fact, waterchannels in the study zone are often boarded by the tallA. corniculatumclass, and it is in these areas that mostK. obovataindividuals exist. Open areas in the upper inter-tidal and supralittoral zones were the last to be inundated, aswas observed in situ, and this may explain the very low den-sity of propagules and the absence of mangroves observed inthese areas, indicating their limited transport by water.
The intriguing pattern of tallA. corniculatumand smallA. corniculatumdistribution observed along the convex andconcave creek sides, respectively (Fig. 4), is likely to corre-spond to accretion and erosion zones (Fig. 2), suggesting animportant role of currents on the dynamics of habitats andvegetation regeneration. The low average salinity (8.5 ‰) inthe high tide area of Gaoqiao could be due to the present
www.biogeosciences.net/10/5681/2013/ Biogeosciences, 10, 5681–5689, 2013
5688 K. Leempoel et al.: Dynamics in mangroves assessed by satellite data in Gaoqiao, China
sampling in the rainy season and also to constant freshwa-ter input from Ximi and Qaoqiao rivers flowing into YingluoBay. Therefore, a pioneer mangrove species likeA. marina,which occupies the frontier edge of the tidal flat (i.e. low tidalflats) in China (Ye et al., 2005; Ren et al., 2011), was foundessentially in the southernmost transect. However, the salin-ity in mangroves close to Gaoqiao was reported to be 23 ‰(Liang and Dong, 2004). This important difference of mea-surement could explain why no significant correlation wasfound with salinity. An important point is the observation ofold A. marina sites in the northern part of the study area,which may reflect an ancient disjunct zonation of this speciesrestrained by parasitism or by man.
Mangrove-associated species such asCerbera manghasL.and Ipomoea pes-capraeL. have mostly occupied the ele-vated grounds where tidal inundation is less frequent. Theyalso colonize, mixed with some mangrove species (A. Cor-niculatum, E. Agallocha), along the banks of rivers and smallstreams inland that supply the rice fields. This abrupt transi-tion in zonation along the land–sea gradient inside the man-groves and the presence of landward mangrove species bothtestify a restricted zonation in light of the artificial barrier(i.e. dike construction) at Gaoqiao.
5 Conclusions
The applicability of very high resolution imagery such asGeoEye-1 for mangrove spatial heterogeneity assessmentand species-level discrimination, along with its difficulty toprovide a precise classification for non-dominant species,has been demonstrated in the present study. If the mangrovestand size is considerable, it is possible to identify the samespecies (e.g.A. corniculatum) with different heights usingGeoEye-1 NIR imagery even when present with different treeheights. In addition, the use of 42 yr old Corona satellite im-agery, compared to newly derived satellite data (e.g. GeoEye-1), allowed studying mangrove and other land-use/cover dy-namics. While mangrove destruction between 1967 and 2000was associated with the land reclamation for agriculture andaquaculture practices, conversion of agricultural fields intoaquaculture ponds, between 2000 and 2009, was also respon-sible for the decrease of mangrove / aquaculture ratio. Themangrove extent over 775 ha at Gaoqiao appeared to be de-termined largely by its geographic (sea or landward) location.The overwhelming dominance ofA. corniculatum(which isknown as “river mangrove”) coincides with strong freshwa-ter input in the vicinity. However, no environmental factorsmeasured were able to discriminateB. gymnorrhizaand tallA. corniculatumstands.
Knowing the current status of mangrove distribution atGaoqiao, we suggest that further studies (involving both re-mote sensing and ground-truth assessments) should be fo-cused on other mangrove patches in the south of the presentstudy zone (Yingluo Bay) and other mangrove areas in
ZMNNR (i.e. Beitan, Techeng, Taiping, Fucheng, Qishui,He’an and Tuli) for a complete monitoring and more efficientmanagement.
Acknowledgements.We wish to express our sincere gratitude to theauthorities at F.R.S.-FNRS (Fonds de la Recherche Scientifique),Brussels, Belgium, for funding this project. B. Satyaranayana issupported by the Belgian National Science Foundation (# F6/15– MCF/OL Convention no. 2.4532.09). Special thanks are due toall people who have helped us during the fieldwork, especially thestudents from the Guangdong Ocean University.
Edited by: S. W. A. Naqvi
References
Bouyoucos, G. J.: Hydrometer Method Improved for Making Parti-cle Size Analyses of Soils, Agron. J., 54, 464–465 1962.
Chapman, V. J.: Mangrove vegetation, Strauss and Cramer, Vaduz,499 pp., 1976.
Chen, G. C. and Ye, Y.: Restoration of Aegiceras cornicu-latum mangroves in Jiulongjiang Estuary changed macro-benthic faunal community, Ecol. Eng., 37, 224–228,doi:10.1016/j.ecoleng.2010.10.003, 2011.
Chen, L. Z., Wang, W. Q., Zhang, Y. H., and Lin, G. H.: Recentprogresses in mangrove conservation, restoration and researchin China, J. Plant. Ecol.-UK, 2, 45–54, doi:10.1093/Jpe/Rtp009,2009.
Cintron, G. and Schaeffer Novelli, Y.: Methods for studying man-grove structure, UNESCO, Paris, INTERNATIONAL, 1984.
Cottam, G. and Curtis, J. T.: The Use of Distance Measures in Phy-tosociological Sampling, Ecology, 37, 451–460, 1956.
Dahdouh-Guebas, F.: The use of remote sensing and GIS in thesustainable management of tropical coastal ecosystems, Environ.Develop. Sustain., 4, 93–112, doi:10.1023/a:1020887204285,2002.
Dahdouh-Guebas, F. and Koedam, N.: Coastal vegetation and theAsian tsunami, Science, 311, 37–37, 2006a.
Dahdouh-Guebas, F. and Koedam, N.: Empirical estimate of thereliability of the use of the Point-Centred Quarter Method(PCQM): Solutions to ambiguous field situations and descrip-tion of the PCQM plus protocol, Forest Ecol. Manag., 228, 1–18,doi:10.1016/j.foreco.2005.10.076, 2006b.
Dahdouh-Guebas, F. and Koedam, N.: Long-term retro-spection on mangrove development using transdisci-plinary approaches: A review, Aquat. Bot., 89, 80–92,doi:10.1016/j.aquabot.2008.03.012, 2008.
Dahdouh-Guebas, F., Zetterstrom, T., Ronnback, P., Troell, M.,Wickramasinghe, A., and Koedam, N.: Recent changes in land-use in the Pambala-Chilaw Lagoon Complex (Sri Lanka) investi-gated using remote sensing and GIS : conservation of mangrovesvs. development of shrimp farming, Environ. Develop. Sustain.,4, 185–200, 2002.
Dahdouh-Guebas, F., Van Hiel, E., Chan, J., Jayatissa, L., andKoedam, N.: Qualitative distinction of congeneric and introgres-sive mangrove species in mixed patchy forest assemblages us-ing high spatial resolution remotely sensed imagery (IKONOS),Syst. Biodivers., 2, 113–119, 2004.
Biogeosciences, 10, 5681–5689, 2013 www.biogeosciences.net/10/5681/2013/
K. Leempoel et al.: Dynamics in mangroves assessed by satellite data in Gaoqiao, China 5689
Dahdouh-Guebas, F., Collin, S., Lo Seen, D., Ronnback, P., De-pommier, D., Ravishankar, T., and Koedam, N.: Analysing eth-nobotanical and fishery-related importance of mangroves of theEast-Godavari Delta (Andhra Pradesh, India) for conservationand management purposes, J. Ethnobiol. Ethnomed., 2, 24, 138–166, doi:10.1201/b14535-8, 2006a.
Dahdouh-Guebas, F., Verheyden, A., Kairo, J. G., Jayatissa, L. P.,and Koedam, N.: Capacity building in tropical coastal resourcemonitoring in developing countries: A re-appreciation of the old-est remote sensing method, Int. J. Sust. Dev. World, 13, 62–76,2006b.
Duke, N. C., Meynecke, J. O., Dittmann, S., Ellison, A. M., Anger,K., Berger, U., Cannicci, S., Diele, K., Ewel, K. C., Field, C.D., Koedam, N., Lee, S. Y., Marchand, C., Nordhaus, I., andDahdouh-Guebas, F.: A world without mangroves?, Science,317, 41–42, 2007.
Gao, X.-M., Han, W.-D., and Liu, S.-Q.: The mangrove and its con-servation in Leizhou Peninsula, China, J. Forest. Res., 20, 174–178, doi:10.1007/s11676-009-0032-0, 2009.
Giri, C., Ochieng, E., Tieszen, L. L., Zhu, Z., Singh, A., Love-land, T., Masek, J., and Duke, N.: Status and distribution ofmangrove forests of the world using earth observation satellitedata, Global Ecol. Biogeogr., 20, 154–159, doi:10.1111/j.1466-8238.2010.00584.x, 2011.
Green, E. P., Mumby, P. J., Edwards, A. J., and Clark, C. D.: RemoteSensing Handbook for tropical Coastal management, CoastalManagement Sourcebooks 3, 316 pp., 2000.
Hamilton, L., Dixon, J., and Miller, G.: Mangroves: an undervaluedresource of the land and the sea, Ocean Yearbook, 8, 254–288,1989.
He, B. Y., Lai, T. H., Fan, H. Q., Wang, W. Q., and Zheng, H. L.:Comparison of flooding-tolerance in four mangrove species in adiurnal tidal zone in the Beibu Gulf, Estuar. Coast Shelf S., 74,254–262, doi:10.1016/j.ecss.2007.04.018, 2007.
Li, M. S. and Lee, S. Y.: Mangroves of China: a brief review, ForestEcol. Manag., 96, 241–259, 1997.
Liang, S. C. and Dong, M.: Spatial heterogeneity of populationstructure of the mangrove Bruguiera gymnorrhiza at YingluoBay, South-China Coast, Acta Bot. Sin., 46, 1015–1024, 2004.
Masso i Aleman, S., Bourgeois, C., Appeltans, W., Van-hoorne, B., De Hauwere, N., Stoffelen, P., Heughebaert,A., and Dahdouh-Guebas, F.: The “Mangrove ReferenceDatabase and Herbarium”, Plant Ecol. Evol., 143, 225–232,doi:10.5091/plecevo.2010.439, 2010.
Nagelkerken, I., Blaber, S. J. M., Bouillon, S., Green, P., Haywood,M., Kirton, L. G., Meynecke, J. O., Pawlik, J., Penrose, H. M.,Sasekumar, A., and Somerfield, P. J.: The habitat function ofmangroves for terrestrial and marine fauna: A review, Aquat.Bot., 89, 155–185, doi:10.1016/j.aquabot.2007.12.007, 2008.
Neukermans, G., Dahdouh-Guebas, F., Kairo, J. G., and Koedam,N.: Mangrove species and stand mapping in GAzi bay (Kenya)using Quickbird satellite imagery, J. Spat. Sci., 53, 75–86, 2008.
Primavera, J. H.: Tropical shrimp farming and its sustainability, in:Tropical mariculture, edited by: Diego, A. P. S., 257–289, 1998.
Ramsar Sites information Service:http://www.ramsar.wetlands.org/Database/Searchforsites/tabid/765/Default.aspx(last access: 3February 2010), 2009.
Ren, H., Jian, S. G., Lu, H. F., Zhang, Q. M., Shen, W. J., Han, W.D., Yin, Z. Y., and Guo, Q. F.: Restoration of mangrove planta-tions and colonisation by native species in Leizhou bay, SouthChina, Ecol. Res., 23, 401–407, doi:10.1007/s11284-007-0393-9, 2008.
Ren, H., Wu, X. M., Ning, T. Z., Huang, G., Wang, J., Jian, S. G.,and Lu, H. F.: Wetland changes and mangrove restoration plan-ning in Shenzhen Bay, Southern China, Landsc. Ecol. Eng., 7,241–250, doi:10.1007/s11355-010-0126-z, 2011.
Ronnback, P.: The ecological basis for economic value of seafoodproduction supported by mangrove ecosystems, Ecol. Econom.,29, 235–252, doi:10.1016/s0921-8009(99)00016-6, 1999.
Satyanarayana, B., Idris, I. F., Mohamad, K. A., Husain, M.L., Shazili, N. A. M., and Dahdouh-Guebas, F.: Mangrovespecies distribution and abundance in relation to local envi-ronmental settings: a case-study at Tumpat, Kelantan Delta,east coast of peninsular Malaysia, Bot. Mar., 53, 79–88,doi:10.1515/Bot.2010.006, 2010.
Satyanarayana, B., Koedam, N., De Smet, K., Di Nitto, D.,Bauwens, M., Jayatissa, L. P., Cannicci, S., and Dahdouh-Guebas, F.: Long-term mangrove forest development in SriLanka: early predictions evaluated against outcomes using VHRremote sensing and VHR ground-truth data, Mar. Ecol. Progr. S.,443, 51–63, doi:10.3354/meps09397, 2011.
Spalding, M., Kainuma, M., and Collins, L.: World Atlas of Man-groves, Earthscan Publications Ltd., UK, 319 pp., 2010.
Tam, N. F. Y., Wong, Y. S., Lu, C. Y., and Berry, R.: Mapping andcharacterization of mangrove plant communities in Hong Kong,Hydrobiologia, 352, 25–37, 1997.
Valiela, I., Bowen, J., and York, J.: Mangrove Forests: One of theWorld’s Threatened Major Tropical Environments, Bioscience,51, 807–815, 2001.
Walters, B. B., Ronnback, P., Kovacs, J. M., Crona, B., Hus-sain, S. A., Badola, R., Primavera, J. H., Barbier, E., andDahdouh-Guebas, F.: Ethnobiology, socio-economics and man-agement of mangrove forests: A review, Aquat. Bot., 89, 220–236, doi:10.1016/j.aquabot.2008.02.009, 2008.
Ye, Y., Tam, N. F. Y., Wong, Y. S., and Lu, C. Y.: Growth and physi-ological responses of two mangrove species (Bruguiera gymnor-rhiza and Kandelia candel) to waterlogging, Environ. Exp. Bot.,49, 209–221, 2003.
Ye, Y., Tam, N. F. Y., Lu, C. Y., and Wong, Y. S.: Effects ofsalinity on germination, seedling growth and physiology ofthree salt-secreting mangrove species, Aquat. Bot., 83, 193–205,doi:10.1016/j.aquabot.2005.06.006, 2005.
Zhanjiang Mangrove National Nature Reserve:http://www.zjmangrove.org/en/about.asp(last access: August 2010), 2010.
www.biogeosciences.net/10/5681/2013/ Biogeosciences, 10, 5681–5689, 2013