Embed Size (px)
Citation preview
The Open Geology Journal, 2009, 3, 39-57 39
1874-2629/09 2009 Bentham Open
Open Access
Facies Analysis of Triassic Formations of the Hassi R’Mel in Southern Algeria Using Well Logs: Recognition of Paleosols Using Log Analysis
R. Baouche*,1
, A. Nedjari2, S. El Aadj
1 and R. Chaouchi
3
1Laboratory of the Physical Earth, University of Boumerdes, 2 Avenue of Independence, Boumerdes, Algeria
2University of Sciences and Technology, Sedimentary Basins, FTSGAT, Algiers, Algeria
3Laboratory of Geology of the Sedimentary Basins, University of Boumerdes, 2 Avenue of Independence, Boumerdes,
Algeria
Abstract: Well logs are essential in the study of geological formations, in terms of taking into account the nature and the
structure of the formations, as well as the sedimentary processes. Qualitative and quantitative interpretations of well logs
respond to a sedimentologic need as well as the establishment of lithological columns, according to the response to
logging tools.
In this study, electrofacies have been defined by manual well-log analysis of ten surveys of Triassic formations in the
Hassi R'Mel area of Algeria. The data thus obtained were then matched with sedimentary facies defined by core analysis.
The results obtained during the facies analysis made it possible to define ten electrofacies (sands, shale, dolomite, and
evaporite, as well as the presence of andesite and clay). The model obtained by the Petrolog software was also developed
and tested on other wells. A semi-automatic data processing was then carried out on seven other wells.
Our aim is to highlight the added value of this integrated regional-scale to reservoir-scale approach in identifying near-
field exploration potential and additional recovery opportunities in producing reservoirs. Based on this aim, we emphasise
the following points using our facies modelling: (1) improved definition of deposition within and between reservoirs, (2)
development of regionally sedimentological models for reservoir intervals (the Hassi R’Mel Formations), and (3)
recognition of paleosols from well log analysis and controls on reservoir architecture and their links to the Triassic
Province of Algeria.
Keywords: Logging, paleosols, reservoirs, modeling, facies, Hassi R’Mel, Sahara.
1. INTRODUCTION
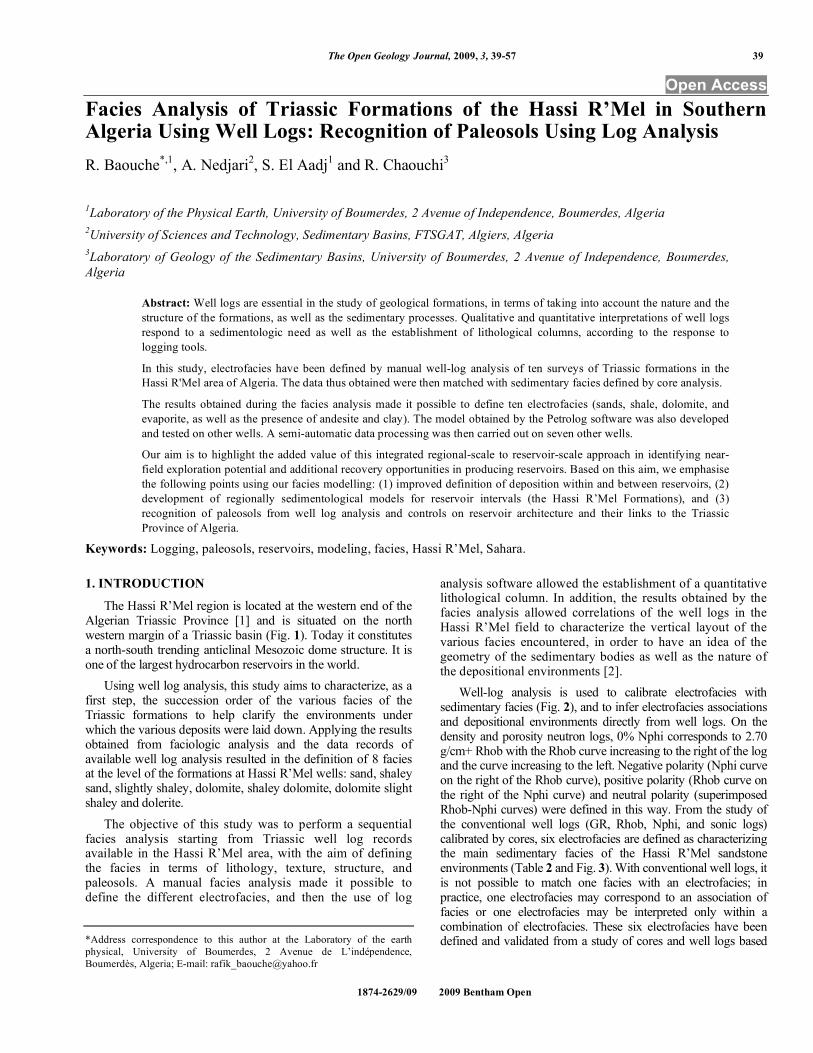
The Hassi R’Mel region is located at the western end of the Algerian Triassic Province [1] and is situated on the north western margin of a Triassic basin (Fig. 1). Today it constitutes a north-south trending anticlinal Mesozoic dome structure. It is one of the largest hydrocarbon reservoirs in the world.
Using well log analysis, this study aims to characterize, as a first step, the succession order of the various facies of the Triassic formations to help clarify the environments under which the various deposits were laid down. Applying the results obtained from faciologic analysis and the data records of available well log analysis resulted in the definition of 8 facies at the level of the formations at Hassi R’Mel wells: sand, shaley sand, slightly shaley, dolomite, shaley dolomite, dolomite slight shaley and dolerite.
The objective of this study was to perform a sequential facies analysis starting from Triassic well log records available in the Hassi R’Mel area, with the aim of defining the facies in terms of lithology, texture, structure, and paleosols. A manual facies analysis made it possible to define the different electrofacies, and then the use of log
*Address correspondence to this author at the Laboratory of the earth
physical, University of Boumerdes, 2 Avenue de L’indépendence,
Boumerdès, Algeria; E-mail: [email protected]
analysis software allowed the establishment of a quantitative lithological column. In addition, the results obtained by the facies analysis allowed correlations of the well logs in the Hassi R’Mel field to characterize the vertical layout of the various facies encountered, in order to have an idea of the geometry of the sedimentary bodies as well as the nature of the depositional environments [2].
Well-log analysis is used to calibrate electrofacies with sedimentary facies (Fig. 2), and to infer electrofacies associations and depositional environments directly from well logs. On the density and porosity neutron logs, 0% Nphi corresponds to 2.70 g/cm+ Rhob with the Rhob curve increasing to the right of the log and the curve increasing to the left. Negative polarity (Nphi curve on the right of the Rhob curve), positive polarity (Rhob curve on the right of the Nphi curve) and neutral polarity (superimposed Rhob-Nphi curves) were defined in this way. From the study of the conventional well logs (GR, Rhob, Nphi, and sonic logs) calibrated by cores, six electrofacies are defined as characterizing the main sedimentary facies of the Hassi R’Mel sandstone environments (Table 2 and Fig. 3). With conventional well logs, it is not possible to match one facies with an electrofacies; in practice, one electrofacies may correspond to an association of facies or one electrofacies may be interpreted only within a combination of electrofacies. These six electrofacies have been defined and validated from a study of cores and well logs based
40 The Open Geology Journal, 2009, Volume 3 Baouche et al.
Fig. (1). Field location of the Southern Hassi R’Mel.
Triassic Formations of the Hassi R’Mel in Southern Algeria Using Well Logs The Open Geology Journal, 2009, Volume 3 41
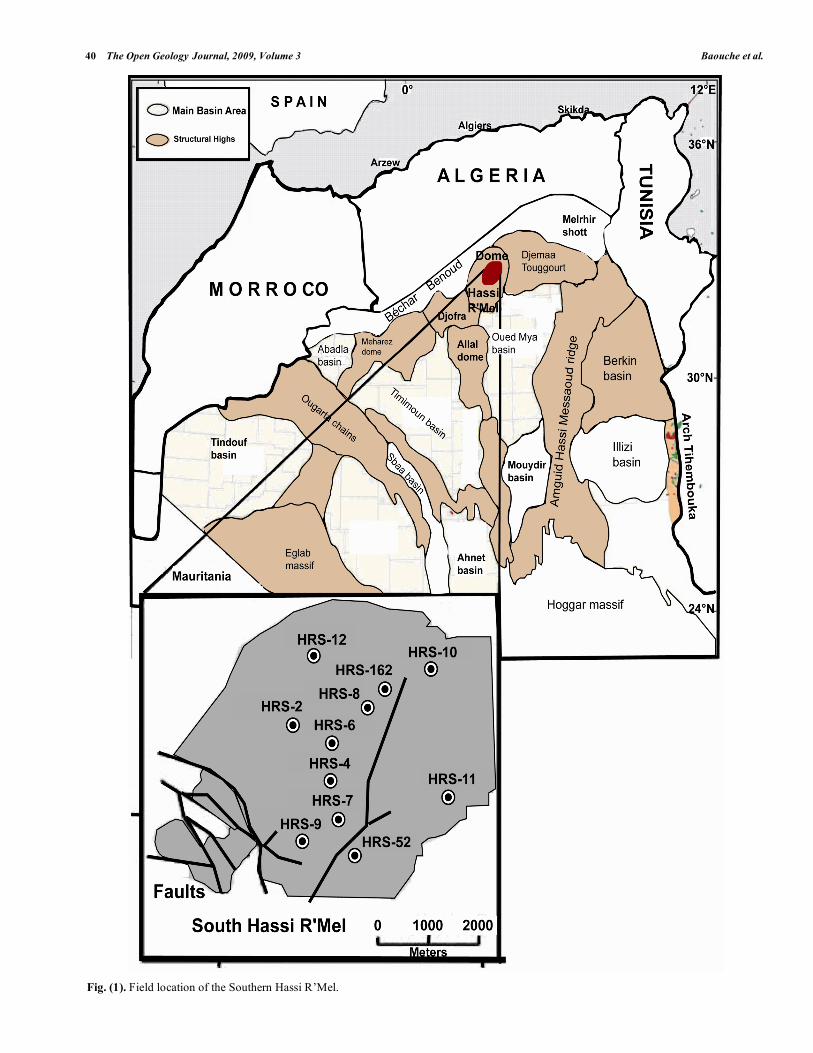
Fig. (2). Core Photos for the Wells: HRS-2 and 9 (memories of engineers: Zeggane F. and Chikhi Z., 2000).
42 The Open Geology Journal, 2009, Volume 3 Baouche et al.
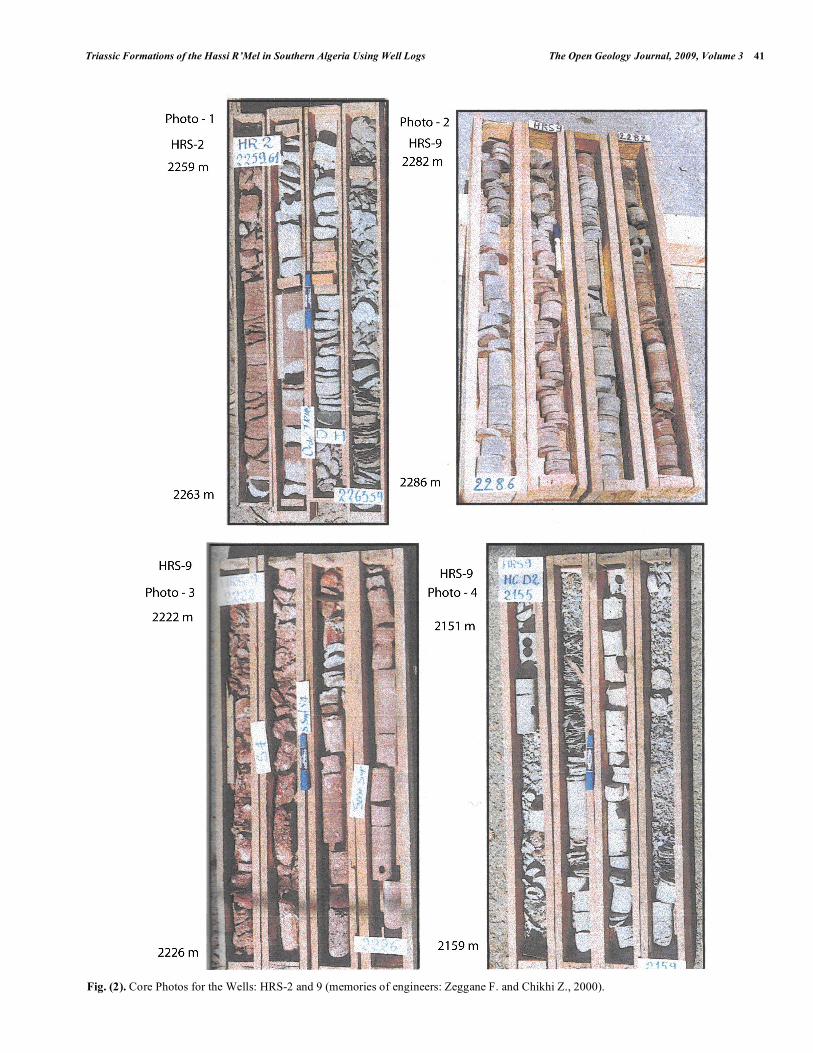
Fig. (3). Manual analysis of the lithofacies from the Hassi R’Mel Southern Triassic.
Triassic Formations of the Hassi R’Mel in Southern Algeria Using Well Logs The Open Geology Journal, 2009, Volume 3 43
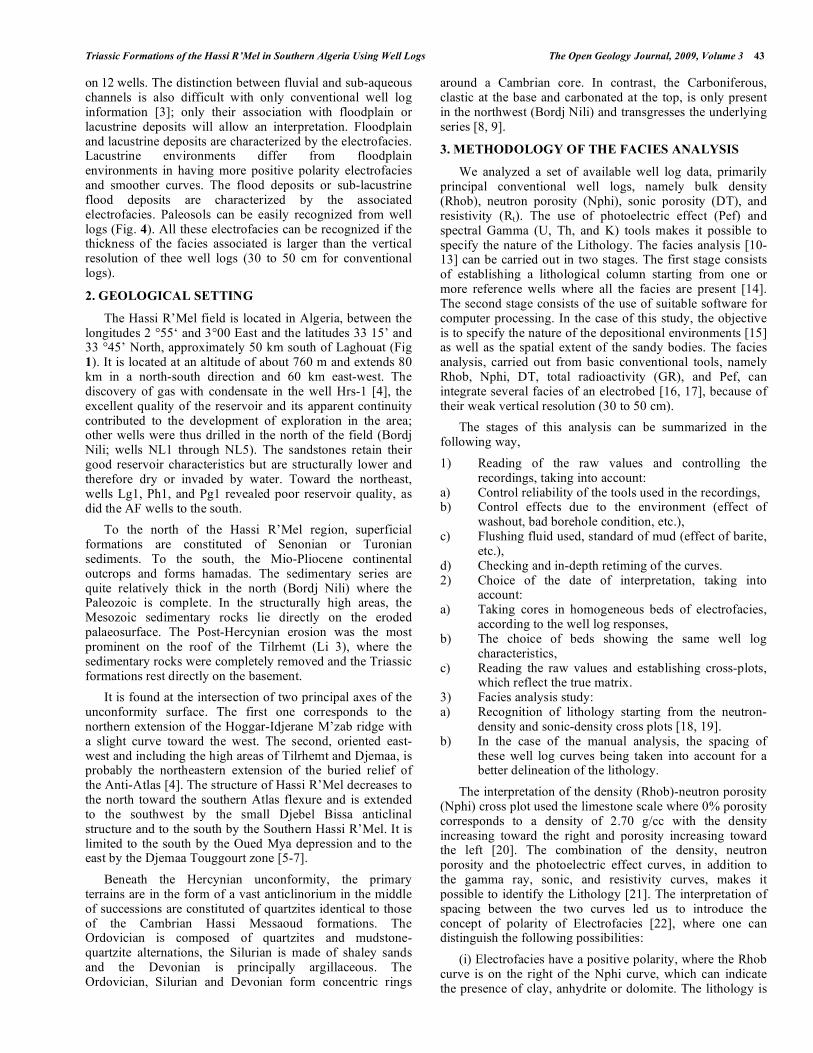
on 12 wells. The distinction between fluvial and sub-aqueous channels is also difficult with only conventional well log information [3]; only their association with floodplain or lacustrine deposits will allow an interpretation. Floodplain and lacustrine deposits are characterized by the electrofacies. Lacustrine environments differ from floodplain environments in having more positive polarity electrofacies and smoother curves. The flood deposits or sub-lacustrine flood deposits are characterized by the associated electrofacies. Paleosols can be easily recognized from well logs (Fig. 4). All these electrofacies can be recognized if the thickness of the facies associated is larger than the vertical resolution of thee well logs (30 to 50 cm for conventional logs).
2. GEOLOGICAL SETTING
The Hassi R’Mel field is located in Algeria, between the longitudes 2 °55‘ and 3°00 East and the latitudes 33 15’ and 33 °45’ North, approximately 50 km south of Laghouat (Fig 1). It is located at an altitude of about 760 m and extends 80 km in a north-south direction and 60 km east-west. The discovery of gas with condensate in the well Hrs-1 [4], the excellent quality of the reservoir and its apparent continuity contributed to the development of exploration in the area; other wells were thus drilled in the north of the field (Bordj Nili; wells NL1 through NL5). The sandstones retain their good reservoir characteristics but are structurally lower and therefore dry or invaded by water. Toward the northeast, wells Lg1, Ph1, and Pg1 revealed poor reservoir quality, as did the AF wells to the south.
To the north of the Hassi R’Mel region, superficial formations are constituted of Senonian or Turonian sediments. To the south, the Mio-Pliocene continental outcrops and forms hamadas. The sedimentary series are quite relatively thick in the north (Bordj Nili) where the Paleozoic is complete. In the structurally high areas, the Mesozoic sedimentary rocks lie directly on the eroded palaeosurface. The Post-Hercynian erosion was the most prominent on the roof of the Tilrhemt (Li 3), where the sedimentary rocks were completely removed and the Triassic formations rest directly on the basement.
It is found at the intersection of two principal axes of the unconformity surface. The first one corresponds to the northern extension of the Hoggar-Idjerane M’zab ridge with a slight curve toward the west. The second, oriented east-west and including the high areas of Tilrhemt and Djemaa, is probably the northeastern extension of the buried relief of the Anti-Atlas [4]. The structure of Hassi R’Mel decreases to the north toward the southern Atlas flexure and is extended to the southwest by the small Djebel Bissa anticlinal structure and to the south by the Southern Hassi R’Mel. It is limited to the south by the Oued Mya depression and to the east by the Djemaa Touggourt zone [5-7].
Beneath the Hercynian unconformity, the primary terrains are in the form of a vast anticlinorium in the middle of successions are constituted of quartzites identical to those of the Cambrian Hassi Messaoud formations. The Ordovician is composed of quartzites and mudstone-quartzite alternations, the Silurian is made of shaley sands and the Devonian is principally argillaceous. The Ordovician, Silurian and Devonian form concentric rings
around a Cambrian core. In contrast, the Carboniferous, clastic at the base and carbonated at the top, is only present in the northwest (Bordj Nili) and transgresses the underlying series [8, 9].
3. METHODOLOGY OF THE FACIES ANALYSIS
We analyzed a set of available well log data, primarily principal conventional well logs, namely bulk density (Rhob), neutron porosity (Nphi), sonic porosity (DT), and resistivity (Rt). The use of photoelectric effect (Pef) and spectral Gamma (U, Th, and K) tools makes it possible to specify the nature of the Lithology. The facies analysis [10-13] can be carried out in two stages. The first stage consists of establishing a lithological column starting from one or more reference wells where all the facies are present [14]. The second stage consists of the use of suitable software for computer processing. In the case of this study, the objective is to specify the nature of the depositional environments [15] as well as the spatial extent of the sandy bodies. The facies analysis, carried out from basic conventional tools, namely Rhob, Nphi, DT, total radioactivity (GR), and Pef, can integrate several facies of an electrobed [16, 17], because of their weak vertical resolution (30 to 50 cm).
The stages of this analysis can be summarized in the following way,
1) Reading of the raw values and controlling the recordings, taking into account:
a) Control reliability of the tools used in the recordings, b) Control effects due to the environment (effect of
washout, bad borehole condition, etc.), c) Flushing fluid used, standard of mud (effect of barite,
etc.), d) Checking and in-depth retiming of the curves. 2) Choice of the date of interpretation, taking into
account: a) Taking cores in homogeneous beds of electrofacies,
according to the well log responses, b) The choice of beds showing the same well log
characteristics, c) Reading the raw values and establishing cross-plots,
which reflect the true matrix. 3) Facies analysis study: a) Recognition of lithology starting from the neutron-
density and sonic-density cross plots [18, 19]. b) In the case of the manual analysis, the spacing of
these well log curves being taken into account for a better delineation of the lithology.
The interpretation of the density (Rhob)-neutron porosity (Nphi) cross plot used the limestone scale where 0% porosity corresponds to a density of 2.70 g/cc with the density increasing toward the right and porosity increasing toward the left [20]. The combination of the density, neutron porosity and the photoelectric effect curves, in addition to the gamma ray, sonic, and resistivity curves, makes it possible to identify the Lithology [21]. The interpretation of spacing between the two curves led us to introduce the concept of polarity of Electrofacies [22], where one can distinguish the following possibilities:
(i) Electrofacies have a positive polarity, where the Rhob curve is on the right of the Nphi curve, which can indicate the presence of clay, anhydrite or dolomite. The lithology is
44 The Open Geology Journal, 2009, Volume 3 Baouche et al.
then distinguished by the Rhob, Nphi, DT and GR (API) values;
(ii) Electrofacies have a negative polarity, where the Rhob curve is to the left of the Nphi curve, characterizing a sandy facies, and the presence of gas, or halite;
(iii) Electrofacies have a neutral polarity, where the Rhob and Nphi curves are superimposed, corresponding to limestone or a mixture between electrofacies with positive and negative polarity.
Differentiation is then done by the analysis of other well log data (e.g. GR, DT, and Pef).
Detection of the presence of gas was done through the examination of the various visible deviations on the established cross-plots, which can be one of three types [20-22]:
(i) Standard effect 3: the neutron tools, sonic and density tools are simultaneously affected,
(ii) standard effect 2: only porosity neutron and the density tools are affected,
(iii) Standard effect 1: only the porosity neutron, density or sonic, is affected.
4) Study by analysis of the depositional environments and the sedimentary systems:
a) Selection of the types of electrosequences in each well,
b) Recognition and study of the nature of the electrosequence types according to the well log responses (positive or negative sequence, rhythmicity and amplitude).
c) Definition of a sedimentary system characteristic of a type of sediment genesis; fluvial, coastal, etc.
d) Control of information: careful reading of the log headers regarding drilling and well conditions
1. Checking the tool calibration using the Schlumberger charts.
2. Checking the reliability of the logs by comparison of the repeated section (repeat section) and the principal section (main log).
Exclusion of significant washout zones: If the tools’ pads are not firmly in contact with the wall of the hole, the tool will record the characteristics of the drilling mud and not those of the formation. The recordings are also inaccurate for tools with pads offset in the case of a deep washout with limited vertical extent. The caliper indicates the possible presence of washouts. However the undermined zones within a formation can have a particular lithological significance (e.g. the presence of uncompacted clays, friable sands, etc.).
5) Checking for the influence of mud on the various tools: The presence, for example, of barite in mud returns unusable information on the Pef log: the Pef of barite being 260 B/E, the response of other minerals will be masked. Moreover, as it is the case in many studied surveys, the presence of KCl in mud disturbs the response of the instruments measuring the total natural radioactivity (GR* or NGS*).
6) Checking the depth correlation of the various recordings: The elasticity of the cable, frictions due to the roughness of the hole, etc., can cause the curves to shift (relative to each other), and it is then advisable to readjust them in depth.
7) Control of the recording speed: For the lithological tools, a speed lower than 10m/minute is usually recommended; for a sampling interval of 3cm; the resolution is then 20cm.
This speed is shown on the recordings by ticks, where each tick accounts for one minute that appears in the right and left edges of the document.
Fig. (3) shows an example of well log processing [23] carried out on a Hassi R’Mel well show the facies contacts obtained after this process.
4. FACIES ANALYSIS
Within the Hassi R’Mel Field, alternations of fine- to coarse-grained continental terrigenous facies with some interbedded dolomites were observed (Fig. 2). Ten main facies are described: four shale facies, six sandy facies and three dolomite facies (Table 1). The facies survey provides insight into depositional processes on the basis of the sedimentary structures [24, 25] and can be interpreted in terms of hydrodynamic regimes [26, 27]. The physical parameters of sandy facies are described in Table 1 and the facies codes are modified from [28-30].
In the Southern Hassi R’Mel, the Triassic rocks are characterized by alluvial fan deposits and contain dolomitic paleosols which are particularly well-developed at the top. The more proximal facies association is characterized by channel facies and debris-flow deposits. The more proximal, continental environment of the sands is characterized by mixed debris-flow and mainly stream-flood deposits, paleosols, and less developed floodplains [30]. The stream-flood deposits are characterized by sandy and gravelly bed-load-dominated deposits and could be attributed to braided channels. The lacustrine deposits observed within the Triassic section suggest a shallow lacustrine environment. The bioturbated mudstones attributed to lacustrine deposits are less than 10 m thick and contain evidence of a period of emergence with a paleosol formation [30].
The study of the facies obtained from core analysis, carried out on the level of the Triassic formations of Southern Hassi R' Mel, required the core analysis available at the laboratory of Sonatrach (Algiers), and combination of the differed well log data: the Gamma Ray, the Neutron and the sonic log, their fittings in sequences and their vertical and side evolutions. The study of the sedimentary figures observed in the sediments, representing the hydrodynamic and physical conditions of the medium of sedimentation was also taken into account. The facies met (Photo-2 of board 1) have well Hrs-9, (Fig. 2) Interval: 2282 to 2286m), show:
a) Clean sandstones and argillaceous sandstones at the base;
b) An argillaceous matrix on the level of the sandstones, the base of the sequences; A small percentage of cement in the sandstones and absence of thorough quartzification;

Triassic Formations of the Hassi R’Mel in Southern Algeria Using Well Logs The Open Geology Journal, 2009, Volume 3 45
c) Importance of the sandstones compared to clays in the series T1 - T2. The fluvial series is characterized primarily by the volume of sand they contain and the natural resources which are associated (water, oil, coal and loggings mineral. Photograph - 2).
d) Red clays (Photo-1 of the Hrs-2 well, interval: 2263.5 with 2259.6m), in centimetric layers with decimetric to metric at the top of the sequences; this aspect corresponds to a quite medium, on the flood plain. Joints argillaceous, centimetric, brown red, probably corresponding to periods of decantation during stops of currents; brown red clays silto-sand spreaders in decimetre benches on metric, pseudo-brecciated texture, abundant in also at the end of the sequences, thus marking periodize draining. Photo -1.
e) Salt (saliferous) is presented in massive benches, of pink colour, with inter beds of clay grey black, sometimes dolomitic; characterizing an evaporitic sedimentation, lagunaire, under hot and even arid
climate; Clays with anhydrite, grey black with dark or green grey dark, injected anhydrite, characterizing a sedimentation in edge of the evaporitic salted lagoon, where the water section is almost permanent, but under influence of silico clastic ends coming from the exondes grounds with flat relief. Photo - 3. Hrs-9.
5. APPLICATION OF MANUAL FACIES ANALYSIS
FOR THE HASSI R’MEL ROCKS
The lithology is determined through the use of specific diagrams that compare the behavior of the electrobeds against the standard mineralogical poles by using an iteration process between different lithological diagrams, such as:
a) The detection of heterogeneous formations (brecciated, cracked, vescular zones, etc.), for example, the analysis of sonic-density and neutron-sonic cross plots in which the sound transit time is the shortest, a phenomenon develops to the right of the zones;
b) The detection of the presence of gas through the examination of the various visible deviations on the established cross-plots [31]: (i) standard effect 3: the
neutron tools, sonic and density tools are simultaneously affected, (ii) standard effect 2: only porosity neutron and the density tools are affected. (iii) Standard effect 1: only the porosity neutron, density or sonic, is affected.
c) The availability of high-resolution tools allows the integration of textural and structural data through high-resolution logging data such as dip logging (SHDT), or imaging (FMS, UBI), allowing one to distinguish very small sedimentary structures.
The use of facies analysis, starting from the well log data for the Triassic rocks of the Hassi R’Mel, was first done by hand after the examination of the representative electrobeds; iteration between the lithologic diagrams (Rhob vs Nphi, Rhob vs DT, Fig. 4) made it possible to define the principal lithology and also to recognize the lithology. Lithology fluctuate between the end points: sandstone, clay and dolomites, and, in certain cases, dolerites. Calculating the lithologic columns (using the Petrolog software) allowed for an analysis of the available data and thus made it possible to generalize the model of all of the wells in the study area. The results obtained are compared with those from the core analysis. The initial manual analysis of the Southern Hassi R’Mel Hrs-2, 4, 6, 8, 9, 10, 11, 12 and 162 wells showed the existence of the following facies:
A. The sandstone-like facies:
All of the sandstone-like facies have an elevated radioactivity, greater than 10 API. The sands are characterized by electrofacies with negative polarity (Rhob curve to the left of the Nphi curve) and by points located to the right of the sands in the neutron-density and sonic-density cross-plots (Fig. 4). They can have considerable amounts of potassic feldspars; thus, the GR increases appreciably. In the case of very porous facies and aquifers, the resistivity of the sandstones is weak to very weak. The slightly shaley
sands have a slightly negative or slightly positive polarity. They are deviated to the right of the sandstones (or the quartz pole in the direction to the right of shale (Fig. 4, Table 1). They are represented by a clear green color. The shaley sandstones, with positive polarity and average spacing of the Rhob-
Table 1. Characterizations of Well Logs from the Various Facies of the Southern Hassi R' Mel Triassic Formations
Rhob-Phin (Variation)
< Rhob < (g/cc)
< Phin < (%)
< DT < ( s/ft)
< GR < (API)
Lithology
Coloured
Halite hight 2.04 - 2.24 -0.01 - 0.10 68 - 75 0.0 - 13 Blue
Shale halite low 2.10 -2.35 0.01 - 0.25 79 - 86 10 - 53 Magenta
Sand hight 2.11-2.60 -0.04 -0.26 59 - 108 10 - 102 Yellow
Low sand shale without 2.33-2.58 0.13 -0.23 66 - 99 30 - 64 Blue sky
Shaley sand without 2.38-2.66 0.13 -0.15 61 - 105 44 - 139 Light green
Shaley dolomite hight 2.40-2.79 022 -0.36 68 - 105 42 - 134 orange
Sandy shaley dolomite low 2.54 - 2.79 0.08 -0.28 55 - 80 45 - 114 Purple
Slightly sandy shaley dolomite low 2.58 - 2.79 0.12 -0.19 59 - 74 35 - 114 Garnet
Sandy shale hight 2.38-2.67 0.19 -0.34 77 - 108 90 - 171 Dark green
Andesites hight 2.44 - 2.67 0.20 -0.36 68 - 94 45 - 65 red
46 The Open Geology Journal, 2009, Volume 3 Baouche et al.
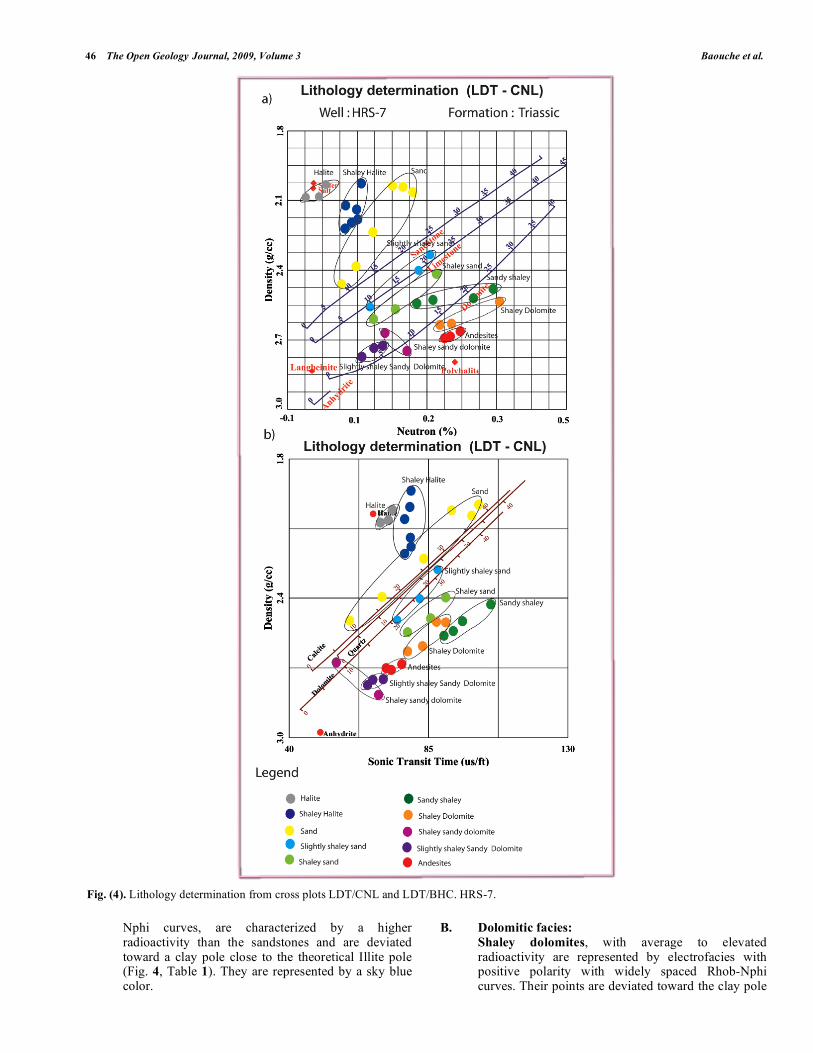
Nphi curves, are characterized by a higher radioactivity than the sandstones and are deviated toward a clay pole close to the theoretical Illite pole (Fig. 4, Table 1). They are represented by a sky blue color.
B. Dolomitic facies:
Shaley dolomites, with average to elevated radioactivity are represented by electrofacies with positive polarity with widely spaced Rhob-Nphi curves. Their points are deviated toward the clay pole
Fig. (4). Lithology determination from cross plots LDT/CNL and LDT/BHC. HRS-7.
Triassic Formations of the Hassi R’Mel in Southern Algeria Using Well Logs The Open Geology Journal, 2009, Volume 3 47
(Fig. 4, Table 1). Shaley sandy dolomites, with positive polarity, cluster to the right of the sandstone line and radioactivity is uncommonly high: up to 150 (API).
C. Slightly shaley sandy dolomites:
These are present in the Hrs-12 well, have weak to average radioactivity and are represented by electrofacies with positive polarity with a wide spacing of the Rhob-Nphi curves. Their values are slightly deviated toward the clay pole on the ND and SD cross-plots and they are brown in color (Fig. 4, Table 1).
D. Shale facies:
They are characterized by high radioactivities (greater than 110 API), electrofacies with positive polarity, and a wide spacing of the Rhob-Nphi curves.
E. Sandy or dolomitic clays:
These are characterized by values deviated from the clay pole toward the sandstone or dolomite pole (Fig. 4, Table 1), represented by a dark green color.
F. Andesites:
They are characterized by radioactivities which vary from 54 to 105 API and a positive polarity with a wide spacing of the Rhob and Nphi curves. Their values are deviated toward the clay pole (Fig. 4, Table 1), and they are represented by a red color. However, to distinguish them from shaley dolomites, a shale cutoff was added.
G. Evaporite facies:
The higher formation corresponds to the evaporites and is primarily made up of halite to clays. This facies exhibits a natural radioactivity that is from 0 to 13 API, a neutron porosity that varies from - 1 to 0%, a density that varies from 2.04 to 2.14 g, a wide negative spacing of the neutron and density curves, and resistivity values from low to high. The gamma ray curve is not very strong because of the gamma ray tool spacing, which is higher than the thickness of the thin layers of clay (Fig. 4, Table 1).
The results of the manual study made on the basis of the cross-plots made it possible to obtain a manual log for well Hrs-7 of the Southern Hassi R’Mel (Fig. 3).
The paleosols correspond to the evolution of the basins, marked by events that close the sequences on different levels [8]. The electrofacies of the Triassic formations correspond to deposition events having specific logging characteristics.
6. AUTOMATIC FACIES
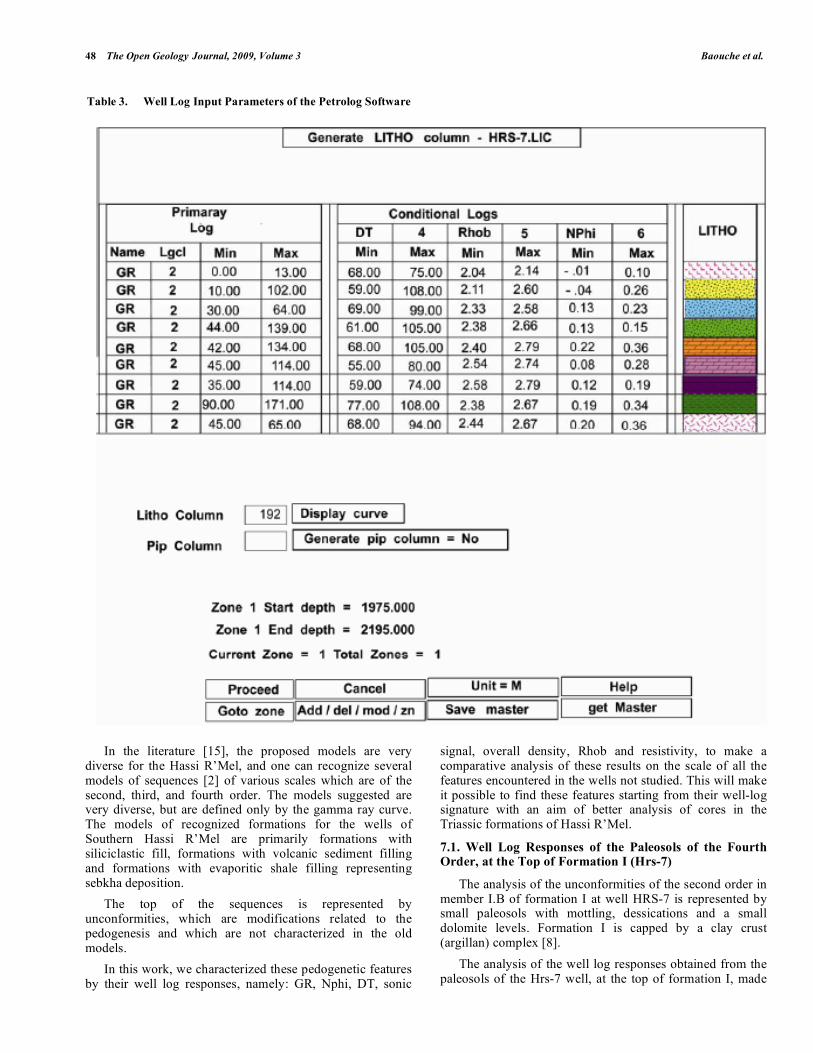
After having established the manual facies analysis and having checked its reliability by comparison with both the lithological well log data of the wells and the drilling, we used the PETROLOG program [23] to process the well log data, using these 4 entry parameters: radioactivity, total density, the transit time, and neutron porosity.
The facies interpretation made by the PETROLOG software, applied especially in the case of complex lithology, initially consists of defining the groups of dots representing each clean facies. Each of these groups represents the 10 litho-types described in this study (Table 2). Each group is identified by a standard color and is stored in the memory (e.g. as “Facies 1”, “Facies 2", etc.).
After these data have been processed, the software provides the results in lithological terms for all of the formations crossed by the survey in accordance with the response of the well log tools given to the entry (Table 3). An example of the outputs for Hrs-7 is given in Fig. (5).
7. ELECTROFACIES AND ENVIRONMENT DEPOSITS
The various sedimentary features are well described [7] and are quite varied: mottling, shrinkage cracks, root traces, polyhedral structures (slickolites) and the ferruginious cementation of Liesegang rings. In the Saharan Triassic section, the context is very different; one finds the same features but some are different: silcrete, gypscrete, calcrete.
Table 2. List of the 10 Lithological Classes with the Porosity Variations and Clay Content
N° LITHOLOGY N° LITHOLOGY
1 Halite 1 Halite
2 Shale halite 2 Halite + shale
3 Sandy shale 3 Sand shale < 40 % of sand
4 Shaley dolomite 4 Shaley dolomite
< 40 % of dolomite
5 Sandy shale dolomite 5 Sandy shale dolomite
Shale > 40 % et < 60 % of shale
6 Low sandy shale dolomite 6 Low sandy shale dolomite
7 Sand 7 Sand
< 10 % Nphi
> 10 % Nphi
8 Shaley sand 8 Shaley sand < 40 % of shale
9 Low sandy shale 9 Low sandy shale < 40 % of shale
10 Andesites 10 Andesites > 40 % of shale
48 The Open Geology Journal, 2009, Volume 3 Baouche et al.
In the literature [15], the proposed models are very diverse for the Hassi R’Mel, and one can recognize several models of sequences [2] of various scales which are of the second, third, and fourth order. The models suggested are very diverse, but are defined only by the gamma ray curve. The models of recognized formations for the wells of Southern Hassi R’Mel are primarily formations with siliciclastic fill, formations with volcanic sediment filling and formations with evaporitic shale filling representing sebkha deposition.
The top of the sequences is represented by unconformities, which are modifications related to the pedogenesis and which are not characterized in the old models.
In this work, we characterized these pedogenetic features by their well log responses, namely: GR, Nphi, DT, sonic
signal, overall density, Rhob and resistivity, to make a comparative analysis of these results on the scale of all the features encountered in the wells not studied. This will make it possible to find these features starting from their well-log signature with an aim of better analysis of cores in the Triassic formations of Hassi R’Mel.
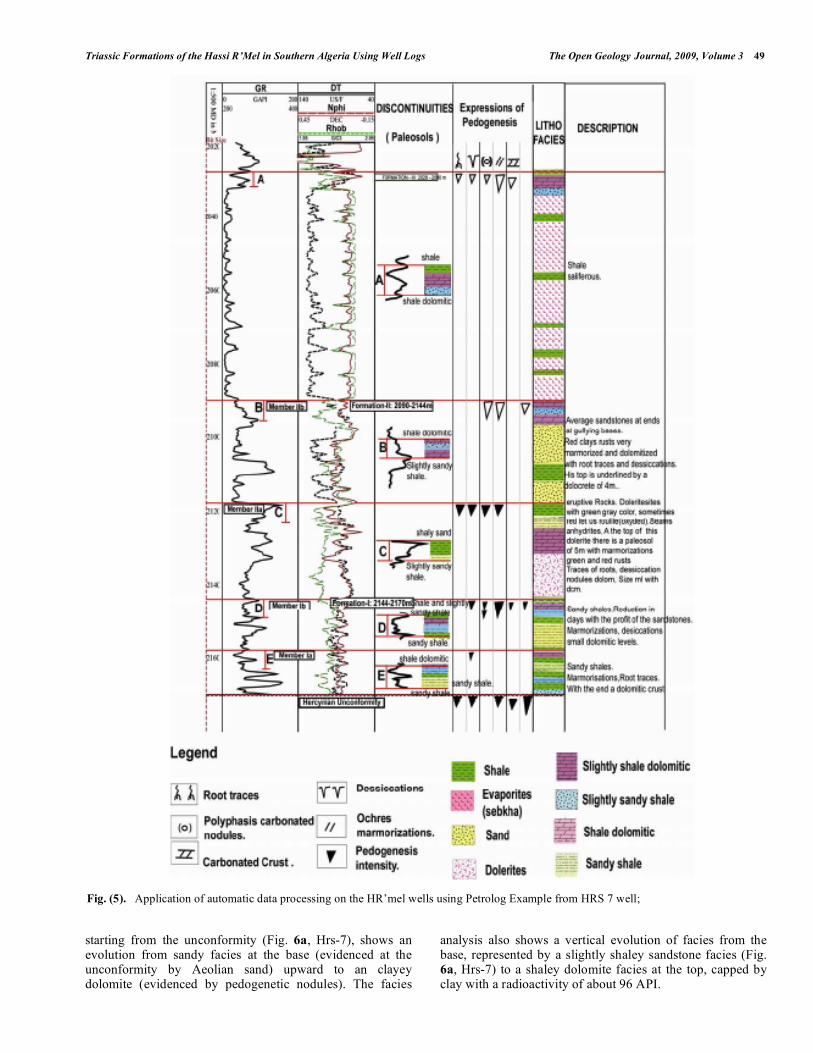
7.1. Well Log Responses of the Paleosols of the Fourth Order, at the Top of Formation I (Hrs-7)
The analysis of the unconformities of the second order in member I.B of formation I at well HRS-7 is represented by small paleosols with mottling, dessications and a small dolomite levels. Formation I is capped by a clay crust (argillan) complex [8].
The analysis of the well log responses obtained from the paleosols of the Hrs-7 well, at the top of formation I, made
Table 3. Well Log Input Parameters of the Petrolog Software
Triassic Formations of the Hassi R’Mel in Southern Algeria Using Well Logs The Open Geology Journal, 2009, Volume 3 49
starting from the unconformity (Fig. 6a, Hrs-7), shows an evolution from sandy facies at the base (evidenced at the unconformity by Aeolian sand) upward to an clayey dolomite (evidenced by pedogenetic nodules). The facies
analysis also shows a vertical evolution of facies from the base, represented by a slightly shaley sandstone facies (Fig. 6a, Hrs-7) to a shaley dolomite facies at the top, capped by clay with a radioactivity of about 96 API.
Fig. (5). Application of automatic data processing on the HR’mel wells using Petrolog Example from HRS 7 well;
50 The Open Geology Journal, 2009, Volume 3 Baouche et al.
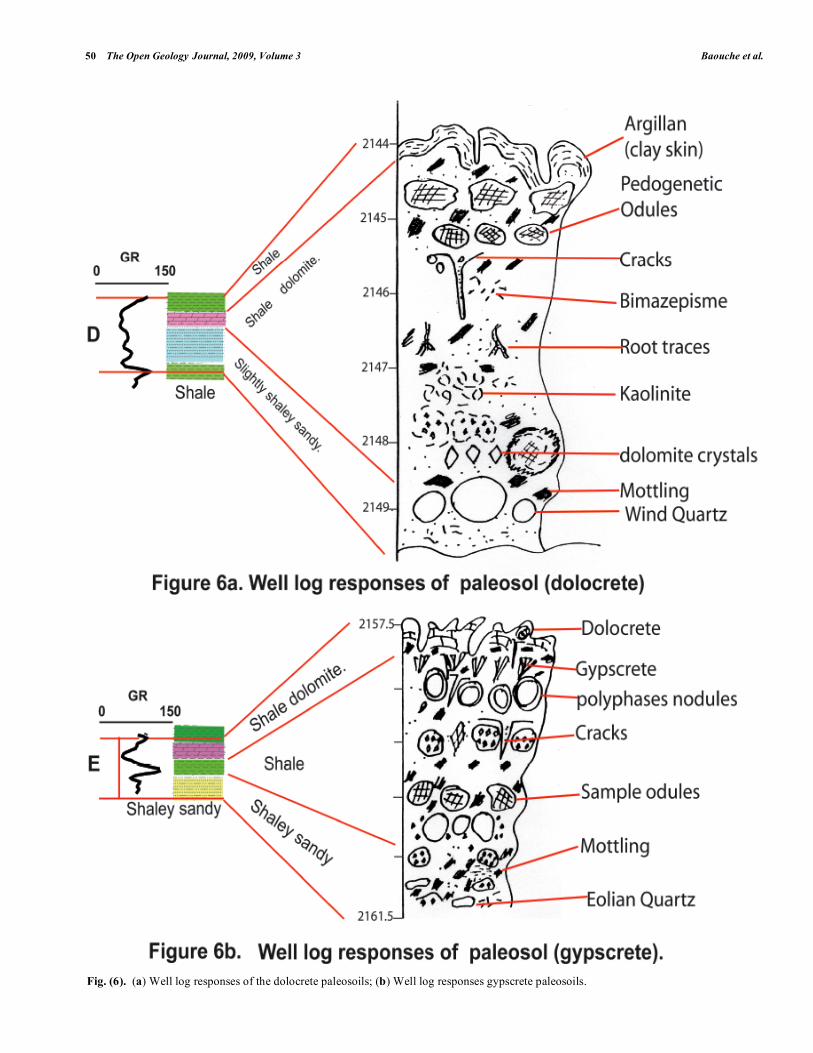
Fig. (6). (a) Well log responses of the dolocrete paleosoils; (b) Well log responses gypscrete paleosoils.
Triassic Formations of the Hassi R’Mel in Southern Algeria Using Well Logs The Open Geology Journal, 2009, Volume 3 51
7.2. Well Log Responses of the Third Order, at the Top
of the Second Member of Formation I-(Hrs-7)
The analysis of the unconformities of the fourth order [8], (Fig. 6b) at the top of Triassic formation I from the HRS-7 well, shows that the first expressions of the pedogensis are in the clays, with the presence of newly formed kaolinite, a bimazépism corresponding to the reorientation of clay minerals, a red rust mottling, root traces and dessication. The evolution continues by giving rise to small dolomite crystals which structure into simple pedogenetic nodules to become polyphased coalescent nodules (Fig. 6b), topped by a small gypseus incrustation (gypscrete), upon which a dolecrete layer marks the end of the first sequence of the third order.
The analysis of the well log responses obtained from the paleosols of the Hrs-7 well, (Fig. 6b, Hrs-7) at the top of the second member of formation I, also shows an evolution of facies starting at the base with Aeolian sand, recognized by analysis of thin sections, at the third order discontinuity at the top of the second member and evolving to dolomite facies (dolocrete). Gypscrete occurs just below the dolocrete. The lithological results obtained from the facies analysis also show a vertical evolution of facies, with the base represented by Aeolian sand and grading upward to a shaley dolomite facies at the top with a radioactivity of 70 API (Fig. 6).
The well log responses recorded at the base of this unconformity have a radioactivity GR(API) level of 56 API, a neutron porosity of N = 18%, a transit time for the sonic signal t = 85 ( s/ft), an overall density b = 2.44 (g/cc) and a resitivity Rt = 2.60 mm. At the top of this unconformity, the readings recorded are: GR(API) = 69(API), N = 19.5%,
t = 84.5 ( s/ft) and b = 2.48 (g/cc) and a resistivity Rt =
2.25 mm.
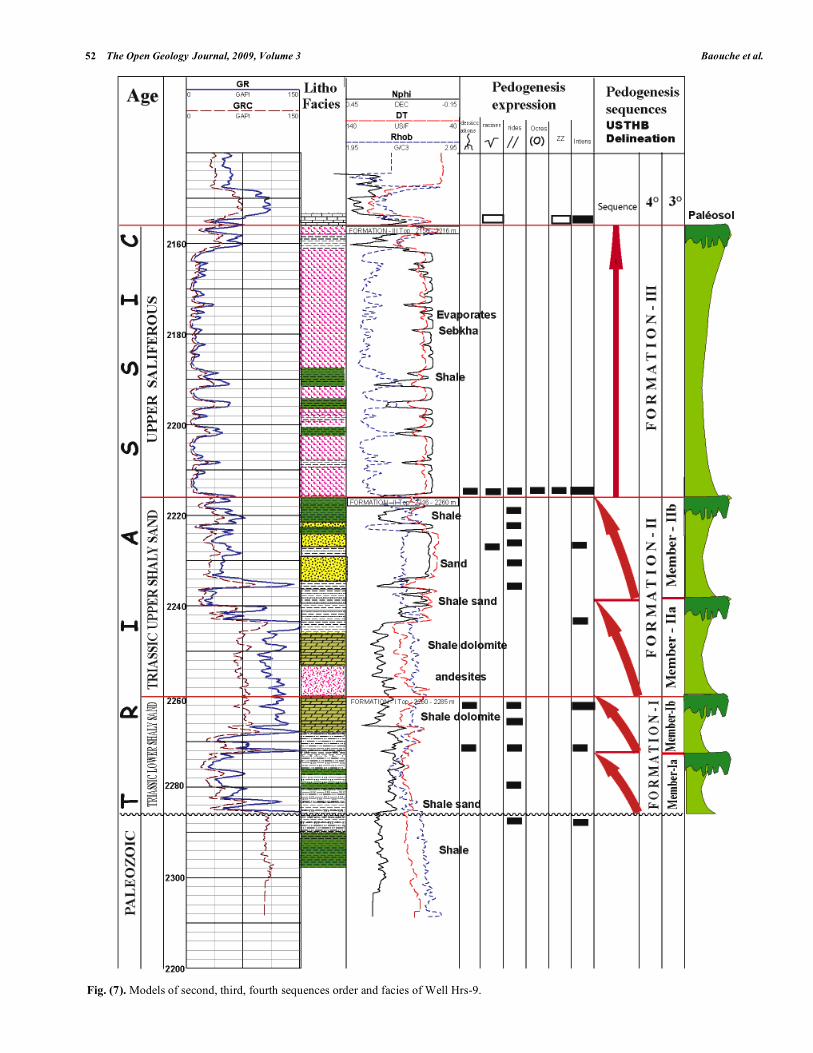
The well log responses of the paleosols to the roof of the formations of the Hrs-9 (Fig. 7) well can be summarized as follows:
Formation III: 24<GR<75; 9<Rt<160; 2.50<Rhob<2.75; 0.30<Phin<0.08; 57<Dt<93.
Formation II: 33<GR<95; 0.14<Phin<0.33; 2.33<Rhob<2.60; 70<DT<87.
Formation I: 40<GR<80; 4<Rt<13; 2.57<Rhob<2.46; 0.16<Phin<0.20; 75<Dt<86.
Finally, changes of facies and thicknesses affect these levels layers characterized by variabilities, in petrophysical terms that are more or less significant. To this end, in future, the prospect researches must be centered mainly with the Formations II which prove to be sandy or shaly sandy.
8. CROSS SECTIONS OF THE HASSI R’MEL WELLS
With an aim of establishing a study of the lateral facies variations in the Hassi R’Mel field, starting from the south toward the north and from the east to the west, three cross sections were generated starting from the well-log data coupled with core descriptions for some of the available wells. The temporal calibrations of the stratigraphic units were carried out starting from published palynologic data and the results of cores analyses provided by Nedjari and Aît Ouali [5]. This allowed correlations on a field scale at Hassi
R’Mel. The database used includes the analysis of reports from Sonatrach and the development and research center as well as results obtained by students from the USTHB and FTSGAT in Bab Ezzouar. In addition, the database included work by [23, 4], publications by Nedjari and Aît Ouali in the Triassic province in Algeria, and the results from work in the Zarzaîtine area [11].
The analysis of the facies and electrofacies as well as the vertical evolution of the stratigraphic units and the analysis of their vertical arrangement made it possible to establish the lateral variation of the facies. The erosion of stratigraphic units and the lithostratigraphic models established, starting from the well log data and the results of available thin sections show that periods of fluvial, playas and sebkha sedimentation during the Triassic were intermingled with periods of non-deposition. This allowed the development of a more or less intense pedogenesis and formed unconformities of varying importance, and which will be used for a scaled sequential cutting erosion principle [24]. The lithographic sequences correspond to environmental sequences and members or formations of the third, fourth and fifth order. Therefore, to build the geometry of the deposit systems of the Hassi R’Mel field, three cross sections were established: NW-SE (Transect II-II), NE-SW (Transect III-III) and NE-SE (Transect V-V). To establish the cross section correlations, common data were chosen for the entire site. We used the paleosols encountered at the tops of formations I, II and III, as is customary in this region.
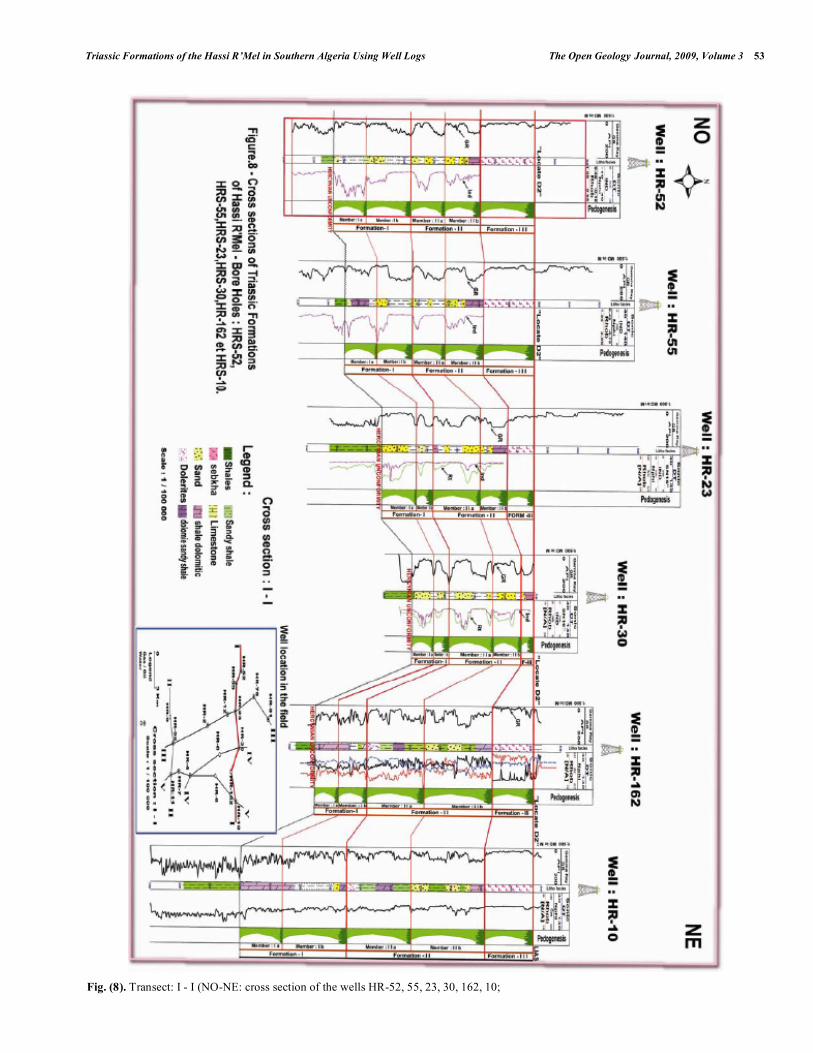
Transect: II-II: Extension of the reservoirs in members II.a and II.b are characterized by a thinning in the second order sequence of the well Hr-52 (NW) toward the Hr-23 well, passing through the Hr-55 well (NE). Conversely, the units thicken from the Hr-30 well to the Hr-10 well (Fig. 8). The electrofacies association of Formation I and II are characteristic of lag deposits and channels. The facies within these channel environments cannot be distinguished using classical well-logs. The distinction between stream flood and subaqueous channels is also difficult with only classical well-log informations; only their association with floodplain or lacustrine deposits will allow an interpretation. Floodplain and lacustrine deposits are characterized by the electrofacies of Formation I or II (Figs. 8-10). Lacustrine environments differ from floodplain environments in having more positive polarity electrofacies and smoother curves. The sebkha deposits are characterized by the electrofacies of Formation III.
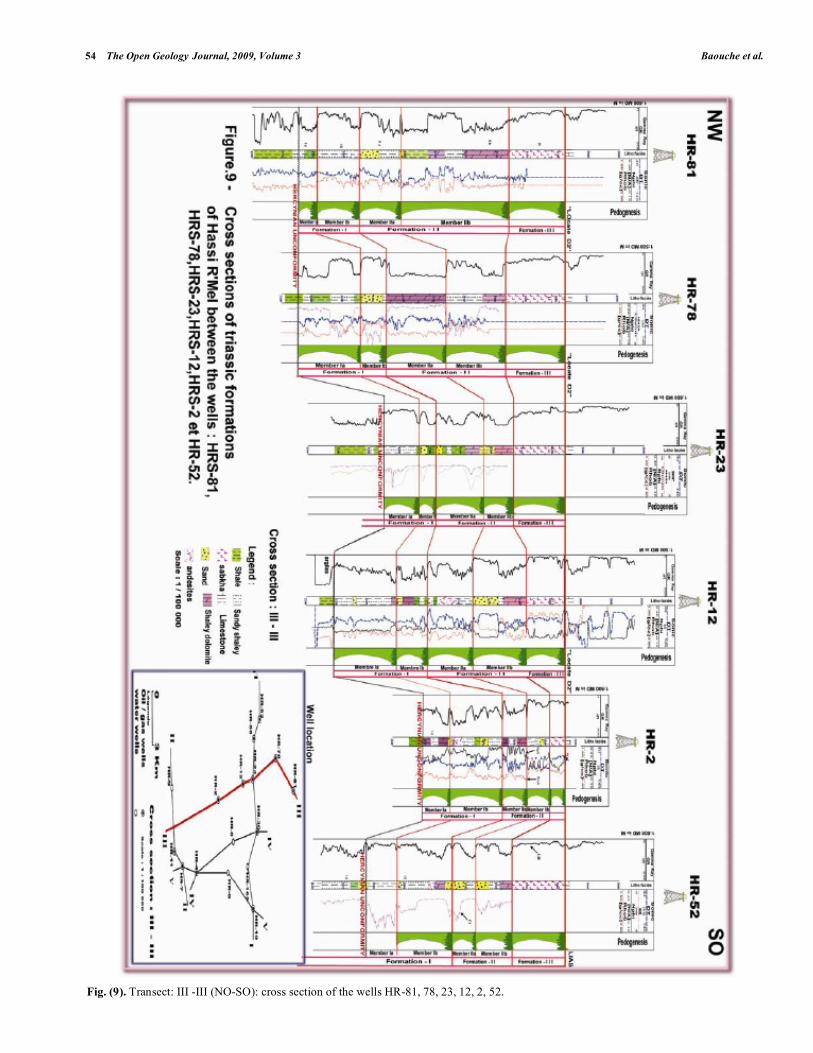
Transect: III-III: Reservoirs of the second order sequences thin from the Hr-81 well (NW), to the well Hr-23 and thicken from this well to the well Hr-52 (SW). A horst can be seen in Hrs-12, Hrs-2 and Hr-52 (Fig. 9). The electrofacies association of Formation I and II are characteristic of lacustrine deposits, fluvial deposits and channels, the sebkha deposits can be recognized by the electrofacies of Formation III.
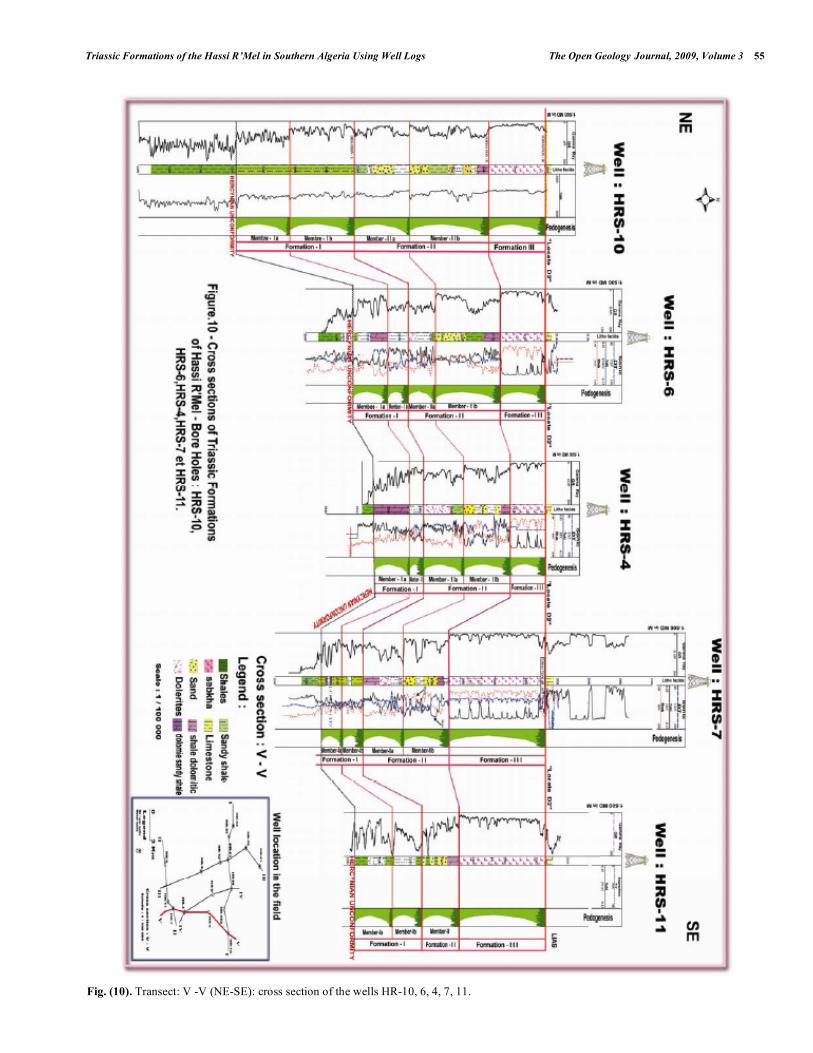
Transect: V-V: An apparent horst is seen in wells Hr-10, Hrs-6 and Hrs-4 and a graben in wells Hrs-4, Hrs-7 and Hrs-11 (Fig. 10). The thickness of the members II.a and II.b increases in the horst and decreases in the graben.These electrofacies have been defined and validated from a study of core and well-logs based on these wells.
52 The Open Geology Journal, 2009, Volume 3 Baouche et al.
Fig. (7). Models of second, third, fourth sequences order and facies of Well Hrs-9.
Triassic Formations of the Hassi R’Mel in Southern Algeria Using Well Logs The Open Geology Journal, 2009, Volume 3 53
Fig. (8). Transect: I - I (NO-NE: cross section of the wells HR-52, 55, 23, 30, 162, 10;
54 The Open Geology Journal, 2009, Volume 3 Baouche et al.
Fig. (9). Transect: III -III (NO-SO): cross section of the wells HR-81, 78, 23, 12, 2, 52.
Triassic Formations of the Hassi R’Mel in Southern Algeria Using Well Logs The Open Geology Journal, 2009, Volume 3 55
Fig. (10). Transect: V -V (NE-SE): cross section of the wells HR-10, 6, 4, 7, 11.
56 The Open Geology Journal, 2009, Volume 3 Baouche et al.
Paleosols can be easily recognized from well-logs (Figs. 8-10) at the top of Formations.
All these electrofacies can be recognized if the thickness of the facies associated is larger than the vertical resolution of the well-logs (30 to 50 cm for classical logs).
9. DISCUSSION AND CONCLUSIONS
The manual and computerized facies analysis of southern, northwestern and northern Hassi R’Mel data from the Triassic Algerian Province reveals the various facies present in the studied zone.
The computated results made it possible to create a reliable lithological model on all of the studied surveys. The comparison between the results obtained and the core analysis (the Hassi R’Mel sandstones were cored in only a very few wells) showed a similarity between the various rock types identified in the well logs and recognized in the core analysis. This method has the following advantages over the traditional approaches. First, the recognizer method effectively identifies lithofacies using well-log data. Lithofacies may be identified automatically and objectively using this process. Second, the system may be more accurate than the faciologic analysis approach where geological variation is complex, and the expert knowledge of geologists is needed to be utilized.
Currently, the model is being used on new wells with the aim of testing its possible extension to a wider field in order to integrate the new lithology that appear into the model (e.g. evaporites, dolomitic sandstone) in the east of the Triassic province. The goal will be to quantitatively define all of the existing rock types in the Triassic Algerian Province.
The facies analysis by well-log analysis helped to distinguish three formations from the Hassi R’Mel Triassic, each one characterized by a unique lithological suite. The first, formation I, is primarily shaley and the second consists of sandy facies alternating with shaley facies (sandy and/or dolomitic) or with sandy shale facies. It is important to note alternations of sandy beds with shaley or dolomitic beds within formations I and II. The dolomite facies have very heterogeneous resistivity curves. The evaporites are generally localized in the top of certain wells located in the south (comprising several tens of meters in thickness) and are absent in certain wells. The shaley facies are generally represented by dolomites and sandy clays. In conclusion, facies analyses can be effective only if an abundance of data is available for study. The manual faciologic analysis makes it possible to define the first elements of studies in order to approach the quantitative facies analysis. Thus, this facies analysis carried out with a maximum of well log records helped to obtain results with a very high degree of accuracy. However, the latter could have been improved if the spacing of the neutron curves and density had been considered in the well log conditions of the parameters (which is a limitation of the software): the software can take into account only five parameters:
Natural total radioactivity Gamma Ray (GR), neutron porosity (Nphi) density (Rhob), transit time of the sonic signal in the rock (DT), and spacing of the neutrons and density curves. Thus, faciologic analysis can be effective only if a variety of data as large as possible exists.
ACKNOWLEDGMENTS
The authors would like to thank Professors Rachid Aît Ouali and Ahmed Nedjari for providing the data set used for this research study and correcting this manuscript. We remain grateful to Digital Formation for their software support and to Geosciences Rennes1. The work reported in this paper was funded by the Department of Sedimentary basins he University of Bab Ezzouar in Algiers.
REFERENCES
[1] A. Boudjema, "Structural evolution of the oil basin (Triassic) of the Eastern northern Sahara (Algeria)", Thesis of doctorate, University
of Paris-South. Hundred. Orsay, 1987, pp. 279. [2] A.D. Miall, "Architecture and sequence stratigraphy of Pleistocene
fluvial systems in the Malay Basin based on seismic time slice analysis", AAPG, Bull., vol. 86, pp. 1201-1216, 2002.
[3] A.D. Miall, "Lithofacies types and vertical profile models in braided river deposits: a summary. In: A.D. Miall, Ed., Fluvial
Sedimentology", Can. Soc. Pet. Geol. Mem., vol 5, p. 859, 1978. [4] A. Hamel, J. Mania, and J. Perriaux, "Etude géologique des grès
triasiques du gisement pétrolier de Hassi R’Mel (Algérie). Caractérisation, extension et milieu de dépôt", pp. 23-55, 1988.
[5] A. Nedjari, "Les faciès rouges de type playa; Electroséquences et chromo séquences; L’exemple des Séries Argileuses Rouges
permiennes du Bassin de Béchar (Sud Oranais, Algérie)", In Actes du 115 e congrès national des sociétés savantes; Section des
sciences; Géologie africaine; Actes du 3e colloque, Actes du Congres National des Sociétés Savantes, Section des Sciences, vol.
115, pp. 111-124, 1992. [6] A. Nedjari, "Litho sequences and 3° electro sequences in the
carboniferous one of the basin of Abadla: comparison of the models and interpretations". Bull. Geol. Service Algeria, vol. 9,
n°1, pp. 69-79, 1998. [7] A. Nedjari, and J. Delfaud, "Les paléosols du Moscovo-Permien du
bassin de Béchar (Algérie), témoins des étapes du comblement d’un bassin syntecto-varisque", In Stratigraphie de l’Algérie:
Contributions et mises au point, CSA, SGA Eds., Mémoires du Service Géologique de l'Algérie 13, 2002, pp. 49-79.
[8] A. Nedjari, R. Ait Ouali, and J. Delfaud, "Sorted basins Saharan and atlassic Algerian: development and news approaches. Triassic
of the Algerian Atlassic and Saharan basins: check not and new approach", In: Stratigraphy of Algeria: Contributions and
developments; Csa, SGA Eds. Memories Geol. Service Algeria, vol.11, pp.87-113, 2002.
[9] A. Nedjari, R. Ait Ouali, T. Philippe, A. Benhamouche, and F. Amrouche, "Les phases passives en géologie et leur
comptabilisation en stratigraphie, Mémoires du Service Géologique de l'Algérie, vol. 13, pp. 253-261, 2006.
[10] A.M. Taylor, and R.L. Gawthorpe, "Application of sequence stratigraphy and trace fossil analysis to reservoir description:
Examples from the Jurassic of the North Sea", In Petroleum Geology of Northwest Europe: Proceedings of the Fourth
Conference, J.R Parker, Ed., Geological Society of London, 1993, pp. 317-336.
[11] B. Hamouche, "Safeguarding of the fluvial systems of Sorted Algerian: impact of the climate and the deformation”, In 10th
French Congress of Sedimentology, October 11-13, 2005, Giens, Delivers summaries, Oral Communication. Geosciences of
Rennes1, 2006. [12] B.K. Horton and J.G. Schmitt, "Sedimentology of the lacustrine
fan-delta system, Miocene Horse Camp Formation, Nevada, USA”, Sedimentology, vol. 43, pp. 133-155, 1996.
[13] C. Augier, Complex well log and matrices. First part: analyze faciologic, Report/ratio interne Elf Aquitaine, 1993.
[14] D.B. Simons, E.V. Richardson, and C.F. Nordin, "Sedimentary structures generated by flows in alluvial channels”, In Primary
Sedimentary Structures and their Hydrodynamic Interpretation, G.V. Middleton, Ed., Soc. Econ. Paleontol. Mineral. Spec. Publ.
vol. 12, pp.34-52, 1965. [15] F. Zeggane, and Z. Chikhi, "Sedimentopedogenetic study of Hassi
R'Mel Southern (Western Province) and characterization of the mediums of deposits. Triassic sequences A, B and C", University of
Triassic Formations of the Hassi R’Mel in Southern Algeria Using Well Logs The Open Geology Journal, 2009, Volume 3 57
Sciences and Technology Houari Boumediene (USTHB), Algiers,
2000. [16] G. Postma, “Depositional architecture and facies of river and fan
deltas: a synthesis”, In Coarse grained deltas, A. Colella, and D.B. Prior, Eds., Int. Assoc. Sedimentol. Spec. Publ., UK: Blackwell,
1990, vol. 10, pp. 13-28. [17] L. Courel, H. Ait Salem, H. Ben Ismail, M. El Mostaine, B.
Fekirine, F. Kamoun, L. Mami, M. Oujidi, and M. Soussi, "An overview of the epicontinental, Triassic series of the Maghreb (NW
Africa). In: G. H. Bachmann and I. Lerche, Eds.,2000; An overview of the epicontinental Triassic series of Maghreb (N-W
Africa)", In: G.H. Bachmann, and I. Lerche, Eds: Epicontinental Triassic. Zbl. Geol. Päont., tome, 2, 9-10, 1998, pp. 1145-1166,
2000. [18] N.F. Louni, N. Zmiri, "Faciès et modèles dans le Trias
Saharien.Algiers", University of Sciences and Technology Houari Boumediene (USTHB), Algiers, 2000.
[19] R. Aît Ouali, J. Delfaud, "Les modalités d'ouverture du bassin des Ksour au Lias dans le cadre du rifting jurassique au Maghreb", C.
R. Acad. Sci. Paris, série IIa, 320, pp. 773-778, 1995. [20] O. Serra, "Differed well log, bases interpretation", interpretation of
the well log data, 7. Bull. Centers Rech. Explor.-Prod. Elf-Aquitaine, Mem. Pau, vol. 631 pp. 205-227, 1985a.
[21] O. Serra, "Sedimentary environment from wireline logs. Schlumberger", vol. 211, pp, 205-227, 1985b.
[22] O. Serra, "Differed well log: their use in Sedimentary geology". Bull. Centers rech. Expl-Prod. Elf Aquitaine, vol. 10, pp. 205-227,
1986. [23] Petrolog, "Advanced Log Analysis Software", v .10. Crocker data
processing. Petroleum House. WA 6102, Australia, 2009. [24] P.R. Vail, R.M. Mitchum, R.G. Todd, J.M. Widmier, S.I.
Thompson, J.B. Sangree, J.N. Bubb, and W.G. Hatlelid, "Seismic
stratigraphy and global changes of Sea-level”, In Seismic
Stratigraphy - Applications to Hydrocarbon Exploration, C.E. Payton, Ed., vol. 26, Am. Assoc. Petrol. Geol. Mem., pp. 49-212,
1977. [25] R. Aît Ouali, and A. Nedjari, "The Saharan Triassic province. 20
years of geological information: critical assessment and reflexions", Bull. Soc. Geol. Service Algeria, vol.7, pp. 211-228,
1996. [26] S. Bourquin, "Analyse facio séquentielle par diagraphies du Trias
du centre ouest du bassin de Paris: apports à la reconstitution de l'environnement de dépôt", Thèse Université Nancy I, p. 215, 1991,
(72 fig. 6 tab). [27] S. Bourquin, B. Mathis, J. Clermonte, B. Didelot, M. Durand, G.
Ghanem-Alkhadour, and J. Le Roux, "Diagraphies et analyse facio séquentielle: approche méthodologique et exemples d’applications
dans le Bassin parisien et le Fossé rhénan". Bull. Soc. Géol. Fance., vol. 4, pp. 693-707, 1990, ( fig, 13).
[28] S. Bourquin, C. Boehm, J. Clermonte, M. Durand, and O. Serra., "Analyse faciologique et séquentielle du Trias du centre ouest du
bassin de Paris à partir des données diagraphiques", Bull. Soc. Geol. France., vol. 2, pp. 177-188, 1993.
[29] S. Bourquin, and F. Guillocheau, "Keuper stratigraphic cycles in the Paris Basin and comparison with cycles in other Peritethyan
basins (German Basin and the Bresse-Jura Basin)", Sedimentary Geology, vol. 105, pp. 159-182, 1996.
[30] S. Bourquin, C. Rigollet, and P. Bourges, "High-resolution sequence stratigraphy of an alluvial fan-fan delta environment:
stratigraphic and geodynamic implications - Example of the Chaunoy Sandstones, Keuper of the Paris Basin”, Sedimentary
Geology, vol. 121, pp. 207-237, 1998. [31] Schlumberger, "Collection of Charts of interpretation of the well
logs", France (Paris), 1987b.
Received: March 14, 2009 Revised: April 29, 2009 Accepted: May 5, 2009
© Baouche et al.; Licensee Bentham Open.
This is an open access article licensed under the terms of the Creative Commons Attribution Non-Commercial License (http: //creativecommons.org/licenses/by-nc/
3.0/) which permits unrestricted, non-commercial use, distribution and reproduction in any medium, provided the work is properly cited.


![11-Petrolog Quim [8]](https://img.pdfslide.net/doc/110x75/55cf868d550346484b98c040/11-petrolog-quim-8.jpg)

