Embed Size (px)
Citation preview
Associate Professor, Environmental Technologies Research Center, Ahvaz Jundishapur University of Medical Sciences, Ahvaz, Iran
Water desalination by membrane technology (RO) in southern Iran (Jask city)Zabihollah Yousefi1*, Ramazan Motallebi2, Afshin Takdastan3
1Professor, Department of Environmental Health, Mazandaran University of Medical Sciences, Sari, Iran2MSc student, Department of Water Engineering, Islamic Azad University, Bandar Abbas Branch, Hormozgan, Iran3
AbstractBackground: Reverse Osmosis (RO) is an increasingly common method of desalination. A full scale water desalination system by membrane technology (RO) evaluated in a southern city (Jask) in Iran. Methods: First, data collection on water supply and network were performed. Analysis on most of the water quality parameters (Turbidity, pH, EC, Cl-, Na+, Alkalinity, Ca, Na, K, No3, No2, Fe, Mg, Mn, NH4, Po4, HCo3
-, So4
2- etc.) was performed as standard methods. The membranes of the RO in the desalination system were Poly-Amid (CSM type). Results: The efficiency of the RO water desalination system was 94.16, 84.12, 92.00, and 96.17% respectively for Turbidity, Na+, Mg2+, So4
2-. The result shows a significant difference between influent and effluent water of the RO system. The produced water is in agreement with national standard of drinking water. Furthermore, water exited from the RO system for TDS, Ca+2, and Mg2+ was less than minimum limit of the guideline.Conclusion: The quality parameters of the water resource (EC, TDS, Cl-, Na+ etc.) were higher than Iranian drinking water standards. The RO technology modified the quality of the water parameters.Keywords: Membrane technology, Reverse osmosis, Water desalination, Southern IranCitation: Yousefi Z, Motalebi R, Takdastan A. Water desalination by membrane technology (RO) in southern Iran (Jask city). Environmental Health Engineering and Management Journal 2014; 1(1): 13–18.
*Correspondence to: Zabihollah Yousefi Email: [email protected]
Article History:Received: 14 August 2014Accepted: 3 November 2014ePublished: 18 November 2014
Environmental Health Engineering and Management Journal 2014, 1(1), 13–18
IntroductionDissolved salts removal from brackish and saline water was difficult and also expensive in the past, so saline water was not as a drinking water source. From 1950s, desalination process was considered as an economic option for traditional usage. Isolation of dissolved salts from a saline or brackish water, is called desalination. Ev-ery water that contains Total Dissolved Salts (TDS) less than 1000 ppm, is called fresh water (1). Range of TDS for injection to desalination process is vary from 1000 to 60,000 ppm. Usually seawater contain TDS between 30,000-45,000 ppm, which can be removed by Reverse Osmosis (RO) membrane. RO membrane can be applied for TDS variation from 10,000 to 60,000 ppm. TDS range from 1000-10,000 ppm (usually related to groundwater resources), can be removed by brackish water RO mem-brane (2,3). Use of membrane technology in desalination process, increased in recent years (4,5). Recently, differi-ent industrial applications, use desalination process by RO membranes. This new technology, increased our po-tential for improvement of environmental protection and sustainable growth (6,7).
Currently, RO method is considered as the best technol-ogy for brackish and seawater treatment and also con-sumes less energy than the other desalination processes (1,8). Requirement of RO system to energy is less than the other desalination processes. It well ensures the global marketing of RO system (1,9). RO membrane is a basic treatment process for groundwater contaminated with different pollutants (10,11). Method of treatment for contaminated aquifer by RO process is the same as brackish water RO (11-14).
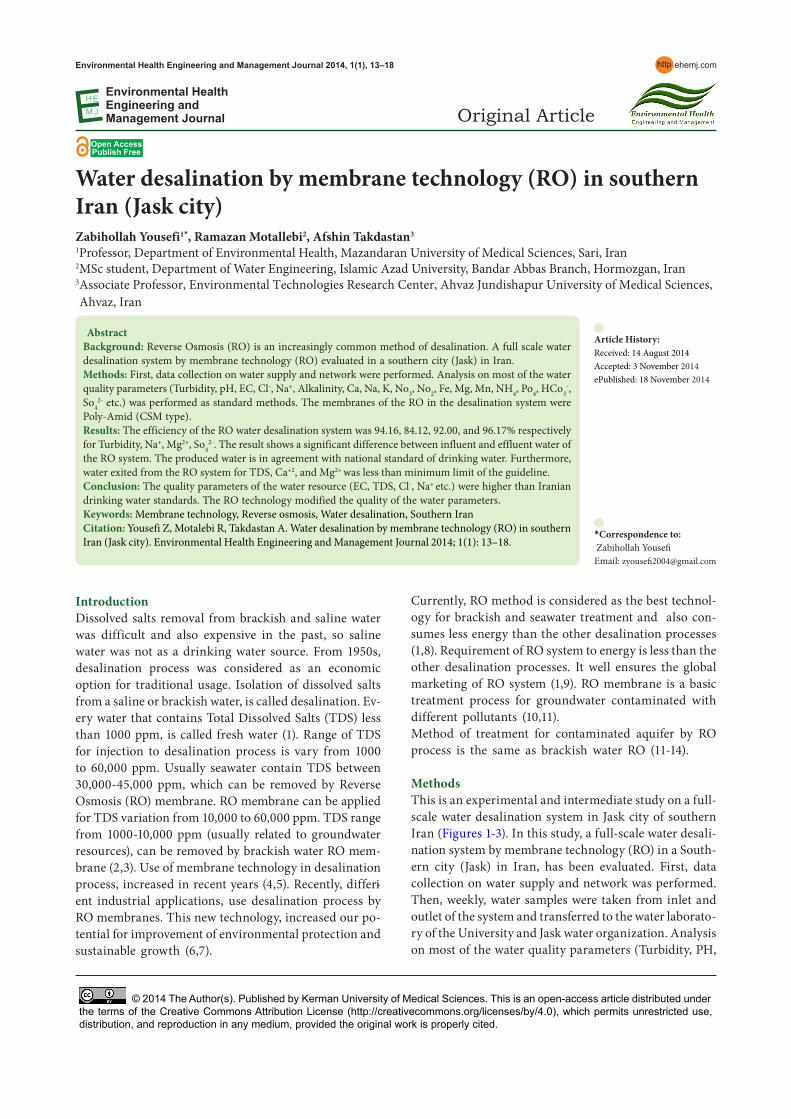
MethodsThis is an experimental and intermediate study on a full-scale water desalination system in Jask city of southern Iran (Figures 1-3). In this study, a full-scale water desali-nation system by membrane technology (RO) in a South-ern city (Jask) in Iran, has been evaluated. First, data collection on water supply and network was performed. Then, weekly, water samples were taken from inlet and outlet of the system and transferred to the water laborato-ry of the University and Jask water organization. Analysis on most of the water quality parameters (Turbidity, PH,
Environmental Health Engineering and Management Journal
HE
MJ
© 2014 The Author(s). Published by Kerman University of Medical Sciences. This is an open-access article distributed under the terms of the Creative Commons Attribution License (http://creativecommons.org/licenses/by/4.0), which permits unrestricted use, distribution, and reproduction in any medium, provided the original work is properly cited.
ehemj.comhttp
Open AccessPublish Free
Original Article
Yousefi et al.
Environmental Health Engineering and Management Journal 2014, 1(1), 13–1814
EC, Cl-, Na+, Alkalinity, Ca, Na, K, No3, No2, Fe, Mg, Mn, NH4, Po4, HCo3
-, So42- etc.) was performed as standard
methods. The membranes of the RO in the desalination system were Poly-Amid (CSM type). All experiments and preparation of the solutions were carried out based on the guidelines of a reference book titled “standard methods for water and wastewater experiments” (15).
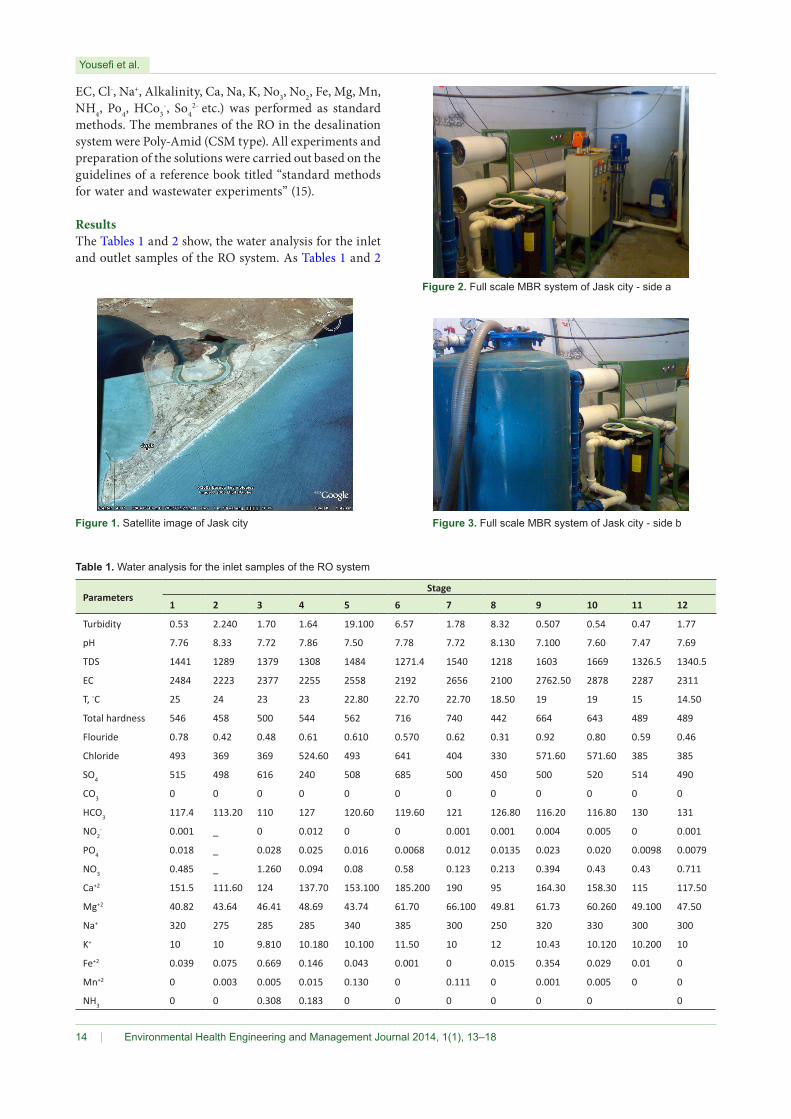
ResultsThe Tables 1 and 2 show, the water analysis for the inlet and outlet samples of the RO system. As Tables 1 and 2
Figure 1. Satellite image of Jask city Figure 3. Full scale MBR system of Jask city - side b
Figure 2. Full scale MBR system of Jask city - side a
Table 1. Water analysis for the inlet samples of the RO system
ParametersStage
1 2 3 4 5 6 7 8 9 10 11 12
Turbidity 0.53 2.240 1.70 1.64 19.100 6.57 1.78 8.32 0.507 0.54 0.47 1.77
pH 7.76 8.33 7.72 7.86 7.50 7.78 7.72 8.130 7.100 7.60 7.47 7.69
TDS 1441 1289 1379 1308 1484 1271.4 1540 1218 1603 1669 1326.5 1340.5
EC 2484 2223 2377 2255 2558 2192 2656 2100 2762.50 2878 2287 2311
T, ◦C 25 24 23 23 22.80 22.70 22.70 18.50 19 19 15 14.50
Total hardness 546 458 500 544 562 716 740 442 664 643 489 489
Flouride 0.78 0.42 0.48 0.61 0.610 0.570 0.62 0.31 0.92 0.80 0.59 0.46
Chloride 493 369 369 524.60 493 641 404 330 571.60 571.60 385 385
SO4 515 498 616 240 508 685 500 450 500 520 514 490
CO3 0 0 0 0 0 0 0 0 0 0 0 0
HCO3 117.4 113.20 110 127 120.60 119.60 121 126.80 116.20 116.80 130 131
NO2- 0.001 _ 0 0.012 0 0 0.001 0.001 0.004 0.005 0 0.001
PO4 0.018 _ 0.028 0.025 0.016 0.0068 0.012 0.0135 0.023 0.020 0.0098 0.0079
NO3 0.485 _ 1.260 0.094 0.08 0.58 0.123 0.213 0.394 0.43 0.43 0.711
Ca+2 151.5 111.60 124 137.70 153.100 185.200 190 95 164.30 158.30 115 117.50
Mg+2 40.82 43.64 46.41 48.69 43.74 61.70 66.100 49.81 61.73 60.260 49.100 47.50
Na+ 320 275 285 285 340 385 300 250 320 330 300 300
K+ 10 10 9.810 10.180 10.100 11.50 10 12 10.43 10.120 10.200 10
Fe+2 0.039 0.075 0.669 0.146 0.043 0.001 0 0.015 0.354 0.029 0.01 0
Mn+2 0 0.003 0.005 0.015 0.130 0 0.111 0 0.001 0.005 0 0
NH3 0 0 0.308 0.183 0 0 0 0 0 0 0
Environmental Health Engineering and Management Journal 2014, 1(1), 13–18 15
Yousefi et al.
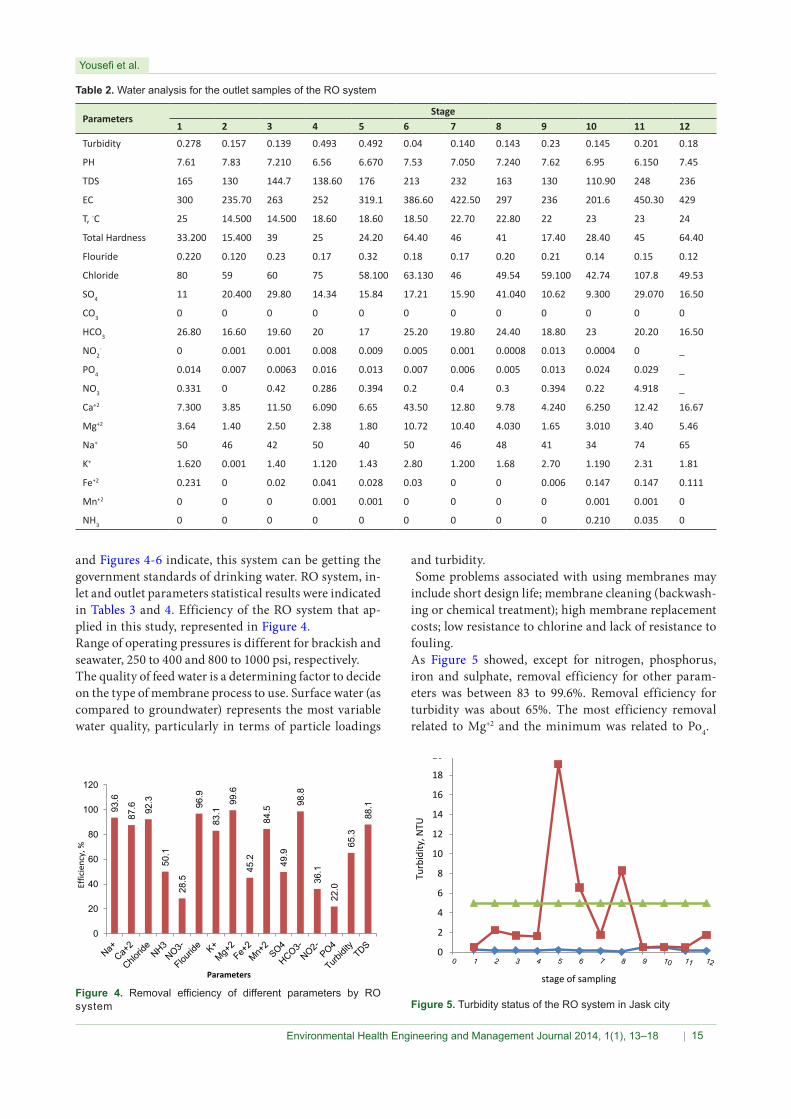
Table 2. Water analysis for the outlet samples of the RO system
ParametersStage
1 2 3 4 5 6 7 8 9 10 11 12
Turbidity 0.278 0.157 0.139 0.493 0.492 0.04 0.140 0.143 0.23 0.145 0.201 0.18
PH 7.61 7.83 7.210 6.56 6.670 7.53 7.050 7.240 7.62 6.95 6.150 7.45
TDS 165 130 144.7 138.60 176 213 232 163 130 110.90 248 236
EC 300 235.70 263 252 319.1 386.60 422.50 297 236 201.6 450.30 429
T, ◦C 25 14.500 14.500 18.60 18.60 18.50 22.70 22.80 22 23 23 24
Total Hardness 33.200 15.400 39 25 24.20 64.40 46 41 17.40 28.40 45 64.40
Flouride 0.220 0.120 0.23 0.17 0.32 0.18 0.17 0.20 0.21 0.14 0.15 0.12
Chloride 80 59 60 75 58.100 63.130 46 49.54 59.100 42.74 107.8 49.53
SO4 11 20.400 29.80 14.34 15.84 17.21 15.90 41.040 10.62 9.300 29.070 16.50
CO3 0 0 0 0 0 0 0 0 0 0 0 0
HCO3 26.80 16.60 19.60 20 17 25.20 19.80 24.40 18.80 23 20.20 16.50
NO2- 0 0.001 0.001 0.008 0.009 0.005 0.001 0.0008 0.013 0.0004 0 _
PO4 0.014 0.007 0.0063 0.016 0.013 0.007 0.006 0.005 0.013 0.024 0.029 _
NO3 0.331 0 0.42 0.286 0.394 0.2 0.4 0.3 0.394 0.22 4.918 _
Ca+2 7.300 3.85 11.50 6.090 6.65 43.50 12.80 9.78 4.240 6.250 12.42 16.67
Mg+2 3.64 1.40 2.50 2.38 1.80 10.72 10.40 4.030 1.65 3.010 3.40 5.46
Na+ 50 46 42 50 40 50 46 48 41 34 74 65
K+ 1.620 0.001 1.40 1.120 1.43 2.80 1.200 1.68 2.70 1.190 2.31 1.81
Fe+2 0.231 0 0.02 0.041 0.028 0.03 0 0 0.006 0.147 0.147 0.111
Mn+2 0 0 0 0.001 0.001 0 0 0 0 0.001 0.001 0
NH3 0 0 0 0 0 0 0 0 0 0.210 0.035 0
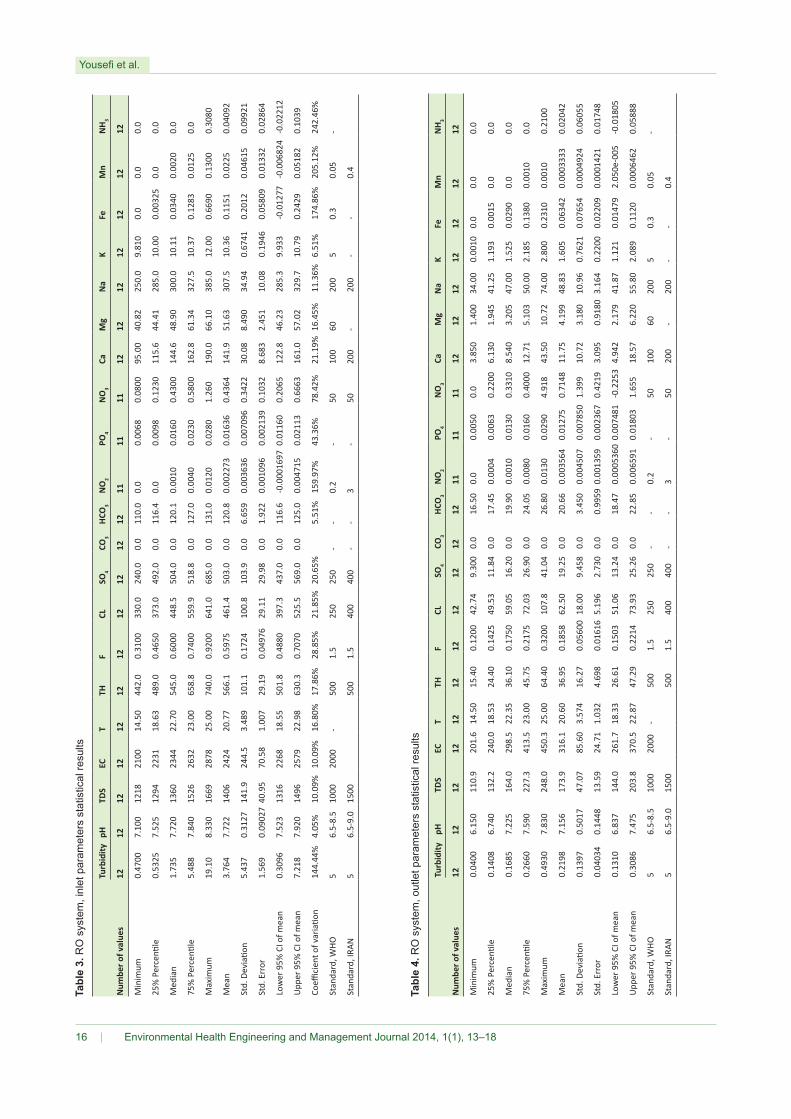
and Figures 4-6 indicate, this system can be getting the government standards of drinking water. RO system, in-let and outlet parameters statistical results were indicated in Tables 3 and 4. Efficiency of the RO system that ap-plied in this study, represented in Figure 4.Range of operating pressures is different for brackish and seawater, 250 to 400 and 800 to 1000 psi, respectively. The quality of feed water is a determining factor to decide on the type of membrane process to use. Surface water (as compared to groundwater) represents the most variable water quality, particularly in terms of particle loadings
and turbidity. Some problems associated with using membranes may include short design life; membrane cleaning (backwash-ing or chemical treatment); high membrane replacement costs; low resistance to chlorine and lack of resistance to fouling.As Figure 5 showed, except for nitrogen, phosphorus, iron and sulphate, removal efficiency for other param-eters was between 83 to 99.6%. Removal efficiency for turbidity was about 65%. The most efficiency removal related to Mg+2 and the minimum was related to Po4.
Figure 4. Removal efficiency of different parameters by RO system
93.6
87.6 92
.3
50.1
28.5
96.9
83.1
99.6
45.2
84.5
49.9
98.8
36.1
22.0
65.3
88.1
0
20
40
60
80
100
120
Effic
ienc
y, %
Parameters
Figure 5. Turbidity status of the RO system in Jask city
0
2
4
6
8
10
12
14
16
18
20
Turb
idity
, NTU
stage of sampling
Yousefi et al.
Environmental Health Engineering and Management Journal 2014, 1(1), 13–1816
Tabl
e 3.
RO
sys
tem
, inl
et p
aram
eter
s st
atis
tical
resu
lts
Tu
rbid
itypH
TDS
ECT
THF
CLSO
4CO
3HC
O3
NO
2PO
4N
O3
CaM
gN
aK
FeM
nN
H 3
Num
ber o
f val
ues
1212
1212
1212
1212
1212
1211
1111
1212
1212
1212
12
Min
imum
0.47
007.
100
1218
2100
14.5
044
2.0
0.31
0033
0.0
240.
00.
011
0.0
0.0
0.00
680.
0800
95.0
040
.82
250.
09.
810
0.0
0.0
0.0
25%
Per
centi
le0.
5325
7.52
512
9422
3118
.63
489.
00.
4650
373.
049
2.0
0.0
116.
40.
00.
0098
0.12
3011
5.6
44.4
128
5.0
10.0
00.
0032
50.
00.
0
Med
ian
1.73
57.
720
1360
2344
22.7
054
5.0
0.60
0044
8.5
504.
00.
012
0.1
0.00
100.
0160
0.43
0014
4.6
48.9
030
0.0
10.1
10.
0340
0.00
200.
0
75%
Per
centi
le5.
488
7.84
015
2626
3223
.00
658.
80.
7400
559.
951
8.8
0.0
127.
00.
0040
0.02
300.
5800
162.
861
.34
327.
510
.37
0.12
830.
0125
0.0
Max
imum
19.1
08.
330
1669
2878
25.0
074
0.0
0.92
0064
1.0
685.
00.
013
1.0
0.01
200.
0280
1.26
019
0.0
66.1
038
5.0
12.0
00.
6690
0.13
000.
3080
Mea
n3.
764
7.72
214
0624
2420
.77
566.
10.
5975
461.
450
3.0
0.0
120.
80.
0022
730.
0163
60.
4364
141.
951
.63
307.
510
.36
0.11
510.
0225
0.04
092
Std.
Dev
iatio
n5.
437
0.31
2714
1.9
244.
53.
489
101.
10.
1724
100.
810
3.9
0.0
6.65
90.
0036
360.
0070
960.
3422
30.0
88.
490
34.9
40.
6741
0.20
120.
0461
50.
0992
1
Std.
Err
or1.
569
0.09
027
40.9
570
.58
1.00
729
.19
0.04
976
29.1
129
.98
0.0
1.92
20.
0010
960.
0021
390.
1032
8.68
32.
451
10.0
80.
1946
0.05
809
0.01
332
0.02
864
Low
er 9
5% C
I of m
ean
0.30
967.
523
1316
2268
18.5
550
1.8
0.48
8039
7.3
437.
00.
011
6.6
-0.0
0016
970.
0116
00.
2065
122.
846
.23
285.
39.
933
-0.0
1277
-0.0
0682
4-0
.022
12
Upp
er 9
5% C
I of m
ean
7.21
87.
920
1496
2579
22.9
863
0.3
0.70
7052
5.5
569.
00.
012
5.0
0.00
4715
0.02
113
0.66
6316
1.0
57.0
232
9.7
10.7
90.
2429
0.05
182
0.10
39
Coeffi
cien
t of v
aria
tion
144.
44%
4.05
%10
.09%
10.0
9%16
.80%
17.8
6%28
.85%
21.8
5%20
.65%
5.51
%15
9.97
%43
.36%
78.4
2%21
.19%
16.4
5%11
.36%
6.51
%17
4.86
%20
5.12
%24
2.46
%
Stan
dard
, WHO
56.
5-8.
510
0020
00-
500
1.5
250
250
--
0.2
-50
100
6020
05
0.3
0.05
-
Stan
dard
, IRA
N5
6.5-
9.0
1500
500
1.5
400
400
--
3-
5020
0-
200
--
0.4
Tabl
e 4.
RO
sys
tem
, out
let p
aram
eter
s st
atis
tical
resu
lts
Tu
rbid
itypH
TDS
ECT
THF
CLSO
4CO
3HC
O3
NO
2PO
4N
O3
CaM
gN
aK
FeM
nN
H 3
Num
ber o
f val
ues
1212
1212
1212
1212
1212
1211
1111
1212
1212
1212
12
Min
imum
0.04
006.
150
110.
920
1.6
14.5
015
.40
0.12
0042
.74
9.30
00.
016
.50
0.0
0.00
500.
03.
850
1.40
034
.00
0.00
100.
00.
00.
0
25%
Per
centi
le0.
1408
6.74
013
2.2
240.
018
.53
24.4
00.
1425
49.5
311
.84
0.0
17.4
50.
0004
0.00
630.
2200
6.13
01.
945
41.2
51.
193
0.00
150.
00.
0
Med
ian
0.16
857.
225
164.
029
8.5
22.3
536
.10
0.17
5059
.05
16.2
00.
019
.90
0.00
100.
0130
0.33
108.
540
3.20
547
.00
1.52
50.
0290
0.0
0.0
75%
Per
centi
le0.
2660
7.59
022
7.3
413.
523
.00
45.7
50.
2175
72.0
326
.90
0.0
24.0
50.
0080
0.01
600.
4000
12.7
15.
103
50.0
02.
185
0.13
800.
0010
0.0
Max
imum
0.49
307.
830
248.
045
0.3
25.0
064
.40
0.32
0010
7.8
41.0
40.
026
.80
0.01
300.
0290
4.91
843
.50
10.7
274
.00
2.80
00.
2310
0.00
100.
2100
Mea
n0.
2198
7.15
617
3.9
316.
120
.60
36.9
50.
1858
62.5
019
.25
0.0
20.6
60.
0035
640.
0127
50.
7148
11.7
54.
199
48.8
31.
605
0.06
342
0.00
0333
30.
0204
2
Std.
Dev
iatio
n0.
1397
0.50
1747
.07
85.6
03.
574
16.2
70.
0560
018
.00
9.45
80.
03.
450
0.00
4507
0.00
7850
1.39
910
.72
3.18
010
.96
0.76
210.
0765
40.
0004
924
0.06
055
Std.
Err
or0.
0403
40.
1448
13.5
924
.71
1.03
24.
698
0.01
616
5.19
62.
730
0.0
0.99
590.
0013
590.
0023
670.
4219
3.09
50.
9180
3.16
40.
2200
0.02
209
0.00
0142
10.
0174
8
Low
er 9
5% C
I of m
ean
0.13
106.
837
144.
026
1.7
18.3
326
.61
0.15
0351
.06
13.2
40.
018
.47
0.00
0536
00.
0074
81-0
.225
34.
942
2.17
941
.87
1.12
10.
0147
92.
050e
-005
-0.0
1805
Upp
er 9
5% C
I of m
ean
0.30
867.
475
203.
837
0.5
22.8
747
.29
0.22
1473
.93
25.2
60.
022
.85
0.00
6591
0.01
803
1.65
518
.57
6.22
055
.80
2.08
90.
1120
0.00
0646
20.
0588
8
Stan
dard
, WHO
56.
5-8.
510
0020
00-
500
1.5
250
250
--
0.2
-50
100
6020
05
0.3
0.05
-
Stan
dard
, IRA
N5
6.5-
9.0
1500
500
1.5
400
400
--
3-
5020
0-
200
--
0.4
Environmental Health Engineering and Management Journal 2014, 1(1), 13–18 17
Yousefi et al.
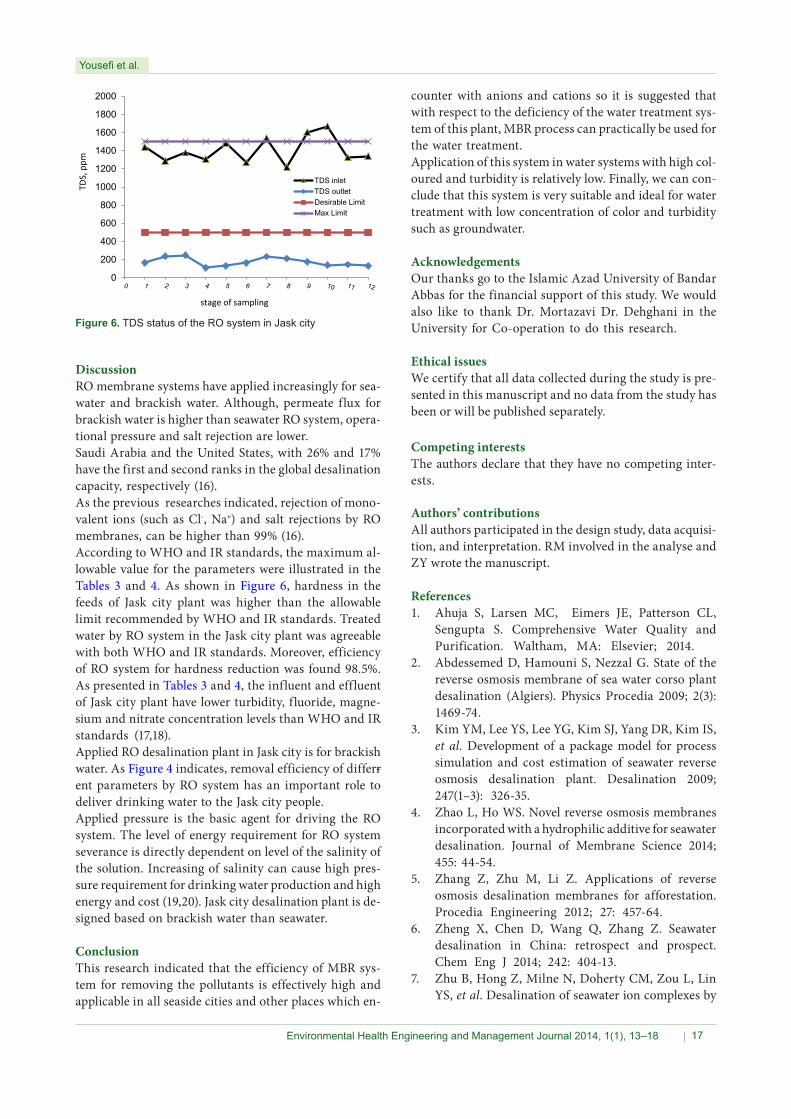
Discussion RO membrane systems have applied increasingly for sea-water and brackish water. Although, permeate flux for brackish water is higher than seawater RO system, opera-tional pressure and salt rejection are lower. Saudi Arabia and the United States, with 26% and 17% have the first and second ranks in the global desalination capacity, respectively (16).As the previous researches indicated, rejection of mono-valent ions (such as Cl-, Na+) and salt rejections by RO membranes, can be higher than 99% (16).According to WHO and IR standards, the maximum al-lowable value for the parameters were illustrated in the Tables 3 and 4. As shown in Figure 6, hardness in the feeds of Jask city plant was higher than the allowable limit recommended by WHO and IR standards. Treated water by RO system in the Jask city plant was agreeable with both WHO and IR standards. Moreover, efficiency of RO system for hardness reduction was found 98.5%. As presented in Tables 3 and 4, the influent and effluent of Jask city plant have lower turbidity, fluoride, magne-sium and nitrate concentration levels than WHO and IR standards (17,18).Applied RO desalination plant in Jask city is for brackish water. As Figure 4 indicates, removal efficiency of differr-ent parameters by RO system has an important role to deliver drinking water to the Jask city people.Applied pressure is the basic agent for driving the RO system. The level of energy requirement for RO system severance is directly dependent on level of the salinity of the solution. Increasing of salinity can cause high pres-sure requirement for drinking water production and high energy and cost (19,20). Jask city desalination plant is de-signed based on brackish water than seawater.
ConclusionThis research indicated that the efficiency of MBR sys-tem for removing the pollutants is effectively high and applicable in all seaside cities and other places which en-
0
200
400
600
800
1000
1200
1400
1600
1800
2000TD
S, p
pm
stage of sampling
TDS inletTDS outletDesirable LimitMax Limit
Figure 6. TDS status of the RO system in Jask city
counter with anions and cations so it is suggested that with respect to the deficiency of the water treatment sys-tem of this plant, MBR process can practically be used for the water treatment. Application of this system in water systems with high col-oured and turbidity is relatively low. Finally, we can con-clude that this system is very suitable and ideal for water treatment with low concentration of color and turbidity such as groundwater.
AcknowledgementsOur thanks go to the Islamic Azad University of Bandar Abbas for the financial support of this study. We would also like to thank Dr. Mortazavi Dr. Dehghani in the University for Co-operation to do this research.
Ethical issues We certify that all data collected during the study is pre-sented in this manuscript and no data from the study has been or will be published separately.
Competing interests The authors declare that they have no competing inter-ests. Authors’ contributionsAll authors participated in the design study, data acquisi-tion, and interpretation. RM involved in the analyse and ZY wrote the manuscript.
References1. Ahuja S, Larsen MC, Eimers JE, Patterson CL,
Sengupta S. Comprehensive Water Quality and Purification. Waltham, MA: Elsevier; 2014.
2. Abdessemed D, Hamouni S, Nezzal G. State of the reverse osmosis membrane of sea water corso plant desalination (Algiers). Physics Procedia 2009; 2(3): 1469-74.
3. Kim YM, Lee YS, Lee YG, Kim SJ, Yang DR, Kim IS, et al. Development of a package model for process simulation and cost estimation of seawater reverse osmosis desalination plant. Desalination 2009; 247(1–3): 326-35.
4. Zhao L, Ho WS. Novel reverse osmosis membranes incorporated with a hydrophilic additive for seawater desalination. Journal of Membrane Science 2014; 455: 44-54.
5. Zhang Z, Zhu M, Li Z. Applications of reverse osmosis desalination membranes for afforestation. Procedia Engineering 2012; 27: 457-64.
6. Zheng X, Chen D, Wang Q, Zhang Z. Seawater desalination in China: retrospect and prospect. Chem Eng J 2014; 242: 404-13.
7. Zhu B, Hong Z, Milne N, Doherty CM, Zou L, Lin YS, et al. Desalination of seawater ion complexes by
Yousefi et al.
Environmental Health Engineering and Management Journal 2014, 1(1), 13–1818
MFI-type zeolite membranes: temperature and long term stability. Journal of Membrane Science 2014; 453: 126-35.
8. Noshita M. Reverse osmosis seawater desalination for power plant. Desalination 1994; 96(1–3): 359-68.
9. Murrer J, Rosberg R. Desalting of seawater using UF and RO — results of a pilot study. Desalination 1998; 118(1–3): 1-4.
10. Murakami M. Hydro-powered reverse osmosis (RO) desalination for co-generation: a Middle East case study. Desalination 1994; 97(1–3): 301-11.
11. Marquardt K, Nagel R, Seeger H. Seawater desalination by reverse osmosis. Desalination 1983; 46(1–3): 135-43.
12. Morillo J, Usero J, Rosado D, El Bakouri H, Riaza A, Bernaola FJ. Comparative study of brine management technologies for desalination plants. Desalination 2014; 336: 32-49.
13. Molina VG, Casañas A. Reverse osmosis, a key technology in combating water scarcity in Spain. Desalination 2010; 250(3): 950-5.
14. Voros NG, Kiranoudis CT, Maroulis ZB. Solar energy exploitation for reverse osmosis desalination
plants. Desalination 1998; 115(1): 83-101.15. American Public Health Association, American
Water Works Association, Water Pollution Control Federation. Standard methods for the examination of water and wastewater. 14th edition. Washington D.C. : American Public Health Association; 1975.
16. Mogheir Y, Foul AA, Abuhabib A, Mohammad A. Assessment of large scale brackish water desalination plants in the Gaza Strip. Desalination 2013; 314: 96-100.
17. World Health Organization. Guidelines for drinking-water quality. Geneva: WHO; 2011.
18. Samadi M, Rahmani A, Sedehi M, Sonboli N. Evaluation of chemical quality in 17 brands of Iranian bottled drinking waters. J Res Health Sci 2009; 9(2): 25-31.
19. Karagiannis IC, Soldatos PG. Water desalination cost literature: review and assessment. Desalination 2008; 223(1-3): 448-56.
20. Gholami V, Yousefi Z, Zabardast Rostami H. Modeling of ground water salinity on the caspian southern coasts. Water Resour Manage 2010; 24: 1415-24.