Embed Size (px)
Citation preview
Universal Journal of Environmental Research and Technology All Rights Reserved Euresian Publication © 2015 eISSN 2249 0256
Available Online at: www.environmentaljournal.org
2015 Volume 5, Issue 3: 141-151
Open Access Research Article
141
Maishale and Ulavi
Role of Bed Surface on the Growth Rate of Algae and Treatability Studies to Control Algae
*Deepa Maishale
and Savitha Ulavi
Department of Environmental Engineering, Sri Jayachamarajendra College of Engineering, Mysuru –570006,
Karnataka, India.
Corresponding author: [email protected]
Abstract: Controlling the growth of algae is a major issue, wherever there is adequate light, moisture and simple nutrients
sustain. The main objective of the current research was to carry out treatability studies to control the growth of
algae using barley, rice and ragi straws and a comparison was made between straws by varying its dosages. This
study revealed the fact that decomposing straw is effective in controlling the growth of algae. Barley straw at a
dosage of 5 g/L was found to be more effective in controlling the growth of algae with 80% reduction in
chlorophyll ‘a’ concentrations when compare with control tray, at an average temperature 290
C, light intensity
of 562 μ mol-2
s-1
photon flux and pH of 7.9. However, barley 2 g/L and rice 5 g/L were also found to control the
growth of the algae. ANOVA results express barley 5 g/L was highly significant when compared with the control
tray with 99% confidence level. Simulation of Kembalu water treatment plant was done to study the effect of
bed surface on the growth of algae. Surface study give an insight about role of surface on the growth rate of
algae. In the present study it was observed that growth of Chlorophyace and Euglenophyceae were predominant
on concrete surface compared Bacillariophyceae, however ceramic surface promoted the growth of
Bacillariophyceae. Higher biomass of Cyanophyceae was found on brick surface.
Keywords: Algae, bed surface, growth rate, inhibition, water quality, growth control
1.0 Introduction: Increase in human population and modern
agricultural practices along with deficient water
management have resulted in superficial water
bodies as a result phytoplanktonic bloom incidents
are turn out to be more frequent and widespread.
Presence of algae in the superficial water bodies
have direct impact on the water utilities and
distribution systems. Algal growth in water
treatment plants causes several operational (filter
clogging, flow disruption, sedimentation basin
operation) and water quality (algal toxins) problems
(Dempster, 2006). In addition, presence of algae in
water treatment plant has direct impact on the
disinfection by products (DBP), total organic carbon
(TOC) and water quality (toxins). Water quality of
source in terms of nutrients (N&P), dissolved oxygen,
silica, carbon dioxide, macro and micro nutrients, pH
effects have direct impact on the growth algae
(AWWA, 2004). Environmental factors such as
sunlight, temperature and water movement also
play a crucial role in promoting the growth of algae
in rivers and treatment plants.
Controlling the growth of algae in treatment plant is
becoming a major issue, design of treatment plant
also plays a role in controlling and managing the
growth of algae. Design consideration including
covered sedimentation tanks and filters, algaecide
coating on the walls, application of algaecides like
copper sulfate and potassium permanganate helps
to control the algae to some extent (Hilal and
Hankins, 2004). Operational practices like scrubbing
the walls and using strong oxidizing agents like
ozone or chlorine dioxide also aid in algae control
(Shehat et al., 2002). Some emerging techniques
including enhanced coagulation, ozofloatation
(dissolved air floatation (DAF) and ultrasonication
appears to be effective in controlling algae to some
Universal Journal of Environmental Research and Technology
142
Maishale and Ulavi
extent, however these treatment methods are not
economically feasible. A lot of research has been
going on to control the algae at the source, yet they
have met limited success, since some species cause
problems during the treatment for example Synura
sp. and Anabaena sp. release oils during chlorination
creating additional taste and odor problems
(Vymazal ,1995). Therefore, research on feasible and
environmentally acceptable approaches to mitigate
and control blooms has important theoretical and
practical significance.
Consequently, there is increasing interest on
biochemical methods to inhibit the growth of algae,
by the decomposition of the straw. Anecdotal
evidence of the ability of barley straw to control
algal growth was observed as early as 1980 (Welch
et al.,1990). Newman, 1999 demonstrated the
algistatic activity of the barley straw. Gibson et al.,
1990 evidenced the growth inhibition of the
filamentous algae, the key algal divisions studied
were cyanobacteria ( Microcystin aeruginosa) and
diatoms (Dinobryon sp). Welch et al.,1990; Barrett et
al.,1996; Martin and Ridge,1999; evidenced the
algistatic effect of barley on Chlorophytes
(Cladophora glomerata) and various desmids.
Chlorella vulgaris, Synedra sp. Scenusdusmus
quadricauda (Ferrier et al.,2005) were shown no
response to the algistatic activity of algae.The
Kembalu water treatment plant is facing huge
problem with the nuisance of algae. The plant is
made to shut down and frequently cleaned or
scarped by applying chlorine. The objectives of the
current research is to identify a predominant micro
and macro algae causing problem in Kembalu water
treatment plant and to compare the effectiveness of
barley, rice and ragi straw in controlling the growth
of algae. In addition to that influence of bed surface
in triggering the growth of algae was studied by
simulating treatment plant at lab scale.
2.0 Materials and Methods: Algal cultures were collected from the Kabini river,
Mysuru. Lab scale study was conducted at Sri
Jayachamarajendra college of Engineering Mysuru,
Karnataka.
2.1 Study Area:
Kembalu water treatment plant is located near
Kabini river in Nanjangud. Nanjangud is spread over
from 1207′12″ N longitude to 76
040′48″ E latitude.
The Intake structure is 1.5 Km away from the
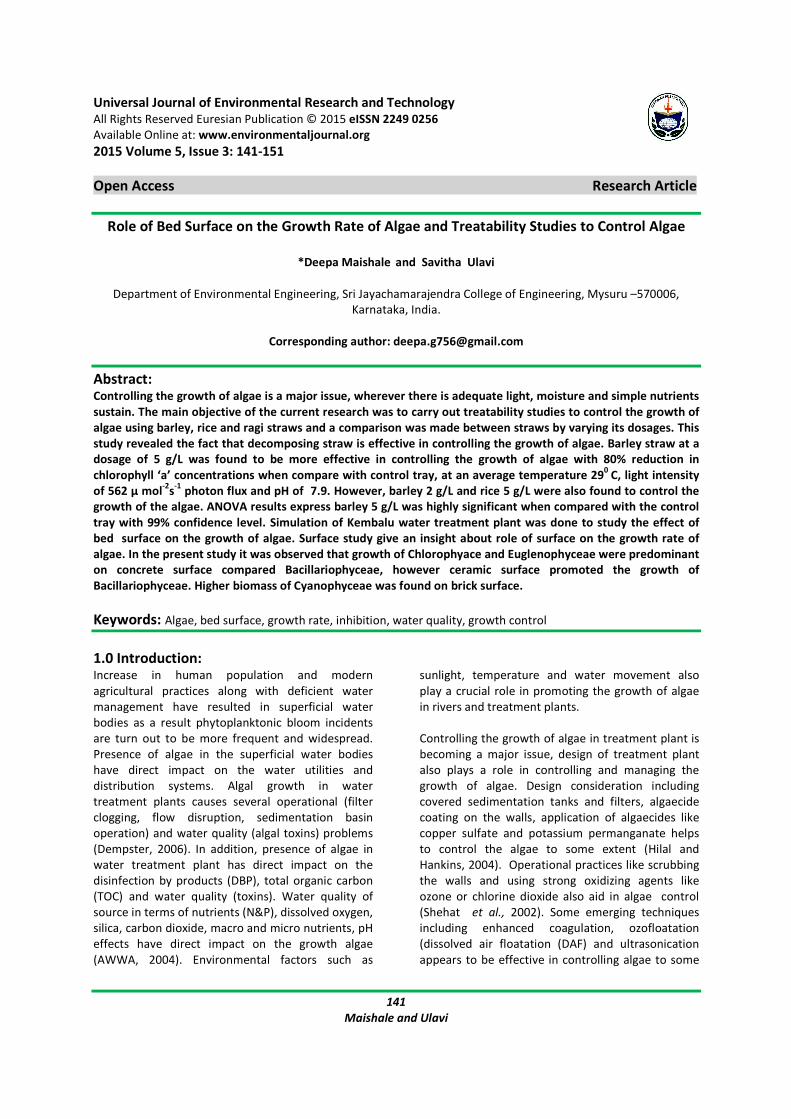
treatment plant. The capacity of treatment plant is
60 MLD and consists of cascade aerator, flash mixer,
settling tank, tube settlers and rapid sand filter units.
Geographic depiction of intake point of Kembalu
water treatment plant and Kabini river is given in
figure 1.
Fig.1: Geographic depiction of intake point of
Kembalu water treatment plant and Kabini river
2.2 Sampling and Analysis of Water and
Phytoplanktons
Water and algal samples were collected from the
treatment plant and river for the phytoplanktons
and water quality analysis. For analysis of planktons
samples were collected separately by addition of 4%
formaldehyde followed by few drops of Lugol’s
iodine. Identification and enumeration of algae were
done by Lackey’s drop count method. Water samples
were analyzed as per APHA (20th
edition) standard
methods for examination of water and wastewater.
2.3 Effect of Surface on the Growth of Algae
Inconsistency in the cell count results of treatment
plant units and visual inspection during site visit,
clearly indicated that surface has influence on the
growth of algae. In treatment plant exuburent
growth was seen in tube settler and cascade aerator
when compared to the indoor filter beds. No single
dominant species were seen in the filter beds
whereas thick biomass of Cladophora and Spirogyra
was seen on the steps of aerator. Thus based on
field visit an attempt is made to study the role of
surface on the growth of algae, by simulating
treatment units surfaces at lab scale.
Universal Journal of Environmental Research and Technology
143
Maishale and Ulavi
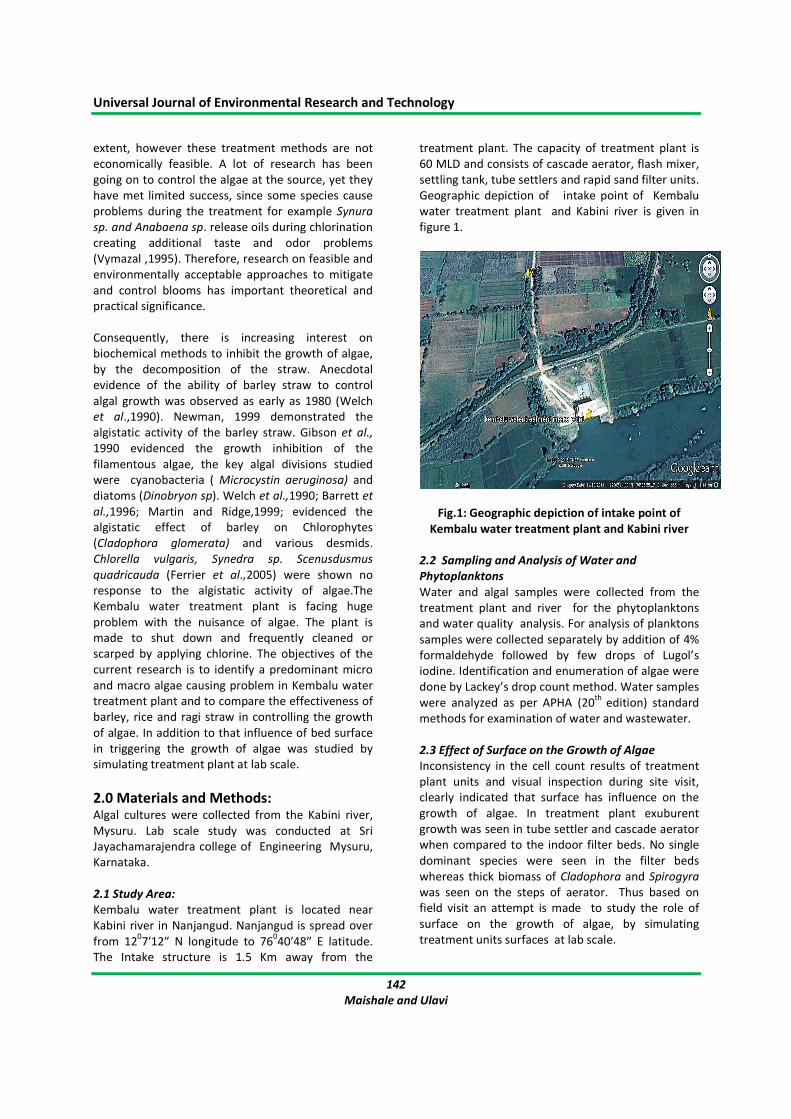
The experiment was carried out in five polythene
trays (50*30cm). Each study tray had ceramic,
concrete, brick and PVC surfaces to simulate various
treatment units of Kembalu treatment plant, and
one tray with plane surface referred as control, as
presented in figure 2. Experimental design for the
surface study is given in table 1.
Table 1: surface study set up
Tray No Surface Media
1 Brick Bold's basic media
2 Ceramic
3 Concrete
4 PVC grooves
5 Control
Each tray contains 5 L water 13 grams( wet weight)
of algae which constitutes 0.2304 mg/m3
of
chlorophyll ‘a’. Water was added regularly since
there was evaporation losses of water, nutrient
supply is done by addition of the Bold’s basic media.
This experimental set up was monitored for 60 days.
2.4 Treatability studies to control the algae.
The experiments were carried out in seven trays
having 50x30 cm2 area, with working volume of 5 L.
Trays were inoculated with 13 grams algae which is
equivalent to 0.23048 mg/m3 of chlorophyll ‘a’
concentration. Initial setup of the experimental is
depicted in figure 2. Water and Bold’s basal media
was added to each tray for supplementing nutrient
requirements for algae. The straws were dried and
cut into small pieces and added to trays. The straws
tested were barley, ragi and rice at dosage of 2 and 5
g/L, experimental design is given in table 2.
Table2: Experimental design of inhibition study
Treatment
trays
Inhibition
substance
Amount of
straw added
1 Barley 2 g/L
2 Barley 5 g/L
3 Rice 2 g/L
4 Rice 5 g/L
5 Ragi 2 g/L
6 Ragi 5 g/L
7 Control Nil
Analysis of Variance (ANOVA) was performed to
check whether the treatment process is statistically
significant or not. ANOVA is performed using XL stat
2015.
Fig.2: Experimental setup of inhibition and surface
study at zeroth
day
2.5 Analytical Methods
Various parameters analyzed were chlorophyll a,
growth rate, identification of and enumeration of
algae and chemical oxygen demand (COD).
2.5.1 Cell Density and Identification of Algae
The cells were counted under digital microscopy by
Lackey’s drop count method and counted cell
numbers were expressed as cell density (cells/L).
Morphological and structural changes in the algae
during the inhibition phase were observed under
digital microscope (make/model: ADI LAB TECH/
EU3490). The photographs were obtained under
40*10X magnification.
2.5.2 Chlorophyll “a” Analysis and Growth Rate
The concentration of chlorophyll ‘a’ pigments is used
extensively to estimate phytoplankton biomass. The
chlorophyll pigments are extracted by 90% acetone
in subdued light and steeped for overnight at 4°C in
the dark room or in aluminum foil wrapped
container, to avoid degradation and concentrations
were estimated by spectrophotometric method
(APHA 20th edition, Standard methods for
examination of water and wastewater).
Chlorophyll a, mg/m3 = Ca* extract volume (L)
Volume of the sample (m3)
Where,
Ca is concentrations of chlorophyll a
Ca = 11.85(OD664) − 1.54(OD647) − 0.08(OD630)
OD is Optical density.
Universal Journal of Environmental Research and Technology
144
Maishale and Ulavi
2.5.3 Growth Rate
The specific growth rate or growth rate (µ) was
estimated by the following formula (Ono and Cuello,
(2007) and X. Wang et al., 2011).
� � ����/�
��………………… . perday
Where, Et and E0 are the final and initial chlorophyll a
concentrations, respectively, and δt is the cultivation
time in day.
2.5.4 Chemical Oxygen Demand (COD)
Chemical Oxygen Demand was determined by the
closed reflux- titrimetric method (APHA 2010).
3. Results and Discussion: The phytoplanktonic analysis showed mixed culture
of algae. Among them Bacillariophyceae,
Chlorophyceace, Cyanophyceae and
Euglinophyceace were seen predominantly. Seasonal
variations of phytoplanktons were observed in the
stretch of Kabini river as well as in treatment plant.
The major species encountered in treatment plant
are Cladophora, Bacillariacceae, Fragilariophyceae,
Microcystin, Zygnema, Navicula sp, Cosmerium,
Synedra Sp Pleurosigma Sp. and Scendusmus sp,.
Potential filter clogging diatoms Synedra and
Fragilaria Sp. were seen throughout the water
treatment plant. In the treatment plant substantial
algal biomass was observed in the cascade aerator
and tube settler when compared to the indoor filter
beds. No single dominant species were seen in the
filter beds whereas thick biomass of Cladophora and
Spirogyra was seen on the steps of aerator. Even
Oscillatoria Sp. were also abundant in the aerator
steps. All filamentous green and blue-green algae
were accounted more in the aerator and tube
settler. Surface plays a vital role in the growth of the
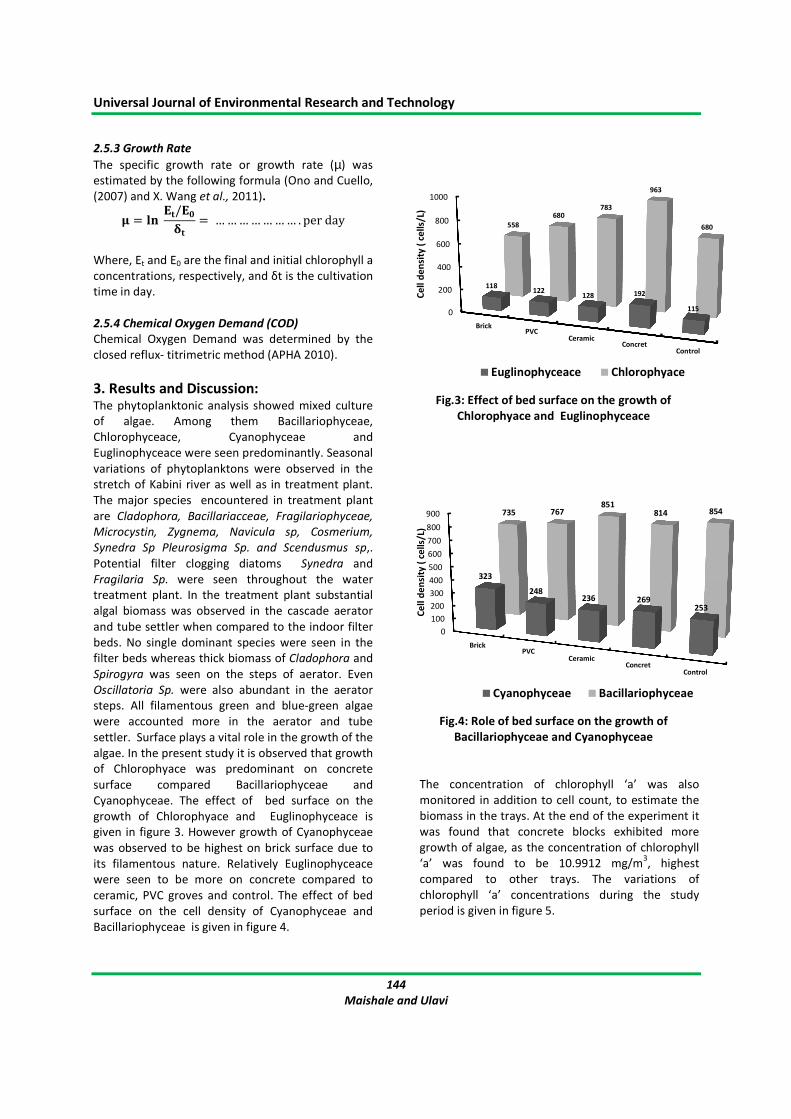
algae. In the present study it is observed that growth
of Chlorophyace was predominant on concrete
surface compared Bacillariophyceae and
Cyanophyceae. The effect of bed surface on the
growth of Chlorophyace and Euglinophyceace is
given in figure 3. However growth of Cyanophyceae
was observed to be highest on brick surface due to
its filamentous nature. Relatively Euglinophyceace
were seen to be more on concrete compared to
ceramic, PVC groves and control. The effect of bed
surface on the cell density of Cyanophyceae and
Bacillariophyceae is given in figure 4.
Fig.3: Effect of bed surface on the growth of
Chlorophyace and Euglinophyceace
Fig.4: Role of bed surface on the growth of
Bacillariophyceae and Cyanophyceae
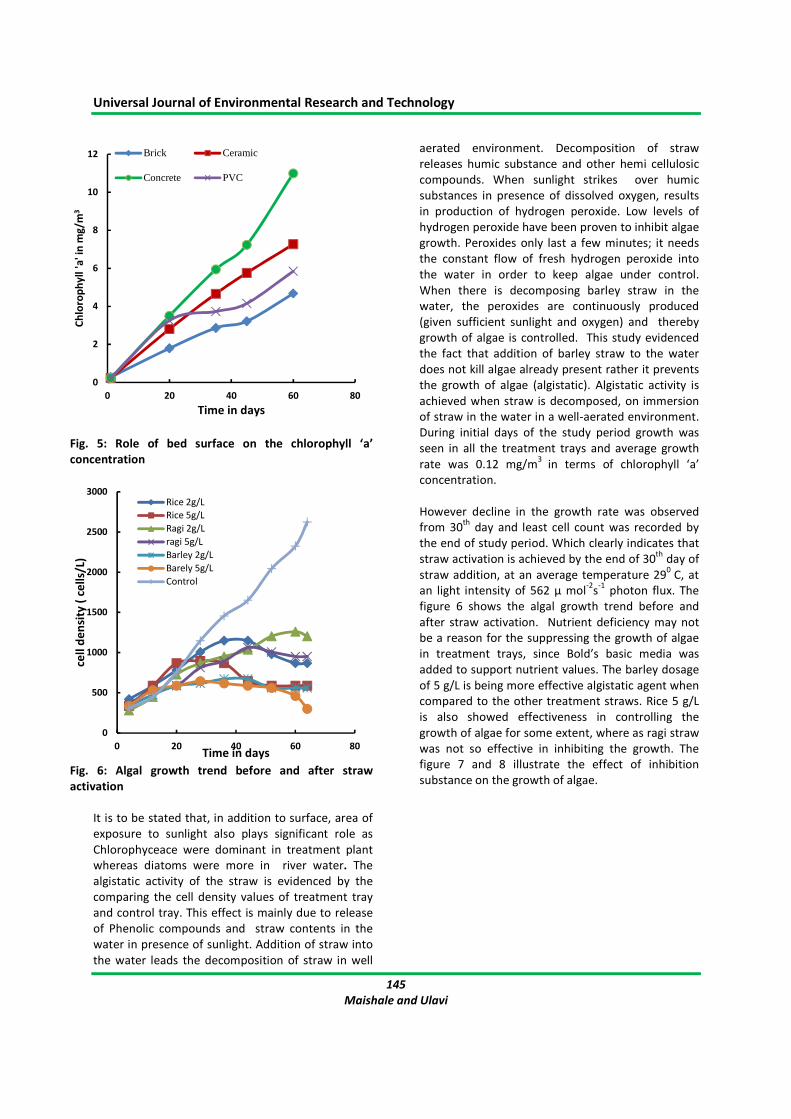
The concentration of chlorophyll ‘a’ was also
monitored in addition to cell count, to estimate the
biomass in the trays. At the end of the experiment it
was found that concrete blocks exhibited more
growth of algae, as the concentration of chlorophyll
‘a’ was found to be 10.9912 mg/m3, highest
compared to other trays. The variations of
chlorophyll ‘a’ concentrations during the study
period is given in figure 5.
0
200
400
600
800
1000
BrickPVC
CeramicConcret
Control
118122
128 192
115
558
680783
963
680
Ce
ll d
en
sity
( c
ell
s/L)
Euglinophyceace Chlorophyace
0
100
200
300
400
500
600
700
800
900
BrickPVC
CeramicConcret
Control
323
248236 269
253
735 767851
814 854
Ce
ll d
en
sity
( c
ell
s/L)
Cyanophyceae Bacillariophyceae
Universal Journal of Environmental Research and Technology
145
Maishale and Ulavi
Fig. 5: Role of bed surface on the chlorophyll ‘a’
concentration
Fig. 6: Algal growth trend before and after straw
activation
It is to be stated that, in addition to surface, area of
exposure to sunlight also plays significant role as
Chlorophyceace were dominant in treatment plant
whereas diatoms were more in river water. The
algistatic activity of the straw is evidenced by the
comparing the cell density values of treatment tray
and control tray. This effect is mainly due to release
of Phenolic compounds and straw contents in the
water in presence of sunlight. Addition of straw into
the water leads the decomposition of straw in well
aerated environment. Decomposition of straw
releases humic substance and other hemi cellulosic
compounds. When sunlight strikes over humic
substances in presence of dissolved oxygen, results
in production of hydrogen peroxide. Low levels of
hydrogen peroxide have been proven to inhibit algae
growth. Peroxides only last a few minutes; it needs
the constant flow of fresh hydrogen peroxide into
the water in order to keep algae under control.
When there is decomposing barley straw in the
water, the peroxides are continuously produced
(given sufficient sunlight and oxygen) and thereby
growth of algae is controlled. This study evidenced
the fact that addition of barley straw to the water
does not kill algae already present rather it prevents
the growth of algae (algistatic). Algistatic activity is
achieved when straw is decomposed, on immersion
of straw in the water in a well-aerated environment.
During initial days of the study period growth was
seen in all the treatment trays and average growth
rate was 0.12 mg/m3
in terms of chlorophyll ‘a’
concentration.
However decline in the growth rate was observed
from 30th
day and least cell count was recorded by
the end of study period. Which clearly indicates that
straw activation is achieved by the end of 30th
day of
straw addition, at an average temperature 290
C, at
an light intensity of 562 µ mol-2
s-1
photon flux. The
figure 6 shows the algal growth trend before and
after straw activation. Nutrient deficiency may not
be a reason for the suppressing the growth of algae
in treatment trays, since Bold’s basic media was
added to support nutrient values. The barley dosage
of 5 g/L is being more effective algistatic agent when
compared to the other treatment straws. Rice 5 g/L
is also showed effectiveness in controlling the
growth of algae for some extent, where as ragi straw
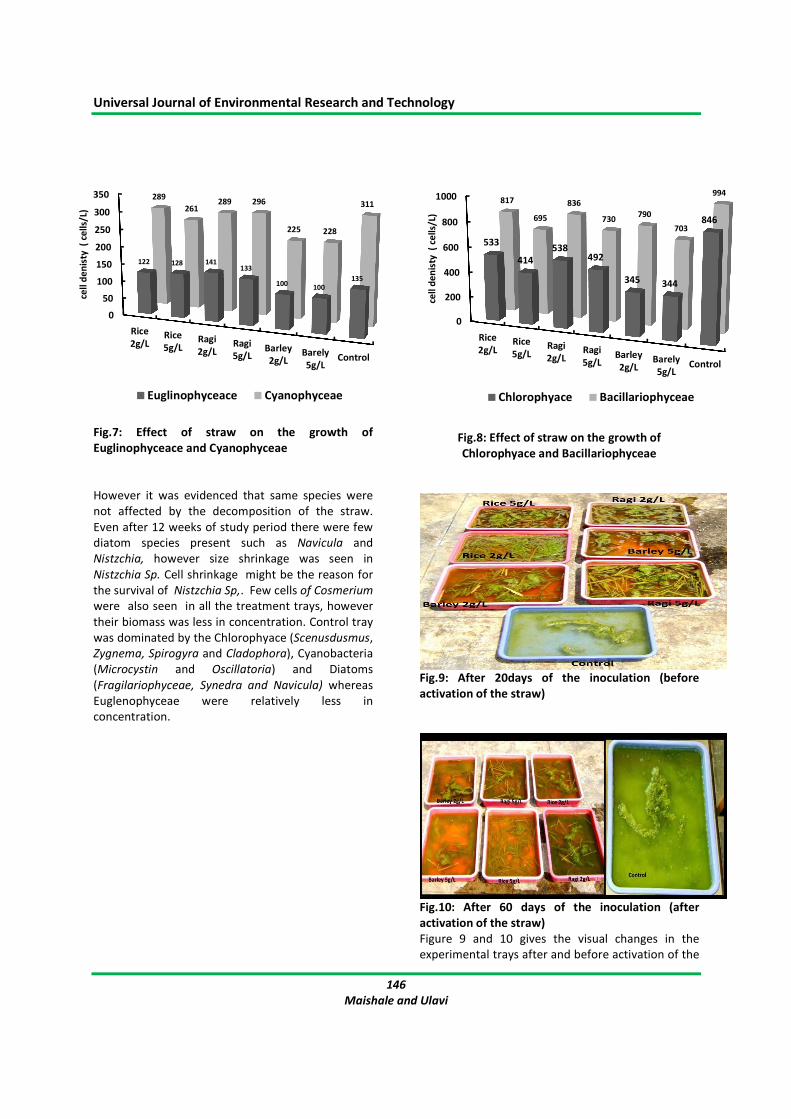
was not so effective in inhibiting the growth. The
figure 7 and 8 illustrate the effect of inhibition
substance on the growth of algae.
0
2
4
6
8
10
12
0 20 40 60 80
Ch
loro
ph
yll
'a
' in
mg
/m3
Time in days
Brick Ceramic
Concrete PVC
0
500
1000
1500
2000
2500
3000
0 20 40 60 80
cell
de
nsi
ty (
ce
lls/
L)
Time in days
Rice 2g/L
Rice 5g/L
Ragi 2g/L
ragi 5g/L
Barley 2g/L
Barely 5g/L
Control
Universal Journal of Environmental Research and Technology
146
Maishale and Ulavi
Fig.7: Effect of straw on the growth of
Euglinophyceace and Cyanophyceae
However it was evidenced that same species were
not affected by the decomposition of the straw.
Even after 12 weeks of study period there were few
diatom species present such as Navicula and
Nistzchia, however size shrinkage was seen in
Nistzchia Sp. Cell shrinkage might be the reason for
the survival of Nistzchia Sp,. Few cells of Cosmerium
were also seen in all the treatment trays, however
their biomass was less in concentration. Control tray
was dominated by the Chlorophyace (Scenusdusmus,
Zygnema, Spirogyra and Cladophora), Cyanobacteria
(Microcystin and Oscillatoria) and Diatoms
(Fragilariophyceae, Synedra and Navicula) whereas
Euglenophyceae were relatively less in
concentration.
Fig.8: Effect of straw on the growth of
Chlorophyace and Bacillariophyceae
Fig.9: After 20days of the inoculation (before
activation of the straw)
Fig.10: After 60 days of the inoculation (after
activation of the straw)
Figure 9 and 10 gives the visual changes in the
experimental trays after and before activation of the
0
50
100
150
200
250
300
350
Rice
2g/LRice
5g/LRagi
2g/LRagi
5g/LBarley
2g/LBarely
5g/LControl
122 128 141133
100100
135
289
261289 296
225 228
311
cell
de
nis
ty (
ce
lls/
L)
Euglinophyceace Cyanophyceae
0
200
400
600
800
1000
Rice
2g/LRice
5g/LRagi
2g/LRagi
5g/LBarley
2g/LBarely
5g/LControl
533
414
538492
345 344
846
817
695
836
730790
703
994
cell
de
nis
ty (
ce
lls/
L)
Chlorophyace Bacillariophyceae
Universal Journal of Environmental Research and Technology
147
Maishale and Ulavi
straw. Microscopic examination disclosed that
Cladophora species were dead after the 12th
week
of the experiment. No further experiment was done
to understand the status of cladophora. The spiral
coils of Spirogyra sp., were separating and resulting
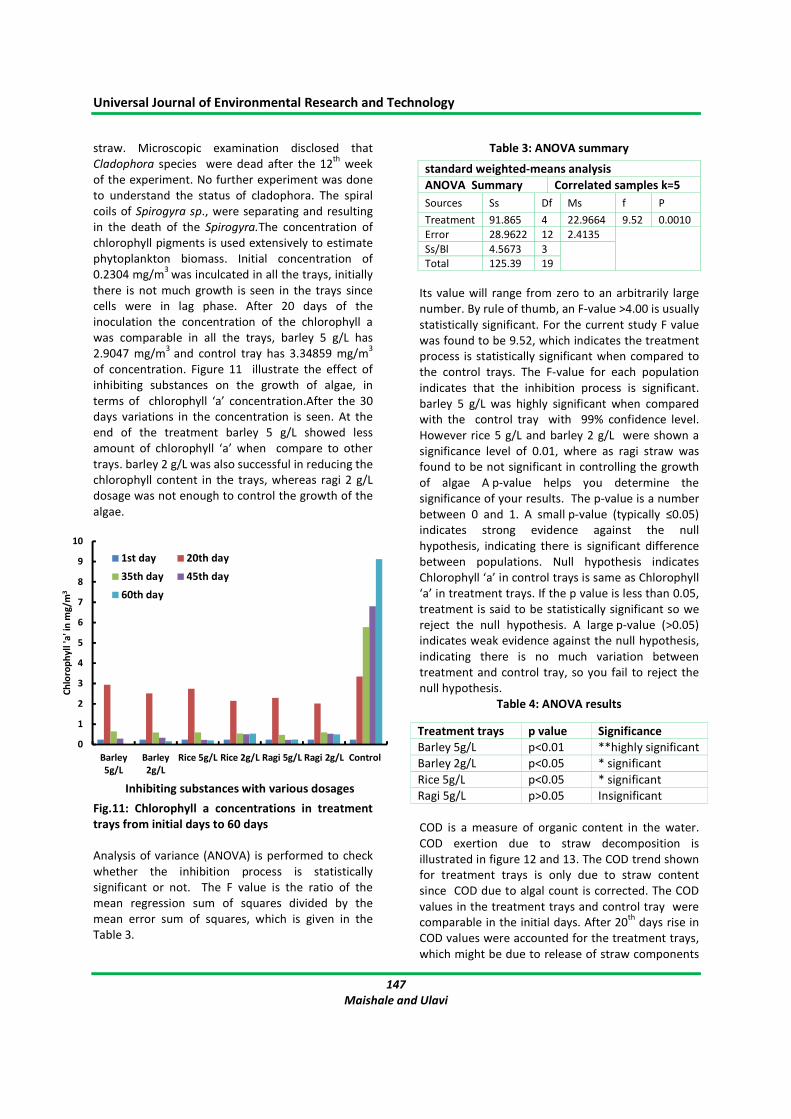
in the death of the Spirogyra.The concentration of
chlorophyll pigments is used extensively to estimate
phytoplankton biomass. Initial concentration of
0.2304 mg/m3
was inculcated in all the trays, initially
there is not much growth is seen in the trays since
cells were in lag phase. After 20 days of the
inoculation the concentration of the chlorophyll a
was comparable in all the trays, barley 5 g/L has
2.9047 mg/m3
and control tray has 3.34859 mg/m3
of concentration. Figure 11 illustrate the effect of
inhibiting substances on the growth of algae, in
terms of chlorophyll ‘a’ concentration.After the 30
days variations in the concentration is seen. At the
end of the treatment barley 5 g/L showed less
amount of chlorophyll ‘a’ when compare to other
trays. barley 2 g/L was also successful in reducing the
chlorophyll content in the trays, whereas ragi 2 g/L
dosage was not enough to control the growth of the
algae.
Fig.11: Chlorophyll a concentrations in treatment
trays from initial days to 60 days
Analysis of variance (ANOVA) is performed to check
whether the inhibition process is statistically
significant or not. The F value is the ratio of the
mean regression sum of squares divided by the
mean error sum of squares, which is given in the
Table 3.
Table 3: ANOVA summary
standard weighted-means analysis
ANOVA Summary Correlated samples k=5
Sources Ss Df Ms f P
Treatment 91.865 4 22.9664 9.52 0.0010
Error 28.9622 12 2.4135
Ss/Bl 4.5673 3
Total 125.39 19
Its value will range from zero to an arbitrarily large
number. By rule of thumb, an F-value >4.00 is usually
statistically significant. For the current study F value
was found to be 9.52, which indicates the treatment
process is statistically significant when compared to
the control trays. The F-value for each population
indicates that the inhibition process is significant.
barley 5 g/L was highly significant when compared
with the control tray with 99% confidence level.
However rice 5 g/L and barley 2 g/L were shown a
significance level of 0.01, where as ragi straw was
found to be not significant in controlling the growth
of algae A p-value helps you determine the
significance of your results. The p-value is a number
between 0 and 1. A small p-value (typically ≤0.05)
indicates strong evidence against the null
hypothesis, indicating there is significant difference
between populations. Null hypothesis indicates
Chlorophyll ‘a’ in control trays is same as Chlorophyll
‘a’ in treatment trays. If the p value is less than 0.05,
treatment is said to be statistically significant so we
reject the null hypothesis. A large p-value (>0.05)
indicates weak evidence against the null hypothesis,
indicating there is no much variation between
treatment and control tray, so you fail to reject the
null hypothesis.
Table 4: ANOVA results
Treatment trays p value Significance
Barley 5g/L p<0.01 **highly significant
Barley 2g/L p<0.05 * significant
Rice 5g/L p<0.05 * significant
Ragi 5g/L p>0.05 Insignificant
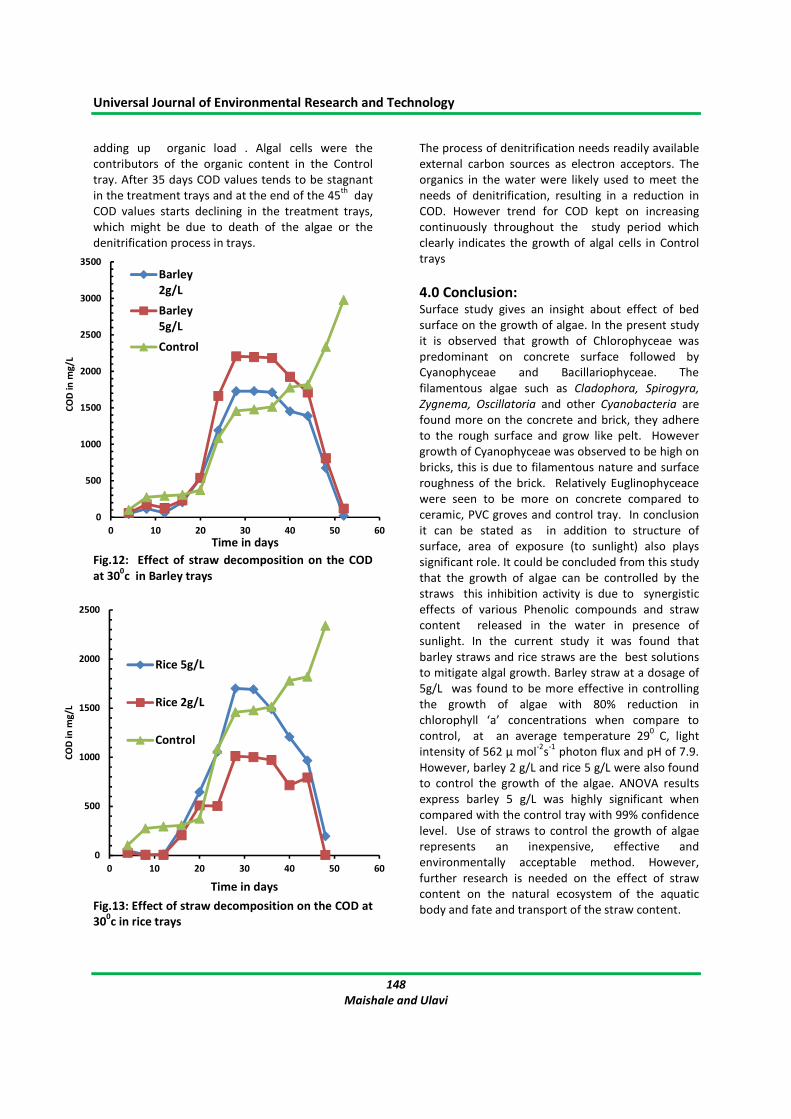
COD is a measure of organic content in the water.
COD exertion due to straw decomposition is
illustrated in figure 12 and 13. The COD trend shown
for treatment trays is only due to straw content
since COD due to algal count is corrected. The COD
values in the treatment trays and control tray were
comparable in the initial days. After 20th
days rise in
COD values were accounted for the treatment trays,
which might be due to release of straw components
0
1
2
3
4
5
6
7
8
9
10
Barley
5g/L
Barley
2g/L
Rice 5g/L Rice 2g/L Ragi 5g/L Ragi 2g/L Control
Ch
loro
ph
yll
'a
' in
mg
/m3
Inhibiting substances with various dosages
1st day 20th day
35th day 45th day
60th day
Universal Journal of Environmental Research and Technology
148
Maishale and Ulavi
adding up organic load . Algal cells were the
contributors of the organic content in the Control
tray. After 35 days COD values tends to be stagnant
in the treatment trays and at the end of the 45th
day
COD values starts declining in the treatment trays,
which might be due to death of the algae or the
denitrification process in trays.
Fig.12: Effect of straw decomposition on the COD
at 300c in Barley trays
Fig.13: Effect of straw decomposition on the COD at
300c in rice trays
The process of denitrification needs readily available
external carbon sources as electron acceptors. The
organics in the water were likely used to meet the
needs of denitrification, resulting in a reduction in
COD. However trend for COD kept on increasing
continuously throughout the study period which
clearly indicates the growth of algal cells in Control
trays
4.0 Conclusion: Surface study gives an insight about effect of bed
surface on the growth of algae. In the present study
it is observed that growth of Chlorophyceae was
predominant on concrete surface followed by
Cyanophyceae and Bacillariophyceae. The
filamentous algae such as Cladophora, Spirogyra,
Zygnema, Oscillatoria and other Cyanobacteria are
found more on the concrete and brick, they adhere
to the rough surface and grow like pelt. However
growth of Cyanophyceae was observed to be high on
bricks, this is due to filamentous nature and surface
roughness of the brick. Relatively Euglinophyceace
were seen to be more on concrete compared to
ceramic, PVC groves and control tray. In conclusion
it can be stated as in addition to structure of
surface, area of exposure (to sunlight) also plays
significant role. It could be concluded from this study
that the growth of algae can be controlled by the
straws this inhibition activity is due to synergistic
effects of various Phenolic compounds and straw
content released in the water in presence of
sunlight. In the current study it was found that
barley straws and rice straws are the best solutions
to mitigate algal growth. Barley straw at a dosage of
5g/L was found to be more effective in controlling
the growth of algae with 80% reduction in
chlorophyll ‘a’ concentrations when compare to
control, at an average temperature 290
C, light
intensity of 562 µ mol-2
s-1
photon flux and pH of 7.9.
However, barley 2 g/L and rice 5 g/L were also found
to control the growth of the algae. ANOVA results
express barley 5 g/L was highly significant when
compared with the control tray with 99% confidence
level. Use of straws to control the growth of algae
represents an inexpensive, effective and
environmentally acceptable method. However,
further research is needed on the effect of straw
content on the natural ecosystem of the aquatic
body and fate and transport of the straw content.
0
500
1000
1500
2000
2500
3000
3500
0 10 20 30 40 50 60
CO
D i
n m
g/L
Time in days
Barley
2g/L
Barley
5g/L
Control
0
500
1000
1500
2000
2500
0 10 20 30 40 50 60
CO
D i
n m
g/L
Time in days
Rice 5g/L
Rice 2g/L
Control
Universal Journal of Environmental Research and Technology
149
Maishale and Ulavi
A B C
D E F
G H I
J K L
M N O
P
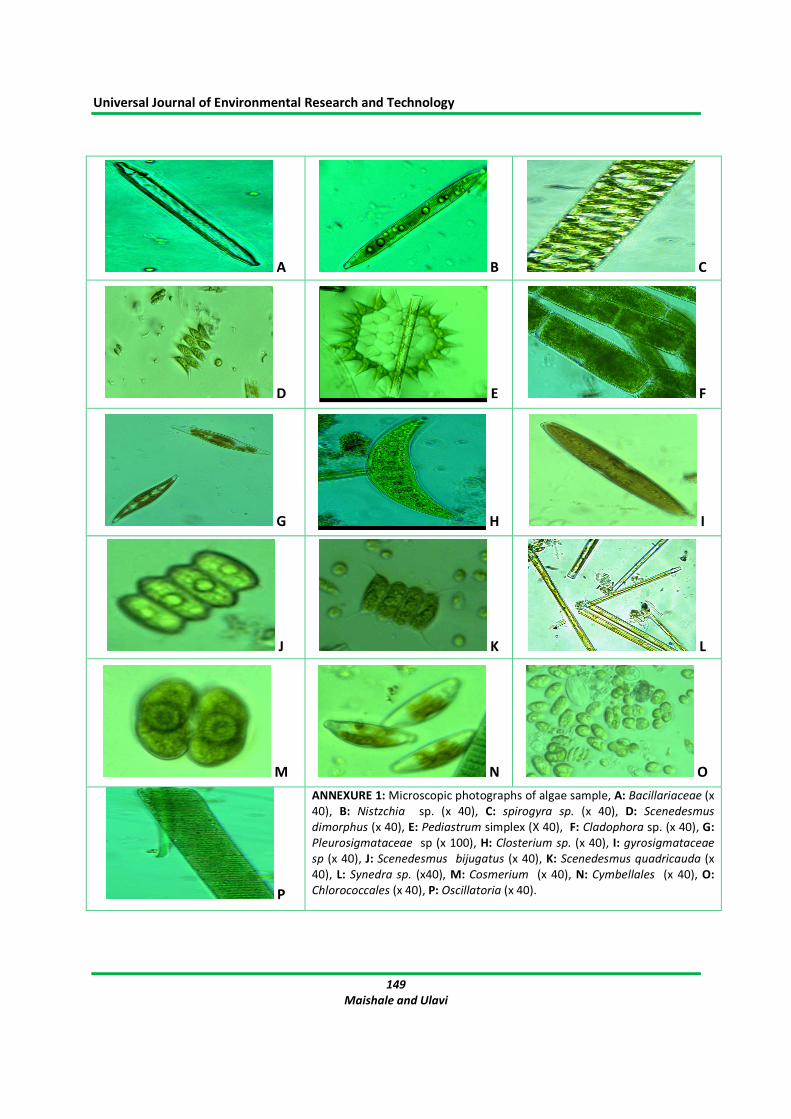
ANNEXURE 1: Microscopic photographs of algae sample, A: Bacillariaceae (x
40), B: Nistzchia sp. (x 40), C: spirogyra sp. (x 40), D: Scenedesmus
dimorphus (x 40), E: Pediastrum simplex (X 40), F: Cladophora sp. (x 40), G:
Pleurosigmataceae sp (x 100), H: Closterium sp. (x 40), I: gyrosigmataceae
sp (x 40), J: Scenedesmus bijugatus (x 40), K: Scenedesmus quadricauda (x
40), L: Synedra sp. (x40), M: Cosmerium (x 40), N: Cymbellales (x 40), O:
Chlorococcales (x 40), P: Oscillatoria (x 40).
Universal Journal of Environmental Research and Technology
150
Maishale and Ulavi
5.0 Acknowledgement: The authors are grateful Dr. Shankar P. Hosmani,
Convener, Research Cell and Avinash V.S., SBRR
Mahajana First Grade College, Jayalakshmi Puram,
Mysuru 570012 for their immense support and
providing necessary facilities.
References: 1) APHA Standard methods for the examination of
water and wastewater, 20th
edition, 2010.
2) Anderson, D.M, Glibert, P.M and Burkholder,
J.M (2002) “Harmful algal blooms and
eutrophication: nutrient sources, composition
and consequences Estuaries” 25:562–584.
3) AWWA (American Water Works Association)
2004. Algae Detection and Removal Strategies
for Drinking Water Treatment Plants, 7-8.
4) Ball, A.S, Williams, M., Vincent, D, Robinson, J
(2011) “Algal growth control by a barley straw
extract”, Bioresource. Technol. 77:177–18.
5) Barrett PRF, Newman JR (1992) “Algal growth
inhibition by barley rotting straw. Br Phycol J
27:83–84.
6) Barrett, P.R.F., Littlejohn, J.W., Curnow, J.( 1999)
“Long-term algal control in a reservoir using
barley straw” Hydrobiologia, 415:309-313.
7) Brownlee, E.F., Sellner, S.G., Sellner, K.G.,(2003)
“Effects of barley straw (Hordeum vulgare) on
freshwater and brackish phytoplankton and
cyanobacteria” J. Appl. Phycol. 15:525–531.
8) Cooper JA, Pillinger JM, Ridge I (1997) “Barley
straw inhibits growth of some aquatic
saprolegniaceous fungi” Aquaculture, 156:157–
163.
9) Dempster, T.A (2006) “Taste and Odor problems
in source water and water traetment facilities”
Dissertation: Arizon State University,182.
10) David Spencer and Carole Lembi,( 2007)
“Evaluation of Barley Straw as an Alternative
Algal Control Method in Northern California Rice
Fields”, J. Aquat. Plant Manage.45:84-90.
11) Everall NC, Lees DR(1997 )“The identification
and significance of chemicals released from
decomposing barley straw in reservoir algal
control”, Water Res , vol. 31:614–62.
12) Everall NC, Lees DR (1996) “The use of barley-
straw to control general and blue-green algal
growth in a Derbyshire reservoir”, Water Res,
30:269–276.
13) Ferrier M.D, Butler B.R, Terlizzi D.E and
Lacouture R.V. (2005). “The effects of barley
straw (Hordeum vulgare) on the growth of
freshwater algae”, Bioresource Technology,
96:1788– 1795.
14) Gibson MT, Welch IM, Barrett PRF, Ridge I
(1990) “Barley straw as an inhibitor of algal
growth” J Applied Phycology 2:241–248
15) Hilal, N., and N. Hankins (2004) Optimal strategy
for algae control in potable water treatment
facilities. International Journal of Environmental
Engineering and Technology Management,
4(3):236-252.
16) Houman Rajabi Islami and Yousef
Filizadeh,(2011) “Use of barley straw to control
nuisance freshwater algae”, American Water
Works Association(AWWA),103:5-12
17) Lackey, J.P. (1938)“Public Health Reports”, vol.
53, pp. 2080-2091
18) Mariraj Mohan S. (2012.) “Comparative Study
of Rice Straw and Ragi Straw for the Inhibition of
Algal Bloom in Fresh Water”, International
Research Journal of Biological Science,1(6):31-
37.
19) Martin D, Ridge I (1999) The relative sensitivity
of algae to decomposing barley straw. J Appl
Phycol 11:285–29.
20) Newman, J.R., Barrett, P.R.F.( 1993)“Control of
Microcystis aeruginosa by decomposing barley
straw. J. Aquat. Plant Manage, 31:203-206.
21) Ono, E., Cuello, J.L., 2007. Carbon dioxide
mitigation using thermophilic cyanobacteria.
Biosyst. Eng. 96:129–134.
22) Pillinger, J.M., Cooper, J.A., Ridge, I., Barrett,
P.R.F., 1992. Barley straw as an inhibitor of algae
growth III: the role of fungal decomposition. J.
Appl. Phycol. 4:353–355.
23) Pillinger, J.M., Cooper, J.A., Ridge, I.(1994) “Role
of phenolic compounds in the antialgal activity
of barley straw. J. Chem. Ecol.20:1557–1569.
24) Pillinger, J.M., Gilmour, I., Ridge, I.( 1995)
“Comparison of the antialgal activity of brown-
rotted and white-rotted wood and in situ
analysis of lignin”. J. Chem. Ecol. 21:1113-1125.
25) Rubeena, Savitha ulavi and B. Manoj
Kumar,(2014) “ Algae control using rice
straw”,international journal of civil engineering
and technology (ijciet), 5(9):43-48.
26) Ridge, I., Barrett, P.R.F.(1992) “Algal control with
barley straw. Aspects Appl. Biol. 29:457-462.
27) Shehata S., S.A. Badr, and S.Z Wahba. (2002)
Drinking Water Treatment Options for
Eliminating Freshwater Algae. Int. J.
Envirob.Studies, 59:679-688.
Universal Journal of Environmental Research and Technology
151
Maishale and Ulavi
28) Salwa M. Abou El Ella, Magdy M. Hosny, and
Mohamed F. Bakry(2007) “growth inhibition of
bloom-forming using rice straw In water courses
(case study) Eleventh International Water
Technology Conference, IWTC11 Sharm El-
Sheikh, Egypt.
29) Welch, I.M., Barrett, P.R.F., Gibson, M.T., Ridge,
I.(1990) “Barley straw as an inhibitor of algae
growth I: studies in the Chesterfield Canal. J.
Appl. Phycol. 2:231–239.
30) Xin Wang, Chunbo Hao, Feng Zhang, Chuanping
Feng and Yingnan Yang (2011) “Inhibition of the
growth of two blue-green algae species
(Microsystis aeruginosa and Anabaena
spiroides) by acidification treatments using
carbon dioxide” Bioresource Technology
102:5742–5748.