Embed Size (px)
Citation preview
Operating Characteristics Internal Combustion Engines
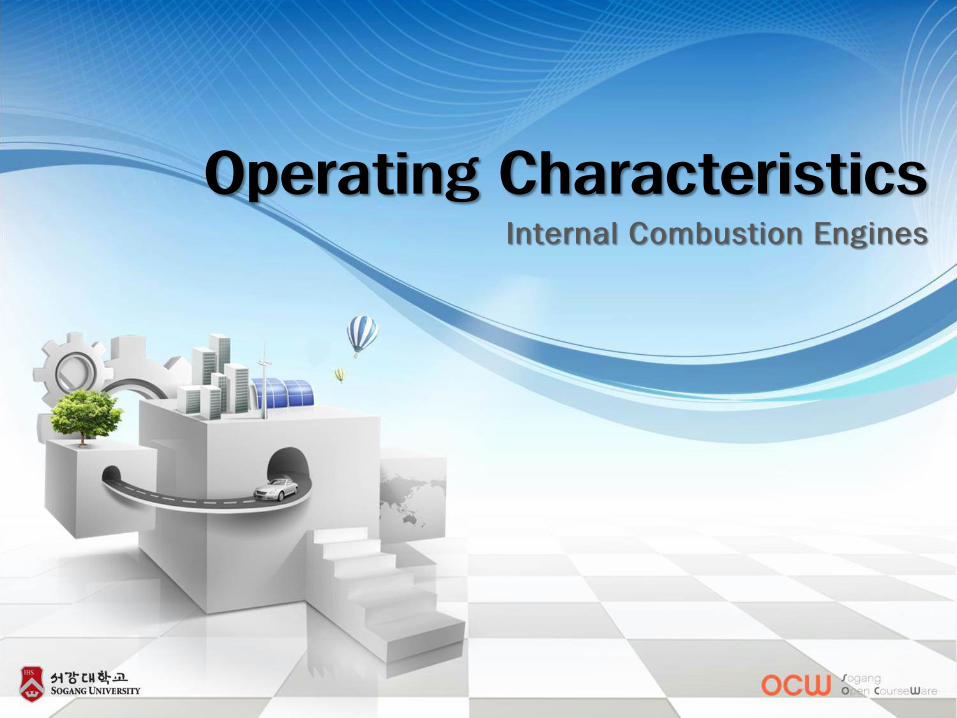
For an engine with bore B, crank offset a, engine speed N,
Stroke length is:
Engine Parameters – Avg piston speed
aS 2
Average piston speed is:
SNU p 2
Maximum average piston speed: 5-20 m/s
Typically inversely proportional to engine
size
Reason for this range:
1. Safe limit of material strength
(piston, connecting rod)
2. Limitation of gas flow in and out
Cf) Table 2-1: Typical engine parameters
S
r
Vd
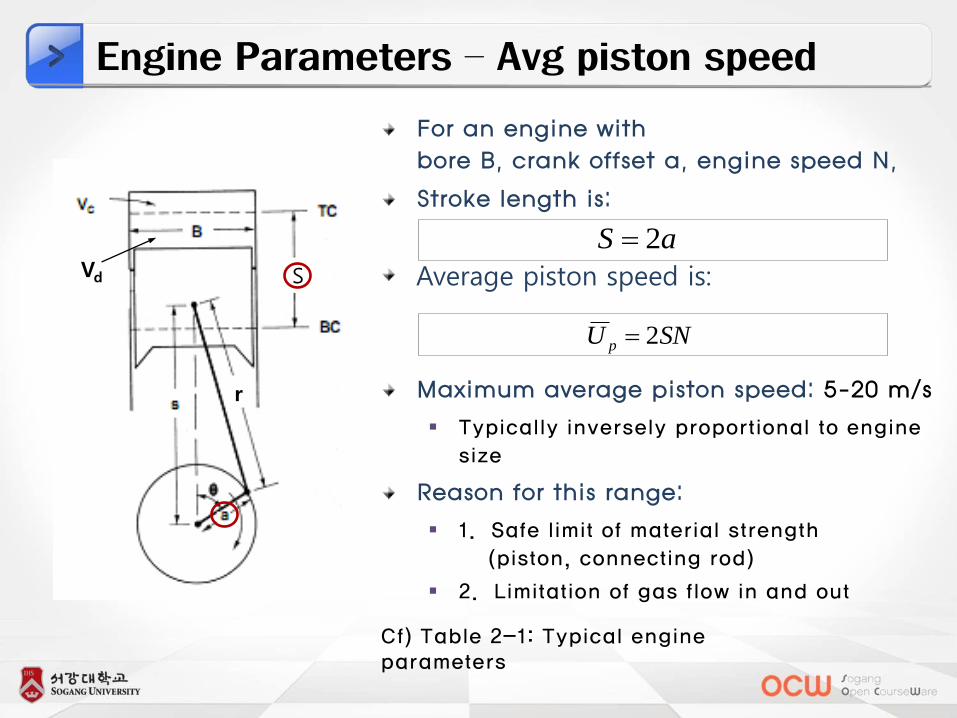
Instantaneous Piston Speed
Distance bet’n crank axis and wrist pin
222 sincos aras
arR
RU
U
dtdsU
p
p
p
/
sin
cos1sin
2
/
22
Bore to stroke ratio B/S Square: B=S
Under square B<S
(large engine, ~4)
Over square: B>S
Instantaneous piston speed
S
r
Vd
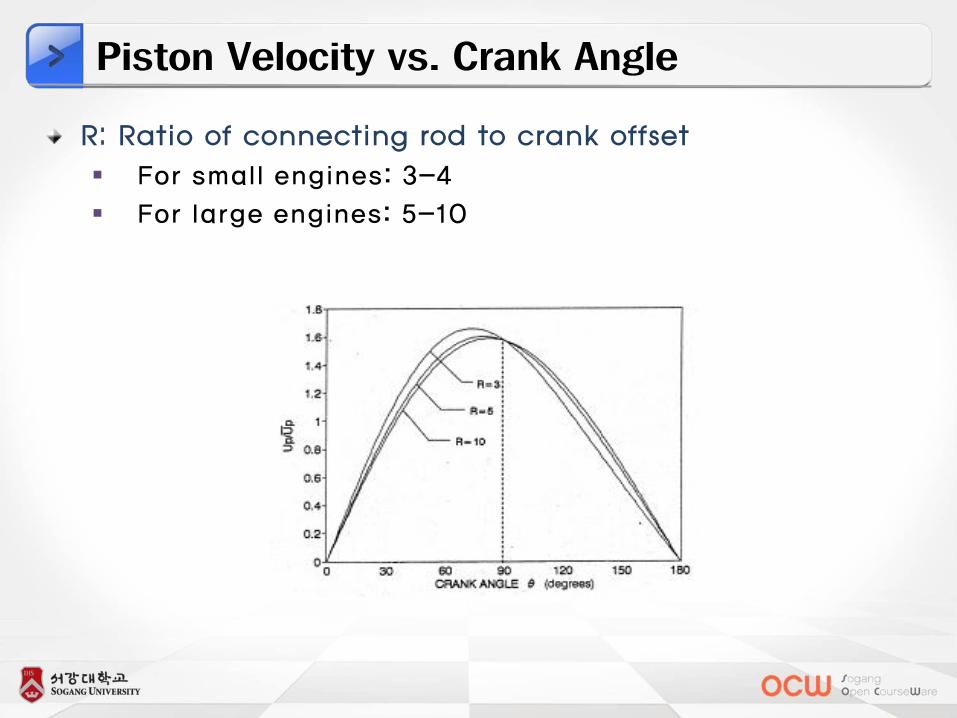
Piston Velocity vs. Crank Angle
R: Ratio of connecting rod to crank offset For small engines: 3-4
For large engines: 5-10
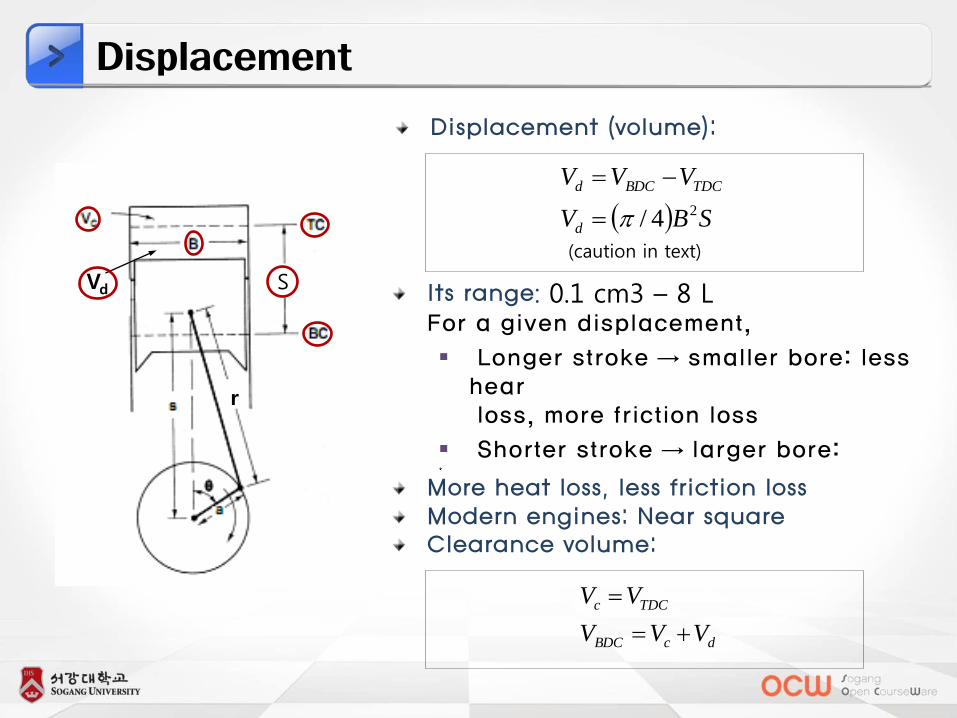
Displacement
Displacement (volume):
SBV
VVV
d
TDCBDCd
24/
Its range: 0.1 cm3 – 8 L For a given displacement,
Longer stroke → smaller bore: less hear loss, more friction loss
Shorter stroke → larger bore:
More heat loss, less friction loss Modern engines: Near square
Clearance volume:
dcBDC
TDCc
VVV
VV
S
r
Vd
(caution in text)
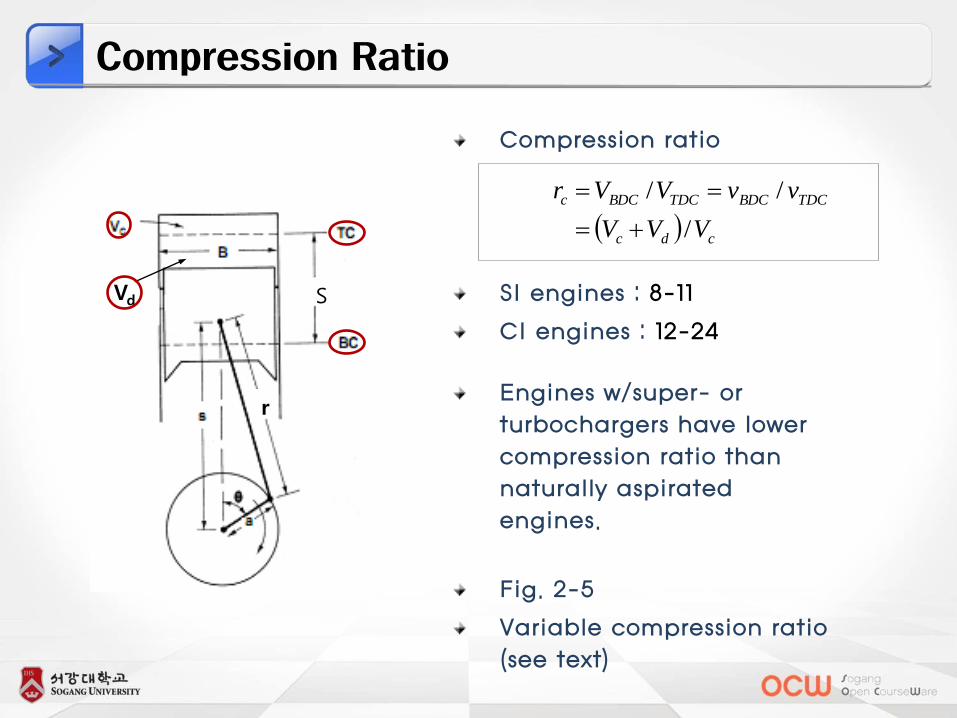
Compression Ratio
Compression ratio
SI engines : 8-11
CI engines : 12-24
Engines w/super- or turbochargers have lower compression ratio than naturally aspirated engines.
Fig. 2-5
Variable compression ratio (see text)
cdc
TDCBDCTDCBDCc
VVV
vvVVr
/
//
S
r
Vd
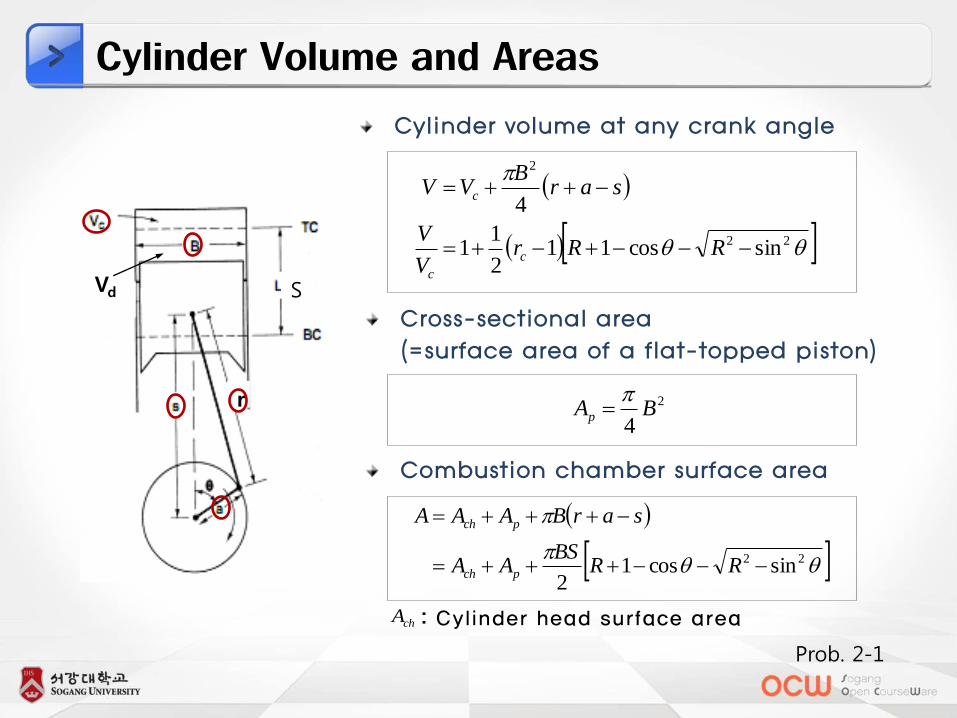
Cylinder Volume and Areas
22
2
sincos112
11
4
RRrV
V
sarB
VV
c
c
c
Cylinder volume at any crank angle
Cross-sectional area (=surface area of a flat-topped piston)
2
4BAp
Combustion chamber surface area
22 sincos12
RRBS
AA
sarBAAA
pch
pch
: Cylinder head surface area
Prob. 2-1
chA
S
r
Vd
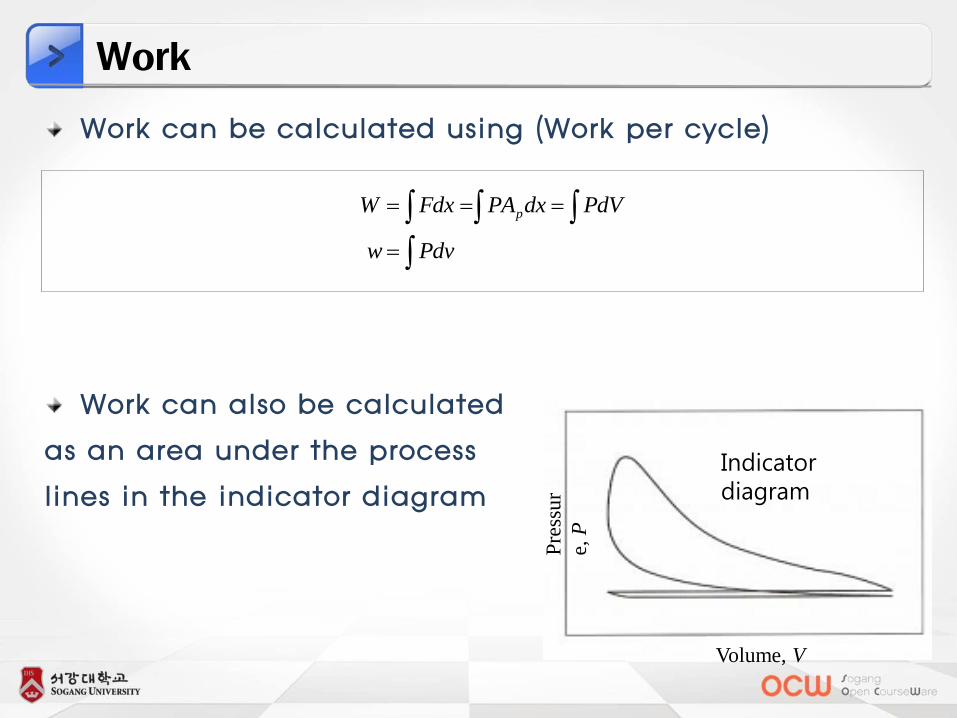
Work
Work can be calculated using (Work per cycle)
Work can also be calculated
as an area under the process
lines in the indicator diagram
Pdvw
PdVdxPAFdxW p
Volume, V
Pre
ssu
r
e, P
Indicator diagram
Indicated Work
Indicated work : Work inside the combustion
chamber
Brake work : Actual work available at the crankshaft
Work lost due to friction and parasitic loads
Parasitic loads include oil pump, supercharger, air conditioner
compressor, alternator, etc.
Relations between three types of work
fib www
iw
bw
fw
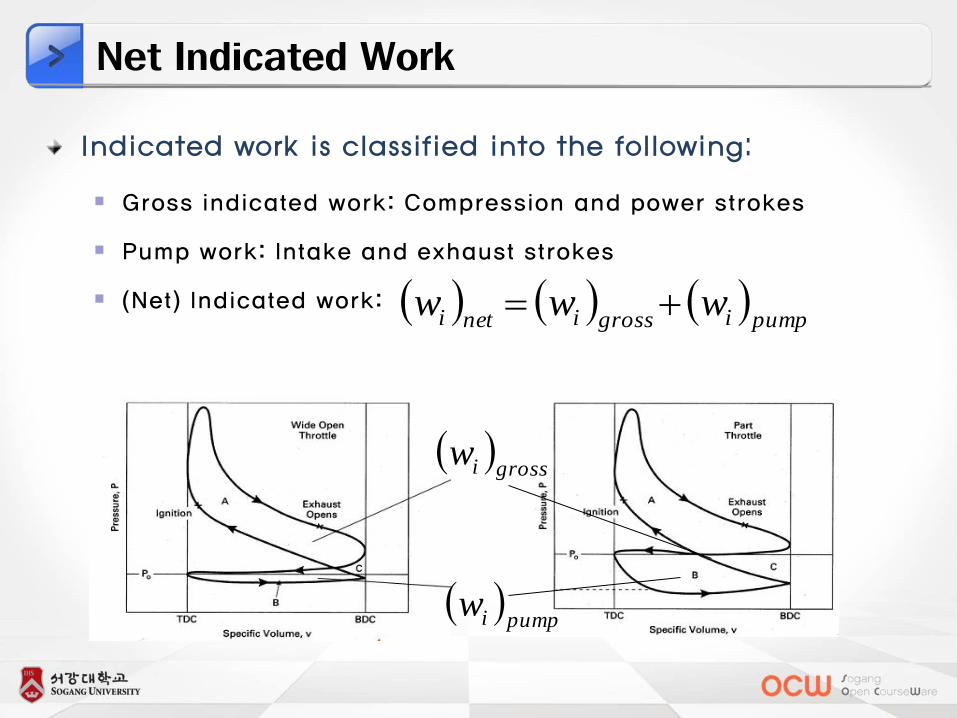
Net Indicated Work
Indicated work is classified into the following:
Gross indicated work: Compression and power strokes
Pump work: Intake and exhaust strokes
(Net) Indicated work: pumpigrossineti www
grossiw
pumpiw
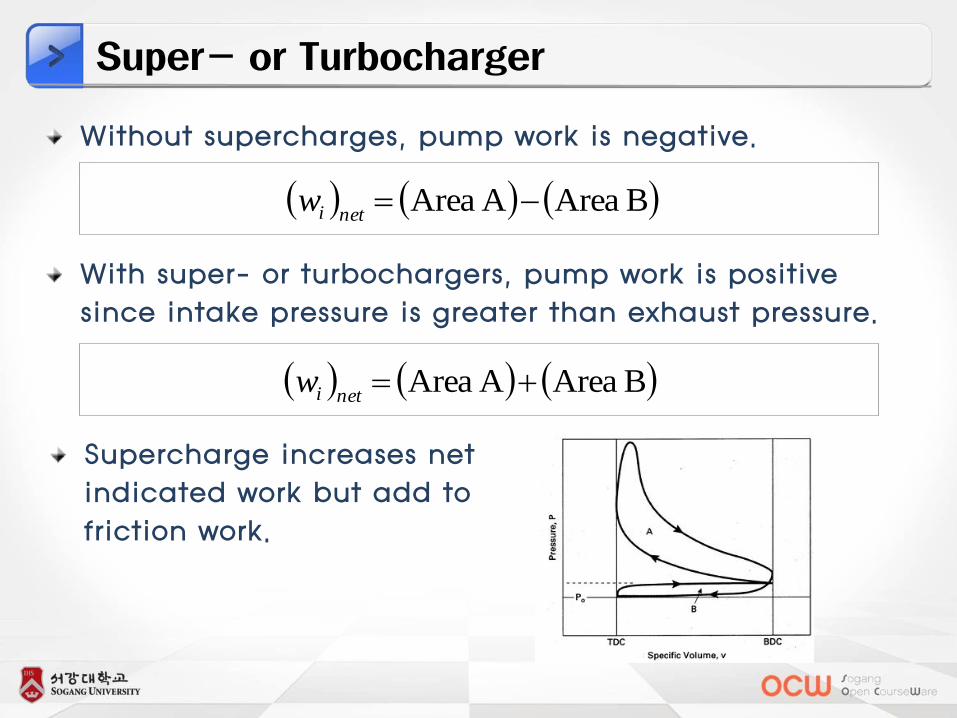
Super- or Turbocharger
Without supercharges, pump work is negative.
With super- or turbochargers, pump work is positive since intake pressure is greater than exhaust pressure.
B AreaA Area netiw
B AreaA Area netiw
Supercharge increases net indicated work but add to friction work.
Mechanical Efficiency
Mechanical efficiency: Ratio between brake work at a
crankshaft to indicated work in a combustion chamber
Excluding parasitic loads, the mechanical efficiency of
an engine is:
55-60% at a high speed (friction loss)
85-95% at a low speed (heat loss)
~0 at idle
ibibm WWww //
Mean Effective Pressure
Mean effective pressure:
A good parameter for comparing engines with regard to design
or output because of independency of both engine size and
speed
Brake mean effective pressure
Indicated mean effective pressure
Pump mean effective pressure
Friction mean effective pressure
Relations of all mep’s
nmep = gmep + pmep
bmep = mimep
bmep = imep – fmep
(No difference bet’n nmep and imep?)
dVWvw //mep
vwb /bmep
vwi /imep
vwpumpi /pmep
vw f /fmep
: # revolution per cycle
Torque
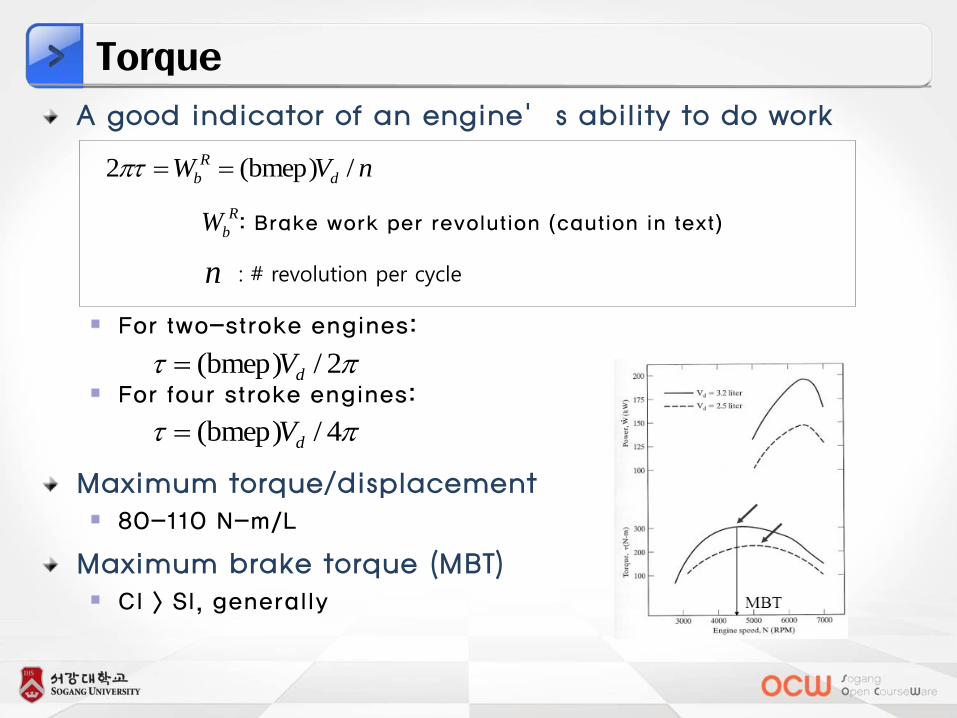
A good indicator of an engine’s ability to do work
: Brake work per revolution (caution in text)
For two-stroke engines:
For four stroke engines:
Maximum torque/displacement 80-110 N-m/L
Maximum brake torque (MBT) CI > SI, generally
nVW d
R
b /(bmep)2
n
R
bW
2/(bmep) dV
4/(bmep) dV
Power
Rate of work
Brake power, net indicated power, gross indicated power, pump power can be defined depending on which work or mep used
Power relations
fib
pumpigrossineti
imb
WWW
WWW
WW
(caution in text)
ppUAn
N
nWNW
(mep))2/1(
2
/
ppUAn
N
nWNW
(mep))2/1(
2
/
Torque and Power: Discussion
Torque and power Both increases with speed at low speed, reaches a maximum, and decreases at high speed
Indicated power increases with speed
Brake power increases to a maximum and then decreases at higher speeds
Friction losses increase with speed and become dominant at very high speeds
Speed at maximum brake power ~ 1 ½ speed at maximum torque
To increase power, increase displacement, mep, speed Faster and higher mep w/super- and turbochargers
Read 2.5, Prob. 2-2, 3
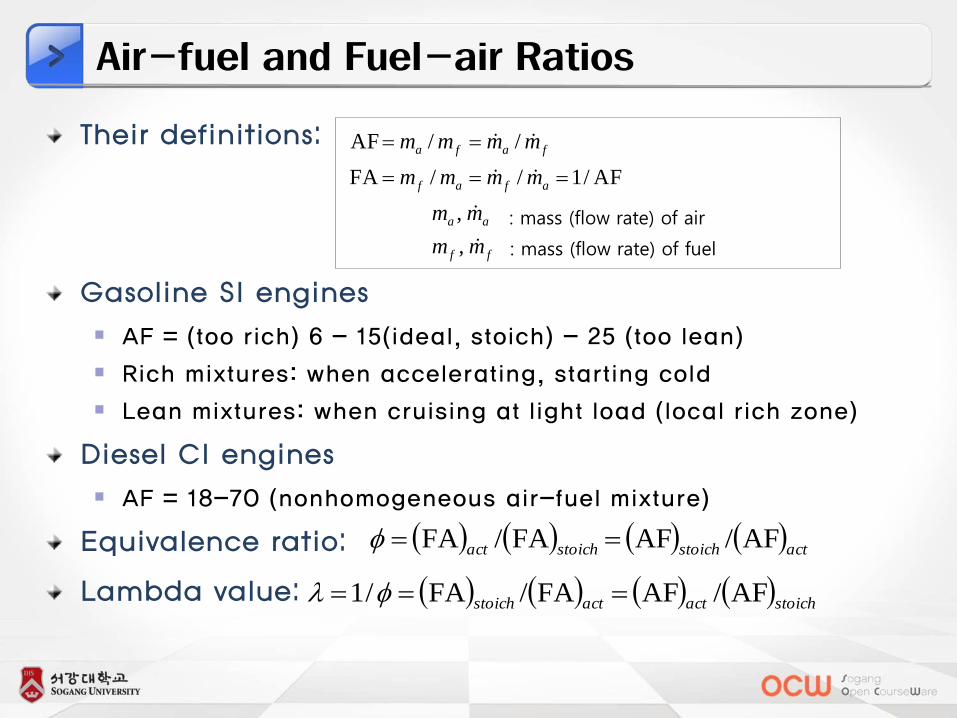
Air-fuel and Fuel-air Ratios
Their definitions:
Gasoline SI engines
AF = (too rich) 6 - 15(ideal, stoich) - 25 (too lean)
Rich mixtures: when accelerating, starting cold
Lean mixtures: when cruising at light load (local rich zone)
Diesel CI engines
AF = 18-70 (nonhomogeneous air-fuel mixture)
Equivalence ratio:
Lambda value:
ff
aa
afaf
fafa
mm
mm
mmmm
mmmm
,
,
AF/1//FA
//AF
: mass (flow rate) of air
: mass (flow rate) of fuel
actstoichstoichact AF/AFFA/FA
stoichactactstoich AF/AFFA/FA/1
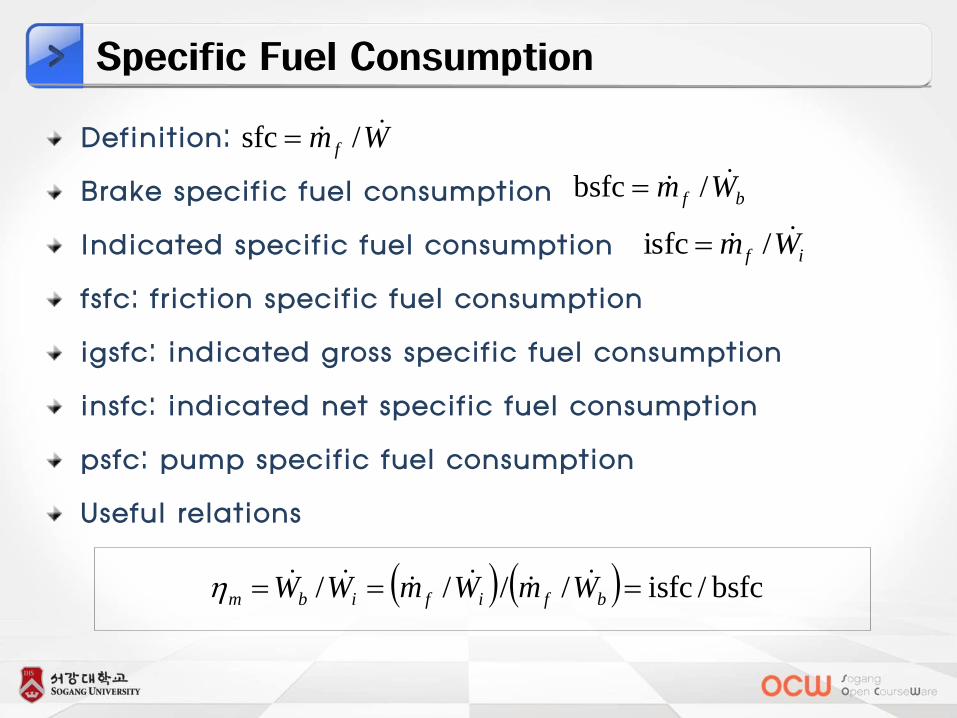
Specific Fuel Consumption
Definition:
Brake specific fuel consumption
Indicated specific fuel consumption
fsfc: friction specific fuel consumption
igsfc: indicated gross specific fuel consumption
insfc: indicated net specific fuel consumption
psfc: pump specific fuel consumption
Useful relations
Wm f /sfc
bf Wm /bsfc
if Wm /isfc
bsfc/isfc//// bfifibm WmWmWW
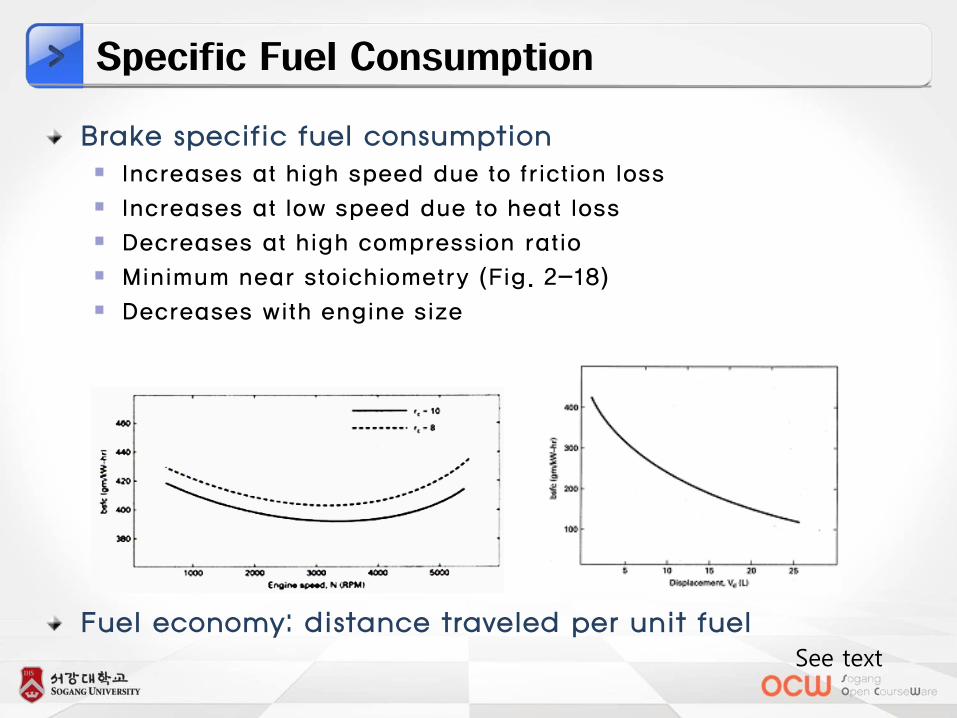
Specific Fuel Consumption
Brake specific fuel consumption Increases at high speed due to friction loss
Increases at low speed due to heat loss
Decreases at high compression ratio
Minimum near stoichiometry (Fig. 2-18)
Decreases with engine size
Fuel economy: distance traveled per unit fuel See text
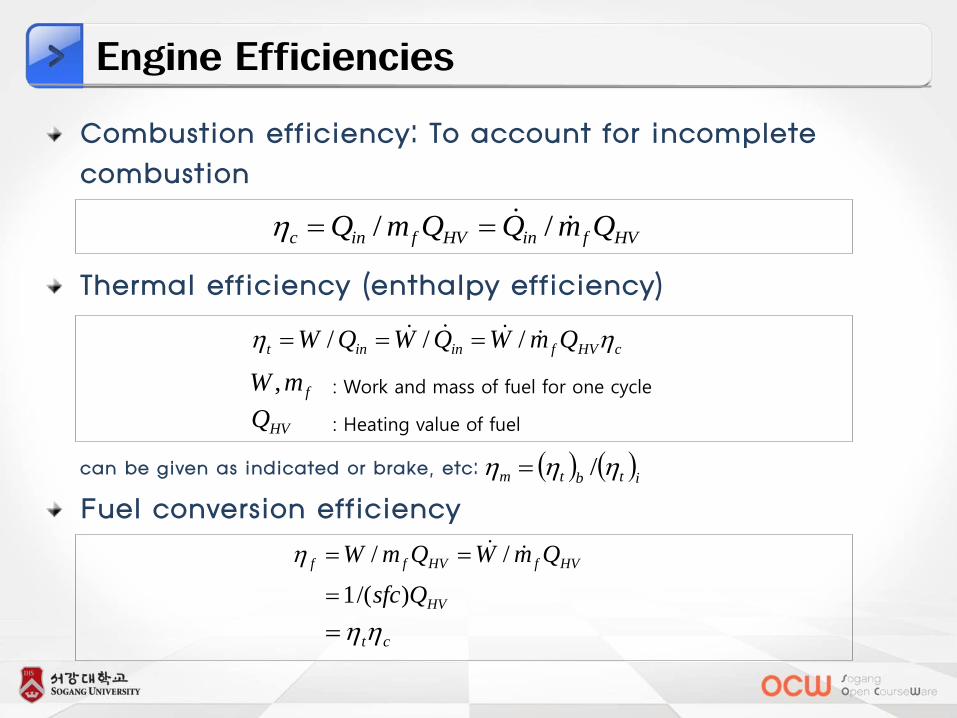
Engine Efficiencies
Combustion efficiency: To account for incomplete
combustion
Thermal efficiency (enthalpy efficiency)
can be given as indicated or brake, etc:
Fuel conversion efficiency
itbtm /
HVfinHVfinc QmQQmQ //
ct
HV
HVfHVff
Qsfc
QmWQmW
/
)/(1
//
ct
HVQ
fmW ,
cHVfinint QmWQWQW ///
: Work and mass of fuel for one cycle
: Heating value of fuel

Volumetric Efficiency
Air enters the chamber less than ideal (short cycle time, flow restrictions, intake manifolds, etc)
Definition:
: air mass per cycle, mass flow rate
Standard air conditions
Air conditions in the intake manifold used sometimes
K-kJ/kg 287.0
kg/m 181.1/
C25K 298
kPa 101
3
00
0
0
R
RTP
T
P
a
Prob. 2-4
NVmnVm daadaav //
aa mm ,
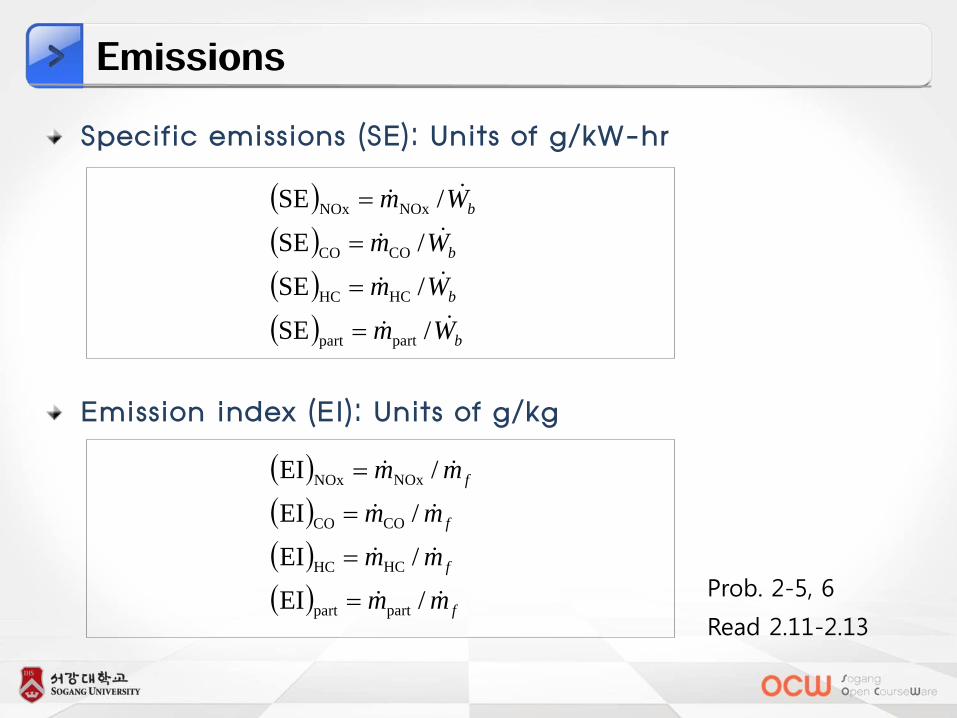
Emissions
Specific emissions (SE): Units of g/kW-hr
Emission index (EI): Units of g/kg
Read 2.11-2.13
Prob. 2-5, 6
b
b
b
b
Wm
Wm
Wm
Wm
/SE
/SE
/SE
/SE
partpart
HCHC
COCO
NOxNOx
f
f
f
f
mm
mm
mm
mm
/EI
/EI
/EI
/EI
partpart
HCHC
COCO
NOxNOx

Please look at Heywood 2.1-2.5, 2.7-2.15