Embed Size (px)
Citation preview
i
Photometric Analyzer
Teledyne Analytical Instruments
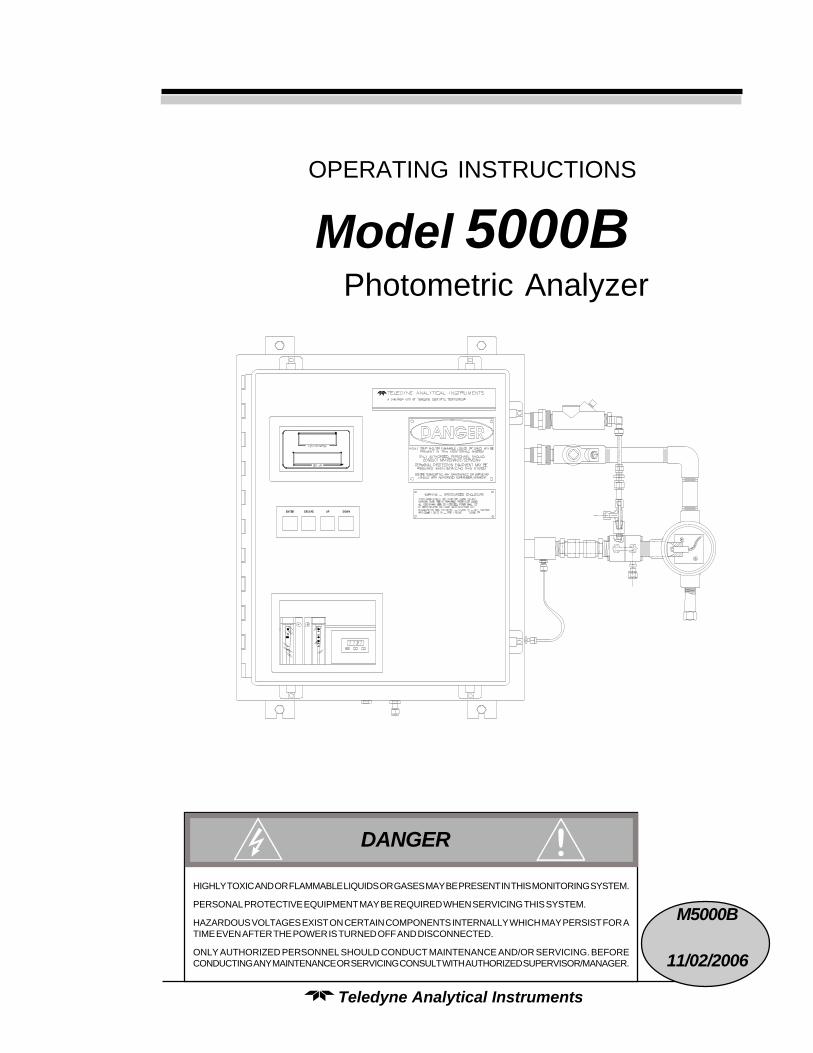
OPERATING INSTRUCTIONS
Model 5000BPhotometric Analyzer
HIGHLY TOXIC AND OR FLAMMABLE LIQUIDS OR GASES MAY BE PRESENT IN THIS MONITORING SYSTEM.
PERSONAL PROTECTIVE EQUIPMENT MAY BE REQUIRED WHEN SERVICING THIS SYSTEM.
HAZARDOUS VOLTAGES EXIST ON CERTAIN COMPONENTS INTERNALLY WHICH MAY PERSIST FOR ATIME EVEN AFTER THE POWER IS TURNED OFF AND DISCONNECTED.
ONLY AUTHORIZED PERSONNEL SHOULD CONDUCT MAINTENANCE AND/OR SERVICING. BEFORECONDUCTING ANY MAINTENANCE OR SERVICING CONSULT WITH AUTHORIZED SUPERVISOR/MANAGER.
DANGER
M5000B
11/02/2006
ii
Model 5000B
Teledyne Analytical Instruments
Copyright © 1999 Teledyne Analytical Instruments
All Rights Reserved. No part of this manual may be reproduced, transmitted,transcribed, stored in a retrieval system, or translated into any other language or computerlanguage in whole or in part, in any form or by any means, whether it be electronic,mechanical, magnetic, optical, manual, or otherwise, without the prior written consent ofTeledyne Analytical Instruments, 16830 Chestnut Street, City of Industry, CA 91749-1580.
Warranty
This equipment is sold subject to the mutual agreement that it is warranted by usfree from defects of material and of construction, and that our liability shall be limited toreplacing or repairing at our factory (without charge, except for transportation), or atcustomer plant at our option, any material or construction in which defects becomeapparent within one year from the date of shipment, except in cases where quotations oracknowledgements provide for a shorter period. Components manufactured by others bearthe warranty of their manufacturer. This warranty does not cover defects caused by wear,accident, misuse, neglect or repairs other than those performed by Teledyne or an autho-rized service center. We assume no liability for direct or indirect damages of any kind andthe purchaser by the acceptance of the equipment will assume all liability for any damagewhich may result from its use or misuse.
We reserve the right to employ any suitable material in the manufacture of ourapparatus, and to make any alterations in the dimensions, shape or weight of any parts, inso far as such alterations do not adversely affect our warranty.
Important Notice
This instrument provides measurement readings to its user, and serves as a tool bywhich valuable data can be gathered. The information provided by the instrument mayassist the user in eliminating potential hazards caused by his process; however, it isessential that all personnel involved in the use of the instrument or its interface, with theprocess being measured, be properly trained in the process itself, as well as all instrumen-tation related to it.
The safety of personnel is ultimately the responsibility of those who control processconditions. While this instrument may be able to provide early warning of imminentdanger, it has no control over process conditions, and it can be misused. In particular, anyalarm or control systems installed must be tested and understood, both as to how theyoperate and as to how they can be defeated. Any safeguards required such as locks, labels,or redundancy, must be provided by the user or specifically requested of Teledyne at thetime the order is placed.
Therefore, the purchaser must be aware of the hazardous process conditions. Thepurchaser is responsible for the training of personnel, for providing hazard warningmethods and instrumentation per the appropriate standards, and for ensuring that hazardwarning devices and instrumentation are maintained and operated properly.
Teledyne Analytical Instruments, the manufacturer of this instrument, cannotaccept responsibility for conditions beyond its knowledge and control. No statementexpressed or implied by this document or any information disseminated by the manufac-turer or its agents, is to be construed as a warranty of adequate safety control under theuser’s process conditions.

iii
Photometric Analyzer
Teledyne Analytical Instruments
Table of Contents
Part I: Control Unit ................................Part I: 1-1
Part II: Analysis Unit ............................Part II: 4-1
Appendix ......................................................... A-1

iv
Model 5000B
Teledyne Analytical Instruments

Part I: i
Part I: Control Unit
Teledyne Analytical Instruments
OPERATING INSTRUCTIONS
Model 5000BPhotometric Analyzer
Part I: Control Unit
NEMA 4 Bulkhead Mount

ii: Part I
Model 5000B Photometric Analyzer
Teledyne Analytical Instruments
Table of Contents
1 Introduction
1.1 Overview ........................................................................ 1-11.2 Typical Applications ....................................................... 1-11.3 Main Features of the Analyzer ....................................... 1-51.4 Operator Interface .......................................................... 1-6
1.4.1 Up/Down Switch .................................................... 1-61.4.2 Escape/Enter Switch.............................................. 1-6
1.5 Control Section Interface Panel...................................... 1-8
2 Installation
2.1 Unpacking the Control Unit/Analysis Unit ...................... 2-12.2 Electrical Connections ................................................... 2-12.3 Testing the System ........................................................ 2-9
3 Operation
3.1 Introduction .................................................................... 3-13.2 Using the Data Entry and Function Buttons ................... 3-13.3 The System Function ..................................................... 3-4
3.3.1 Setting up an Auto-Cal ........................................... 3-43.3.2 Password Protection .............................................. 3-6
3.3.2.1 Entering the Password ................................... 3-63.3.2.2 Installing or Changing the Password ............. 3-7
3.3.3 Logging Out ........................................................... 3-83.3.4 System Self-Diagnostic Test .................................. 3-93.3.5 The Model Screen ................................................. 3-103.3.6 Checking Linearity with Algorithm ......................... 3-103.3.7 Digital Flter Setup .................................................. 3-113.3.8 Filter or Solenoid Setup ......................................... 3-123.3.9 Hold/Track Setup ................................................... 3-133.3.10 Calibration/Hold Timer Setup ................................ 3-133.3.11 Analog 4 to 20 mA Output Calibration.................... 3-14

Part I: iii
Part I: Control Unit
Teledyne Analytical Instruments
3.3.12 Model ..................................................................... 3-153.3.13 Show Negative ...................................................... 3-15
3.4 The Zero and Span Functions ....................................... 3-163.4.1 Zero Cal ................................................................. 3-16
3.4.1.1 Auto Mode Zeroing ........................................ 3-163.4.1.2 Manual Mode Zeroing .................................... 3-173.4.1.3 Cell Failure .................................................... 3-18
3.4.2 Span Cal ................................................................ 3-193.4.2.1 Auto Mode Spanning ..................................... 3-193.4.2.2 Manual Mode Spanning................................. 3-19
3.4.3 Offset Function ....................................................... 3-203.5 The Alarms Function ...................................................... 3-223.6 The Range Select Function ........................................... 3-24
3.6.1 Manual (Select/Define Range) Screen .................. 3-243.6.2 Auto Screen ........................................................... 3-253.6.3 Precautions ............................................................ 3-26
3.7 The Analyze Function .................................................... 3-283.8 Programming ................................................................. 3-28
3.8.1 The Set Range Screen .......................................... 3.293.8.2 The Curve Algorithm Screen ................................. 3-31
3.8.2.1 Manual Mode Linearization ........................... 3-313.8.2.2 Auto Mode Linearization ................................ 3-31
4 Maintenance
4.1 Fuse Replacement......................................................... 4-14.2 System Self Diagnostic Test ........................................... 4-24.3 Major Internal Components ............................................ 4-3

iv: Part I
Model 5000B Photometric Analyzer
Teledyne Analytical Instruments

Part I: 1-1Teledyne Analytical Instruments
Photometric Analyzer Part I: Control Unit
Introduction
1.1 Overview
The Teledyne Analytical Instruments Model 5000B Control Unit,together with a 5000B Analysis Unit, is versatile microprocessor-basedinstrument.
Part I, of this manual covers the Model 5000B General Purpose NEMA4 Bulkhead Mount Control Unit. (The Analysis Unit is covered in Part II ofthis manual.) The Control Unit is for indoor/outdoor use in a nonhazardousenvironment only. The Control or Analysis Unit in the folded optics designcan accomodate a variety of hazardous environments with either full explo-sion proof housings or Z, X, Y or Cenelec Purging functions.
1.2 Typical Applications
A few typical applications of the Model 5000B are:
WATER MONITORING
Background Typical Range
Acids, including: 0–4000 PPM
Acetic
Formic
Sulfuric
Acetaldehyde 0–1000 PPM
Air 0–2%
Alcohols, including: 0–400 ppm
Butanol

1-2: Part I Teledyne Analytical Instruments
1 Introduction Model 5000B
Ethanol
Isopropanol
Methanol
Alkanes, including: 0–500 ppm
Heptane
Hexane
Ammonia 0–1000 ppm and up
Aromatics, including: 0–500 ppm
Benzene
Cumene
Toluene
Xylene
Chlorinated Hydrocarbons including: 0–200 ppm
Carbon Tetrachloride
Ethyl Chloride
Ethylene Dichloride
Methyl Chloride
Perchloroethylene
Propylene Dichloride
Trichloroethylene
Vinyl Chloride
Chloroprene 0–200 ppm
Chloropicrin 0–200 ppm
Deuterium Oxide 0–200 ppm
Epichlorohydrin 0–2000 ppm
Ethylene Glycol 0–500 ppm
Freons 0–500 ppm
Gasoline 0–500 ppm
Part I: 1-3Teledyne Analytical Instruments
Photometric Analyzer Part I: Control Unit
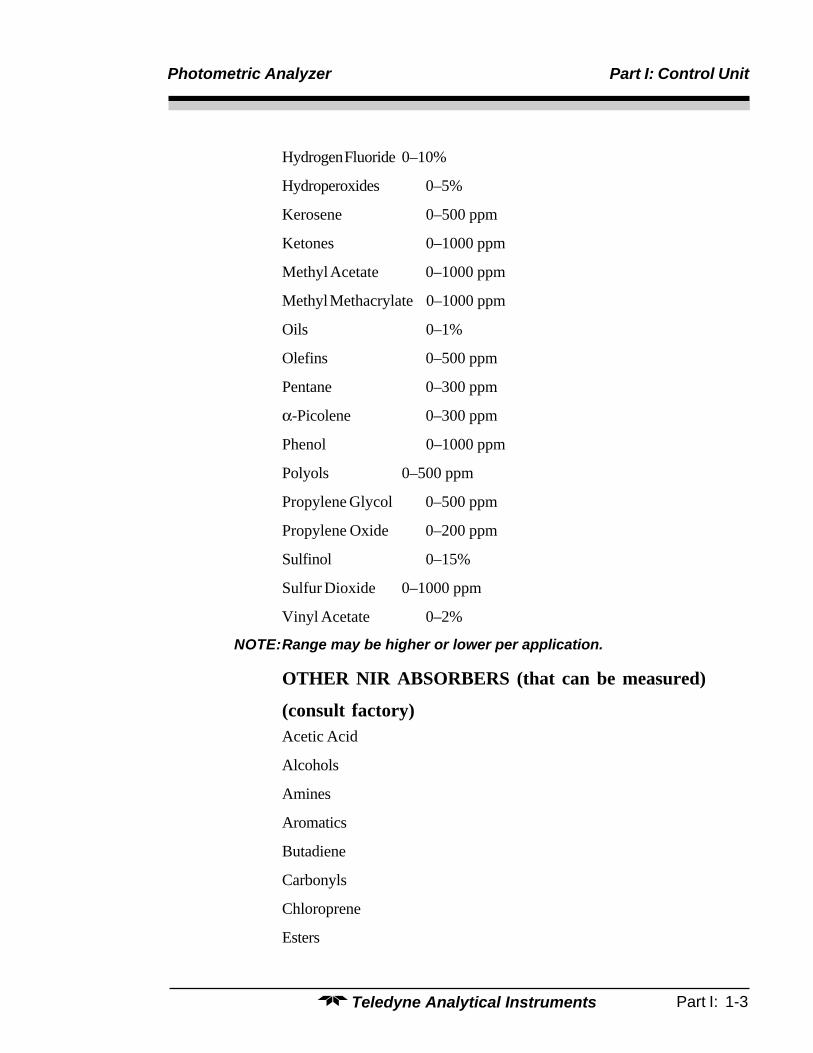
Hydrogen Fluoride 0–10%
Hydroperoxides 0–5%
Kerosene 0–500 ppm
Ketones 0–1000 ppm
Methyl Acetate 0–1000 ppm
Methyl Methacrylate 0–1000 ppm
Oils 0–1%
Olefins 0–500 ppm
Pentane 0–300 ppm
α-Picolene 0–300 ppm
Phenol 0–1000 ppm
Polyols 0–500 ppm
Propylene Glycol 0–500 ppm
Propylene Oxide 0–200 ppm
Sulfinol 0–15%
Sulfur Dioxide 0–1000 ppm
Vinyl Acetate 0–2%
NOTE:Range may be higher or lower per application.
OTHER NIR ABSORBERS (that can be measured)
(consult factory)Acetic Acid
Alcohols
Amines
Aromatics
Butadiene
Carbonyls
Chloroprene
Esters

1-4: Part I Teledyne Analytical Instruments
1 Introduction Model 5000B
Hydroxyl Value
Hydrocarbons
Hydrogen Chloride
Hydrogen Fluoride
Hydroxyl Value
Ketones
Olefins
Oximes
Epoxides
Methylene
Ketones
Part I: 1-5Teledyne Analytical Instruments
Photometric Analyzer Part I: Control Unit
1.3 Main Features of the Analyzer
The Model 5000B Photometric Analyzer is sophisticated yet simple touse. The main features of the analyzer include:
• A 2-line alphanumeric display screen, driven by microprocessorelectronics, that continuously prompts and informs the operator.
• High resolution, accurate readings of concentration from lowppm levels through to 100%. Large, bright, meter readout.
• Versatile analysis over a wide range of applications.
• Microprocessor based electronics: 8-bit CMOS microprocessorwith 32 kB RAM and 128 kB ROM.
• Three user definable output ranges (from 0-1 ppm through0-100 %) allow best match to users process and equipment.
• Calibration range for convenient zeroing or spanning.
• Auto Ranging allows analyzer to automatically select the properpreset range for a given measurement. Manual override allowsthe user to lock onto a specific range of interest.
• Two adjustable concentration alarms and a system failure alarm.
• Extensive self-diagnostic testing, at startup and on demand, withcontinuous power-supply monitoring.
• RS-232 serial digital port for use with a computer or other digitalcommunication device.
• Analog outputs for concentration and range identification.(0-1 V dc standard, and isolated 4–20 mA dc)
• Superior accuracy.
• Internal calibration-Manual or Automatic (optional).

1-6: Part I Teledyne Analytical Instruments
1 Introduction Model 5000B
1.4 Operator Interface
All controls and displays on the standard 5000B are accessible fromoutside the housing. The instrument has two simple operator controls. Theoperator has constant feedback from the instrument through an alphanumericdisplay, and a digital LED meter. The displays and controls are describedbriefly here and in greater detail in chapter 3. See Figure 1-1.
1.4.1 UP/DOWN Switch
The UP/DOWN switch is used to select between any subfunctionsdisplayed on the VFD screen such as in the main menue, the system menue,the Alarm menue, etc. When modifiable values are displayed on the VFD,the UP/DOWN switch can be used to increment or decrement the values.
1.4.2 ESCAPE/ENTER Switch
The ESCAPE/ENTER switch is used to input the data, to enter afunction, or to exit a function displayed in the alphanumeric display:
• Escape Moves VFD display back to the previous screen in aseries. If none remains, returns to Analyze mode
screen.
• Enter Within a menue: the funtion selected is enteredmoving on to the next screen in a series.
With Value selected: Enters the value into theanalyzer as data. Advances cursor on VFD to thenext operation.
In the Analyze mode: it calls the main menue.Functions called out by the main menue:
-System This function is a menu that calls anumber of functionsthat regulate the analyzer
operation.
-Span This function spans the instrument.
-Zero This function zeros the instrument.
-Alarms This functions sets the alarmpreferences.
Part I: 1-7Teledyne Analytical Instruments
Photometric Analyzer Part I: Control Unit
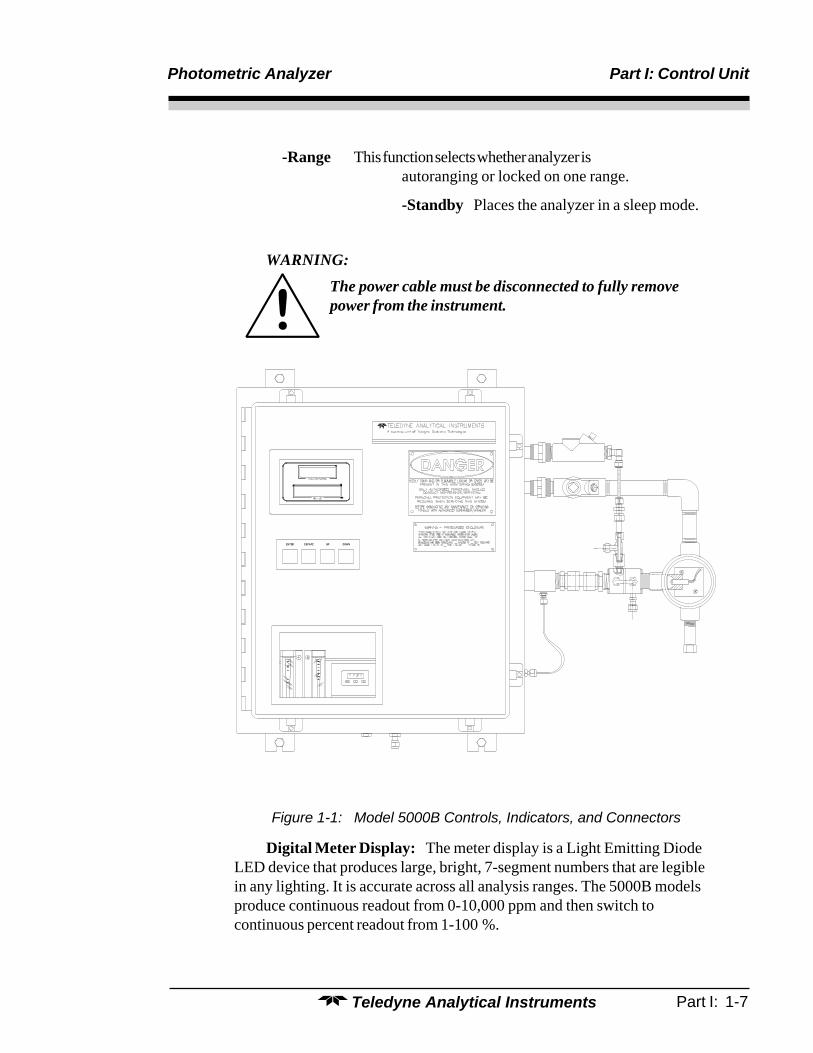
-Range This function selects whether analyzer isautoranging or locked on one range.
-Standby Places the analyzer in a sleep mode.
WARNING:
The power cable must be disconnected to fully removepower from the instrument.
Figure 1-1: Model 5000B Controls, Indicators, and Connectors
Digital Meter Display: The meter display is a Light Emitting DiodeLED device that produces large, bright, 7-segment numbers that are legiblein any lighting. It is accurate across all analysis ranges. The 5000B modelsproduce continuous readout from 0-10,000 ppm and then switch tocontinuous percent readout from 1-100 %.
1-8: Part I Teledyne Analytical Instruments
1 Introduction Model 5000B
Alphanumeric Interface Screen: The backlit VFD screen is an easy-to-use interface between operator and analyzer. It displays values, options,and messages for immediate feedback to the operator.
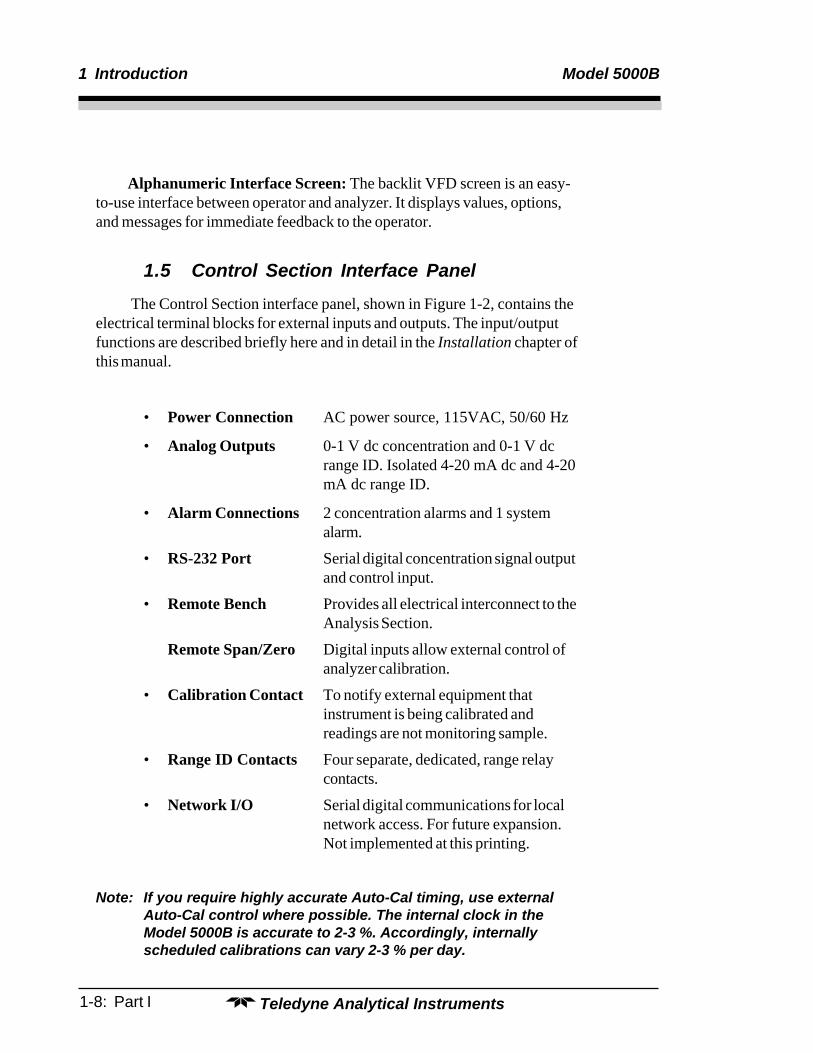
1.5 Control Section Interface Panel
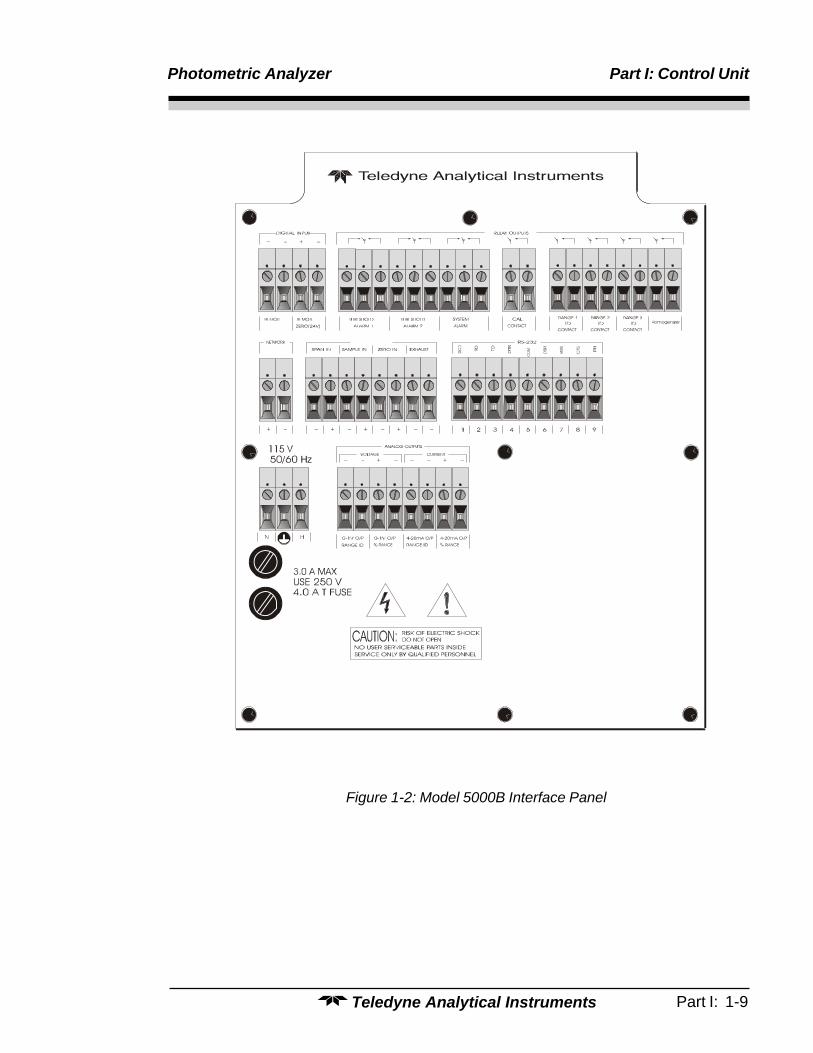
The Control Section interface panel, shown in Figure 1-2, contains theelectrical terminal blocks for external inputs and outputs. The input/outputfunctions are described briefly here and in detail in the Installation chapter ofthis manual.
• Power Connection AC power source, 115VAC, 50/60 Hz
• Analog Outputs 0-1 V dc concentration and 0-1 V dcrange ID. Isolated 4-20 mA dc and 4-20mA dc range ID.
• Alarm Connections 2 concentration alarms and 1 systemalarm.
• RS-232 Port Serial digital concentration signal outputand control input.
• Remote Bench Provides all electrical interconnect to theAnalysis Section.
Remote Span/Zero Digital inputs allow external control ofanalyzer calibration.
• Calibration Contact To notify external equipment thatinstrument is being calibrated andreadings are not monitoring sample.
• Range ID Contacts Four separate, dedicated, range relaycontacts.
• Network I/O Serial digital communications for localnetwork access. For future expansion.Not implemented at this printing.
Note: If you require highly accurate Auto-Cal timing, use externalAuto-Cal control where possible. The internal clock in theModel 5000B is accurate to 2-3 %. Accordingly, internallyscheduled calibrations can vary 2-3 % per day.
Part I: 1-9Teledyne Analytical Instruments
Photometric Analyzer Part I: Control Unit
Figure 1-2: Model 5000B Interface Panel

1-10: Part I Teledyne Analytical Instruments
1 Introduction Model 5000B
Part I: 2-1Teledyne Analytical Instruments
Photometric Analyzer Part I: Control Unit
Installation
Installation of Model 5000B Analyzers includes:1. Unpacking, mounting, and interconnecting the Control/Analysis
Section2. Making gas connections to the system3. Making electrical connections to the system4. Testing the system.
This chapter covers installation of the Control Section. (Installation ofthe Analysis Section is covered in Part II of this manual.)
2.1 Unpacking the Control/Analysis Unit
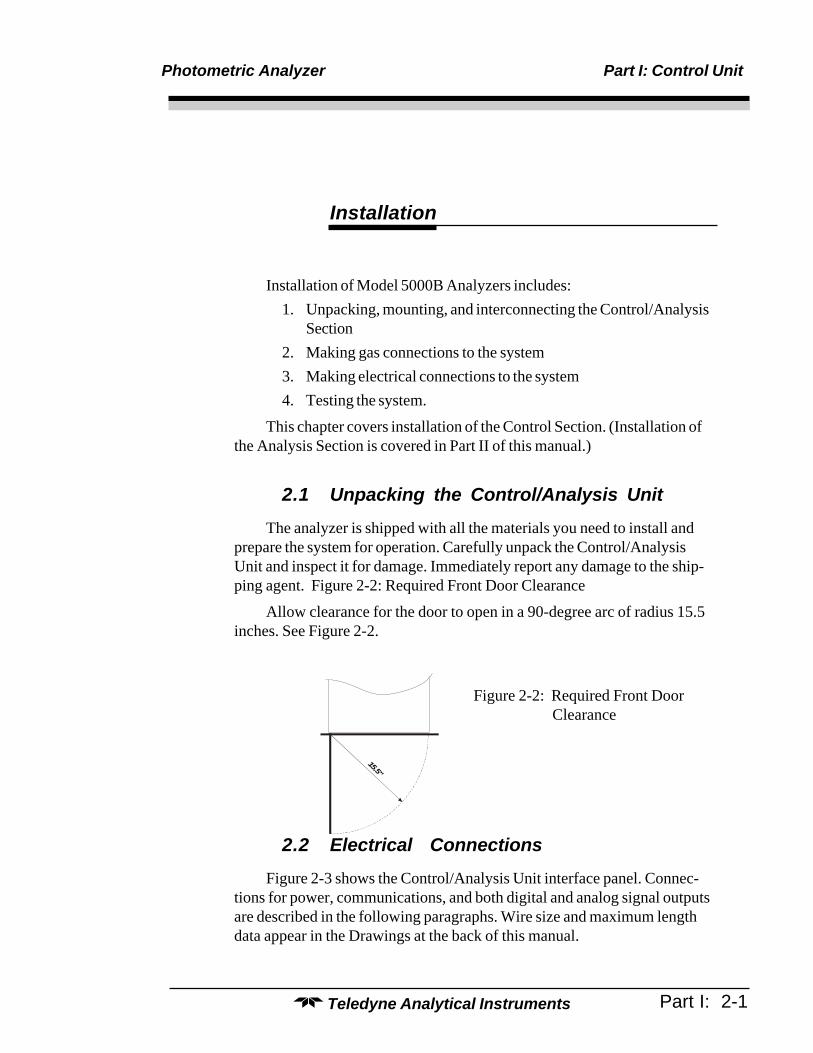
The analyzer is shipped with all the materials you need to install andprepare the system for operation. Carefully unpack the Control/AnalysisUnit and inspect it for damage. Immediately report any damage to the ship-ping agent. Figure 2-2: Required Front Door Clearance
Allow clearance for the door to open in a 90-degree arc of radius 15.5inches. See Figure 2-2.
Figure 2-2: Required Front Door Clearance
2.2 Electrical Connections
Figure 2-3 shows the Control/Analysis Unit interface panel. Connec-tions for power, communications, and both digital and analog signal outputsare described in the following paragraphs. Wire size and maximum lengthdata appear in the Drawings at the back of this manual.
15.5”
2-2: Part I Teledyne Analytical Instruments
1 Introduction Model 5000B
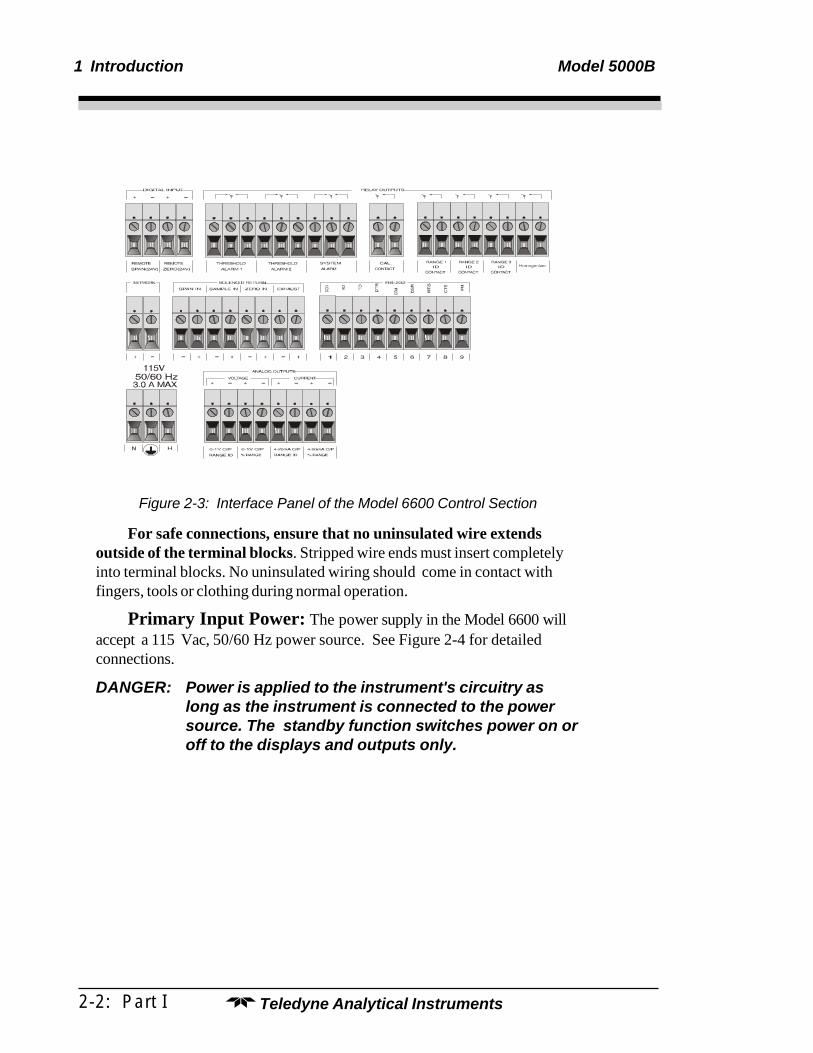
Figure 2-3: Interface Panel of the Model 6600 Control Section
For safe connections, ensure that no uninsulated wire extendsoutside of the terminal blocks. Stripped wire ends must insert completelyinto terminal blocks. No uninsulated wiring should come in contact withfingers, tools or clothing during normal operation.
Primary Input Power: The power supply in the Model 6600 willaccept a 115 Vac, 50/60 Hz power source. See Figure 2-4 for detailedconnections.
DANGER: Power is applied to the instrument's circuitry aslong as the instrument is connected to the powersource. The standby function switches power on oroff to the displays and outputs only.
Part I: 2-3Teledyne Analytical Instruments
Photometric Analyzer Part I: Control Unit
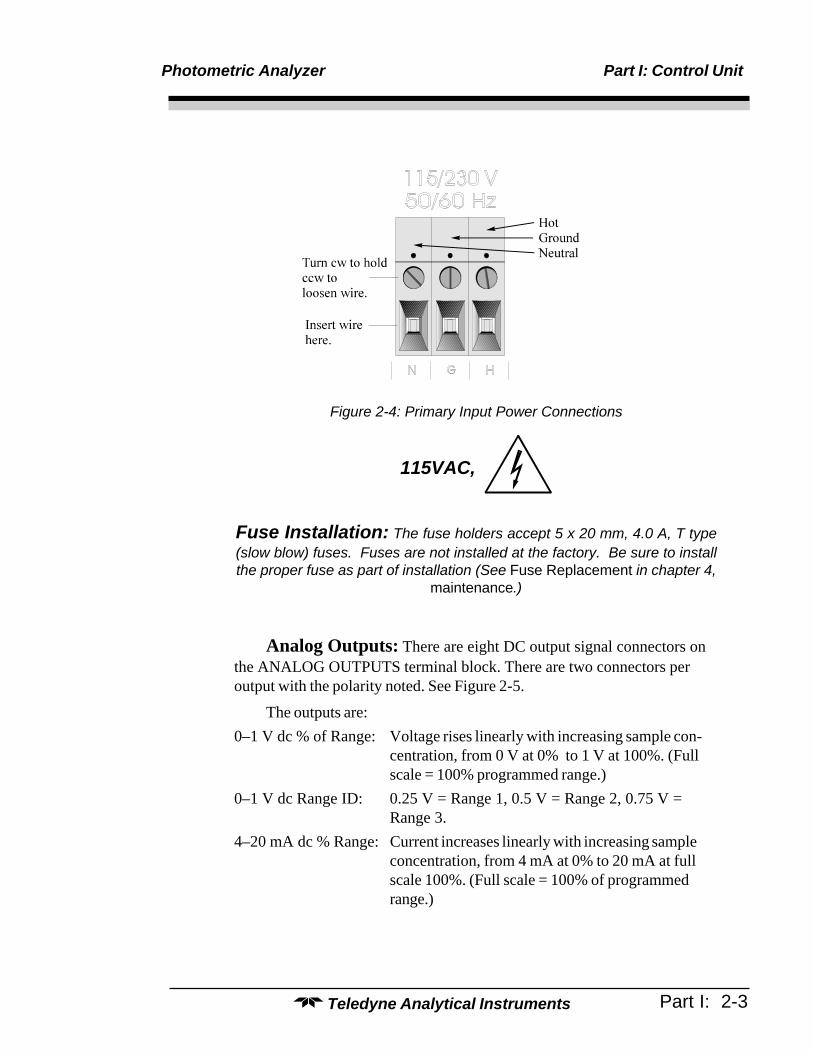
Figure 2-4: Primary Input Power Connections
115VAC,
Fuse Installation: The fuse holders accept 5 x 20 mm, 4.0 A, T type(slow blow) fuses. Fuses are not installed at the factory. Be sure to installthe proper fuse as part of installation (See Fuse Replacement in chapter 4,
maintenance.)
Analog Outputs: There are eight DC output signal connectors onthe ANALOG OUTPUTS terminal block. There are two connectors peroutput with the polarity noted. See Figure 2-5.
The outputs are:0–1 V dc % of Range: Voltage rises linearly with increasing sample con-
centration, from 0 V at 0% to 1 V at 100%. (Fullscale = 100% programmed range.)
0–1 V dc Range ID: 0.25 V = Range 1, 0.5 V = Range 2, 0.75 V =Range 3.
4–20 mA dc % Range: Current increases linearly with increasing sampleconcentration, from 4 mA at 0% to 20 mA at fullscale 100%. (Full scale = 100% of programmedrange.)

2-4: Part I Teledyne Analytical Instruments
1 Introduction Model 5000B
4–20 mA dc Range ID: 8 mA = Range 1, 12 mA = Range 2, 16 mA =Range 3.
Figure 2-5: Analog Output Connections
Examples:
The analog output signal has a voltage which depends on the sampleconcentration AND the currently activated analysis range. To relate thesignal output to the actual concentration, it is necessary to know what rangethe instrument is currently on, especially when the analyzer is in theautoranging mode.
The signaloutput for concentration is linear over currently selectedanalysis range. For example, if the analyzer is set on a range that wasdefined as 0-10 %, then the output would be as shown in Table 2-1.
Table 2-1: Analog Concentration Output-Examples
Concentration Voltage Signal Current Signal% Output (V dc) Output (mA dc)0 0.0 4.0
1 0.1 5.6
2 0.2 7.2

Part I: 2-5Teledyne Analytical Instruments
Photometric Analyzer Part I: Control Unit
3 0.3 8.8
4 0.4 10.4
5 0.5 12.0
6 0.6 13.6
7 0.7 15.2
8 0.8 16.8
9 0.9 18.4
10 1.0 20.0
To provide an indication of the range, a second pair of analog outputterminals are used. They generate a steady preset voltage (or current whenusing the current outputs) to represent a particular range. Table 2-2 gives therange ID output for each analysis range.
Table 2-2: Analog Range ID Output - Example
Range Voltage (V) Current (mA)
Range 1 0.25 8
Range 2 0.50 12
Range 3 0.75 16
Alarm Relays:
There are three alarm-circuit connectors on the alarm relays block(under RELAY OUTPUTS) for making connections to internal alarm relaycontacts. Each provides a set of Form C contacts for each type of alarm.Each has both normally open and normally closed contact connections. Thecontact connections are indicated by diagrams on the rear panel. They arecapable of switching up to 3 ampers at 250 V AC into a resistive load(Figure 2-6).

2-6: Part I Teledyne Analytical Instruments
1 Introduction Model 5000B
Normally open
Moving contact
Normally closedNormally openMoving contact
Figure
2-6: Types of Relay Contacts
The connectors are:
Threshold Alarm 1: • Can be configured as high (actuates whenconcentration is above threshold), or low(actuates when concentration is below thresh old).• Can be configured as fail-safe or non-fail-safe.• Can be configured as latching or nonlatching.• Can be configured out (defeated).
Threshold Alarm 2: • Can be configured as high (actuates when concen-tration is above threshold), or low (actuates whenconcentration is below threshold).• Can be configured as fail-safe or non-fail-safe.• Can be configured as latching or nonlatching.• Can be configured out (defeated).
System Alarm: Actuates when DC power supplied to circuits isunacceptable in one or more parameters. Permanentlyconfigured as fail-safe and latching. Cannot be de-feated. Actuates if self test fails.To reset a System Alarm during installation, discon-nect power to the instrument and then reconnect itFurther detail can be found in chapter 3, section 3-5.
Digital Remote Cal Inputs
Remote Zero and Span Inputs: The REMOTE SPAN and RE-MOTE ZERO inputs are on the DIGITAL INPUT terminal block. They

Part I: 2-7Teledyne Analytical Instruments
Photometric Analyzer Part I: Control Unit
accept 0 V (OFF) or 24 V dc (ON) for remote control of calibration (SeeRemote Calibration Protocol below.)
Zero: Floating input. 5 to 24 V input across the + and – terminalsputs the analyzer into the ZERO mode. Either side may begrounded at the source of the signal. 0 to 1 volt across theterminals allows ZERO mode to terminate when done. Asynchronous signal must open and close the external zerovalve appropriately. See Remote Probe Connector at end ofsection 3.3. (With the -C option, the internal valves automati-cally operate synchronously).
Span: Floating input. 5 to 24 V input across the + and – terminalsputs the analyzer into the SPAN mode. Either side may begrounded at the source of the signal. 0 to 1 volt across theterminals allows SPAN mode to terminate when done. Asynchronous signal must open and close the external spanvalve appropriately. See Remote Probe Connector at end ofsection 3.3. (With the -C option, the internal valves automati-cally operate synchronously.)
Cal Contact: This relay contact is closed while analyzer is spanningand/or zeroing. (See Remote Calibration Protocol below.)
Remote Calibration Protocol: To properly time the Digital RemoteCal Inputs to the Model 5000B Analyzer, the customer's controller mustmonitor the Cal Relay Contact.
When the contact is OPEN, the analyzer is analyzing, the Remote CalInputs are being polled, and a zero or span command can be sent.
When the contact is CLOSED, the analyzer is already calibrating. Itwill ignore your request to calibrate, and it will not remember that request.
Once a zero or span command is sent, and acknowledged (contactcloses), release it. If the command is continued until after the zero or span iscomplete, the calibration will repeat and the Cal Relay Contact (CRC) willclose again.
For example:1) Test the CRC. When the CRC is open, Send a zero command
until the CRC closes (The CRC will quickly close.)2) When the CRC closes, remove the zero command.3) When CRC opens again, send a span command until the CRC
closes. (The CRC will quickly close.)4) When the CRC closes, remove the span command.

2-8: Part I Teledyne Analytical Instruments
1 Introduction Model 5000B
When CRC opens again, zero and span are done, and the sample isbeing analyzed.
Note: The Remote Bench terminal strip (section 3.6 Part III) providessignals to ensure that the zero and span gas valves will becontrolled synchronously.
Range ID Relays: Four dedicated RANGE ID CONTACT relays .The first four ranges are assigned to relays in ascending order—Range 1 isassigned to RANGE 1 ID, Range 2 is assigned to RANGE 2 ID, Range 3is assigned to RANGE 3 ID, and Range 4 is assigned to RANGE 4 ID.
Network I/O: A serial digital input/output for local network protocol.At this printing, this port is not yet functional. It is to be used in futureversions of the instrument.
RS-232 Port: The digital signal output is a standard RS-232 serialcommunications port used to connect the analyzer to a computer, terminal, orother digital device. The pinouts are listed in Table 2-3.
Table 2-3: RS-232 Signals RS-232 Sig RS-232 Pin Purpose
DCD 1 Data Carrier Detect
RD 2 Received Data
TD 3 Transmitted Data
DTR 4 Data Terminal Ready
COM 5 Common
DSR 6 Data Set Ready
RTS 7 Request to Send
CTS 8 Clear to Send
RI 9 Ring Indicator
The data sent is status information, in digital form, updated every twoseconds. Status is reported in the following order:
• The concentration in percent• The range is use (HI< MED< LO)• The span of the range 0-100%, etc.• Which alarm - if any - are disabled (AL-x DISABLED)
Part I: 2-9Teledyne Analytical Instruments
Photometric Analyzer Part I: Control Unit
• Which alarms - if any - are tripped (AL-x ON)
Each status output is followed by a carriage return and line feed.
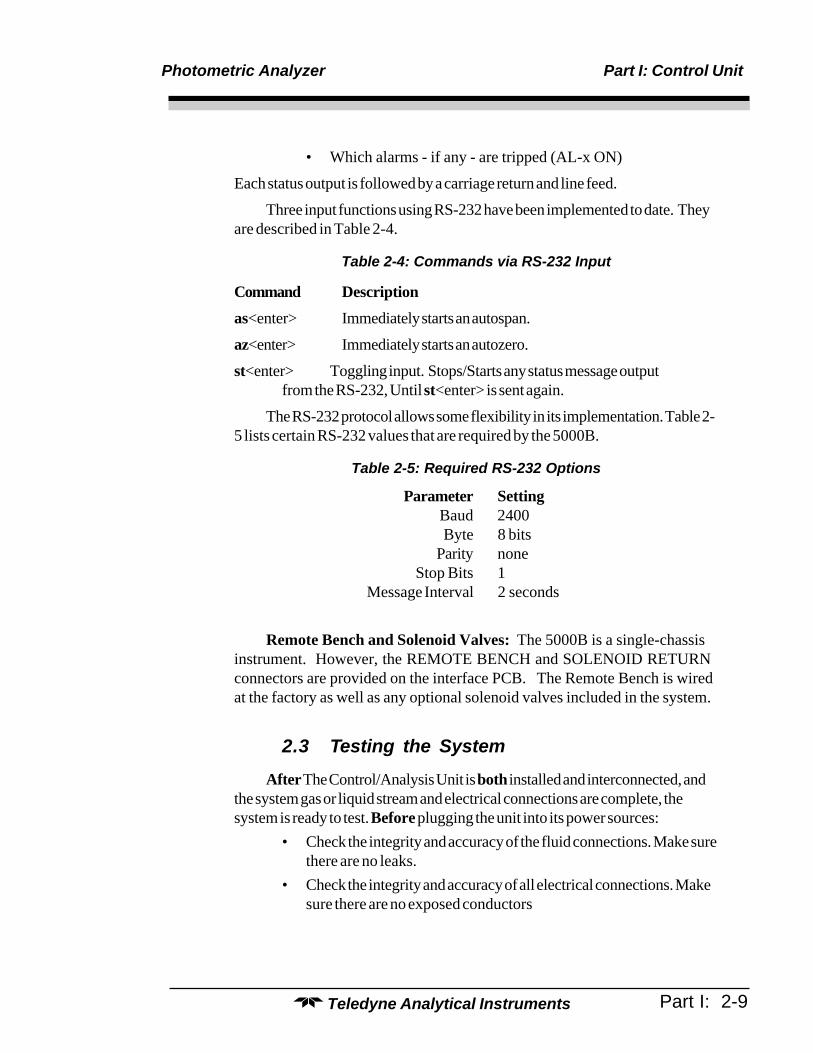
Three input functions using RS-232 have been implemented to date. Theyare described in Table 2-4.
Table 2-4: Commands via RS-232 Input
Command Description
as<enter> Immediately starts an autospan.
az<enter> Immediately starts an autozero.
st<enter> Toggling input. Stops/Starts any status message outputfrom the RS-232, Until st<enter> is sent again.
The RS-232 protocol allows some flexibility in its implementation. Table 2-5 lists certain RS-232 values that are required by the 5000B.
Table 2-5: Required RS-232 Options
Parameter SettingBaud 2400Byte 8 bits
Parity noneStop Bits 1
Message Interval 2 seconds
Remote Bench and Solenoid Valves: The 5000B is a single-chassisinstrument. However, the REMOTE BENCH and SOLENOID RETURNconnectors are provided on the interface PCB. The Remote Bench is wiredat the factory as well as any optional solenoid valves included in the system.
2.3 Testing the System
After The Control/Analysis Unit is both installed and interconnected, andthe system gas or liquid stream and electrical connections are complete, thesystem is ready to test. Before plugging the unit into its power sources:
• Check the integrity and accuracy of the fluid connections. Make surethere are no leaks.
• Check the integrity and accuracy of all electrical connections. Makesure there are no exposed conductors
2-10: Part I Teledyne Analytical Instruments
1 Introduction Model 5000B
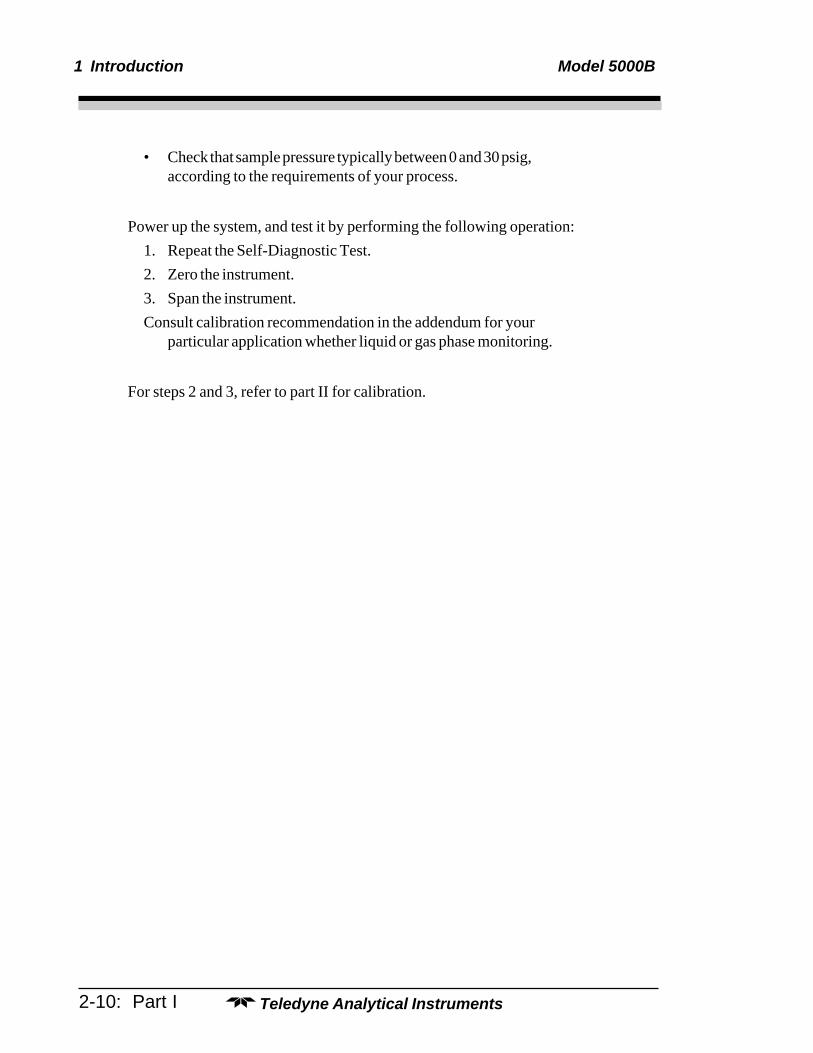
• Check that sample pressure typically between 0 and 30 psig,according to the requirements of your process.
Power up the system, and test it by performing the following operation:1. Repeat the Self-Diagnostic Test.2. Zero the instrument.3. Span the instrument.Consult calibration recommendation in the addendum for your
particular application whether liquid or gas phase monitoring.
For steps 2 and 3, refer to part II for calibration.
Photometric Analyzer Operation /Control Unit 3
Part I 3-1Teledyne Analytical Instruments
Operation
3.1 Introduction
Although the Model 5000B is usually programmed to your applicationat the factory, it can be further configured at the operator level, or even,cautiously, reprogrammed. Depending on the specifics of the application,this might include all or a subset of the following procedures:
• Setting system parameters:• Establish a security password, if desired, requiring Operator
to log in (secure in safe file for referrence).• Establish and start an automatic calibration cycle, if desired.
• Routine Operation:• Calibrate the instrument.• Choose autoranging or select a fixed range of analysis.• Set alarm setpoints, and modes of alarm operation (latching,
fail-safe, etc).• Program/Reprogram the analyzer:
• Define new applications.• Linearize your ranges.
If you choose not to use password protection, the default password isautomatically displayed on the password screen when you start up, and yousimply press Enter for access to all functions of the analyzer.
3.2 Using the Data Entry and FunctionButtons
Data Entry Buttons: The < > buttons select options from the menucurrently being displayed on the VFD screen. The selected option blinks.
When the selected option includes a modifiable item, the DÑ arrowbuttons can be used to increment or decrement that modifiable item.

3 Operation/Control Unit Model 5000B
3-2 Part I Teledyne Analytical Instruments
The Enter button is used to accept any new entries on the VFD screen.The Escape button is used to abort any new entries on the VFD screen thatare not yet accepted by use of the Enter button.
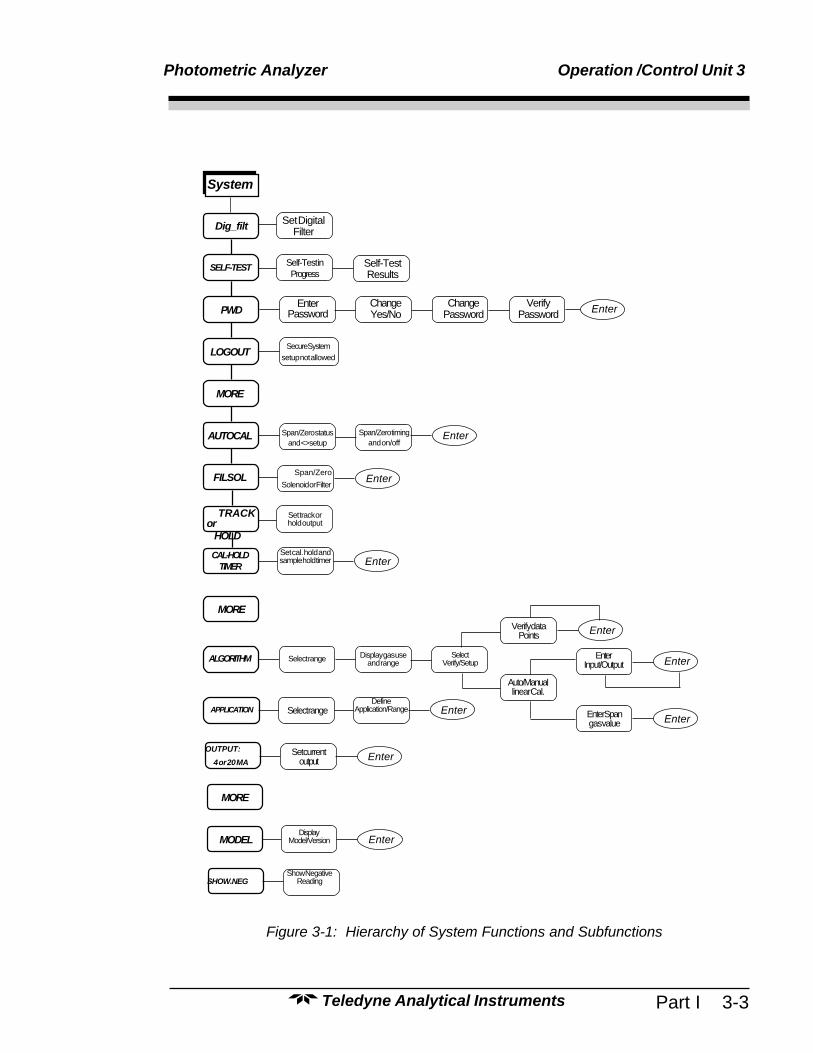
Figure 3-1 shows the hierarchy of functions available to the operator via thefunction buttons. The six functions of the buttons on the analyzer are:
• Analyze. This is the normal operating mode. The analyzer monitorsthe concentration of the sample, displays the percent or parts-per-million of target fluid or contamination, and warns of any alarmconditions.
• System. The system function consists of nine subfunctions.Four of these are for ordinary setup and operation:
• Setup an Auto-Cal• Assign Passwords• Log out to secure system• Initiate a Self-Test
Three of the subfunctions do auxiliary tasks:• Checking model and software version• Adjust electronic filter of the signal• Display more subfunctions• Display negative readings
Two of these are for programming/reprogramming the analyzer:• Define fluid applications and ranges (Refer to programming
section, or contact factory.)• Use the Curve Algorithm to linearize output. (Refer to
programming section, or contact factory.)• Zero. Used to set up a zero calibration.• Span. Used to set up a span calibration.• Alarms. Used to set the alarm setpoints and determine whether
each alarm will be active or defeated, HI or LO acting, latching,and/or fail-safe.
• Range. Used to set up three analysis ranges that can be switchedautomatically with autoranging or used as individual fixedranges.
Any function can be selected at any time by pressing the appropriatebutton (unless password restrictions apply). The order as presented in thismanual is appropriate for an initial setup.
Each of these functions is described in greater detail in the following proce-dures. The VFD screen text that accompanies each operation is reproduced, at
Photometric Analyzer Operation /Control Unit 3
Part I 3-3Teledyne Analytical Instruments
Figure 3-1: Hierarchy of System Functions and Subfunctions
System
SELF-TEST Self-TestResults
Self-Test inProgress
ChangeYes/No
ChangePassword
VerifyPassword
Set track orhold output
Set currentoutput
CAL-HOLDTIMER
MORE
LOGOUT
PWD
FILSOL
AUTOCAL
EnterPassword
DefineApplication/RangeSelect range
Display gas useand range
Enter
Secure Systemsetup not allowed
Span/Zero statusand <>setup
Span/Zero timingand on/off
Enter
Span/Zero
Solenoid or FilterEnter
TRACKor
HOLDSet cal. hold andsample hold timer Enter
MORE
ALGORITHM Select range
APPLICATION
OUTPUT:
4 or 20 MA
Enter
Enter
SelectVerify/Setup
Auto/Manuallinear Cal.
Verify dataPoints Enter
EnterInput/Output
Enter Spangas value
Enter
Enter
Dig_filt Set DigitalFilter
MODEL EnterDisplay
Model/Version
MORE
Show NegativeReading SHOW.NEG

3 Operation/Control Unit Model 5000B
3-4 Part I Teledyne Analytical Instruments
the appropriate point in the procedure, in a Monospaced type style. Push-buttonnames are printed in Oblique type.
3.3 The System Function
The subfuctions of the System function are described below. Specificprocedures for their use follow the descriptions:
• Dig_Filt: Adjust how much digital filtering should be on thesignal
• SELF-TEST: Performs a self-diagnostic test to check theintegrity of the power supplies, outputs, detector signal andpreamplifier.
• PWD: Login security system for accessing to the setup functions.• LOGOUT: Prevents an unauthorized tampering with analyzer
settings.• AUTOCAL: Set the automatic calibrated timer schedule for
Zero and Span cycling.• FILSOL: Select Span/Zero flag (filter) or Span/Zero solenoid
valve for calibration method.• TRACK: Set the system reading to be held or followed by the
concentration “fluid or filter” during calibration.• CAL-HOLD-TIMER: Set the timing for calibration holding
and timing for the sample reading after return to analyze mode.• ALGORITHM: Linearize the output for nonlinear characteristic.• APPLICATION: Used to define the analysis ranges and
application (fluid used).• MODEL: Displays model number and software version.• OUTPUT: 4-20 MA: Adjust 4 and 20 mA output.• SHOW_NEG: Whether to display negative readings or not;
affects analog output too. No negative readings is the default.
3.3.1 Setting up an AUTO-CAL
When proper automatic valving is connected, the Analyzer can cycleitself through a sequence of steps that automatically zero and span the instru-ment.

Photometric Analyzer Operation /Control Unit 3
Part I 3-5Teledyne Analytical Instruments
Note: Before setting up an AUTO-CAL, be sure you understand the Zeroand Span functions as described in section 4.4, and follow theprecautions given there.
Note: If you require highly accurate AUTO-CAL timing, use externalAUTO-CAL control where possible. The internal clock in theModel 5000BF is accurate to 2-3 %. Accordingly, internallyscheduled calibrations can vary 2-3 % per day.
To setup an Auto–Cal cycle:
Choose System from the Function buttons. TheVFD will display fivesubfunctions.
DIG_FILT SELF—TESTPWD LOGOUT MORE
Select MORE and press the Enter Key
AUTOCAL FILSOL HOLDCAL-HOLD-TIMER MORE
Use < > arrows to blink AUTO—CAL, and press Enter. A new screenfor ZERO/SPAN set appears.
ZERO in Ød Øh offSPAN in Ød Øh off
Press < > arrows to blink ZERO (or SPAN), then press Enter again.(You won’t be able to set OFF to ON if a zero interval is entered.) A SpanEvery ... (or Zero Every ...) screen appears.
Zero schedule: OFFDay: Ød Hour: Øh
Use DÑ arrows to set an interval value, then use < > arrows to move tothe start-time value. Use DÑ arrows to set a start-time value.
To turn ON the SPAN and/or ZERO cycles (to activate AUTO–CAL):Press System again, choose AUTO–CAL, and press Enter again. When theZERO/SPAN values screen appears, use the < > arrows to blink the ZERO(or SPAN) and press Enter to go to the next screen. Use < > to select OFF/ON field. Use DÑ arrows to set the OFF/ON field to ON. You can now turnthese fields ON because there is a nonzero span interval defined.
If instrument is turned off, the next time the instrument is powered, theinstrument will automatically perform a calibration cycle after 3 minutes ofentering the sample mode if AUTOCAL functions were on prior to shutdown.
3 Operation/Control Unit Model 5000B
3-6 Part I Teledyne Analytical Instruments
3.3.2 Password Protection
Before a unique password is assigned, the system assigns TAI by default.This password will be displayed automatically. The operator just presses theEnter key to be allowed total access to the instrument’s features.
If a password is assigned, then setting the following system parameters canbe done only after the password is entered: alarm setpoints, assigning a newpassword, range/application selections, and curve algorithm linearization.(APPLICATION and ALGORITHM are covered in the programming section.)However, the instrument can still be used for analysis or for initiating a self-testwithout entering the password. To defeat security the password must bechanged back to TAI.
NOTE: If you use password security, it is advisable to keep a copy of thepassword in a separate, safe location.
3.3.2.1 Entering the Password
To install a new password or change a previously installed password,you must key in and ENTER the old password first. If the default passwordis in effect, pressing the ENTER button will enter the default TAI passwordfor you.
Press System to enter the System mode.
DIG_FILT AUTO—CALPWD LOGOUT MORE
Use the < > arrow keys to scroll the blinking over to PWD, and pressEnter to select the password function. Either the default TAI password orAAA place holders for an existing password will appear on screen depend-ing on whether or not a password has been previously installed.
Enter password: T A Ior
Enter password: A A A
The screen prompts you to enter the current password. If you are notusing password protection, press Enter to accept TAI as the default pass-word. If a password has been previously installed, enter the password usingthe < > arrow keys to scroll back and forth between letters, and the DÑ
Photometric Analyzer Operation /Control Unit 3
Part I 3-7Teledyne Analytical Instruments
arrow keys to change the letters to the proper password. Press Enter to enterthe password.
In a few seconds, you will be given the opportunity to change this pass-word or keep it and go on.
Change Password?<ENT>=Yes <ESC>=No
Press Escape to move on, or proceed as in Changing the Password,below.
3.3.2.2 Installing or Changing the Password
If you want to install a password, or change an existing password,proceed as above in Entering the Password. When you are given the oppor-tunity to change the password:
Change Password?<ENT>=Yes <ESC>=No
Press Enter to change the password (either the default TAI or thepreviously assigned password), or press Escape to keep the existing pass-word and move on.
If you chose Enter to change the password, the password assignmentscreen appears.
Select new password T A I
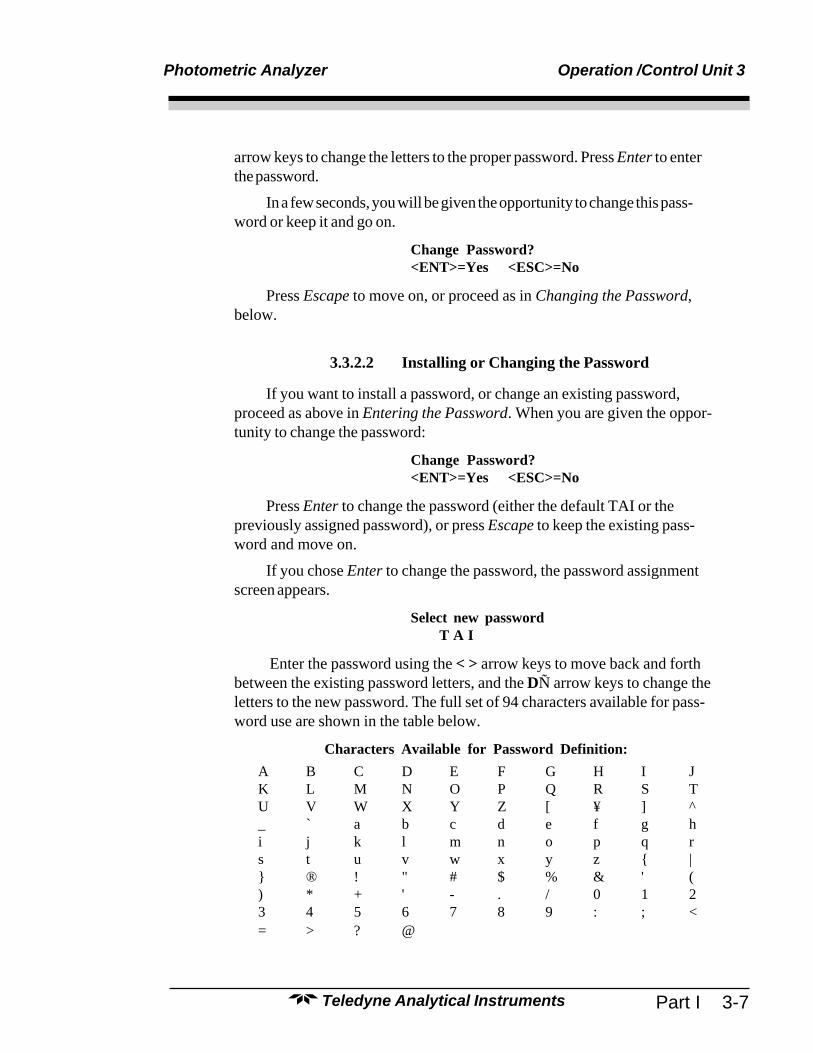
Enter the password using the < > arrow keys to move back and forthbetween the existing password letters, and the DÑ arrow keys to change theletters to the new password. The full set of 94 characters available for pass-word use are shown in the table below.
Characters Available for Password Definition:A B C D E F G H I JK L M N O P Q R S TU V W X Y Z [ ¥ ] ^_ ` a b c d e f g hi j k l m n o p q rs t u v w x y z { |} ® ! " # $ % & ' () * + ' - . / 0 1 23 4 5 6 7 8 9 : ; <= > ? @
3 Operation/Control Unit Model 5000B
3-8 Part I Teledyne Analytical Instruments
When you have finished typing the new password, press Enter. A verifica-tion screen appears. The screen will prompt you to retype your password forverification.
Enter PWD To Verify: A A A
Use the arrow keys to retype your password and press Enter whenfinished. Your password will be stored in the microprocessor and the systemwill immediately switch to the Analyze screen, and you now have access toall instrument functions.
If all alarms are defeated, the Analyze screen appears as:
1.95 ppm SO2nR1: Ø — 1Ø Anlz
If an alarm is tripped, the second line will change to show which alarmit is:
1.95 ppm SO2AL—1
NOTE: If you log off the system using the LOGOUT function in thesystem menu, you will now be required to re-enter the password togain access to Alarm, and Range functions.
3.3.3 Logging Out
The LOGOUT function provides a convenient means of leaving theanalyzer in a password protected mode without having to shut the instrumentoff. By entering LOGOUT, you effectively log off the instrument leavingthe system protected against use until the password is reentered. To log out,press the System button to enter the System function.
DIG_FILT SELF-TESTPWD LOGOUT MORE
Use the < > arrow keys to position the blinking over the LOGOUTfunction, and press Enter to Log out. The screen will display the message:
Protected untilpassword entered

Photometric Analyzer Operation /Control Unit 3
Part I 3-9Teledyne Analytical Instruments
3.3.4 System Self-Diagnostic Test
The Model 5000BF has a built-in self-diagnostic testing routine. Pre-programmed signals are sent through the power supply, output board,preamp board and sensor circuit. The return signal is analyzed, and at theend of the test the status of each function is displayed on the screen, either asOK or as a number between 1 and 1024. (See System Self Diagnostic Test inchapter 4 for number code.) If any of the functions fails, the System Alarm istripped.
Note: The sensor will always show failed unless Zero fluid is present inthe sampling cell at the time of the SELF-TEST.
The self diagnostics are run automatically by the analyzer whenever theinstrument is turned on, but the test can also be run by the operator at will.To initiate a self diagnostic test during operation:
Press the System button to start the System function.
DIG_FILT SELF-TESTPWD LOGOUT MORE
Use the < > arrow keys again to move the blinking to the SELF–TESTand press Enter. The screen will follow the running of the diagnostic.
RUNNING DIAGNOSTICTesting Preamp — Cell
When the testing is complete, the results are displayed.
Power: OK Analog: OKCell: 2 Preamp: 3
The module is functioning properly if it is followed by OK. A numberindicates a problem in a specific area of the instrument. Refer to Chapter 5Maintenance and Troubleshooting for number-code information. The resultsscreen alternates for a time with:
Press Any KeyTo Continue...
Then the analyzer returns to the initial System screen.

3 Operation/Control Unit Model 5000B
3-10 Part I Teledyne Analytical Instruments
3.3.5 The Model Screen
Move the < > arrow key to MORE and press Enter. With MODELblinking, press Enter. The screen displays the manufacturer, model, andsoftware version information.
3.3.6 Checking Linearity with ALGORITHM
From the System Function screen, select ALGORITHM, and press Enter.
sel rng to set algo:—> Ø1 Ø2 Ø3 <—
Use the < > keys to select the range: 01, 02, or 03. Then press Enter.
Fluid Use: SO2Range: Ø — 10%
Press Enter again.
Algorithm setup: VERIFY SET UP
Select and Enter VERIFY to check whether the linearization has beenaccomplished satisfactorily.
Dpt INPUT OUTPUT Ø Ø.ØØ Ø.ØØ
The leftmost digit (under Dpt) is the number of the data point beingmonitored. Use the DÑ keys to select the successive points.
The INPUT value is the input to the linearizer. It is the simulated outputof the analyzer. You do not need to actually flow fluid.
The OUTPUT value is the output of the linearizer. It should be theACTUAL concentration of the span fluid being simulated.
If the OUTPUT value shown is not correct, the linearization must becorrected. Press ESCAPE to return to the previous screen. Select and EnterSET UP to Calibration Mode screen. (set-up will not work without a PCbeing connected to the analyzer)
Select algorithm mode : AUTO
There are two ways to linearize: AUTO and MANUAL: The automode requires as many calibration fluides as there will be correction pointsalong the curve. The user decides on the number of points, based on the preci-sion required.
Photometric Analyzer Operation /Control Unit 3
Part I 3-11Teledyne Analytical Instruments
The manual mode only requires entering the values for each correctionpoint into the microprocessor via the front panel buttons. Again, the numberof points required is determined by the user.
3.3.7 Digital Filter Setup
The 5000BF has the option of decreasing or increasing the amountfiltering on the signal. This feature enhances the basic filtering done by theanalog circuits by setting the amount of digital filtering effected by themicroprocessing. To access the digital filter setup, you must:
1. Press the System key to start the System function
DIG_FILT SELF-TESTPWD LOGOUT MORE
2. DIG_FILT will flash, press the ENTER key,
Weight of digitalFilter: 9
3. The number on the second row will flash and can be set byusing the Up or Down arrow keys.
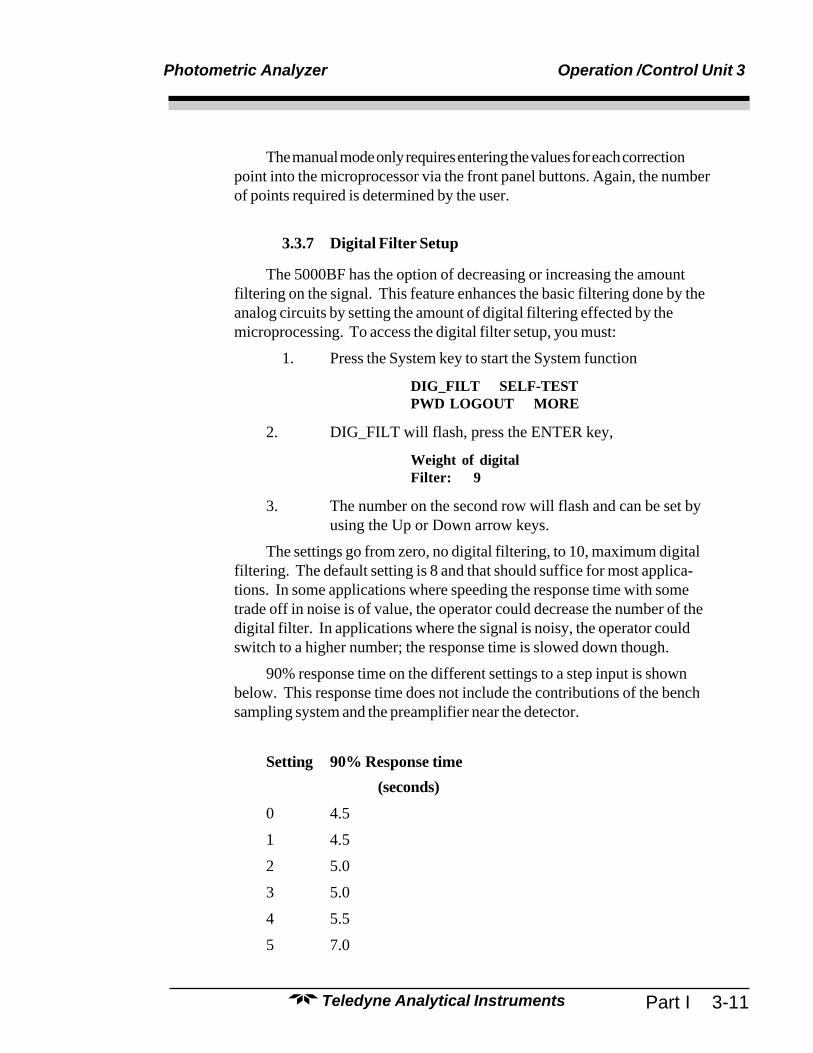
The settings go from zero, no digital filtering, to 10, maximum digitalfiltering. The default setting is 8 and that should suffice for most applica-tions. In some applications where speeding the response time with sometrade off in noise is of value, the operator could decrease the number of thedigital filter. In applications where the signal is noisy, the operator couldswitch to a higher number; the response time is slowed down though.
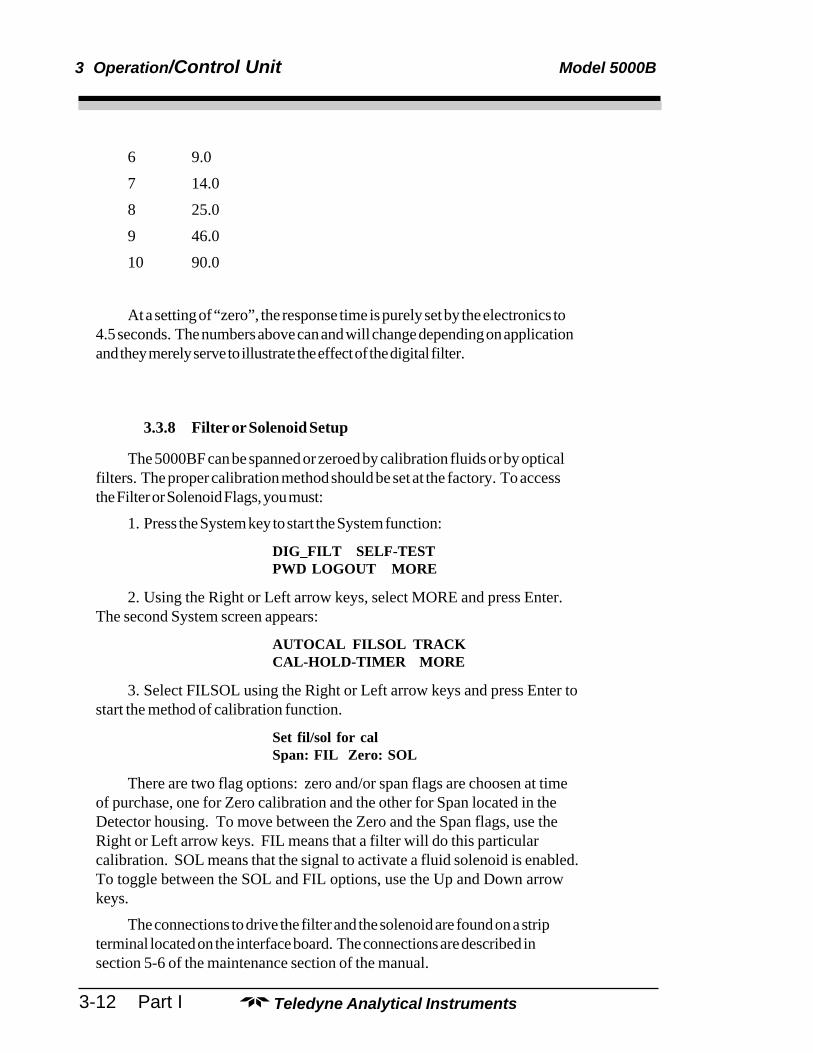
90% response time on the different settings to a step input is shownbelow. This response time does not include the contributions of the benchsampling system and the preamplifier near the detector.
Setting 90% Response time(seconds)
0 4.5
1 4.5
2 5.0
3 5.0
4 5.5
5 7.0
3 Operation/Control Unit Model 5000B
3-12 Part I Teledyne Analytical Instruments
6 9.0
7 14.0
8 25.0
9 46.0
10 90.0
At a setting of “zero”, the response time is purely set by the electronics to4.5 seconds. The numbers above can and will change depending on applicationand they merely serve to illustrate the effect of the digital filter.
3.3.8 Filter or Solenoid Setup
The 5000BF can be spanned or zeroed by calibration fluids or by opticalfilters. The proper calibration method should be set at the factory. To accessthe Filter or Solenoid Flags, you must:
1. Press the System key to start the System function:
DIG_FILT SELF-TESTPWD LOGOUT MORE
2. Using the Right or Left arrow keys, select MORE and press Enter.The second System screen appears:
AUTOCAL FILSOL TRACKCAL-HOLD-TIMER MORE
3. Select FILSOL using the Right or Left arrow keys and press Enter tostart the method of calibration function.
Set fil/sol for calSpan: FIL Zero: SOL
There are two flag options: zero and/or span flags are choosen at timeof purchase, one for Zero calibration and the other for Span located in theDetector housing. To move between the Zero and the Span flags, use theRight or Left arrow keys. FIL means that a filter will do this particularcalibration. SOL means that the signal to activate a fluid solenoid is enabled.To toggle between the SOL and FIL options, use the Up and Down arrowkeys.
The connections to drive the filter and the solenoid are found on a stripterminal located on the interface board. The connections are described insection 5-6 of the maintenance section of the manual.

Photometric Analyzer Operation /Control Unit 3
Part I 3-13Teledyne Analytical Instruments
3.3.9 Hold/Track Setup
The 5000BF has ability to disable the analog outputs and freeze the displaywhile undergoing a scheduled or remote calibration. The 5000BF will trackchanges in the concentration if calibration is started through the frontpanel. To setup this feature, the operator must:
1. Press the System key to start the System function:
DIG_FILT SELF-TESTPWD LOGOUT MORE
2. Using the Right or Left arrow keys, select MORE and pressEnter. The Second System screen appears:
AUTOCAL FILSOL TRACKCAL-HOLDER-TIMER MORE
or
AUTOCAL FILSOL HOLDCAL-HOLD-TIMER MORE
3. The option on the right of the first row can be set to TRACKor HOLD by using the UP or Down keys. By selecting the TRACK option,the analog outputs are enabled and with the display will track the concentra-tion changes while the instrument is undergoing scheduled or remote calibra-tion (either zero or span). By selecting the HOLD option, the analog outputsand display are disabled and will not track the concentration changes whilethe instrument is undergoing scheduled or remote calibration (either zero orspan). In the HOLD option, the analog outputs and display will freeze onthe last reading before entering calibration.
The analog outputs are both 0 to 1 volt outputs and both 4 to 20 mAoutputs.
3.3.10 Calibration/Hold Timer Setup
This Calibration Timer lets the operator adjust the time thee instrumentpurges the calibration fluid prior to actually start the calibration computa-tions. The Sample timer lets the operator adjust the time the instrumentpurges sample fluid after finishing a calibration before it lets the analog outputsand display track the change in concentration.

3 Operation/Control Unit Model 5000B
3-14 Part I Teledyne Analytical Instruments
This function and the TRACK/HOLD feature will prevent false alarmswhile performing remote or autoscheduled calibrations. These functions arenot applicable if the calibration is initiated through the front panel. To enterthe Calibration/Hold Timer function, you must:
1. Press the System key to start the System function:
DIG_FILT SELF-TESTPWD LOGOUT MORE
2. Using the Right or Left arrow keys, select MORE and pressEnter: The Second System screen appears:
AUTOCAL FILSOL TRACKCAL-HOLD-TIMER MORE
or
AUTOCAL FILSOL HOLDCAL-HOLD-TIMER MORE
3. Select with the Right or Left keys CAL-HOLD-TIMER, andpress the Enter key to access this function menu:
Calbrt hold: 3 min
Sample hold: 1 min
The calibration hold time is set on the first row, while the sample holdtime is set on the second row. To select one or the other, use the Right orLeft keys. To modify the time of either timer, use the Up or Down keys.The time is in the minutes.
3.3.11 Analog 4 to 20 mA Output Calibration
This function will let the operator calibrate the 4 to 20 mA analogoutput to match the display reading. A DMM configure as a DC ammeter isneeded. The DMM should be connected across the output terminals of the 4to 20 mA output to monitor the output current. To enter the 4 to 20 mAoutput adjust function, you must:
1. Press the System key to start the System function:
DIG_FILT SELF-TESTPWD LOGOUT MORE
2. Using the Right or Left arrow keys, select MORE and pressEnter. The second System screen appears:
AUTOCAL FILSOL TRACKCAL-HOLD-TIMER MORE

Photometric Analyzer Operation /Control Unit 3
Part I 3-15Teledyne Analytical Instruments
or
AUTOCAL FILSOL HOLDCAL-HOLD-TIMER MORE
3. Using the Right or the Left arrow keys, select MORE andpress Enter. The third System screen appears:
ALGORITHM APPLICATIONMODEL OUTPUT: 4 MA
or
ALGORITHM APPLICATIONMODEL OUTPUT: 20 MA
OUTPUT: 4 MA and OUTPUT: 20 MA can be toggled by moving onthat field and pressing the Up or Down key. 4 mA output should be calibrat-ed first and 20 mA output afterwards.
4. Select OUTPUT: 4 MA and press the Enter key
Use UP/DOWN arrow to
Adjust 4 ma: 250
The number on the second row is the setpoint of the 4 mA output. It isanalogous to a potentiometer wiper. The number can be set anywhere from0 to 500. The default is 250, in the middle. At the default setting, the outputshould be very close to 4 mA. If not, slowly adjust the number using the Upor the Down keys until DMM reads 4.00 mA. Press the Enter key whendone.
5. Now select OUTPUT: 20 MA and press the Enter key. Ascreen similar to the one above will appear and the DMM should read closeto 20 mA. If not, slowly adjust the number using the Up or Down key untilDMM reads 20.0 mA. Press the Enter key when done.
The range of adjustment is approximately +/- 10% of scale (+/- 1.6 ma).Since the 4 to 20 mA output is tied to the 0 to 1 volt output, this function canbe used to calibrate the 0 to 1 volt output, if the 4 to 20 mA output is notused. By using a digital Volt meter on the 0-1 Volt output.
3.3.12 Model
This selection in the System menu flashes for a few seconds the modelnumber and the software version installed in this instrument.
3 Operation/Control Unit Model 5000B
3-16 Part I Teledyne Analytical Instruments
3.3.13 Show Negative
The analyzer defaults to not to show negative readings on the analyze modeonly. This affects the analog outputs too by pressing the UP or DOWN key, theanalyzer can be set to display negative readings, on the SHOW_NEG field ofthe system menu.
3.4 The Zero and Span Functions
The Model 5000BF can have as many as three analysis ranges plus aspecial calibration range (Cal Range). Calibrating any one of the ranges willautomatically calibrate the other ranges.
CAUTION: Always allow 4-5 hours warm-up time before calibrating, ifyour analyzer has been disconnected from its power source.This does not apply if the analyzer was plugged in but was inSTANDBY.
The analyzer is calibrated using zero, and span fluides.
Note: Shut off the fluid pressure before connecting it to the analyzer, andbe sure to limit pressure to 40 psig or less when turning it back on.
Readjust the fluid pressure into the analyzer until the flowrate throughthe Sample Cell settles between 50 to 200 cc/min (approximately 0.1 to 0.4SCFH).
Note: Always keep the calibration fluid flow as close to the flowrate of thesample fluid as possible
3.4.1 Zero Cal
The Zero function on the menu is used to enter the zero calibrationfunction. Zero calibration can be performed in either the automatic or manualmode.
Make sure the zero fluid is flowing to the instrument. If you get aCELL CANNOT BE BALANCED message while zeroing skip to section4.4.1.3.
3.4.1.1 Auto Mode Zeroing
Observe the precautions in sections 4.4 and 4.4.1, above. Press Zero toenter the zero function mode. The screen allows you to select whether the
Photometric Analyzer Operation /Control Unit 3
Part I 3-17Teledyne Analytical Instruments
zero calibration is to be performed automatically or manually. Use the DÑarrow keys to toggle between AUTO and MAN zero settling. Stop whenAUTO appears, blinking, on the display.
Select zeromode: AUTO
Press Enter to begin zeroing.
####.## % SO2Slope=#.### C—Zero
The beginning zero level is shown in the upper left corner of the dis-play. As the zero reading settles, the screen displays and updates informationon Slope= in percent/second (unless the Slope starts within the acceptablezero range and does not need to settle further). The system first does a coarsezero, shown in the lower right corner of the screen as C—Zero, for 3 min, andthen does a fine zero, and displays F—Zero, for 3 min.
Then, and whenever Slope is less than 0.01 for at least 3 min, instead ofSlope you will see a countdown: 9 Left, 8 Left, and so fourth. These aresoftware steps in the zeroing process that the system must complete, AFTERsettling, before it can go back to Analyze. Software zero is indicated by S–Zero in the lower right corner.
####.## % SO24 Left=#.### S—Zero
The zeroing process will automatically conclude when the output iswithin the acceptable range for a good zero. Then the analyzer automaticallyreturns to the Analyze mode.
3.4.1.2 Manual Mode Zeroing
Press Zero to enter the Zero function. The screen that appears allowsyou to select between automatic or manual zero calibration. Use the DÑkeys to toggle between AUTO and MAN zero settling. Stop when MANU-AL appears, blinking, on the display.
Select zeromode: MANUAL
Press Enter to begin the zero calibration. After a few seconds the firstof three zeroing screens appears. The number in the upper left hand corner isthe first-stage zero offset. The microprocessor samples the output at a prede-termined rate.
3 Operation/Control Unit Model 5000B
3-18 Part I Teledyne Analytical Instruments
####.## % SO2Zero adj:2048 C—Zero
The analyzer goes through C–Zero, F–Zero, and S–Zero. During C–Zero and F–Zero, use the DÑ keys to adjust displayed Zero adj: value asclose as possible to zero. Then, press Enter.
S–Zero starts. During S–Zero, the Microcontroller takes control as inAuto Mode Zeroing, above. It calculates the differences between successivesamplings and displays the rate of change as Slope= a value in parts permillion per second (ppm/s).
####.## % SO2Slope=#.### S—Zero
Generally, you have a good zero when Slope is less than 0.05 ppm/s forabout 30 seconds.
Once zero settling completes, the information is stored in the analyzer’smemory, and the instrument automatically returns to the Analyze mode.
3.4.1.3 Cell Failure
Detector failure in the 5000BF is usually associated with inability tozero the instrument with a reasonable voltage differential between the refer-ence and measure voltages. If this should ever happen, the 5000BF systemalarm trips, and the LCD displays a failure message.
Detector cannot be balancedCheck your zero fluid
Before optical balancing:a. Check your zero fluid to make sure it is within specifications.b. Check for leaks downstream from the Sample Cell, where con-
tamination may be leaking into the system.c. Check flowmeter to ensure that the flow is no more than 200
SCCMd. Check temperature controller board.e. Check fluid temperature.f. Check the Sample Cell for dirty windows.
If none of the above, proceed to perform an optical balance as describedin section 5.
Photometric Analyzer Operation /Control Unit 3
Part I 3-19Teledyne Analytical Instruments
3.4.2 Span Cal
The Span function on the menu is used to span calibrate the analyzer. Spancalibration can be performed in either the automatic or manual mode.
Make sure the span fluid is flowing to the instrument.
3.4.2.1 Auto Mode Spanning
Observe all precautions in sections 3.4 and 3.4.2, above. Press Span toenter the span function. The screen that appears allows you to select whetherthe span calibration is to be performed automatically or manually. Use theDÑ arrow keys to toggle between AUTO and MAN span settling. Stopwhen AUTO appears, blinking, on the display.
Select spanmode: AUTO
Press Enter to move to the next screen.
Span Val: 2Ø.ØØ %<ENT> To begin span
Use the < > arrow keys to toggle between the span concentration valueand the units field (%/ppm). Use the DÑ arrow keys change the value and/or the units, as necessary. When you have set the concentration of the spanfluid you are using, press Enter to begin the Span calibration.
####.##% SO2Slope=#.### Span
The beginning span value is shown in the upper left corner of thedisplay. As the span reading settles, the screen displays and updates informa-tion on Slope. Spanning automatically ends when the span output corre-sponds, within tolerance, to the value of the span fluid concentration. Thenthe instrument automatically returns to the analyze mode.
3.4.2.2 Manual Mode Spanning
Press Span to start the Span function. The screen that appears allowsyou to select whether the span calibration is to be performed automatically ormanually.
Select spanmode: MANUAL
3 Operation/Control Unit Model 5000B
3-20 Part I Teledyne Analytical Instruments
Use the DÑ keys to toggle between AUTO and MAN span settling. Stopwhen MAN appears, blinking, on the display. Press Enter to move to the nextscreen.
Span Val: 2Ø.ØØ %<ENT> To begin span
Use the < > arrow keys to toggle between the span concentration valueand the units field (%/ppm). Use the DÑ arrow keys change the value and/or the units, as necessary. When you have set the concentration of the spanfluid you are using, press Enter to begin the Span calibration.
Press Enter to enter the span value into the system and begin the spancalibration.
Once the span has begun, the microprocessor samples the output at apredetermined rate. It calculates the difference between successive samplingsand displays this difference as Slope on the screen. It takes several secondsfor the first Slope value to display. Slope indicates rate of change of the Spanreading. It is a sensitive indicator of stability.
####.##% SO2Slope=#.### Span
When the Span value displayed on the screen is sufficiently stable,press Enter. (Generally, when the Span reading changes by 1 % or less ofthe range being calibrated for a period of ten minutes it is sufficiently stable.)Once Enter is pressed, the Span reading changes to the correct value. Theinstrument then automatically enters the Analyze function.
3.4.3 Offset Function
This software when installed in the 5000BF instruments provides a way toenter an offset on the zero operation of the analyser. This is useful when theinstrument is zeroed in some inert fluid such as Nitrogen or Argon, but thebackground fluid of the process is different. If the background fluid of theprocess is different than the zero calibration fluid being used, the reading willhave an offset that will be constant throughout its working range. Thus, theneed to provide an offset when the instrument is being zeroed.
How to access the offset function:
To access this function, the instrument zero mode must be entered bypushing the Zero key on the front panel of the control unit. The VFD displaywill show the following menu selection:
Photometric Analyzer Operation /Control Unit 3
Part I 3-21Teledyne Analytical Instruments
Select zeromode: AUTO
orSelect zeromode: MAN
Select whether you want the instrument to do an automatic or manual zero. Ifyou do an automatic zero, the instrument does the zero by itself. If you do amanual zero you must manually enter inputs to the instrument to accomplishthe zero, see in the corresponding section of the manual on how these twofunctions differ.When the Enter key is pressed, the following menu will appear:
Zero off: 0.0 ppm<ENT> to begin Zero
The offset value can be modified by using the Up/Down keys. Next sectionshows how to select this value. Suffice to say that whatever value you enter,will be automatically added to the reading. Thus, if you entered -0.1 ppm, atthe end of the zero the display will show -0.1 ppm.
Once the Enter key is pressed the instrument enters the zero mode. If youchose AUTO zero mode, the instrument will do the work of bringing thereading back to zero plus the offset value that was entered. If you choseMANual zero mode, then you must enter input to the instrument asexplained in the corresponding section of the manual but with onedifference: instead of bringing the display to read zero, you must make thedisplay read zero plus the value entered as offset.
How the offset value is selected:
To find out what the offset value should be, the intended zero calibrationfluid and the a mix of the process background fluid must be procured. Thisof course assumes that the zero fluid and the process background fluid arevery different and that an offset will occur.1. Let the intended zero calibration fluid flow through the 5000BF samplecell (this assumes that you have started up you system as recommended bythe manual or technical personnel) and do a zero on the instrument. Leavethe offset set to zero value.2. At the end of the zero function, make sure the analyser reads zero.3. Flow a zero level of the process background fluid mix through the5000BF sample cell on the Analyse mode. Wait for the reading to becomestable. Write the reading down. Change the sign of the reading: This is the

3 Operation/Control Unit Model 5000B
3-22 Part I Teledyne Analytical Instruments
offset to be entered.4. Do a manual run to check. Reintroduce the zero calibration fluid. Start azero on the analyser but this time enter the offset value.5. At the end of the zero function, check that the instrument reads the enteredoffset.6. Reintroduce the process background fluid mix to the 5000BF sample cellin the Analyse mode. It should read close to zero once the reading is stable(+/- 1% error of full scale).
Spanning the 5000BF:
Since the instrument might be spanned with background fluid the same asthe zero calibration fluid, the span value to be entered should be the spanconcentration plus the offset value (if the offset value has a minus sign thenalgebraically it becomes a subtraction).
3.5 The Alarms Function
The Model 5000BF is equipped with two fully adjustable set pointsconcentration with two alarms and a system failure alarm relay. Each alarmrelay has a set of form “C" contacts rated for 3 amperes resistive load at 250V ac. See Figure in Chapter 2, Installation and/or the Interconnection Dia-gram included at the back of this manual for relay terminal connections.
The system failure alarm has a fixed configuration described in chapter2 Installation.
The concentration alarms can be configured from the front panel aseither high or low alarms by the operator. The alarm modes can be set aslatching or non-latching, and either failsafe or non-failsafe, or, they can bedefeated altogether. The setpoints for the alarms are also established usingthis function.
Decide how your alarms should be configured. The choice will dependupon your process. Consider the following four points:
1. Which if any of the alarms are to be high alarms and which if anyare to be low alarms?Setting an alarm as HIGH triggers the alarm when thecontaminant concentration rises above the setpoint. Setting analarm as LOW triggers the alarm when the contaminantconcentration falls below the setpoint.Decide whether you want the alarms to be set as:
Photometric Analyzer Operation /Control Unit 3
Part I 3-23Teledyne Analytical Instruments
• Both high (high and high-high) alarms, or• One high and one low alarm, or• Both low (low and low-low) alarms.
2. Are either or both of the alarms to be configured as failsafe?In failsafe mode, the alarm relay de-energizes in an alarmcondition. For non-failsafe operation, the relay is energized in analarm condition. You can set either or both of the concentrationalarms to operate in failsafe or non-failsafe mode.
3. Are either of the alarms to be latching?In latching mode, once the alarm or alarms trigger, they willremain in the alarm mode even if process conditions revert backto non-alarm conditions. This mode requires an alarm to berecognized before it can be reset. In the non-latching mode, thealarm status will terminate when process conditions revert to non-alarm conditions.
4. Are either of the alarms to be defeated?The defeat alarm mode is incorporated into the alarm circuit sothat maintenance can be performed under conditions whichwould normally activate the alarms.The defeat function can also be used to reset a latched alarm.(See procedures, below.)
If you are using password protection, you will need to enter yourpassword to access the alarm functions. Follow the instructions in section3.3.3 to enter your password. Once you have clearance to proceed, enter theAlarm function.
Press the Alarm button on the front panel to enter the Alarm function.
Use the DÑ keys to choose between % or ppm units. Then press Enterto move to the next screen.
AL1: 1ØØØ ppm HIDft:N Fs:N Ltch:N
Five parameters can be changed on this screen:• Value of the alarm setpoint, AL1: ####• Out-of-range direction, HI or LO• Defeated? Dft:Y/N (Yes/No)• Failsafe? Fs:Y/N (Yes/No)

3 Operation/Control Unit Model 5000B
3-24 Part I Teledyne Analytical Instruments
• Latching? Ltch:Y/N (Yes/No).• To define the setpoint, use the < > arrow keys to move the blinking
over to AL1: ####. Then use the DÑ arrow keys to change thenumber. Holding down the key speeds up the incrementing ordecrementing.
• To set the other parameters use the < > arrow keys to move theblinking over to the desired parameter. Then use the DÑ arrowkeys to change the parameter.
• Once the parameters for alarm 1 have been set, press Alarmsagain, and repeat this procedure for alarm 2 (AL2).
• To reset a latched alarm, go to Dft– and then press either D twotimes or Ñ two times. (Toggle it to Y and then back to N.)
–OR –Go to Ltch– and then press either D two times or Ñ two times.(Toggle it to N and back to Y.)
3.6 The Range Select Function
The Range function allows you to manually select the concentrationrange of analysis (MANUAL), or to select automatic range switching(AUTO).
In the MANUAL screen, you are further allowed to define the high andlow (concentration) limits of each Range, and select a single, fixed range torun.
CAUTION: If this is a linearized application, the new range must bewithin the limits previously programmed using the Systemfunction, if linearization is to apply throughout the range.Furthermore, if the limits are too small a part (approx 10 %or less) of the originally linearized range, the linearizationwill be compromised.
3.6.1 Manual (Select/Define Range) Screen
The Manual range-switching mode allows you to select a single, fixedanalysis range. It then allows you to redefine the upper and lower limits, forthe range.
Press Range key to start the Range function.

Photometric Analyzer Operation /Control Unit 3
Part I 3-25Teledyne Analytical Instruments
Select rangemode: MANUAL
If above screen displays, use the DÑ arrow keys to Select MANUAL,and press Enter.
Select range to run—> Ø1 Ø2 Ø3 CAL<—
Use the < > keys to select the range: 01, 02, 03, or CAL. Then pressEnter.
Fluid use: SO2Range: Ø — 10 %
Use the < > keys to toggle between the Range: low-end field and theRange: high-end field. Use the DÑ keys to change the values of the fields.
Press Escape to return to the previous screen to select or define anotherrange.
Press Enter to return the to the Analyze function.
3.6.2 Auto Screen
Autoranging will automatically set to the application that has at leasttwo ranges setup with the same fluides.
In the autoranging mode, the microprocessor automatically responds toconcentration changes by switching ranges for optimum readout sensitivity.If the upper limit of the operating range is reached, the instrument automati-cally shifts to the next higher range. If the concentration falls to below 85%of full scale of the next lower range, the instrument switches to the lowerrange. A corresponding shift in the DC concentration output, and in therange ID outputs, will be noticed.
The autoranging feature can be overridden so that analog output stayson a fixed range regardless of the contaminant concentration detected. If theconcentration exceeds the upper limit of the range, the DC output willsaturate at 1 V dc (20 mA at the current output).
However, the digital readout and the RS-232 output of the concentra-tion are unaffected by the fixed range. They continue to read beyond the full-scale setting until amplifier saturation is reached. Below amplifier saturation,the overrange readings are accurate UNLESS the application uses lineariza-tion over the selected range.
3 Operation/Control Unit Model 5000B
3-26 Part I Teledyne Analytical Instruments
The concentration ranges can be redefined using the Range functionManual screen, and the application fluides can be redefined using the Systemfunction, if they are not already defined as necessary.
CAUTION: Redefining applications or ranges might require relineariza-tion and/or recalibration.
To setup automatic ranging:
Press Range key to start the Range function.
Select rangemode : AUTO
If above screen displays, use the DÑ arrow keys to Select AUTO, andpress Enter.
Press Escape to return to the previous Analyze Function.
3.6.3 Precautions
The Model 5000BF allows a great deal of flexibility in choosing rangesfor automatic range switching. However, there are some pitfalls that are to beavoided.
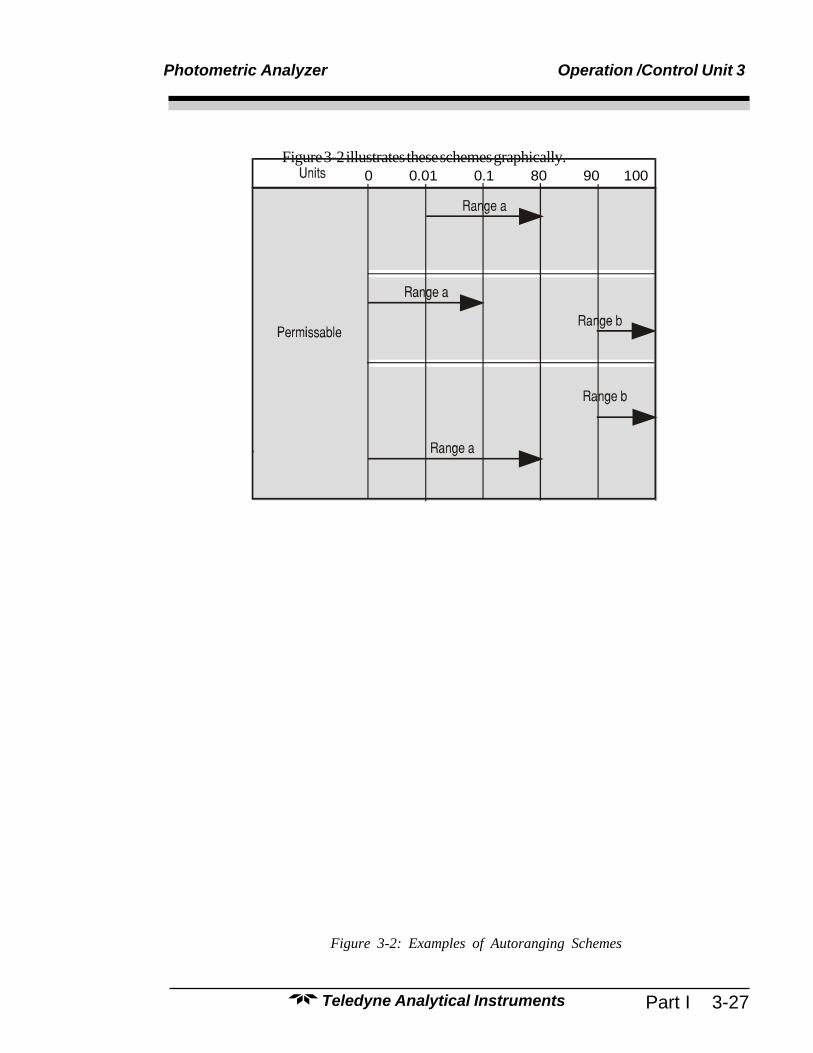
Ranges that work well together are:• Ranges that have the same lower limits but upper limits that differ
by approximately an order of magnitude• Ranges whose upper limits coincide with the lower limits of the
next higher range• Ranges where there is a gap between the upper limit of the range
and the lower limit of the next higher range.
Range schemes that are to be avoided include:• Ranges that overlap• Ranges whose limits are entirely within the span of an adjoining
range.• Ranges where the zero is suppressed, is 1-10, 1-100, etc,
however, 80-100, 90-100 is ok where the zero fluid is actually100% concentration and the calibration is inverted.
Photometric Analyzer Operation /Control Unit 3
Part I 3-27Teledyne Analytical Instruments
Figure 3-2 illustrates these schemes graphically.
Figure 3-2: Examples of Autoranging Schemes
0 0.01 0.1 80 90 100
3 Operation/Control Unit Model 5000B
3-28 Part I Teledyne Analytical Instruments
3.7 The Analyze Function
Normally, all of the functions automatically switch back to the Analyzefunction when they have completed their assigned operations. Pressing theEscape button in many cases also switches the analyzer back to the Analyzefunction. Alternatively, you can press the Analyze button at any time toreturn to analyzing your sample.
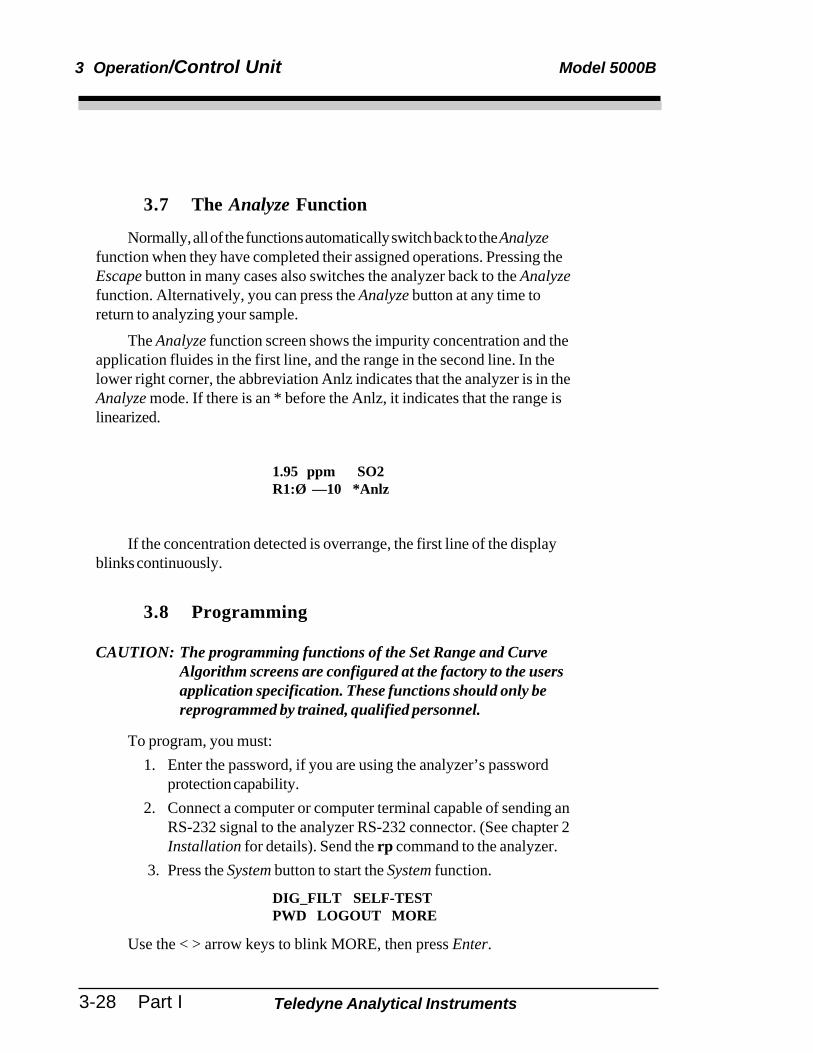
The Analyze function screen shows the impurity concentration and theapplication fluides in the first line, and the range in the second line. In thelower right corner, the abbreviation Anlz indicates that the analyzer is in theAnalyze mode. If there is an * before the Anlz, it indicates that the range islinearized.
1.95 ppm SO2R1:Ø —10 *Anlz
If the concentration detected is overrange, the first line of the displayblinks continuously.
3.8 Programming
CAUTION: The programming functions of the Set Range and CurveAlgorithm screens are configured at the factory to the usersapplication specification. These functions should only bereprogrammed by trained, qualified personnel.
To program, you must:1. Enter the password, if you are using the analyzer’s password
protection capability.2. Connect a computer or computer terminal capable of sending an
RS-232 signal to the analyzer RS-232 connector. (See chapter 2Installation for details). Send the rp command to the analyzer.
3. Press the System button to start the System function.
DIG_FILT SELF-TESTPWD LOGOUT MORE
Use the < > arrow keys to blink MORE, then press Enter.

Photometric Analyzer Operation /Control Unit 3
Part I 3-29Teledyne Analytical Instruments
AUTOCAL FILSOLL HOLD CAL-HOLD-TIMER MORE
Select MORE and press ENTER one more time
ALGORITHM APPLICATION MORE OUTPUT: 4MA
Now you will be able to select the APPLICATION and ALGO-RITHM set-up functions.
3.8.1 The Set Range Screen
The Set Range screen allows reprogramming of the three analysisranges and the calibration range (background fluid, low end of range, highend of range, and % or ppm units). Original programming is usually done atthe factory according to the customer’s application. It must be done throughthe RS-232 port using a computer running a terminal emulation program.
Note: It is important to distinguish between this System programmingsubfunction and the Range button function, which is an operatorcontrol. The Set Range Screen of the System function allows theuser to DEFINE the upper and lower limits of a range AND theapplication of the range. The Range button function only allows theuser to select or define the limits, or to select the application, butnot to define the application.
Normally the Model 5000BF is factory set to default to manual rangeselection, unless it is ordered as a single-application multiple-range unit (inwhich case it defaults to autoranging). In either case, autoranging or manualrange selection can be programmed by the user.
In the autoranging mode, the microprocessor automatically responds toconcentration changes by switching ranges for optimum readout sensitivity.If the upper limit of the operating range is reached, the instrument automati-cally shifts to the next higher range. If the concentration falls to below 85%of full scale of the next lower range, the instrument switches to the lowerrange. A corresponding shift in the DC concentration output, and in therange ID outputs, will be noticed.
The autoranging feature can be overridden so that analog output stayson a fixed range regardless of the contaminant concentration detected. If theconcentration exceeds the upper limit of the range, the DC output willsaturate at 1 V dc (20 mA at the current output).
However, the digital readout and the RS-232 output of the concentra-tion are unaffected by the fixed range. They continue to read beyond the full-
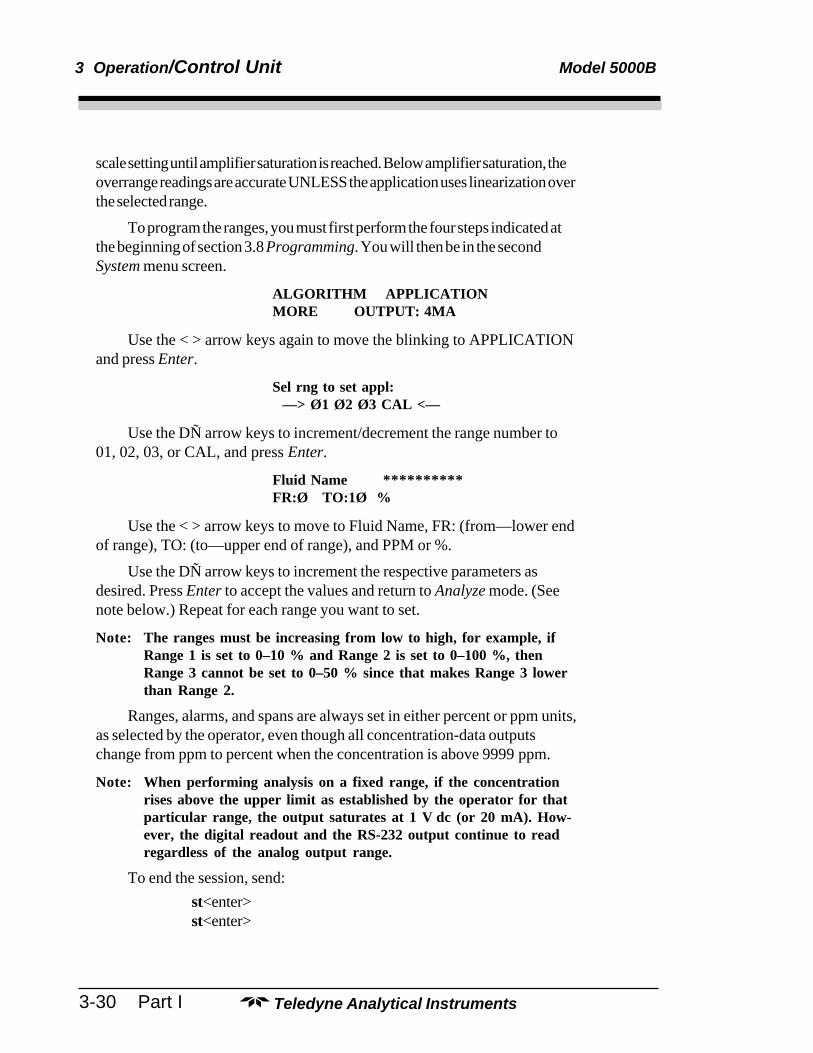
3 Operation/Control Unit Model 5000B
3-30 Part I Teledyne Analytical Instruments
scale setting until amplifier saturation is reached. Below amplifier saturation, theoverrange readings are accurate UNLESS the application uses linearization overthe selected range.
To program the ranges, you must first perform the four steps indicated atthe beginning of section 3.8 Programming. You will then be in the secondSystem menu screen.
ALGORITHM APPLICATIONMORE OUTPUT: 4MA
Use the < > arrow keys again to move the blinking to APPLICATIONand press Enter.
Sel rng to set appl: —> Ø1 Ø2 Ø3 CAL <—
Use the DÑ arrow keys to increment/decrement the range number to01, 02, 03, or CAL, and press Enter.
Fluid Name **********FR:Ø TO:1Ø %
Use the < > arrow keys to move to Fluid Name, FR: (from—lower endof range), TO: (to—upper end of range), and PPM or %.
Use the DÑ arrow keys to increment the respective parameters asdesired. Press Enter to accept the values and return to Analyze mode. (Seenote below.) Repeat for each range you want to set.
Note: The ranges must be increasing from low to high, for example, ifRange 1 is set to 0–10 % and Range 2 is set to 0–100 %, thenRange 3 cannot be set to 0–50 % since that makes Range 3 lowerthan Range 2.
Ranges, alarms, and spans are always set in either percent or ppm units,as selected by the operator, even though all concentration-data outputschange from ppm to percent when the concentration is above 9999 ppm.
Note: When performing analysis on a fixed range, if the concentrationrises above the upper limit as established by the operator for thatparticular range, the output saturates at 1 V dc (or 20 mA). How-ever, the digital readout and the RS-232 output continue to readregardless of the analog output range.
To end the session, send:st<enter>st<enter>
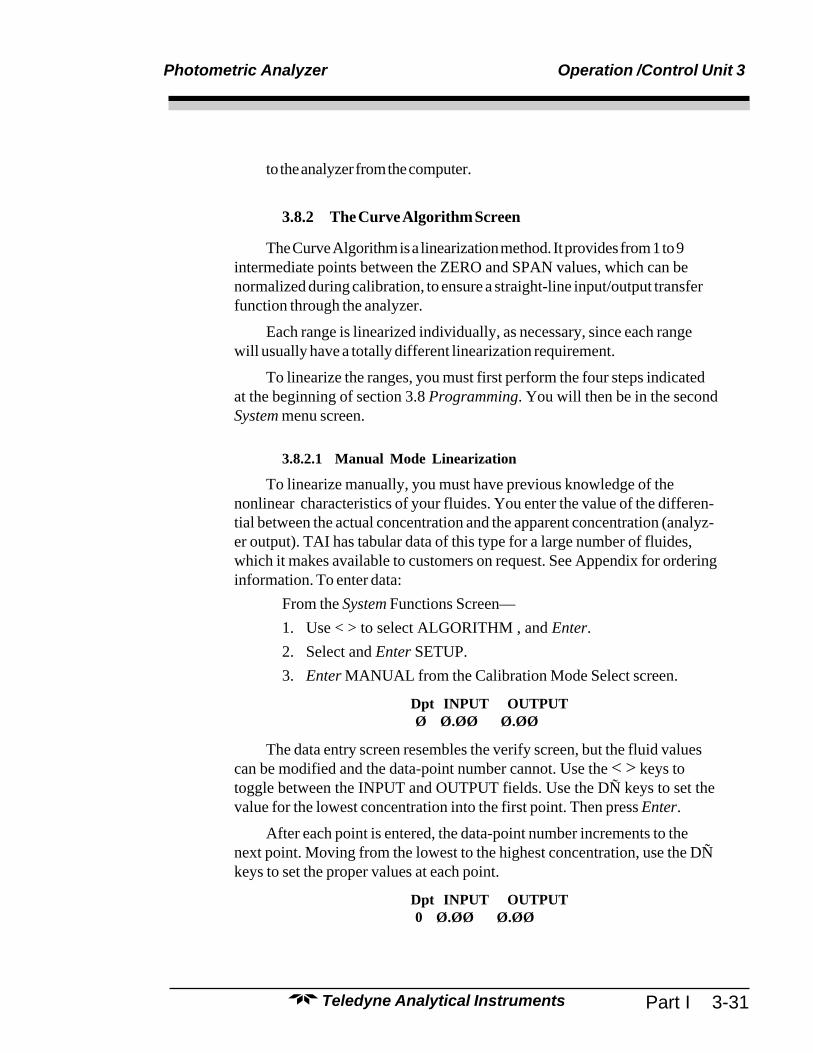
Photometric Analyzer Operation /Control Unit 3
Part I 3-31Teledyne Analytical Instruments
to the analyzer from the computer.
3.8.2 The Curve Algorithm Screen
The Curve Algorithm is a linearization method. It provides from 1 to 9intermediate points between the ZERO and SPAN values, which can benormalized during calibration, to ensure a straight-line input/output transferfunction through the analyzer.
Each range is linearized individually, as necessary, since each rangewill usually have a totally different linearization requirement.
To linearize the ranges, you must first perform the four steps indicatedat the beginning of section 3.8 Programming. You will then be in the secondSystem menu screen.
3.8.2.1 Manual Mode Linearization
To linearize manually, you must have previous knowledge of thenonlinear characteristics of your fluides. You enter the value of the differen-tial between the actual concentration and the apparent concentration (analyz-er output). TAI has tabular data of this type for a large number of fluides,which it makes available to customers on request. See Appendix for orderinginformation. To enter data:
From the System Functions Screen—1. Use < > to select ALGORITHM , and Enter.2. Select and Enter SETUP.3. Enter MANUAL from the Calibration Mode Select screen.
Dpt INPUT OUTPUT Ø Ø.ØØ Ø.ØØ
The data entry screen resembles the verify screen, but the fluid valuescan be modified and the data-point number cannot. Use the < > keys totoggle between the INPUT and OUTPUT fields. Use the DÑ keys to set thevalue for the lowest concentration into the first point. Then press Enter.
After each point is entered, the data-point number increments to thenext point. Moving from the lowest to the highest concentration, use the DÑkeys to set the proper values at each point.
Dpt INPUT OUTPUT 0 Ø.ØØ Ø.ØØ
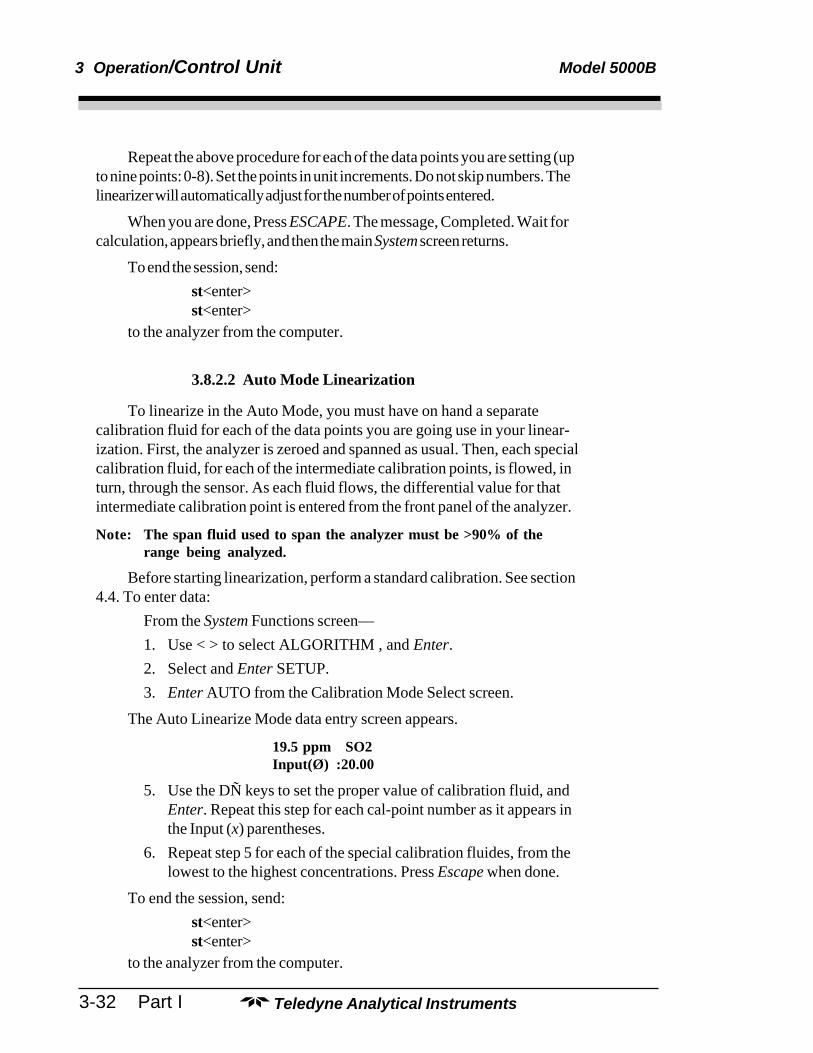
3 Operation/Control Unit Model 5000B
3-32 Part I Teledyne Analytical Instruments
Repeat the above procedure for each of the data points you are setting (upto nine points: 0-8). Set the points in unit increments. Do not skip numbers. Thelinearizer will automatically adjust for the number of points entered.
When you are done, Press ESCAPE. The message, Completed. Wait forcalculation, appears briefly, and then the main System screen returns.
To end the session, send:st<enter>st<enter>
to the analyzer from the computer.
3.8.2.2 Auto Mode Linearization
To linearize in the Auto Mode, you must have on hand a separatecalibration fluid for each of the data points you are going use in your linear-ization. First, the analyzer is zeroed and spanned as usual. Then, each specialcalibration fluid, for each of the intermediate calibration points, is flowed, inturn, through the sensor. As each fluid flows, the differential value for thatintermediate calibration point is entered from the front panel of the analyzer.
Note: The span fluid used to span the analyzer must be >90% of therange being analyzed.
Before starting linearization, perform a standard calibration. See section4.4. To enter data:
From the System Functions screen—1. Use < > to select ALGORITHM , and Enter.2. Select and Enter SETUP.3. Enter AUTO from the Calibration Mode Select screen.
The Auto Linearize Mode data entry screen appears.
19.5 ppm SO2Input(Ø) :20.00
5. Use the DÑ keys to set the proper value of calibration fluid, andEnter. Repeat this step for each cal-point number as it appears inthe Input (x) parentheses.
6. Repeat step 5 for each of the special calibration fluides, from thelowest to the highest concentrations. Press Escape when done.
To end the session, send:st<enter>st<enter>
to the analyzer from the computer.
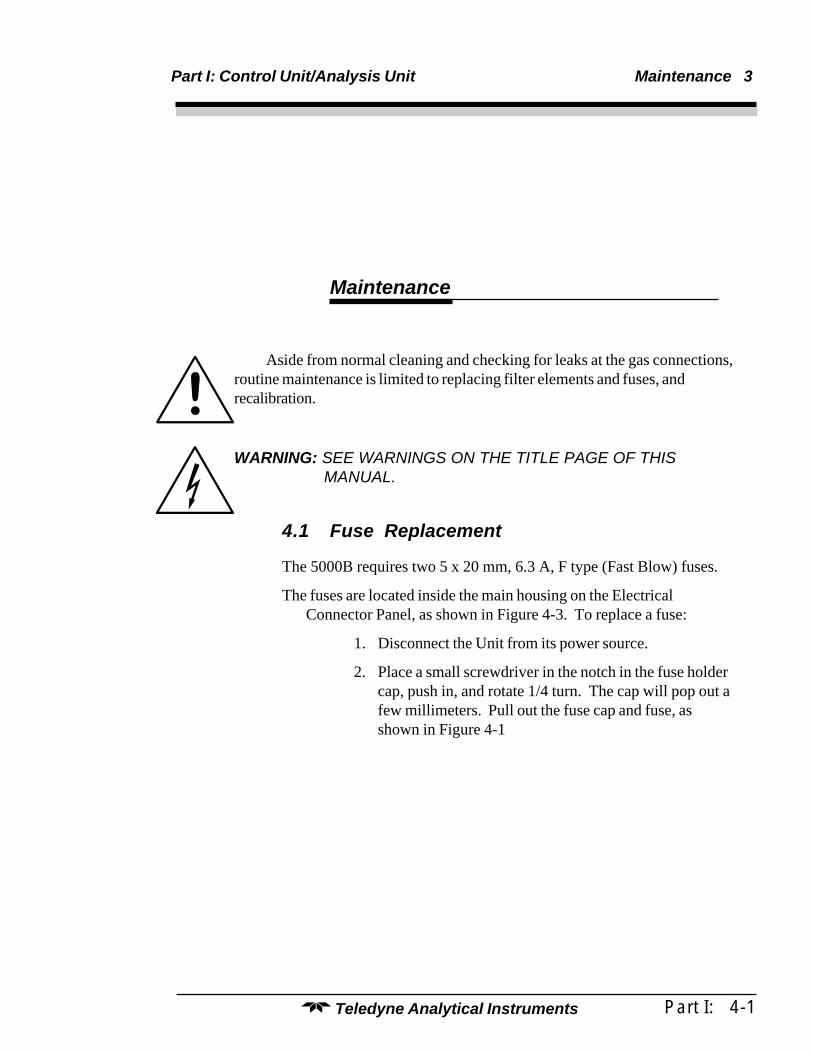
Part I: Control Unit/Analysis Unit Maintenance 3
Part I: 4-1Teledyne Analytical Instruments
Maintenance
Aside from normal cleaning and checking for leaks at the gas connections,routine maintenance is limited to replacing filter elements and fuses, andrecalibration.
WARNING: SEE WARNINGS ON THE TITLE PAGE OF THISMANUAL.
4.1 Fuse Replacement
The 5000B requires two 5 x 20 mm, 6.3 A, F type (Fast Blow) fuses.
The fuses are located inside the main housing on the ElectricalConnector Panel, as shown in Figure 4-3. To replace a fuse:
1. Disconnect the Unit from its power source.
2. Place a small screwdriver in the notch in the fuse holdercap, push in, and rotate 1/4 turn. The cap will pop out afew millimeters. Pull out the fuse cap and fuse, asshown in Figure 4-1
3 Maintenance Model 5000B Photometric Analyzer
4-2: Part I Teledyne Analytical Instruments
Figure 4-1: Removing Fuse Block Cap and Fuse from Housing
2. Replace fuse by reversing process in step 1.
4.2 System Self Diagnostic Test
NOTE: Always run self diagnostic with the intended zero fluid.
1. Press the System button to enter the system mode.
2. Use the < > arrow keys to move to More, and press Enter.
3. Use the < > arrow keys to move to Self-Test, and press Enter.
The following failure codes apply:
Table 4-1: Self Test Failure Codes
Power
0 OK1 5 V Failure2 15 V Failures3 Both Failed
Analog
0 OK1 DAC A (0–1 V Concentration)2 DAC B (0–1 V Range ID)3 Both Failed
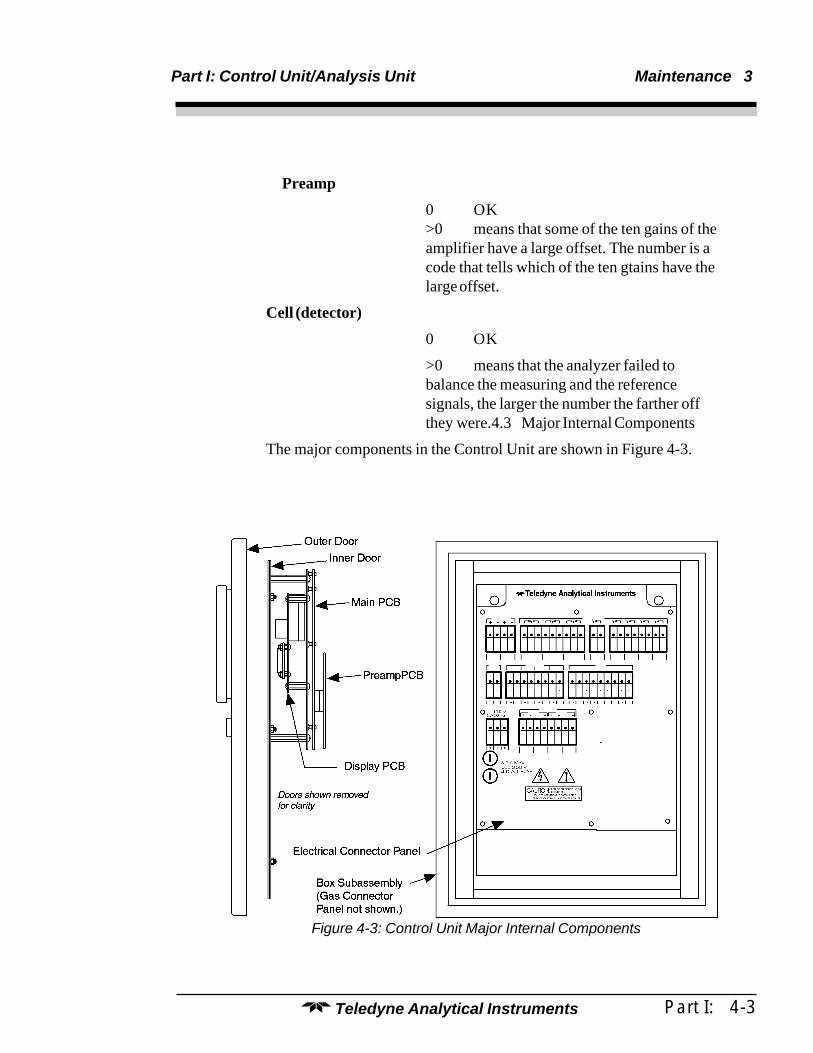
Part I: Control Unit/Analysis Unit Maintenance 3
Part I: 4-3Teledyne Analytical Instruments
Preamp
0 OK>0 means that some of the ten gains of theamplifier have a large offset. The number is acode that tells which of the ten gtains have thelarge offset.
Cell (detector)
0 OK
>0 means that the analyzer failed tobalance the measuring and the referencesignals, the larger the number the farther offthey were.4.3 Major Internal Components
The major components in the Control Unit are shown in Figure 4-3.
Figure 4-3: Control Unit Major Internal Components

3 Maintenance Model 5000B Photometric Analyzer
4-4: Part I Teledyne Analytical Instruments
WARNING: HAZARDOUS VOLTAGES EXIST ON CERTAINCOMPONENTS INTERNALLY WHICH MAY PERSISTFOR A TIME EVEN AFTER THE POWER IS TURNEDOFF AND DISCONNECTED.
The 5000B Control Units contain the following major components:• Power Supply• Motherboard (with Microprocessor, RS-232 chip, and
Preamplifier PCB)• Front Panel Display Board and Displays—
5 digit LED meter2 line, 20 character, alphanumeric, VFD display
See the drawings in the Drawings section or addendum in back ofthis manual for details.
Part II: i
Part II: Analysis Unit
Teledyne Analytical Instruments
OPERATING INSTRUCTIONS
Model 5000BPhotometric Analyzer
Part II: Analysis Unit
NEC or ATEX Type
5000B - GP, Rack, Panel (Integral or Remote)5000 - GP, Bulkhead (Z-Purged in Div II or Zone 2 areas)
I, II, B, C, D (Integral)5000B-(X-Purged, 1,1, B, C, D) (Integral)5000B-(Purged, Zone 1) (Integral)
ii: Part II
Model 5000B Photometric Analyzer
Teledyne Analytical Instruments
Table of Contents
4 Operational Theory
4.0 Operations ..................................................................... 4-14.1 Control Function ............................................................ 4-2
4.1.1 Analysis Section .................................................... 4-24.1.2 Explosion-Proof Version: Control Module .............. 4-2
4.2 Start Up.......................................................................... 4-34.2.1 Preliminary Inspection ........................................... 4-34.2.2 Pre-Start Up Electrical Checkout ........................... 4-44.2.3 Power On Observations ......................................... 4-4
4.3 Calibration ..................................................................... 4-64.4 Operational Theory Continued ....................................... 4-17
4.4.1 Source Module....................................................... 4-174.4.2 Sample Cell ........................................................... 4-194.4.3 Power ..................................................................... 4-224.4.4 Detector Compartment ........................................... 4-22
5 Routine Maintenance
5.0 Routine Maintenance ..................................................... 5-15.1 Automatic Operation and Routine Operational Duties ... 5-15.2 System Visual Check and Response Procedure ........... 5-15.3 Routine Maintenance ..................................................... 5-25.4 Suggested Preventive Maintenance Schedule .............. 5-25.5 Service Procedures and Adjustments ............................ 5-3
5.5.1 Electronics ............................................................. 5-35.5.2 Power Supply Test Points ....................................... 5-35.5.3 Setup of the Signal Processing Front-End Amplifier .. 5-35.5.4 Oscilloscope Display of the I to E Converter Output .. 5-45.5.5 Balancing the Optics for Equal Light Transmission
with Zero Fluid in the Sample Cell ......................... 5-55.5.6 Setup of the Logarithmic Amplifier ......................... 5-65.5.7 Inverting Amplifier .................................................. 5-65.5.8 Integrated Reference and Measuring Signals ........ 5-75.5.9 Battery-Powered Oscilloscope Synchronization Point 5-7
5.6 Interface Board Terminal Strip ........................................ 5-7
Part II: iii
Part II: Analysis Unit
Teledyne Analytical Instruments
Appendix
A-1 Specifications ................................................................ A-1A-2 Recommended 2-Year Spare Parts List ......................... A-4A-3 Drawing List ................................................................... A-5
iv: Part II
Model 5000B Photometric Analyzer
Teledyne Analytical Instruments
4–1
Operations/Analysis Unit 4
Teledyne Analytical InstrumentsA Business Unit of Teledyne Electronic Technologies
4.0 Operations
Before shipment, TAI calibrates the analyzer for your application whenfeasible. Calibration data is listed in the Appendix. Prior to calibration, TAIchecks the electronics of the analyzer and makes all of the necessary internalprinted circuit board adjustments. Calibration is performed to determine theproper or close proximity zero and span settings, and also to verify that theanalyzer response is linear.
After calibration, TAI makes a lengthy stability check to insure that theanalyzer performs within all specifications. We advise that you recalibrateyour equipment as part of start-up for the following reasons:
1. During shipment, it is possible that components have been jarredout of position or damaged.
2. Your process may be of a proprietary nature. Beyond checkingelectrical stability, TAI is unable to make a meaningful calibra-tion of the system, requiring these adjustments to be made byyou.
3. In other cases precise calibration from the original feasibility/proposal may have determined field calibration of the analyzerconnected to your process stream is required and accuracy willonly be obtainable upon representatiive matching and use of theactual process fluid background components at the operatingphysical conditions of flow, pressure and temperature of thesample.
In any case, it is important that you calibrate the analyzer when it is firstinstalled. Zero checks should be made routinely once or twice a week andspan calibration should be performed weekly, at first, and monthly afterreproducibility is assured.
4–2
4 Operations/Analysis Unit
Teledyne Analytical InstrumentsA Business Unit of Teledyne Electronic Technologies
4.1 Control Functions
4.1.1 Analysis Section, fully explosion proof, Z or Xpurged Nema enclosure or Cenelec Purged (pending).
The control functions for the analysis section are located on the Frontof the Enclosure module:
1. POWER ON/OFF: This function is hard wired into theenclosure for power to the control/analysis section.
2.a
X = (C-A)(1000)(B-A)
For example, if the range of analysis is 20-80%, and a desirable alarmsetpoint is 30%, then A = 20, B = 80, and C = 30
X = (30-20)(1000) = 167(80-20)
2.b RANGE: Control unit allows changing the range by somepredetermined amount, such as 4X or 5X; i.e., triple range: lowrange of 0-100 ppm, mid of 250ppm and a high range of 0-500ppm.
3. Mode: Programmable functions for incorporating an automaticzero, span or autoranging. Autocal also possible with fluids byvalving or by filter solenoid.. Consult control unit sections of themanual.
4. Digital displayt: indicates the concentration of the componentof interest. Consult control unit section for setting up units asppm, mg/l, %, etc.
4.1.2 Explosion-Proof Version: Control Module
When the control module is integral with the analysis section (single explo-sion-proof enclosure), it has all of the same control functions as the GeneralPurpose control module, however, the buttons are replaced by two switches.These switches have different movements to achieve the same functionality as the4 button model. (Consult factory or assure the manual has the correct version ofthe front panel control switches and functions.
4–3
Operations/Analysis Unit 4
Teledyne Analytical InstrumentsA Business Unit of Teledyne Electronic Technologies
The control unit digital display must handle functions for both the analysissection and the control module.
4.2 Start-p
Information contained in this paragraph is based on the premise that theanalyzer has been properly installed and that it is in operable condition. Ifdifficulties arise during start-up, it is probable that some form of damage hasincurred during shipment or some installation error has inadvertently been made.
Accessory test equipment is not necessary for start-up of the 5000B..However, if the analyzer malfunctions at start-up, an oscilloscope and amultimeter will be required for troubleshooting . TAI recommends that a dualtrace oscilloscope be used. A dual trace oscilloscope will permit the operator tosee two different waveforms simultaneously.
4.2.1 Preliminary Inspection
Before power is supplied to the analyzer, all modules should be openedand inspected for damage or loose components. Plug-in circuit cards shouldbe firmly seated in their sockets. All barrier strip wiring connections must beinspected, and user-installed wiring between units verified as being in agree-ment with the system interconnection diagram.
Control SettingsPrior to turning on the power, the controls on and within the control
module should be positioned as follows:
Analyzers not equipped with Auto Zero1. ON/OFF functionality hardwired at customers remote terminal
block or power switch.
2. SPAN control preset to the setting noted in Specific ApplicationData in the Appendix.
Analyzers equipped with Auto Zero1. ON/OFF functionality hardwired at customers remote terminal
block or power switch.
2. SAMPLE/ZERO switch on ZERO.
3. SPAN control preset to the setting noted in Specific ApplicationData in the Appendix.
4–4
4 Operations/Analysis Unit
Teledyne Analytical InstrumentsA Business Unit of Teledyne Electronic Technologies
4.2.2 Pre-Start-up Electrical Checkout
After the preliminary procedures have been accomplished (refer to Prelimi-nary Inspection and Control Settings, above), the integrity of the system inter-connection and the power sources must be verified before attempting the analyti-cal start-up procedures.
The observations and measurements described in the following paragraphsare vital to the operation of the analyzer. If the analyzer does not respond asdescribed, the equipment has been damaged in shipment or installation, or theuser-installed wiring is in error. If a problem arises, correct it before proceedingfurther.
The following procedures should be employed in the same sequence inwhich they appear.
4.2.3 Power On Observations
Turn both the analysis/control module at the remote wiring panel ofcustomer to ON and make the following observations:
1. Open the control/analysis section detector module and verify thatthe chopper motor is operating. Open the cover of thecompartment and verify motion. The motor should start turningthe instant power is established. If it does not, check the integrityof the main fuse on the control module door. If the fuse is blown,re-check the power service connections on TS2 in the controlmodule, and the control module to analysis sectioninterconnection wiring (refer to Electrical Installation in Chapter3.0: Installation, and dwg. _________).
2. The lamp source should light the instant power is established.Open the enclosure door and view the source module to verifyillumination.
WARNING: 1. The light intensity from the Mini IR lamp or quartz iodine lampIf used is intense and should not be looked at directly withoutspecial protective eyewear. Protective goggles with shadedlenses (Fed. Spec. #5) should be worn if it is necessary to lookdirectly at the source.2. Before opening any of the enclosure covers with the power on,make certain that the area has been classified as safe to do so.
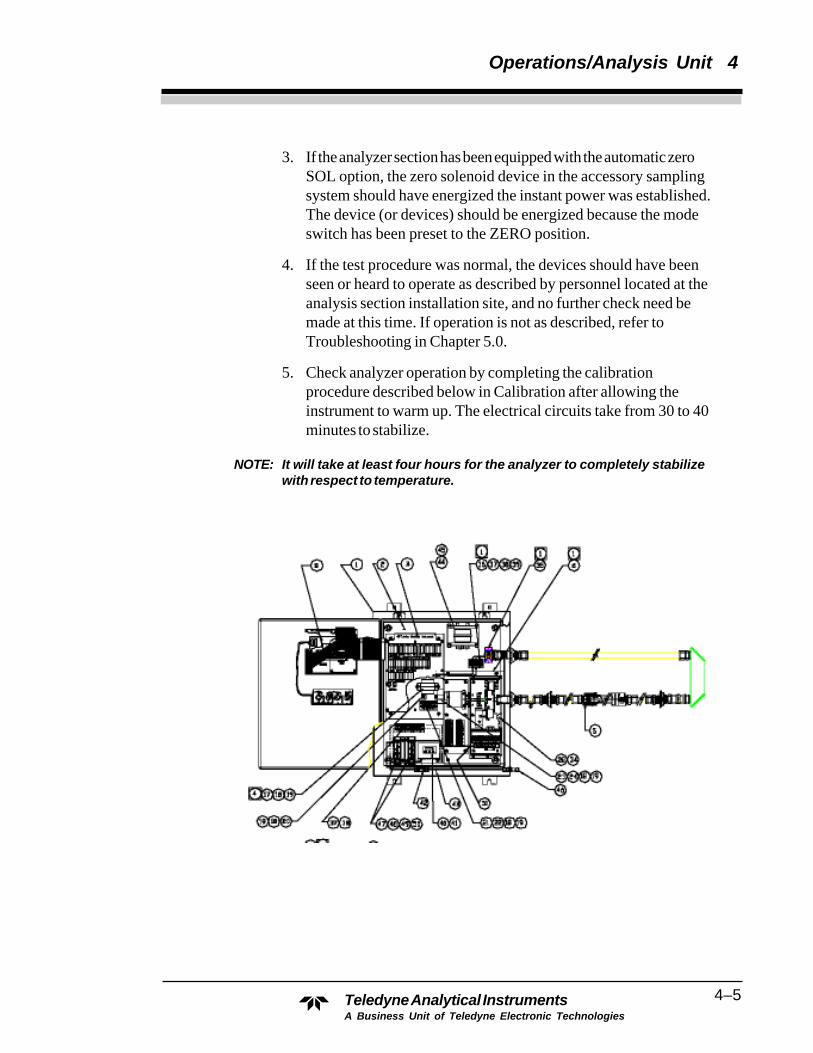
4–5
Operations/Analysis Unit 4
Teledyne Analytical InstrumentsA Business Unit of Teledyne Electronic Technologies
3. If the analyzer section has been equipped with the automatic zeroSOL option, the zero solenoid device in the accessory samplingsystem should have energized the instant power was established.The device (or devices) should be energized because the modeswitch has been preset to the ZERO position.
4. If the test procedure was normal, the devices should have beenseen or heard to operate as described by personnel located at theanalysis section installation site, and no further check need bemade at this time. If operation is not as described, refer toTroubleshooting in Chapter 5.0.
5. Check analyzer operation by completing the calibrationprocedure described below in Calibration after allowing theinstrument to warm up. The electrical circuits take from 30 to 40minutes to stabilize.
NOTE: It will take at least four hours for the analyzer to completely stabilizewith respect to temperature.

4–6
4 Operations/Analysis Unit
Teledyne Analytical InstrumentsA Business Unit of Teledyne Electronic Technologies
4.3 Calibration
Standardization FluidsTwo standardization fluids are necessary to calibrate the analyzer:
1. Zero Fluid: The zero standard fluid must have a composition similarto the sample, and ideally, contains none of the components ofinterest. The zero fluid should be laboratory analyzed to determine itscomposition. The exact composition must be known, as theaccuracy of the analysis can be no better than the knowledge of thestandardization fluid.
2. Span Fluid: The span fluid must be representative of the sample fluidin composition (like the zero fluid), and contain a measured quantityof the component of interest. The component of interest content ofthe fluid should be in the region of 75% to 100% of the range ofmeasurement. As with the zero fluid, the accuracy of the system isdependent upon the your knowledge of the span fluid composition.Ideally, the span sample should contain at least 75% of whatever theinstrument is set up to analyze.
Procedure1. Introduce zero fluid (see above) into the sample cell. Flow liquid
samples into the cell at a flow rate of about 50 cc/minute to allowthe sample to completely flush to a steady state concentration.Make certain that bubbles are not introduced or formed in thecell. (Some back-pressure may help avoid this.) Gas samples canbe introduced at about 200-500 cc/minute.
2. The digital meter should be capable of adjusting the zero level toan on scale reading. Consult section for zero functioning. If thereading cannot be adjusted then the signals will requirerebalancing for your particular process fluid. The filter wheellocated inside the detector module must be removed and balancedoptically with screens. See section:___________
b. If the measuring peak is so far out of balance with thereference peak that1 it can no longer be adjusted withpotentiometer R3, the optical filters require re-screening.If the analyzer has been in use for some time, it is possiblethat the sample cell windows need cleaning or that a filterhas deteriorated.Another cause of peak imbalance might be that the sample
4–7
Operations/Analysis Unit 4
Teledyne Analytical InstrumentsA Business Unit of Teledyne Electronic Technologies
chemical background has changed. In some cases, TAI isnot able to duplicate the background your sample forpurposes of optically balancing the analyzer before shipment.In these cases, it is necessary for you to screen for anapproximate balance, and to then electronically adjust R3 forprecise balance. To do so:1. Reset R3 to its midpoint.2. Re-screen the filter wheel, as necessary, to obtain ameasuring voltage within 10% of the reference voltage.Every time a screen is added or removed from a filter, theanalyzer must be turned off, and the filter wheel removedfrom the analyzer. When the filter wheel is replaced in theanalyzer, its rotational position is not critical, but thewhite backing must face in the direction of the positionsensor. The filter wheel must also be securely tightened,so that no slippage or vibration can occur. See Figure 5-1.
NOTE: Refer to Figure 5-1 when installing filter screens. Screens should beinstalled in the filter disk cup, under the filter holder. Also, if a bal-ance ring is used, it should be placed over the screen.
c. After screening to bring the measuring voltage to within10% of the reference voltage, adjust R3 as in step a aboveto make the measuring peak voltage read the same as thereference peak voltage.
5. Turn the NORM/ZERO switch to ZERO. The analysis sectionmeter should be made to read zero by adjusting the coarse ZEROcontrol on the analysis section power module.
6. Check the control module SPAN setting to make sure it agreeswith the calibration results obtained by TAI (see SpecificApplication Data in the Appendix).
7. Adjust the ZERO control on the control module to give a zeroreading on the control module meter.
8. Add span fluid (see Span Fluid, above) to the sample cell. Makecertain that all of the zero fluid is displaced.
9. Adjust the control module SPAN control to obtain the correctmeter reading with reference to the concentration of span fluid.For example, if the sample contains 100% of whatever the
4–8
4 Operations/Analysis Unit
Teledyne Analytical InstrumentsA Business Unit of Teledyne Electronic Technologies
instrument is set up to analyze, then the SPAN control must beadjusted for a full scale reading, i. e., 200 ppm water in EDC.
10. Re-check the ZERO setting with zero fluid.
11. If desired, the linearity of the analyzer can be checked with a fluidintermediate in concentration between the zero and the span fluid.
12. The analyzer is now calibrated. It is often desirable to checkcalibration (fine tune) on a dynamic sample from your process,double checking the 5020 analyzer response with laboratoryanalyzed grab samples. This is desirable where there is apossibility that your sample stream may have some backgroundmaterials not in the makeup of the calibration fluid.
13. From time to time, re-check the zero setting. If it is found thatthere is no zero drift, re-checking the zero setting may becomeunnecessary or may be performed only on an occasional basis.
14. Some optical filters used in some applications will be sotemperature sensitive that screening must be performed with thefilters near the operating temperature.
DIRECTIONS FOR USING TELEDYNE CALIBRATION OPTIONSFOR ON-LINE PROCESS PHOTOMETRIC ANALYZERS
I GeneralThese calibration options consists of procedures for calibrating analyzerson-line. These techniques are offered when process conditions (highpressures, temperatures, sample phase changes) are extremely difficult todeal with and calibration standards are impossible, difficult to obtain, aretoo expensive to use due to volume consumption into the system, areunstable, or are difficult to introduce into the analyzer or sample systembecause of toxicity, pressure, etc. Also many times the sample streamcomposition is difficult to match with a calibration fluid.
In one case an optical absorbing filter(s) is inserted into the light pathof the analyzer. The absorber is actuated by a switch(s) located onthe readout panel of the control unit. The option functions by pre-senting a calibrated and reproducible absorbance or fluid into the lightpath of the analyzer.
4–9
Operations/Analysis Unit 4
Teledyne Analytical InstrumentsA Business Unit of Teledyne Electronic Technologies
A zero may be established with a reproducible simulated (offset)zero absorbance fluid in the sample cell of the analyzer. Whenpossible this fluid should be stable for H2O content and shouldapproximate the process being measured to minimize the offsetzeroing, otherwise, dry air or nitrogen can be used. The analyzermust first be calibrated for sensitivity full scale by using knowncertified/analyzed samples containing the component (analyte(s) to bemeasured.
NOTES:These samples (low/mid/high about 1 liter each) must beprepared and provided for introduction into the zero and/orspan port of the sample system, with outlet collected from thecal return port of the sample system. A 500 to l liter glasssyringe with Luor-loc to 1/4" tube connections should be usedfor introducing the samples into the analyzer sample cell forzero and span cal adjustments. These are introduced throughthe calibration ports usually labelled zero or span fluid inlets.The exiting samples when nontoxic are usually collected inwaste containers from the cal-return port of the instrumentcabinet. These cannot be used again as water vapor fromcontainers and atmosphere will contaminate them. They wouldrequire analysis again before reintroducing for correlationpurposes. Also, its is a good practice to flush copiously thesampling train with each calibration sample prior to acceptingany read value. Each sample should be allowed to stabilizebefore reading. When a N2 flush is used to dry the samplingtrain before each sample is read, the readings will come toequilibrium faster since no water cross-contamination shouldbe evident or occur.
11 IF CALIBRATION PROCESS REPRESENTATIVE SAMPLESCANNOT BE OBTAINED,THEN A DIRECT ON-LINE TWO-POINT CALIBRATION APPROACHCAN BE USED AS FOLLOWS:
Assuming customer has designed in a sampling valve (thisvalve may contain a chromatographic septum port for a needle,i.e., for toxic or flammable samples at low pressure), hookupfor a sampling bomb (high pressure), grab sample port, orsealed container to draw off representative process grabsamples. Note: All samples are brought to the analytical labfor speedy analyses (preferably analyzed within 15 minutes) tocorrelate to process conditions. The sample analyzed shouldbe by an analytical method with an acceptable precision andaccuracy as used to normally monitor the process and confirmthe on-line analysis. The on-line analyzer is only as accurate
4–10
4 Operations/Analysis Unit
Teledyne Analytical InstrumentsA Business Unit of Teledyne Electronic Technologies
as the off-line method used to verify the process variables.
Below is an example of an on-line calibration when measuring0-200ppm water in liquid TDI (assumes TDI is a toxic liquid atstandard temperature and pressure conditions).
The first sample should be taken when the analyte (H20)concentration is known to be low (approximately O-.002 %water). The sample is quickly withdrawn and analyzed in thelab to determine the water content via an acceptable labmethod (This may be Karl Fischer titration, gas chromatogra-phy, IR spectroscopy or volume extraction/distillation, etc.). Atthis time, the instrument zero is made to read exactly zero onthe output of the analyzer (i.e., on the % or PPM of the panel/digital meter, 4-20 ma current, or 0-1 VDC etc.) using the zeropotentiometer of the analyzer or the digital or microprocessorszeroing calibration adjustment, Record the lab value, ana-lyzed corresponding to the zero set-point adjustment.
A second sample from the process must be grabbed after asteady state upscale reading has been reached. Hopefully, atthis time, the customer can make a minor changes in theprocess to cause a slight upscale reading (1 0-30% of the fullscale or more if possible) in order to obtain a steady-statereading at another concentration level. It this is not possible,then an appropriate time interval must occur when the processnaturally changes to an upscale steady-state level concentra-tion. At this time the second calibration sample is grabbed andimmediately analyzed. Record this value, This higher concen-tration value is subtracted from the first sample analyzed, Itsdifference value1 defines the slope of the calibrationcurve.
value1- This value will be used to determine the calibrationslope of the instrument range.
Using the span adjustment of the analyzer, set the output reading to agreewith this difference in concentration. Once the slope is set, adjust the zeroof the instrument to agree with the true concentration to that of the analyzedsteady-state sample presently flowing through the instrument cell. Now theanalyzer is calibrated to the process fluid.
Zero calibration using secondary standard zero and span flag(s)
AFTER the analyzer has been calibrated on the process fluid, a simulationof this process on-line calibration can be made using internal synthetic
4–11
Operations/Analysis Unit 4
Teledyne Analytical InstrumentsA Business Unit of Teledyne Electronic Technologies
optical filters. These optical filters are stable and are chosen to indicate themeasured component at the required instrument wavelengths. Therefore,future, faster, yet much simpler calibration zero and span checks can bemade without the unnecessary tedious on-line calibration described abovenor the consumption of expensive calibration fluids which may be difficult tohandle or obtain, are unstable, or toxic in nature.
A Fitter(s) at the factory is chosen and installed in the instrument (approxi-mating in absorbance value to the anticipated stream composition back-ground) to give reproducible zero/ span value when nitrogen or air back-ground is in the measuring cell. This capability is possible when the zerooffset between the process fluid and dry air or nitrogen remains close to thezero point of the actual process fluid (i.e., after calibration, the zero off-setcan be adjusted over the entire range of the meter, plus or minus 100 %from zero). In the case of the calibration zero check value, the requirementfor installing a zero optical flag with dry nitrogen as the background fluiddepends upon how unbalanced the reference and measure channel peakheights are with respect to each other as measured using an oscilloscope atTest Point 1 (TP1 -Violet)) of the AGC- board designated B-1 4521-4. Agood ratio (ref/meas.) estimate to keep within is (1 volt minimum: 2 voltmaximum) to (2 volt maximum: 1 volt minimum) between the zero processfluid signal levels and the nitrogen calibration fluid background signal levels.With the process fluid in the cell at the zero point of the calibration range,the reference and measure pulses are optically balanced using densityscreens placed over the reference and/or measure filters. These signals arebalanced to 9 volts each as measured at TP4 (ref-orange) and TP3 (meas-yellow) on the PEAK LEVEL DETECTOR BOARD designated B- 14074-A. The spectral background absorbance at the reference versus measurewavelengths of the process fluid determines the magnitude of the unbal-anced ref/meas ratio. This ratio is kept within the 1:2 to 2:1 values forproper operation of the AGC circuitry and therefore proper stability andsignal/noise levels of the instrument output. After balancing on a zerosample of the process fluid, if the ratio is not found to be within the 1:2 to 2:1range, a zero flag is necessary and installed in the sample cell compartmentalong with a span flag if ordered. This zero flag when chosen is alsosolenoid actuated to bring the ratio within the 1:2 to 2:1 range betweenprocess zero fluid and zero nitrogen or dry air background. The span flag isactuated while the zero offset level (usually when nitrogen is used as a zerocalibration fluid) is switched in.
Zero calibration check after process on-line calibration.
To check zero on the analyzer, immediately back-flush out the process fluidand dry the cell out with a reproducible zero fluid that should never containany of the analyte. (This is usually done with N2 assuming the process fluidhas low vapor pressure and can be purged dry in an acceptable short time

4–12
4 Operations/Analysis Unit
Teledyne Analytical InstrumentsA Business Unit of Teledyne Electronic Technologies
period). In this case, nitrogen or dry air (typically-100OF dewpoint or 2ppmwater) can be used. Manually switch in the zero offset check from thecontrol unit to operate the zero solenoid flag (depending upon the application,this may or may not simultaneously insert a zero flag into the light path;indeed, 90% of the time it is not needed). The factory zero offset valuewas set from its best determined factory calibration and was approximatelyset between 10-20% of the full scale range for the zero. After the field on-line calibration, a zero offset value around a 10-20% meter range should beset, using the potentiometer adjustment located within the analyzer controlunit to bring it into the 10-20% range. This may require a short termarea declassification (on explosion proof units) in order to make this adjust-ment.
The zero offset adjustment potentiometer is panel-mount locatedwithin the control unit. The potentiometer identified (zero- offset) isadjusted while the reproducible zero fluid background is in the samplecell. (This zero check may be automatically or manually operateddepending upon the sample system and electronic instrument design).RECORD the zero calibration reading for future reference andagreement checks of the zero stability.Note the instrument zero reading should typically be between 10-20%of full scale calibrated range (chosen at the factory), This readingshould always repeat on nitrogen with the zero offset and/orflag introduced. If not, readjust the instrument fine or coarse zeropotentiometer (s) or microprocessor/computer etc., to read thecorrect concentration value known (determined after the original on-line process calibration).
Span calibration check after performing a process on-line calibration.After zero calibration above.
To check span on the analyzer, immediately back-flush out theprocess fluid and dry the cell with a reproducible zero fluid that doesnot contain any of the analyte. In this case, nitrogen or dry air(typically -75 ‘C dew point or less than 1 PPM water) should beused. Manually introduce the span flag from the readout control unitto operate the solenoid containing the appropriate span filter into thelight path of the analyzer (this may be automatically or manuallyoperated depending upon the sample system and electronic instru-ment design). RECORD the span calibration reading for futurecalibration reference of the span sensitivity agreement. The filterspan flag is chosen at the factory to represent an upscale reading oftypically between 60-90% of the full scale range.
NOTE: The zero or span flag readings should always repeat if theanalyzer remains in calibration. Any drift in the zero or span can
4–13
Operations/Analysis Unit 4
Teledyne Analytical InstrumentsA Business Unit of Teledyne Electronic Technologies
always be corrected using the calibration zero and/or span features.
SUMMARYThe zero and/or span calibration of 5000 series photometric Teledyne analyzers can bequickly verified manually by using Zero and/or calibration zero offsets and/or span flags.
Refer to typical Teledyne Analytical 1475 sample system below, 3-way valves 1,2,+ 3below are used to check internal calibration using zero and/or span filters with N2.
CALIBRATION OF H2O IN SOLVENTSEXAMPLE
Based upon our experience when suppling photometric NIR analyzers for 0-100ppm water in solventslike EDC, TDI, benzene and the like, the following can be incorporated for the customers pertinentsolvent.
1 Customer is responsible for introducing a reproducible dry zero fluid, typically (-75deg C)dewpoint Nitrogen or reproducible dry EDC or TDI etc., within +/- 1 ppm H2O (for accuracy of +/- 1% full scale).
2 When customer supplies a reproducible dry TDI zero fluid: A span flag option is available toverify instrument full scale sensitivity. This optical flag may be (manually or automatically) introducedinto the light path within the temperature controlled (within +/- 1 deg C) sample cell compartment. Thisoptical span flag ( when in this temperature stable environment simulates a very stable upscale ppmH2O reading on top of the DRY reproducible TDI zero background.
3 Conversely, a zero flag and/or offset is (manually or automatically) switched into the light pathof the analyzer after drying out the sample cell of process fluid. Consult your manual for the factorcalibration values obtained.
Actual concentration 5000/5020 series analyzer meter
Zero check5 ppm water/TDI 5ppm water in the 5020 meter or output. Check.or0 ppm water in N2 5ppm water on the 5020 meter or output. with zero flag
offset introduction.delta 0ppm water or stability check on zero verified.
Span Checkmole-sieve or dried sample(could be from process)5ppm water in TDI 5ppm water on the 5020 meter or output. Zero verified.85ppm water in TDI 85 ppm water as determined by Karl Fischer titration.(grab sample from process) (lab technique must be verified for precision.
(sampling device, Karl Fischer titrator and operatortechnique)
4–14
4 Operations/Analysis Unit
Teledyne Analytical InstrumentsA Business Unit of Teledyne Electronic Technologies
or 85 ppm simulated water usingspan flag on top of dry liquid TDI
delta 80 ppm agreement on slopesensitivity.
or
0 ppm water in N2 5 ppm water on the 5000B meteror output with zero-flag/offsetintro.
0 ppm water in N2 delta 80 ppm simulated sensitivitychange of water.
Note: the span flag checks the sensitivity change of the 5000Band not the zero drift of the analyzer. The mole sieve dried TDIchecks the zero of the instrument provided it can be reproduce thezero by consistently removing all the water to the same ppm level,(somewhere in the 2-10 ppm water range). The long termefficiency of removing the water by mole-sieve contact should beknown for the customers process fluid, otherwise the customershould have an acceptable off line lab technique to analyzeprepared samples be fore intro into the 5020 field analyzer. WithTeledyne’s approach, using N2 as the dry background for bothzero and span checks, eliminates the concern of the mole-sievebeing saturated with time. Indeed, the N2 Nitrogen backgroundapproach can be used to verify the inefficiency of the mole-sieve(saturation). Teledyne prefers this approach using easilyreproducible N2 since it is much simpler to flush out the samplecell and check the instrument provided the original calibration onTDI is used to set up the zero and span instruments of the opticalfilters. See attached piping on how the appropriate valves areoperated to switch in N2 in the reverse mode to provide a stablezero and or span check.
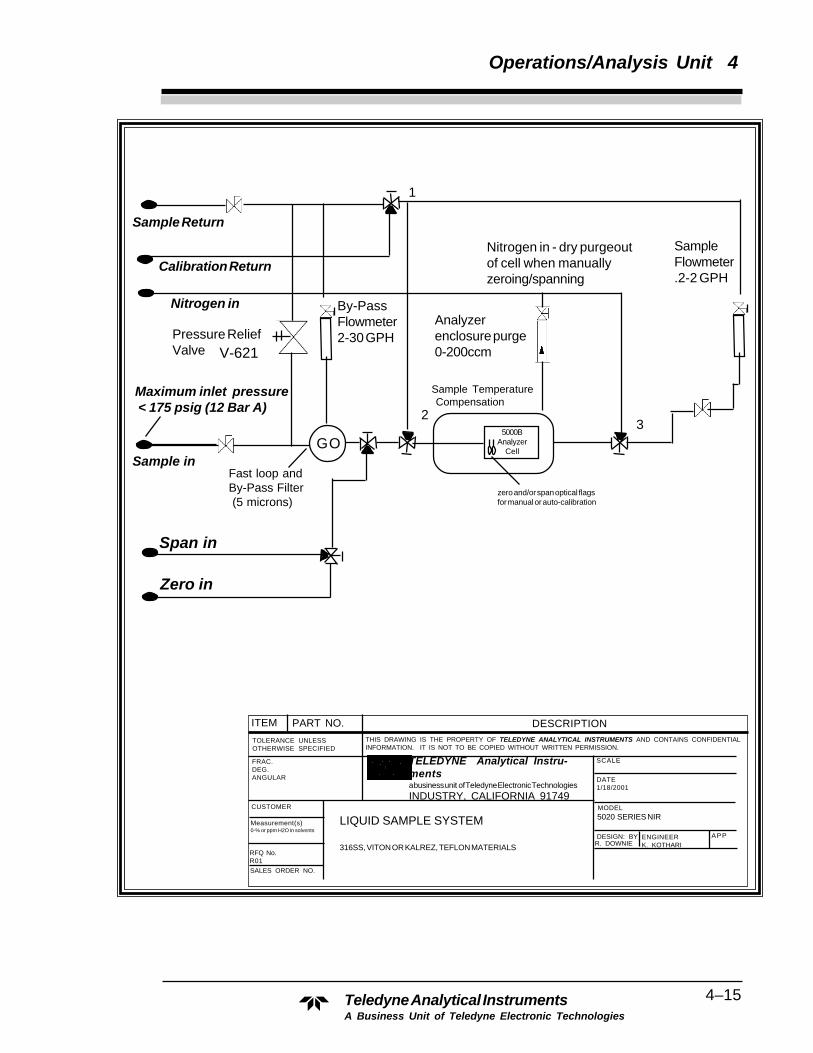
4–15
Operations/Analysis Unit 4
Teledyne Analytical InstrumentsA Business Unit of Teledyne Electronic Technologies
5000BAnalyzer
Cell
Nitrogen in - dry purgeoutof cell when manuallyzeroing/spanning
SampleFlowmeter.2-2 GPH
By-PassFlowmeter2-30 GPHPressure Relief
Valve V-621
Maximum inlet pressure < 175 psig (12 Bar A)
3
Fast loop andBy-Pass Filter (5 microns)
zero and/or span optical flagsfor manual or auto-calibration
Sample Temperature Compensation
1
2
Zero in
Nitrogen in
Span in
Calibration Return
Sample inGO
Sample Return
Analyzerenclosure purge0-200ccm
PART NO. DESCRIPTIONITEM
TOLERANCE UNLESSOTHERWISE SPECIFIED
THIS DRAWING IS THE PROPERTY OF TELEDYNE ANALYTICAL INSTRUMENTS AND CONTAINS CONFIDENTIALINFORMATION. IT IS NOT TO BE COPIED WITHOUT WRITTEN PERMISSION.
SCALE
MODEL
DESIGN: BY
FRAC.DEG.ANGULAR
R. DOWNIE
5020 SERIES NIR
DATE1/18/2001
CUSTOMER
APPENGINEERK. KOTHARI
SALES ORDER NO.
RFQ No.R01
Measurement(s)0-% or ppm H2O in solvents
LIQUID SAMPLE SYSTEM
316SS, VITON OR KALREZ, TEFLON MATERIALS
TELEDYNE Analytical Instru-mentsa business unit of Teledyne Electronic Technologies
INDUSTRY, CALIFORNIA 91749
4–16
4 Operations/Analysis Unit
Teledyne Analytical InstrumentsA Business Unit of Teledyne Electronic Technologies
ATTACHMENT 5000B/5020 NIR ANALYZER
Quote "Exceptions" and "LIQUID PHASE Conditions" for this application.
1 Response Time is proportional to sample system design for take-off distance, process pressure, line
size, sequencing and bypass, by-pass analyzer flow design, dead-volumes/tee's, sample cell volume
and instrument electronics.
2 Maximum cell operation pressure to be 175 psig, based upon standard Sapphire window cell design.
Higher pressures available.
3 The sample flow through the analyzer should be regulated to within ± 5% of its recommended absolute
nominal set point flow value (typically 20-60ccm). This will avoid any pressure drops across any
orifices or poor temperature control of the sample.
4 The temperature of the sample from the take-off thorough the sample cell must be non-freezing, non-
crystallizing, non-coating as provided by customer.
5 The sample temperature should not vary at the inlet more than ± 15 OC of the calibration temperature,
nor exceed the design operating specifications typically 5-45 OC. Assume sample below 45 C and
requires no cooling.
6 Any background components later found to be present and not specified in the original application
feasibility may void the instrument performance should they interfere. particulates assumed none.
7 If compounds are found present, such as moisture, acid gases or corrosive solvents, etc., the sample
system materials may be compromised for corrosion resistance integrity. We assume that the sample
will not polymerize, clog or react in any 1/4" sample line, filter or sample cell when transporting through
the sample systems for all inlet ambient or sample pressures and temperatures from takeoff or derived
from sample conditioning. Special materials may be required for stability, corrosion protection, coalesc-
ing, filtering, hazardous protection or due to heating or cooling.
8 We recommend when ambient temperatures exceed outside a 1-50 OC range that the instrument and
sample system be conditioned appropriately for heating/ cooling without condensation, crystallizing,
coating, polymerization, etc.
9 Should the general purpose or explosion proof instrument be supplied on a back-panel or as a bulk-
mount housing, the customer must install to protect the instrument to meet harsh ambient conditions
for dust, water, snow, wind, corrosion, etc.
10 Teledyne is not responsible for applying a general purpose instrument in a hazardous area or where a
flammable or toxic gas or liquid is brought to an analyzer above its lower explosive limit and the area
has been classified as general purpose and safe.11 The internal calibration features using optical filters are optimized and used when the sample can be
flushed (backflushed usually) out of the sample cell using dry nitrogen or air to a reproducible back-ground zero. The zero offset and/or span flag is introduced and set-up to simulate the on-line calibrationonly after the customer has calibrated the analyzer on the representative process fluid. Thereafter, nocalibration fluids are needed to check analyzer.
4–17
Operations/Analysis Unit 4
Teledyne Analytical InstrumentsA Business Unit of Teledyne Electronic Technologies
4.4 Operational Theory Cont'd
The energy source for the analyzer is most commonly provided by as ahigh intensity quartz iodine lamp located in the source module. Quartz iodinewas chosen because it produces sufficient NIR to operate the system andmaintains a nearly constant brightness over its lifetime. (See Figures 2-1 and2.2).
This energy is then fed through the sample, which is temperaturecontrolled, and into the detector module where it passes through a rotatingfilter wheel before reaching the lead sulfide (PbS) detector (PbSe also usedfor longer wavelengths (cooled and non-cooled).
The filter wheel, driven at 30 RPS or 1800 RPM by a synchronous ACmotor, contains two optical filters with bandpasses selected for each applica-tion, thus providing reference and measuring pulses from which the requiredinformation may be obtained.
The detector receives pulses at the rate of 60 PPS, or two pulses perrevolution of the filter wheel. Every other pulse is from the measuring filter,while the alternate pulse is from the reference filter, so that pulses throughthe measuring filter alternate with pulses through the reference filter. A filterposition sensor, which is an optical device having an integral light sourceand light detector, differentiates between the two.
The two entrained pulses received by the detector each revolution areamplified through a preamplifier which is physically located inside the sealedcompartment with the filter wheel and detector. This signal is then sent to aclamping circuit where an exact zero reference is established.
This clamped video signal is then fed through a gain control network,which is controlled by the automatic gain control loop, through anotheramplifier, to the electronic switch. This switch is controlled by the switchdriver network which derives its information from the filter position sensor inorder to separate the entrained video signal into its component parts of ameasuring peak and a reference peak. These peaks are then fed through abalancing network and channeled into separate peak height detectors whichproduce DC voltage levels which are exactly equal to the peak height orabsolute magnitude of the voltage from the base to the peak of each of thepulses.
At this point the reference signal is fed back to the automatic gaincontrol loop to maintain the desired system gain. In addition, both the mea-suring and reference levels are fed to selector switches in order to enable

4–18
4 Operations/Analysis Unit
Teledyne Analytical InstrumentsA Business Unit of Teledyne Electronic Technologies
direct meter indication, which greatly eases the task of balancing the systemduring initial system installation and periods of calibration.
The DC voltage levels are fed to a logarithmic ratio amplifier which pro-duces a voltage output that is proportional to the logarithm of the ratio of the twoDC input voltages. This output voltage, directly proportional to the concentrationof sample, is, within certain limits, a linear function of the concentration. Forpurposes of transmission, the voltage signal is converted by an E-to-I converter;thus, the output signal from the analysis unit is a current signal that is proportionalto the concentration of sample in the sample module.
There is also an option of providing an automatic zero function (see draw-ing B-14729) in the control unit. This circuit provides electrical signals forswitching a fluid which contains none of the material to be measured into thesample module, electrically adjusting the zeros and switching back to sample.
4.4.1 Source ModuleThe source module is the source of infrared energy. This is provided
through the use of a high-intensity mini IR lamp or a quartz iodine lampoperating directly from a 5.0 volt stable supply or a 6.3 V transformer. Toensure a stable source of radiation in the face of line-voltage variations, thelamp transformer derives its input directly from a line voltage-regulatingtransformer, selected for its ability to maintain a constant output voltage levelregardless of fluctuations in the input line voltage within the control range of105 to 130 VAC.
In some applications where we have an abundance of energy due tolow sample absorption, the focusing lens is removed to avoid excess energyreaching the detector. However, other systems have high energy losses in thesample module due to strong sample absorbance or exceptionally longsample path-lengths. These systems require a focusing lens to gather andcollimate the radiation for maximum utilization of source energy. Thecollimating lens is usually quartz, but may be CaF2 for longer wavelengths.Also the source lamp may be a differenct type, to emit more radiation at thelonger measuring wavelengths. (Consult manual addendum descriptions).

4–19
Operations/Analysis Unit 4
Teledyne Analytical InstrumentsA Business Unit of Teledyne Electronic Technologies
Figure 4-1. Optical System
4.4.2 Sample cell
The sample cell, generally constructed of 316SS, is located in the path ofthe NIR radiation, between the source and the detector modules. Each com-pound in the sample path exhibits its own characteristic absorption spectrum.Cell spacer thicknesses will vary depending upon the absorbance of the compo-nent of interest at the measuring wavelength. Due to the possible variation ofabsorption with temperature, it is either necessary to maintain the sample at aconstant temperature during analysis or to compensate for the minor frequencyshifts of the water bonding which can change due to sample temperature varia-tions.. To achieve this, two separate methods of temperature control are em-ployed for constant temperature control.
1. A preheater (heat exchanger coil) is used on the incoming samplestream to raise or lower it to the desired temperature controlledlevel.
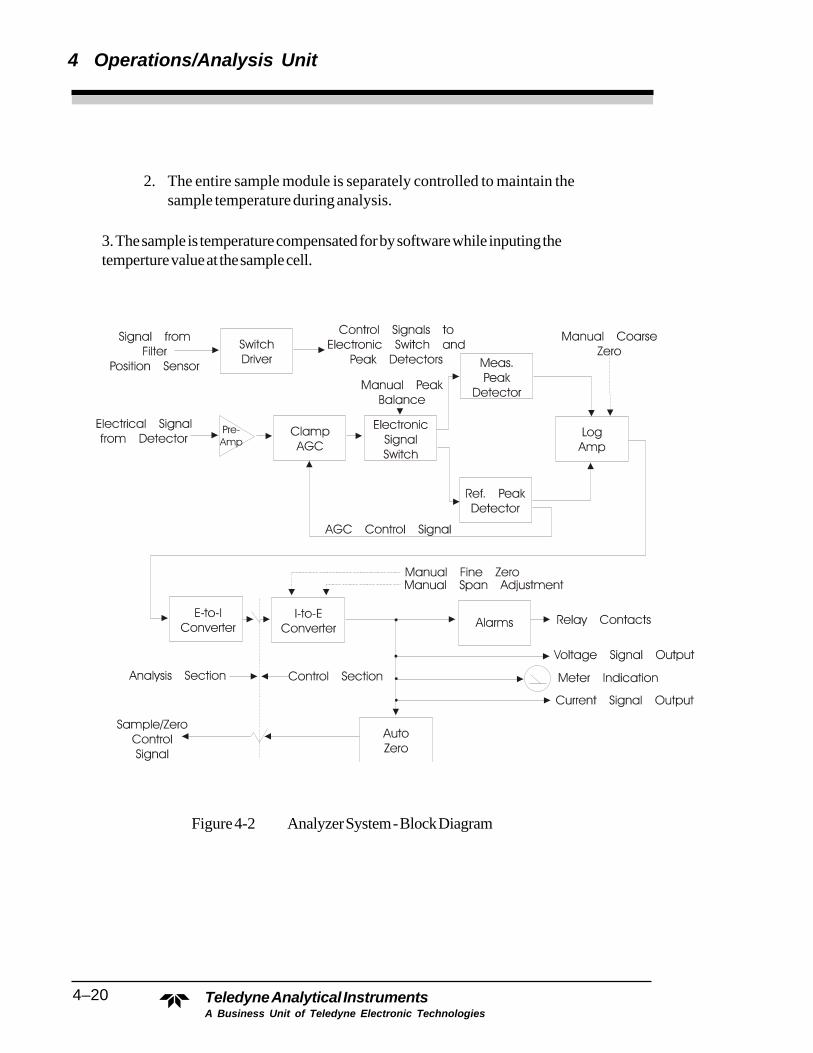
4–20
4 Operations/Analysis Unit
Teledyne Analytical InstrumentsA Business Unit of Teledyne Electronic Technologies
2. The entire sample module is separately controlled to maintain thesample temperature during analysis.
3. The sample is temperature compensated for by software while inputing thetemperture value at the sample cell.
Figure 4-2 Analyzer System - Block Diagram

4–21
Operations/Analysis Unit 4
Teledyne Analytical InstrumentsA Business Unit of Teledyne Electronic Technologies
15 VDC CoarseZero
Control
Selec torSwitch
MEASREFZERO
PowerLine Voltage
RegulatorTransformer5AS1
115 VAC60 HzInput
From
Det
ecto
r Mod
ule
PreheaterTemp.Control
SampleModuleTemp.Control
DetectorModuleTemp.Control
Thermistorand Heater
Thermistorand Heater
Thermistorand Heater
To Log Amplifier
To Meter Driver
115 VAC toSource Module
115 VAC toDetector Module
Figure 4-3 Power Module - Block Diagram

4–22
4 Operations/Analysis Unit
Teledyne Analytical InstrumentsA Business Unit of Teledyne Electronic Technologies
4.4.3 PowerSee Figure 4-3. The power to the analyzer unit, enables the switching
functions, and temperature control for the detector compartment.
With the microprocessor control unit, the following information is provided.
Figure 2-3. Power Module - Block Diagram
The temperature in the detector compartment is controlled by inputs from aRTD device which feeds to a PID controller capable of set points of temperatureversus temperature readout.
4.4.4 Detector compartment
After energy has passed through the sample, it arrives at the filter wheelwhere it is fed alternately through two filters (measuring and reference) beforereaching the detector.
These filters are specially selected for each application according to theabsorption characteristics of the compounds under analysis. The referenceand measuring filter waveforms occur along a baseline at approximately 16milliseconds intervals; each reference or measuring waveform reoccurs at atime interval of 33 mS, or one per revolution of the filter wheel.
At the detector, infrared energy is transformed into electrical pulses andfed through an impedance-matched preamplifier (see dwg. A-14619). De-pending upon the application, length of the cell spacer, etc., the gain of thepreamplifier may vary from 1 to 10, depending upon the energy intensity atthe detector, to achieve an AC signal output of approximately 0.1 to 1.0 voltpeak-to-peak.
Additionally, the detector, filters, and preamplifier are housed in an electri-cally and thermally isolated compartment to provide maximum stability andminimum noise. This box, or compartment, is normally temperature controlled at46 °C.
As noted previously, the filter wheel is driven by a synchronous AC chop-per motor which operates at 1800 RPM. The filter wheel performs two func-tions: (1) switching filters, and (2) chopping the optical signal to give pulseswhich can be amplified for high quality processing.

Part II: Maintenance/Analysis Unit Maintenance 5
Part II: 5-1Teledyne Analytical Instruments
Maintenance
5.0 Routine Maintenance
5.1 Automatic operation and routine operational duties
The system operates continuously without adjustment. Under normal condi-tions, after you program the system for automatic operation, only routine maintenanceprocedures are necessary. The most common failure condition is a temporaryinterruption of the power serving the instrument. If the power service is interrupted, thesource lamp in the analyzer will restart automatically as long as there is no defect in thelamp circuit or its starter.
You can detect a lamp off condition with the signal failure alarm circuit, but youmust connect the relay contacts from the alarm to your indicating device. In addition,you will experience an alarm condition when the cell windows are extremely dirty or theelectronics fail in the detector-converter, log amplifier, or inverter circuits. When thealarm circuit is powered independently from the analyzer power source, the alarmcircuit is fail-safe and will detect power failure.
A message such as "Cell Fail check the detector signal" might be displayedif a 1amp off condition occurs
5.2 System Visual Check and Response Procedure
1. Verify that the signal failure alarm is not in failure condition.
2. Verify that the zero and span control setting have not beendisturbed.
5 Maintenance Model 5000B Photometric Analyzer
5-2: Part II Teledyne Analytical Instruments
3. Verify that the chart recorder contains a normal display.
4. Verify that the recorder has a sufficient supply of chart paper andink.
5.3 Routine Maintenance
Keep the sample lines and components, including the measuring cellwithin the analyzer sample module, free of deposits and leaks. You mustdetermine the interval between cleaning procedures empirically, because theduration of time that the system runs without attention is related directly to thesample’s condition.
5.4 Suggested Preventive MaintenanceSchedule
DAILY1. Visually inspect the complete system for obvious defects, suchas leaking tubes or connectors.
2. Verify that the sample pump (if applicable) is running.
3. Verify that the signal failure alarm is not in failure condition.
4. Verify that zero and span settings are correct.
WEEKLY1. Examine sample cell windows for accumulation of solids.
Remove and clean as necessary.
2. Calibrate the system.
ANNUALLY1. Check the electronics calibration.
2. Check the UV source.NOTE: Be sure to wear UV filtering eye goggles.
3. Check the solenoid valves.

Part II: Maintenance/Analysis Unit Maintenance 5
Part II: 5-3Teledyne Analytical Instruments
5.5 Service Procedures and Adjustments
5.5.1 Electronics
TAI aligns the system’s electronics. However, you mayneed to touch up the circuitry, using the following procedure.
Equipment Required:
Oscilloscope (dual trace is preferred, but not required) To observeoscilloscope test points switch the vertical input selector of the scope to DC.
Switch to AC to observe the demodulator switch signals.
DVM (Digital Voltmeter)
PC Board Extender
Use the PC board extender whenever you need to adjust trimpot.Because all PC board connectors are keyed to avoid wrong positioning in theconnectors, you must remove the key and after testing you need to replace thekey with long-nosed pliers. Turn off the power during this operation. Neverdisconnect or connect the PC boards with the power on, because you may damagethe PC board C-MOS devices.
5.5.2 Power Supply Test Points
Measure +15 volt ±1 volt DC and -15 volt ±1 volt DC on the differential powersupply PC board in the control unit. Refer to the power supply schematic in the backof the manual to identify the power supply test points.
5.5.3 Setup of the Signal Processing Front-EndAmplifiers
Fill the sample cell with air or a stable fluid, such that the photo energythat strikes the detector is constant. A stable fluid is distilled or tap water. Thisstep may be omitted when the system is stable in its present state.
5 Maintenance Model 5000B Photometric Analyzer
5-4: Part II Teledyne Analytical Instruments
If you open the detector module, keep stray light out by covering theopening with a dense black cloth. If you do not take this precaution, the resultis a misinterpretation of the scope patterns. On general-purpose systems, thescope test points are in the bottom of the detector module and are accessiblewithout opening the module.
5.5.4 Oscilloscope Display of the I to E Converter Output
The output of the I to E Converter is observed at the output of the secondamplifier. The objective of this operation is to set up the optical system and thegain of the second amplifier in such a way that the analyzer keeps operatingwithin its dynamic range.
Connect the oscilloscope to TP3. The oscilloscope displays the measur-ing and reference pulses in an alternating pattern. The display is created by thelight passing through the reference and measuring filters as they are brought inand out of the light beam by the rotating filter wheel. These light pulses areconverted to electronic energy which is amplified and brought to TP2. The baseline represents the blocking of the light beam by the opaque part of the filterwheel.
To identify which of the pulses is the measuring peak, insert the spanfilter (when present) or a piece of flat glass or clear plastic in the light beam. Thepeak that becomes the shortest (retracts excessively) is the measuring filter pulse.
In case you cannot set the gain properly, because the peaks are too short,too tall, or too much out of balance, adjust R2 trimpot on the converter PC boarduntil you obtain the desired peak height as observed on the scope (usually 8 to9 volt) for the tallest of the two peaks. Never leave the system operating withpeaks exceeding 10 volts or you may saturate the logarithmic amplifier. Youshould not permit oscillations or distortions in the peaks.
5.5.5 Balancing the Optics for Equal Light Transmissionwith Zero Fluid in the SAMPLE CELL
The objective of this procedure is to obtain measuring and referencepeak heights as displayed on the oscilloscope that are approximately equal, withthe tallest peaks set at 8 to 9 volts. This must be done with air or zero fluid inthe cell.

Part II: Maintenance/Analysis Unit Maintenance 5
Part II: 5-5Teledyne Analytical Instruments
The procedure is purely mechanical and consists of adjusting the amount oflight passing through either the measuring or reference filter, never both. Screens(wire mesh) of varying density are used for this operation and are part of the smalltook kit accompanying the instrument.
1. Observe the oscilloscope and judge if optical balancing isneeded. When the difference is less than 1 volt, balancing is not required. Thetallest of the two peaks should be adjusted to 8 or 9 volts with the gain controlR2 on the detector PC board. When this cannot be done because both peaks aretoo short or too long, search for screens mounted in the light path, usually locatedin a holder on the light pipe which interconnects the detector and sample module,and remove or add screens, as necessary.
2. When balancing is needed, identify the peaks as outlined underSection
3. For example, if the reference peak is the shorter one, stop thefilter wheel with your hand and see if screens are located behind the referencefilter. The reference filter is identified by the letter “R” engraved on the filterwheel.
4. If screens are found, remove them after taking the filter wheel offthe shaft with the special Allen wrench supplied in the tool kit.
5. After removal of the screens and remounting the filter, mount thefilter wheel back on the shaft. Position it correctly on the shaft by lining up thetwo paint marks on shaft and wheel.
6. Turn on the instrument and observe the balance on the oscillo-scope.
a. If the reference peak is now too tall, remove the filter wheel andadd a screen of lesser density behind the reference filter. Repeat this procedureuntil the peaks are within 1 volt of each other.
b. If the measuring peak is equal to or within 1 volt of thereference peak,the system is optically balanced and ready for calibration.
c. If the peak is still too short, repeat the procedure, but thistime put ascreen behind the measuring filter to shorten its peak.

5 Maintenance Model 5000B Photometric Analyzer
5-6: Part II Teledyne Analytical Instruments
7. After the peaks are balanced, adjust the gain control until the tallest ofthe two peaks is 8 to 9 volts. The peaks should still be within1 volt of each other.
8. It is always good practice to operate the analyzer with as low a gain aspossible. Therefore, with the gain control just barely off its stop, once again removeor add screens in the light path to obtain as high a voltage as possible withoutexceeding 9 volts for the highest peak. Read-just gain for 8 to 9 volts.
This concludes the balancing procedure and the instrument is ready forcalibration.
5.5.6 Setup of the Logarithmic Amplifier
The amplifier is inverting and continuously taking the logarithm of the outputsignal of the second amplifier. You can observe the output by connecting the scopeprobe to TP4.
The correct wave shape has a rounded negative going pulse that is thesignal and a flat-topped positive pulse that depicts saturation of the log amplifier.
You should not permit distortions or oscillations in the rounded peaks.
When the positive going pulse is not flat or is distorted, adjust trimpot R3only enough to obtain a flat positive pulse. If you over adjust, you may lose partof the second decade of absorption and affect the accuracy of analysis for highconcentrations of the component of interest where the measuring pulse canbecome very short. The log amplifier saturates because the amplifier isincapable of taking the logarithm of the slightly negative baseline.
5.5.7 Inverting Amplifier
The amplifier is inverting and has a gain of 1. It inverts the output signal of thelogarithmic amplifier and acts as a buffer between the logarithmic amplifier and thereed switch and integrators. To observe the output of the inverter, connect the scopeprobe to TP5. The wave must be a duplicateof that observed on TP4, except thatit is inverted.

Part II: Maintenance/Analysis Unit Maintenance 5
Part II: 5-7Teledyne Analytical Instruments
5.5.8 Integrated Reference and Measuring Signals
You can observe the reference and measuring signal at the first stage ofintegration by connecting the scope probe to TP6 (reference signal) and TP7(measuring signal) at the detector unit. A dual trace scope is advantageous butnot required for this observation.
The test points’ significance is that they reveal proper switch action. Thedisplay shows a sawtooth pattern that is a charge-discharge of the first capacitorin the integrating network. This ripple is the AC component of the reference andmeasuring signal after the pulses are converted to DC. The sawtooth patternsmust be displayed 180° with respect to each other as viewed with a dual tracescope. They must both be present.
If one is missing, the switch is not switching. If the sawtooth shows abroken pattern, the switching action is feeble or irregular. Usually, you can fixthe faulty condition of the switch by slightly changing the switch position.
The action of a bar magnet and a rotating chopper disc activatethemagnetic mercury reed switch. An aluminum motor mounting block housesa bar magnet. This bar magnet is parallel with the mercury chopper switch.
The chopper disc is a green and black disc mounted on the filter wheelshaft next to the motor. The disc is composed of both magnetic and non-magnetic materials. As the shaft rotates, the magnetic portion of the disc shortsthe magnetic flux as it passes between the magnet and the switch. The non-magneticportion of the disc enables flux lines from the bar magnet to activate the mercuryswitch.
5.5.9 Battery-Powered OscilloscopeSynchronization Point
Because the line frequency cannot synchronize battery-powered oscillo-scopes, use TP8 at the detector module to provide external synchronization.
5.6 Interface Board Terminals Strip
At the bottom of the interface PCB on the Control Unit, are three terminalstrip where wiring is distributed to other sections of the Model 6000B System.Such as AC power for the D2 lamp power supply, DC Power to the preampli-fier, High DC voltage for the photodetector, and signals to control calibrationsolenoids and filters. To gain access to this terminals, the silkscreen cover mustbe removed. These terminals are wired in the factory.
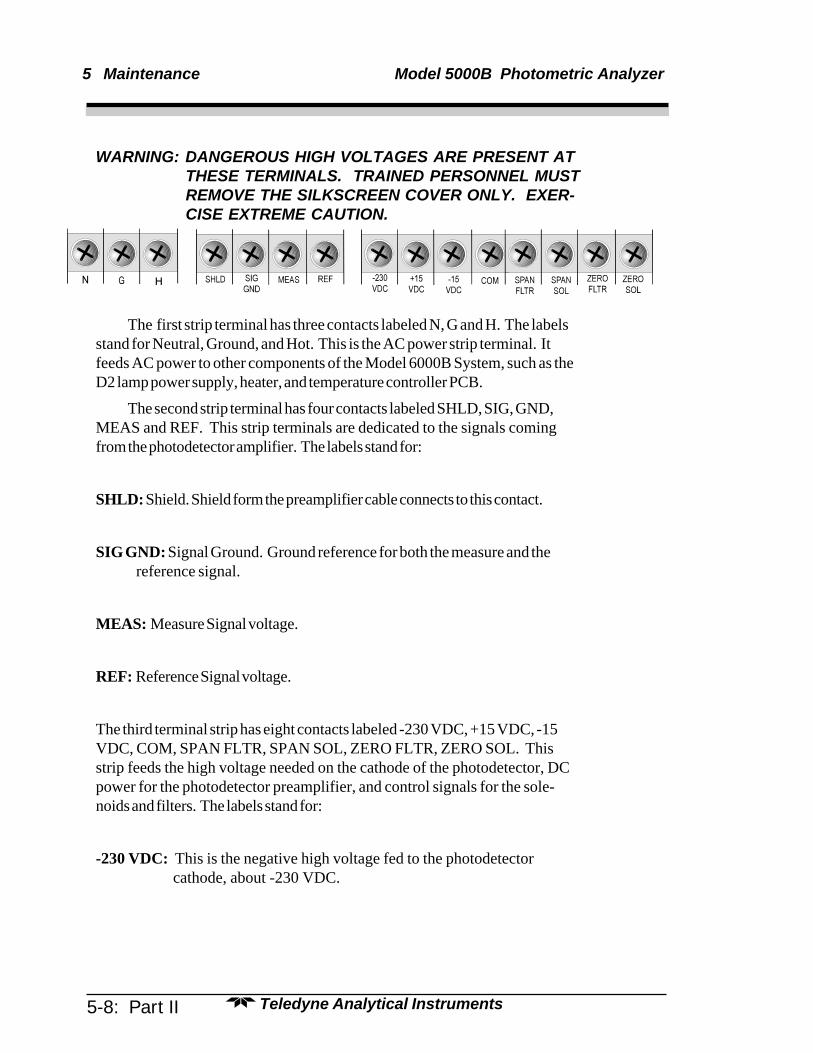
5 Maintenance Model 5000B Photometric Analyzer
5-8: Part II Teledyne Analytical Instruments
WARNING: DANGEROUS HIGH VOLTAGES ARE PRESENT ATTHESE TERMINALS. TRAINED PERSONNEL MUSTREMOVE THE SILKSCREEN COVER ONLY. EXER-CISE EXTREME CAUTION.
The first strip terminal has three contacts labeled N, G and H. The labelsstand for Neutral, Ground, and Hot. This is the AC power strip terminal. Itfeeds AC power to other components of the Model 6000B System, such as theD2 lamp power supply, heater, and temperature controller PCB.
The second strip terminal has four contacts labeled SHLD, SIG, GND,MEAS and REF. This strip terminals are dedicated to the signals comingfrom the photodetector amplifier. The labels stand for:
SHLD: Shield. Shield form the preamplifier cable connects to this contact.
SIG GND: Signal Ground. Ground reference for both the measure and the reference signal.
MEAS: Measure Signal voltage.
REF: Reference Signal voltage.
The third terminal strip has eight contacts labeled -230 VDC, +15 VDC, -15VDC, COM, SPAN FLTR, SPAN SOL, ZERO FLTR, ZERO SOL. Thisstrip feeds the high voltage needed on the cathode of the photodetector, DCpower for the photodetector preamplifier, and control signals for the sole-noids and filters. The labels stand for:
-230 VDC: This is the negative high voltage fed to the photodetector cathode, about -230 VDC.
Part II: Maintenance/Analysis Unit Maintenance 5
Part II: 5-9Teledyne Analytical Instruments
+15 VDC: Power Supply voltage fed to the photodetector preamplifier, +15 VDC.
-15 VDC: Power Supply voltage fed to the photodetector preamplifier,
-15 VDC.
COM: Common reference to the +/- 15 VDC and the -230 VDC power supplies.
SPAN FLTR: Span filter signal, AC voltage.
SPAN SOL: Span solenoid signal, AC voltage.
ZERO FLTR: Zero filter signal, AC voltage.
ZERO SOL: Zero solenoid signal, AC voltage.

5 Maintenance Model 5000B Photometric Analyzer
5-10: Part II Teledyne Analytical Instruments
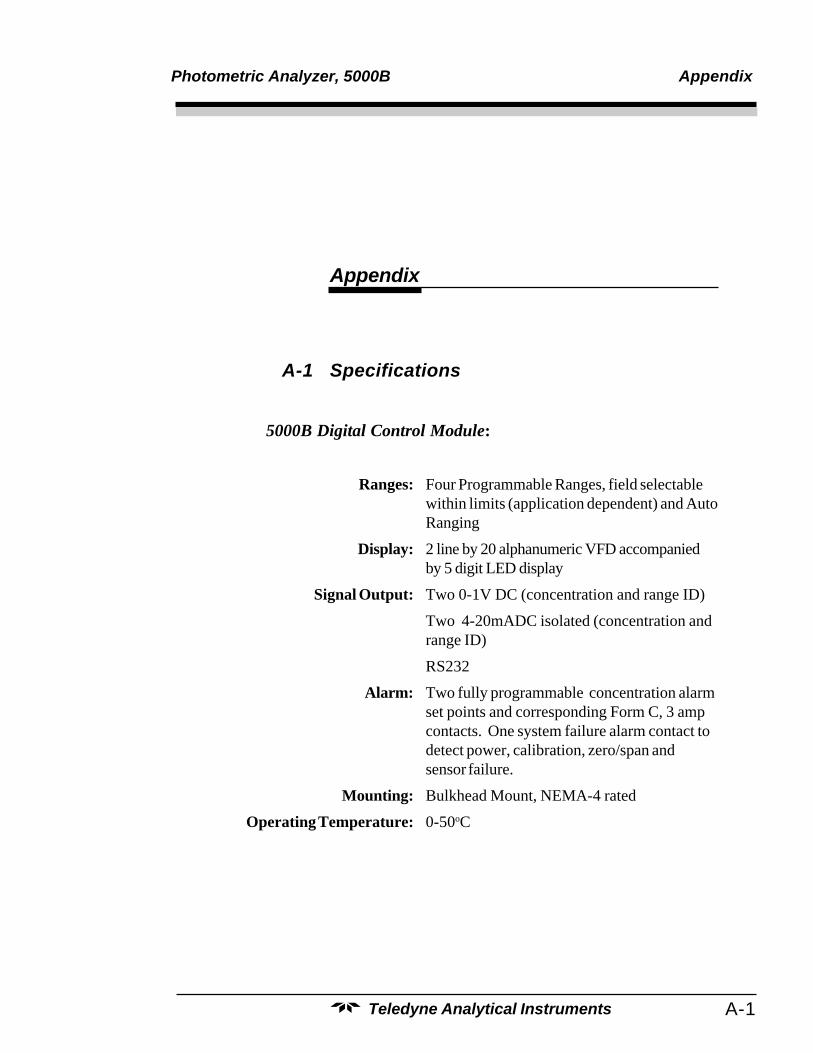
A-1
Photometric Analyzer, 5000B Appendix
Teledyne Analytical Instruments
Appendix
A-1 Specifications
5000B Digital Control Module:
Ranges: Four Programmable Ranges, field selectablewithin limits (application dependent) and AutoRanging
Display: 2 line by 20 alphanumeric VFD accompaniedby 5 digit LED display
Signal Output: Two 0-1V DC (concentration and range ID)
Two 4-20mADC isolated (concentration andrange ID)
RS232
Alarm: Two fully programmable concentration alarmset points and corresponding Form C, 3 ampcontacts. One system failure alarm contact todetect power, calibration, zero/span andsensor failure.
Mounting: Bulkhead Mount, NEMA-4 rated
Operating Temperature: 0-50oC
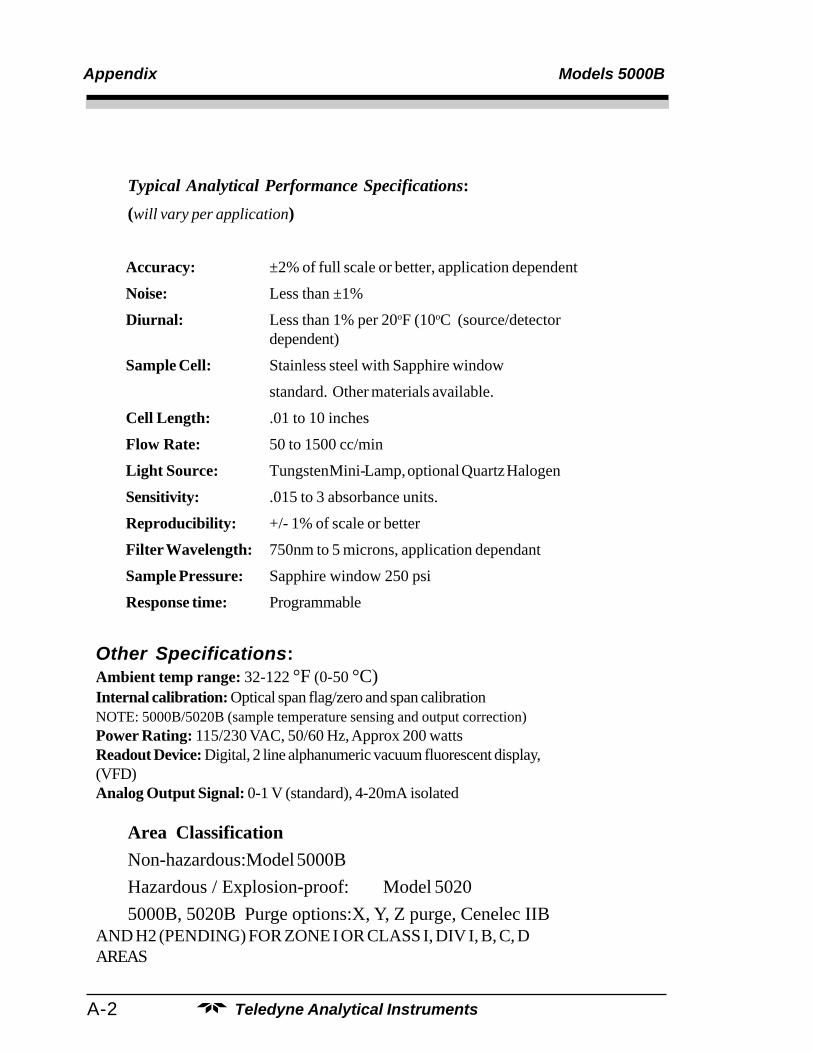
A-2
Appendix Models 5000B
Teledyne Analytical Instruments
Typical Analytical Performance Specifications:(will vary per application)
Accuracy: ±2% of full scale or better, application dependent
Noise: Less than ±1%
Diurnal: Less than 1% per 20oF (10oC (source/detectordependent)
Sample Cell: Stainless steel with Sapphire window
standard. Other materials available.
Cell Length: .01 to 10 inches
Flow Rate: 50 to 1500 cc/min
Light Source: Tungsten Mini-Lamp, optional Quartz Halogen
Sensitivity: .015 to 3 absorbance units.
Reproducibility: +/- 1% of scale or better
Filter Wavelength: 750nm to 5 microns, application dependant
Sample Pressure: Sapphire window 250 psi
Response time: Programmable
Other Specifications:Ambient temp range: 32-122 °F (0-50 °C)Internal calibration: Optical span flag/zero and span calibrationNOTE: 5000B/5020B (sample temperature sensing and output correction)Power Rating: 115/230 VAC, 50/60 Hz, Approx 200 wattsReadout Device: Digital, 2 line alphanumeric vacuum fluorescent display,(VFD)Analog Output Signal: 0-1 V (standard), 4-20mA isolated
Area ClassificationNon-hazardous:Model 5000BHazardous / Explosion-proof: Model 50205000B, 5020B Purge options:X, Y, Z purge, Cenelec IIB
AND H2 (PENDING) FOR ZONE I OR CLASS I, DIV I, B, C, DAREAS

A-3
Photometric Analyzer, 5000B Appendix
Teledyne Analytical Instruments
Enclosure Purging:Purge air startup*:40 – 80 PSI (3 – 6 BAR), 0.5 CFM (15 L / min)Purge optical path*:15 – 30 PSI (1 – 2 BAR), 10 cc/min, purity of
Nitrogen, - 110 °F (-80 °C) dewpoint
* If ordered with purge option
Other Features:
* Three user selectable ranges* Signal and Range ID output: 0-1VDC and 4-20maDC (isolated)* Programmable auto ranging* Range ID contacts, 3A@250VAC resistive* Two adjustable concentration alarm set points with programmable relayfunction Form C contacts, 3A@250VAC resistive* Programmable auto calibration with mode ID Form A normally open contacts* Remotely operated calibration (customer supplied valves) and 24 VDCsignal), application dependent* Self diagnostics with Form C failure contacts* Full duplex RS232 communication link* Alphanumeric VF display for set up and diagnostics
General Installation Note: Protect the instrument fromdirect sunlight and rain.
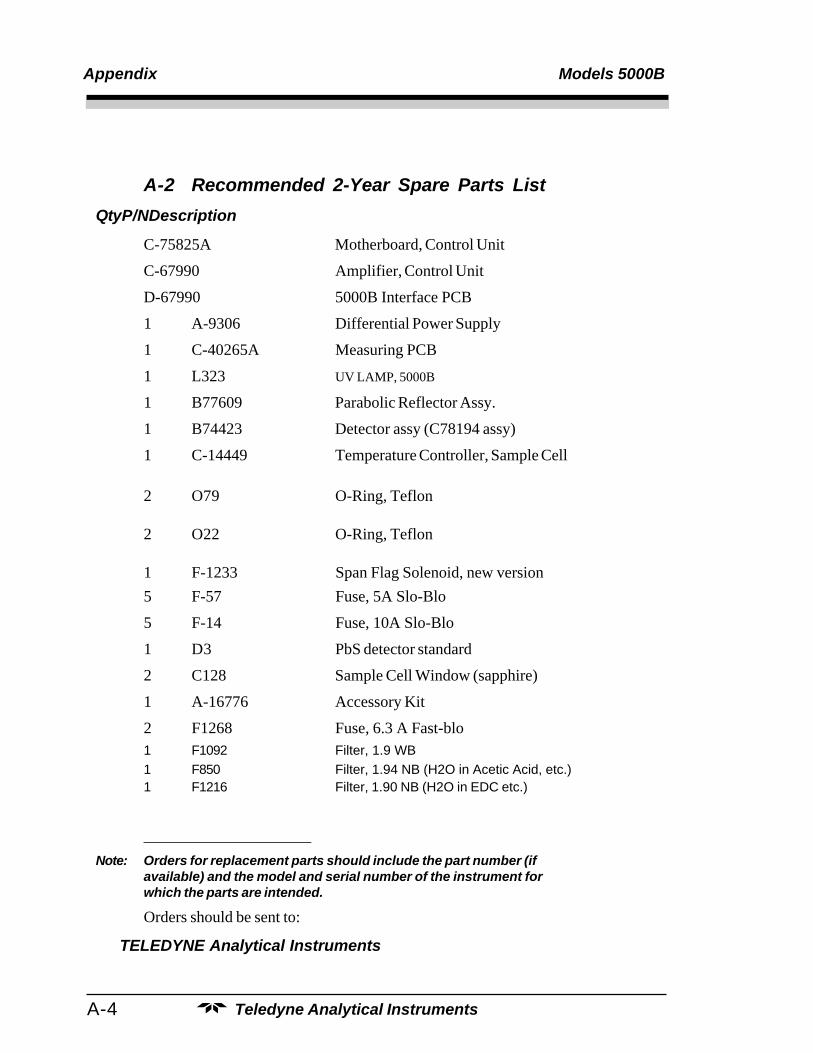
A-4
Appendix Models 5000B
Teledyne Analytical Instruments
A-2 Recommended 2-Year Spare Parts List
QtyP/NDescription
C-75825A Motherboard, Control Unit
C-67990 Amplifier, Control Unit
D-67990 5000B Interface PCB
1 A-9306 Differential Power Supply
1 C-40265A Measuring PCB
1 L323 UV LAMP, 5000B
1 B77609 Parabolic Reflector Assy.
1 B74423 Detector assy (C78194 assy)
1 C-14449 Temperature Controller, Sample Cell
2 O79 O-Ring, Teflon
2 O22 O-Ring, Teflon
1 F-1233 Span Flag Solenoid, new version5 F-57 Fuse, 5A Slo-Blo
5 F-14 Fuse, 10A Slo-Blo
1 D3 PbS detector standard
2 C128 Sample Cell Window (sapphire)
1 A-16776 Accessory Kit
2 F1268 Fuse, 6.3 A Fast-blo1 F1092 Filter, 1.9 WB1 F850 Filter, 1.94 NB (H2O in Acetic Acid, etc.)1 F1216 Filter, 1.90 NB (H2O in EDC etc.)
_____________________Note: Orders for replacement parts should include the part number (if
available) and the model and serial number of the instrument forwhich the parts are intended.
Orders should be sent to:
TELEDYNE Analytical Instruments
A-5
Photometric Analyzer, 5000B Appendix
Teledyne Analytical Instruments
16830 Chestnut StreetCity of Industry, CA 91749-1580
Phone (626) 934-1500, Fax (626) 961-2538TWX (910) 584-1887 TDYANYL COID
Web: www.teledyne-ai.com
or your local representative.
A-3 Drawing List, 5000B
SEE MANUAL ADDENDUM OF Q FOR COMPLETE DRAWINGLIST.

A-6
Appendix Models 5000B
Teledyne Analytical Instruments