Embed Size (px)
Citation preview

Glyde Sub Basin, Northern Territory
FALCON® Airborne Gravity Gradiometer and Magnetometer Survey
for
Armour Energy Pty Ltd
Operations and Processing Report
Survey Flown: December 2012 to January 2013
By
FUGRO AIRBORNE SURVEYS Pty Ltd U3/435 Scarborough Beach Rd
Osborne Park, WA 6017 AUSTRALIA
Job# 2381

Fugro Airborne Surveys FALCON® Airborne Gravity Gradiometer and Magnetometer Survey – Glyde Sub Basin, Northern Territory
2
TABLE OF CONTENTS
1 INTRODUCTION ..........................................................................................................5 1.1 Survey Location.....................................................................................................5 1.2 General Disclaimer ................................................................................................7
2 SUMMARY OF SURVEY PARAMETERS ....................................................................8 2.1 Survey Area Specifications....................................................................................8 2.2 Data Recording......................................................................................................8 2.3 Job Safety Plan, HSE Summary............................................................................8
3 FIELD OPERATIONS...................................................................................................9 3.1 Operations.............................................................................................................9 3.2 Base Stations ........................................................................................................9 3.3 Field Personnel......................................................................................................9
4 QUALITY CONTROL RESULTS ................................................................................10 4.1 Survey acquisition issues ....................................................................................10 4.2 Flight Path Map ...................................................................................................11 4.3 Turbulence...........................................................................................................12 4.4 AGG System Noise .............................................................................................13 4.5 Digital Terrain Model ...........................................................................................15 4.6 Terrain Clearance................................................................................................17
5 FALCON® AIRBORNE GRAVITY GRADIENT (AGG) RESULTS...............................18 5.1 Processing Summary ..........................................................................................18 5.2 FALCON® Airborne Gravity Gradiometer Data ....................................................18 5.3 Radar Altimeter Data ...........................................................................................19 5.4 Laser Scanner Data.............................................................................................19 5.5 Positional Data ....................................................................................................19 5.6 Terrain Correction................................................................................................19 5.7 Tie line Levelling..................................................................................................19 5.8 Micro-levelling......................................................................................................20 5.9 FALCON® Airborne Gravity Gradient Data - GDD & gD.........................................20
5.9.1 Fourier ..........................................................................................................20 5.9.2 Equivalent Source ........................................................................................20 5.9.3 Drape Surfaces ............................................................................................20
5.10 Conforming gD to regional gravity ........................................................................25 6 AEROMAGNETIC RESULTS .....................................................................................28
6.1 Processing Summary ..........................................................................................28 6.2 Aeromagnetic Data..............................................................................................28 6.3 Radar Altimeter Data ...........................................................................................29 6.4 Positional Data ....................................................................................................29 6.5 Lag Correction.....................................................................................................29 6.6 IGRF Correction ..................................................................................................29 6.7 Diurnal Subtraction ..............................................................................................29 6.8 Tie-line Levelling..................................................................................................29 6.9 Micro-levelling......................................................................................................29 6.10 Residual Magnetic Intensity.................................................................................30
7 APPENDIX I - SURVEY EQUIPMENT .......................................................................31 7.1 Survey Aircraft .....................................................................................................31 7.2 FALCON® Airborne Gravity Gradiometer.............................................................31 7.3 Airborne Data Acquisition Systems .....................................................................31 7.4 Aerial and Ground Magnetometers......................................................................31 7.5 Real-Time Differential GPS .................................................................................31 7.6 GPS Base Station Receiver ................................................................................32 7.7 Altimeters ............................................................................................................32

Fugro Airborne Surveys FALCON® Airborne Gravity Gradiometer and Magnetometer Survey – Glyde Sub Basin, Northern Territory
3
7.8 Laser Scanner .....................................................................................................32 7.9 Data Processing Hardware and Software............................................................32
8 APPENDIX II - SYSTEM TESTS ................................................................................33 8.1 Instrumentation Lag.............................................................................................33 8.2 Radar Altimeter Calibration .................................................................................33 8.3 FALCON® AGG Noise Measurement ..................................................................33 8.4 Daily Calibrations.................................................................................................33
8.4.1 Magnetic Base Station Time Check .............................................................33 8.4.2 FALCON® AGG Calibration ..........................................................................33
9 APPENDIX III - FALCON® AGG DATA & PROCESSING ..........................................34 9.1 Nomenclature ......................................................................................................34 9.2 Units ....................................................................................................................34 9.3 FALCON® Airborne Gravity Gradiometer Surveys...............................................34 9.4 Gravity Data Processing......................................................................................35 9.5 Aircraft dynamic corrections ................................................................................35 9.6 Self gradient Corrections .....................................................................................35 9.7 Laser Scanner Processing...................................................................................35 9.8 Terrain Corrections..............................................................................................36 9.9 Tie line Levelling..................................................................................................36 9.10 Transformation into GDD & gD ..............................................................................36 9.11 Terrain Corrections Using Alternate Terrain Densities ........................................37 9.12 Noise & Signal .....................................................................................................37 9.13 Risk Criteria in Interpretation ...............................................................................38 9.14 References ..........................................................................................................38
10 APPENDIX IV - FINAL PRODUCTS .......................................................................40
FIGURES
Figure 1: Glyde Sub Basin – Survey Area Location.............................................................6 Figure 2: Glyde Sub Basin – Flight Path map ....................................................................11 Figure 3: Glyde Sub Basin – Turbulence (milli g where g = 9.80665 m/sec/sec) ...............12 Figure 4: Glyde Sub Basin – System Noise NE (E) ...........................................................13 Figure 5: Glyde Sub Basin – System Noise UV (E) ...........................................................14 Figure 6: Glyde Sub Basin – Final Digital Terrain Model (metres, referenced to the EGM96
geoid)..........................................................................................................................16 Figure 7: Glyde Sub Basin – Terrain clearance derived from laser scanner data (metres
above ground surface)................................................................................................17 Figure 8: FALCON® AGG Data Processing .......................................................................18 Figure 9: Glyde Sub Basin – Vertical Gravity Gradient (GDD) from Fourier processing (E).
....................................................................................................................................21 Figure 10: Glyde Sub Basin – Vertical Gravity Gradient (GDD) from equivalent source
processing (E). ...........................................................................................................22 Figure 11: Glyde Sub Basin – Vertical Gravity (gD) from Fourier processing (mGal) .........23 Figure 12: Glyde Sub Basin – Vertical Gravity (gD) from equivalent source processing
(mGal).........................................................................................................................24 Figure 13: Glyde Sub Basin – Vertical Gravity (gD) from Fourier processing conformed to
regional gravity data (mGal) .......................................................................................26 Figure 14: Glyde Sub Basin – Vertical Gravity (gD) from equivalent source processing
conformed to regional gravity data (mGal)..................................................................27 Figure 15: Aeromagnetic Data Processing ........................................................................28 Figure 16: Glyde Sub Basin – Residual Magnetic Intensity (nT)........................................30

Fugro Airborne Surveys FALCON® Airborne Gravity Gradiometer and Magnetometer Survey – Glyde Sub Basin, Northern Territory
4
TABLES
Table 1: Glyde Sub Basin – Survey Boundary Coordinates.................................................8 Table 2: Final FALCON® AGG Digital Data – ASCII and Geosoft Database Format .........41 Table 3: Final Aeromagnetic Digital Data – ASCII and Geosoft Database Format ............42 Table 4: Final Aeromagnetic and AGG Grids – ERMapper Format ...................................43

Fugro Airborne Surveys FALCON® Airborne Gravity Gradiometer and Magnetometer Survey – Glyde Sub Basin, Northern Territory
5
1 INTRODUCTION Fugro Airborne Surveys conducted a high-sensitivity aeromagnetic and FALCON ®
Airborne Gravity Gradiometer (AGG) survey over the Glyde Sub Basin survey area under contract with Armour Energy Pty Ltd. 1.1 Survey Location The Glyde Sub Basin survey area is centred on longitude 136° 12’ E, latitude 16º 45’ S (see the location map in Figure 1). The production flights took place during December, 2012 and January, 2103 with the first production flight taking place on December 31st and the final flight taking place on January 5th. To complete the survey area coverage a total of 10 production flights were flown, for a combined total of 4,272 line kilometres of data acquired.

Fugro Airborne Surveys FALCON® Airborne Gravity Gradiometer and Magnetometer Survey – Glyde Sub Basin, Northern Territory
6
Figure 1: Glyde Sub Basin – Survey Area Location
Fugro Airborne Surveys FALCON® Airborne Gravity Gradiometer and Magnetometer Survey – Glyde Sub Basin, Northern Territory
7
1.2 General Disclaimer It is Fugro Airborne Surveys' understanding that the data and report provided to the client is to be used for the purpose agreed between the parties. That purpose was a significant factor in determining the scope and level of the Services being offered to the Client. Should the purpose for which the data and report is used change, the data and report may no longer be valid or appropriate and any further use of, or reliance upon, the data and report in those circumstances by the Client without Fugro Airborne Surveys' review and advice shall be at the Client's own and sole risk. The Services were performed by Fugro Airborne Surveys exclusively for the purposes of the Client. Should the data and report be made available in whole or part to any third party, and such party relies thereon, that party does so wholly at its own and sole risk and Fugro Airborne Surveys disclaims any liability to such party. Where the Services have involved Fugro Airborne Surveys' use of any information provided by the Client or third parties, upon which Fugro Airborne Surveys was reasonably entitled to rely, then the Services are limited by the accuracy of such information. Fugro Airborne Surveys is not liable for any inaccuracies (including any incompleteness) in the said information, save as otherwise provided in the terms of the contract between the Client and Fugro Airborne Surveys.
Fugro Airborne Surveys FALCON® Airborne Gravity Gradiometer and Magnetometer Survey – Glyde Sub Basin, Northern Territory
8
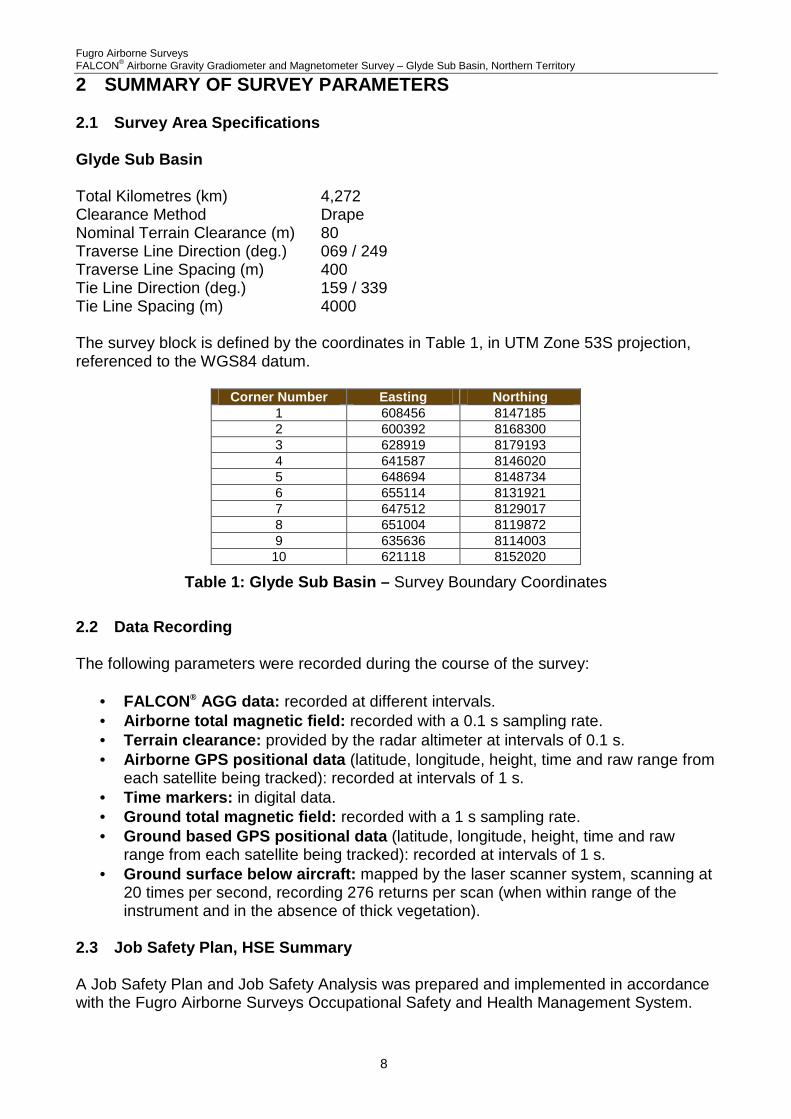
2 SUMMARY OF SURVEY PARAMETERS 2.1 Survey Area Specifications Glyde Sub Basin Total Kilometres (km) 4,272 Clearance Method Drape Nominal Terrain Clearance (m) 80 Traverse Line Direction (deg.) 069 / 249 Traverse Line Spacing (m) 400 Tie Line Direction (deg.) 159 / 339 Tie Line Spacing (m) 4000 The survey block is defined by the coordinates in Table 1, in UTM Zone 53S projection, referenced to the WGS84 datum.
Corner Number Easting Northing 1 608456 8147185 2 600392 8168300 3 628919 8179193 4 641587 8146020 5 648694 8148734 6 655114 8131921 7 647512 8129017 8 651004 8119872 9 635636 8114003 10 621118 8152020
Table 1: Glyde Sub Basin – Survey Boundary Coordinates
2.2 Data Recording The following parameters were recorded during the course of the survey:
• FALCON ® AGG data: recorded at different intervals. • Airborne total magnetic field: recorded with a 0.1 s sampling rate. • Terrain clearance: provided by the radar altimeter at intervals of 0.1 s. • Airborne GPS positional data (latitude, longitude, height, time and raw range from
each satellite being tracked): recorded at intervals of 1 s. • Time markers: in digital data. • Ground total magnetic field: recorded with a 1 s sampling rate. • Ground based GPS positional data (latitude, longitude, height, time and raw
range from each satellite being tracked): recorded at intervals of 1 s. • Ground surface below aircraft: mapped by the laser scanner system, scanning at
20 times per second, recording 276 returns per scan (when within range of the instrument and in the absence of thick vegetation).
2.3 Job Safety Plan, HSE Summary A Job Safety Plan and Job Safety Analysis was prepared and implemented in accordance with the Fugro Airborne Surveys Occupational Safety and Health Management System.
Fugro Airborne Surveys FALCON® Airborne Gravity Gradiometer and Magnetometer Survey – Glyde Sub Basin, Northern Territory
9
3 FIELD OPERATIONS 3.1 Operations The survey was based out of Borroloola, Northern Territory. The survey aircraft was operated from Borroloola airport using aircraft fuel available on site. A temporary office was set up in Borroloola at the Savannah Way Motel where all survey operations were run and the post-flight data verification was performed. 3.2 Base Stations A dual frequency GPS base station was set up at the Savannah Way Motel in order to correct the raw GPS data collected in the aircraft. A secondary GPS base station was available but was not required. GPS Base Station
Date: December 31st 2012 Location: GPS base Latitude: 16º 4' 18.24421" S Longitude: 136º 18' 24.68636" E Height: 68.810 m ellipsoidal
Magnetometer Base Station (CF1)
Location: Borroloola Airport Base: 48080 nT
3.3 Field Personnel The following technical personnel participated in field operations: Crew Leader: S. Rawlings Pilots: G Hamilton and T. Masefield Technicians: S. Rawlings and M. Owen Project Manager: P. Johnson Final QC and Processing: A. Carbone and P. Chambers

Fugro Airborne Surveys FALCON® Airborne Gravity Gradiometer and Magnetometer Survey – Glyde Sub Basin, Northern Territory
10
4 QUALITY CONTROL RESULTS 4.1 Survey acquisition issues During the course of the survey there were no data quality issues with: AGG instrumentation Magnetic and GPS base stations Airborne magnetometer system Data acquisition systems Radar altimeter Laser scanner
Fugro Airborne Surveys FALCON® Airborne Gravity Gradiometer and Magnetometer Survey – Glyde Sub Basin, Northern Territory
11
4.2 Flight Path Map
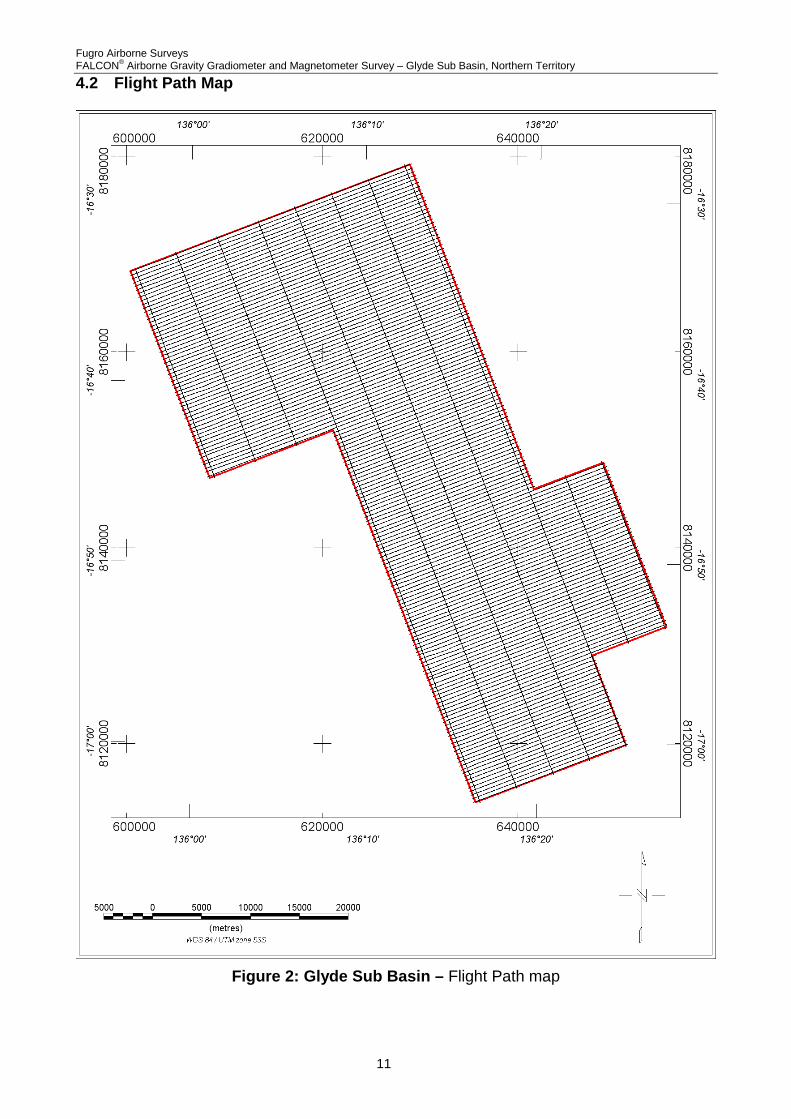
Figure 2: Glyde Sub Basin – Flight Path map

Fugro Airborne Surveys FALCON® Airborne Gravity Gradiometer and Magnetometer Survey – Glyde Sub Basin, Northern Territory
12
4.3 Turbulence The mean turbulence recorded in the Glyde Sub Basin survey area was 53 milli g (where g = 9.80665 m/sec/sec). Turbulence was variable, ranging from low to high. Primarily it was influenced by the local daily weather patterns, increasing with temperature during the day and decreasing towards late afternoon. The turbulence pattern across the survey area is shown in Figure 3.
Figure 3: Glyde Sub Basin – Turbulence (milli g where g = 9.80665 m/sec/sec)

Fugro Airborne Surveys FALCON® Airborne Gravity Gradiometer and Magnetometer Survey – Glyde Sub Basin, Northern Territory
13
4.4 AGG System Noise The system noise is defined to be the standard deviation of half the difference between the A & B complements, for each of the NE and UV curvature components. The results for this survey were very good with values of 1.82 E and 1.80 E for NE and UV respectively. Figure 4 and Figure 5 provide a representation of the variation in this standard deviation for each component. This is achieved by gridding a rolling measurement of standard deviation along each line using a window length of 100 data points.
Figure 4: Glyde Sub Basin – System Noise NE (E)

Fugro Airborne Surveys FALCON® Airborne Gravity Gradiometer and Magnetometer Survey – Glyde Sub Basin, Northern Territory
14
Figure 5: Glyde Sub Basin – System Noise UV (E)
Fugro Airborne Surveys FALCON® Airborne Gravity Gradiometer and Magnetometer Survey – Glyde Sub Basin, Northern Territory
15
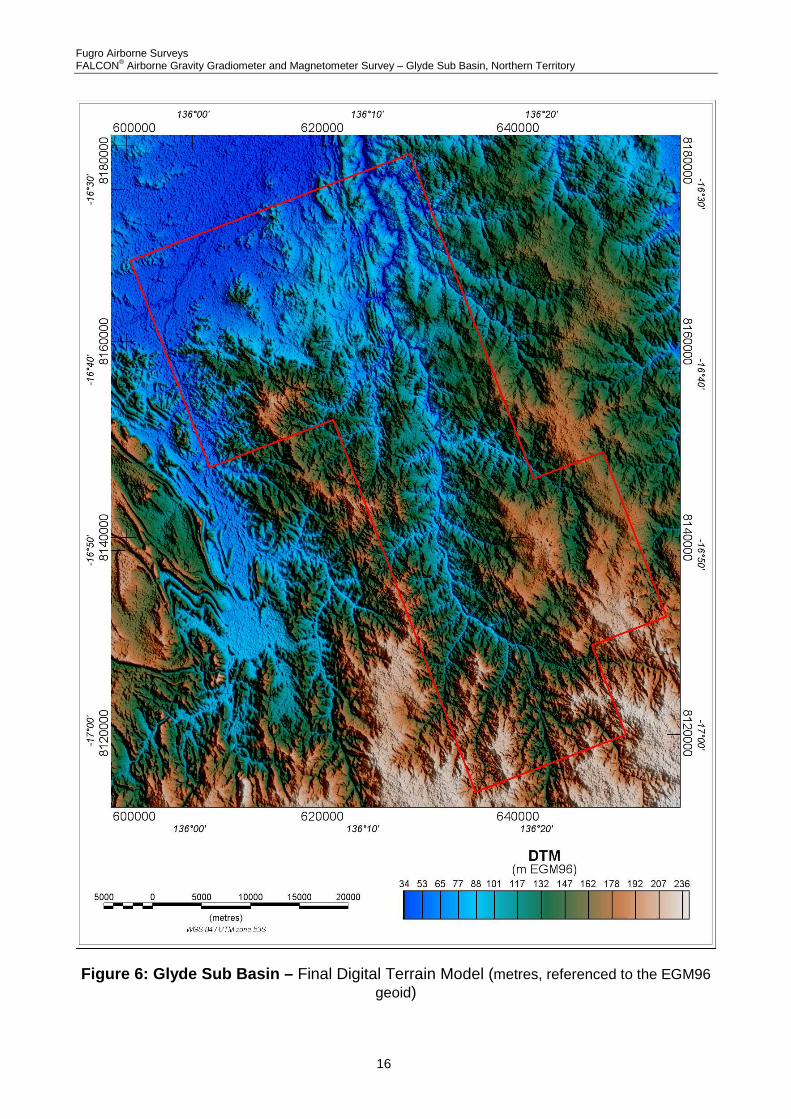
4.5 Digital Terrain Model Laser scanner range data were combined with GPS position and height data (adjusted from height above the WGS84 ellipsoid to height above the geoid by applying the Earth Gravitational Model 1996 (EGM96)). The output of this process is a “swath” of terrain elevations extending either side of the aircraft flight path. Width and sample density of this swath varies with aircraft height. Typical values are 100 to 150 metres and 5 to 10 metres respectively. Because terrain correction of AGG data requires knowledge of the terrain at distances up to at least 10 km from the data location, laser scanner data collected only along the survey line path must be supplemented by data from another source. For this purpose, Shuttle Radar Topography Mission (SRTM) v2 data are usually chosen. Laser scanner data quality was good with scan density generally above 90%. Laser scanner data were gridded at 20 m with a 1 cell maximum extension beyond data limits. To fill gaps between lines and extend data coverage beyond the survey area, SRTM grid data were excised to an area 15 km beyond the planned survey area. The excised data were adjusted to the level of the laser scanner data using a Fourier domain wrapping method. The two grids were then combined into a single grid such that unmodified laser scanner data were used where defined and adjusted SRTM data were used to fill the gaps and extend the area. Figure 6 shows the final Digital Terrain Model for the survey area.
Fugro Airborne Surveys FALCON® Airborne Gravity Gradiometer and Magnetometer Survey – Glyde Sub Basin, Northern Territory
16
Figure 6: Glyde Sub Basin – Final Digital Terrain Model (metres, referenced to the EGM96 geoid)
Fugro Airborne Surveys FALCON® Airborne Gravity Gradiometer and Magnetometer Survey – Glyde Sub Basin, Northern Territory
17
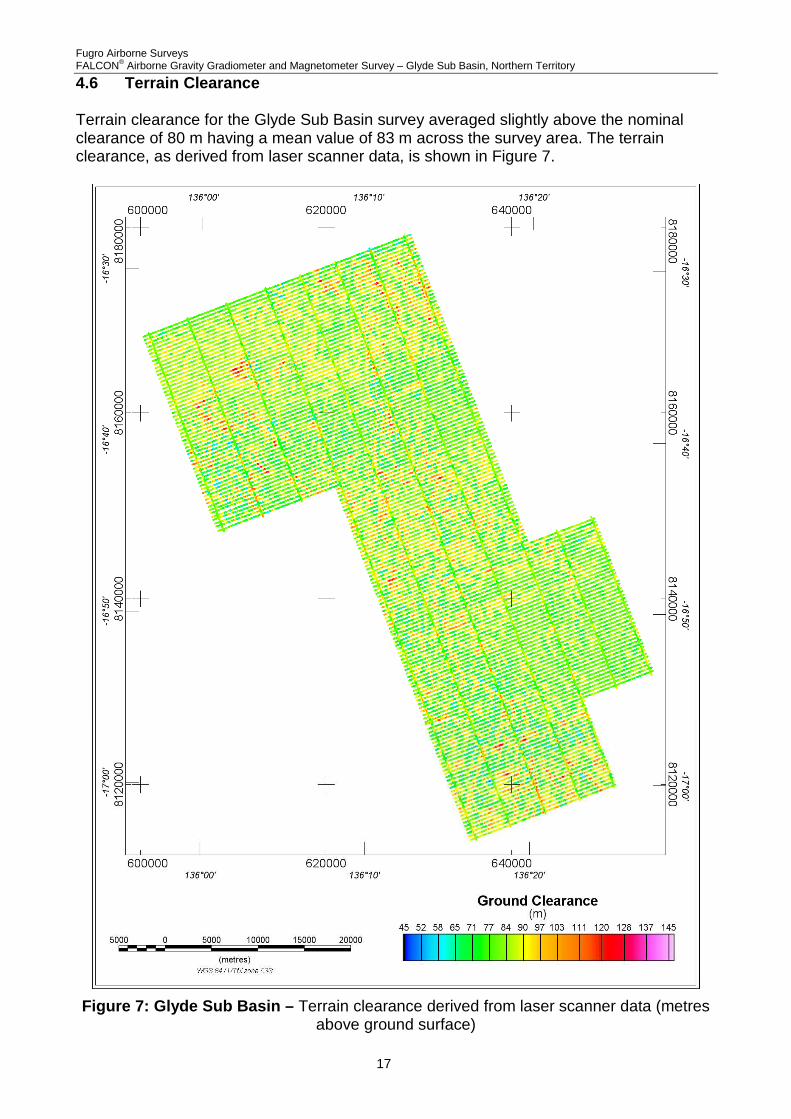
4.6 Terrain Clearance Terrain clearance for the Glyde Sub Basin survey averaged slightly above the nominal clearance of 80 m having a mean value of 83 m across the survey area. The terrain clearance, as derived from laser scanner data, is shown in Figure 7.
Figure 7: Glyde Sub Basin – Terrain clearance derived from laser scanner data (metres above ground surface)

Fugro Airborne Surveys FALCON® Airborne Gravity Gradiometer and Magnetometer Survey – Glyde Sub Basin, Northern Territory
18
5 FALCON® AIRBORNE GRAVITY GRADIENT (AGG) RESULTS 5.1 Processing Summary
FALCON ® AGG Processing Flow Chart
Figure 8: FALCON® AGG Data Processing
5.2 FALCON® Airborne Gravity Gradiometer Data Figure 8 summarises the steps involved in processing the AGG data obtained from the survey. The FALCON ® Airborne Gravity Gradiometer data were digitally recorded by the ADAS on removable hard drives. The raw data were then copied on to the field processing laptop, backed up twice onto DVD+R media and shipped to Fugro Perth using a secure courier service. Preliminary processing and QC of the FALCON ® AGG data were completed on-site using Fugro’s DiAGG software.
AGG data sub sampled to 8hz
DGPS imported
PMC calculated & applied S & T corrections applied
Tie line levelled data
Transformation to gD/GDD
Laser DTM grid @ 25 m cell size
AGG 8hz imported
AGG data QC
Flights (AGG data) merged
Self gradient (S) calculated
Terrain effects (T) calculated
Merged DTM into GDB
Demodulation (0.18 Hz)
Demodfilter / modulation (0.18hz)
Merge gD with the Geoscience Australia GAGAR09 grid
Laser scanner sub-sampled
Import and QC Laser data
Flight based laser data merged to combined GDB
Laser /SRTM grids merged

Fugro Airborne Surveys FALCON® Airborne Gravity Gradiometer and Magnetometer Survey – Glyde Sub Basin, Northern Territory
19
Further QC and final FALCON ® AGG data processing were performed by the office-based data processor. 5.3 Radar Altimeter Data The terrain clearance measured by the radar altimeter in metres was recorded at 10 Hz. The data were plotted and inspected for quality. 5.4 Laser Scanner Data Laser scanner returns were recorded at a rate of 20 scans per second with each scan returning 276 data points. Each return was converted to ground surface elevation by combining scanner range and angle data with aircraft position and attitude data. Computed elevations were then sub sampled by first dividing each scan into ten segments and combining five adjacent scans per segment , then using a special algorithm to select the optimum return within each data "bin" thus formed. Sub-sampled laser scanner data were edited to remove spikes prior to gridding. 5.5 Positional Data A number of programs were executed for the compilation of navigation data in order to reformat and recalculate positions in differential mode. Waypoint’s GrafNav GPS processing software was used to calculate DGPS positions from raw range data obtained from the moving (airborne) and stationary (ground) receivers. The GPS ground station position was determined by logging GPS data continuously for 24 hours prior to survey flights commencing. The GPS data were processed and quality controlled completely in the field using the WGS84 datum. Parameters for the WGS84 datum are:
Ellipsoid: WGS84 Semi-major axis: 6378137.0 m 1/flattening: 298.257
All processing was performed using WGS84/UTM Zone 53S coordinates. Final line data and final grid data were supplied in this projection. 5.6 Terrain Correction Terrain corrections were derived from the digital terrain model grid for every data point in the survey. A terrain density of 1.00 g/cm3 was used to compute the terrain correction channels, which were then multiplied by the chosen correction density before being subtracted from the data. In the consultation with the client and after testing with a terrain density tool, the standard correction density of 2.67 g/cm3 was selected. Typically 2.67 g/cm3 will work well for most terrain types but may lead to over correction or under correction in some areas. 5.7 Tie line Levelling The terrain corrected data and the uncorrected data were then tie line levelled. All lines were used in the levelling process to produce a single combined set of levelled data.
Fugro Airborne Surveys FALCON® Airborne Gravity Gradiometer and Magnetometer Survey – Glyde Sub Basin, Northern Territory
20
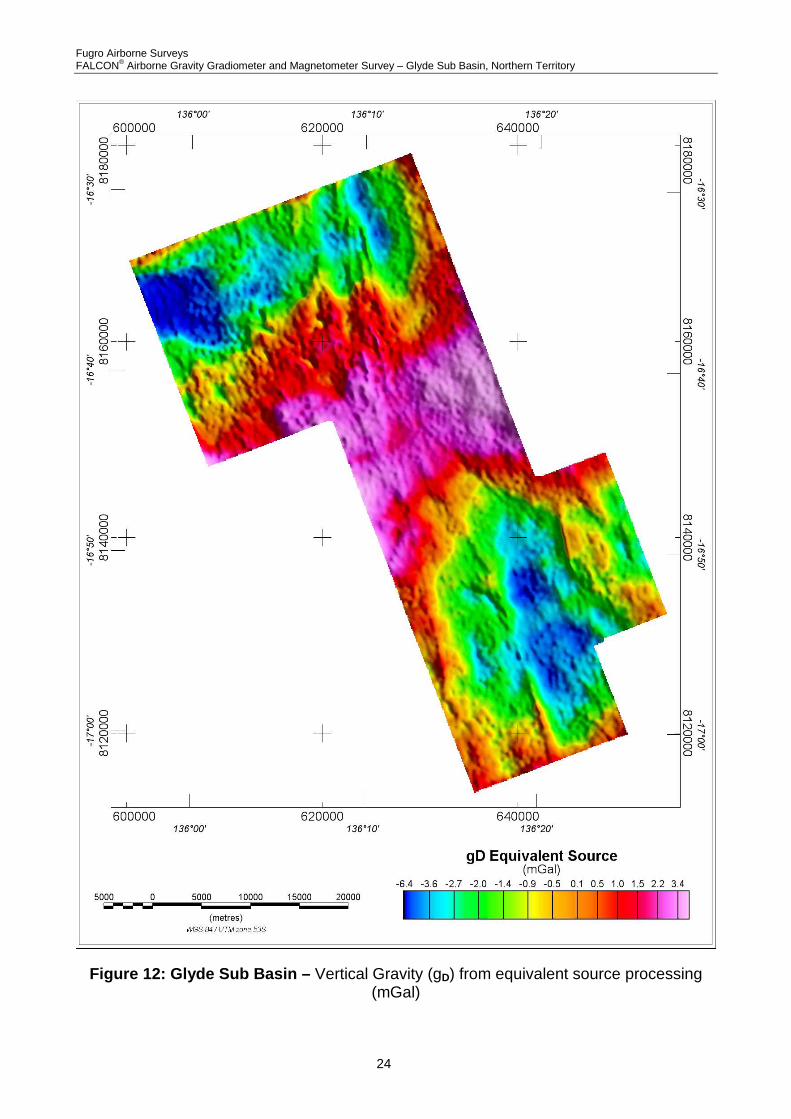
WARNING: Since tie line levelling is performed after terrain correction, the use of the levelled uncorrected data together with the terrain correction channels to create data corrected for a different terrain density will almost certainly result in residual levelling errors in the new corrected data. An alternative method for computing terrain corrected data for additional densities is described in section 9.11. 5.8 Micro-levelling Micro-levelling was applied to the tie line levelled data to remove residual long wavelength levelling errors. 5.9 FALCON® Airborne Gravity Gradient Data - G DD & gD The transformation into GDD and gD was accomplished using two methods: Fourier domain transformation and the Method of Equivalent Sources 5.9.1 Fourier The Fourier domain transformation method upward continues data to a horizontal surface on which the transformation is applied. The transformed data are then downward continued to the computation surface. A low-pass filter is applied to improve the signal to noise ratio by removing artefacts of the continuation process and other information which is known to be beyond the sampling resolution. A cut-off wavelength of 400 m was used in the low-pass filter. 5.9.2 Equivalent Source The equivalent source transformation utilises a smooth model inversion to calculate the density of a surface of sources followed by a forward calculation to produce gD and GDD. It was possible to closely match the short to medium wavelength characteristics of the Fourier results by placing the sources at a depth of 400 metres. 5.9.3 Drape Surfaces Both transformations use a smoothed surface onto which the output data are projected. These surfaces are smoother equivalents of the actual flying surface. The Fourier and equivalent source (density 2.67 g/cm3) GDD maps are shown in Figure 9 and Figure 10 respectively. Two versions of vertical gravity (gD) are presented: Fourier, derived by integrating GDD; and equivalent source, derived directly from the modelled sources. The (density 2.67 g/cm3) Fourier result is presented in Figure 11 and the (density 2.67 g/cm3) equivalent source result is presented in Figure 12.

Fugro Airborne Surveys FALCON® Airborne Gravity Gradiometer and Magnetometer Survey – Glyde Sub Basin, Northern Territory
21
Figure 9: Glyde Sub Basin – Vertical Gravity Gradient (GDD) from Fourier processing (E).

Fugro Airborne Surveys FALCON® Airborne Gravity Gradiometer and Magnetometer Survey – Glyde Sub Basin, Northern Territory
22
Figure 10: Glyde Sub Basin – Vertical Gravity Gradient (GDD) from equivalent source
processing (E).

Fugro Airborne Surveys FALCON® Airborne Gravity Gradiometer and Magnetometer Survey – Glyde Sub Basin, Northern Territory
23
Figure 11: Glyde Sub Basin – Vertical Gravity (gD) from Fourier processing (mGal)
Fugro Airborne Surveys FALCON® Airborne Gravity Gradiometer and Magnetometer Survey – Glyde Sub Basin, Northern Territory
24
Figure 12: Glyde Sub Basin – Vertical Gravity (gD) from equivalent source processing (mGal)
Fugro Airborne Surveys FALCON® Airborne Gravity Gradiometer and Magnetometer Survey – Glyde Sub Basin, Northern Territory
25
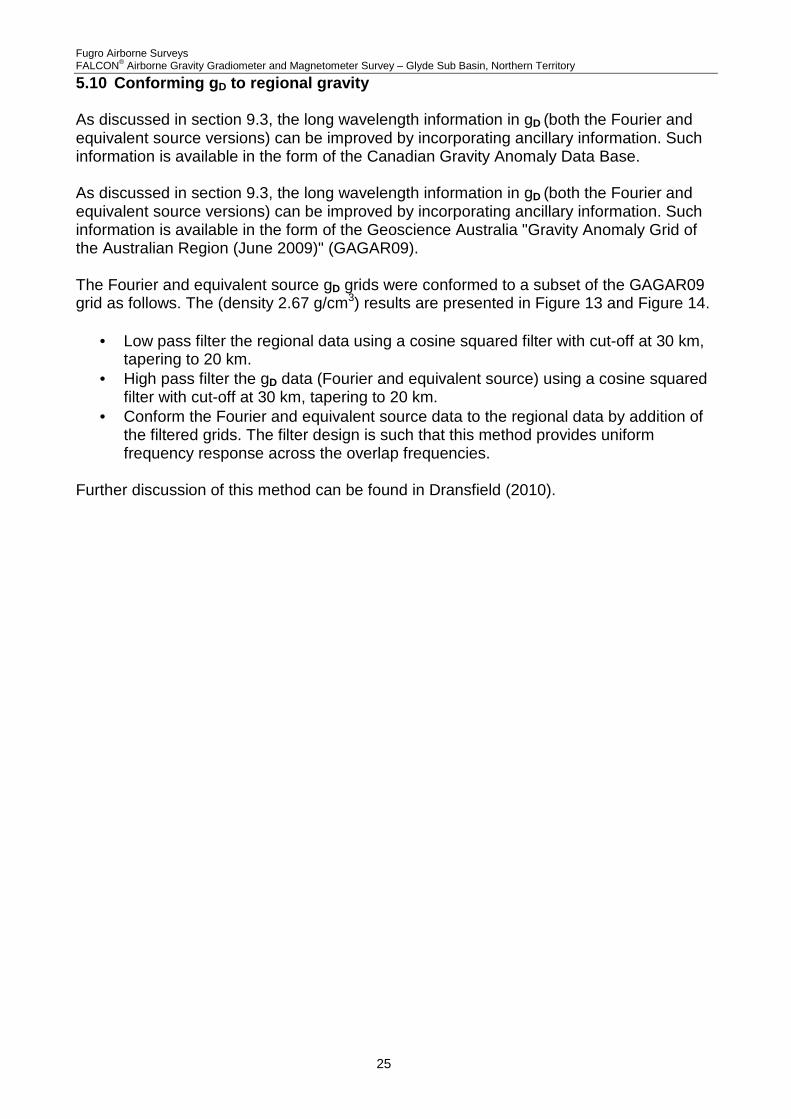
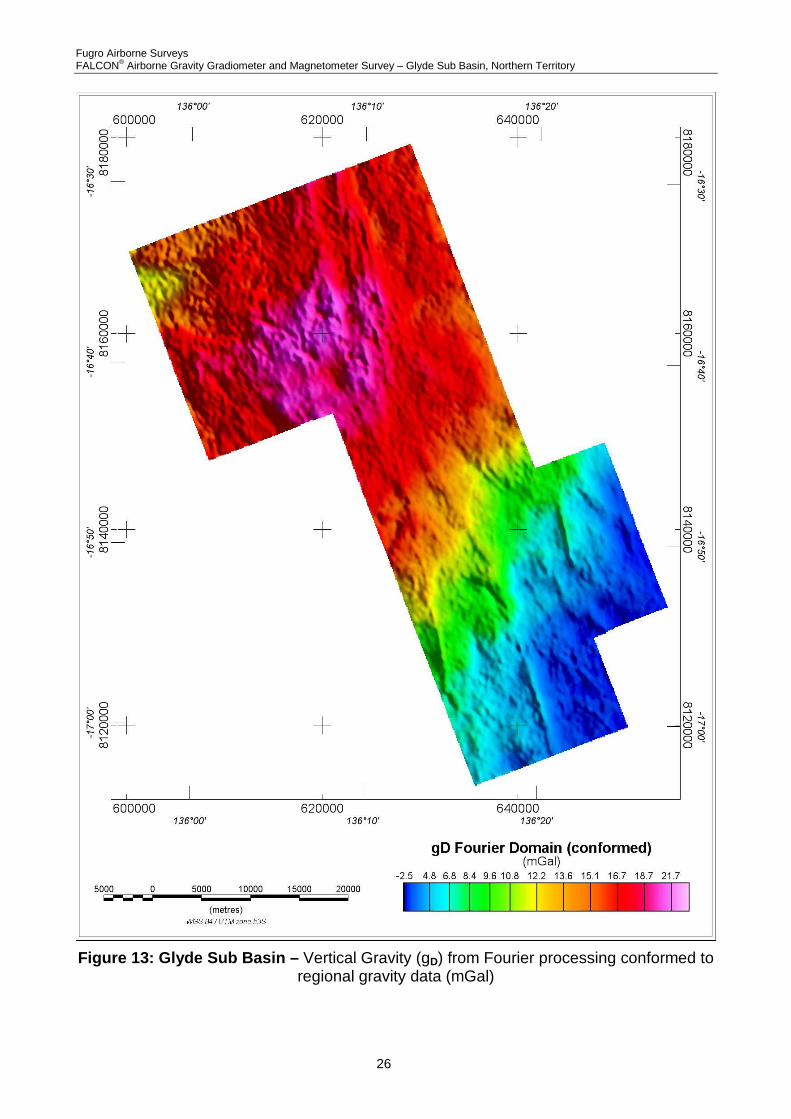
5.10 Conforming g D to regional gravity As discussed in section 9.3, the long wavelength information in gD (both the Fourier and equivalent source versions) can be improved by incorporating ancillary information. Such information is available in the form of the Canadian Gravity Anomaly Data Base. As discussed in section 9.3, the long wavelength information in gD (both the Fourier and equivalent source versions) can be improved by incorporating ancillary information. Such information is available in the form of the Geoscience Australia "Gravity Anomaly Grid of the Australian Region (June 2009)" (GAGAR09). The Fourier and equivalent source gD grids were conformed to a subset of the GAGAR09 grid as follows. The (density 2.67 g/cm3) results are presented in Figure 13 and Figure 14.
• Low pass filter the regional data using a cosine squared filter with cut-off at 30 km, tapering to 20 km.
• High pass filter the gD data (Fourier and equivalent source) using a cosine squared filter with cut-off at 30 km, tapering to 20 km.
• Conform the Fourier and equivalent source data to the regional data by addition of the filtered grids. The filter design is such that this method provides uniform frequency response across the overlap frequencies.
Further discussion of this method can be found in Dransfield (2010).
Fugro Airborne Surveys FALCON® Airborne Gravity Gradiometer and Magnetometer Survey – Glyde Sub Basin, Northern Territory
26
Figure 13: Glyde Sub Basin – Vertical Gravity (gD) from Fourier processing conformed to
regional gravity data (mGal)
Fugro Airborne Surveys FALCON® Airborne Gravity Gradiometer and Magnetometer Survey – Glyde Sub Basin, Northern Territory
27
Figure 14: Glyde Sub Basin – Vertical Gravity (gD) from equivalent source processing
conformed to regional gravity data (mGal).
Fugro Airborne Surveys FALCON® Airborne Gravity Gradiometer and Magnetometer Survey – Glyde Sub Basin, Northern Territory
28
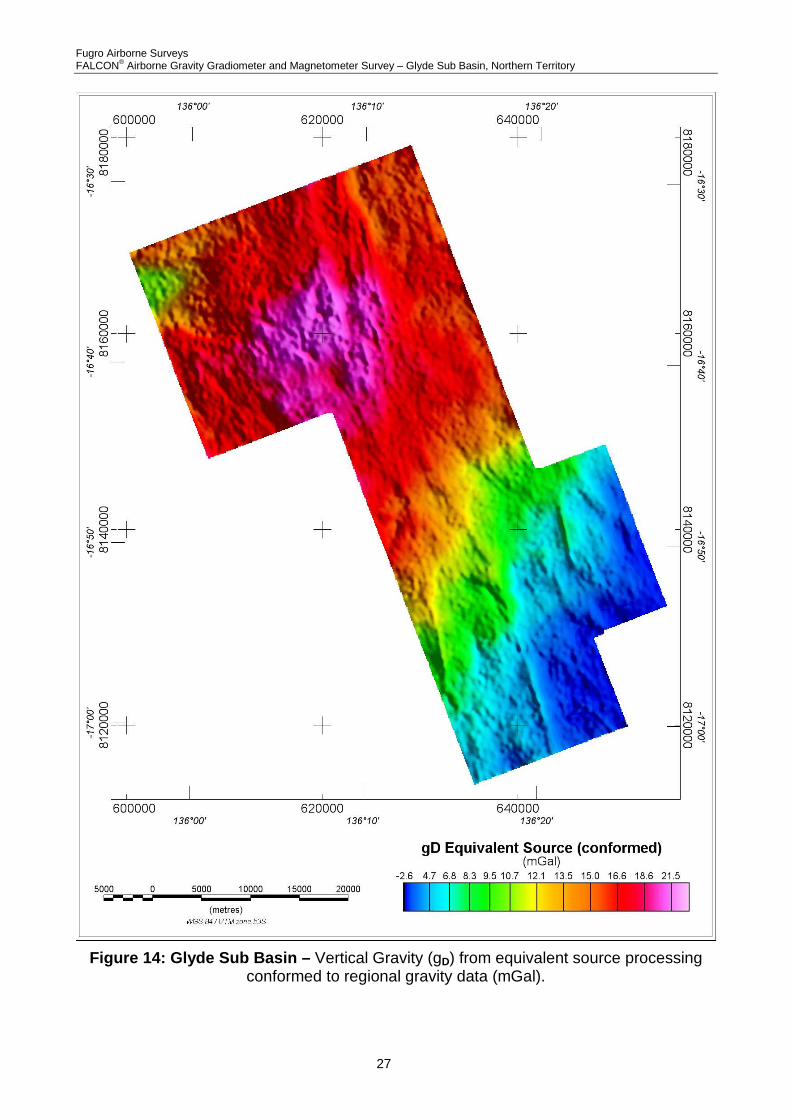
6 AEROMAGNETIC RESULTS 6.1 Processing Summary
Aeromagnetic Processing Flow Chart
Figure 15: Aeromagnetic Data Processing
6.2 Aeromagnetic Data Figure 15 summarises the steps involved in processing the aeromagnetic data obtained from the survey. The aeromagnetic data were digitally recorded by the FASDAS on removable hard drives. The raw data were then copied onto the field processing laptop, backed up twice onto hard drive media and sent via FTP to Fugro’s secure server. Preliminary QC of the aeromagnetic data was completed on-site using Fugro’s proprietary ATLAS software. Further QC and aeromagnetic data processing were performed by the office based data
MAG data sub sampled to 10hz
DGPS imported
Tie-line levelling
Residual Magnetic Intensity
MAG 10hz imported
MAG data QC
Flights (MAG data) merged
Lag correction applied
IGRF height correction
Micro-levelling
Diurnal subtraction + diurnal average
GPS sub-sampled
Import and QC GPS data
Final IGRF correction + IGRF average

Fugro Airborne Surveys FALCON® Airborne Gravity Gradiometer and Magnetometer Survey – Glyde Sub Basin, Northern Territory
29
processor. 6.3 Radar Altimeter Data The terrain clearance measured by the radar altimeter in metres was recorded at 10 Hz. The data were plotted and inspected for quality. 6.4 Positional Data A number of programs were executed for the compilation of navigation data in order to reformat and recalculate positions in differential mode. Waypoint’s GrafNav GPS processing software was used to calculate DGPS positions from raw range data obtained from the moving (airborne) and stationary (ground) receivers. The GPS ground station position was determined by logging GPS data continuously for 24 hours prior to survey flights commencing. The GPS data were processed and quality controlled completely in the field using the WGS84 datum. Parameters for the WGS84 datum are:
Ellipsoid: WGS84 Semi-major axis: 6378137.0 m 1/flattening: 298.257
All processing was performed using WGS84/UTM Zone 53S coordinates. Final line and grid data were supplied in this projection. 6.5 Lag Correction All aeromagnetic data were lagged while importing raw data. Any necessary adjustments are made during final processing and in this case, no further lag correction was applied. 6.6 IGRF Correction The regional effects of the earth’s magnetic field were corrected for by calculating the IGRF value at each fiducial using IGRF model 2010 and secular variation model. 6.7 Diurnal Subtraction The base station magnetics (diurnal) were filtered using a long wavelength filter to retain wavelengths longer than 51 seconds. This value was subtracted from the IGRF corrected total magnetic intensity and a base value of 48080 nT was added back to the magnetics. This produced the diurnally corrected residual magnetic intensity. 6.8 Tie-line Levelling At this stage the residual magnetic intensity data were tie-line levelled using Fugro’s proprietary ATLAS software. 6.9 Micro-levelling At this stage the residual magnetic intensity data were micro-levelled using Fugro’s proprietary ATLAS software.

Fugro Airborne Surveys FALCON® Airborne Gravity Gradiometer and Magnetometer Survey – Glyde Sub Basin, Northern Territory
30
6.10 Residual Magnetic Intensity The residual magnetic intensity data is presented in Figure 16.
Figure 16: Glyde Sub Basin – Residual Magnetic Intensity (nT)

Fugro Airborne Surveys FALCON® Airborne Gravity Gradiometer and Magnetometer Survey – Glyde Sub Basin, Northern Territory
31
7 APPENDIX I - SURVEY EQUIPMENT 7.1 Survey Aircraft A Fugro Airborne Surveys Cessna C208B turbo prop, Canadian registration VH-FAY was used to fly the survey area. The following instrumentation was used for this survey. 7.2 FALCON® Airborne Gravity Gradiometer FALCON® AGG System (Cavendish) The FALCON® AGG System is based on current state-of-the-art airborne gravity gradiometer technology and has been optimized for airborne broad band geophysical exploration. The system is capable of supporting surveying activities in areas ranging from 1,000 ft below sea level to 13,000 ft above sea level with aircraft speeds from 70 to 130 knots. The FALCON® AGG data streams were digitally recorded at different rates on removable drives installed in the FALCON® AGG electronics rack. 7.3 Airborne Data Acquisition Systems Fugro Digital Acquisition System (FASDAS) The Fugro FASDAS is a data acquisition system executing propriety software for the acquisition and recording of location, magnetic and ancillary data. Data are presented both numerically and graphically in real time on the VGA display providing on-line quality control capability. The FASDAS is also used for real time navigation. A pre-programmed flight plan containing boundary coordinates, line start and end coordinates, the altitude values calculated for a theoretical drape surface, line spacing and cross track definitions is loaded into the computer prior to each flight. The WGS-84 latitude and longitude and altitude received from the real-time corrected, dual frequency Novatel OEMV L1/l2-Band Positioning receiver, is transformed to the local coordinate system for cross track and distance to go values. This information, together with ground heading and speed, is displayed to the pilot numerically and graphically on a two line LCD display. It is also presented on the operator LCD screen in conjunction with a pictorial representation of the survey area, survey lines and ongoing flight path. FALCON® AGG Data Acquisition System (ADAS) The FASDAS provides control and data display for the FALCON® AGG system. Data are displayed in real time for the operator and warnings displayed should system parameters deviate from tolerance specifications. All FALCON® AGG and laser scanner data are recorded to a removable hard drive. 7.4 Aerial and Ground Magnetometers The airborne Caesium magnetometer was a Scintrex CS-2 having a noise envelope of 0.002nT pk-pk in 0.01-1Hz bandwidth. The ground magnetometer was a Scintrex CS2 Caesium sensor sampling at 1Hz. 7.5 Real-Time Differential GPS Novatel OEMV L-Band Positioning The Novatel OEMV L-band Positioning receiver provides real-time differential GPS for the onboard navigation system. The differential data set was relayed via a geo-synchronous
Fugro Airborne Surveys FALCON® Airborne Gravity Gradiometer and Magnetometer Survey – Glyde Sub Basin, Northern Territory
32
satellite to the aircraft where the receiver optimized the corrections for the current location. 7.6 GPS Base Station Receiver Novatel OEM4 L1/L2 The Novatel GPS receiver is a 12 channel dual frequency GPS receiver. It provides raw range information of all satellites in view sampled every second and recorded on a computer laptop. These data are post-processed with the rover data to provide differential GPS (DGPS) corrections for the flight path. 7.7 Altimeters Collins ALT-55 Radio Altimeter The radar altimeter has a resolution of 1m, an accuracy of 2%, a range of 1-2,500 ft and a measurement rate of 10 Hz. 7.8 Laser Scanner Riegl LMS-Q140I-80 The laser scanner is designed for high speed line scanning applications. The system is based upon the principle of time-of-flight measurement of short laser pulses in the infrared wavelength region and the angular deflection of the laser beam is obtained by a rotating polygon mirror wheel. The measurement range is up to 400 m with a minimum range of 2 m and an accuracy of 50mm. The laser beam is eye safe, the laser wavelength is 0.9 µm, the scan angle range is +/- 40º and the scan speed is 20 scans/s. 7.9 Data Processing Hardware and Software The following equipment and software were used: Hardware
• One 2.0 GHz (or higher) laptop computer • External USB hard drive reader for ADAS removable drives • Two External USB hard drives for data backup • HP DeskJet All-In-One printer, copier, scanner
Software
• Oasis Montaj data processing and imaging software • GrafNav Differential GPS processing software • Fugro - Atlas data processing software • Fugro - DiAGG processing software
Fugro Airborne Surveys FALCON® Airborne Gravity Gradiometer and Magnetometer Survey – Glyde Sub Basin, Northern Territory
33
8 APPENDIX II - SYSTEM TESTS 8.1 Instrumentation Lag Due to the relative position of the magnetometer, altimeters and GPS antenna on the aircraft and to processing/recording time lags, raw readings from each data stream vary in position. To correct for this and to align selected anomaly features on lines flown in opposite directions, the magnetic and altimeter data are ‘parallaxed’ with respect to the position information. The lags were applied to the data during processing. 8.2 Radar Altimeter Calibration The radar altimeter is checked for accuracy and linearity every 12 months, or when any change in a key system component requires this procedure to be carried out. This calibration allows the radar altimeter data to be compared and assessed with the other height data (GPS, barometric and laser) to confirm the accuracy of the radar altimeter over its operating range. The calibration is performed by flying a number of 30 second lines at preselected terrain clearances over an area of flat terrain and using the results of the radar altimeter, differentially corrected GPS heights in mean sea level (MSL) and laser scanner were used to derive slope and offset information. 8.3 FALCON® AGG Noise Measurement At the commencement of the survey, 20 minutes of data were collected with the aircraft in straight level flight at 3500 ft AGL. These data were processed as a survey line to check the AGG noise levels. Daily flight debriefs incorporating FALCON® AGG performance statistics for each flight line are prepared using output from Fugro DiAGG software. These are sent daily to Fugro office staff for performance evaluation. 8.4 Daily Calibrations A set of daily calibrations were performed each survey day as follows:
Magnetic base station time check AGG Quiescent Calibration
8.4.1 Magnetic Base Station Time Check Prior to each day’s survey all magnetic base stations were synchronised using broadcast GPS time signals. 8.4.2 FALCON ® AGG Calibration A calibration was performed at the beginning of each flight and the results monitored by the operator. The coefficients obtained from each of the calibrations were used in the processing of the data.
Fugro Airborne Surveys FALCON® Airborne Gravity Gradiometer and Magnetometer Survey – Glyde Sub Basin, Northern Territory
34
9 APPENDIX III - FALCON ® AGG DATA & PROCESSING 9.1 Nomenclature The FALCON® airborne gravity gradiometer (AGG) system adopts a North, East, and Down coordinate sign convention and these directions (N, E, and D) are used as subscripts to identify the gravity gradient tensor components (gravity vector derivatives). Lower case is used to identify the components of the gravity field and upper case to identify the gravity gradient tensor components. Thus the parameter usually measured in a normal exploration ground gravity survey is gD and the vertical gradient of this component is GDD. 9.2 Units The vertical component of gravity (gD) is delivered in the usual units of mGal. The gradient tensor components are delivered in eotvos, which is usually abbreviated to “E”. By definition 1 E = 10-4 mGal/m. 9.3 FALCON® Airborne Gravity Gradiometer Surveys In standard ground gravity surveys, the component measured is “gD”, which is the vertical component of the acceleration due to gravity. In airborne gravity systems, since the aircraft is itself accelerating, measurement of “gD” cannot be made to the same precision and accuracy as on the ground. Airborne gravity gradiometry uses a differential measurement to remove the aircraft motion effects and delivers gravity data of a spatial resolution and sensitivity comparable with ground gravity data. The FALCON® gradiometer instrument acquires two curvature components of the gravity gradient tensor namely GNE and GUV where GUV = (GNN – GEE)/2. A feature of the FALCON® AGG system is that two independent measurements are made of both the NE and UV curvature components. This is achieved by using two sets of accelerometers, referred to as the A complement and the B complement. Each complement consists of four accelerometers. The measured gradients from these complements are referred to as ANE and AUV and BNE and BUV. The GNE and GUV gradients are computed by averaging A and B:
GNE = (ANE + BNE)/2 GUV = (AUV + BUV)/2
Since these curvature components cannot easily and intuitively be related to the causative geology, they are transformed into the vertical gravity gradient (GDD), and integrated to derive the vertical component of gravity (gD). Interpreters display, interpret and model both GDD and gD. The directly measured GNE and GUV data are appropriate for use in inversion software to generate density models of the earth. The vertical gravity gradient, GDD, is more sensitive to small or shallow sources and has greater spatial resolution than gD (similar to the way that the vertical magnetic gradient provides greater spatial resolution and increased sensitivity to shallow sources of the magnetic field). In the integration of GDD to give gD, the very long wavelength component, at wavelengths comparable to or greater than the size of the survey area, cannot be fully recovered. Long wavelength gravity are therefore incorporated in the gD data from other sources. This might be regional ground, airborne or marine gravity if such data are available. The Danish National Space Centre global gravity data of 2008 (DNSC08) are used as a default if other data are not available.

Fugro Airborne Surveys FALCON® Airborne Gravity Gradiometer and Magnetometer Survey – Glyde Sub Basin, Northern Territory
35
9.4 Gravity Data Processing The main elements and sequence of processing of the gravity data are given below. Unless not applicable or specified otherwise, the processing step is applied to each individual complement element (ANE, AUV, BNE, BUV):
1. Dynamic corrections for residual aircraft motion (called Post Mission Compensation or PMC) are calculated and applied.
2. Self gradient corrections are calculated and applied to reduce the time-varying gradient response from the aircraft and platform.
3. A Digital Terrain Model (DTM) is created from the laser scanner range data, the AGG inertial navigation system rotation data and the DGPS position data.
4. Terrain corrections are calculated and applied. 5. Tie line levelling, and micro-levelling (where necessary) are applied. 6. GNE and GUV are transformed into the full gravity gradient tensor, including GDD, and
into gD. 9.5 Aircraft dynamic corrections The design and operation of the FALCON® AGG results in very considerable reduction of the effects of aircraft acceleration but residual levels are still significant and further reduction is required and must be done in post-processing. Post-processing correction relies on monitoring the inertial acceleration environment of the gravity gradiometer instrument (GGI) and constructing a model of the response of the GGI to this environment. Parameters of the model are adjusted by regression to match the sensitivity of the GGI during data acquisition. The modelled GGI output in response to the inertial sensitivities is subtracted from the observed output. Application of this technique to the output of the GGI, when it is adequately compensated by its internal mechanisms, reduces the effect of aircraft motion to acceptable levels. Following these corrections, the gradient data are demodulated and filtered along line using a 6-pole Butterworth low-pass filter with a cut-off frequency of 0.18 Hz. 9.6 Self gradient Corrections The GGI is mounted in gimbals controlled by an inertial navigation system which keeps the GGI pointing in a fixed direction whilst the aircraft and gimbals rotate around it. Consequently, the GGI measures a time-varying gravity gradient due to these masses moving around it as the heading and attitude of the aircraft changes during flight. This is called the self-gradient. Like the aircraft dynamic corrections, the self-gradient is calculated by regression of model parameters against measured data. In this case, the rotations of the gimbals are the input variables of the model. Once calculated, the modelled output is subtracted from the observed output. 9.7 Laser Scanner Processing The laser scanner measures the range from the aircraft to the ground in a swath of angular width ±40 degrees below the aircraft. The aircraft attitude (roll, pitch and heading) data provided by the AGG inertial navigation system are used to adjust the range data for
Fugro Airborne Surveys FALCON® Airborne Gravity Gradiometer and Magnetometer Survey – Glyde Sub Basin, Northern Territory
36
changes in attitude and the processed differential GPS data are used to reference the range data to located ground elevations referenced to the WGS 84 datum. Statistical filtering strategies are used to remove anomalous elevations due to foliage or built up environment. The resulting elevations are gridded to form a digital terrain model (DTM). 9.8 Terrain Corrections An observation point above a hill has excess mass beneath it compared to an observation point above a valley. Since gravity is directly proportional to the product of the masses, uncorrected gravity data have a high correlation with topography. It is therefore necessary to apply a terrain correction to gravity survey data. For airborne gravity gradiometry at low survey heights, a detailed DTM is required. Typically, immediately below the aircraft, the digital terrain will need to be sampled at a cell size roughly one-third to one-half of the survey height and with a position accuracy of better than 1 metre. For these accuracies, LIDAR data are required and each FALCON® survey aircraft comes equipped with LIDAR (laser scanner). If bathymetric data are used then these form a separate terrain model for which terrain corrections are calculated at a density chosen to suit the water bottom – water interface. Once the DTM has been merged, the terrain corrections for each of the GNE and GUV data streams are calculated. In the calculation of terrain corrections, a density of 1 gm/cc is used. The calculated corrections are stored in the database allowing the use of any desired terrain correction density by subtracting the product of desired density and correction from the measured GNE and GUV data. The terrain correction density is chosen to be representative of the terrain density over the survey area. Sometimes more than one density is used with input from the client. Typically, the terrain corrections are calculated over a distance 10 km from each survey measurement point. 9.9 Tie line Levelling The terrain- and Self gradient-corrected GNE and GUV data are tie line levelled across the entire survey using a least-squares minimisation of differences at survey line intersections. Occasionally some micro-levelling might be performed. 9.10 Transformation into G DD & gD The transformation of the measured, corrected and levelled GNE and GUV data into gravity and components of the full gravity gradient tensor is accomplished using two methods:
- Fourier domain transformation and - Equivalent source transformation.
The input data for the Fourier method are the average NE and UV components computed from the complement data, as described in section 9.3. The Fourier method relies on the Fourier transform of Laplace’s equation. The application of this transform to the complex function GNE + i GUV provides a stable and accurate calculation of each of the full tensor components and gravity. The Fourier method performs piece-wise upward and downward continuation to work with data collected on a surface that varies from a flat horizontal plane. For stability of the downward continuation, the data are low-pass filtered. The cut-off wavelength of this filter depends on the variations in altitude and the line spacing. It is set to the smallest value that provides stable downward continuation.

Fugro Airborne Surveys FALCON® Airborne Gravity Gradiometer and Magnetometer Survey – Glyde Sub Basin, Northern Territory
37
In survey areas where the variability of the terrain surface (and hence the flight surface) makes it impossible to obtain Fourier transformation results that are both high resolution and stable, an alternate method can be applied which bypasses the upward and downward continuation steps. The results are calculated at the flight surface. This approach lacks the mathematical rigour of the complete method but allows for greater detail in the output data. The input data for the equivalent source method are the individual NE and UV component data from each complement, as referred to in section Error! Reference source not found. . The equivalent source method relies on a smooth model inversion to calculate the density of a surface of sources and from these sources, a forward calculation provides the GDD and gD data. The smoothing results in an output that is equivalent to the result of the low-pass filter in the Fourier domain method. The Fourier method generates all tensor components but the equivalent source method only generates GDD and gD (and GNE and GUV for comparison with the inputs). The limitations of gravity gradiometry in reconstructing the long wavelengths of gravity can lead to differences in the results of these two methods at long wavelength. The merging of the gD data with externally supplied regional gravity such as the DNSC08 gravity provides a way of reducing these differences. 9.11 Terrain Corrections Using Alternate Terrain De nsities Although both uncorrected processed and transformed data and unit density terrain correction data are supplied, it is not recommended that these be used to create final data corrected for any arbitrary terrain correction density. The principal reason for this is that tie line levelling occurs after application of the terrain correction. As a result, levelling errors present in the terrain correction channels by virtue of positional inaccuracy are not removed from these channels and will be present in any data corrected with them. Further, filtering applied in creating the uncorrected, transformed data is not applied to the terrain correction channels. Mixing data filtered in different ways is not advised. An alternative method uses the linear relationship between the terrain corrections at different densities and the corresponding gravity gradient or gD values. This method can be applied to either the grid data or the located data. An example is given using GDD:
The new density is referred to as ρN, the existing densities as ρ1 and ρ2
GDD(ρN) = GDD(ρ1) + (GDD(ρ2) - GDD(ρ1))*(ρN - ρ1)/(ρ2 - ρ1) Note that the terrain correction channel is eliminated by substitution in deriving this equation. It is recommended that two densities that differ by a reasonable value be used for this method, in order to minimise uncertainties caused by noise in the data. The values of 0.00 and 2.67 g/cm3 usually delivered should be sufficient to yield useful results. 9.12 Noise & Signal By taking two independent measurements of the NE and UV curvature components at each sample point, it is possible to obtain a direct indication of the reliability of these

Fugro Airborne Surveys FALCON® Airborne Gravity Gradiometer and Magnetometer Survey – Glyde Sub Basin, Northern Territory
38
measurements. The standard deviation of half the difference of the pairs of measurements - (ANE,BNE) and (AUV,BUV) - provides a good estimate of the survey noise:
NoiseNE = StdDev((ANE - BNE)/2) Noiseuv = StdDev((Auv - Buv)/2)
These difference channels are calculated for each data point. The standard deviation across all data points is the figure quoted for the survey as a whole. This difference error has been demonstrated to follow a ‘normal’ or Gaussian statistical distribution, with a mean of zero. Therefore, the bulk of the population (95%) will lie between -2σ and +2σ of the mean. For a typical survey noise estimate of, say, 3 E, 95% of the noise will be between -6 E and +6 E. These typical errors in the curvature gradients translate to errors in GDD of about 5 E and in gD (in the shorter wavelengths) in the order of 0.1 mGal. 9.13 Risk Criteria in Interpretation The risks associated with a FALCON® AGG survey are mainly controlled by the following factors.
• Survey edge anomalies – the transformation from measured curvature gradients to vertical gradient and vertical gravity gradient is subject to edge effects. Hence any anomalies located within about 2 x line spacing of the edge of the survey boundaries should be treated with caution.
• Single line anomalies – for a wide-spaced survey, an anomaly may be present on only one line. Although it might be a genuine anomaly, the interpreter should note that no two-dimensional control can be applied.
• Low amplitude (less than 2 σ) anomalies – Are within the noise envelope and need to be treated with caution, if they are single line anomalies and close in diameter to the cut-off wavelengths used.
• Residual topographic error anomalies – Inaccurate topographic correction either due to inaccurate DTM or local terrain density variations may produce anomalies. Comparing the DTM with the GDD map terrain-corrected for different densities is a reliable way to confirm the legitimacy of an anomaly.
• The low density of water and lake sediments – (if present) can create significant gravity and gravity gradient lows which may be unrelated to bedrock geology. It is recommended that all anomalies located within lakes or under water be treated with caution and assessed with bathymetry if available.
9.14 References
Boggs, D. B. and Dransfield, M. H., 2004, Analysis of errors in gravity derived from the Falcon® airborne gravity gradiometer, Lane, R. (ed.), Airborne Gravity 2004 - Abstracts from the ASEG-PESA Airborne Gravity 2004 Workshop, Geoscience Australia Record 2004/18, 135-141.
Dransfield, M. H., 2010, Conforming Falcon gravity and the global gravity anomaly, Geophysical Prospecting, 58, 469-483.
Fugro Airborne Surveys FALCON® Airborne Gravity Gradiometer and Magnetometer Survey – Glyde Sub Basin, Northern Territory
39
Dransfield, M. H. and Lee, J. B., 2004, The FALCON® airborne gravity gradiometer survey systems, Lane, R. (ed.), Airborne Gravity 2004 - Abstracts from the ASEG-PESA Airborne Gravity 2004 Workshop, Geoscience Australia Record 2004/18, 15-19.
Dransfield, M. H. and Zeng, Y., Airborne gravity gradiometry: terrain corrections and elevation error, submitted to Geophysics.
Lee, J. B., 2001, FALCON Gravity Gradiometer Technology, Exploration Geophysics, 32, 75-79.
Lee, J. B.; Liu, G.; Rose, M.; Dransfield, M.; Mahanta, A.; Christensen, A. and Stone, P., 2001, High resolution gravity surveys from a fixed wing aircraft, Geoscience and Remote Sensing Symposium, 2001. IGARSS '01. IEEE 2001 International, 3, 1327-1331.
Stone, P. M. and Simsky, A., 2001, Constructing high resolution DEMs from Airborne Laser Scanner Data, Preview, Extended Abstracts: ASEG 15th Geophysical Conference and Exhibition, August 2001, Brisbane, 93, 99.

Fugro Airborne Surveys FALCON® Airborne Gravity Gradiometer and Magnetometer Survey – Glyde Sub Basin, Northern Territory
40
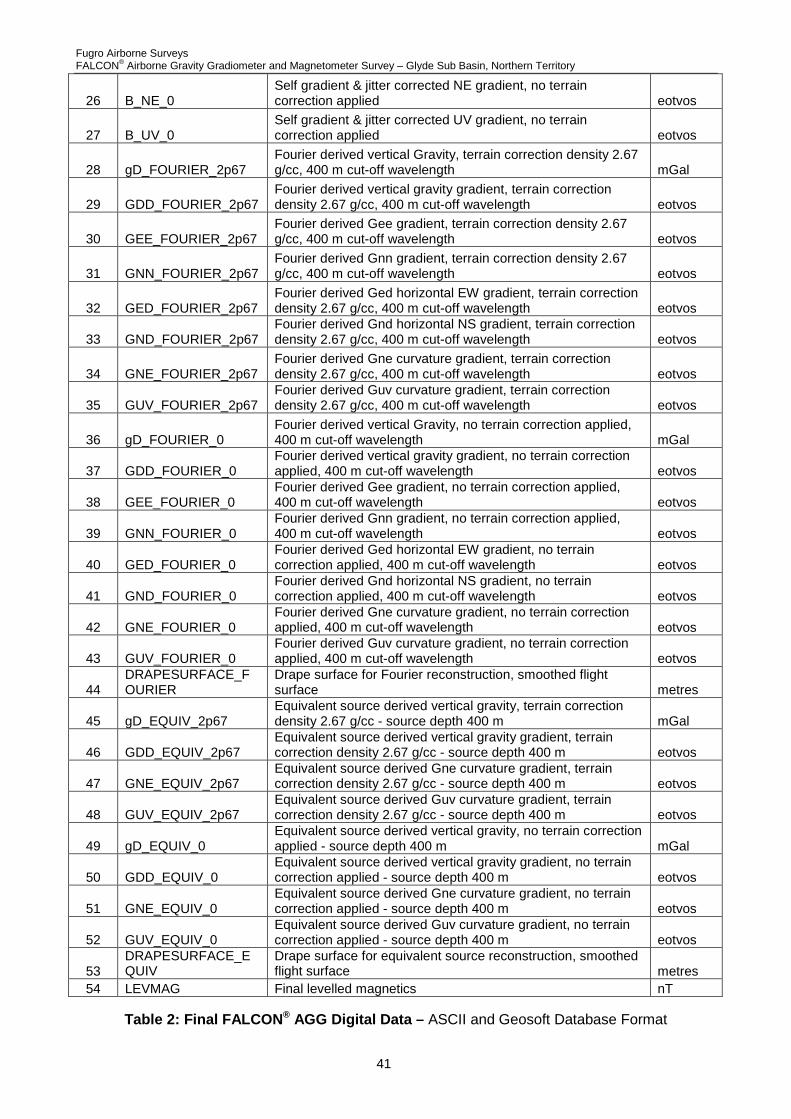
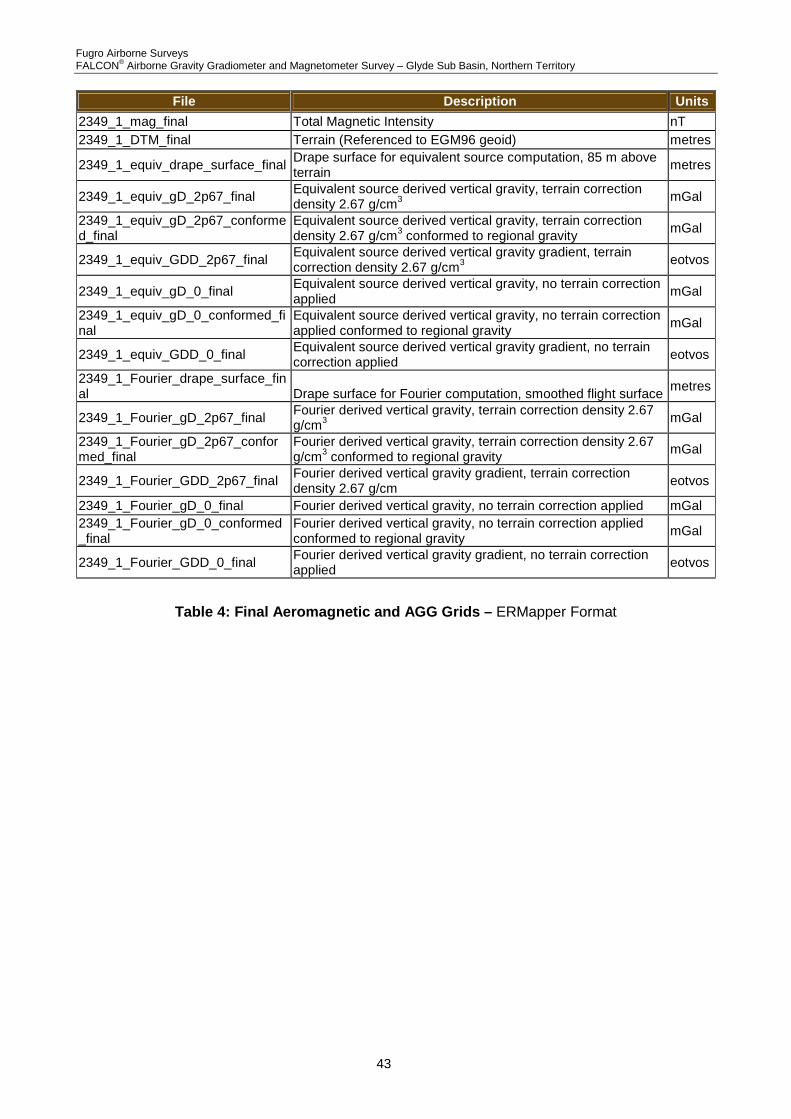
10 APPENDIX IV - FINAL PRODUCTS Final FALCON® AGG digital line data were provided in 8 Hz ASCII and Geosoft Oasis GDB database files containing the fields and format described in Table 2 below. Final aeromagnetic digital line data were provided in 10Hz ASCII and Geosoft Oasis GDB database files containing the fields and format described in Table 3 below. Grids of Fourier and equivalent source products, Total Magnetic Intensity, as well as the DTM were delivered, as described in Table 4 below. The grids are in ERMapper ERS formats with a 100 m cell size, with the exception of the DTM grid which has a 25 m cell size. One copy of the digital archives was delivered along with a hard copy of this Logistics and Processing Report. Field Variable Description Units
1 EASTING WGS84 UTM53S Easting metres 2 NORTHING WGS84 UTM53S Northing metres 3 Line Line number 4 Flight Flight number
5 Date Gregorian Date YYYYMMDD
6 LONGITUDE WGS84 Longitude degrees 7 LATITUDE WGS84 Latitude degrees 8 ALTITUDE_Ellipsoid GPS antenna height above WGS84 ellipsoid metres
9 ALTITUDE GPS antenna height above WGS84 ellipsoid with geoid (EGM96) correction applied metres
10 time Universal Time (seconds since January 6 1980) seconds
11 alt_RADAR Radar altimeter (aircraft's height above terrain as measured by the radar altimeter) metres
12 HEIGHT Flying height, (aircraft's height above terrain as derived from laser scanner and ALTITUDE data) metres
13 DTM Terrain height above WGS84 ellipsoid with Geoid (EGM96) correction applied metres
14 TURBULENCE Estimated vertical platform turbulence (vertical acceleration where g = 9.80665 m/sec/sec) milli g
15 T_DD Terrain effect calculated for DD using a density of 1g/cc eotvos 16 T_NE Terrain effect calculated for NE using a density of 1g/cc eotvos 17 T_UV Terrain effect calculated for UV using a density of 1g/cc eotvos
18 Err_NE NE gradient uncorrelated noise estimate, after levelling eotvos
19 Err_UV UV gradient uncorrelated noise estimate, after levelling eotvos
20 A_NE_2p67 Self gradient, jitter & terrain corrected NE gradient, terrain correction density 2.67 g/cc eotvos
21 A_UV_2p67 Self gradient, jitter & terrain corrected UV gradient, terrain correction density 2.67 g/cc eotvos
22 B_NE_2p67 Self gradient, jitter & terrain corrected NE gradient, terrain correction density 2.67 g/cc eotvos
23 B_UV_2p67 Self gradient, jitter & terrain corrected UV gradient, terrain correction density 2.67 g/cc eotvos
24 A_NE_0 Self gradient & jitter corrected NE gradient, no terrain correction applied eotvos
25 A_UV_0 Self gradient & jitter corrected UV gradient, no terrain correction applied eotvos
Fugro Airborne Surveys FALCON® Airborne Gravity Gradiometer and Magnetometer Survey – Glyde Sub Basin, Northern Territory
41
26 B_NE_0 Self gradient & jitter corrected NE gradient, no terrain correction applied eotvos
27 B_UV_0 Self gradient & jitter corrected UV gradient, no terrain correction applied eotvos
28 gD_FOURIER_2p67 Fourier derived vertical Gravity, terrain correction density 2.67 g/cc, 400 m cut-off wavelength mGal
29 GDD_FOURIER_2p67 Fourier derived vertical gravity gradient, terrain correction density 2.67 g/cc, 400 m cut-off wavelength eotvos
30 GEE_FOURIER_2p67 Fourier derived Gee gradient, terrain correction density 2.67 g/cc, 400 m cut-off wavelength eotvos
31 GNN_FOURIER_2p67 Fourier derived Gnn gradient, terrain correction density 2.67 g/cc, 400 m cut-off wavelength eotvos
32 GED_FOURIER_2p67 Fourier derived Ged horizontal EW gradient, terrain correction density 2.67 g/cc, 400 m cut-off wavelength eotvos
33 GND_FOURIER_2p67 Fourier derived Gnd horizontal NS gradient, terrain correction density 2.67 g/cc, 400 m cut-off wavelength eotvos
34 GNE_FOURIER_2p67 Fourier derived Gne curvature gradient, terrain correction density 2.67 g/cc, 400 m cut-off wavelength eotvos
35 GUV_FOURIER_2p67 Fourier derived Guv curvature gradient, terrain correction density 2.67 g/cc, 400 m cut-off wavelength eotvos
36 gD_FOURIER_0 Fourier derived vertical Gravity, no terrain correction applied, 400 m cut-off wavelength mGal
37 GDD_FOURIER_0 Fourier derived vertical gravity gradient, no terrain correction applied, 400 m cut-off wavelength eotvos
38 GEE_FOURIER_0 Fourier derived Gee gradient, no terrain correction applied, 400 m cut-off wavelength eotvos
39 GNN_FOURIER_0 Fourier derived Gnn gradient, no terrain correction applied, 400 m cut-off wavelength eotvos
40 GED_FOURIER_0 Fourier derived Ged horizontal EW gradient, no terrain correction applied, 400 m cut-off wavelength eotvos
41 GND_FOURIER_0 Fourier derived Gnd horizontal NS gradient, no terrain correction applied, 400 m cut-off wavelength eotvos
42 GNE_FOURIER_0 Fourier derived Gne curvature gradient, no terrain correction applied, 400 m cut-off wavelength eotvos
43 GUV_FOURIER_0 Fourier derived Guv curvature gradient, no terrain correction applied, 400 m cut-off wavelength eotvos
44 DRAPESURFACE_FOURIER
Drape surface for Fourier reconstruction, smoothed flight surface metres
45 gD_EQUIV_2p67 Equivalent source derived vertical gravity, terrain correction density 2.67 g/cc - source depth 400 m mGal
46 GDD_EQUIV_2p67 Equivalent source derived vertical gravity gradient, terrain correction density 2.67 g/cc - source depth 400 m eotvos
47 GNE_EQUIV_2p67 Equivalent source derived Gne curvature gradient, terrain correction density 2.67 g/cc - source depth 400 m eotvos
48 GUV_EQUIV_2p67 Equivalent source derived Guv curvature gradient, terrain correction density 2.67 g/cc - source depth 400 m eotvos
49 gD_EQUIV_0 Equivalent source derived vertical gravity, no terrain correction applied - source depth 400 m mGal
50 GDD_EQUIV_0 Equivalent source derived vertical gravity gradient, no terrain correction applied - source depth 400 m eotvos
51 GNE_EQUIV_0 Equivalent source derived Gne curvature gradient, no terrain correction applied - source depth 400 m eotvos
52 GUV_EQUIV_0 Equivalent source derived Guv curvature gradient, no terrain correction applied - source depth 400 m eotvos
53 DRAPESURFACE_EQUIV
Drape surface for equivalent source reconstruction, smoothed flight surface metres
54 LEVMAG Final levelled magnetics nT
Table 2: Final FALCON ® AGG Digital Data – ASCII and Geosoft Database Format

Fugro Airborne Surveys FALCON® Airborne Gravity Gradiometer and Magnetometer Survey – Glyde Sub Basin, Northern Territory
42
Field Variable Description Units
1 EASTING WGS84 UTM53S Easting metres 2 NORTHING WGS84 UTM53S Northing metres 3 Line Line number 4 Flight Flight number 5 Date Gregorian Date YYYYMMDD 6 LONGITUDE WGS84 Longitude degrees 7 LATITUDE WGS84 Latitude degrees 8 ALTITUDE_Ellipsoid GPS antenna height above WGS84 ellipsoid metres
9 ALTITUDE GPS antenna height above WGS84 ellipsoid with geoid (EGM96) correction applied metres
10 time Universal Time (seconds since January 6 1980) seconds
11 alt_RADAR Radar altimeter (aircraft's height above terrain as measured by the radar altimeter) metres
12 DTM Terrain height above WGS84 ellipsoid with Geoid (EGM96) correction applied (sampled from DTM grid) metres
13 RAWMAG Raw magnetic intensity - Lagged, unfiltered, uncompensated TMI nT
14 COMPMAG Compensated magnetic intensity - Lagged, de-spiked, compensated TMI nT
15 DIURNAL Despiked, lightly filtered ground station mag nT
16 IGRF IGRF TMI based on date, location and altitude of each point (IGRF model 2010) nT
17 DCMAG COMPMAG after subtraction of the IGRF and DIURNAL nT 18 LEVMAG DCMAG after tie line levelling and micro-levelling nT 19 FLUX_X Fluxgate X component nT 20 FLUX_Y Fluxgate Y component nT 21 FLUX_Z Fluxgate Z component nT
Table 3: Final Aeromagnetic Digital Data – ASCII and Geosoft Database Format
Fugro Airborne Surveys FALCON® Airborne Gravity Gradiometer and Magnetometer Survey – Glyde Sub Basin, Northern Territory
43
File Description Units
2349_1_mag_final Total Magnetic Intensity nT 2349_1_DTM_final Terrain (Referenced to EGM96 geoid) metres
2349_1_equiv_drape_surface_final Drape surface for equivalent source computation, 85 m above terrain
metres
2349_1_equiv_gD_2p67_final Equivalent source derived vertical gravity, terrain correction density 2.67 g/cm3
mGal
2349_1_equiv_gD_2p67_conformed_final
Equivalent source derived vertical gravity, terrain correction density 2.67 g/cm3 conformed to regional gravity
mGal
2349_1_equiv_GDD_2p67_final Equivalent source derived vertical gravity gradient, terrain correction density 2.67 g/cm3
eotvos
2349_1_equiv_gD_0_final Equivalent source derived vertical gravity, no terrain correction applied
mGal
2349_1_equiv_gD_0_conformed_final
Equivalent source derived vertical gravity, no terrain correction applied conformed to regional gravity
mGal
2349_1_equiv_GDD_0_final Equivalent source derived vertical gravity gradient, no terrain correction applied
eotvos
2349_1_Fourier_drape_surface_final Drape surface for Fourier computation, smoothed flight surface
metres
2349_1_Fourier_gD_2p67_final Fourier derived vertical gravity, terrain correction density 2.67 g/cm3 mGal
2349_1_Fourier_gD_2p67_conformed_final
Fourier derived vertical gravity, terrain correction density 2.67 g/cm3 conformed to regional gravity
mGal
2349_1_Fourier_GDD_2p67_final Fourier derived vertical gravity gradient, terrain correction density 2.67 g/cm
eotvos
2349_1_Fourier_gD_0_final Fourier derived vertical gravity, no terrain correction applied mGal 2349_1_Fourier_gD_0_conformed_final
Fourier derived vertical gravity, no terrain correction applied conformed to regional gravity
mGal
2349_1_Fourier_GDD_0_final Fourier derived vertical gravity gradient, no terrain correction applied eotvos
Table 4: Final Aeromagnetic and AGG Grids – ERMapper Format