Embed Size (px)
Citation preview

January 27, 2017
Board of Trustees Meeting
Opioid Overuse/Misuse Management Strategy

Overview
• The Problem
• Opioid Prevalence
• Consequences of Opioid Misuse/Overuse
• Understanding Prescription Overuse/Misuse within State Health Plan
• Current Plan Resources to Address the Issue
• Plan Strategies for 2017
2

These Plan members had a Per Member Per Year (PMPY) cost of $17,428
compared to $4,958 for average Plan members.
The Problem
• In 2015, 3,347 Plan members (active, non-Medicare and COBRA) received and
filled 12 or more (with an average of 16), 30-day prescriptions of opioids.
• These 3,347 members cost the Plan $58 million in CY 2015.
• $23 million in pharmacy costs and $35 million in medical costs.
3

Opioid Overuse/Misuse
• Opioids are medications used to treat pain in many contexts, from post-surgical relief to
severe chronic back pain to end-of-life care.
• Two common drugs include: Oxycodone (OxyContin, Percocet) and Hydrocodone (Vicodin)
• Opioid overuse/misuse has become an epidemic in the United States and in North
Carolina.
• Problematic patterns of prescription opioid consumption lead to clinically significant
impairment or distress and has far-reaching socioeconomic consequences.
• Prevalence of prescription/illicit opioid overuse and misuse is estimated to be 4.1% in
the United States, which translates to over 10,709,000 citizens over the age of 12 years.
• The same survey estimates the prevalence in North Carolina to be 4.3% (349,000)
• Parts of North Carolina (Wilmington, Hickory, Jacksonville, Fayetteville) show prevalence 2-
3 times higher than state and national estimates (7.9% to 11.6%).
Source: Substance Abuse and Mental Health Service Administration (2016). National Survey on Drug Use and Health. Retrieved from http://www.samhsa.gov/
4

Demographics of Opioid and Prescription Drug MisuseNorth Carolina High School Students, 2014-2015
5
39.8%
30.2%
29.9%
White
Black
Other
50.3%49.7% Female
Male13.8% (2,360)
20.5% (2,860)
19.5% (822)
0
500
1,000
1,500
2,000
2,500
3,000
3,500
<= 15 16-17 18+
Nu
mb
er
Source: Youth Risk Behavior Survey, 2015

CDC Vital Statistics, July 2014
6
• Each day, 46 people die from an
overdose of prescription painkillers
in the U.S.
• Health care providers wrote
259 million prescriptions in 2012-
enough for every American to have
a bottle of pills.
• 10 of the highest prescribing states
are in the South…
North Carolina is one of them.

Medication Overdose Deaths, Hospitalizations and ED Visits
NC Residents, 2014
7
1,306
Deaths
11,835 Hospitalizations
21,835 Emergency Department Visits
349,000 NC residents reported misusing prescription pain relievers
19,591,021 Prescriptions for controlled substances
• In 2014, for every medication or
drug overdose death, there were
more than 9 hospitalizations and
nearly 17 ED visits due to
medication or drug overdose.
• Direct cost to a payer comes from the
unnecessary prescriptions written and
the ED visits and hospitalizations that
could be avoided
Source: N.C. State Center for Health Statistics, Vital Statistics-Deaths, 2014; N.C. State Center for Health Statistics, Vital
Statistics- Hospitalizations, 2014; NC DETECT, 2014.NSDUH 2013-2014. CSRS 2014. Analysis: N.C. Injury Epidemiology and
Surveillance Unit
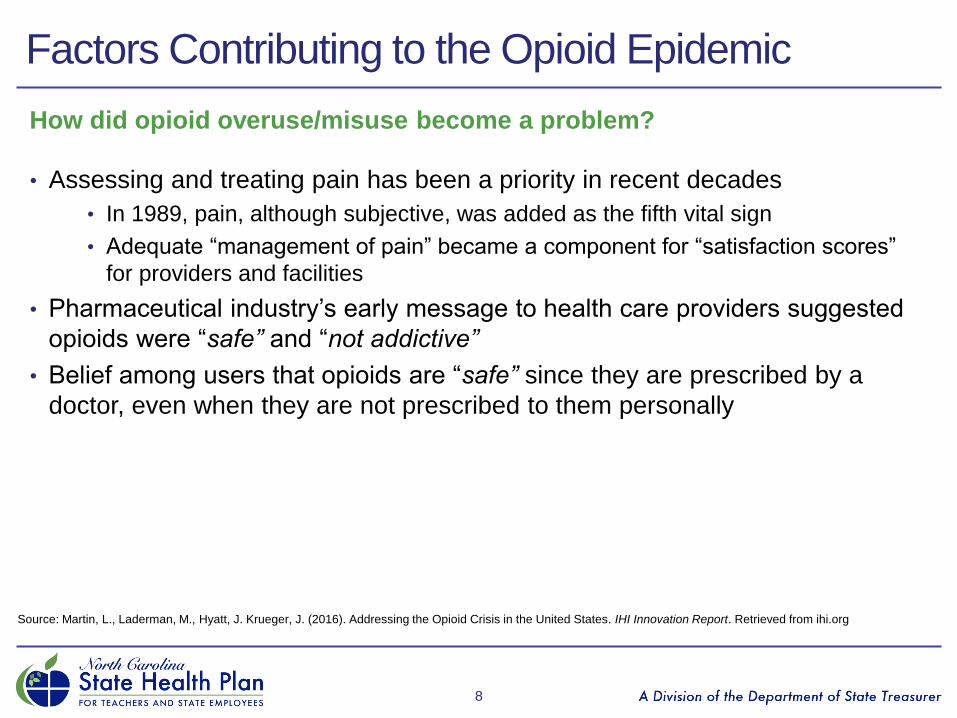
Factors Contributing to the Opioid Epidemic
How did opioid overuse/misuse become a problem?
• Assessing and treating pain has been a priority in recent decades
• In 1989, pain, although subjective, was added as the fifth vital sign
• Adequate “management of pain” became a component for “satisfaction scores”
for providers and facilities
• Pharmaceutical industry’s early message to health care providers suggested
opioids were “safe” and “not addictive”
• Belief among users that opioids are “safe” since they are prescribed by a
doctor, even when they are not prescribed to them personally
8
Source: Martin, L., Laderman, M., Hyatt, J. Krueger, J. (2016). Addressing the Opioid Crisis in the United States. IHI Innovation Report. Retrieved from ihi.org

Consequences of Opioid Overuse/Misuse
• Prescription fills and costs: Rising costs to insurers and increase in therapeutic
use of opioids.
• Total opioid prescriptions in the U.S. rose over 200% between 1992 and 2002,
and have continued to rise with hydrocodone and oxycodone posting nearly
400% increases.
• It has been estimated that the nonmedical use of opioid pain relievers costs
insurance companies up to $72.5 billion annually in health care costs.
• Direct Costs: Health care costs, law enforcement, court system, emergency service
providers, fraud, theft, illegal actions by individuals, responses to injury and rescue
calls.
• Indirect Costs: Individuals who overuse opioids are often unable to work,
depending on state and federal assistance.
9
Source: Martin, L., Laderman, M., Hyatt, J. Krueger, J. (2016). Addressing the Opioid Crisis in the United States. IHI Innovation Report., 2016
Center for Disease Control and Prevention, National Center for Health Statistics, National Vital Statistics System, Mortality File. (2015).
http://www.cdc.gov/nchs/data/health_policy/AADR_drug_poisoning_involving_OA_Heroin_US_2000-2014.pdf.
America’s addiction to Opioids: Heroin and prescription drug abusehttps://www.drugabuse.gov/about-nida/legislative-activities/testimony-to-
congress/2016/americas-addiction-to-opioids-heroin-prescription-drug-abuse

10
Opioid Overuse/Abuse: State Health Plan

State Health Plan Data Analysis: Methodology
The State Health Plan wants to better understand opioid overuse/misuse
among members, which led to an analysis of claims data.
Utilizing claims data:
• Medical and pharmacy claims were merged to identify patterns of
utilization and diagnosis among members who had >12 opioid
prescriptions over a 12-month period in 2015• Members with a cancer diagnosis code or cancer procedural code were
excluded.
Using claims has inherent limitations:
• When a claim has been processed, it is with a prescription
• Claims data does not capture individuals who pay cash for prescriptions or
those who are acquiring these through illegal means
11

Burden of Opioid Use Disorders – State Health Plan
0.9% (3,347) of members (active/COBRA/pre-Medicare retirees) were identified as “potential” opioid misusers in 2015.
• The Plan’s opioid “over users” were older (mean=51.2 years)
• On average, members filled 16.8 prescriptions over the course of the year (median prescription= 30-day fill)
• Approximately two-fifths (1,483) of identified members had a chronic pain diagnosis
• Approximately 18 percent (648) also had a comorbidity of serious or persistent mental illness (SPMI) diagnosis
• Other common diagnoses included diabetes, hypertension, and depression
• Approximately 14 percent (517) were dually prescribed opioids while taking benzodiazepines in 2015; between 2002 and 2014, there has been an increase of 41% of patients nationally who are on both these medications, with potentially dangerous consequences.
• Main prescribers were Primary Care Providers (Family Practice, Internal Medicine,Ob-Gyns) and dentists.
12

Opioid Overuse/Misuse – State Health Plan
• In preliminary analysis, the burden does not look high or similar to patterns seen in North Carolina. • This is likely due to limitations of the claims data (0.9% vs. 4.3%).
• According to the CDC (2011) only 17.3% of people who misuse opioids are obtaining their prescriptions from a prescribing physician.
• 82.7% obtained their prescriptions from an alternate source such as a friend, relative, or even stolen from others.
• In the absence of a robust mechanism to identify cases, the Plan cannot estimate the number of members who may need or benefit from case management or care coordination services.
• If state data is extrapolated to the Plan membership, the burden of opioid misuse impacts approximately 24,336 Plan members, with the majority, 15,489 members, over the age of 26 (2,098 between the ages of 12-17 and 6,016 between the ages of 18-25).
Source: Centers for Disease Prevention and Control. Policy Impact: Prescription Painkiller Overdoes, November 2011.
13

Express Scripts (ESI) Fraud Waste Abuse (FWA) Referrals, 2016
• Since March 2016, the Plan received 52 referrals for potential Fraud
Waste and Abuse (FWA) from the Plan’s previous Pharmacy Benefits
Manager, Express Scripts.
• 71% (35) are probable opioid misuse cases.
• Of those probable misuse cases, 86% (32) were locked in to a single
pharmacy and 14% (5) were locked in to a single prescriber.
• 8 cases were referred to the Population Health Management Vendor
for disease management for coexisting concerns:
• Migraines, fibromyalgia, chronic back pain, plantar fasciitis
• The 35 cases that were probable opioid overuse/misuse could have
benefited from case management and care coordination services.
14

Limitations of Lock-in Programs
Limitations of Provider Lock-In
• Majority of provider lock-ins are with a family medicine practitioner or internist who lacks
the training to manage opioid misuse.
• Unable to obtain provider’s agreement to be sole controlled-substance provider.
• Some providers dismiss potential FWA patients from their service to decrease their
liability of overdose/fatality, leaving the member without a provider.
• Limited referral agencies.
Limitations of Pharmacy Lock-In
• Members can pay cash to avoid limits of a lock-in.
• Pharmacists have the professional ability to “over-ride” warnings.
• Both provider and pharmacy lock-ins deter use but do not address and treat the
underlying diagnoses that drive opioid overuse/misuse.
• Lock-in programs have been shown to have unintended consequences.
• A North Carolina Medicaid lock-in program found that a lock-in program had the consequence of
a four-fold increase in out-of-pocket controlled substance prescription fills
Source: Roberts, A.W, Farley, J.F, Holmes, G.M, Controlled Substances Lock-in Programs: Examining an unintended Consequence of A Prescription
Drug Abuse Policy. Health Affairs October 2016 vol35 no.101884-1892
15

Current State Health Plan Resources (2017)
Population Health Management (PHM)
• Case management of potential underlying chronic conditions, such as chronic
back pain, does not focus on opioid overuse/misuse.
CVS Caremark (2017)
• Detecting and preventing inappropriate use through ongoing identification of
potential Fraud Waste and Abuse (FWA), timely intervention and follow-up,
prescriber outreach, and offering additional support for complex cases.
• Enhanced safety monitoring to include letters to prescribers and members,
pharmacy follow-up, prescriber toolkit and consultations, medication therapy
counseling, and comprehensive investigations.
• Developing utilization management program based on morphine equivalent
dosing.
16

Options Available to All Health Plans
1. Limit supply of opioids
• Formulary management; review and revise opioid-related pharmacy benefits (dose, duration and limits/ceiling, prior authorization as appropriate)
• Covering and promoting alternate pain management therapies (PT, Chiropractor, Acupuncture)
2. Promote effective prescription of opioids
• Promote CDC guidelines for effective and efficient prescription
• Encourage use of Controlled Substance Reporting System (CSRS)
3. Raise awareness and educate on risks of opioids• Mass campaign among Plan membership on risks associated with opioids
• Messaging at first fill on alternate options for pain management
• Reduce stigma and treat it as a chronic illness
4. Identify and manage opioid-dependent members
• Data surveillance
• Provide case management and care coordination for members identified with potential dependency
• Encourage Medication Assisted Treatment (MAT)
5. Coordinate efforts with community agencies and nonprofits
• For example, NC Harm Reduction Coalition
17
Source: Martin, L., Laderman, M., Hyatt, J. Krueger, J. (2016). Addressing the Opioid Crisis in the United States. IHI Innovation Report.

2017 Proposed State Health Plan Actions
• Review formulary with CVS Caremark and place additional restrictions if warranted.
• Implement data surveillance algorithms and predictive analysis to identify potential misuse of opioids. Identify other sources of data (mortality data) as well.
• Communication campaign among all members:
• Risks, appropriate use, and appropriate storage and disposal of opioids
• Secondary messaging at opioid prescription fills/refills
• Develop a case management/care coordination program with the Plan’s population health management vendor.
• Promote CDC guidelines for effective prescription, including alternate pain management therapies and Controlled Substance Reporting System (CSRS) among providers.
• Participate in NC Prescription Drug Abuse Advisory Committee (PDAAC).
18

Proposed Opioid Case Management Program
• Develop and deliver a case management and care coordination program through the Plan’s current vendor, ActiveHealth Management.
• Identify and stratify members into risk categories for targeted outreach and engagement.
• Provide qualified professional health care staff that hold a current North Carolina license and have behavioral health license.
• Provide screening, evaluation, and risk assessment to identify, stratify, and develop a member specific care plan.
• Provide necessary member-specific interventions including, but not limited to, health education, treatment options, pain management, community resource introduction and disease self-management and empowerment.
• Collaborate, communicate and integrate care services as a multidisciplinary team member of the medical home with other Plan vendors (CVS, Beacon Health), and most importantly the members’ Primary Care Providers.
• Provide data to the Plan that demonstrates member satisfaction and clinical impacts of the program.
• These services can be provided at an additional cost of $.035 PMPM, which will be approximately $19,145.00 per month for an approximate annual cost of $229,740.
19

20
Appendix:
Opioid Overuse and Misuse Patterns and
Consequences in U.S. and North Carolina

Prescription Patterns for Opioids
21

Correlation Between Prescribing and Death
22
As rates of prescribing increased, rates of opioid related deaths also increased.
Sharp rate
increases in
opioid prescribing
Sharp rate increases
in prescription opioid
deaths
Source: CDC, 2015
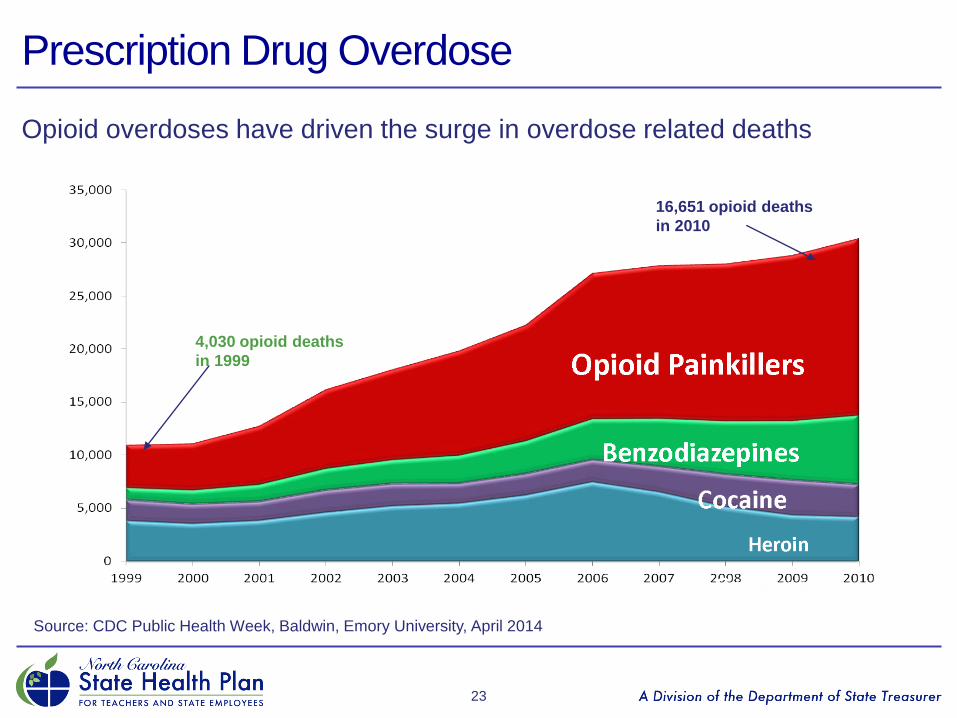
Prescription Drug Overdose
23
Opioid overdoses have driven the surge in overdose related deaths
16,651 opioid deaths
in 2010
4,030 opioid deaths
in 1999
Source: CDC Public Health Week, Baldwin, Emory University, April 2014

Medication of Drug Overdose Death by Intent NC Residents, 1999-2015
24
1498
1268
190
40
0
200
400
600
800
1,000
1,200
1,400
1,600
1999 2000 2001 2002 2003 2004 2005 2006 2007 2008 2009 2010 2011 2012 2013 2014 2015
Num
be
r o
f d
ea
ths
All intents
Unintentional
Self-inflicted
Undetermined
Assault
Source: N.C. State Center for Health Statistics, Vital Statistics-Deaths, 1999-2014
Analysis by Injury Epidemiology and Surveillance Unit
Medication or drug overdose: X40-X44, X60-X64, Y10-Y14, X85

Substances Contributing to Drug Overdose DeathsNC Residents, 1999-2015
25
738
293
364
0
100
200
300
400
500
600
700
800
900
1999 2000 2001 2002 2003 2004 2005 2006 2007 2008 2009 2010 2011 2012 2013 2014 2015
Num
be
r o
f d
ea
ths
Prescription Opioid
Cocaine
Heroin
Source: N.C. State Center for Health Statistics, Vital Statistics-Deaths, 1999-2014
Analysis by Injury Epidemiology and Surveillance Unit

Deaths vs. ED Visits for Drug Overdose, NC 2015
26
• 20,371 ED visits
1,215 deaths
Source: N.C. State Center for Health Statistics, Vital Statistics-Deaths, 2015; NC DETECT,
2015.Analysis: N.C. Injury Epidemiology and Surveillance Unit
• The number of ED visits for
overdose dwarfs the number of
overdose deaths
• Average NC county has about one
overdose death per month but just
under one overdose ED visit per day

Prescription Opioid Overuse/Abuse Patterns: North Carolina
27

Rate of Drug Overdose Deaths by CountyNC Residents, 2010-2013
28

Unintentional Opioid Overdose Death Rate and Outpatient
Prescriptions Dispensed for Opioid Rates
29


![Tackling the Antibiotic Resistant Bacteria Crisis Using ......misuse and overuse of antibiotics is the most important of these actions [6]. Thus, it is important to immediately identify](https://img.pdfslide.net/doc/110x75/60a1ac3bf80a831e013067fc/tackling-the-antibiotic-resistant-bacteria-crisis-using-misuse-and-overuse.jpg)


![MONITORING GLOBAL PROGRESS ON ADDRESSING ANTIMICROBIAL …€¦ · Antimicrobial resistance (AMR) is a grave threat to human health and economic development [1]. The overuse and misuse](https://img.pdfslide.net/doc/110x75/5f0b27e97e708231d42f1fba/monitoring-global-progress-on-addressing-antimicrobial-antimicrobial-resistance.jpg)