Embed Size (px)
Citation preview
2012
Jamal Arif
WAN/LAN Planning and Design
5/8/2012
OPNET TRANSPORT PLANNER Graduate Project
2
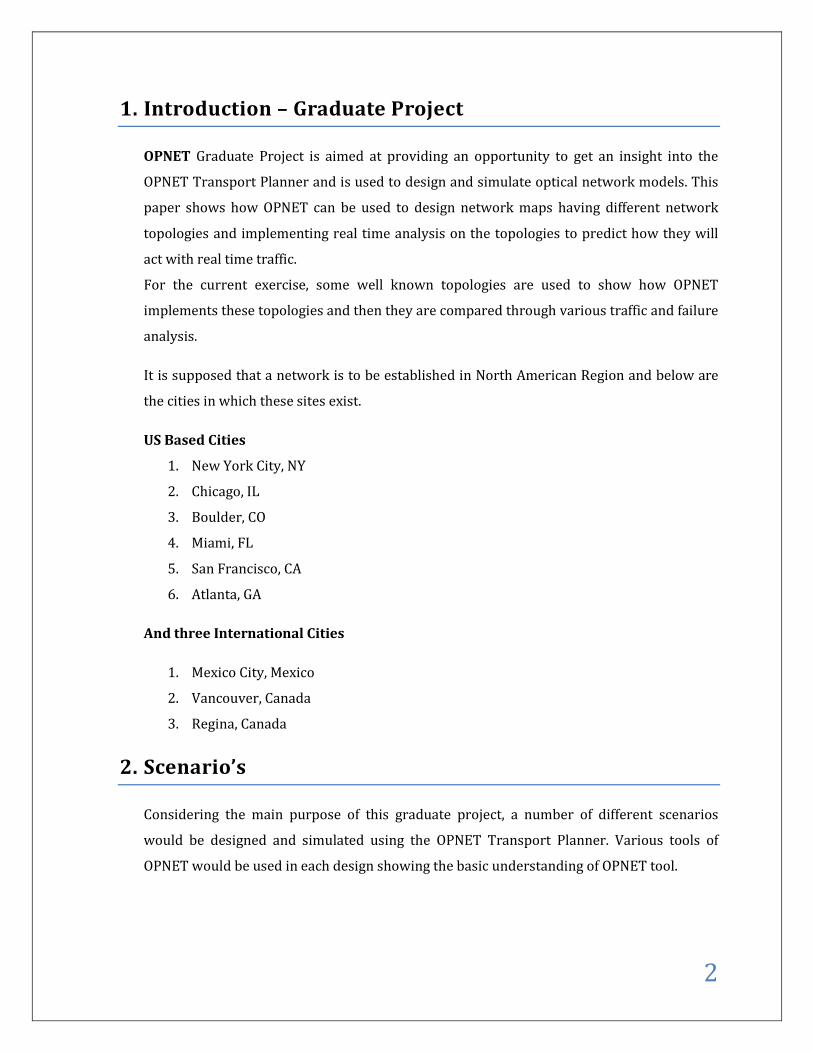
1. Introduction – Graduate Project
OPNET Graduate Project is aimed at providing an opportunity to get an insight into the
OPNET Transport Planner and is used to design and simulate optical network models. This
paper shows how OPNET can be used to design network maps having different network
topologies and implementing real time analysis on the topologies to predict how they will
act with real time traffic.
For the current exercise, some well known topologies are used to show how OPNET
implements these topologies and then they are compared through various traffic and failure
analysis.
It is supposed that a network is to be established in North American Region and below are
the cities in which these sites exist.
US Based Cities
1. New York City, NY
2. Chicago, IL
3. Boulder, CO
4. Miami, FL
5. San Francisco, CA
6. Atlanta, GA
And three International Cities
1. Mexico City, Mexico
2. Vancouver, Canada
3. Regina, Canada
2. Scenario’s
Considering the main purpose of this graduate project, a number of different scenarios
would be designed and simulated using the OPNET Transport Planner. Various tools of
OPNET would be used in each design showing the basic understanding of OPNET tool.
3
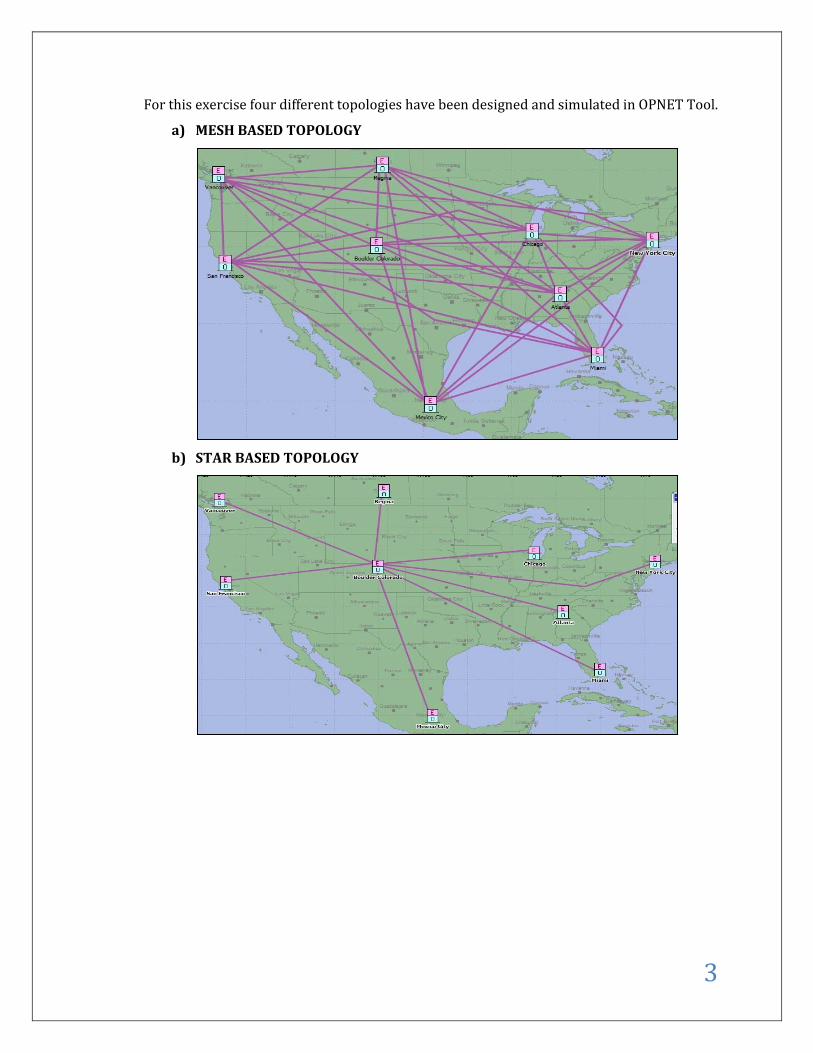
For this exercise four different topologies have been designed and simulated in OPNET Tool.
a) MESH BASED TOPOLOGY
b) STAR BASED TOPOLOGY
4
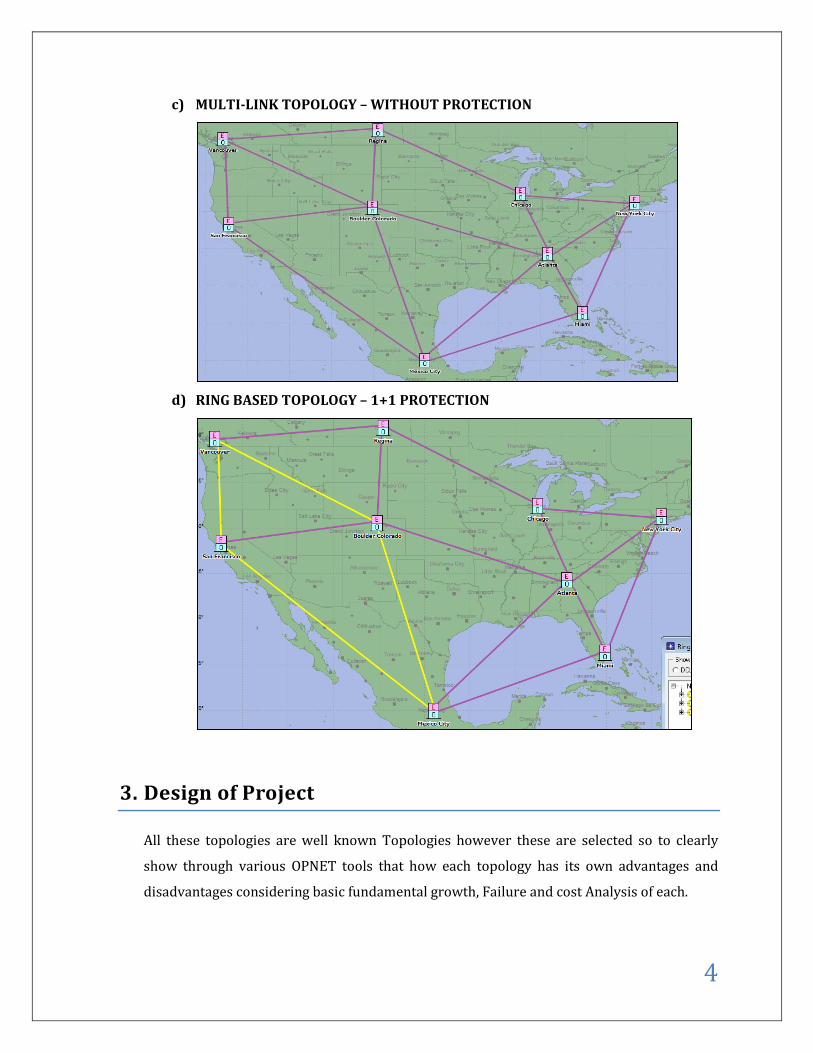
c) MULTI-LINK TOPOLOGY – WITHOUT PROTECTION
d) RING BASED TOPOLOGY – 1+1 PROTECTION
3. Design of Project
All these topologies are well known Topologies however these are selected so to clearly
show through various OPNET tools that how each topology has its own advantages and
disadvantages considering basic fundamental growth, Failure and cost Analysis of each.
5
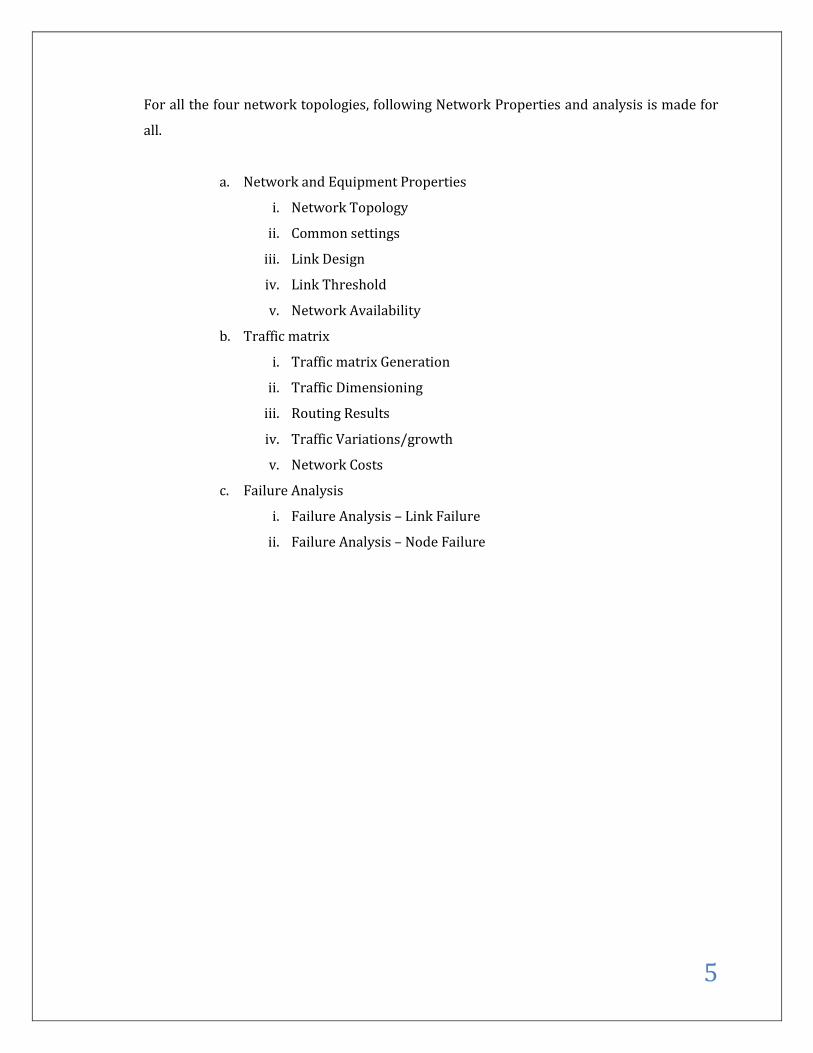
For all the four network topologies, following Network Properties and analysis is made for
all.
a. Network and Equipment Properties
i. Network Topology
ii. Common settings
iii. Link Design
iv. Link Threshold
v. Network Availability
b. Traffic matrix
i. Traffic matrix Generation
ii. Traffic Dimensioning
iii. Routing Results
iv. Traffic Variations/growth
v. Network Costs
c. Failure Analysis
i. Failure Analysis – Link Failure
ii. Failure Analysis – Node Failure
6
4. Topologies
Following are the topologies created in OPNET.
4.1 Mesh Topology
4.1.1 Network Map
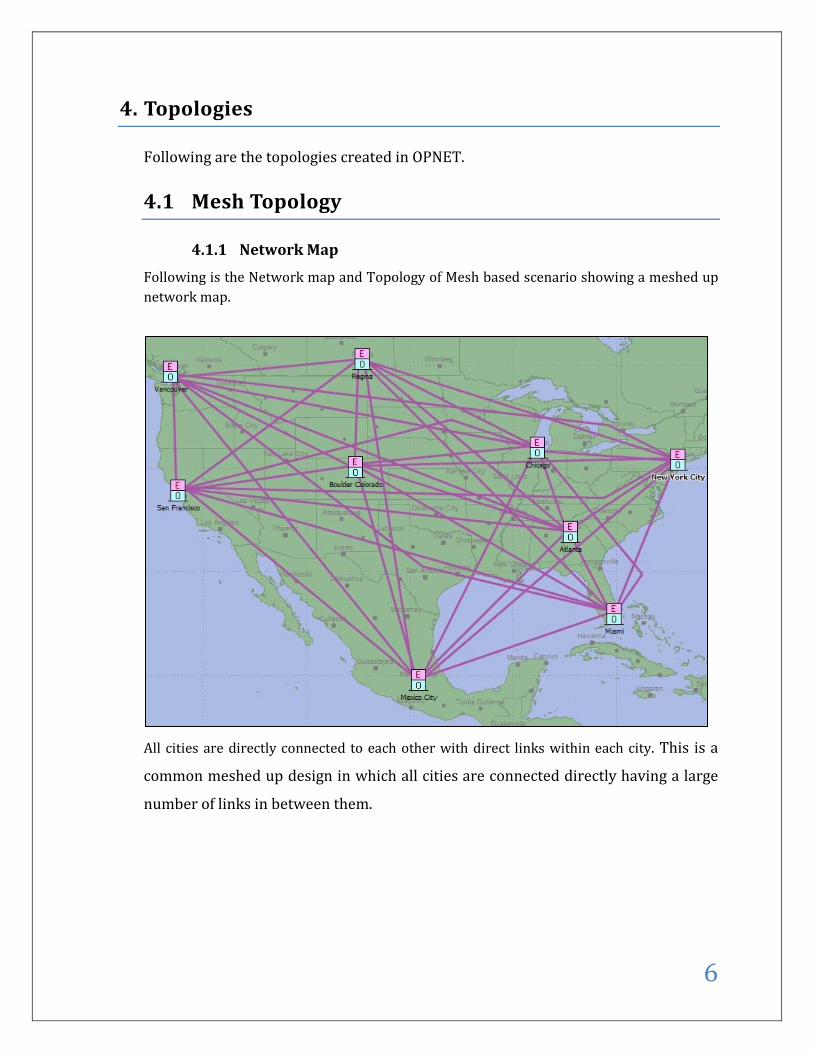
Following is the Network map and Topology of Mesh based scenario showing a meshed up network map.
All cities are directly connected to each other with direct links within each city. This is a
common meshed up design in which all cities are connected directly having a large
number of links in between them.
7
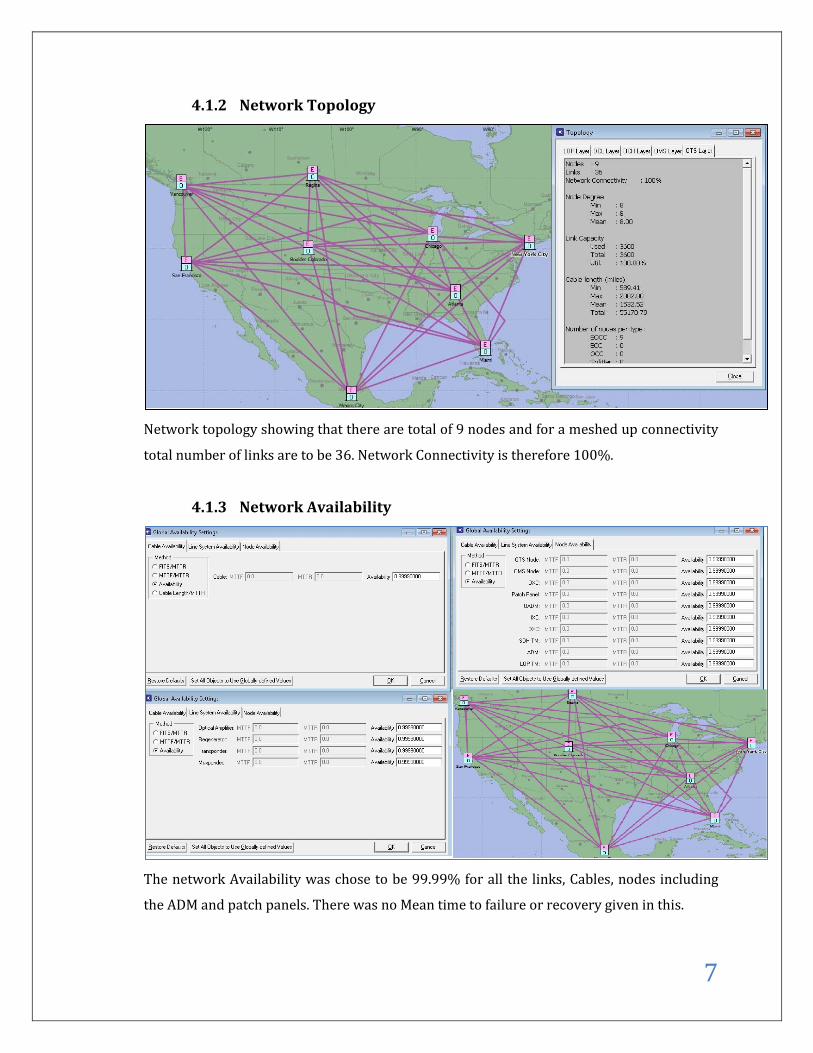
4.1.2 Network Topology
Network topology showing that there are total of 9 nodes and for a meshed up connectivity
total number of links are to be 36. Network Connectivity is therefore 100%.
4.1.3 Network Availability
The network Availability was chose to be 99.99% for all the links, Cables, nodes including
the ADM and patch panels. There was no Mean time to failure or recovery given in this.
8
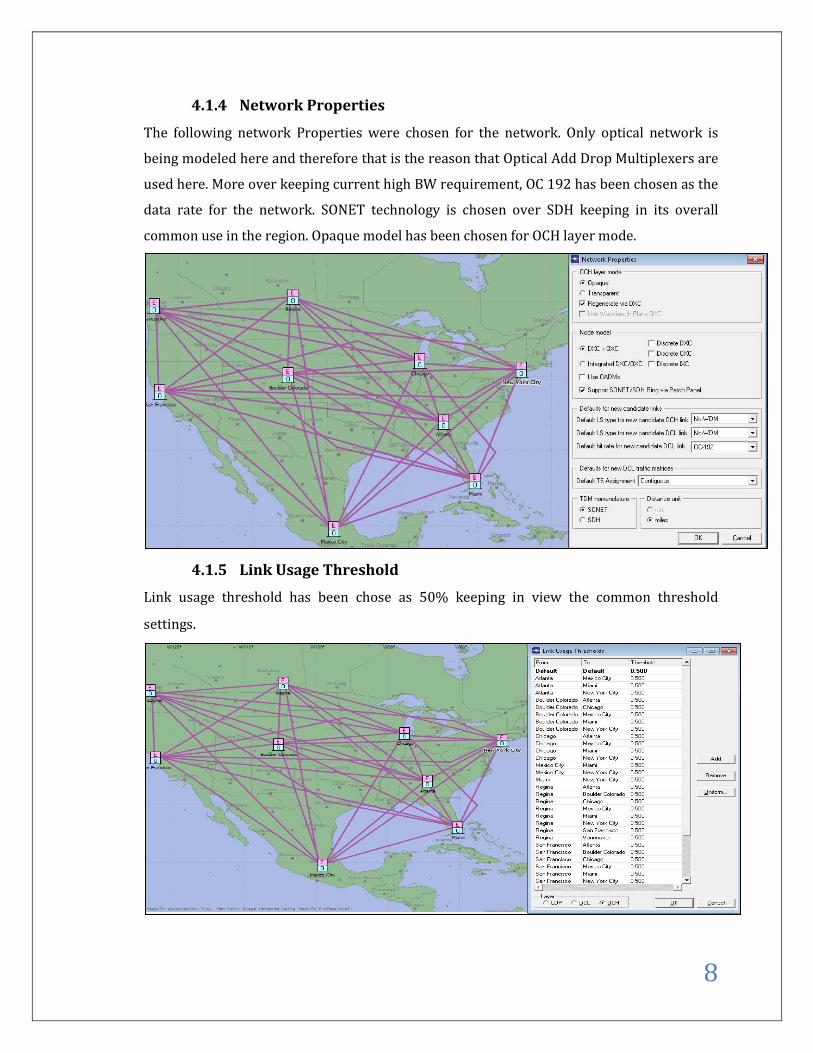
4.1.4 Network Properties
The following network Properties were chosen for the network. Only optical network is
being modeled here and therefore that is the reason that Optical Add Drop Multiplexers are
used here. More over keeping current high BW requirement, OC 192 has been chosen as the
data rate for the network. SONET technology is chosen over SDH keeping in its overall
common use in the region. Opaque model has been chosen for OCH layer mode.
4.1.5 Link Usage Threshold
Link usage threshold has been chose as 50% keeping in view the common threshold
settings.
9
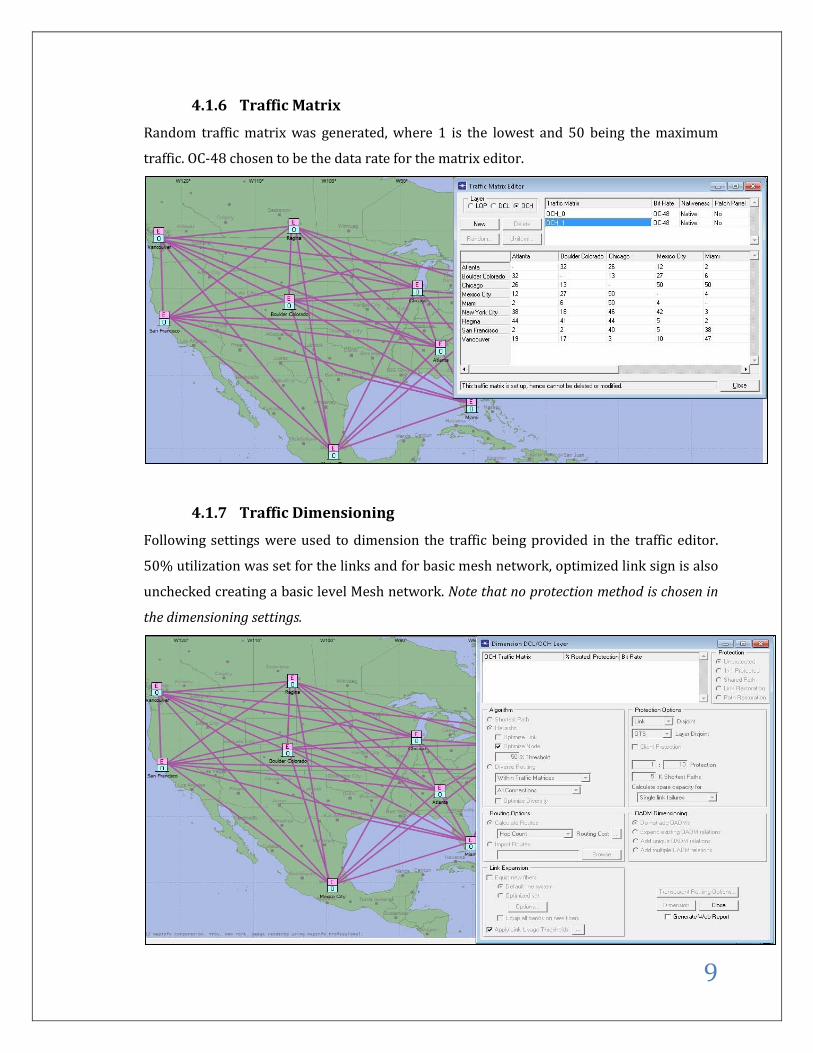
4.1.6 Traffic Matrix
Random traffic matrix was generated, where 1 is the lowest and 50 being the maximum
traffic. OC-48 chosen to be the data rate for the matrix editor.
4.1.7 Traffic Dimensioning
Following settings were used to dimension the traffic being provided in the traffic editor.
50% utilization was set for the links and for basic mesh network, optimized link sign is also
unchecked creating a basic level Mesh network. Note that no protection method is chosen in
the dimensioning settings.
10
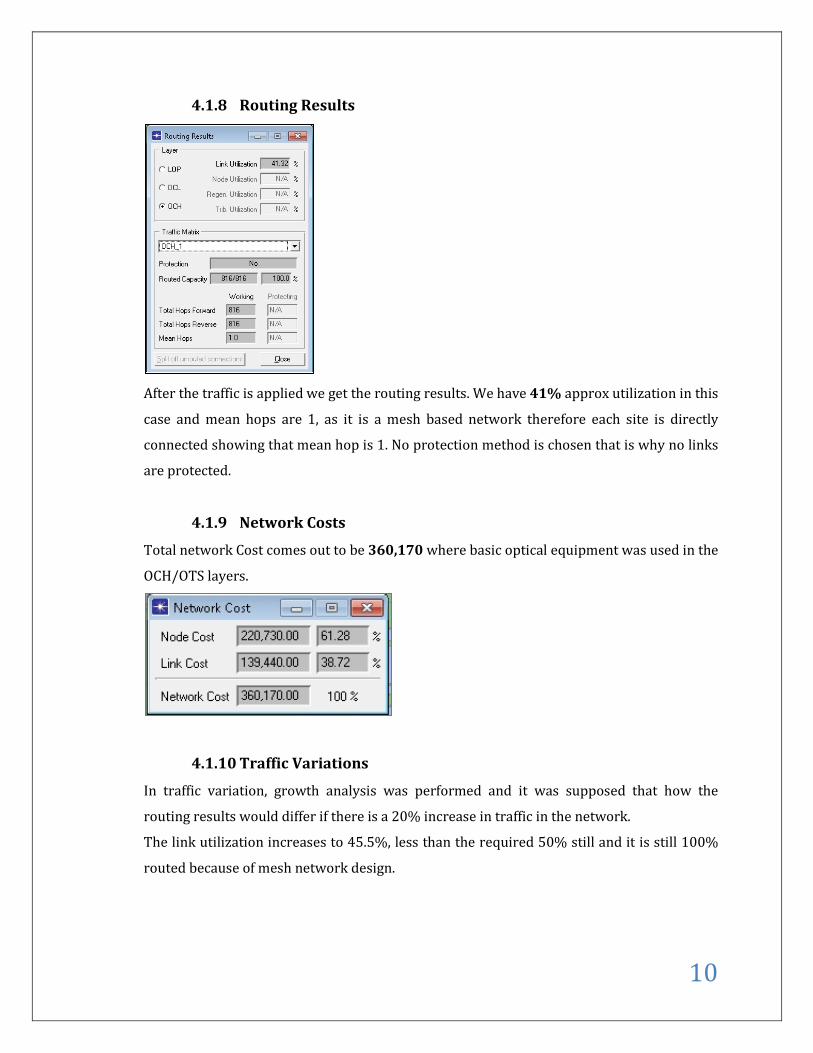
4.1.8 Routing Results
After the traffic is applied we get the routing results. We have 41% approx utilization in this
case and mean hops are 1, as it is a mesh based network therefore each site is directly
connected showing that mean hop is 1. No protection method is chosen that is why no links
are protected.
4.1.9 Network Costs
Total network Cost comes out to be 360,170 where basic optical equipment was used in the
OCH/OTS layers.
4.1.10 Traffic Variations
In traffic variation, growth analysis was performed and it was supposed that how the
routing results would differ if there is a 20% increase in traffic in the network.
The link utilization increases to 45.5%, less than the required 50% still and it is still 100%
routed because of mesh network design.
11
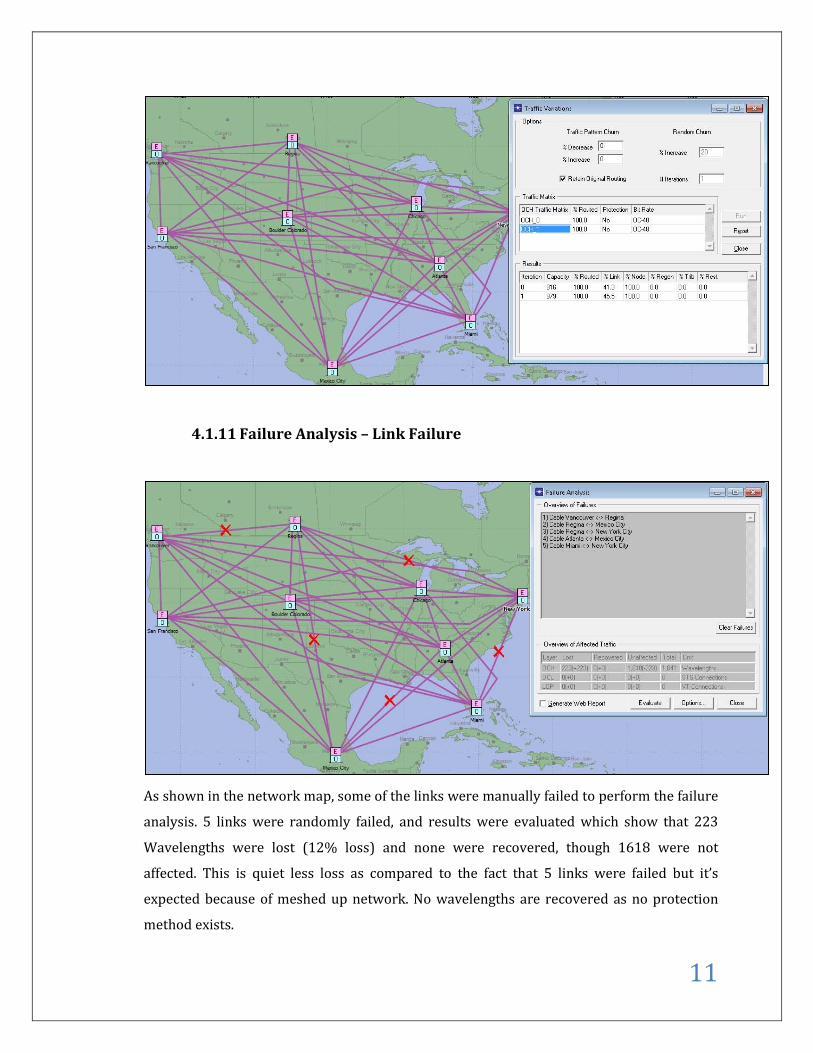
4.1.11 Failure Analysis – Link Failure
As shown in the network map, some of the links were manually failed to perform the failure
analysis. 5 links were randomly failed, and results were evaluated which show that 223
Wavelengths were lost (12% loss) and none were recovered, though 1618 were not
affected. This is quiet less loss as compared to the fact that 5 links were failed but it’s
expected because of meshed up network. No wavelengths are recovered as no protection
method exists.
12
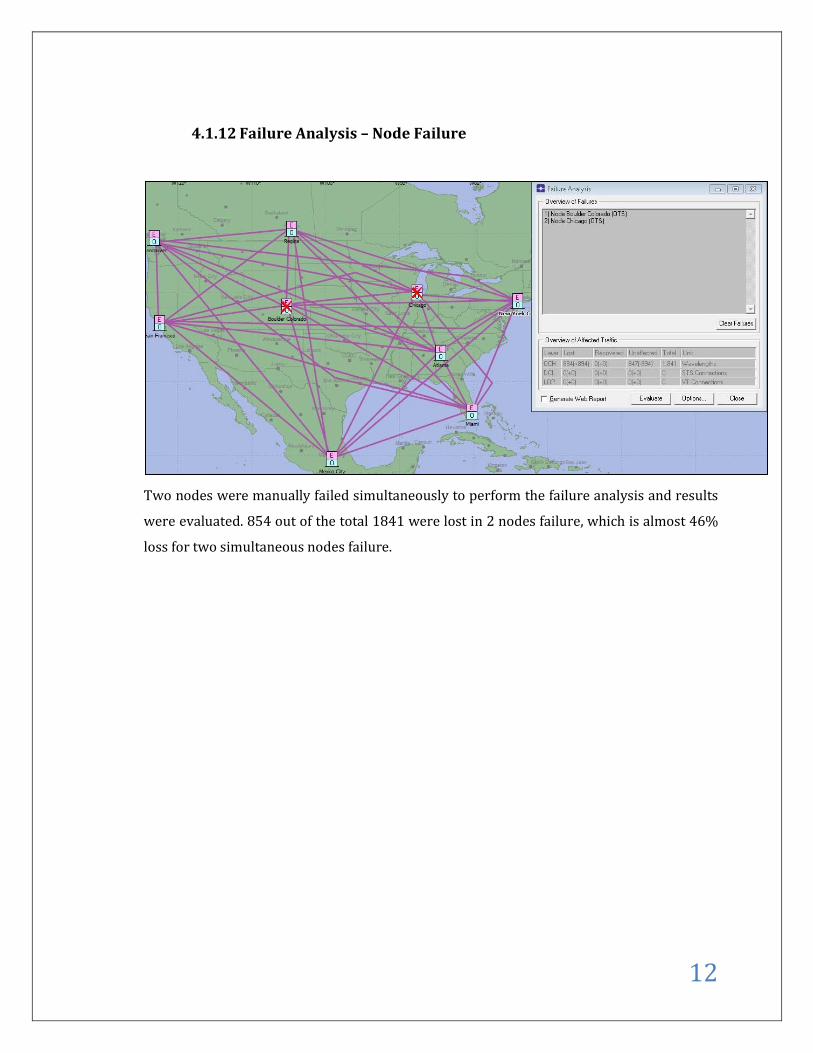
4.1.12 Failure Analysis – Node Failure
Two nodes were manually failed simultaneously to perform the failure analysis and results
were evaluated. 854 out of the total 1841 were lost in 2 nodes failure, which is almost 46%
loss for two simultaneous nodes failure.
13
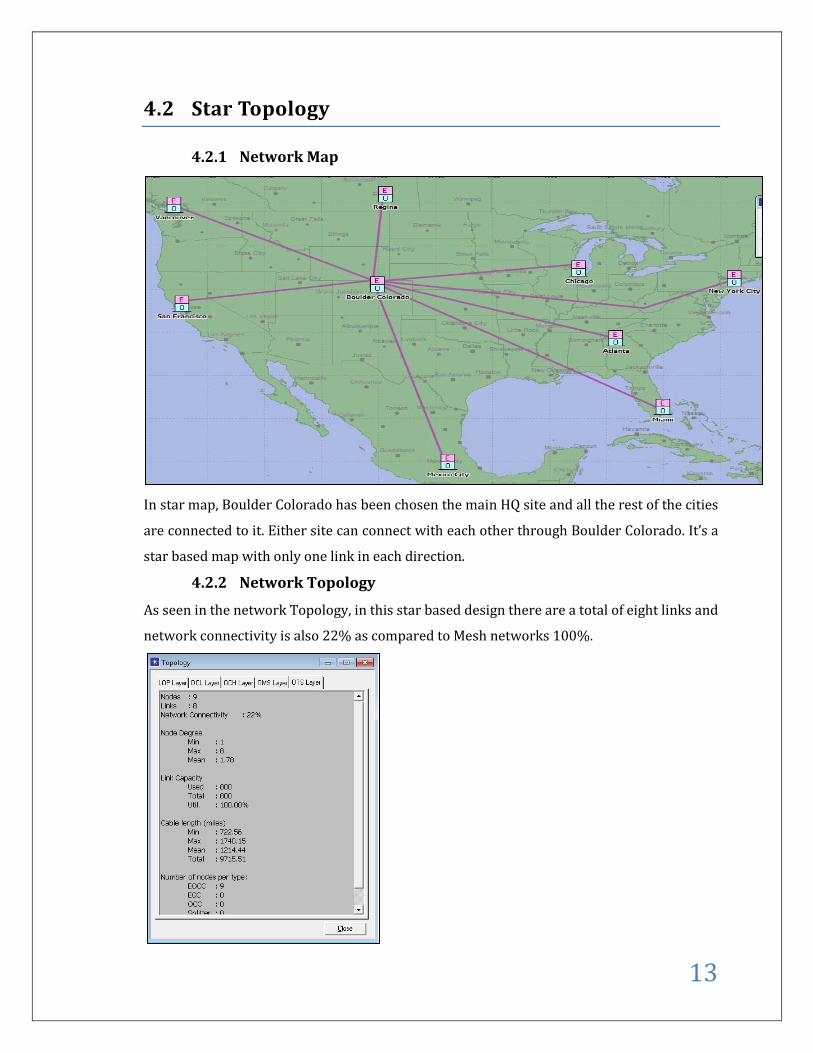
4.2 Star Topology
4.2.1 Network Map
In star map, Boulder Colorado has been chosen the main HQ site and all the rest of the cities
are connected to it. Either site can connect with each other through Boulder Colorado. It’s a
star based map with only one link in each direction.
4.2.2 Network Topology
As seen in the network Topology, in this star based design there are a total of eight links and
network connectivity is also 22% as compared to Mesh networks 100%.
14
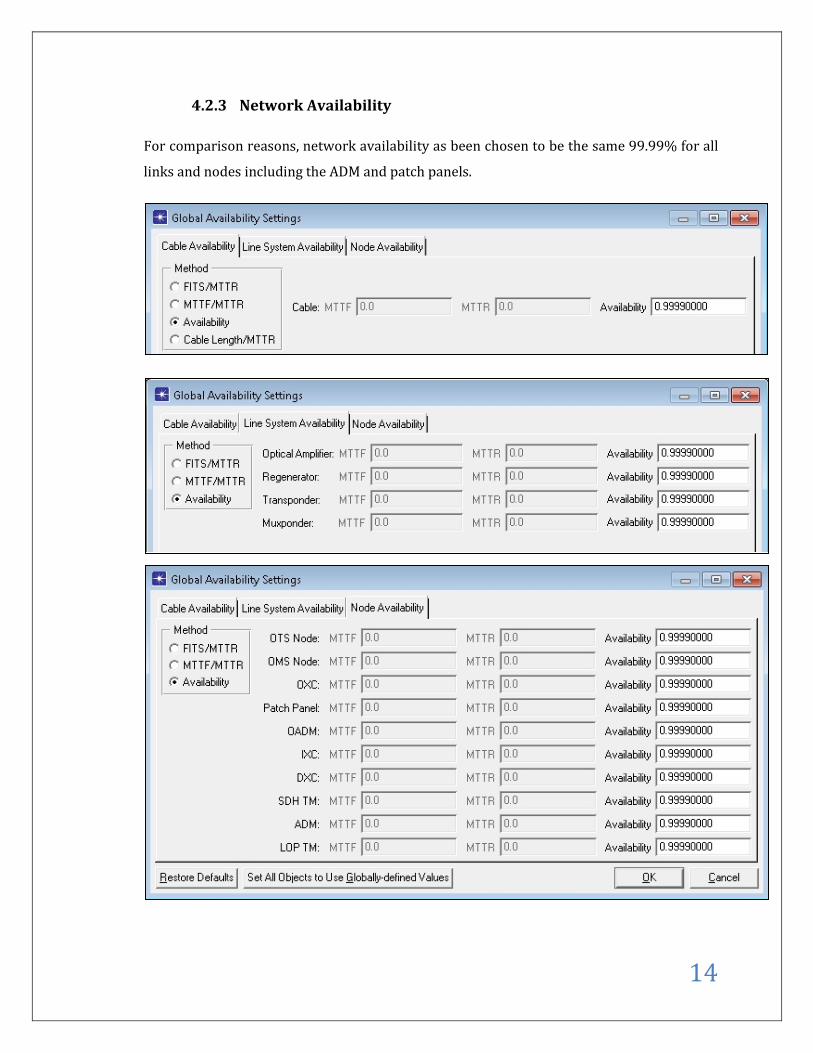
4.2.3 Network Availability
For comparison reasons, network availability as been chosen to be the same 99.99% for all
links and nodes including the ADM and patch panels.
15
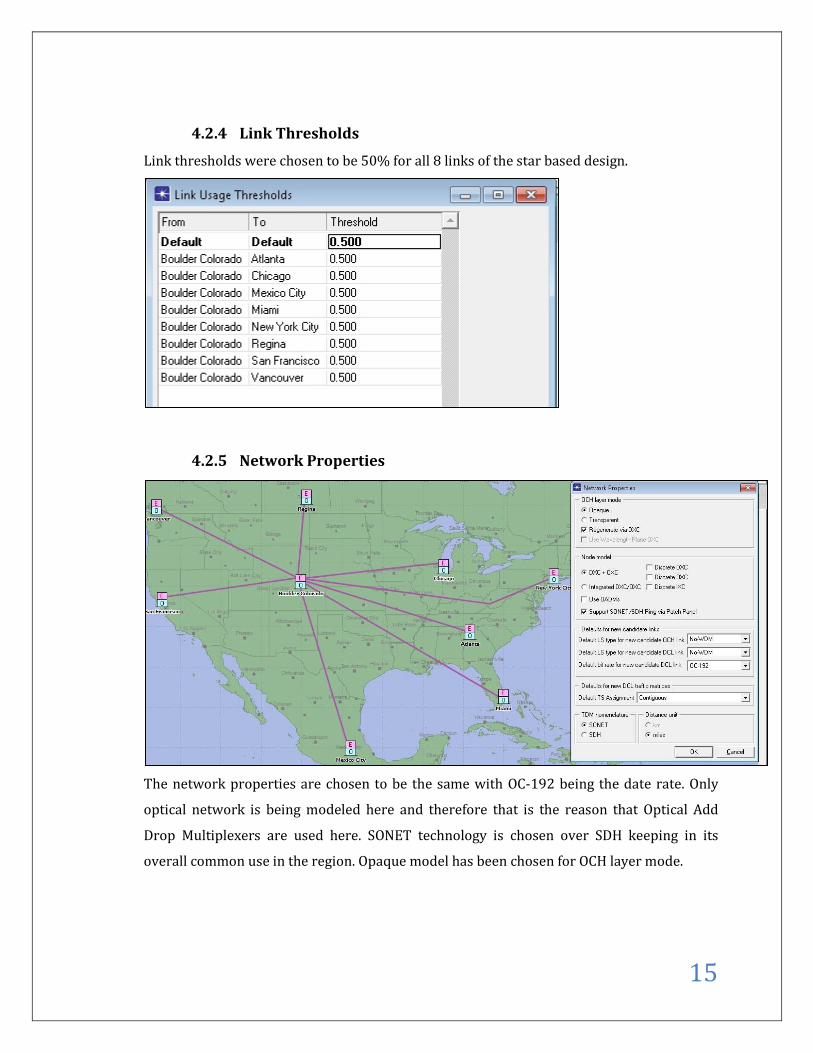
4.2.4 Link Thresholds
Link thresholds were chosen to be 50% for all 8 links of the star based design.
4.2.5 Network Properties
The network properties are chosen to be the same with OC-192 being the date rate. Only
optical network is being modeled here and therefore that is the reason that Optical Add
Drop Multiplexers are used here. SONET technology is chosen over SDH keeping in its
overall common use in the region. Opaque model has been chosen for OCH layer mode.
16
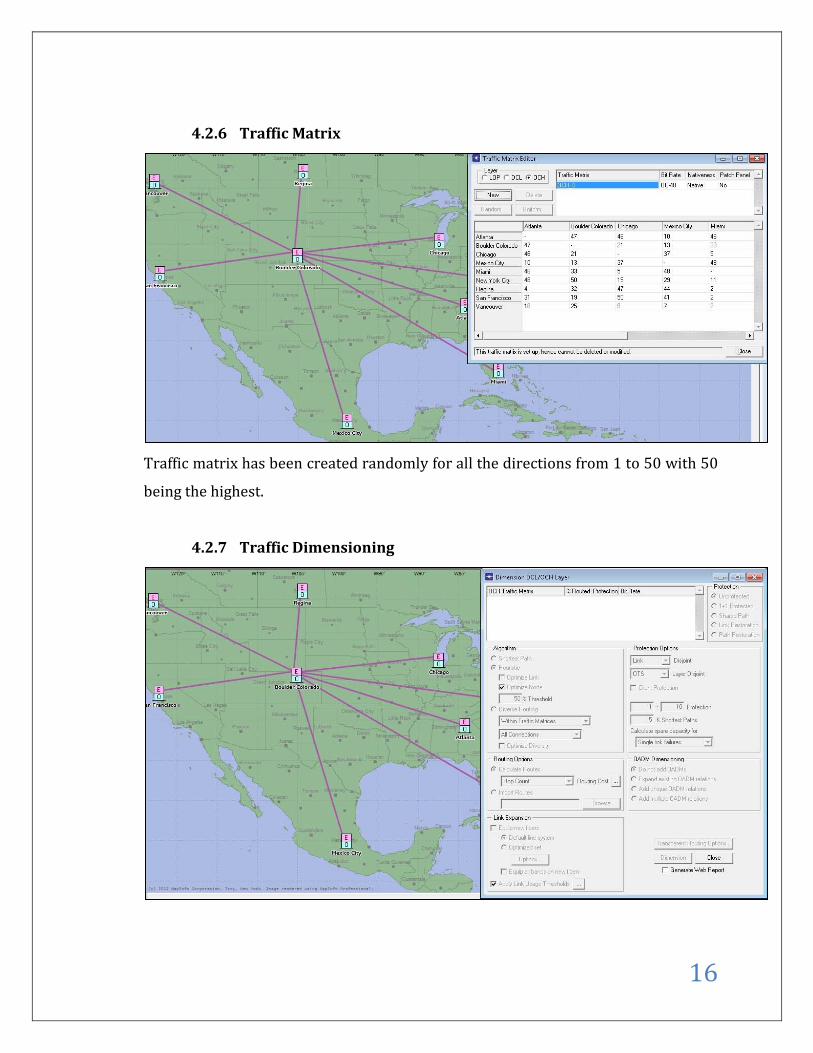
4.2.6 Traffic Matrix
Traffic matrix has been created randomly for all the directions from 1 to 50 with 50
being the highest.
4.2.7 Traffic Dimensioning
17
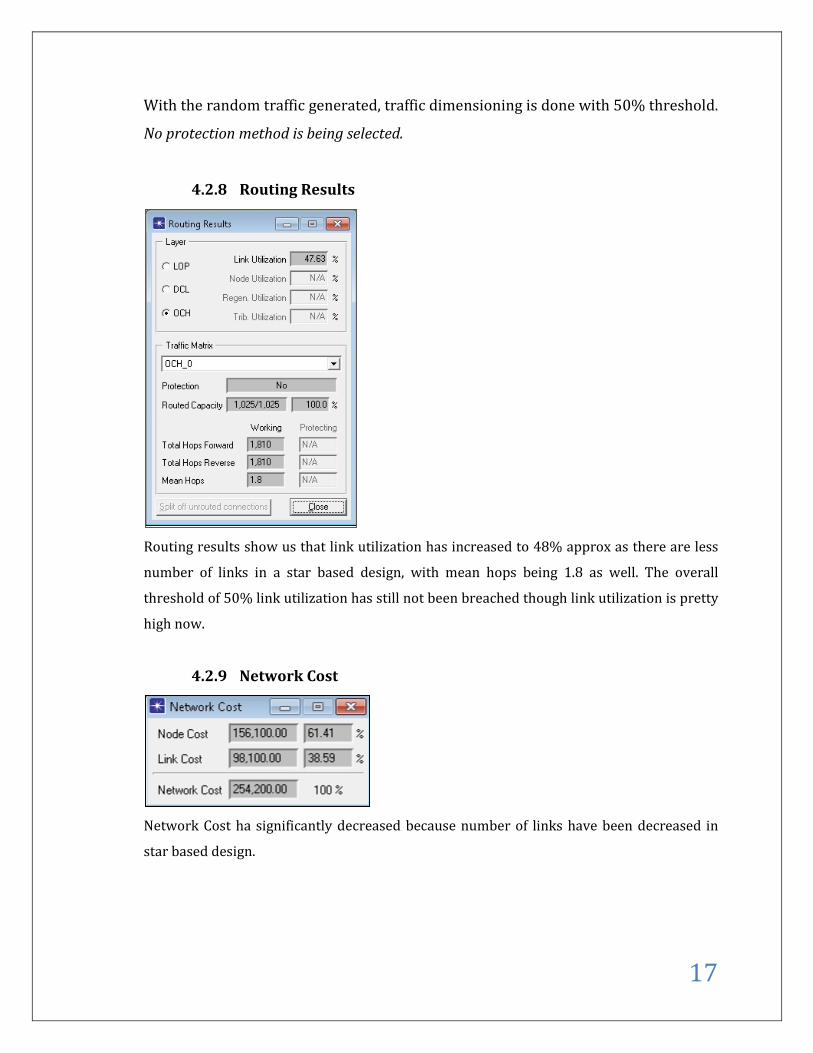
With the random traffic generated, traffic dimensioning is done with 50% threshold.
No protection method is being selected.
4.2.8 Routing Results
Routing results show us that link utilization has increased to 48% approx as there are less
number of links in a star based design, with mean hops being 1.8 as well. The overall
threshold of 50% link utilization has still not been breached though link utilization is pretty
high now.
4.2.9 Network Cost
Network Cost ha significantly decreased because number of links have been decreased in
star based design.
18
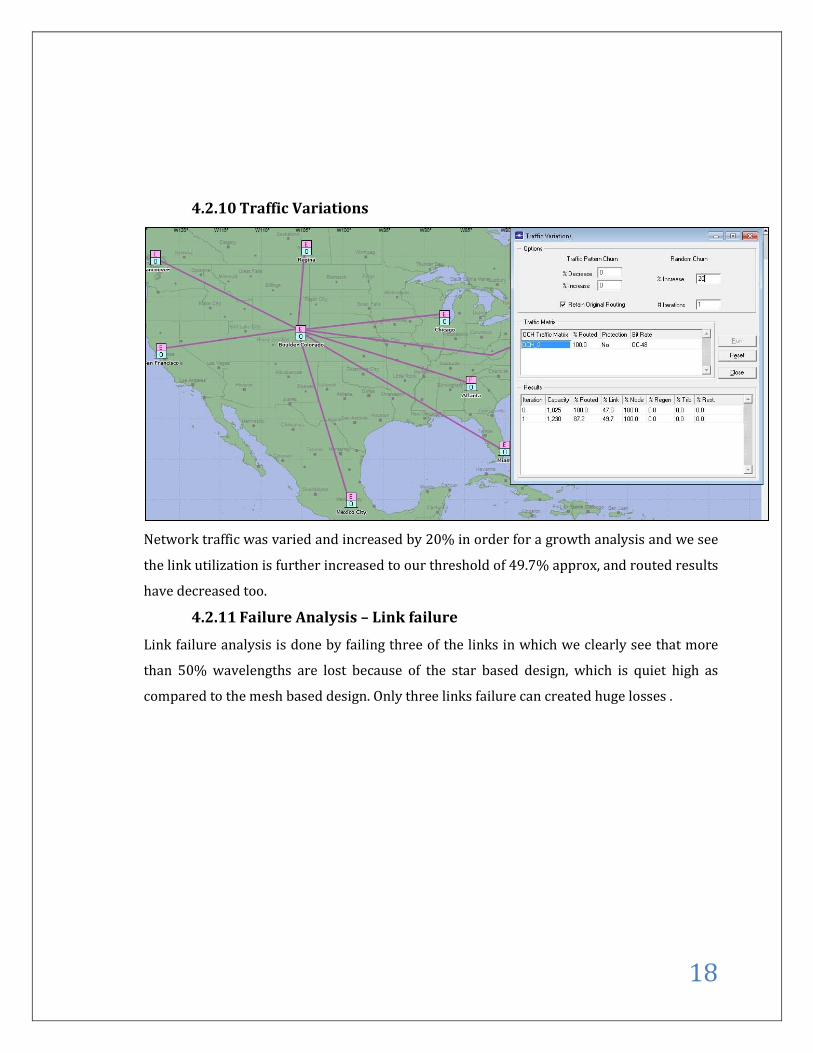
4.2.10 Traffic Variations
Network traffic was varied and increased by 20% in order for a growth analysis and we see
the link utilization is further increased to our threshold of 49.7% approx, and routed results
have decreased too.
4.2.11 Failure Analysis – Link failure
Link failure analysis is done by failing three of the links in which we clearly see that more
than 50% wavelengths are lost because of the star based design, which is quiet high as
compared to the mesh based design. Only three links failure can created huge losses .
19
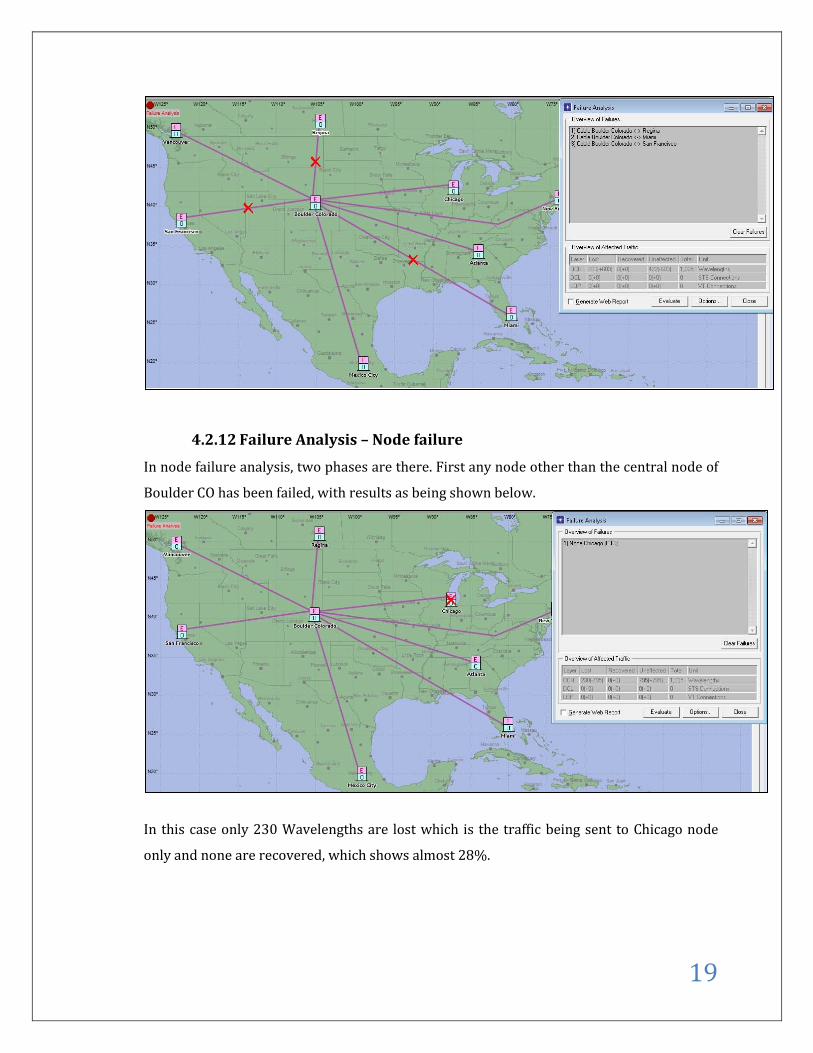
4.2.12 Failure Analysis – Node failure
In node failure analysis, two phases are there. First any node other than the central node of
Boulder CO has been failed, with results as being shown below.
In this case only 230 Wavelengths are lost which is the traffic being sent to Chicago node
only and none are recovered, which shows almost 28%.
20
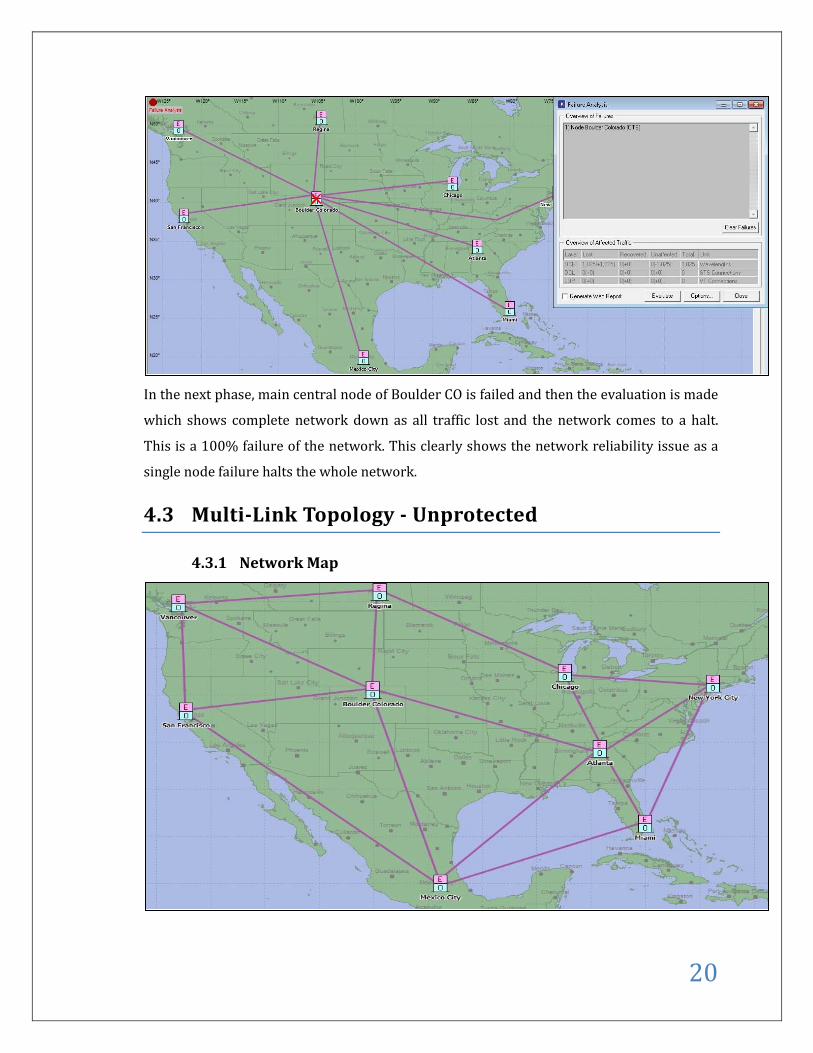
In the next phase, main central node of Boulder CO is failed and then the evaluation is made
which shows complete network down as all traffic lost and the network comes to a halt.
This is a 100% failure of the network. This clearly shows the network reliability issue as a
single node failure halts the whole network.
4.3 Multi-Link Topology - Unprotected
4.3.1 Network Map
21
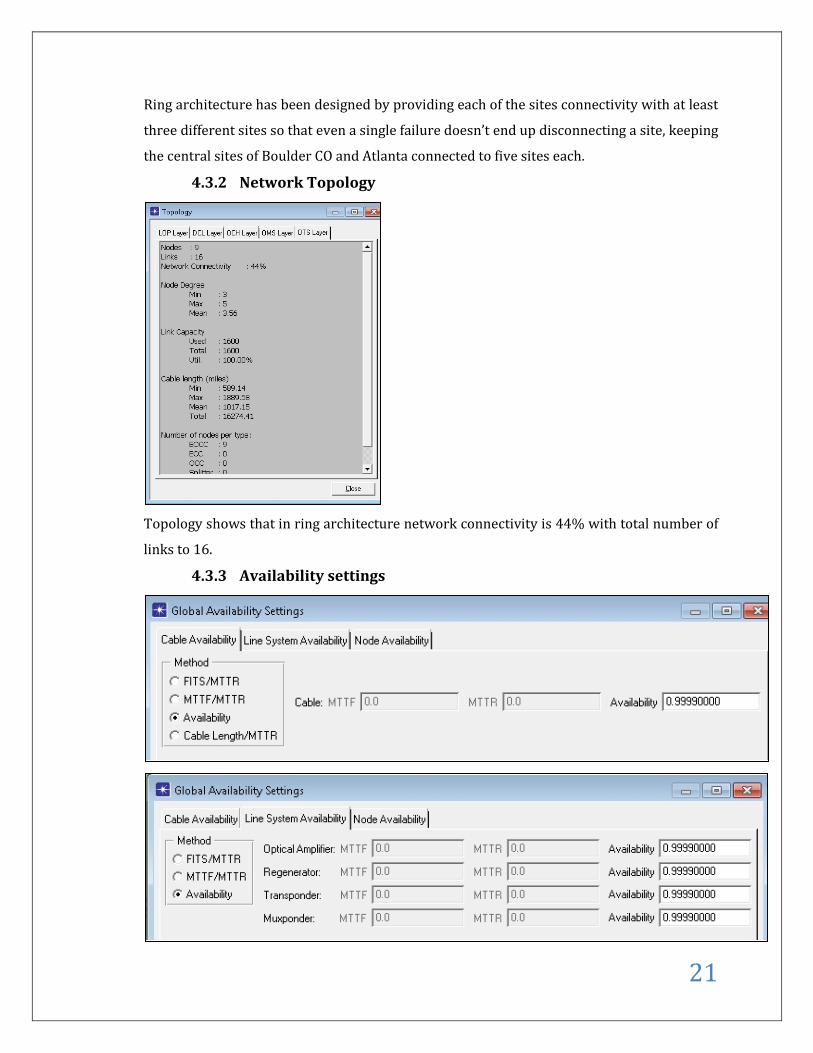
Ring architecture has been designed by providing each of the sites connectivity with at least
three different sites so that even a single failure doesn’t end up disconnecting a site, keeping
the central sites of Boulder CO and Atlanta connected to five sites each.
4.3.2 Network Topology
Topology shows that in ring architecture network connectivity is 44% with total number of
links to 16.
4.3.3 Availability settings
22
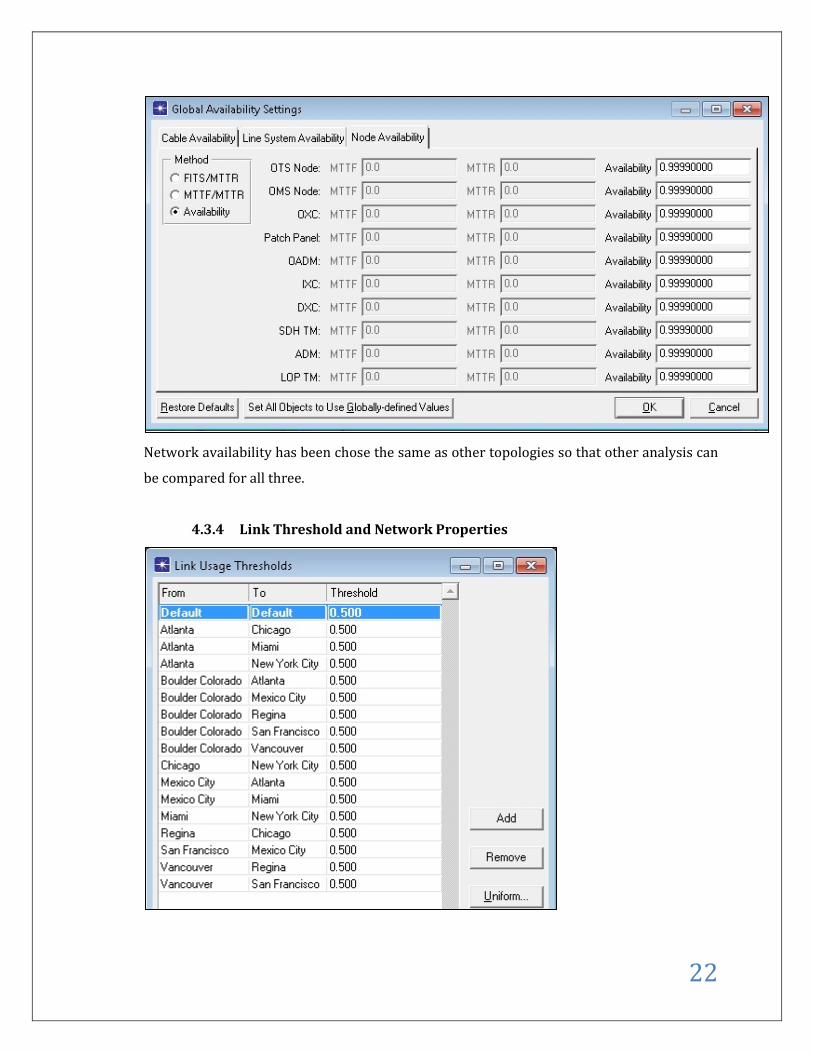
Network availability has been chose the same as other topologies so that other analysis can
be compared for all three.
4.3.4 Link Threshold and Network Properties
23
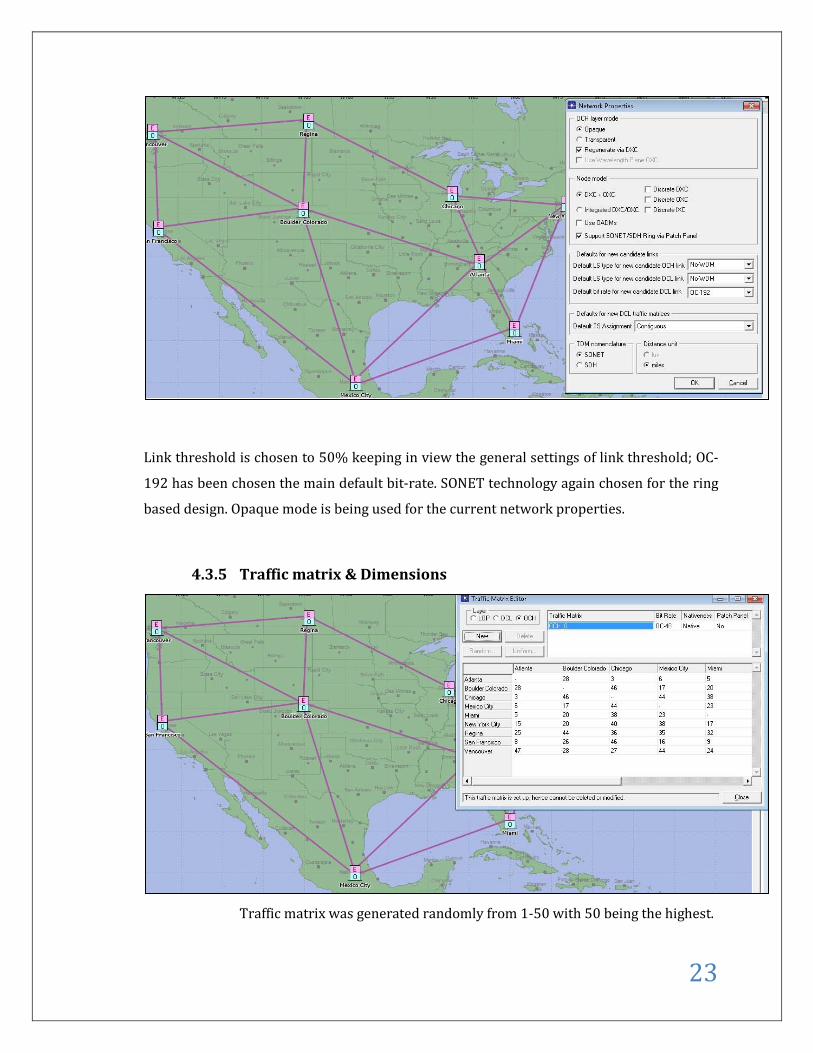
Link threshold is chosen to 50% keeping in view the general settings of link threshold; OC-
192 has been chosen the main default bit-rate. SONET technology again chosen for the ring
based design. Opaque mode is being used for the current network properties.
4.3.5 Traffic matrix & Dimensions
Traffic matrix was generated randomly from 1-50 with 50 being the highest.
24
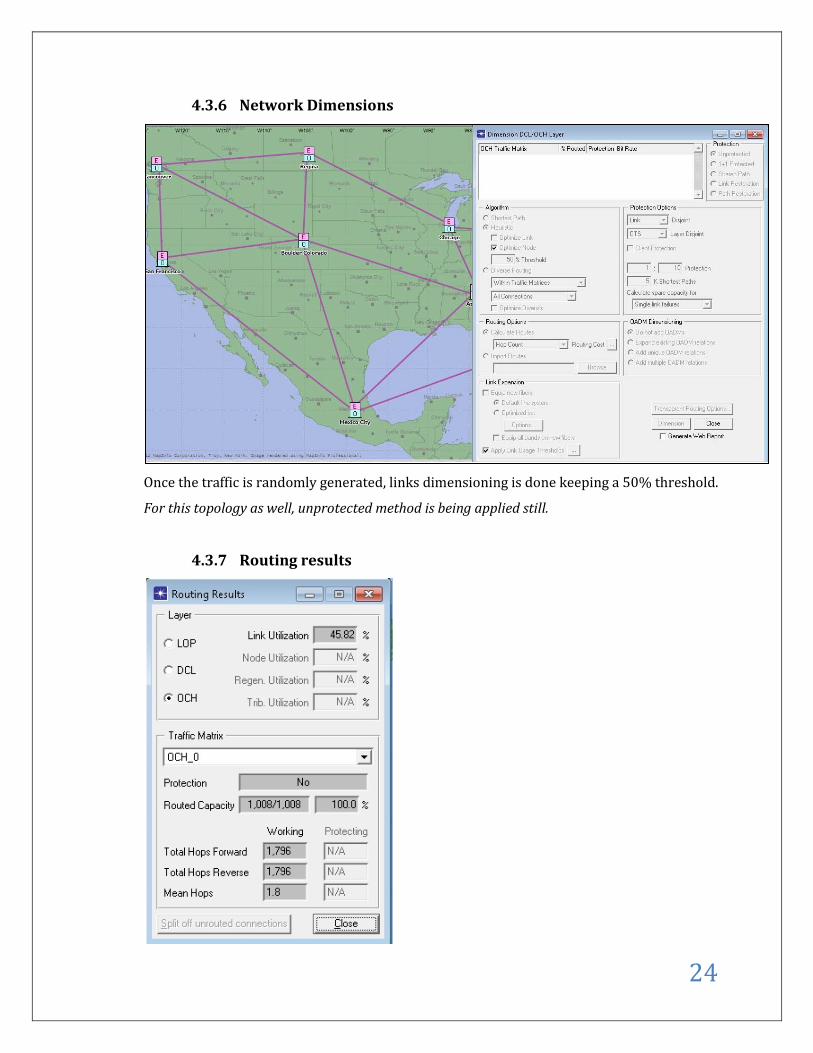
4.3.6 Network Dimensions
Once the traffic is randomly generated, links dimensioning is done keeping a 50% threshold.
For this topology as well, unprotected method is being applied still.
4.3.7 Routing results
25
Routing results provide us with the results given above for the ring based design, as shown
the link utilization is in between the star based and Mesh topology i.e. almost 45%. This
does make sense as the traffic would require fewer paths as compared to a star based
design however as compared to the mesh based design; link utilization should be a little
more. No protection method is being applied so no links are protected.
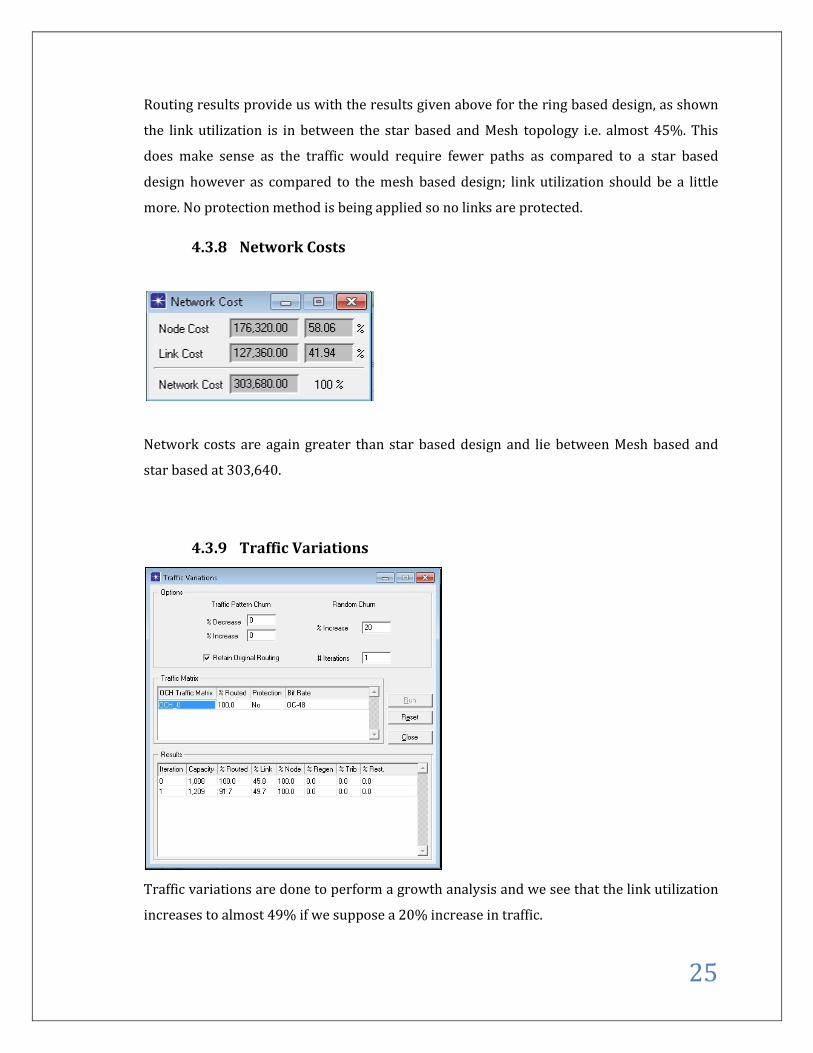
4.3.8 Network Costs
Network costs are again greater than star based design and lie between Mesh based and
star based at 303,640.
4.3.9 Traffic Variations
Traffic variations are done to perform a growth analysis and we see that the link utilization
increases to almost 49% if we suppose a 20% increase in traffic.
26
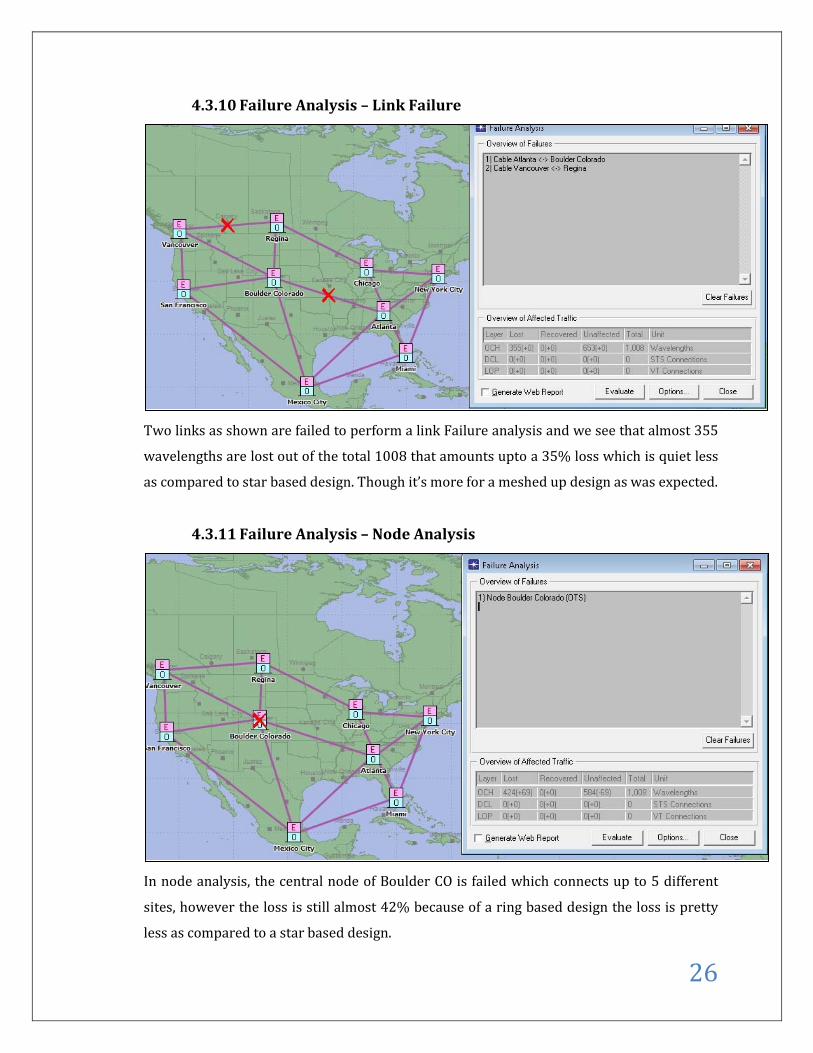
4.3.10 Failure Analysis – Link Failure
Two links as shown are failed to perform a link Failure analysis and we see that almost 355
wavelengths are lost out of the total 1008 that amounts upto a 35% loss which is quiet less
as compared to star based design. Though it’s more for a meshed up design as was expected.
4.3.11 Failure Analysis – Node Analysis
In node analysis, the central node of Boulder CO is failed which connects up to 5 different
sites, however the loss is still almost 42% because of a ring based design the loss is pretty
less as compared to a star based design.
27
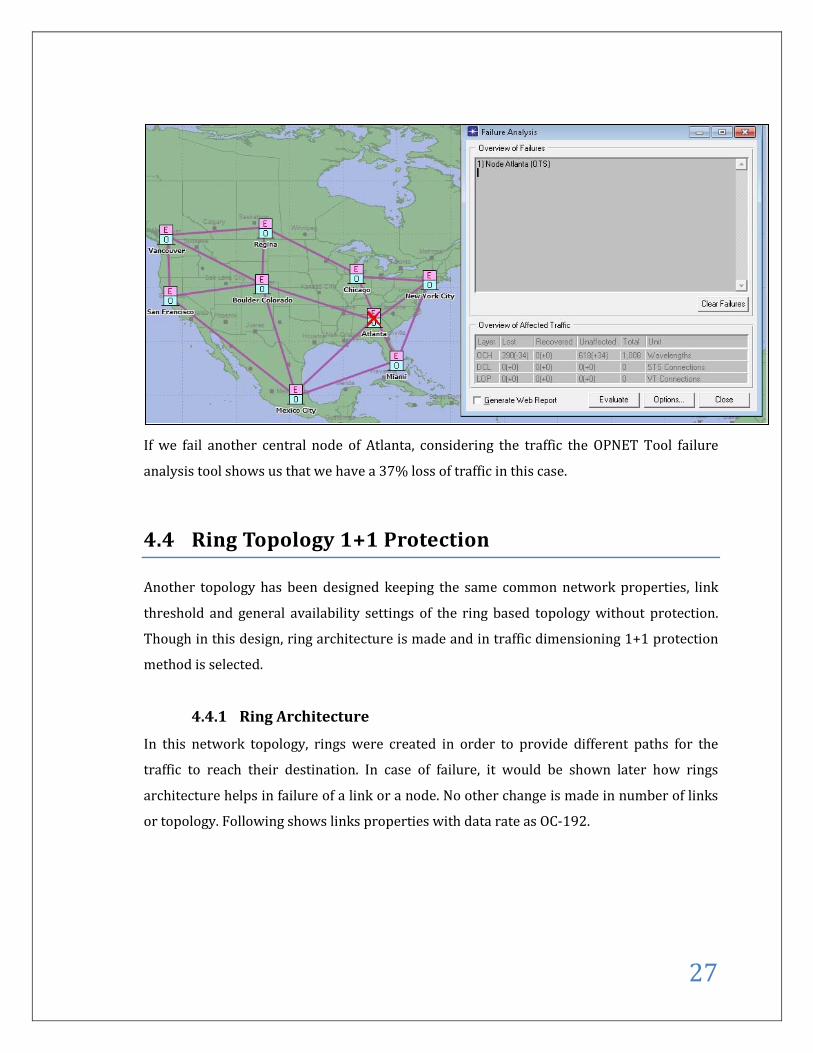
If we fail another central node of Atlanta, considering the traffic the OPNET Tool failure
analysis tool shows us that we have a 37% loss of traffic in this case.
4.4 Ring Topology 1+1 Protection
Another topology has been designed keeping the same common network properties, link
threshold and general availability settings of the ring based topology without protection.
Though in this design, ring architecture is made and in traffic dimensioning 1+1 protection
method is selected.
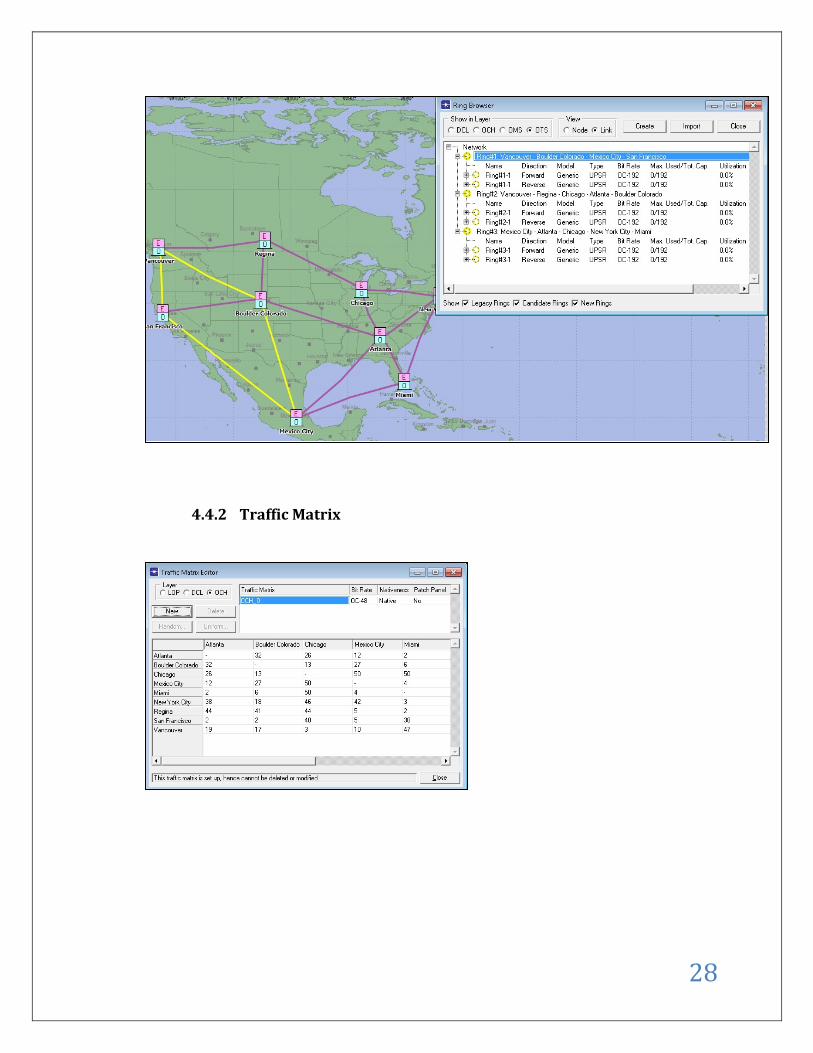
4.4.1 Ring Architecture
In this network topology, rings were created in order to provide different paths for the
traffic to reach their destination. In case of failure, it would be shown later how rings
architecture helps in failure of a link or a node. No other change is made in number of links
or topology. Following shows links properties with data rate as OC-192.
28
4.4.2 Traffic Matrix
29
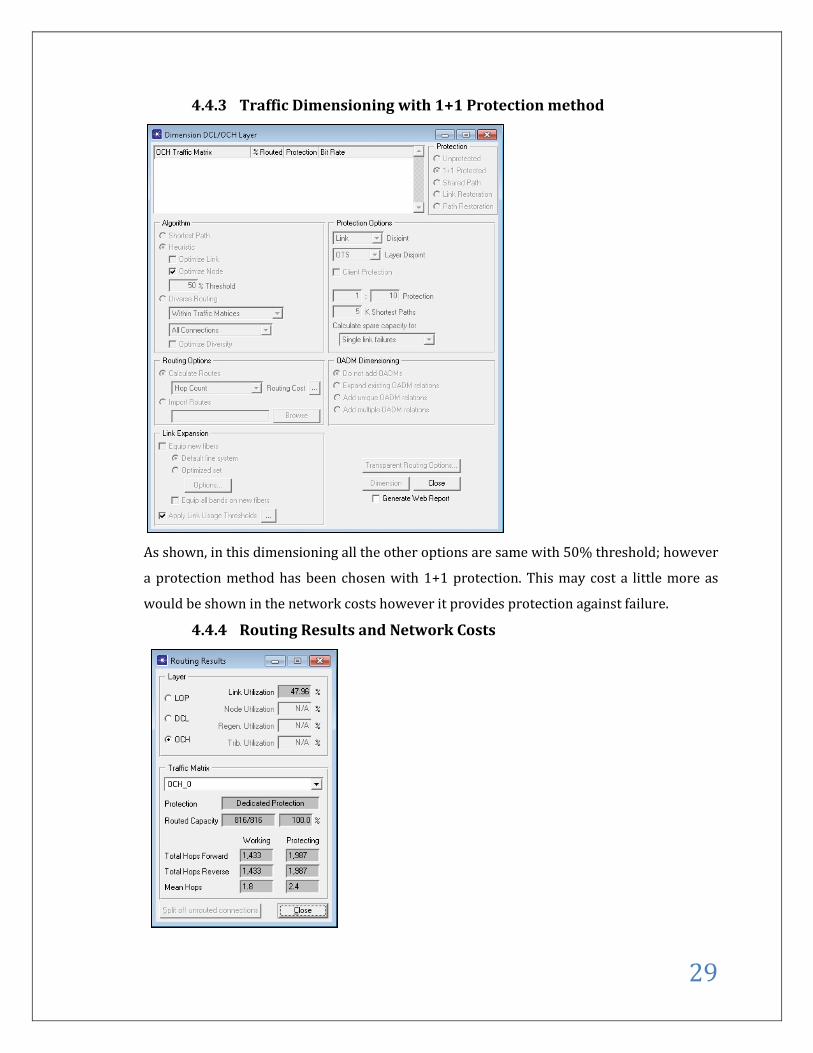
4.4.3 Traffic Dimensioning with 1+1 Protection method
As shown, in this dimensioning all the other options are same with 50% threshold; however
a protection method has been chosen with 1+1 protection. This may cost a little more as
would be shown in the network costs however it provides protection against failure.
4.4.4 Routing Results and Network Costs
30
Routing results show that the link utilization is a bit more than a normal without ring
based topology at 47% but provides protection of the links as well. As a protection method
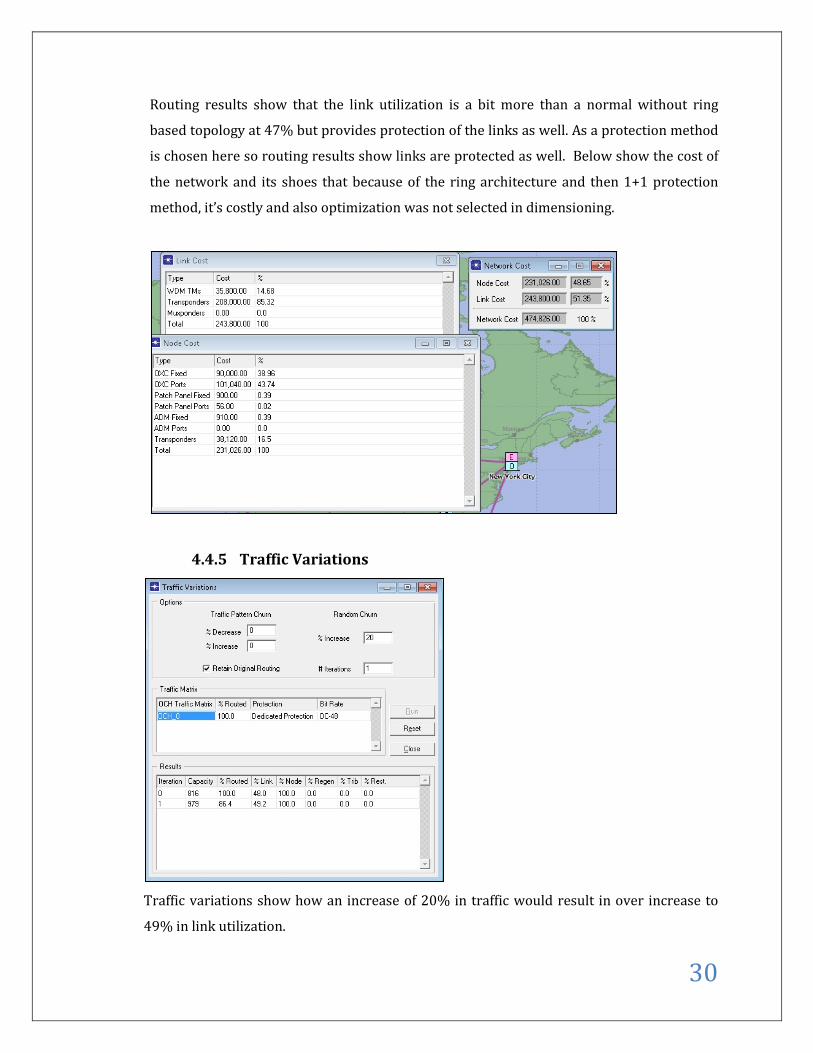
is chosen here so routing results show links are protected as well. Below show the cost of
the network and its shoes that because of the ring architecture and then 1+1 protection
method, it’s costly and also optimization was not selected in dimensioning.
4.4.5 Traffic Variations
Traffic variations show how an increase of 20% in traffic would result in over increase to
49% in link utilization.
31
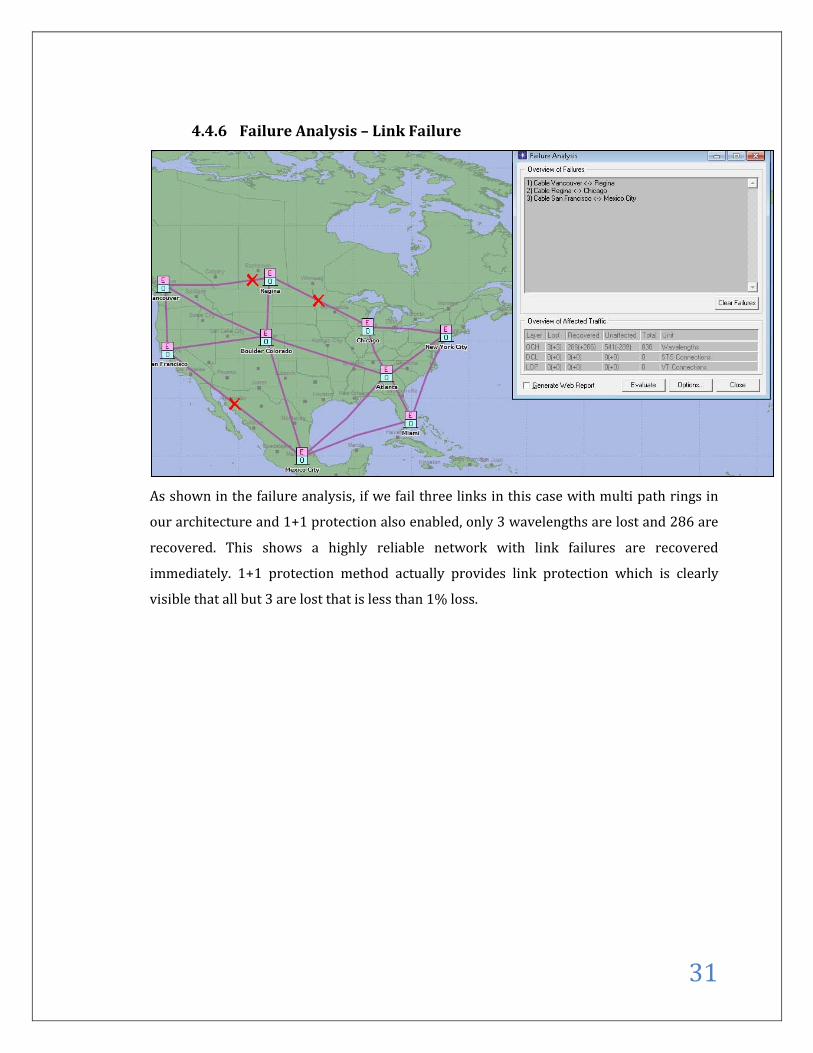
4.4.6 Failure Analysis – Link Failure
As shown in the failure analysis, if we fail three links in this case with multi path rings in
our architecture and 1+1 protection also enabled, only 3 wavelengths are lost and 286 are
recovered. This shows a highly reliable network with link failures are recovered
immediately. 1+1 protection method actually provides link protection which is clearly
visible that all but 3 are lost that is less than 1% loss.
32
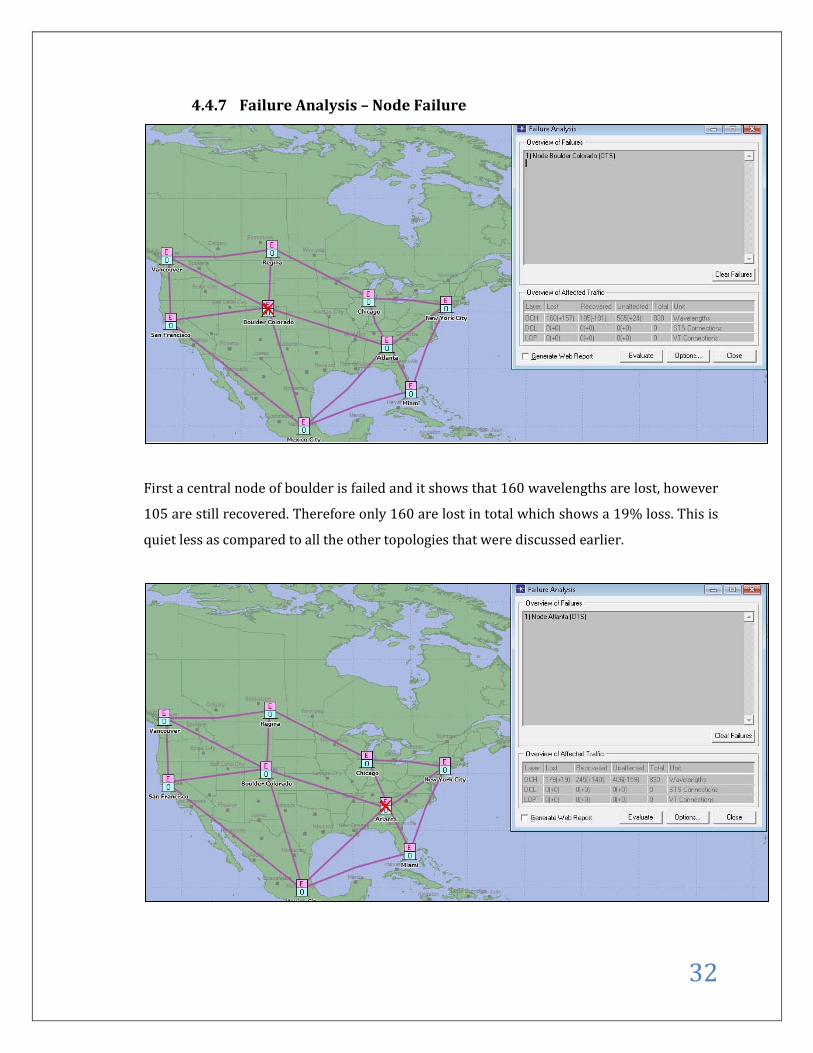
4.4.7 Failure Analysis – Node Failure
First a central node of boulder is failed and it shows that 160 wavelengths are lost, however
105 are still recovered. Therefore only 160 are lost in total which shows a 19% loss. This is
quiet less as compared to all the other topologies that were discussed earlier.
33
In this failure node analysis, another central node of Atlanta is being failed. This causes 179
wavelengths to be lost with 249 being recovered. This gives a loss of almost 21% which is
again less as compared to other topologies.
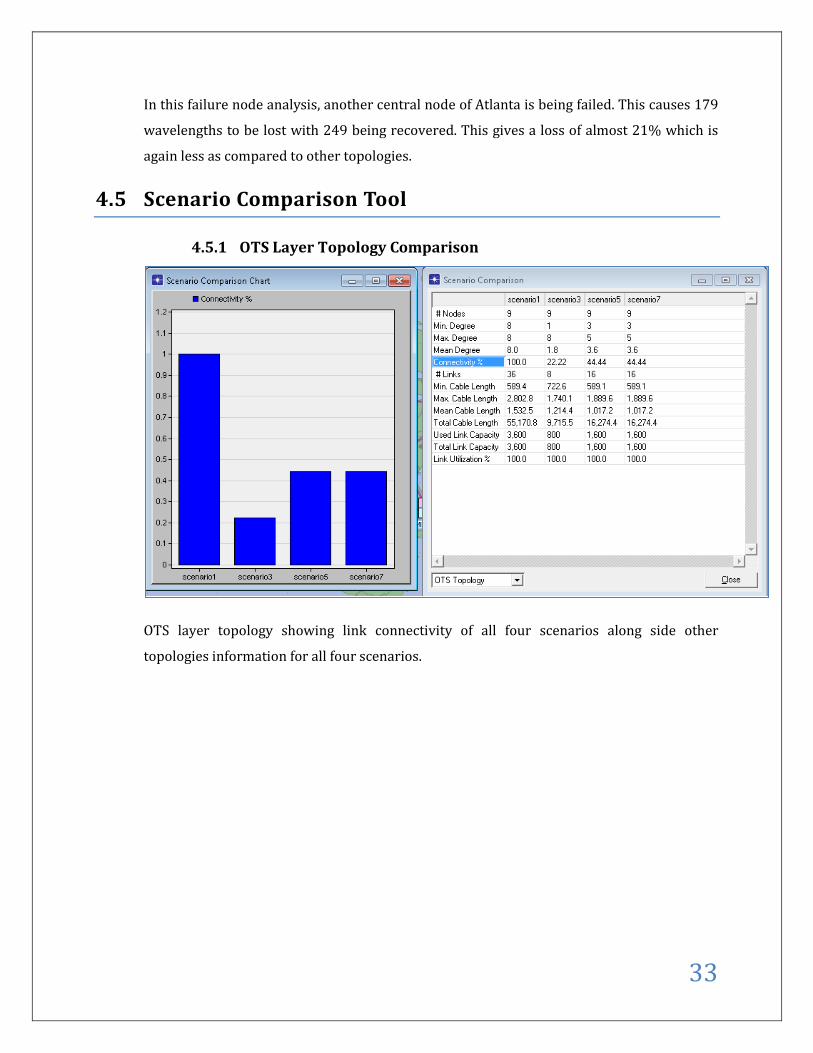
4.5 Scenario Comparison Tool
4.5.1 OTS Layer Topology Comparison
OTS layer topology showing link connectivity of all four scenarios along side other
topologies information for all four scenarios.
34
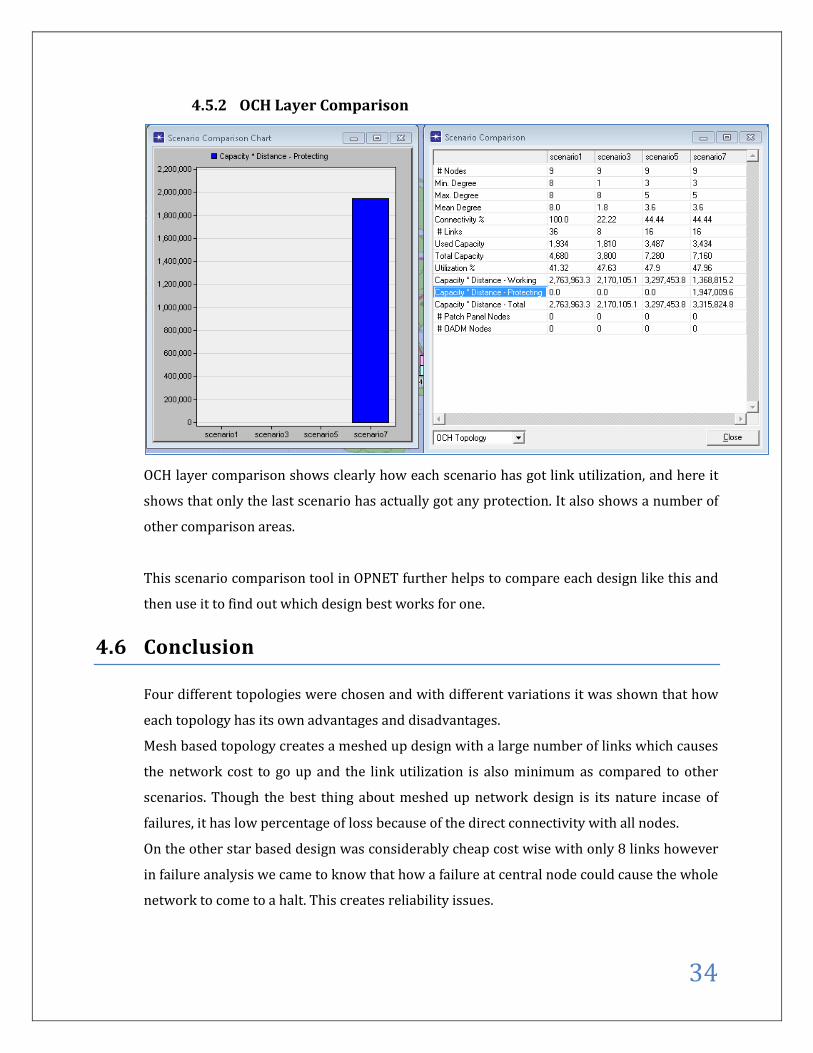
4.5.2 OCH Layer Comparison
OCH layer comparison shows clearly how each scenario has got link utilization, and here it
shows that only the last scenario has actually got any protection. It also shows a number of
other comparison areas.
This scenario comparison tool in OPNET further helps to compare each design like this and
then use it to find out which design best works for one.
4.6 Conclusion
Four different topologies were chosen and with different variations it was shown that how
each topology has its own advantages and disadvantages.
Mesh based topology creates a meshed up design with a large number of links which causes
the network cost to go up and the link utilization is also minimum as compared to other
scenarios. Though the best thing about meshed up network design is its nature incase of
failures, it has low percentage of loss because of the direct connectivity with all nodes.
On the other star based design was considerably cheap cost wise with only 8 links however
in failure analysis we came to know that how a failure at central node could cause the whole
network to come to a halt. This creates reliability issues.
35
Multiple path scenarios was an appropriate design having appropriate cost, also in failure
analysis the loss was less as compared to a star based design. On the other hand Ring Based
design having a 1+1 protection method was very well versed in Failure analysis of links
with just under 1% loss. Though this came at a price that was shown in network costs.
OPNET is a handy optical networking tool as it has a number of different tools which are
there for network developers, which can design the network according to their own needs
and then simulate there, design in a real time traffic environment. Various analysis tools
provide further idea how the design would work in case of failures or growth in traffic.