Embed Size (px)
Citation preview
OPTIMISATION OF CHO CELL GROWTH AND RECOMBINANT
INTERFERON-y PRODUCTION
A thesis submitted to the University of London
for the Degree of
DOCTOR OF PHILOSOPHY
by
Paula Maria Lima e Castro
Department of Chemical & Biochemical Engineering
University College London
Torrington Place
London WC1E 7JE
October 1993
I'!"LONDON
iNlV

To my parents

ABSTRACT
The optimisation of recombinant protein production by animal cell cultures is important for the
economic feasibility of these processes. Simultaneously with product yield, product
authenticity is a crucial aspect to consider as it may per se affect the therapeutic value of such
proteins. More defmed culture media are being developed, particularly to ensure batch product
consistency. A Chinese Hamster Ovary cell line (CHO 320) producing human interferon-y
(IFN-y), a glycosylated protein, was chosen to investigate the effects of the culture
environment on (I) cell growth, (2) product yield and (3) product authenticity.
A statistical approach was used to identify important culture components for cell growth and
LFN-y production. When the concentration of the resulting positive variables was initially
increased in culture, improvements of approximately 40% in both of these parameters were
achieved; the glycosylation of JFN-y was not affected. The former analysis also indicated that
different stimuli were required for growth and production. Fed-batch feeding of glucose and
glutamine, components depleted early from culture, did not prolong cell growth or IFN-y
production but the initial glycosylation pattern of WN-y was a function of glutamine
concentration.
Bovine serum albumin (BSA) was shown to have important role(s) in culture and cell growth
was not possible in its absence. Pluronic F68, alone or in combination with a lipid mixture or
linoleic acid, was able to restore cell growth in low BSA (1 mg/ml) cultures. However, JFN-y
production was significantly reduced and the extent of IFN-y glycosylation also changed.
These effects were related to: (1) BSA concentration, (2) BSA type, and ultimately, (3) lipid
composition of the culture.
The results reported in this thesis exhibit the necessity to consider the effects of the culture
environment not only on cell growth and product yield but also on product authenticity
throughout any optimisation process.
3
ACKNOWLEDGEMENTS
I would like to express my sincere gratitude to all those who have provided support throughout
this work, at University College London and at the University of Kent at Canterbury, where
Animal Cell Culture facilities were made available for my research. Special thanks go to my
supervisors, Professor Alan T. Bull and Dr. Andrew P. Ison, for their guidance and
constructive criticism during my research and in the preparation of this thesis.
I would also like to thank Dr. Nigel Jenkins for allowing me to use the facilities in his
laboratory, Dr. Mike Bushell for helpful advice on the statistical methodology and Dr. John
Clegg for the encouraging discussions during my research.
I am very grateful to all the members of the Animal Cell Biotechnology Group for making my
time at UKC so enjoyable. In particular, I would like to mention Paul Hayter for his helpfuL
suggestions in all aspects of my research and for reading and discussing substantial parts of the
thesis. I would also like to mention Malcolm Gould, Lucy Gettings, Jerry Tong, David James
and Lis Curling for their valuable advice and assistance.
The friendship and encouragement of many friends made my stay in England a period I will
always cherish. A special thought goes to José Luz, Paulo Pinto, Helena Assis e Manuel
Santos, Paulo Carvalho, Alison Hovey, Mark Calleja, Carlos Sá da Costa, Antonio Lobo and
Kioko Kawamura.
A word of gratitude to my parents and my brothers and sisters for their constant support and
love.
I finally acknowledge the Junta Nacional de Investigacao CientIfica e Tecnologica- INICT,
Portugal and the Science and Engineering Research Council- SERC, for financial support.
4

TABLE OF CONTENTS
Page
ABSTRACT
3
ACKNOWLEDGEMENTS
4
TABLE OF CONTENTS
5
TABLE OF TABLES
10
TABLE OF FIGURES
12
NOMENCLATURE
14
1- INTRODUCTION
17
1.1- Animal cells: a potential resource
17
1.1.1- General introduction
17
1.1.2- Why use animal cells?
18
1.1.3- Products obtained from animal cells in culture
20
1.2- Cultivation systems for animal cells
23
1.2.1- Kinetics of growth and product formation
23
1.2.2- Cultivation techniques
25
1.2.3- Hydrodynamic environment of the cells
28
1.2.3.1- Aeration and agitation
27
1.2.3.2- Additives for cell protection from fluid-mechanical damage
30
1.2.4- Temperature and pH
33
1.3- Cell nutritional environment- the culture medium
34
1.3.1- Development of serum-free medium
34
1.3.2- Cell requirements in serum-free medium
36
1.3.2.1- Energy sources
36
1.3.2.2- Amino acids
39
1.3.2.3- Lipids
40
1.3.2.4- Vitamins and minerals
41
1.3.2.5- Protein supplementation
42
1.3.3- Toxicity in animal cell culture 44
5

1.4- Production of glycoproteins
46
1.4.1 - Significance of glycosylation
47
1.4.2- The host and its environment
49
1.4.3- Interferon-y
50
1.5- Scope of the work
55
2- MATERiALS AND METHODS
57
2.1- Cell culture system 57
2.1.1- Cell line
57
2.1.2- Culture medium
57
2.1.2.1- Serum-free medium
57
2.1.2.2- Specific media supplementation
59
2.1.3- Cell culture methods
63
2.1.3.1- Cell maintenance
63
2.1.3.2- Shake-flask and fermenter cultures
64
2.1.3.3- Plackett-Burman experimental set-up
68
2.2- Analytical Methods
68
2.2.1 - Determination of CHO cell growth
68
2.2.2- IFN-y analysis
69
2.2.2.1- ELISA assay for IFN-ytitre
69
2.2.2.2- Analysis of JFN-'y glycosylation
71
2.2.2.2.1- Immunoprecipitation of IFN-y
71
2.2.2.2.2- SDS-page electrophoresis
72
2.2.2.2.3- Silver staining
72
2.2.3- Metabolite analysis
75
2.2.3.1- Enzymatic determination of glucose
75
2.2.3.2- Enzymatic determination of lactate
76
2.2.3.3- Determination of ammonia
77
2.2.3.4- HPLC determination of amino acids
78
2.2.3.4.1- Sample and buffer preparation
79
2.2.3.4.2- Auto-sampler preparation
80
2.2.3.4.3- HPLC assay
80
6

2.3- Experimental data analysis
81
3- STATISTICAL ANALYSIS OF THE CULTURE MEDIUM
83
3.1- Introduction
83
3.2- CHO cell growth and IFN-y production in serum-free medium
86
3.3- Statistical screening of the medium components:
the Plackett-Burman design
88
3.3.1- Experimental design
88
3.3.2- Experimental effects of variables
92
3.4- Cluster effect of positive and negative groups of variables
98
3.4.1- Cell growth and IFN-y production: titre and product quality
98
3.4.2- Analysis of the culture medium
101
3.4.3- The independent effect of BSA
107
3.5- The stimulating effect of the positive variables on CHO cell growth
110
3.5.1 - Effect of methotrexate on CHO cell growth
110
3.5.2- Fed-batch cultures with the positive group of components
112
3.6- Concluding remarks
115
4- FED-BATCH FERMENTER CULTURES
117
4.1- Introduction
117
4.2- Cell growth and IFN-y production in fermenter cultures
120
4.3- Glucose and glutamine fed-batch cultures
120
4.3.1- Glucose and glutamine profiles 122
4.3.2- Cell growth and IFN-'y production
127
4.3.3- IFN-y glycosylation patterns
133
4.4- Metabolic flux changes in batch and fed-batch cultures
135
4.4.1- Glucose and glutamine metabolism 137
4.4.2- Amino acid metabolism 138
4.5- Concluding remarks 141
7

5- ThE EFFECTS OF BSA, LIPIDS AND PLURONIC F68 ON CHO
CELL CULTURE
144
5.1- Introduction 144
5.2- Defmition of the culture conditions 147
5.3- Effect of reducing the BSA concentration of the culture medium 148
5.3.1- Possible substitutes for BSA- lipids and Pluronic F68
148
5.3.2- Influence of individual lipid components on the behaviour of
low-BSA cultures: Plackett-Burman statistical analysis 153
5.3.3- Linoleic acid substitution of the lipid mixture 159
5.3.4- Effects of fatty acid-free BSA in culture 167
5.3.5- The independent effects of Pluronic F68 and fatty acid-free BSA
172
5.4- Supplementation of control cultures with lipids and Pluronic F68
177
5.4.1 - Addition of lipids to control cultures
177
5.4.2- Addition of Pluronic F68 to control cultures 179
5.5- Effect of serum in culture 182
5.6- Concluding remarks
185
6- GENERAL DISCUSSION
188
6.1- The Plackett-Burman statistical design applied to the optimisation
of the cell culture composition 188
6.2- The cell culture environment
189
6.2.1 - CHO cell growth and JFN-y production enhanced by different stimuli 190
6.2.2- Influence of BSA on CHO cell growth and JFN-y production
193
6.2.2.1- Nutritional effect 194
6.2.2.2- "Protective" effect 194
6.2.2.3- Antioxidant effect 196
6.2.2.4- Cell structural integrity 196
6.2.3- Glycosylation of IFN-'y 198
6.2.3.1- Glycosylation of IFN-'y is not dependent on the rate of IFN-y
production 199
6.2.3.2- The effect of glucose and glutamine in the glycosylation of JFN-y 200
8
6.2.3.3- The extent of IFN-y glycosylation varies with the concentration
and type of BSA in culture
201
6.2.3.4- Serum affects the patterns of IFN-y
206
6.2.3.5- The impact of the media composition on the production
of glycoproteins
207
6.3- Nature of CHO cell growth limitation
209
7- CONCLUSIONS
211
8- SUGGESTIONS FOR FUTURE WORK
213
REFERENCES
215
9

TABLE OF TABLES
Page
1.1- Examples of products obtained from animal cells. 21
1.2- Recombinant products in clinical development. 22
1.3- Examples of recombinant protein production by different cultivation techniques 27
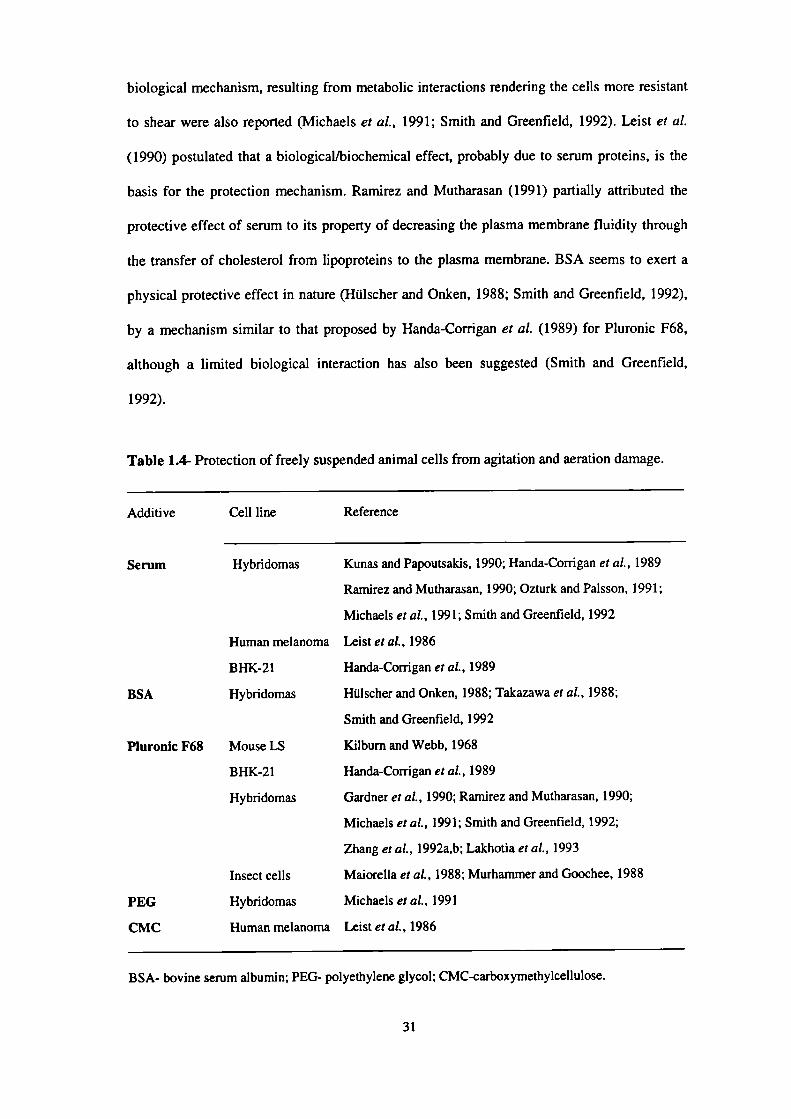
1.4- Protection of freely suspended animal cells from agitation and aeration damage. 31
1.5- Factors affecting the glycosylation pattern of recombinant proteins. 50
2.1- Cell culture medium supplements and final concentrations in RPMI 1640. 58
2.2- Solutions prepared to supplement the serum-free culture medium for the
statistical study. 61
2.3- Composition of buffers used for the IFN-y ELISA assay. 69
2.4- Procedure for the ELISA assay for IFN-y. 70
2.5- Buffers for immunoprecipitation of IFN-y. 71
2.6- Reagents required for the Bio-rad Silver Staining procedure. 73
2.7- Silver staining procedure for mini-gels. 73
2.8- Buffers for HPLC determination of derivatised amino acids. 79
2.9- Chromatography program for OPA amino acid assay. 81
3.1- Plackett-Burman matrix for the study of 23 variables with 24 experiments. 89
3.2- Components under study and their corresponding concentrations. 90
3.3- Cell growth and JFN-y production data for Plackett-Burman analysis. 91
3.4- Components and their effects on cell growth rate, viable cell production
and IFN-y titre. 94
3.5- Effects of the positive and negative variables on CHO cell growth and
IFN-y production. 98
3.6- Initial consumption rates of glucose and glutamine in batch control
cultures (I) and batch cultures containing the positive (+11) or negative (-II)
groups of variables. 106
3.7- Accumulation of lactate and ammonia in batch control cultures (I) and
batch cultures containing the positive (+11) or negative (-II) groups of variables. 106
3.8- Independent effect of the two positive group variables (amino acids plus
pyruvate, and BSA) on CHO cell growth and IFN-y production. 107
3.9- Effect of different BSA preparations on IFN-y production. 109
10

3.10- Effect of MTX and positive group on CHO cell growth. 112
3.11- Scheduled feeding of the positive group of variables to stirred batch cultures. 113
3.12- Effect of different feeding strategies of the positive group on CHO cell growth. 114
4.1- Feeding regime of glucose and glutamine to fermenter cultures. 122
4.2- Specific cell growth and IFN-y production rates in fermenter cultures. 127
4.3- Ammonia and lactate levels at cessation of cell growth in fermenter cultures 131
4.4- Metabolic quotients for glucose and glutamine in fed-batch cultures. 138
4.5- Amino acid initial consumption/production rates in fed-batch cultures. 139
5.1- Culture environments used in the present Chapter. 147
5.2- Addition of different combinations of a lipid mixture and Pluronic F68 to
1 mg/ml BSA cultures. 150
5.3- IFN-y production rates in cultures A, D and E. 151
5.4- Plackett-Burman matrix for the study of 7 variables. 153
5.5- Components under study and corresponding concentrations. 154
5.6- Cell growth and JFN-y data for Plackett-Burman analysis. 155
5.7- Components and their effects on CHO cell growth and JFN-y production. 157
5.8- Specific cell growth and IFN-y production rates in low-BSA cultures. 159
5.9- Intracellular and extracellular IFN-y accumulation in low-BSA cultures. 162
5.10- Initial JFN-y production rates in low-BSA cultures. 169
5.11- Proportions of the ON and 2N IFN-y glycoforms in low-BSA cultures. 175
5.12- Relative unit cost of IFN-y produced using different media. 187
6.1- Effect of several components on CHO cell growth and IFN-y titre and
glycosylation. 191
6.2- Effect of BSA and medium supplements on interferon-y production. 202
11

TABLE OF FIGURES
Page
1.1- Diagram of the major metabolic pathways of animal cells
(derived from Miller et al., I 989a). 37
1.2- N-linked oligosaccharide processing in mammalian cells
(derived from Goochee eta!., 1990). 48
1.3- Human interferon-y polypeptide sequence. 51
1.4- Biantennary N-glycans associated with 1FN-y (derived from Mutsaers eta!., 1986). 51
1.5- N-glycans associated with IFN-'y (derived from James eta!., 1993). 53
2.1- Process diagram for fermenter cultures under batch and fed-batch operation. 67
2.2- Analysis of JFN-y variants produced by CHO cells. 74
3.1- Kinetics of CHO cell growth and IFN-y production in stirred batch culture. 87
3.2- Glycosylation patterns of IFN-y obtained from a) control cultures and b) cultures
containing increased concentrations of the positive group of variables. 100
3.3- Cell growth in control batch cultures (I), and cultures containing the positive
group of nutrients (+11) or negative group of nutrients (-II). 102
3.4- Glucose and amino acid consumption/production in control batch cultures (I),
and cultures containing the positive group of nutrients (+11)
or negative group of nutrients (-II). 103
3.5- Effect of supplementing the culture with different sources of BSA on
CHO cell growth. 108
3.6- Synthesis of glycine from serine and tetrahydrofolate. 111
4.1- a) Cell growth and b) IFN-y production in control fermenter cultures and
cultures containing the positive group of variables. 121
4.2- Glucose concentration profile in fed-batch cultures a) FF1, b) FF2 and c) FF3. 124
4.3- Glutamine concentration profile in fed-batch cultures a) FF1, b) FF2 and c) FF3. 125
4.4- Cumulative consumption of a) glucose and b) glutamine in fed-batch cultures. 126
4.5- a) Cell growth, b) cell viability and c) IFN-'y production in fed-batch cultures. 128
4.6- Accumulation of a) ammonia and b) lactate in fed-batch cultures. 130
4.7- Percentage of each amino acid remaining in fed-batch cultures at the cessation
of cell growth. 132
12

4.8- Glycosylation patterns of JFN-y obtained from fermenter cultures with
a,b) 2 mM initial glutamine and c,d) 0.5 mM initial glutamine concentration. 134
4.9- Major routes of glucose metabolism. 136
4.10- Major routes of glutamine metabolism. 136
4.11- a) Glutamate and b) alanine production in fed-batch cultures. 142
4.12- Metabolism of serine and glycine in fed-batch cultures a) FF1, b) FF2 and c) FF3. 143
5.1- a) Cell growth and b) 1FN-y production in cultures A, D and E. 152
5.2- a) Cell growth and b) WN-y production in cultures A, K, E, M and L. 160
5.3- Glycosylation patterns of JFN-y obtained in cultures A, K, E, M and L. 163
5.4- Analysis of IFN-y variants obtained in cultures A and L. 165
5.5- Initial production rates of the three IFN-y glycoforms in cultures A, K, E and L. 165
5.6- Accumulation of each IFN-yglycoform during cultures A, K, E and L. 166
5.7- a) Cell growth and b) IFN-y production in cultures A, N, 0, P. and Q. 168
5.8- Glycosylation patterns of IFN-y obtained in cultures A, N, 0, P and Q. 170
5.9- Initial production rates of the three IFN-'y glycoforms in cultures A, N, 0, P and Q. 172
5.10- Accumulation of each IFN-y glycoform during cultures A, N, 0, P and Q. 173
5.11- a) CHO cell growth and b) JFN-y production in cultures A, K, N and 0. 174
5.12- Glycosylation patterns of IFN-y obtained in cultures A, K, N and 0. 176
5.13- a) CHO cell growth and b) IFN-y production in 5 mg/ml BSA cultures
supplemented with I mi/l lipid mixture. 178
5.14- Glycosylation patterns of IFN-y obtained in 5 mglml BSA cultures
supplemented with 1 ml/l lipid mixture. 179
5.15- a) CHO cell growth and b) IFN-y production in 5 mg/mi BSA cultures
supplemented with 0.1% Pluronic F68. 180
5.16- Glycosylation patterns of IFN-y obtained in 5 mg/mI BSA cultures
supplemented with 0.1% Pluronic F68. 181
5.17- a) CHO cell growth and b) JFN-'y production in serum supplemented cultures. 183
5.18- Analysis of IFN-y variants obtained in serum-free and serum-supplemented
cultures. 184
5.19- Glycosylation patterns of IFN-y obtained in serum supplemented cultures. 184
13

NOMENCLATURE
AIDS
Ala
Arg
Asn
Asp
a-kG
BHK
BSA
Cl 27
CSF
CD-4
CHO
CMC
CMP
Cys
Da
DHFR
DMEM
DMSO
Dol-P-P
EBM
EDTA
EGF
ELISA
EPO
ER
FAF-BSA
FCS
FGF
GDP
Gic
GIcNAc
Acquired Immune Deficiency Syndrome
alanine
arginine
asparagine
aspartate
a- ketoglutarate
Baby Hamster Kidney cells
bovine serum albumin
Mouse Mammary cells
cerebrospinal fluid
human T-4 differentiation antigen
Chinese Hamster Ovary cells
carboxymethycellulose
cytidine monophosphate
cystine
dalton
dihydrofolate reductase
Dulbecko's Modified Essential Medium
dimethyl sulfoxide
dolychol-P-P
ephithelial basement membranes
[ethylenedinitrilol tetra-acetic, disodium salt
epidermal growth factor
enzyme linked immunosorbant assay
erythropoietin
endoplasmic reticulum
fatty acid-free bovine serum albumin
foetal calf serum
fibroblast growth factor
guanosine diphosphate
glucose
N-acetylglucosamine
14
Gin
Glu
Gly
h
HDL
HPLC
WN
IFN-y - xN
'U
Hdp
His
}IIV
IGF
IgG
1gM
Iso
IL
Leu
Lip mix
LL-O
Lys
m
Mab
man
MDCK
MEM
MES
Met
mPL-I
MDC
MW
p
OPA
P
glutamine
glutamate
glycine
hour
high density lipoprotein
high performance liquid chromatography
interferon
interferon-y glycosylated at x sites
International Units
hydroxyproline
histidine
human immunodeficiency virus
insulin-like growth factor
immunoglobulin 0
immunoglobulin M
isoleucine
iriterleukin
litre
leucine
lipid mixture
lipid-linked oligosaccharide
lysine
minute
monoclonal antibody
mannose
Madin-Darby Canine Kidney cells
Minimum Essential Medium
2-[N-morpholino] ethanesulfonic acid
methionine
mouse placental lactogen-I
methotrexate
molecular weight
specific cell growth rate (h-I)
orthophthalaldehyde
phosphate15
PAGE
PBS
PDGF
PEG
Phe
Pro
pSV2
amm
qglc
qgln
JFN
lac
RPM!
rscu-PA
SDS
SE
Ser
5V40
TCA
Tris
Thr
polyacrylamide gel electrophoresis
phosphate buffered saline
platelet-derived growth factor
polyethylene glycol
phenylalanine
proline
mammalian expression plasmid vector
specific production rate of ammonia (pmo!IlO6cells/h)
specific consumption rate of glucose (pmol/lO6cells/h)
specific consumption rate of glutamine (nmol/lO6cells/h)
specific production rate of interferon-y (lUll 06 cells/h)
specific production rate of lactate (pmoL'lO6cells/h)
Roswell Park Memorial Institute medium
recombinant single chain urokinase-type plasminogen activator
sodium dodecyl sulphate
standard error
serine
Simian virus 40
tricarboxylic acid
2-amino-2-[hydroxymethylj 1 ,3-propandiol
threonine
TNF tumour necrosis factor
t-PA tissue-type plasminogen activator
Try tryptophan
Tyr tyrosine
UDP uridine diphosphate
V variance
Val valine
Yammlgln yield of ammonia on glutamine (mol/mol)
Ylac/glu yield of lactate on glucose (mol/mol)
16

1- INTRODUCTION
1.1- Animal cells: a potential resource
1.1.1- General introduction
The first reports on cultivation of animal cells date back to the beginning of the century. In
1907, Harrison suspended dissected nerve tissue from frog embryos in lymph fluid, allowed it
to clot as a droplet on the underside of a microscope cover slip sealed with wax, and found that
the embryonic nerve cells were able to grow for several weeks under these conditions
(Harrison, 1907). The more recent area of cell culture technology started in the early 1950s
with the work of Eagle, who analysed the nutritional requirements of animal cells in culture
(Eagle, 1955a,b,c), and the number of available cell lines has increased significantly since this
initial work was carried out.
The approach of using cells which naturally produced the product of interest has presented
several limitations. The producer cells often could not be cultivated and the productivity of the
cells was extremely low. The ability to fuse cells of different types emerged in the 1970s,
making it possible to produce genetically stable hybridomas, capable of continuous secretion
of specific monoclonal antibodies (Koler and Milstein, 1975). The development of the
recombinant DNA technology also in the 1970s, with the expression of mammalian genes in
bacteria, led to the production of mammalian proteins in bacterial cultures (Cohen et a!.,
1973). This technology was then applied to mammalian cells and many types of cells were
transformed to continuous cell lines capable of infinite growth capacity while others were
genetically manipulated to produce selected products. The developments which occurred in
recombinant DNA technology have made possible the production of many previously scarce
human proteins in large quantities (Bebbington and Hentshell, 1985) and as a result several
17

recombinant mammalian cells capable of high specific production of selected compounds are
now available.
The development of animal cell technology has been a continuous process and is the result of
technological advances in different areas, such as bioreactor design, cultivation techniques,
genetic engineering techniques, media design and protein concentration and purification
techniques. Much effort is being dedicated to widen the knowledge of cellular physiology and
protein processing, the mechanisms controlling gene expression and the activity of specific
gene products. Development in the area of process control is also required.
1.1.2- 'Why use animal cells?
It was believed in the late 1970s that most of the biologicals naturally produced by animal
cells would be produced in the future either by prokaryotic cells, e.g., bacteria, or by
eukaryotic cells, e.g., yeast. In recent years it became clear that there are several advantages in
using animal cells as hosts, instead of bacterial or yeast systems, despite the perceived
economical advantages of the latter ones. Animal cells, unlike bacteria or yeast systems, have
the ability to secrete proteins in a correctly folded functional state and with the correct post-
translational modifications, such as glycosylation (Berman and Lasky, 1985; Bialy, 1987).
These features may be essential for the biological function of a protein (Dube et al., 1988;
Delorme et al., 1992). Glycosylation is one of the most significant post-translational
modifications and can influence the biological activity, immunogenicity and life time of
therapeutic proteins (Parekh et a!., 1989a). It should be considered though that cells may not
be able to perform all the modifications necessary for a specific protein, and even proteins
expressed in mammalian cells may display reduced activity because of incorrect processing
(Yan et al., 1989).
18
A detailed analysis of the biosynthetic capabilities of existent expression systems (bacteria,
yeast, insect cells, animal cells) has been made by Bialy (1987). When a mammalian gene is
introduced into an heterologous host, such as a bacterium, some aspects of the complex protein
biosynthetic apparatus can be modified and they may have significant problems in modifying,
over-expressing and folding foreign proteins. Bacteria are not able to perform post-
translational modifications associated with mammalian cell proteins, like proteolytic cleavage,
subunit association or addition reactions, especially glycosylations, phosphorylations,
acylations and methylations. Inactive protein, altered or unexpected activity and increased
difficulty in purification are some of the possible consequences. Yeasts constitute another
alternative for the expression of some human proteins. They are able to perform post-
translational modifications to secreted proteins (Smith et a!., 1985) although some of these
may differ from those occurring in animal cells.
Another factor that needs consideration when comparing animal cell systems with bacterial
systems is the usual absence of an effective secretion mechanism in the latter one. In bacterial
systems, unless the product of the inserted gene is associated with a secretory component it
will remain within the bacteria. The development of renaturation procedures for product
recovery may be required, and this can limit the practicability of a bacterial production
process, as it has been reported for the production of tissue-type plasminogen activator (t-PA)
by Escherichia coli (Datar eta!., 1993). Proteins from animal cells are secreted to the medium,
enabling product extraction to be made from culture supematants, which is much more
convenient than extraction from the cell lysate, although it exposes the product to the possible
harsh environment of the culture. In addition, endotoxins can be part of the bacterial lysate,
and have to be completely removed before use of the desired protein (Butler, 1987).
The major drawbacks of using animal cells are still the cost of fermentation and the lower
productivities achieved. The first point is particularly stressed when serum is used in the
19

culture medium. A comparative economic analysis of the recovery process of t-PA from either
Chinese Hamster Ovary (CHO) cells or Escherichia coli has shown that the ratio of
fermentation to recovery materials cost for CHO-tPA is 3:1 while for t-PA from Escherichia
coli the ratio is 1:7 (Datar et a!., 1993), highlighting the expensive mammalian cell culture
fermentations and the complex downstream processing required for products obtained from
bacteria cultures.
Nevertheless, animal cells seem to produce the most structurally accurate human proteins,
when compared to bacterial and yeast systems. Ability of performing post-translational
modifications, accurate polypeptide folding, efficient assembly of subunits and secretion of
proteins are the most significant aspects which enhance the importance of the use of animal
cells.
1.1.3- Products obtained from animal cells in culture
A wide range of biological products are produced by animal cells in culture. Vaccines,
monoclonal antibodies, growth factors, hormones, plasminogen activators and lymphokines
are among the large group (Mizrahi, 1988; Leist et a!., 1990; Sanders, 1990; Birch, 1991).
Examples of recent animal cell products, some of which are already in therapeutic use, are
presented in Table 1.1. Sanders (1990) presented an extensive list of genes currently expressed
in specific animal cell types.
The cell lines which are cited in Table 1.1 are the ones that are most commonly used for
protein production. Among these, the CHO cell line is the best characterised and most widely
used. CHO cells were first isolated by Puck, who in 1957 established a fibroblastic cell line
from the ovary of a Chinese hamster (Puck et a!., 1958). The CHO host/vector system that has
been most used is a result of the co-amplification of the genes for dihydrofolate reductase
20
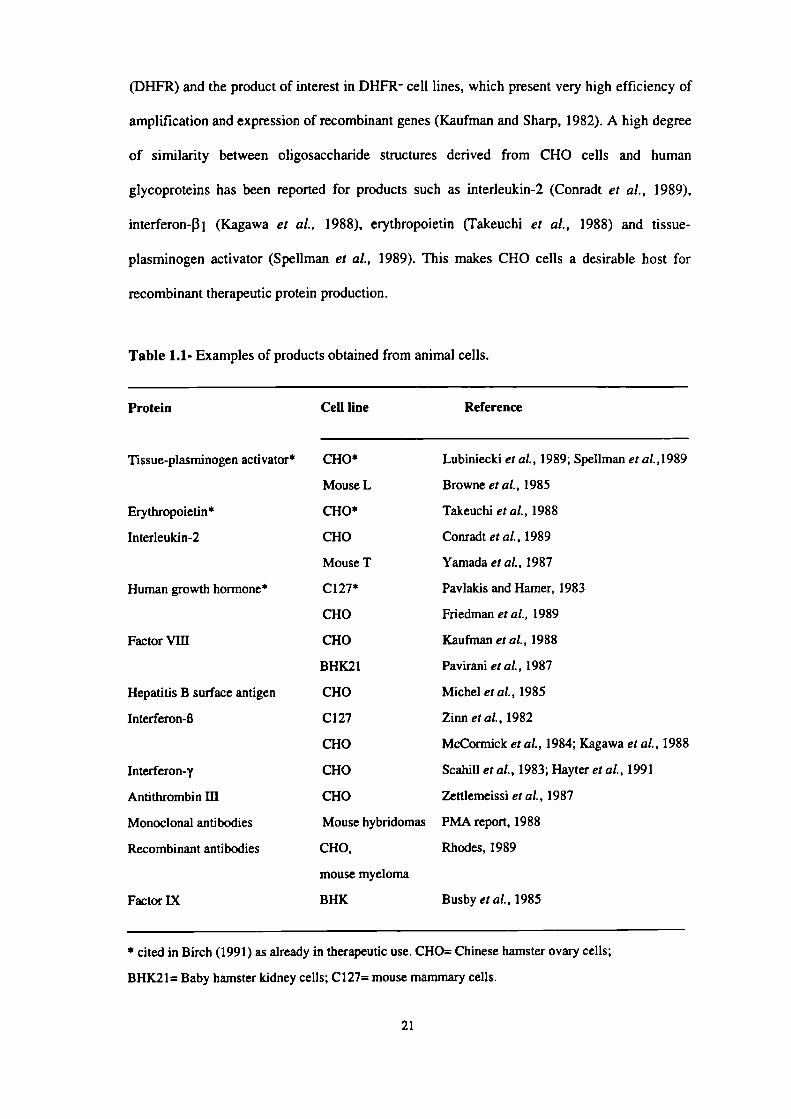
(DHFR) and the product of interest in DHFR- cell lines, which present very high efficiency of
amplification and expression of recombinant genes (Kaufman and Sharp, 1982). A high degree
of similarity between oligosaccharide structures derived from CHO cells and human
glycoproteins has been reported for products such as interleukin-2 (Conradt et a!., 1989),
interferon-3i (Kagawa et a!., 1988), erythropoietin (Takeuchi et a!., 1988) and tissue-
plasminogen activator (Speilman et al., 1989). This makes CHO cells a desirable host for
recombinant therapeutic protein production.
Table 1.1- Examples of products obtained from animal cells.
Protein Cell line Reference
Tissue-plasminogen activator* CHO* Lubiniecki eta!., 1989; Spellman et a!.,l989
Mouse L Browne eta!., 1985
Erythropoietin* CHO* Takeuchi eta!., 1988
Interleukin-2 CHO Conradt et a!., 1989
Mouse T Yamada eta!., 1987
Human growth hormone* C127* Pavlakis and Hamer, 1983
CHO Friedman eta!., 1989
Factor Vifi CHO Kaufman eta!., 1988
BHK21 Pavirani eta!., 1987
Hepatitis B surface antigen CHO Michel eta!., 1985
Interferon-B C127 Zinn eta!., 1982
CHO McCormick eta!., 1984; Kagawa eta!., 1988
Interferon-y CHO Scahill eta!., 1983; Hayter eta!., 1991
Antithrombin ifi CHO Zettlemeissi eta!., 1987
Monoclonal antibodies Mouse hybridomas PMA report, 1988
Recombinant antibodies CR0, Rhodes, 1989
mouse myeloma
Factor IX BHK Busby eta!., 1985
* cited in Birch (1991) as already in therapeutic use. CHO= Chinese hamster ovary cells;
BHK21= Baby hamster kidney cells; C127= mouse mammary cells.
21

Pharmacologically active proteins for application in diagnosis and therapy are of special
interest and therapeutic products from animal cells are expected to make an increasing
commercial impact in the next five years (KJausner, 1993). Approximately 150 recombinant
proteins are at the present at some stage of clinical development (Table 1.2) and among them it
is estimated that about 100 represent novel substances, with no precedents in medical therapy
(Drews, 1993). It is anticipated that 30-40 products from this group will be successfully
marketed over the next 5-6 years.
Table 1.2- Recombinant products in clinical development.
Protein Number Selected Indications
Growth factors
e.g. TNF, CSF, EPO,
FGF, PDGF
Hormones
e.g. insulin, IGF, relaxin
Interferons
Interleukins
Fibrinolytics
e.g. tPA
Vaccines
Recombinant proteins
Recombinant live vaccines
Recombinant monoclonal
antibodies
Soluble receptors
e.g. CD-4, IL-I-receptor
Others
e.g. Factor VIII, DNase
Total
27
Cancer, anemia, wound-healing, viral and bacterial
infections, bone marrow transplantation
13
Diabetes, growth disorders, osteoporosis
11 Cancer, viral infections
19 Cancer
14 Cardiovascular diseases
28 Hepatitis B, AIDS, malaria, pertussis, typhus,
influenza
22
6
11
Cancer, infections, inflammation
2
Inflammation, HIV-infection
18
Enzyme deficiencies
143
Source: Pharmaprojects Data Base, February, 1993 (after Drews, 1993).
22

It is evident that the role of mammalian cell culture in the production of therapeutic proteins
has significantly increased over the last years, and still other uses may be found in the future.
1.2- Cultivation systems for animal cells
The growth of animal cells, in contrast with microbial cells, is restricted to a narrow range of
environmental conditions. These will determine the growth rate and maximum cell density that
may be achieved, affecting the product yields obtained in the final culture medium. An
appropriate cultivation system should provide cells with a suitable physical environment, but
the choice requires an understanding of the cell growth characteristics and cell behaviour
towards the surrounding environment. Together with the medium composition, environmental
parameters such as dissolved oxygen, hydrodynamic forces, pH and temperature are among the
most important factors to consider when designing a cultivation system for mammalian cells.
Most of the effects on the growth and productivity of the cells are the result of complex
interactions between those factors.
1.2.1- Kinetics of growth and product formation
The growth of animal cells in suspension culture follows a similar profile to that observed for
most microorganisms. Distinct growth phases can be identified. During an initial stage, known
as the lag phase, cells adapt to the fresh medium. After that, they begin an exponential growth
phase, increasing in population with a typical doubling time of 18 to 24 hours. In a batch
culture, the exponential growth is usually followed by a transition stage and subsequently cells
reach a stationary phase, which is characterized by some kind of growth limitation, such as
nutrient limitation, product inhibition or accumulation of toxic products.
Several parameters, such as medium composition and environmental parameters affect the cell
23

growth and productivity in culture. These are discussed in the following sections. The kinetics
of cell growth, nutrient consumption and product formation in a batch culture are usually
described mathematically as:
M X (1.1)
dt
where,
x = cell concentration= cell specific growth rate
(1.2)dt Ys
where,
S = nutrient concentration
Ys = cell yield based on substrate
ms = maintenance coefficient
=qp . X (1.3)
dt
where,
p = product concentration
qp = specific productivity
The main objective in an animal cell culture is usually to obtain a biologically active product
secreted by the cells. The production can either be growth associated, non growth associated or
both. if the product is growth associated, the exponential growth phase of the culture should be
extended. If the product is non growth associated, it is desirable to maintain the population in
the stationary phase. When it is irrelevant if the cells are growing or not, it is desirable to
achieve high-density cell growth and then maintain the cell density for as long as possible.
This will therefore influence the choice of both cultivation method and medium design.
24
1.2.2- Cultivation techniques
Animal cells can generally be classified according to their anchorage dependence. This is the
first factor to consider for the design of a culture system. While anchorage-dependent cells
need a surface to attach in order to grow, anchorage-independent cells can grow fully
submerged in suspension culture. Most of the continuous cell lines (e.g. CHO, BHK21,
hybridomas, myelomas) can be grown in suspension while most 'normal' cells, such as
fibroblasts and some continuous cell lines, e.g. mouse C127, are anchorage dependent; a third
group can either grow in suspension or attached to a surface, e.g. CHO and HeLa cells, which
includes transformed cells derived from anchorage-dependent cell types (Hu and Dodge, 1985;
Birch, 1991).
The subject of animal cell bioreactor technology has been extensively examined (Hu and
Dodge, 1985; Adamson and Schmidli, 1986; Prokop and Rosenberg, 1989; Leist et al., 1990).
Non-anchorage dependent cells can be grown in suspension, either floating free or
immobilised in appropriate systems, e.g., microcarriers; anchorage dependent cells have to be
attached to a surface. Suspension cultures are usually preferred. Homogeneity of the culture,
reproducible and defmed culture conditions, simplicity of scale-up, reliable on-line analysis
and process control are listed as the most important features accomplished by using suspension
cultures. At the laboratory scale, suspension cultures can be performed in shaker flasks and
spinner flasks. Anchorage-dependent cells are usually cultured in T-flasks and roller bottles.
For scaling-up of suspension cultures stirred or air-lift bioreactors are normally used (Rhodes
and Birch, 1988; Lubiniecki et al., 1989; Rhodes, 1989; Merchuk, 1990). More recent culture
systems are based on the continuous passage of fresh medium through a bioreactor in which
the cells are immobilised, known as perfusion cultures. These include hollow-fiber (Tharakan
and Chau, 1986; Piret and Cooney, 1990) and porous microcarriers (Looby and Griffiths,
1990) bioreactors. The latter technology can be used in stirred tank bioreactors, and is applied
25

to both anchorage dependent and non-anchorage dependent cells (Fammiletti and Fredericks,
1988; Nilsson eta!., 1988; Smiley eta!., 1989; Schmidt eta!, 1992).
Stirred-tank reactors and air-lift reactors still remain the more widely used, due to the
homogeneous environment they provide, their suitability to scale-up and process control and
because substantial knowledge from traditional microbial fermentation literature is available.
Different operation modes can be utilised for the cultivation of animal cells, which are
generally classified as batch, fed-batch, continuous or perfusion cultures. Examples of use of
each technique for the production of several biologicals are presented in Table 1.3. Each mode
has its own advantages and the use of systems other than a batch culture is an attempt to
overcome some of the limitations of that one.
In a batch system no medium components are added and no waste products are removed, and
growth becomes limited either by nutrient limitation or inhibitory products accumulation. In a
fed-batch culture essential nutrients, or even a certain percentage of the whole growth medium,
are continuously or intermittently fed into the culture, in order to extend cell growth and/or
production phase. Metabolic products are not removed, which may then become the limiting
growth factor. In order to efficiently design a fed-batch process, the requirements of the
specific cell line must be known and such a system can be very useful when dealing with
nutrients which are utilised according to their availability in the culture medium, such as
glucose and glutamine (see also section 1.3.2.1). In continuous culture there is a constant feed
and harvesting rate of the culture medium, and once a steady-state is attained, the culture can
be maintained at a constant cell density and product yield for long periods. In a perfusion
system the cells are physically retained in the bioreactor and there is a constant addition of
fresh medium and removal of spent medium. Although higher cell density can be attained,
these systems are more complex than the conventional stirred tank and air-lift bioreactors,
require large supplies of medium and usually the culture is not homogeneous. Furthermore,
26

this technique becomes inefficient if producing recombinant products that are growth
associated, as the immobilised cells inside the reactor are not in the growth phase.
Table 1.3- Examples of recombinant protein production by different cultivation techniques.
Operation method Product Reference
Batch Interferons Phillips eta!., 1985
t-PA Rhodes and Birch, 1988
Recombinant antibodies Rhodes, 1989
Lymphokines Shaughnessy and Kargi, 1990
Interferon-y Hayter eta!., 1991a
Fed-batch Monoclonal antibodies Reuveny eta!., 1986; Luan eta!., 1987;
Miller et al., 1988; Rhodes and Birch, 1988
*Interferon.y Smiley eta!., 1989
Human IL-2 Lucki-Lang and Wagner, 1991
Continuous Monoclonal antibodies Ray eta!., 1989; Merten eta!., 1993
Lymphokines Shaughnessy and Kargi, 1990
Interferon-y Hayter eta!., 1992
Perfusion t-PA Rhodes and Birch, 1988; Lin eta!., 1993
rscu-PA Avgerinos eta!., 1990
Monoclonal antibodies BUntemeyer eta!., 1991
Human IL-2 Wagner eta!., 1989
Factor VIII Boedeker et a!., 1993
* indicates fed-batch in relation to the whole growth medium
Although the environment of the cells in a batch or fed-batch culture is continuously changing,
these processes have several advantages in terms of large-scale production, namely flexibility,
simplicity of plant and operation, clarity of batch definition for quality assurance and safety by
reducing the quantity of product at risk (Rhodes and Birch, 1988).
27

1.2.3- Hydrodynamic environment of the cells
1.2.3.1- Aeration and agitation
Oxygen is the terminal electron receptor in oxidative phosphorylation, being essential for
energy generation. Supplying sufficient oxygen to the culture to allow cell growth and product
biosynthesis is one of the design criteria for a bioreactor. For this, it is important to know the
optimum oxygen level that should be provided. Fleischaker and Sinskey (1981) have compiled
specific rates of oxygen uptake of several cultured cells. Below the critical dissolved oxygen
tension, consumption is limited by oxygen availability (Lin and Miller, 1992) and above the
critical oxygen tension varies with the glucose consumption rate (Frame and Hu, 1985; Miller
et a!., 1989a). Each cell type seems to have an optimum range of dissolved oxygen partial
pressures for growth. CHO cells cultured under low oxygen concentrations (Kurano et a!.,
1 990a) had a specific growth rate half of its normal value, but cell growth and metabolism was
found to be approximately constant between 50-100% air saturation. The studies conducted by
Kilburn and Webb (1968) with mouse L cells have demonstrated the growth inhibitory effects
of high oxygen levels and cultivation of cells out of the optimum range, either at lower or
higher oxygen levels, limits their growth (Kilbum et a!., 1969). The production of oxygen-
derived free radicals, which can damage cellular components such as lipids, DNA and proteins,
may account for the toxic effect of oxygen (Lin and Miller, 1992). In fact, non-lethal levels of
oxygen or H2O2 exposures may decrease the specific rate of production of t-PA by CHO cells
by at least 50% (Lin et a!., 1993). They have also found that while CHO cell growth rate, cell
titre and t-PA production rate were not affected by mild hypoxic conditions (50% reduction in
specific oxygen consumption rate), the exposure of cells to anoxia led to a drastic decrease in
cell titre and t-PA production rate.
Unlike other nutrients, oxygen has relatively low solubility in aqueous media, approximately
28
0.2 mmolll at 37°C, and so it would be rapidly depleted from a high density cell culture, if not
continuously replaced. Both agitation and aeration are required to maintain an adequate mixing
of the culture and to provide enough oxygen to the cells. However, these are also the main
sources of hydrodynamic shear stress in bioreactors and the mechanical-fluid forces generated
may be of a magnitude that causes damage to the cells. Shear sensitivity has long been
reported to vary between cell lines (Augenstein et a!., 1971) and culture parameters, such as
agitation history of the cells, concentration of specific metabolites and cell growth phase
(Petersen et a!., 1990; Ozturk and Palsson, 1991), with cells becoming more susceptible to
shear in the stationary growth phase. A dependence of shear sensitivity on nutrient limitation,
preventing maintenance of the structural integrity of the cell, has been suggested (Petersen et
at., 1990). When considering the scale-up of cell culture processes, this parameter may become
critical.
In shaker-flask cultures, agitation is simply provided by placing them in shaker incubators. In
larger scale cultures, agitation is usually provided by mechanical means, e.g. impellers,
paddles, coiled stiners, or in the case of air-lift bioreactors, the contents are pneumatically
agitated by a stream of air (see Leist et a!., 1990). An important source of fluid shear in
bioreactors is the agitation of the culture by such mechanical devices (Dodge and Hu, 1986;
Peterson et a!., 1990). According to Bliem and Katinger (1988), the cell tolerance rates for
agitation fall in the range of 100-200 revolutions per minute for industrial reactors (500-5000 1
batch reactors). However, Kurano et a!. (1990a) cultured CHO cells in small scale bioreactors
at 400 rpm; adverse effects on specific cell growth rate were only noticed at 600 rpm. Kunas
and Papoutsakis (1990) also reported that in a bubble vortex-free stirred tank bioreactor, the
growth of hybridoma cells was not affected at 600 rpm agitation speed, concluding that cell
damage in stirred and sparged bioreactors is mainly caused by the presence of bubbles.
As the agitation rate used is usually low to prevent damage of the cells, the low degree of fluid
29
mixing in the gas-liquid interface does not promote good oxygen transfer and as the ratio
volume/surface increases head-space aeration becomes insufficient to supply the required
oxygen. Several techniques have been developed to provide oxygen to cell cultures, e.g. use of
surface aerators, air sparging (Aunins et al., 1986; Hu et a!., 1986; Prokop and Rosenberg,
1989). Air sparging provides good oxygen transfer, but excessive foaming and cell damage
due to the shear force caused by rising air bubbles and bubble break-up have been reported
(Handa-Corrigan eta!., 1989; Gardner eta!., 1990; Kunas and Papoutsakis, 1990; Papoutsakis,
1991b; Zhang et a!., 1992b). Sparged systems are usually used for the culturing cell lines
which are more robust, such as BHK 21, Namalva, some CHO lines and several hybridomas,
whereas microcarrier-based cultures and other cell lines seem to be predominately affected by
direct bubble sparging (Bliem and Katinger, 1988). A compromise between minimum physical
damage to the cells and maximum oxygen transfer from the gas phase to liquid medium has to
be established for each culture system.
1.2.3.2- Additives for cell protection from fluid-mechanical damage
Several additives have been reported as "shear protectants" from agitation and aeration in
animal cell cultures. Among them are serum, bovine serum albumin, carbohydrate polymers
and pluronic alcohols. A list with several examples where this protective effect was involved is
shown in Table 1.4. Papoutsakis (1991a) has recently reviewed this area.
Serum and albumin have been shown to allow better cell growth in agitated and/or aerated
cultures, and mostly the effects reported are dose-dependent. Although serum has an important
nutritional role (see section 1.3.1) there are clear indications that this effect is not only due to
faster cell growth caused by higher serum concentrations. The effect seems to be mainly
related to modifications in the bubble-burst characteristics (physical effect) (Handa-Corrigan et
a!., 1989; Michaels et a!., 1991; Smith and Greenfield, 1992), although evidences for a
30
biological mechanism, resulting from metabolic interactions rendering the cells more resistant
to shear were also reported (Michaels et a!., 1991; Smith and Greenfield, 1992). Leist et a!.
(1990) postulated that a biological/biochemical effect, probably due to serum proteins, is the
basis for the protection mechanism. Ramirez and Mutharasan (1991) partially attributed the
protective effect of serum to its property of decreasing the plasma membrane fluidity through
the transfer of cholesterol from lipoproteins to the plasma membrane. BSA seems to exert a
physical protective effect in nature (HUlscher and Onken, 1988; Smith and Greenfield, 1992),
by a mechanism similar to that proposed by Handa-Corrigan et a!. (1989) for Pluronic F68,
although a limited biological interaction has also been suggested (Smith and Greenfield,
1992).
Table 1.4- Protection of freely suspended animal cells from agitation and aeration damage.
Additive
Cell line
Reference
Serum Hybridomas Kunas and Papoutsakis, 1990; Handa-Corrigan eta!., 1989
Ramirez and Mutharasan, 1990; Ozturk and Palsson, 1991;
Michaels eta!., 1991; Smith and Greenfield, 1992
Human melanoma Leist et a!., 1986
BHK-21 Handa-Corrigan et a!., 1989
BSA Hybridomas HUlscher and Onken, 1988; Takazawa eta!., 1988;
Smith and Greenfield, 1992
Pluronic F68 Mouse IS Kilburn and Webb, 1968
BHK-21 Handa-Corrigan eta!., 1989
Hybridomas Gardner eta!., 1990; Ramirez and Mutharasan, 1990;
Michaels eta!., 1991; Smith and Greenfield, 1992;
Zhang eta!., 1992a,b; Lakhotia eta!., 1993
Insect cells Maiorella et a!., 1988; Murhammer and Goochee, 1988
PEG
Hybridomas
Michaels eta!., 1991
CMC
Human melanoma Leist eta!., 1986
BSA- bovine serum albumin; PEG- polyethylene glycol; CMC-carboxymethylcellulose.
31

The elimination of serum and even proteins from the culture media may significantly affect the
susceptibility of animal cells to damage caused by adverse hydrodynamic conditions. The
increasing tendency to develop these types of culture and the increasing need for large scale
productions led to the search of additives to protect cells from shear damage in bioreactors.
The nonionic surfactant Pluronic F68 has been the polymer most widely used as it protects
cells against damage in mixed, agitated and/or aerated cultures. The mechanism through which
Pluronics prevent cell damage is not clear yet and opinions diverge. These additives are known
to lower the interfacial tension and/or stabilise the formed foams and gas-liquid interfaces. The
protective effect of Pluronic F68 in fermenter cultures has been attributed to the surface active
properties of the molecule, by changing the properties of the gas-liquid interfaces (bubbles)
and stabilising surface foams (Handa-Corrigan et a!, 1989; Zhang et at., 1992b). Murhammer
and Goochee (1988) proposed that Pluronic F68 incorporates in the cell membrane and
stabilises it, contributing to its protective effect in fermenter cultures. Ramirez and Mutharasan
(1990) also suggested that the presence of a semi-stagnant film at the cell surface of
hybridomas decreases the apparent fluidity of the cell membrane and leads to the formation of
more shear resistant cells, providing evidence that Pluronic F68 alters the cell plasma
membrane. This is supported by the work of Zhang et al. (1992a), which demonstrated that
Pluronic F68 increases the strength of cell membranes. The latter effect was attributed to the
adsorption of Pluronic to the cell membranes, and it was postulated to partially account for its
protective effects in sparged, agitated bioreactors. In fact, a cumulative protection mechanism,
based on the models mentioned above, has been proposed by Zhang et a!. (1992b). Although
Pluronic F68 is postulated to interact with the cell membrane, the work of Michaels et at.
(1991) has indicated that these possible interactions do not affect the shear sensitivity of the
cells, and that the effect is solely physical, i.e., resulting from hydrodynamic changes in the
culture environment; the same was found for polyethylene glycol. It is possible that the effect
depends on the cell line and culture conditions. Along with these reports, Pluronic F68 has
also been shown to affect cell growth independently of shear damaging conditions, e.g., in
32
static cultures (Mizhari, 1975; Bentley eta!., 1989).
While much effort has been dedicated to the characterisation of the fluid-mechanical forces
that cause damage to freely suspended cells, less work has been done on their actual effect on
cell physiology. Recently, Lakhotia et a!. (1993) have reported a reduction in the content of
specific surface proteins of the cells, CD13 and CD33, caused by an increase in agitation rate
from 80 to 400 rpm with a simultaneous detrimental effect on cell growth. However, even at
mechanical forces of a magnitude that did not cause any apparent cell damage (270 rpm), a
reduction in the content of the same proteins was still observed. Pluronic F68 was shown to
have a protective effect on the CD33 content per cell of cultures subjected to hydrodynamic
stress but not on the content of CD13. It was suggested that the protective effect of Pluronic
F68 is surface protein specific.
1.2.4- Temperature and pH
Temperature and pH are important extracellular parameters in culture. Animal cells are
routinely grown at a temperature of 37°C but they can grow over a fairly wide range of
temperatures, which allows the isolation of temperature sensitive mutants. Temperatures
ranging from 34 to 40°C have been shown to allow the growth of CHO cells (Gottesman,
1985), and an optimum of 37°C has been reported (Kurano et a!., 1990a). Different cell lines
have different pH optimum values for growth and production. CHO cells have been reported to
grow from pH 7.0 to pH 8.2 in static cultures, but outside that range cells would not grow well
(Gottesman, 1985). CHO cell growth in agitated cultures was shown to be limited to a more
narrow range, pH 7.0 to pH 7.9 (Kurano et a!., 1990a), which was suggested to be related to an
increase in shear sensitivity under agitation. Optimum culture pH was reported to be between
7.6-7.8 (Gottesman, 1985; Kurano et al., 1990a), but reported values for CHO cell cultures
vary between 7.0 and 7.2 (Conradt eta!., 1989; Curling et a!., 1990).
33

1.3- Cell nutritional environment- the culture medium
The cell culture medium must provide the nutrients required by mammalian cells for the
synthesis of cell biomass and products, and the additional function of maintaining suitable
physiochemical conditions. This medium is far more complex and expensive than culture
medium for microbial cells, based on an osmotically balanced mixture of vitamins, minerals
and amino acids, often supplemented with animal serum and/or proteins. Quantitative studies
on the effect of medium components on cell growth and product formation are essential for
process development, as they vary widely with cell lines, culture systems and culture
conditions. A good quantitative understanding of the nutrient requirements of the cell line to
use is an important step for process optimisation.
1.3.1- Development of serum-free medium
Traditionally, supplementation of the culture medium with serum had been required to support
long-term cultivation of animal cells. The present trend in industry is to move towards more
well-defined and simpler culture medium and during the past decade there was a significant
shift towards the development of serum-free media. The inclusion of serum is not only
expensive but also introduces much variability to media formulations due to its own
complexity and undefined nature. Thus, serum also represents a potential source of
contamination and a potential carrier of growth and/or production inhibitors. Downstream
processing in large scale operations is also impaired by the use of serum (Jager, 1991).
Although only a few of the components existent in serum are growth promoting, it has an
important nutritional role in the culture media. Barnes (1987) reviewed the serum components
considered to be potentially active on cultured animal cells. These include nutrients, such as
vitamins, amino acids, lipoproteins and fatty acids, hormones and growth factors for the
stimulation of growth and metabolism, binding proteins for lipids and small compounds, such
34
as albumin and transferrin, attachment factors and also enzymes. Furthermore, serum proteins
also seem to play an important role in providing physical protection to the cells against shear
damage (see section 1.2.3.2) and serum-free media that support cell growth in shake-flask
cultures may not be efficient in large scale fermenters, where cells are more exposed to
mechanical stresses.
The development of serum-free media has not always been straightforward, mainly due to
difficulties in isolating the growth promoting factors which are present in the serum and
because each cell type has specific requirements. When growing cells in serum-free medium,
several of its functions have to be replaced by supplementation with components able to
perform them. The developments in the understanding of cell nutritional requirements have
made possible the growth of many cell types in the complete absence of serum (Barnes and
Sato, 1980; Barnes, 1987). Serum-free medium for hybridomas has been often reported
(Murakami et a!., 1982; McHugh et a!., 1983; Glassy et a!., 1988; Takazawa et a!., 1988,
Minamoto et a!., 1991). Cell lines usually used for the expression of recombinant protein, such
as CHO cells (Hamilton and Ham, 1977; Gasser et a!., 1985; Hayter et a!., 1989; Ganne and
Mignot, 1991; Ogata et a!., 1993), have been grown in serum-free medium.
Although several advantages arise from culturing cells in serum-free media, its apparent cost
if supplemented with hormones and growth factors may become higher than serum
supplemented media. However, serum-free media with low protein supplementation usually
becomes more cost effective and does allow more efficient large scale operation for the
production of biological products.
35
1.3.2- Cell requirements in serum-free medium
1.3.2.1- Energy sources
Glucose and glutamine are typically the main energy and carbon sources for most of the
culture media. Glucose is usually included in the medium at a concentration of 5 to 20 mM
and glutamine at a concentration varying from 0.7 to 5 mM. Figure 1.1 shows the major
metabolic pathways of animal cells. The operation of particular metabolic pathways is
dependent on the cell line and on the culture conditions (Eigenbrodt et a!., 1985; Mckeehan,
1986). Glucose is metabolised to pyruvate and lactate through the glycolytic pathway to
produce energy (Eagle et al., 1958). Although glycolysis can supply cells with much of their
energy requirements, its major role has been reported as the provision of anabolic substrates
for biosynthesis (Hume et al., 1978, Wice et a!., 1981); it is a major source of carbon,
providing ribose for nucleic acid synthesis (Zielke eta!., 1976, 1978). Glutamine is usually the
most abundant amino acid in cell culture media, being typically metabolised to glutamate and
ammonia (McKeehan, 1986). Its metabolism leads to different levels of energy production,
depending on whether it is completely oxidised to CO2, or incompletely oxidised to either
aspartate and lactate (Reitzer et a!., 1979). It is the major amino group donor for the synthesis
of purines and pyrimidines, amino sugars, pyridine nucleotides and asparagine (McKeehan,
1986). It can additionally be involved in the synthesis of lipids (Zetterberg and Engstrom,
1981). Despite this, a high flux rate of glutamine carbons to pyruvate through glutaminolysis
may not be essential for cell proliferation (McKeehan, 1986).
36

Glucose Biosynthesis
NADH +
NADH(YCOLYS
ADH I tAlP -_ 'SI'—, _
Serine Glycine
NAD NADHt
Amino ACidS
Pynivate Acetyl CoALactate Glu
Biosyn11sis/7Atarñne
NAD(P)
Gln
NAD NAD
TCA
Glu
NADHI t .dminoacid
NAD / I
NHi4r_Ja-ketoacid
ADP
Glutamate
OxidativeNAD + HOI-1
NH1.
qRNI2 Phosphorylation
R.X ATP
GlutainaneCarboxylic acid
Figure 1.1- Diagram of the major metabolic pathways of animal cells (derived from Miller eta!.,
1989a).
37

Glucose and glutamine metabolism are complementary to the production of other metabolites
(Zielke et a!., 1978). The relative amounts of energy provided to the cells by glucose and
glutamine vary according to the cell line, If both nutrients are present in the culture medium,
glutamine oxidation can contribute up to 30 to 50% of the cell energy requirements (Zielke et
al., 1984). Even at high glucose concentrations, it has been stated that glycolysis can only
supply 50% of the cell energy requirements, glutamine oxidation contributing 40% and
pyruvate and fatty acid oxidation 10% (Eigenbrodt et a!., 1985). In the wild-type ovary cell
line, in the presence of glucose, about 40% of the energy is supplied by glutamine (Donnelly
and Scheffler, 1976). Despite this, cells can rely on the energy produced either by glycolysis, if
glutamine is limited, or by glutaminolysis, if carbohydrates are limited, and it was suggested
that flux through neither pathways is compulsory for cell growth (Eigenbrodt eta!., 1985).
The availability of glucose can reduce the rate of glutamine utilisation by mammalian cells
(Zielke et a!., 1978, Reitzer et a!., 1979, Lazo, 1981) and a decrease in glucose concentration
has been shown to increase glutamine oxidation rates (Zielke et a!., 1984). However, additions
of either glucose and glutamine to culture medium has been shown to increase the rates of
utilisation of both nutrients (Glacken et a!., 1986; Miller eta!., 1989a,b; Hayter et al., 1991a),
decreasing the nutrient utilisation efficiency. It is important to consider this type of relations
when designing a culture medium, in terms of providing glutamine and glucose.
Cells are able to grow in media containing other types of carbohydrates, such as fructose or
galactose, as first shown by Eagle (1958). The substitution of glucose by fructose, galactose or
maltose has been achieved by others, who reported a decrease in the glycolytic rate under those
conditions (Reitzer et a!., 1979; Imamura et al., 1982, Nahapetian et a!., 1986). However, an
increase in glutamine oxidation rate (Zielke et a!., 1984) also results from this metabolism.
Mannose, fructose and galactose have been reported to support the growth of some
recombinant CHO cell lines (Morgan and Faik, 1986).
38
1.3.2.2- Amino acids
Amino acids essentially act as precursors in the biosynthesis of proteins. They may also serve
as an energy source, through oxidation to acetyl-CoA and tricarboxylic acid (TCA) cycle
intermediates. Eagle, working with a mouse fibroblast and a human carcinoma cell line,
reported the requirement of at least 13 amino acids for animal cell growth (Eagle, 1955a,b,
1959). These amino acids included arginine, cystine, glutamine, histidine, isoleucine, lysine,
methionine, phenylalanine, threonine, tryptophan, tyrosine and valine and are most of the
times considered essential for normal and established cell lines.
It was realised early that amino acid utilisation varies considerably with cell line. A high
requirement of serine, glycine and proline was reported for normal human pituitary cells in the
early 1960's (McCarthy, 1962). Culture medium must be designed in order to accommodate
the needs of individual cell lines. As typical examples, the branched amino acids leucine,
isoleucine and valine are consumed at high rates by some cell lines, namely Madin-Darby
canine kidney (MDCK) cells (Butler and Thilly, 1982), human fibroblasts (Lambert and Pirt,
1975), hybndomas (Duval Ct a!., 1991) and CHO cells (Hayter et a!., 1991a). CHO cells are
proline auxotrophs, requiring the presence of this amino acid in the culture medium (Kao and
Puck, 1967), while it is produced in culture by myeloma cells (Ljunggren and Haggström,
1992).
There is a strong interrelation between the metabolic pathways shown in Figure 1.1. Amino
acid quantification in culture supernatants is a straightforward means of determining the
metabolic requirements and status of the cells. Specific amino acid utilisation depends on the
availability of the major energy sources in culture, e.g., specific consumption of leucme,
isoleucine, valine and serine was shown to be higher at lower glutamine concentrations (Miller
et a!., 1989b). The production of amino acids, e.g., alanine, glycine and glutamate by some
39
cell lines has been reported (Butler and Thilly, 1982; Lanks, 1987; Miller et a!., 1989a,b,
Duval et al., 1991; Hayter eta!., 1991a). Alanine accumulation may reflect the transamination
of glutamate to pyruvate and its production rate seem to be regulated by both glucose and
glutamine consumption rates (Miller et al., 1989a,b). Glycine and glutamate are a reflection of
serine and glutamine metabolism, respectively.
Lately, more attention has been given to the concentration of amino acids in serum-free
cultures and its importance for growth and production in animal cell cultures should be
recognised for the development of any process. Due to the metabolic complexity between
medium components, it is not possible to look at each component separately. Furthermore, no
general rules can be made, as the amino acid metabolism varies between cell lines and even
with the fermentation mode for the same cell line (BUntemeyer eta!., 1991).
1.3.2.3- Lipids
Incorporated lipids are important for animal cells as a source of energy and as structural
components of membranes (King and Spector, 1981). The fatty acid composition of animal
cells, both cellular storage lipids and membrane phospholipids, resembles the lipid
composition of the culture medium and thus cell function is affected by changes in the medium
lipid content (Doi et a!., 1978). The majority of cells can synthesise de novo cholesterol and
most of the fatty acids they require from acetylcoenzyme-A. When the culture medium has an
adequate supply of lipids de novo synthesis is inhibited and when cells are exposed to an
excess of lipids, they accumulate excessive triglycerides and cholesterol esters in the form of
cytoplasmic inclusions (Schmid, 1991). Linoleic and linolenic acid families can not be
synthesised de novo by animal tissues; linoleic acid is essential for animals from a nutritional
point of view (King and Spector, 1981) but whether the same is true for animal cells in culture
is not clear yet.
40

Lipids are included in most serum-free and/or protein-free medium formulations (Barnes and
Sato, 1980; Glassy et a!., 1988) and several lipids, e.g. cholesterol, oleic acid, linoleic acid and
certain phospholipids, have been shown to stimulate the growth of several cell lines (Darfier
and Insel, 1982; Kovar and Franek, 1986; Sato et a!., 1987; Minamoto et a!., 1991; Jayme,
1991). Serum and serum albumin are major sources of lipids in the culture medium and when
using serum-free and protein-free media they can be supplemented to the medium in the form
of isolated plasma lipoprotein fractions, free fatty acids complexed to serum albumin or fatty
acid/phospholipid microemulsions (Schmid et a!., 1991). Pluronic F68 has also been used as
an emulsifying agent (Jayme, 1991).
Quantitative data available on the subject is scarce (Schmid eta!., 1991) and although analysis
of total fatty acids was shown to be an unreliable indicator of cell culture performance,
individual quantitative analysis has allowed the identification of critical lipids for certain cell
culture applications (Jayme, 1991). Most of the studies on the influence of lipids on culture
performance focus on cell growth and production data are most of the times unavailable.
1.3.2.4- Vitamins and minerals
Addition of vitamins and trace elements is common practise in serum-free cultures. Several
forms of water-soluble vitamins (vitamin B complex), such as riboflavin and thiamine, were
found to be essential for the growth of some cell lines, e.g. mouse L and HeLa cells (Eagle,
1955c). Supplementation of vitamins to most media is mostly made based on those early
nutritional studies and not much work has been done lately on the consumption of vitamins by
cultured cells. Biotin, choline, folic acid, inositol, niacinamide, pantothenic acid, pyridoxine,
riboflavine and thiamine are present in almost all basal media formulations. The lipid-soluble
vitamins, A, D, E and K, are required by higher animal species, but they are not normally used
in culture media. A more recent study on the consumption and stability of four vitamins,
41
ascorbic acid, nicotinamide, choline and thiamine (Kurano et a!., 1990c) in CHO cell culture
has shown that while nicotinamide and choline were stable in culture medium, ascorbic acid
and thiamine were not. Furthermore, ascorbic acid did not appear to be required for the growth
of the CHO lines but growth limitation by choline at high cell densities was suggested.
At least 15 trace elements have been reported as essential or beneficial for the growth of
several cell lines (Nielsen, 1981). Among these are copper, iron, manganese, selenium and
zinc. Knowing the specific cell requirements for these nutrients is very important when using
serum-free medium and specific supplementations have been developed according to the cell
line. Some inorganic ions are essential for cell growth, as reported by Eagle (1955c): sodium,
potassium, calcium, magnesium, chloride and phosphate and they are all present in basal
media formulations.
1.3.2.5- Protein supplementation
The proteins insulin, transferrin and bovine serum albumin are usually included in most
serum-free media formulations (Barnes and Sato, 1980; Glassy eta!., 1988), in order to replace
some of serum functions. The function of the latter ones is mainly related to their binding
capacities of several components, e.g., lipids (albumin) and trace elements (transferrin).
Insulin and transferrin are usually included in the medium at low concentration, Ca. 5 pg/mI.
Insulin is a peptide hormone known to control the metabolic activities of cells and affects cell
proliferation. However, the reasons for its stimulatory effect are still unknown. Although
extensively used in most serum free media formulations it has been shown that is not strictly
required (Kovar and Franek, 1984) and complete deletion of insulin from serum-free medium
has been reported (Schneider, 1989; Fike et a!., 1991). Transferrin is an iron-binding serum
protein, and it acts via specific receptors on the cell surface (Aisen and Listowsky, 1980),
42

exerting a stimulatory effect on cell proliferation. Most cell lines under serum-free conditions
require its presence to proliferate (Iscove and Melchers, 1978; Murakami et al., 1982; Kovar
and Franek, 1984). However, the concept that transferrin would never be replaced in the
medium seems less likely as the replacement of transferrin by others sources of iron such as
e.g., ferric citrate (Kovar and Franek, 1987; Scheneider, 1989) and iron gluconate (Minamoto
et al., 1991) has been reported.
Unlike insulin and transferrin, BSA is usually included in the medium at relatively high
concentration, 1-5 mg/mi. BSA may serve as a carrier for metals, lipids and hormones (Barnes
and Sato 1980; Iscove eta!., 1980) and it has been shown to strongly inhibit copper-stimulated
peroxidation and generation of free hydroxyl radicals from systems containing copper and
H202, preventing toxicity by oxidation of unsaturated fatty acids in the membranes (Daffier
and Insel, 1983; Halliwell, 1988). It may also provide the cells with protection from shear
damage (see section 1.2.3.2). It is most likely that its stimulating properties are due to the
effects of unidentified molecules bound to it. Because BSA is derived from a somewhat raw
material, bovine plasma and serum, even the purified fraction will reflect some of this natural
variability. It is thus a component that may be a major source of variability in cell culture
media.
There are several advantages in removing proteins from the culture media and efforts towards
the development of protein-free medium are being made. In fact, the lower the level of
exogenous proteins in the crude product the easier the downstream processing process. Also,
these proteins may represent a possible source of contamination. Complete replacement of
those proteins is not however a very easy task and protein-free medium is not necessarily more
cost effective, specially if it is supplemented with hormones and lipid precursors. Each
production system will always have to be analysed individually, as there is a clear dependence
on the cell line and culture method. Successful protein-free media for the production of
43
monoclonal antibodies by hybridomas have been reported by Kovar and Franek (1987),
Schneider (1989), Darfier (1990) and Fike et a!. (1991). The former ones are quite complex
and use hormone supplements (hydrocortisone, oestradiol, progesterone) while the detailed
formulation for the latter one is only available for FDA purposes, but the authors do not refer
to any hormone supplementation. While Darfler (1990) mostly reported cell growth in static
cultures, the others included suspension cultures in their investigations, which is an important
consideration for the scaling-up of the process. Production of recombinant interleukin-2 by
suspension cultures of BHK 21 cells in a rather simple protein-free medium has also been
reported (Lucki-Lange and Wagner, 1991). Clonal growth of the parental CHO-KI in protein-
free medium has been long achieved by Hamilton and Ham (1977), but suspension cultures
would most likely behave differently. Furthermore, the level of contaminants existent in the
chemicals at that time would probably be a problem in reproducing the same conditions.
Substantial work is still required in order to routinely cultivate recombinant cells in totally
protein-free medium.
1.3.3- Toxicity in animal cell culture
Ammonia and lactate are the usually reported potential toxic compounds accumulated in
animal cell culture. As stated in section 1.3.2.1, ammonia mainly derives from the metabolism
of glutamine by glutaminase activity while lactic acid is a result of the catabolism of glucose
by anaerobic glycolysis.
The sensitivity of animal cells to ammonia and lactate varies considerably between cell lines.
Inhibition by those compounds can become one of the limitations for cell growth. In a batch
culture ammonia production levels usually reach 2 mM, which may be inhibitory to many
cells (Butler and Spier, 1984). Glacken et a!. (1986) have reported growth inhibition of MDCK
cells above 4 mM ammonia concentration. Lower inhibition levels, 2-2.5 mM, have been
44

found for some hybridoma cell lines (Reuveny et a!., 1986; Hassel et a!., 1991) while L-
mouse cells have been found to be inhibited by concentrations as low as 0.5 mM (Ryan and
Cardin, 1966). On the other hand, the accumulation of lactic acid in culture may exceed the
buffering capacity of the medium, leading to a decrease in the culture pH and to suboptimal
conditions for cell growth (Reuveny et a!., 1986) but usually no inhibition is found up to 25
mM lactate. Concentrations as high as 40 mM did not any effect on the growth of several
hybridoma cell lines (Hassel et al., 1991).
The sensitivity of CHO cells to lactate and ammonium was investigated by Schlaeger and
Schumpp (1989), who reported inhibition constants (50% growth inhibition) of 8-10 mM
ammonia and ca. 75 mM lactate. The work of Hayter et a!. (1991a) with CHO cells gave
support to the previously reported results, showing that cell growth is not inhibited by
ammonium concentration of 2 mM although inhibitory effects were seen at 4.5 mM, and cells
seemed to be relatively insensitive to lactate as concentrations of 17.5 mM were reported to
have little effect on cell growth. Kurano et a!. (1990b) also found that CHO cell growth was
not affected by lactate itself and an inhibition constant of about 7.5 mM was found for
ammonia.
An interactive effect between ammonia and lactate inhibition has been suggested by Hassel et
al. (1991). They found that at lower concentrations of lactate, the apparent toxicity of
ammonia decreased. Reuveny ef a!. (1986) also found that the addition of lactate to culture
medium stimulated the growth of some hybridomas. Ammonia inhibition was also reported to
be pH dependent (Doyle and Butler, 1990), e.g., as the culture pH was reduced from 7.8 to 6.8
the initial concentration of ammonium chloride causing 50% growth inhibition shifted from 4
mM to 7.6 mM.
Some strategies have been proposed to overcome the problem of ammonia and lactate
45

accumulation in culture medium, when they become the bottleneck of the process. The use of
slowly utilised carbohydrates results in less lactate production (Eagle et a!., 1958; Imamura et
a!., 1982). The glucose concentration in the medium is known to affect the lactate production:
the rate of glucose utilisation is higher at higher glucose concentrations (Zielke, 1978; Glacken
et a!., 1986; Miller et a!., 1989a; Hayter et al., 1991a), increasing the flux of glucose carbon
through glycolysis to lactic acid. The same rational is applied to glutamine utilisation and
consequent ammonia formation (Glacken et a!., 1986; Miller et a!., 1988; Hayter et a!.,
1991a). Controlled feeding of glucose and glutamine into the culture medium, in order to keep
their concentration within acceptable limits has been shown to be successful in reducing lactate
and ammonia production (Glacken et a!., 1986; Ljunggren and Haggstrom, 1990). The
accumulation of metabolic end products can be also limited by perfusion culture (Glacken et
a!., 1986; Glacken, 1988), but this may not be economically viable. Kurano et a!. (1990b)
cultured CHO cells in glutamine-free and asparagine supplemented medium, reducing
ammonia production by 40%. More recently, in-situ removal of ammonia through electrical
means has been reported (Chang et a!., 1993). It has also been reported that potassium ion can
be used as an ammonia detoxifying agent in murine myeloma cell cultures, by inhibition of
inward transport of ammonium ions (Martinelle and Haggstrom, 1993).
1.4- Production of glycoproteins
A great proportion of proteins produced by animal cell systems are proteins which have
oligosaccharide structures covalently attached to the polypeptide bone, which are known as
glycoproteins. These structures may have a marked effect on properties which are critical to
the protein therapeutic value and are known to be affected by the culture environment
(Goochee and Monica, 1990; Goochee et a!., 1991). The importance of analysing the product
in this respect throughout any production system is now well recognised. There are two
46

different types of glycosylation, N-glycosylation and 0-glycosylation, but here we will only
refer to the former.
1.4.1- Significance of glycosylation
Glycosylation is one of the several post-translational modifications of human proteins. It may
have a major role on the biological properties of a protein, often dictating its therapeutic value.
Biological properties, such as plasma clearance rate, antigenicity, immunogenicity, specific
activity, solubility and resistance to proteolytic attack, may all be affected by the
oligosaccharide structures of a glycoprotein (Goochee et a!., 1991). The importance of
glycosylation for biological function and stability has however to be evaluated for each protein
individually. While N-glycosylation is essential for full biological activity in vivo of EPO
(Delorme et a!., 1992) and dramatically increases the functional anticoagulant activity of
human Protein C (Grinnell et a!., 1991), it has also been reported that an increased
glycosylation of recombinant antithrombin causes a decrease in the affinity for heparin (Björk
eta!., 1992) and decreases the specific activity of t-PA (Einarsson eta!., 1985).
A review on the assembly of N-linked oligosaccharides has been written by Kornfeld and
Komfeld (1985). A diagram with the glycosylation pathway is shown in Figure 1.2. The
oligosaccharides are covalently attached to the polypeptide chain through an asparagine
residue, at the consensus sequence Asn-X-Ser/Thr. Each step in the glycosylation pathway is
cataiysed enzymaticaily. Initially, a Glc3Man9GlcNAc2 structure is synthesised on a
polyisoprenoid derivative, the dolichol-P-P (GIc3Man9G1cNAc2-P-P-dol) and transferred en
bloc to the asparagine residues of the nascent polypeptide chain in the endoplasmic reticulum
(ER). Several "trimming" reactions are then catalysed by exoglycosidases in the ER to yield
high mannose N-linked structures. These high mannose structures are variably modified in the
Golgi compartments by several exoglycosidases and glycosyltransferase reactions, leading to
47

TRANS - GOLGI
TRANS - GOLGI NETWORK
the formation of "complex type" oiigosaccharide structures, terminated by sialic acids. Not all
the potential sites for glycosylation are used in a protein, leading to forms that differ in the
number of oligosaccharide chains attached. Variation in the terminal sugars and chain
branching may also occur and ultimately affect protein behaviour in vivo (Maiorella et al.,
1993).
ENDOPLASMIC RETICULUM
S 0. ina.. •- N tyIucs.nIa. 5. ñea.. S . adcs, . IIc add
Figure 1.2- N-linked oligosaccharide processing in mammalian cells (derived from Goochee et
al., 1991). Enzymes: 1. oligosaccharyltransferase, 2. a-glucosidase I, 3. a-glucosidase II, 4. ER a(1,2)
mannosidase, 5. Golgi cz-mannosidase-I, 6. N-acetylglucosaminyltransferase I, 7. Golgi a-
mannosidase-il, 8. N-acetylglucosaminyltransferase 11, 9. cz(1,6) fucosyltransferase, 10. 3(1,4)
galactosyltransferase, 11. a(2,3) sialyltransferase. Dol-P-P= dolichol-P-P; UDP= uridine diphosphate;
GDP= guanosine diphosphate; CMP= cytidine monophosphate.
48

1.4.2- The host and its environment
How to control the variation of the oligosaccharide structures remains unclear, but several
studies on the factors which may affect that variation have been carried out. It is now well
recognised that the glycosylation profile of a given glycoprotein is host-dependent. Host-
dependent oligosaccharide structures have been reported for IFN-B (Utsumi et al., 1989), t-PA
(Parekh et a!., 1989b) and EPO (Goto et a!., 1988). The degree of similarity between
oligosaccharide structures derived from CHO cells and human glycoproteins has been found to
be quite high. This has been reported for several products, such as IFN-Bl (Kagawa et a!.,
1988), EPO (Takeuchi et al., 1988) and t-PA (Speilman et a!., 1989). This fact seems to put
CHO cells in a very favourable position when selecting a cell line for the synthesis of
recombinant human proteins. It has to be pointed out that CHO cells have a limited capacity of
y- carboxylation and an inability for oligosaccharide suiphation (Goochee et a!., 1991).
Glycosylation patterns also vary with the extracellular environment of the cells and more
attention now is being given to this subject. Some examples reported in the literature are
shown in Table 1.5.
As the glycosylation profile of a protein may significantly affect its therapeutic value,
glycosylation analysis throughout the development of production processes for such proteins
becomes a major concern. The development of new strategies and instrumentation to allow a
rapid defmition of the glycosylation status is a major area of research (Parekh and Pate!, 1992;
James et a!., 1993).
I tONO\\,/
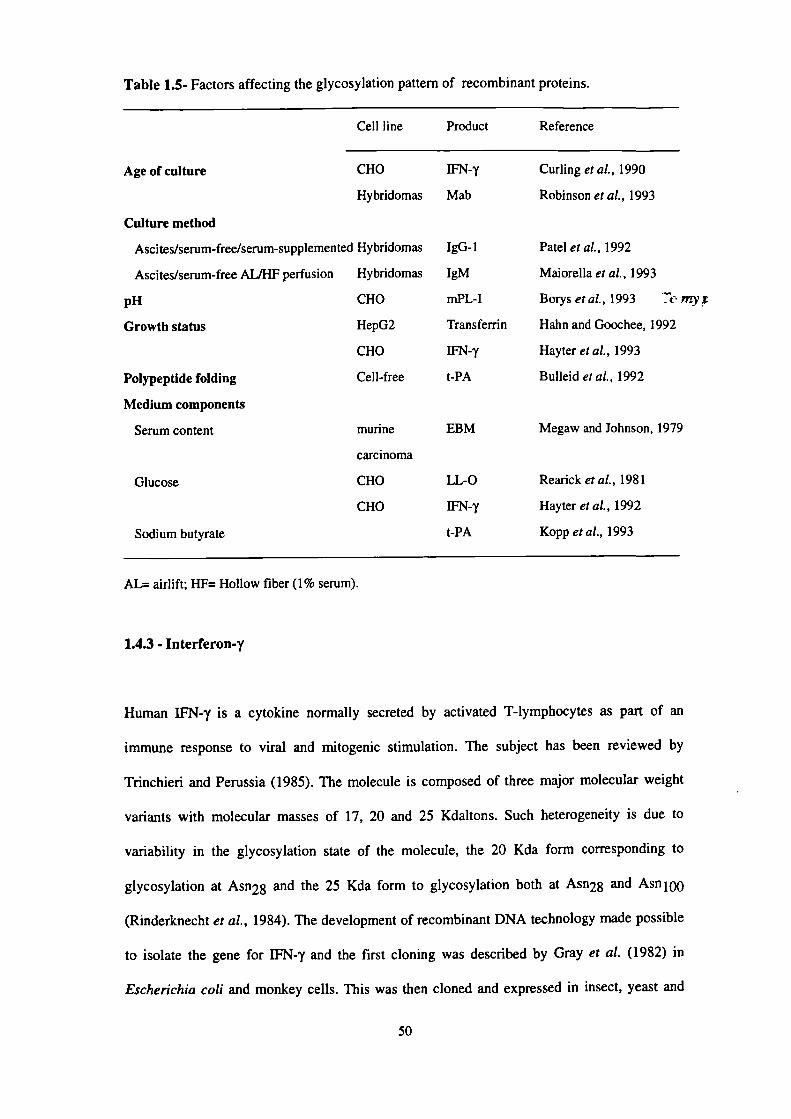
Table 1.5- Factors affecting the glycosylation pattern of recombinant proteins.
Cell line Product
Reference
Age of culture
CHO IFN-y
Curling et a!., 1990
Hybridomas Mab
Robinson eta!., 1993
Culture method
Ascites/serum-free/serum-supplemented Hybridomas
Ascites/serum-free AL/HF perfusion Hybndomas
pH CHO
Growth status HepG2
CHO
Polypeptide folding Cell-free
Medium components
Serum content murine
carcinoma
Glucose
CHO
CHO
Sodium butyrate
IgG-1 Patel eta!., 1992
1gM Malorella eta!., 1993
mPL-I Borys eta!., 1993 1
Transferrin Hahn and Goochee, 1992
IFN-y Hayter eta!., 1993
t-PA Bulleid eta!., 1992
EBM Megaw and Johnson, 1979
LL-O Rearick eta!., 1981
IFN-y Hayter eta!., 1992
t-PA Kopp eta!., 1993
AL= airlift; HF= Hollow fiber (1% serum).
1.4.3 - Interferon-'y
Human IFN-y is a cytokine normally secreted by activated T-lymphocytes as part of an
immune response to viral and mitogenic stimulation. The subject has been reviewed by
Trinchieri and Perussia (1985). The molecule is composed of three major molecular weight
variants with molecular masses of 17, 20 and 25 Kdaltons. Such heterogeneity is due to
variability in the glycosylation state of the molecule, the 20 Kda form corresponding to
glycosylation at Asn28 and the 25 Kda form to glycosylation both at Asn28 and Asn1yj
(Rinderknecht et a!., 1984). The development of recombinant DNA technology made possible
to isolate the gene for IFN-y and the first cloning was described by Gray et a!. (1982) in
Escherichia coli and monkey cells. This was then cloned and expressed in insect, yeast and
50
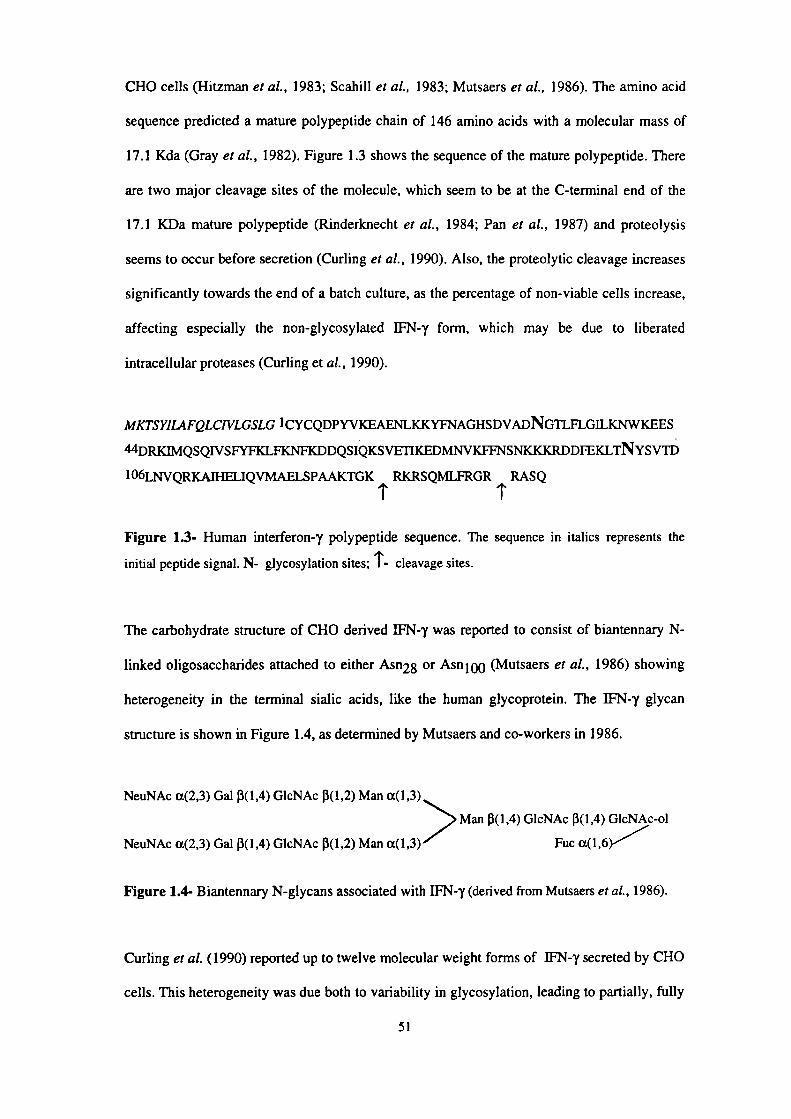
CHO cells (Hitzman eta!., 1983; Scahill et a!., 1983; Mutsaers et a!., 1986). The amino acid
sequence predicted a mature polypeptide chain of 146 amino acids with a molecular mass of
17.1 Kda (Gray eta!., 1982). Figure 1.3 shows the sequence of the mature polypeptide. There
are two major cleavage sites of the molecule, which seem to be at the C-terminal end of the
17.1 KDa mature polypeptide (Rinderknecht et a!., 1984; Pan et a!., 1987) and proteolysis
seems to occur before secretion (Curling et a!., 1990). Also, the proteolytic cleavage increases
significantly towards the end of a batch culture, as the percentage of non-viable cells increase,
affecting especially the non-glycosylated IFN-'y form, which may be due to liberated
intracellular proteases (Curling et a!., 1990).
MKTSYIL4FQLCJVLGSLG 1 CYCQDPYVKEAENLKKYFNAGHSDVADNGTLFLGILKNWKEES
44DRKIMQSQIVSFYFKLFKNFKDDQSIQKSVETIKEDMNVKFFNSNKKKRDDFEKLTNYSVTD
1O6LNVQRJ&TIQVMAELSPAAKTGK RKRSQMLFRGR RASQ
Figure 1.3- Human interferon-'y polypeptide sequence. The sequence in italics represents the
initial peptide signal. N- glycosylation sites; 1'- cleavage sites.
The carbohydrate structure of CHO derived IFN-'y was reported to consist of biantennary N-
linked oligosaccharides attached to either Asn28 or Asn1yj (Mutsaers et a!., 1986) showing
heterogeneity in the terminal sialic acids, like the human glycoprotein. The IFN-y glycan
structure is shown in Figure 1.4, as determined by Mutsaers and co-workers in 1986.
NeuNAc a(2,3) Gal (l,4) GlcNAc J(l,2) Man
I)> Man (I,4) GIcNAc (1,4)
NeuNAc a(2,3) Gal (l,4) GIcNAc 3(l,2) Man a(1,3)" Fuc
Figure 1.4- Biantennary N-glycans associated with IFN-y (derived from Mutsaers eta!., 1986).
Curling et a!. (1990) reported up to twelve molecular weight forms of JFN-y secreted by CHO
cells. This heterogeneity was due both to variability in glycosylation, leading to partially, fully
51

and non-glycosylated forms and to proteolytic processing of the glycosylated and non-
glycosylated forms at two separate sites of the polypeptide. At least six variants of the fully
glycosylated form were found, suggesting some variation in the oligosaccharide structure.
More recent studies have shown that the giycan structures attached to IFN-y are more complex
than the ones presented earlier by Mutsaers et a!. (1986) and there are also differences between
the glycans attached to Asn28 and Asn (yJ (James et a!., 1993). In Figures 1.5a,b the
oligosaccharide structures linked to Asn 28 and Asny-j are represented. Not only biantennary
but also more complex triantennary structures were found in the oligosaccharides at both
Asn28 and Asn 1(yJ. Furthermore, truncated structures were found at both sites, ca. 16.5% for
Asn28 and 10.5% for Asn1(yJ. However, while ca. 87% of the structures linked to Asn28 were
fucosylated, that fraction was only 3.5% for Asnl(yJ structures. Thus, there is great
heterogeneity between the oligosaccharide structures linked to the core polypeptide, which is
designated as microheterogeneity.
Although core polypeptide processing of both natural and recombinant IFN-y has been
reported, whether this affects the biological properties of the product is a subject of debate.
According to Hogrefe et al. (1989) the NH2-ternunal end is critical in maintaining the anti-
viral activity but there are different opinions regarding the role of the carboxy-terminus for full
biological activity in vivo (Seeling et al., 1988; Sakaguchi et a!., 1988). A recent study (Ealick
et a!., 1991) has shown that IFN-y exists as a dimer, which was reported to be required intact
for biological activity, and may include the COOH-terminal of one subunit and the NH2-
terminal of the other. The significance of glycosylation for the biological properties and
pharmacokinetics of IFN-y has not been firmly established. Recombinant IFN-y obtained from
bacteria cultures, which is not glycosylated, did not show any apparent change in activity
(Perez et a!., 1990) but it has not been reported whether IFN-y glycosylation affects other
properties in vivo, such as the half-life of the product or the loss of a specific receptor-
mediated activity (Bialy, 1987).
52

Fucosylated Core Oligosaccharides
L
FucosyJated Biantennary Complexes
Fucosylated Triantennary Complexes
(.)fAR
Nonfucosylated Biantennary Complexes
Nonfucosylated Triantennary Complexes
j—Mn
(1Am
3.7%
1.2%
9.1%
2.5%
5.8%
8.2%
50.7%
6.3%
1.6%
3.0%
4.7%
3.5%
• Sialic Acid A GalactoseN N-acetylglucosamine 0 Mannose + Fucose
Residues in parentheses may be present or absent.
Figure 1.5- N-glycans associated with IFN-y (derived from James et a!., 1993). a) Asn28 linked
oligosaccharide structures.
53

Nonfucosylated Core Oligosaccharides
- Mn 2.6%
Nonfucosylated Biantennary Complexes
Mn 3.6%
Mn 4.3%
Mn 4.1%
(•) 1A--CXMn 67.5%
Nonfucosylated Triantennary Complexes
(4(44 Mn 1.4%
(.)fAR
Mn 13.1%
Fucosylated Biantennaiy Complexes
Mn 3.1%
Fucosylated Triantennary Complexes
Mn 0.4%
• Sialic Acid A Galactose U N-acetylglucosamine 0 Mannose 4 Fucose
Residues in parentheses may be present or absent.
Figure 1.5- Contd. b) Asn iØO linked oligosaccharide structures.
54
Product heterogeneity in relation to glycosylation is not necessarily a restraint to the product
licensing process. However, in order to achieve batch to batch product consistency it is
important to characterise and understand the reasons underlying such heterogeneity.
1.5- Scope of the work
The relatively low cell densities and product titres usually achieved with animal cell culture
systems still strongly encourage studies on the cell culture environment. The optimisation of
cell recombinant protein production by animal cell cultures is important for the economic
feasibility of these processes. The design of the culture environment is clearly an aspect to
look at very carefully throughout the development of any production system and its relevance
can not be underestimated.
In early studies, experiments were developed in terms of nutrient requirements for cell growth
(Eagle, 1955a,b, 1959) and many following studies still used this as the only criterion for
developing cell culture and assigning levels of importance to specific components in the
culture (Mather and Sato, 1979; Iscove et a!., 1980; Barnes and Sato, 1980; McHugh et a!.,
1983; Gasser et al., 1985; Kovar and Franek, 1985; Kovar, 1986). Recent reports focus both
on cell growth and protein production (Luan et a!., 1987; Takazawa et a!., 1988; Duval et a!.,
1991; Fike et a!., 1991; Lucki-Lange and Wagner, 1991; Minamoto et a!., 1991; Schmid eta!.,
1991, 1992; Maiorella, 1992; Gaertner and Dhurjati, 1993; Lin et a!., 1993). Approaches that
include the production component during the investigations will be of greater value.
Optimisation schemes based on cell growth are not always the best rationale to take, as cell
growth and production may not be enhanced by the same stimuli (Schmid et al., 1991;
Gaertner and Dhurjati, 1993). This may have prominent implications on the design of the
culture and reinforces the importance of optimising the culture environment aiming to improve
55
the desired biological response.
Although an increase in product yield is most desirable, product authenticity is also a crucial
aspect to consider as it is known to be affected by the culture environment and may per se
affect the product therapeutic value (section 1.4). When producing proteins for therapeutic
applications, the quality of the product throughout the investigations should be analysed and
becomes an element that needs evaluation. Given the complexity of the process and the
information required to evaluate such systems, the final choice for an appropriate culture
system may not be straightforward and can not be based only on parameters such as product
titre, fermentation cost and ease of downstream processing. The quality and consistency of the
product from batch to batch will also have to be considered. The definition of the objectives of
an optimisation scheme at an early stage of the investigation is thus of primary importance.
A Chinese hamster ovary (CHO) cell line producing human interferon-y (IFN-y) under serum-
free culture, was used in this investigation. Manipulation of the culture design in order to
increase the production of IFN-y by CHO cells while investigating the effect of different
culture environments on product authenticity were set as the main objectives. At the same
time, the studies considered the trend of developing more defined cell culture media to allow
better process reproducibility.
The importance of serum-free medium components on CHO cell growth and IFN-y production
with an experimental statistical design was first investigated (Chapter 3). Follow-up studies
were based on that screening and include (1) the use of fermenter fed-batch cultures of glucose
and glutamine with a view to extend CHO cell growth and IFN-y production phases (Chapter
4) and (2) an investigation of the possibility of reducing the bovine serum albumin content of
the culture, while exploring its major effects (Chapter 5). The glycosylation pattern of JFN-y
was simultaneously analysed.
56

2- MATERIALS AND METHODS
2.1- Cell culture system
2.1.1- Cell line
The cell line used throughout this investigation was a Chinese hamster ovary cell (CHO 320),
kindly provided by Welicome Biotech (Beckenham, Kent, UK). It was derived from a
dihydrofolate reductase deficient (DHFR-) mutant of CHO-Ki, which has been co-transfected
with the DHFR arid the human IFN-y genes. The JFN-y gene was inserted using a plasmid
vector derived from pSV2-dhfr, which is under the control of the SV4O early promoter. The
IFN-'y gene was amplified by methrotrexate selection (McCormick eta!., 1984).
2.1.2- Culture medium
All the procedures involved in the final preparation of the culture medium and any other
medium supplementation were carried out in a laminar flow hood model Gelaire BSB 4A
(Flow Laboratories, High Wycombe, Buckinghamshire, UK), under sterile conditions. The
sterile disposable cell culture material used was obtained from Fisons (Loughborough,
Leicestershire, UK), Falcon (Becton-Dickinson, Oxford, UK) or Greinier (Dursley,
Gloucestershire, UK), unless otherwise indicated. All the sterile filter units were obtained from
Gelman Sciences (Ann Arbor, Michigan, USA). The media supplements were obtained from
Sigma (Poole, Dorset, UK), unless otherwise indicated.
2.1.2.1- Serum-free medium
The culture medium was a serum-free medium based on Roswell Park Memorial Institute
57

(RPM!) 1640 (Imperial Laboratories, Andover, Hants, UK) and supplemented with proteins,
bovine serum albumin (BSA), bovine insulin and human transferrin, glutamine, trace elements
and methotrexate (MTX) developed by the Animal Cell Culture group at the University of
Kent (Hayter et a!., 1989). The concentrations of the low molecular weight nutrients were
based on those described by Hamilton and Ham (1977). The final concentrations of each
component in the culture medium are presented in Table 2.1.
Table 2.1- Cell culture medium supplements and final concentrations in RPMI 1640.
Component
Proteins (x20)
Bovine serum albumin (Pentex Fraction V)*
Human transferrin
Bovine insulin
L-glutamine (xl 00)
Sodium pyruvate (xlOO)
L-alanine (xlOO)
Putrescine (x 100)
Trace Elements (xlOO)
FeSO4
ZnSO4
Na2SeO3
CuSO4
Methotrexate (xl 000)
Concentration
5g/l
5mg/I
5mg/I
2mM
1mM
0.1 mM
1pM
3pM
3pM
10 nM
10 nM
0.1 pM
*Miles Biochemicals, Slough, Bucks, UK. Each group of supplements is added to the culture medium
as a concentrated solution, as indicated in brackets.
The RPM! 1640 base medium was prepared using ultra pure water from a Milli-Q Plus system
(Millipore, Watford, Hertfordshire, UK) and filtered through a 0.22 pm Micro Capsule filter
unit and stored at 4°C. Unless otherwise indicated, all the supplements added to the culture
58

medium were prepared using the same Milli-Q water. The protein working stock (x20) was
filtered using a Gelman Micro Capsule filter and stored at -20°C in 50 ml aliquots. The
glutamine working stock (xIOO) was filtered using an Acrocap filter and stored at -20°C in 10
ml aliquots. The trace elements working stock (xlOO), prepared in combination with sodium
pyruvate, L-alanine and putrescine (all xIOO), was filtered through an Acrocap filter and stored
at 4°C in 10 ml aliquots. A methotrexate concentrated stock (xl 00000) was prepared in RPM!
1640, filtered through an Acrodisc and stored at -20°C in 100 tl aliquots; the working stock
(xl000) was prepared by diluting asceptically the concentrated stock 100 times in RPMI 1640
and storing Imi aliquots at -20°C. The final serum-free medium was prepared by warming up
each working stock in a 37°C water bath and adding the appropriate volume to the required
amount of RPM!, which was also pre-warmed at 37°C before being used. Frozen working
stocks were only used at the time of thawing, and any excess was discarded.
2.1.2.2- Specific media supplementation
In each of the investigations carried out in the present study (Chapter 3, 4 and 5), different
media formulations were used by adding specific medium supplements. For all the
supplementation studies, the basal serum-free medium was first prepared as above, divided
into appropriate portions, after which the specific nutrients were added. Thus, within each set
of experiments the basal medium was the same, to minimise variability between experiments
and attribute the effects to each specific supplementation rather than variability in the medium
preparation.
A. Statistical studies on the components of the serum-free medium
In Chapter 3, the screening of several of the culture components with a statistical design of
experiments is described. Increased concentrations of those components in the culture medium
59

was necessary and they were varied between two concentrations, i.e., a low and a high level.
The concentration present in the serum-free medium was designated as the low level; the high
level was taken as twice that concentration, except for arginine, glutamine and BSA, which
were increased only by 50%. Each individual nutrient or group of nutrients was prepared as
concentrated stock solutions, which were added to the basal medium in order to obtain the
required high levels (Table 2.2). The actual concentration of each nutrient in the serum-free
medium (low level), was taken into account to calculate the addition volume.
All the supplements were prepared using Milli-Q water. The BSA solution was filtered using
an Acrodisc filter and stored at -20°C. The other solutions were filtered through an Acrodisc
and stored at 4°C. Alter each specific supplementation, the pH of the culture medium was
corrected with HCI IM or NaOH IM if necessary (colour indication by phenol red present in
RPMI).
B. Fed-batch addition of glucose and glutamine to fermenter cultures
Fed-batch additions of glucose and glutamine to fermenter cultures were described in Chapter
4, where the details of the feeding regimes used are specified.
A concentrated stock solution of 50 mM glutamine and 14 mM glucose was prepared in Milli-
Q water, filtered through an Acrocap filter and stored at -20°C. In the beginning of each
fermenter run, a feeding bottle containing that solution, which was kept at 4°C throughout the
run, was connected to the fermenter and additions were made accordingly to the feeding
regime to use.
60

x 500
0.2
x 1000
0.1
x 100
x 200
0.5
x 200
0.25
x 150
0.70
x 200
0.5
x 200
0.5
x 100
0.5
x 200
0.5
x 200
0.5
x 200
0.5
x 200
0.5
x 200
0.5
x 200
0.5
x 200
0.5
x 200
0.5
Table 2.2- Solutions prepared to supplement the serum-free culture medium for the statistical
study [as specified in section 3.3].
Low level
Concentrated
Volume per 100 ml
gil
stock
(ml)
x 40
1.25
x 500
0.1
x 1000
0.2
BSA,FractionV 5
Human Transferrin 0.005
Bovine Insulin 0.005
mM
Sodium pyruvate 1
Putrescine 0.001
Glucose 11
Alanine 0.10
Arginine 1.15
Asparagine 0.33
Aspartate 0.15
Cystine 0.021
Glutamine 2
Glutamate 0.14
Glycine 0.13
Serine 0.29
Methionine 0.10
Proline/Histidine/Hydroxyproline 0.17/0.097/0.15
ThreoninelValinel.Isoleucine 0.13/0.17/0.38
Leucine/Tryptophan/Lysine 0.38/0.024/0.22
Phenylalanine/Tyrosine 0.09/0.013
nQ1: all the supplements were the same as those used to supplement the basal RPMI, except for BSA
which was obtained from Sigma in this study. The concentration of each supplement was increased by
100% in the culture medium, except for BSA, glutamine and arginine, which were increased by only
50%.
61

C. Low-BSA cultures
Serum-free medium containing low concentration of BSA (Chapter 5), was prepared using the
same procedure as before (section 2.1.2.1), except that the protein stock solution was prepared
with a lower level of BSA, but still as a x20 concentrated stock:
Final concentration
Proteins (x20)
Bovine serum albumin I g/l
Human transferrin 5 mg/I
Bovine insulin 5 mg/i
D. Lipids, Pluronic F68, fatty acid-free BSA and foetal calf serum supplementation
In Chapter 5 experiments are described in which the culture medium was supplemented with
various concentrations and combinations of a lipid mixture, Pluronic F68, cholesterol, linoleic
acid, oleic acid, choline and ethanolamine. In some cases fatty acid-free BSA (FAF-BSA) was
also added individually to the culture medium, at a fmal concentration of 1 mg/mi.
A commercial water soluble lipid mixture, cholesterol-rich, was obtained from Sigma and used
throughout these studies. This lipid emulsion is provided in sterile conditions and it was kept
at 4°C.
Free fatty acids, oleic and linoleic acids, and cholesterol (all from Sigma) were prepared as
fatty acid-free BSA (Miles Pentex, Fraction V) complexes at a ratio of 1:100 w/w. A
concentrated stock (0.5 mg/mi) was prepared by dissolving them in absolute ethanol at a
concentration of 20 mg/mI and, after filtering through Acrodisc filters, adding dropwise and
under sterile conditions 25 itI aliquots per I ml of a FAF-BSA solution (50 mg/mI in PBS),
which was also previously filtered through an Acrocap. The complexes were shaken for 1 h at
62
20°C protected from light and stored at 4°C.
Choline chloride and ethanolamine were obtained from Sigma and prepared in Milli-Q water
as 100 x concentrated solutions. They were filtered through Acrocap filters and stored at 4°C.
Pluronic F68 was obtained from Sigma as a sterile 10% solution and kept at room temperature.
For individual supplementations, FAF-BSA (Miles Pentex Fraction V) was prepared as a I OOx
concentrated solution (100 mg/ml) in Milli-Q water, filtered through an Acrocap and stored at
-20°C.
Foetal bovine serum was obtained from Gibco, Life Technologies (Uxbridge, Middlesex, UK)
and used at a concentration of 8% (w/w). In those particular experiments, trace elements and
proteins were excluded from the culture medium.
2.1.3- Cell culture methods
All the cell culture work was carried out in a laminar flow hood (Flow Laboratories) and the
cell culture sterile disposable material was obtained from Fisons, Falcon or Greinier, unless
otherwise indicated. When sterile glass or other material, e.g., sterile connectors, material was
required, including the fermenters, they were steriuised in a Rodwell autoclave model Ensign
(Hornchurch, Essex, England) for 45 minutes at 120°C.
2.1.3.1 . Cell maintenance
Cell working stocks for the present investigations were prepared from a master stock existent
at the University of Kent. Cells were allowed to grow for 5-6 passages, after which they were
63
harvested in the mid-exponential phase of growth. The cell culture medium was centrifuged at
1000 rpm in a MSE bench top centrifuge Model Chilspin 2 (Fisons) and the cell pellet
resuspended in fresh RPMI containing 2.5% BSA (Miles Pentex Fraction V) and 10% DMSO
(Sigma) at a density of 2-5 x 10⁶ cells/mI, for cryopreservation. This freezing mixture
containing the cells was then divided into 1.8 ml cryopreservation tubes (Nunc, Roskilde,
Denmark) in 1 ml aliquots, placed in a polystyrene box and stored at -70°C for 2 h, alter which
they were tranferred to liquid nitrogen storage until required.
Cell revival was done by rapidly thawing one vial of frozen cells and placing the tube in a
37°C water bath until defrosted. The cells were then washed with culture medium to remove
traces of DMSO, resuspended in 15 ml of fresh medium, put in a sealed 25 ml Erlenmeyer
sterile culture flask and gassed with 5% CO2 in air before incubation at 37°C in an orbital
shaking incubator Model Infors FIT (Rittergasse, Bottminger) at 100 rpm.
Scaling-up of the culture to obtain the required cell density to set up each experiment was done
by subcultunng the cells every 2-3 days in fresh culture medium, and going successively from
the 25 ml culture flask to a 50 ml culture flask, then to a 250 ml spinner flask (Techne,
Cambridge, UK) and finally to a 500 ml spinner flask (Techne). Spinner flasks were
maintained at 37°C in a CO2 incubator Model 1500 (Flow Laboratories) with a 5% CO2
atmosphere and keeping the caps loose. The stirrer speed was 100 rpm.
2.1.3.2- Shake-flask and fermenter cultures
Initial cell concentration for both shake-flask experiments and fermenter cultures were in the
range of 1.5-2 x 10 5 cells/mI, and the cell inocula were harvested at the mid-exponential
phase of 500 ml spinner cultures. Cells with the same culture history (same number of
passages and subculturing procedure) were used for all the experiments, and as such a new cell
64
working stock was revived for each set of culture conditions.
A. Shake-flask cultures
Shake-flask culture studies were made in sealed 250 ml Erlenmeyer culture flasks. The cell
inoculum for each experiment was prepared by centrifuging at 1000 rpm the desired volume of
culture medium, after which the cell pellets were ressuspended and pooled to a common bottle.
Each individual flask was then seeded with equal inoculum volume. Following the same
procedure as the cell culture maintenance, the headspace of each flask was purged with 5%
CO2 in air to maintain the pH at 7.2 - 7.4 and they were then incubated at 37°C in an orbital
shaking incubator at 100 rpm. The flasks were sampled every day (or as required) and a cell
count was carried out. The remaining sample was centrifuged at high speed in a MSE
microcentrifuge Model Microcentaur (Fisons) and the supematant was aliquoted into
appropriate volumes and stored at -70°C until required for analysis. If required, cell pellets
were also stored at -70°C.
B. Fennenter cultures
Fermenter culture studies were made in 2 1 fermenters (LH Fermentation, Reading, UK) with
approximately 1.7 1 working volume, connected to Anglicon controllers (Brighton Systems
Limited, Newhaven, East Sussex, UK) for temperature, pH and oxygen control. The air, CO2
and N2 flow rate into the fermenter were controlled by flow control valves built into the
controller unit. The exit and inlet gas lines of the fermenters were filtered by means of 0.22 im
Microcap filter cartridges (Gelman Sciences) and the exit line had a cooled condenser before
the filter unit. The fermenters were provided with flat turbine impellers and the stirrer speed
was set at 60 rpm. All the fermenter lines were mount with silicone tubing. Sampling,
inoculation, air input and output and nutrient feeding for fed-batch option, were carried out by
65

means of ports on the top plate. Temperature, pH and dissolved oxygen tension probes were
placed in the top of the plate. Figure 2.1 shows a diagram of the fermentation and control
process.
Temperature was measured by a resistance thermometer and heat was supplied by a heating
resistance jacket. The controller was tuned to give no more than 0.1°C overshoot.
The pH was measured by a steam sterilizable pH electrode (Ingold Messtechnik AG, Industrie
Nord, Urdorf, Switzerland) and the culture maintained at 7.2 under the action of the pH
controller channel, by sparging CO2 whenever the medium pH became alkaline (early stages
of the culture). The production of lactate and CO2 in later growth phases decreases the pH of
the culture, but the increased oxygen demand at higher cell densities leads to increased
sparging of air, which displaces CO2 and thus reduced the need for base addition.
Dissolved oxygen was measured by a steam sterilizable polarographic dissolved oxygen
electrode (Ingold) and the oxygen controller was tuned to keep the culture at 40% air
saturation by sparging air. A slow flow of air through the fermenter headspace prevented CO2
build up. A slow bleed of nitrogen into the sparge line was also kept to prevent siphoning of
medium when there was little addition of air or CO2.
Sterilisation of the fermenter was carried out with all the probes and lines in place, and with
the fermenter filled with 1.7 1 PBS solution. Unlike the oxygen probe, the pH probe was
calibrated prior to sterilisation.
The cell inoculum was prepared at the desired concentration and working volume in 2 1 bottles
and the contents were siphoned into the fermenter by means of sterile connections, after
emptying the solution used to fill the fermenter during its sterilisation by the same procedure.
66

air
cc
air
N2
10ff
Sampling was done by a sample port at the top plate of the vessel and the sample was treated
by the same procedure as described for the shake-flask cultures.
For fermenter fed-batch cultures, the feeding solution was supplied from a 500 ml reservoir
maintained at 4°C. The flow rate was controlled using a peristaltic pump (Watson Marlow,
Falmouth, Cornwall, UK), with periodic checks on the flow rate using a graduated reservoir in
line. The additions were made every four hours, with a duration of 2 to 4 minutes, depending
on the volume required and on the pump flow rate; a timer was used to turn on the pump at the
appropriate time. The volumes added to the fermenter were small (ca. 15 ml per day) to avoid
dilution of the culture. Sampling was done as described for the batch cultures.
Figure 2.1- Process diagram for fermenter cultures under batch and fed-batch operation.
67

2.1.3.3- Plackett-Burman experimental set-up
A statistical experimental design, the Plackett-Burman method, was used in Chapter 3 and
Chapter 5. Those experiments were carried out according to a design matrix, selected
considering the number of variables to study (Tables 3.1 and 5.4). The matrix employed in
Chapter 3 [Table 3.1] required 24 different culture conditions, corresponding to n=48 flasks, as
each culture was set in duplicate. The matrix was organised in three sets of experiments, each
of them including a control culture (flask 24 in the matrix), as follows: two sets of 9 cultures
(18 flasks) and one set of 8 cultures (16 flasks). In each set, the growth and IFN-y production
data obtained for the duplicate control cultures were used to assess variations ocurring between
the different experimental sets. Cell yield was adjusted for one data set, where the variation in
growth was unusually high (ca.13%). The matrix used in Chapter 5 required a much smaller
number of flasks (16) and so all the cultures were set up together. The components (variables)
of each matrix were added to the corresponding basal medium according to its specified level
in the matrix, after which the flasks were inoculated with aliquots of a common cell
suspension.
2.2- Analytical Methods
2.2.1- Determination of CHO cell growth
In an Eppendorf tube, 100 p1 of cell culture medium were mixed with 100 p1 of trypan blue
(Sigma) and cell counts were made in a Neubauer counting chamber, using a microscope
Model ID 02 (Zeiss, West Germany). Cell viability was determined by dye exclusion as dead
cells stain blue with this method.
68

2.2.2- IFN-y analysis
2.2.2.1- ELISA assay for IFN-y titre
IFN-y titres were determined by a monoclonal antibody-based sandwich enzyme-linked
immunosorbent assay (ELISA). All the buffers used in the assay are shown in Table 2.3.
Table 23- Composition of buffers used for the IFN-y ELISA assay.
Final concentration
Coating Buffer
PBS tablets* 1/100 ml
20B8 10 pg/mI
N: Adjusted to pH 8.0 using 5 M Nal-lO.
Wash Buffer
PBS tablets 1/lOOmI
Casein 0.05%
Tween20 0.1%
Nt: warmed on hotplate to dissolve.
Block Buffer
PBS tablets 1/100 ml
Casein 0.5%
Tween2O 0.1%
Qt: warmed on hotplate to dissolve.
Substrate Buffer
Glycine 0.5 M
ZnCl2l 0.lM
0.1 M
N: Adjusted to pH 10.4 using 5 M NaHO. Immediately prior to use, one phosphatase substrate
tablet (Sigma 104) was added per 5 ml of substrate buffer.
all the buffers were prepared with Milli-Q water. * Unipath Ltd, Basingstoke, Hampshire, UK;
§ Sigma; I Fisons.
69

Time/temperature
Overnight- 4°C
2 h RT
I h RT
1 h RT
I h RT
I5mRT
Concentration
10 pg/ml
1200-160 (lU/mI)
5 pg/mI
1/2000
SM
The assay was carried out in 96-well plates (Greinier), following the steps described in Table
2.4. The 20B8 antibody used to coat the assay plates was raised against recombinant JFN-y
from Escherichia coli (Celltech, Slough, UK), and a concentrated stock was kept at 4°C. The
biotinylated antibody 2007 was raised against Escherichia coli-derived IFN-y (Celltech),
recognising a different epitope on the JFN-y molecule, and was prepared in wash buffer from a
concentrated stock kept at 4°C. A concentrated stock of IFN-y standards (Weilcome,
Beckenham, UK) was kept at 4°C and 1/4 serial dilutions in wash-buffer were made to obtain
a standard concentration range of 1200 to 160 IU. The samples were thawed and appropriate
dilutions were made in wash buffer. For the determination of the intracellular 1FN- cell
pellets were thawed and resuspended in 400 p1 of wash buffer, after which the pellets were
sedimented again by centrifuging at 7500 rpm for 5 minutes in a microcentrifuge. Appropriate
dilutions were carried out using the supematant obtained. Samples and standards were applied
to the plate in triplicate. Extravidin-phosphatase was obtained from Sigma and prepared in
wash buffer. The substrate reaction was carried out in the dark.
Table 2.4- Procedure for the ELISA assay for IFN-y.
1.Coating- 20B8
Wash x 2
2. Blocking- block buffer
Wash x 2
3. Samples/ Standards
Wash x 3
4. Second antibody- 2007-biotin
Wash x 3
5. Extravidin-phosphatase
Wash x 4
6. Substrate buffer
7. Stop reaction- NaOH
p1/well
50.il
100 p1
50
50111
50p1
100111
20111
RT- room temperature.70

IM
50 mM
50 mM (pH 8.2)
5 mM
0.5%
62.5 mM
2.5%
0.1%
10%
Once the assay was completed, the plates were read at 410 nm in a Dynatech MR5000 plate
reader (Dynatech, Billingshurst, West Sussex, UK). A calibration curve was constructed with
the absorbance values obtained for the standards and the concentration of each sample was
determined by interpolation.
2.2.2.2- Analysis of IFN-y glycosylation
The IFN-'y glycosylation patterns were determined by three sequential steps:
immunoprecipitation of the samples, SDS-page electrophoresis and silver staining.
2.2.2.2.1- Immunoprecipitation of IFN-y
For each determination a 5 ml sample was immunoprecipitated using the 20B 8 antibody raised
against JFN-y (Ceiltech). The buffers used for this assay are shown in Table 2.5.
Table 2.5- Buffers for immunoprecipitation of WN-y.
Final concentration
Stock buffer
20x MES*Wash buffer 1
MES
'-: adjusted to pH 6.5 with 5 M NaOHWash buffer 2
Tris-I-lCI
EDTA
Nonidet P4OISample buffer
Tris-HCI
SDS
Bromophenol blue*
Sucrose
all buffers prepared with MilIi-Q water. * Sigma; § Fisons; ¶ BDH, Poole, UK.
71

In a 15 ml centrifuge tube, 0.25 ml of a I M MES solution and 10 i.tl of the 20B8 packed
volume Reselute (Celitech) were added to 5 ml of thawed sample. The samples were placed in
a rotating wheel and left at 4°C overnight, after which they were centrifuged at 3000 rpm to
sediment the beads and the supernatant was aspirated. Wash buffer 1 (750 p1) was added to
each tube and the beads gently resuspended. The suspensions were then transferred to
Eppendorf tubes, which were centrifuged for 3 minutes at low speed (7500 rpm) in a
microcentrifuge and the supernatant was aspirated. The beads were further washed twice with
wash buffer I and twice with wash buffer 2, using the same procedure. After the final washing
step, the beads were resuspended in 15 j.d of sample buffer and boiled for 3 minutes to
dissociate JFN-y from the beads. Samples were then centrifuged at 7500 rpm for 5 minutes.
The supernatant was loaded into pre-cast wells of a 14% polyacrylamide SDS Tris-glycine gel
(Novex, San Diego, CA, USA), with 1.0 mm x 10 well and 1.0mm thickness x 7.5 cm height
x8 cm width.
2.2.2.2.2- SDS-page electrophoresis
The 14% polyacrylamide SDS-PAGE gels were assembled into a Model XCe1I gel apparatus
(Novex) and the electrode reservoirs were filled with glycine electrode buffer (Bio-Rad,
Richmond, CA, USA), which consisted of a solution 0.025 M Tris-HC1, 0.192 M glycine and
0.1% SDS. Supernatant (15-20 p1) was loaded into the wells of the gel with an Hamilton
syringe. A Bio-Rad SDS-PAGE protein standard, with molecular weight ranging from 14.5 to
97.4 kD was also applied to one well of the gel. The gels were run for approximately 2 hours
at 125 volts.
2.2.2.2.3- Silver staining
The silver staining of the gels was done using the Silver Stain Plus kit obtained from Bio-Rad
and unless otherwise indicated, all the reagents were provided by that supplier. Three steps
72
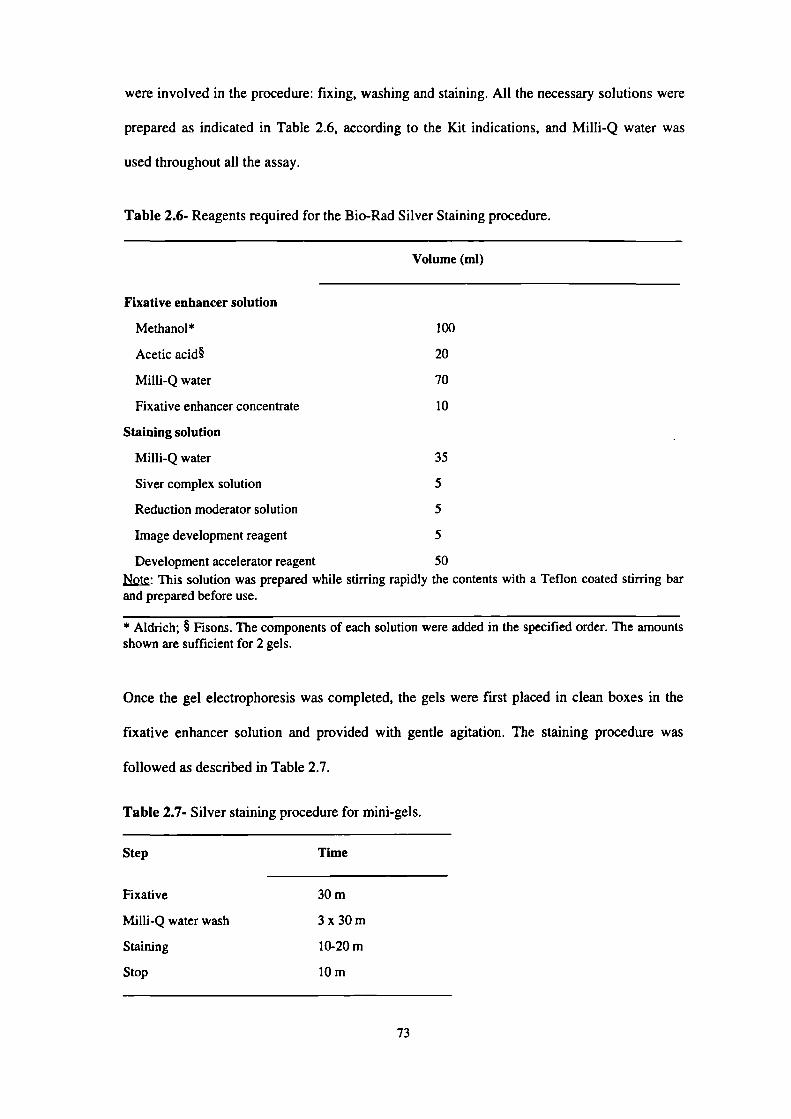
were involved in the procedure: fixing, washing and staining. All the necessary solutions were
prepared as indicated in Table 2.6, according to the Kit indications, and Milli-Q water was
used throughout all the assay.
Table 2.6- Reagents required for the Bio-Rad Silver Staining procedure.
Volume (ml)
Fixative enhancer solution
Methanol* 100
Acetic acid 20
Milli-Q water 70
Fixative enhancer concentrate 10
Staining solution
Milli-Q water 35
Siver complex solution 5
Reduction moderator solution 5
Image development reagent 5
Development accelerator reagent 50
Ik^t: This solution was prepared while stirring rapidly the contents with a Teflon coated stirring barand prepared before use.
* Aldrich; § Fisons. The components of each solution were added in the specified order. The amountsshown are sufficient for 2 gels.
Once the gel electrophoresis was completed, the gels were first placed in clean boxes in the
fixative enhancer solution and provided with gentle agitation. The staining procedure was
followed as described in Table 2.7.
Table 2.7- Silver staining procedure for mini-gels.
Step Time
Fixative 30m
MiIli-Q water wash 3 x 30 m
Staining 10-20 m
Stop lOm
73

After stopping the reaction, each band on the silver-stained gels was quantified by conversion
into absorbance units with a Bio-Rad Model 1050 scanning densitometer connected to an
Amstrad 1640 microcomputer. From the scans obtained, the area under each peak was
integrated to allow the relative proportions of each WN-y variant to be estimated. A
photograph of the gel bands corresponding to IFN-y obtained with this method (lane 3),
together with molecular weight markers (lane 1), is shown in Figure 2.2. Three major variants
of JFN-y weredetected on the gel, also showing the microheterogeneity existent within each
variant: 1) at the lower molecular weight range a cluster of non-glycosylated forms, ON (ca.
15-17 kDa), 2) an intermediate cluster of bands corresponding to JFN-y glycosylated at one
site only, iN (19-22 kDa) and 3) a top cluster of bands corresponding to IFN-y glycosylated at
the two potential sites, 2N (23-27 kDa). Lane 2 shows that the medium components do not
interfere with this assay. The JFN-y patterns shown in Figure 2.2 are consistent with those
earlier reported (Curling et a!., 1990).
kDa
66
45
31
21.5
11.5
1 2 3
} - 23-27 2N
} -19-22
} -15-17 ON
Figure 2.2- Analysis of IFN-y variants produced by CHO cells. Immunoprecipitated samples
were resolved by SDS/PAGE on a 14% polyacrylamide gel and detected by silver stain, as described in
the text. The white arrow indicates the direction of migration. Lane 1- MW markers; lane 2- serum-
free medium; 3- sample of a batch culture at Ca. 100 h.
74
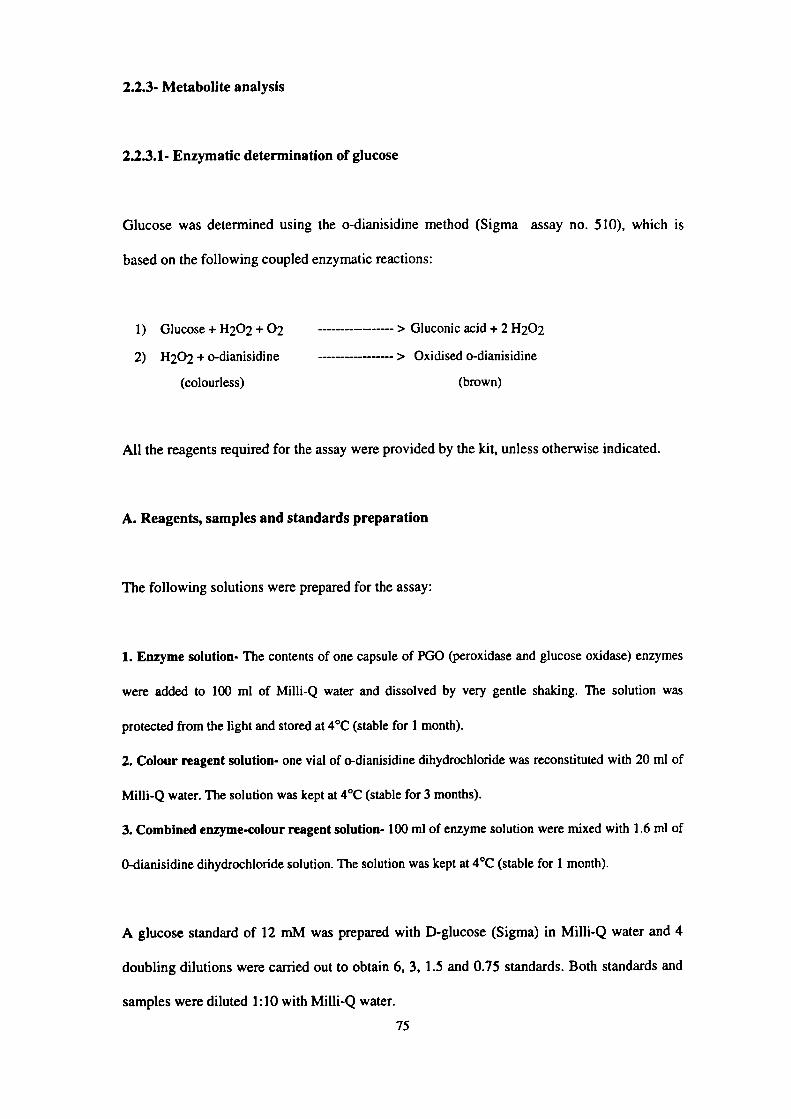
2.2.3- Metabolite analysis
2.23.1- Enzymatic detennination of glucose
Glucose was determined using the o-dianisidine method (Sigma assay no. 510), which is
based on the following coupled enzymatic reactions:
I) Glucose + H202 + 02 -----------------> Gluconic acid + 2 H202
2) H202 + o-dianisidine -----------------> Oxidised o-dianisidine
(colourless)
(brown)
All the reagents required for the assay were provided by the kit, unless otherwise indicated.
A. Reagents, samples and standards preparation
The following solutions were prepared for the assay:
1. Enzyme solution- The contents of one capsule of PGO (peroxidase and glucose oxidase) enzymes
were added to 100 ml of MilIi-Q water and dissolved by very gentle shaking. The solution was
protected from the light and stored at 4°C (stable for I month).
2. Colour reagent solution- one vial of o-dianisidine dihydrochloride was reconstituted with 20 ml of
Milli-Q water. The solution was kept at 4°C (stable for 3 months).
3. Combined enzyme-colour reagent solution- 100 ml of enzyme solution were mixed with 1.6 ml of
0-dianisidine dihydrochloride solution. The solution was kept at 4°C (stable for I month).
A glucose standard of 12 mM was prepared with D-glucose (Sigma) in Milli-Q water and 4
doubling dilutions were carried out to obtain 6, 3, 1.5 and 0.75 standards. Both standards and
samples were diluted 1:10 with Milli-Q water.
75

B. Assay procedure
The assay was carried out in ImI disposable cuvettes, to which 100 jil of each sample, standard
and a blank (Milli-Q water), were first added. 1 ml of combined enzyme-colour reagent
solution was added on the top of that and the contents were mixed well. The cuvettes were
then incubated at room temperature for 45 minutes, after which the absorbance was read at 450
nm in a UV/VIS spectrometer Model UNICAM 8625 (Unicam Ltd, Cambridge, UK). The
concentration of each sample was determined by construction of a standard curve.
2.2.3.2- Enzymatic determination of lactate
Lactate was determined by an enzymatic assay from Sigma (assay no.735). The assay relies on
the action of lactate oxidase on lactate, which produces pyruvate and hydrogen peroxide. The
hydrogen peroxide catalyses the oxidative condensation of chromogen precursors to produce a
coloured dye with a maximum absorbance at 540 nm.
All the reagents required for the assay were provided by the kit, unless otherwise indicated.
A. Reagents, samples and standards preparation
The lactate reagent was prepared by adding 10 ml of Milli-Q water to each vial of lactate
reagent, and the contents mixed with gentle inversion.
A lactate standard was obtained by preparing a 16 mM solution of L-lactic acid (Sigma),
aliquoted into I ml vials and stored at -20°C. Serial doubling dilutions of that standard were
carried out to obtain a standard concentration range of 16 to 1 mM. Any sample thought to be
over 14 mM was diluted 1:2 in Milli-Q water.
76
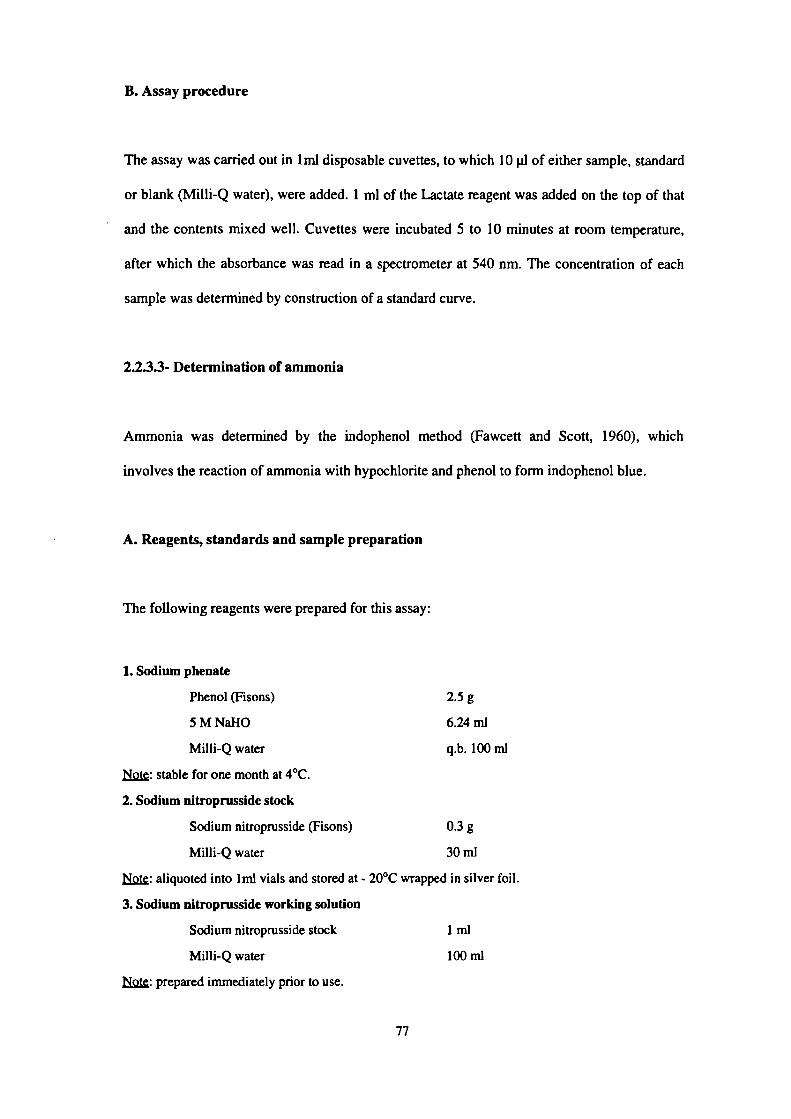
B. Assay procedure
The assay was carried out in ImI disposable cuvettes, to which 10 jil of either sample, standard
or blank (MilIi-Q water), were added. I ml of the Lactate reagent was added on the top of that
and the contents mixed well. Cuvettes were incubated 5 to 10 minutes at room temperature,
after which the absorbance was read in a spectrometer at 540 nm. The concentration of each
sample was determined by construction of a standard curve.
2.2.3.3- Determination of ammonia
Ammonia was determined by the indophenol method (Fawcett and Scott, 1960), which
involves the reaction of ammonia with hypochiorite and phenol to form indophenol blue.
A. Reagents, standards and sample preparation
The following reagents were prepared for this assay:
1. Sodium phenate
Phenol (Fisons) 2.5 g
5MNaI-IO 6.24m1
Milli-Q water q.b. 100 ml
stable for one month at 4°C.
2. Sodium nitroprusside stock
Sodium nitroprusside (Fisons) 0.3 g
Milli-Q water 30 ml
1: aliquoted into imi vials and stored at. 20°C wrapped in silver foil.
3. Sodium nitroprusside working solution
Sodium nitroprusside stock 1 ml
Milli-Q water 100 ml
prepared immediately prior to use.
77

4. Sodium hypochiorite
Sodium hypochlorite solution (Fisons) 0.71 ml
Milli-Q water 100 ml
: prepared immediately prior to use.
An ammonia standard was obtained by preparing a 5 mM ammonium chloride (Fisons)
solution. Serial doubling dilutions were carried out in Milli-Q water to give a 2.5 to 0.325
standard concentration range.
B. Assay procedure
50 p1 of sample, standard and blank were added to 3 ml disposable cuvettes. Then the reagents
were added in the following order:
1.Sodium phenate 0.5 ml
2. Sodium nitroprusside working solution 0.75 ml
3. Sodium hypochlorite 0.75 ml
The contents of the cuvettes were mixed well and incubated at room temperature for 30
minutes. The absorbance was read at 630 nm in a spectrometer. The concentration of each
sample was determined by construction of a standard curve.
2.23.4- HPLC determination of amino acids
Amino acid concentrations were determined by reverse phase HPLC, using a reverse phase
Spherisorb Cl 8 column (Hichrom, Reading, Berks, UK), of orthophthalaldehyde (OPA)
derivatised amino acids. In the presence of mercaptoethanol, OPA reacts with primary amino
acids to form fluorescent derivatives. The following amino acids were detected by the assay:
aspartate, glutamate, serine, glutamine, histidine, glycine, threonine, arginine, alanine,
78

tyrosine, methionine, valine, phenylalanine, isoleucine, leucine and lysine. Imines, such as
proline and hydroxyproline, are not derivatised unless they are modified by pre-treatment with
hyphochlorite. Cysteine and cystine are not derivatised using this method. A procedure similar
to the one described by Seaver et al. (1984) was followed. The HPLC system consisted of a
Model SIL 9A auto-sampler (Shimadzu, Hetton, UK), a Model Series 4 Liquid
Chromatography solvent delivery system (Perkin-Elmer, Norwalk, CT, USA), a luminescence
spectrometer (Perkin-Elmer) and a laboratory computing integrator Model LCI- 100 (Perkin-
Elmer). The column was calibrated using a standard amino acid mixture (Sigma AA-S-18)
with the addition of glutamine and asparagine.
2.2.3.4.1- Sample and buffers preparation
The buffers required for this assay were prepared as described in Table 2.8.
Table 2.8- Buffers for HPLC determination of derivatised amino acids.
Concentration
Buffer A- Phosphate Buffer
di-Sodium hydrogen phosphate (12 H20)*
Sodium di-hydrogen phosphate*
Sodium acetate*
Methanol §
Tetrahydrofuran
Buffer B- 70% Methanol
Methanol
Buffer C- 100% Methanol
Buffer D- 100% Mili-Q Water
0.05 M
0.05 M
0.05 M
2%
2%
70%
100%
* Fisons; § Aldrich. Buffers A and B were prepared using Milli-Q water.
79

Samples and standard (serum-free medium frozen at -70°C in 500 g.d aliquots) were thawed and
400 .tI aliquots were centrifuged through lO-KDa exclusion limit ultrafiltration membranes
(Millipore, Harrow, Middlesex, UK) for approximately 15 minutes at high speed in a
microcentrifuge. The filtrate was then diluted 1:25 with Milli-Q water and 200 tI of each
dilution was placed in the auto-sampler vials and cap with septum in place.
2.2.3.4.2- Auto-sampler preparation
The vials containing the 200 i1 aliquots of sample were loaded into the auto-sampler tray. The
sampler was programmed in order to add 200 Al of fluoraldehyde (Pierce Chemical Co.,
Rocklord, IL, USA) to each sample vial and then to inject 20 .il of each vial into the column.
The line was purged twice with buffer A prior to the beginning of the run and between each
sample injection.
2.2.3.4.3- HPLC assay
One litre of each buffer was placed in the respective buffers reservoirs, the system was
degassed for 5 minutes and then purged with buffers C, D and A, in that order. The column
was washed with buffer B for 15 minutes before starting the equilibration section of the
chromatography program (Table 2.9). The fluorescent detector auto zero was set when a stable
reading was achieved when running buffer A through the column. Sampler and integrator were
programmed for the number of samples to be run.
The amino acid profile was obtained by the 40 minutes gradient shown in Table 2.9. The
fluorescent OPA-amino acid derivatives were detected using a 334 nm excitation filter and 425
emission filter. The data was collected and analysed by the sample integrator. Using this
method, there is a linear relationship between each chromatogram peak area and amino acid
80
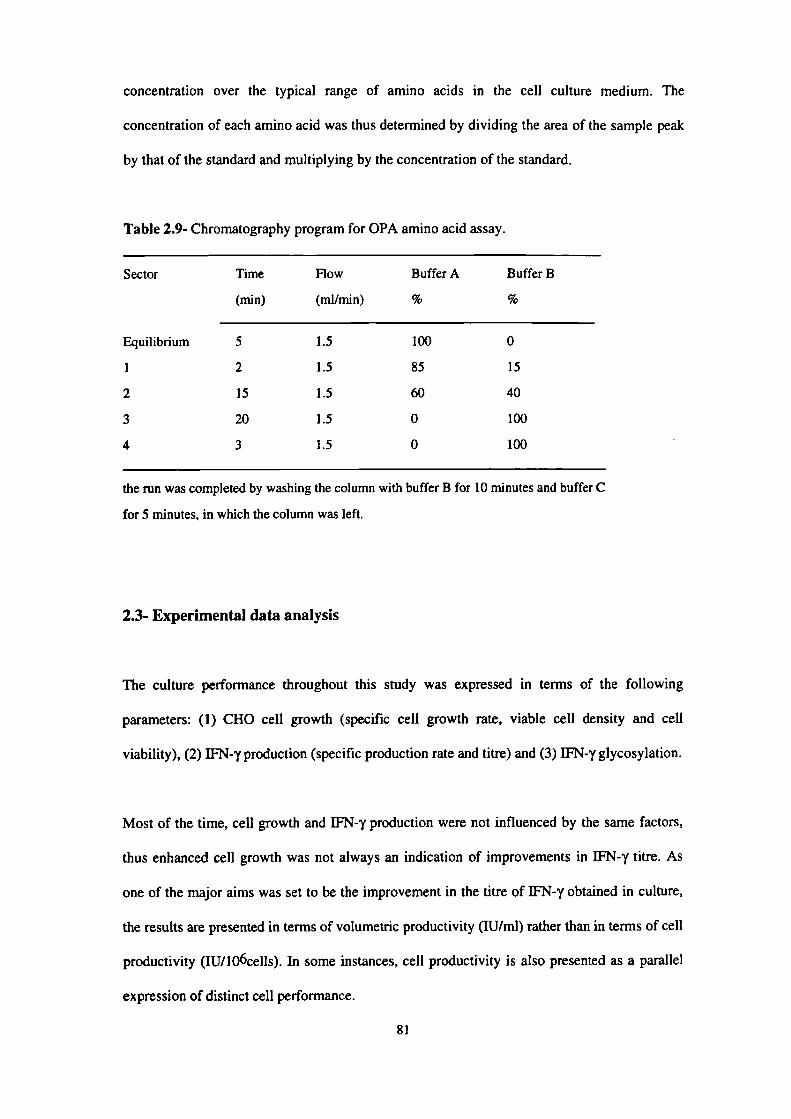
concentration over the typical range of amino acids in the cell culture medium. The
concentration of each amino acid was thus determined by dividing the area of the sample peak
by that of the standard and multiplying by the concentration of the standard.
Table 2.9- Chromatography program for OPA amino acid assay.
Sector Time Flow Buffer A
Buffer B
(mm)
(mllmin)
%
%
Equilibrium
5
1.5
100
0
2
1.5
85
15
2
15
1.5
60
40
3
20
1.5
0
100
4
3
1.5
0
100
the run was completed by washing the column with buffer B for 10 minutes and buffer C
for 5 minutes, in which the column was left.
2.3- Experimental data analysis
The culture performance throughout this study was expressed in terms of the following
parameters: (1) CHO cell growth (specific cell growth rate, viable cell density and cell
viability), (2) IFN-T production (specific production rate and titre) and (3) IFN-y glycosylation.
Most of the time, cell growth and LFN-y production were not influenced by the same factors,
thus enhanced cell growth was not always an indication of improvements in IFN-y titre. As
one of the major aims was set to be the improvement in the titre of IFN-y obtained in culture,
the results are presented in terms of volumetric productivity (lU/mi) rather than in terms of cell
productivity (IU/lOócells). In some instances, cell productivity is also presented as a parallel
expression of distinct cell performance.
81
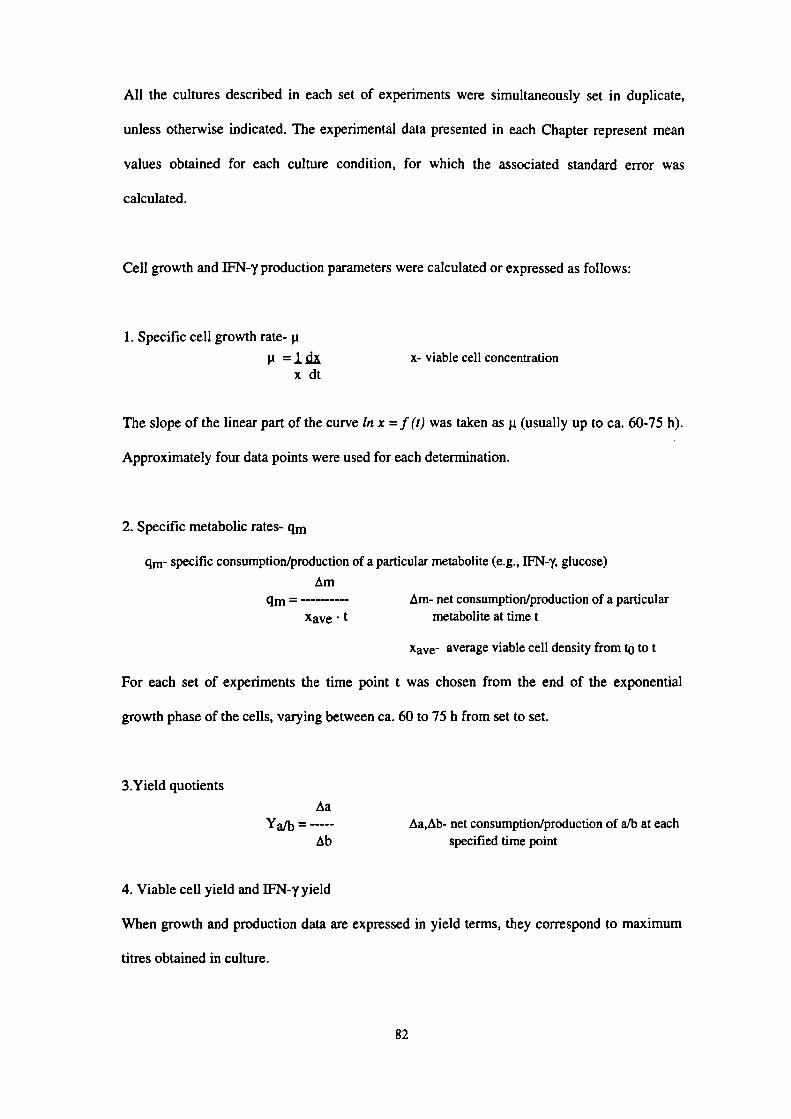
All the cultures described in each set of experiments were simultaneously set in duplicate,
unless otherwise indicated. The experimental data presented in each Chapter represent mean
values obtained for each culture condition, for which the associated standard error was
calculated.
Cell growth and IFN-y production parameters were calculated or expressed as follows:
1. Specific cell growth rate- i
Il =Ith
x- viable cell concentrationx dt
The slope of the linear part of the curve in x = 1(t) was taken as t (usually up to Ca. 60-75 h).
Approximately four data points were used for each determination.
2. Specific metabolic rates- qm
qm- specific consumption/production of a particular metabolite (e.g., IFN-y, glucose)
Amqn = - Am- net consumption/production of a particular
xaye t metabolite at time t
Xave- average viable cell density from tj to t
For each set of experiments the time point t was chosen from the end of the exponential
growth phase of the cells, varying between Ca. 60 to 75 h from set to set.
3.Yield quotients
AaAa,Ab- net consumption/production of a/b at each
Ab
specified time point
4. Viable cell yield and IFN-y yield
When growth and production data are expressed in yield terms, they correspond to maximum
titres obtained in culture.
82

3- STATISTICAL ANALYSIS OF THE CULTURE MEDIUM
3.1- Introduction
A wide range of biological products is produced by recombinant DNA technology using
eukaryote or prokaryote host systems. In the last decade it has become clear that there are
several advantages in using animal cells as hosts instead of bacteria or yeast, despite the
perceived economical advantage of the latter systems. In general, animal cells have the ability
to secrete proteins in a correctly folded functional state and with the correct post-translational
modifications, such as glycosylation (Berman and Lasky, 1985; Bialy, 1987; Parekh et al.,
1989a). The optimisation of protein production in animal cell culture is an important objective
as the product yields obtained with these systems tend to be low. Process optimisation may
involve the study of many biochemical and physical parameters, including media formulation,
culture parameters and culture systems. The nutritional environment of the cell may
significantly alter the product yield, thus the manipulation of the medium components
constitutes a potent way of improving the productivity.
The media used for animal cell culture generally are very complex and the significance of
particular components for growth or product synthesis often is unknown. The basal media
manufactured by various companies, e.g., Minimum Essential Medium (MEM), Dulbecko's
Modified Essential Medium (DMEM), Roswell Park Memorial Institute (RPMI) medium
contain essentially a mixture of inorganic salts, amino acids, glucose and vitamins, varying in
the number and concentration of those nutrients. All these media have been empirically
developed over a number of years. Traditionally, the main supplements to these formulations
were bovine, foetal bovine or calf serum but now the use of more defmed serum-free medium
has become a more common method for the cultivation of animal cells, due to the
disadvantages presented by serum (discussed in section 1.3.1). A mammalian cell culture
83
medium is now usually composed of a basal formulation, such as one of those refered to
above, plus a protein rich-supplement usually including binding proteins, growth factors,
adhesion factors and hormones, lipids and/or lipid precursors and several trace elements, e.g.,
selenium (Barnes and Sato, 1980). Optimisation of nutrient formulation of serum-free medium
may be exploited to enhance culture performance, either in terms of cell growth and/or product
synthesis. The growth of sublines of CHO cells, including the parental CHO-KI, is relatively
easy to achieve in serum-free medium (Hamilton and Ham, 1977; Gasser et al., 1985), but
detailed studies of media to improve the productivity of recombinant proteins in CHO cells are
scarce. The cell line used in this study, a CHO 320 producing human recombinant IFN-y, has
been previously adapted to a serum-free medium (Hayter et al., 1989). The latter is based on
RPM! and supplemented with glutamine, bovine serum albumin (BSA), human transferrin,
bovine insulin, sodium pyruvate, alanine, putrescine, FeSO4, ZnSO4, Na2SeO3 and CuSO4.
Recently, Hata et a!. (1992) reported an improvement in CHO cell culture medium for the
production of human growth hormone by addition of N-acetylglucosamine, glutathione,
putrescine, succinic acid, choline chloride, i-inositol and iron to alpha MEM medium
supplemented with 1% dialysed foetal calf serum. In the present study, apart from N-
acetylgiucosamine and succinic acid, all the other components are already present in RPM! and
putrescine is added to the basal medium used. There is still scope for substantial work towards
the development of a defined serum-free CHO medium suitable for biological production
applications. The development of such formulations has to be done for each specific line, as
different CHO recombinants derived from a common parental strain vary significantly in terms
of their metabolic requirements, even under identical cultivation conditions (Jayme, 1991).
The quality of the product obtained in culture is another important aspect to consider when
analysing the cell culture system. !FN-y is a glycoprotein, and the product obtained in culture
is a mixture of three major variants: one form glycosylated at two sites (2N glycoform),
another glycosylated only at one site (IN glycoform) while another form is not glycosylated.
84

Changes in the proportion of these forms during batch cultures has been previously reported
(Curling et al., 1990), which could possibly be related to deterioration in the culture conditions
with time. The glycosylation patterns of JFN-y have been also shown to be affected by glucose
pulses in chemostat cultures (Hayter et al., 1992). Changes in culture conditions have been
shown to alter the glycosylation patterns of other proteins (see section 1.4.2), although studies
on changes throughout the culture are scarce.
The importance of serum-free medium components on cell growth and production of
recombinant IFN-y was investigated in this study. The complexity of the medium led to the
adoption of a statistical optimisation approach. The classical method of changing one medium
variable at a time in order to optimise performance is impracticable. Selecting the possible
significant variables is both time consuming and expensive, unless a logical basis for
minimising the effort while maximising the probability that important variables are identified
is employed. This need for efficient methods for screening large number of variables has led to
the adoption of statistical experimental designs. Greasham and Inamine (1986), Bull et a!.
(1990) and Leslie (1992) have described some of the existing statistical designs, while their
application to the formulation and improvement of culture media has been also discussed in
the former cases. Statistical methods have been applied to microbial culture optimisation (De
Meo et al., 1985; Staheli, 1987) but only more recently to the optimisation of animal cell
cultures e.g., optimisation of follicle stimulating hormone production by CHO cells (Gebert
and Gray, 1990) and optimisation of Factor Vifi expression by CHO cells (Ganne and Mignot,
1991). In both of the latter cases, significant improvements in production were achieved. A
fractional factorial experimental method has also been used for the identification of key
variables, and interactions between variables, affecting hybridoma cell growth and monoclonal
antibody production (Gaertner and Dhurjati, 1993). In this study, a statistical design based on
the Plackett-Burman (Plackett and Burman, 1946) procedure was chosen. This methodology
provides an efficient way of screening a large number of variables and identifying the most
85
important ones. Its usefulness has been earlier illustrated by a case history involving the
preparation of a new catalyst (Stowe and Mayer, 1966). It allows the investigation of up to N-I
variables with N experiments and designs of up to 100 experiments were proposed by the
authors. Greasham and Inamine (1986) recommend the use of this method when more than
five independent variables are to be investigated.
In this present research, 20 different variables, including low molecular weight nutrients such
as glucose and ammo acids and also protein supplements used in the serum-free medium, were
tested in only 24 experiments. The implementation of the Plackett-Burman statistical design
and its application to the optimisation of the cell culture media for CHO cell growth and IFN-y
production is exemplified. The effect of the outcome formulation on the glycosylation pattern
of IFN-y was also evaluated. Follow-up experiments were based on the identification of
important nutrient variables with the Plackett-Burman method, with a view to having better
understanding of cell behaviour and further improvements of cell culture performance.
3.2- CHO cell growth and IFN-y production in serum-free medium
The serum-free medium previously developed at the University of Kent for this particular cell
line was used as the basis for the optimisation studies. This medium was selected based on the
range of media available in the literature for culturing cells in serum-free media, where little
optimisation has been attempted. CHO cell growth and interferon-y production kinetics in this
medium were first characterised (Figure 3.1). Typically, cells reach maximum viable cell
concentrations of 8-9 x i 5 cells/mi after 100 hours. IFN-y is produced only during cell
growth phase, reaching concentrations of approximately 8000 lU/mi and maximum specific
production rates of approximately 200 IU/lO 6cells/h are usually obtained during exponential
growth of the cells. Very similar behaviour has been reported previously with these cells
86

(Hayter et a!., 1991a). In chemostat cultures IFN-T production rate also seemed to be a
function of cell specific growth rate (Hayter et a!., 1993), suggesting that production is growth
associated. However, this is not yet clear as production of IFN-y by non-proliferating cells has
also been reported (Hayter eta!., 1991 a).
These CHO 320 cells are sensitive to the culture conditions, and the quality of some of the
medium components, which may vary from batch to batch, namely proteins, can influence the
behaviour of the culture. In each set of experiments a positive control culture, grown under the
existent serum-free medium conditions, was included to compensate for any variability that
might occur. The results obtained in each set of experiments are related to this control culture,
unless otherwise indicated.
• VabIe cells
• Interreron
I0
8
00 50 100 150 200
Time (h)
Figure 3.1- Kinetics of CHO cell growth and IFN-y production in stirred batch culture.
87
3.3- Statistical screening of the medium components: the Plackett-Burman design
3.3.1- Experimental design
The Plackett-Burman design allows the investigation of up to N-i variables with N
experiments. In practice, all the experiments are carried out according to a design matrix,
which is based on the number of variables to be studied. The matrix applied to the present
study is shown in Table 3.1. Each row represents a different experiment and each column
represents a different variable. Three variables (E, 0 and X in Table 3.1) are designated as
"dummy variables", as they are not real variables and no change is made to them, but they are
used to estimate the experimental error. The number of variables under study is then reduced
to N-4. Each independent variable is tested at two levels, a high (+) and a low (-) level, which
in the present investigation means two different nutrient concentrations.
The following independent variables were selected for analysis: glucose, BSA, insulin,
transferrin, putrescine, sodium pyruvate and all of the amino acids present in the culture
medium. During the studies of CHO cell growth and IFN-y production, unlike all the other
components, BSA from different suppliers has been used. It is important, therefore, to point
out that the BSA used in the Plackett-Burman matrix experiments and that used to supplement
the base medium were not identical. The implication of the source of material on culture
performance is further discussed below. Effects of the amino acids in the major pathways were
tested independently (asparagine, aspartate, glutamate, glutamine, serine, glycine and alanine).
Arginine was also studied separately because its concentration in the medium is higher than
the other amino acids, and it is not extensively used during growth (Hayter et a!., i991a).
Methionine and cystine were also considered independently. The remaining amino acids were
tested in sub-groups according to their metabolic relationships, i.e., (a) tyrosine plus
phenylalanine, (b) threonine, valine plus isoleucine, (c) leucine, tryptophan plus lysine and (d)
88
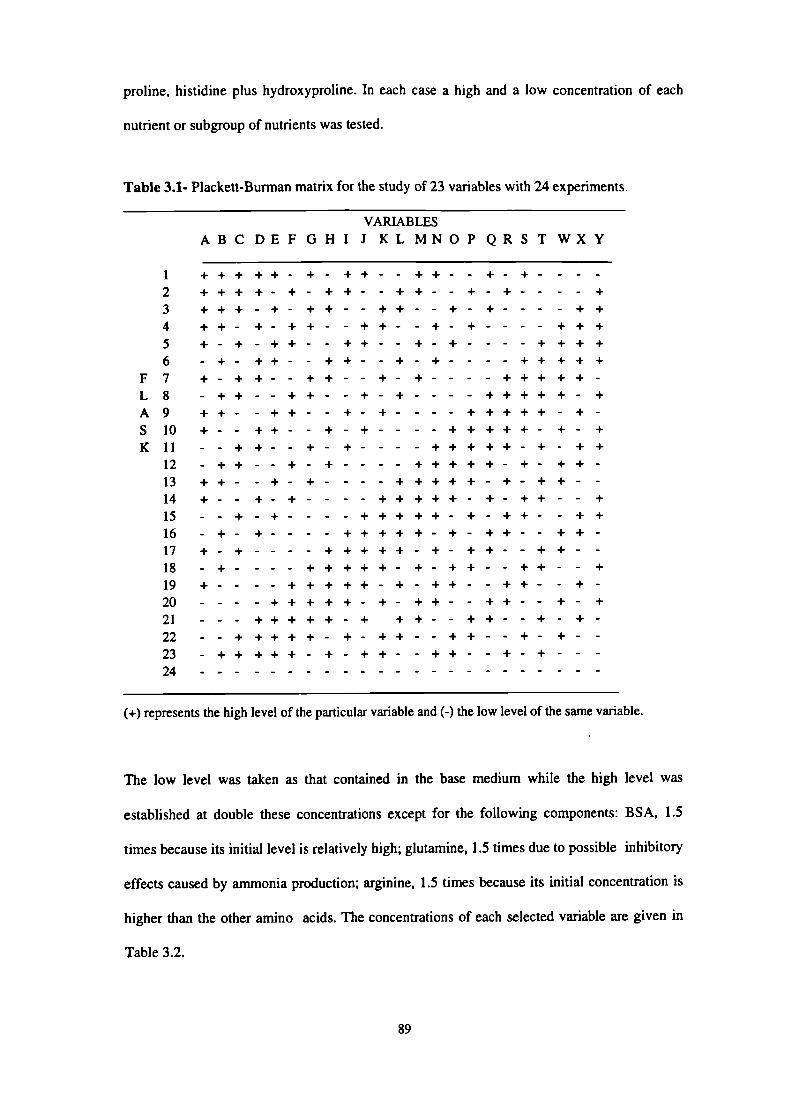
proline, histidine plus hydroxyproline. In each case a high and a low concentration of each
nutrient or subgroup of nutrients was tested.
Table 3.1- Plackett-Burman matrix for the study of 23 variables with 24 experiments.
VARIABLES
ABCDEFGHIJKLMNOPQRSTWXY
I2
34
5
6F7L8A9S 10Ku
12131415
161718192021222324
+++ ++- + - ++ - - ++- - +- +- -++++- +- ++- - ++- - +- +- - - - ++++-+- ++-- ++--+- +--- - ++++- +-++- -++- -+- +---- +++
- ++-- +-+- --- +- ++- - + +- - + - +- - - - ++ + + ++- ++- - ++- - +- +- - - --++--++- -+-+--- - +++++- +++- - ++ - - +- +- - - - + ++++ - + -+- - ++- - +- +- - - - +++++- +- +--++-- +- +- -- -+++++-+- ++- ++ - - +- +- - - - +++++- +- ++ -++- - +- + - - - - + +++ + - +- + + -+- - +- +- - - - +++++- +- ++ - - +- - + - +- - - - + ++ ++- + - ++- - + +- +- +- - - - +++++- +- ++- - ++ -+-+--- - +++++-+- ++--++- -
+++++- +-++--++- - +- - - +++++- +- ++- - ++- - + -
-+++++- +- ++- - ++-- +- +- - - +++++- + ++- - ++- - +- +---+++++- +- ++--++--+- +- --+++++- +-++- -++- -+-+- -
(+) represents the high level of the particular variable and (-) the low level of the same variable.
The low level was taken as that contained in the base medium while the high level was
established at double these concentrations except for the following components: BSA, 1.5
times because its initial level is relatively high; glutamine, 1.5 times due to possible inhibitory
effects caused by ammonia production; arginine, 1.5 times because its initial concentration is
higher than the other amino acids. The concentrations of each selected variable are given in
Table 3.2.
89

gil
5
0.005
0.005
mM
0.001
11
0.10
1.15
0.33
0.15
0.021
2
0.14
0.13
0.29
0.10
0.17/0.097/0.15
0. 13/0. 17/0.38
0.38/0.024/0.22
0.09/0.013
gil
7.5
0.01
0.01
mM
2
0.002
22
0.20
1.725
0.66
0.30
0.042
3
0.28
0.26
0.58
0.20
0.34/0.19/0.15
0.26/0.34/0.76
0.76/0.048/0.44
0.18/0.26
Table 3.2- Components under study and their corresponding concentrations.
Variable Low level
High level
A-BSA
B - Transferrin
C - Insulin
D - Sodium pyruvate
E - Dummy
F -Putrescine
G - Glucose
H - Alanine
1-Arginine
J - Asparagine
K - Aspartate
L - Cystine
M - Glutamine
N - Glutamate
0- Dummy
P - Glycine
Q - Serine
R - Methionine
S - ProlinelHistidinelllydroxyproline
T - Threonine/Valine/Jsoieucine
W - Leucinei'Fryptophan/Lysine
X - Dummy
Y - PhenylalaninefFyrosine
All the experiments were performed in shake-flasks in duplicate according to the design
matrix (Table 3.1). The parameters evaluated for each experiment were specific growth rate,
which was calculated from the linear part of the exponential growth curve, maximum viable
cell production and maximum IFN-y titre. The results as required by the statistical analysis are
90

shown in Table 3.3.
Table 3.3- Cell growth and IFN-y production data for Plackett-Burman analysis.
Experiment p Cell titre Interferon-y titre
(h-I)
(105 cells/mI)
(lU/mi)
I
2
3
4
5
6
7
8
9
10
11
12
13
14
15
16
17
18
19
20
21
22
23
24
0.022 ± 0.000
0.030 ± 0.002
0.025 ± 0.000
0.033 ± 0.001
0.024 ± 0.000
0.026± 0.001
0.023 ± 0.002
0.017± 0.000
0.030 ± 0.000
0.031 ± 0.001
0.030 ± 0.001
0.032± 0.001
0.03 1 ± 0.002
0.023 ± 0.000
0.030 ± 0.002
0.019± 0.001
0.022± 0.000
0.032± 0.001
0.025 ± 0.001
0.021 ± 0.001
0.03 2 ± 0.000
0.028 ± 0.001
0.023 ± 0.000
0.028 ± 0.001
8.9± 0.2
11.2± 0.3
9.7± 0.2
12.2± 0.4
9.0± 0.1
7.8± 0.4
9.0± 0.5
6.9± 0.2
11.6± 0.3
12.3± 0.1
11.2± 0.1
11.0± 0.1
10.8± 0.3
7.7± 0.4
11.9± 0.2
6.5± 0.2
6.1 ± 0.1
11.2± 0.3
9.6± 0.2
6.5± 0.3
9.0± 0.4
5.9± 0.3
7.8± 0.2
9.5± 0.4
9276± 340
8140± 620
8048± 786
12608± 108
8581± 850
7597± 675
10158± 705
6703± 365
8223± 438
12973± 565
8354± 435
6815± 288
11495± 500
11318± 620
10108± 370
6366± 400
4493± 210
7142± 250
11131± 625
6463± 475
6517± 305
6372± 385
6205± 745
7500± 620
IFN-y titres are the maximum titres achieved in culture, which corresponded to the same time
point in all the experiments.
91

In this study, experiment 24 corresponds to the control culture, the original formulation for the
serum-free medium. The results clearly show that both cell growth arid IFN-y production were
influenced by different components of the cell culture medium. In some experiments, there
was an increase of approximately 20-30% in cell titre (e.g., experiments 2, 4, 9, 10, 11, 15,
18), which also corresponded to higher initial specific growth rates. IFN-y production seemed
to be affected by different components, as not always the highest titres corresponded to the
highest cell titres (e.g., experiments 7, 14, 19) nor did higher cell numbers correspond to the
highest IFN-y titres (e.g., experiments 2, 9, 11, 12, 18). In some cases, significant increases in
IFN-y titres were obtained over the control culture (e.g, experiments 1, 4, 7, 10, 13, 14, 15).
The more pronounced reductions in JFN-y titre in relation to the control culture mostly
coincided with lower cell numbers (e.g., experiments 8, 16, 17, 20, 21, 22, 23). To draw any
conclusion on which components are responsible for this behaviour from this analysis alone
would be difficult, as there are several parameters changing at the same time. In order to
calculate the effect that each particular component has on each parameter, a statistical analysis
is applied to the results.
3.3.2- Experimental effects of the study variables
Statistical analyses were made to identify those medium variables that had a significant effect
on CHO cell growth and IFN-y production. First, the effect of each variable was determined as
the difference between the average value of the response for the 12 experiments at the high
level (+) and the average value for the 12 experiments at the low level (-):
Rat(+) Rat(-)EA = --------- (3.1)
12 12
where EA is the effect of the variabJe, and R is the measured response.
92
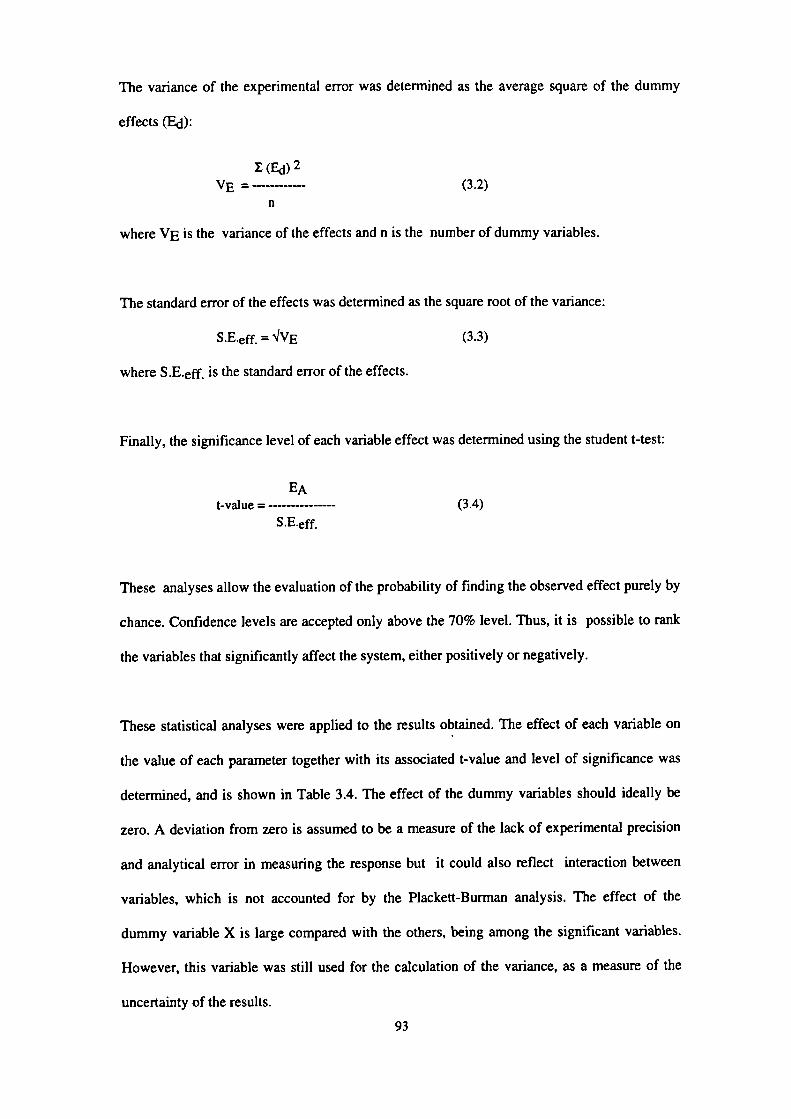
The variance of the experimental error was determined as the average square of the dummy
effects (Ed):
L (Ed)2VE =-
(3.2)n
where VE is the variance of the effects and n is the number of dummy variables.
The standard error of the effects was determined as the square root of the variance:
S.E.eff. = IVE (3.3)
where S.E.eff. is the standard error of the effects.
Finally, the significance level of each variable effect was determined using the student t-test:
t-value = (3.4)S .E.eff.
These analyses allow the evaluation of the probability of finding the observed effect purely by
chance. Confidence levels are accepted only above the 70% level. Thus, it is possible to rank
the variables that significantly affect the system, either positively or negatively.
These statistical analyses were applied to the results obtained. The effect of each variable on
the value of each parameter together with its associated t-value and level of significance was
determined, and is shown in Table 3.4. The effect of the dummy variables should ideally be
zero. A deviation from zero is assumed to be a measure of the lack of experimental precision
and analytical error in measuring the response but it could also reflect interaction between
variables, which is not accounted for by the Plackett-Burman analysis. The effect of the
dummy variable X is large compared with the others, being among the significant variables.
However, this variable was still used for the calculation of the variance, as a measure of the
uncertainty of the results.
93
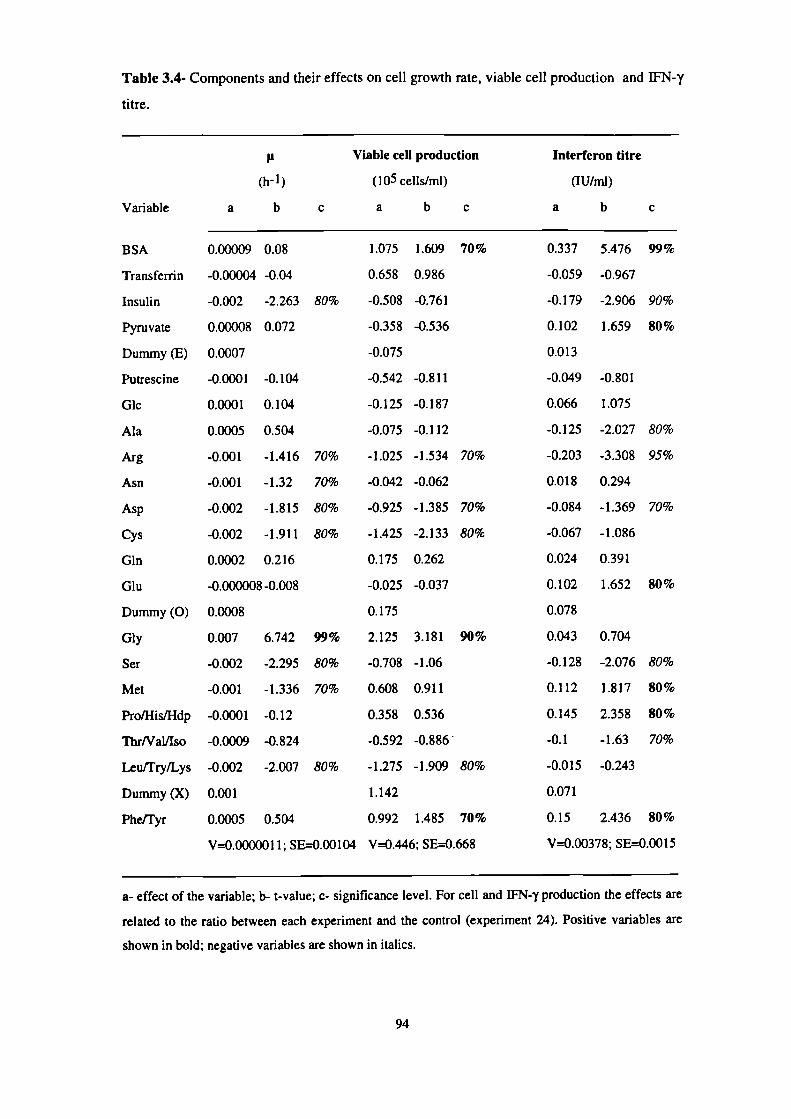
Variable
BSA
Transferrin
Insulin
Pyruvate
Dummy (E)
Putrescine
GIc
Ala
Mg
Asn
Asp
Cys
Gin
Giu
Dummy (0)
Gly
Ser
Met
Pro/HislHdp
Thr/Vai/Iso
LeufFry/Lys
Dummy (X)
PheiTyr
Table 3.4- Components and their effects on cell growth rate, viable cell production and WN-'y
titre.
p Viable cell production
(h- I ) (105 cells/mi)
a b c a b c
0.00009 0.08 1.075 1.609 70%
-0.00004 -0.04 0.658 0.986
-0.002 -2.263 80% -0.508 -0.76 1
0.00008 0.072 -0.358 -0.536
0.0007 -0.075
-0.0001 -0.104 -0.542 -0.811
0.0001 0.104 -0.125 -0.187
0.0005 0.504 -0.075 -0.112
-0.001 -1.416 70% -1.025 -1.534 70%
-0.001 -1.32 70% -0.042 -0.062
-0.002 -1.815 80% -0.925 -1.385 70%
-0.002 -1.911 80% -1.425 -2.133 80%
0.0002 0.216 0.175 0.262
-0.000008 -0.008 -0.025 -0.037
0.0008 0.175
0.007 6.742 99% 2.125 3.181 90%
-0.002 -2.295 80% -0.708 -1.06
-0.001 -1.336 70% 0.608 0.911
-0.0001 -0.12 0.358 0.536
-0.0009 -0.824 -0.592 -0.886
-0.002 -2.007 80% -1.275 -1.909 80%
0.001 1.142
0.0005 0.504 0.992 1.485 70%
V=0.00000lI; SE=0.00104 V=0.446; SE=0.668
Interferon titre
(lU/mi)
a b c
0.337 5.476 99%
-0.059 -0.967
-0.179 -2.906 90%
0.102 1.659 80%
0.013
-0.049 -0.801
0.066 1.075
-0.125 -2.027 80%
-0.203 -3.308 95%
0.018 0.294
-0.084 -1.369 70%
-0.067 -1.086
0.024 0.391
0.102 1.652 80%
0.078
0.043 0.704
-0.128 -2.076 80%
0.112 1.817 80%
0.145 2.358 80%
-0.1 -1.63 70%
-0.015 -0.243
0.071
0.15 2.436 80%
V=0.00378; SE=0.0015
a- effect of the variable; b- t-value; c- significance level. For cell and IFN-y production the effects are
related to the ratio between each experiment and the control (experiment 24). Positive variables are
shown in bold; negative variables are shown in italics.
94
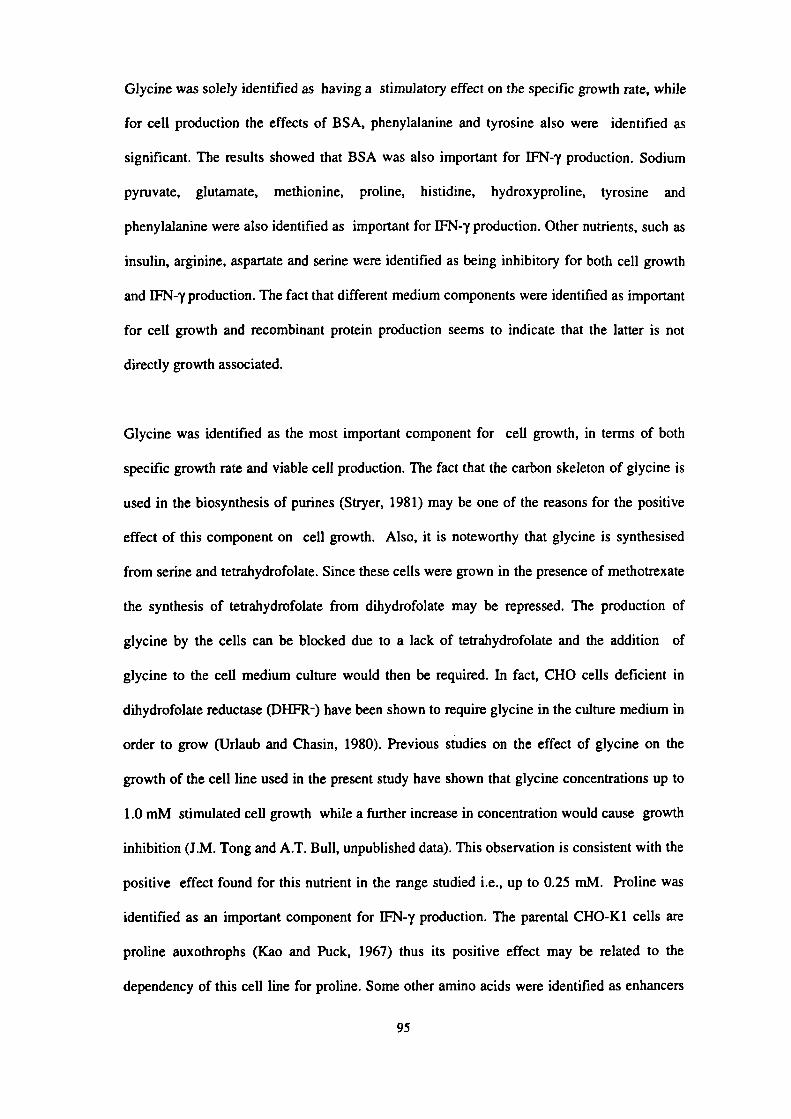
Glycine was solely identified as having a stimulatory effect on the specific growth rate, while
for cell production the effects of BSA, phenylalanine and tyrosine also were identified as
significant. The results showed that BSA was also important for IFN-y production. Sodium
pyruvate, glutamate, methionine, proline, histidine, hydroxyproline, tyrosine and
phenylalanine were also identified as important for IFN-y production. Other nutrients, such as
insulin, arginine, aspartate and serine were identified as being inhibitory for both cell growth
and IFN-y production. The fact that different medium components were identified as important
for cell growth and recombinant protein production seems to indicate that the latter is not
directly growth associated.
Glycine was identified as the most important component for cell growth, in terms of both
specific growth rate and viable cell production. The fact that the carbon skeleton of glycine is
used in the biosynthesis of purines (Stryer, 1981) may be one of the reasons for the positive
effect of this component on cell growth. Also, it is noteworthy that glycine is synthesised
from serine and tetrahydrofolate. Since these cells were grown in the presence of methotrexate
the synthesis of tetrahydrofolate from dihydrofolate may be repressed. The production of
glycine by the cells can be blocked due to a lack of tetraliydrofolate and the addition of
glycine to the cell medium culture would then be required. In fact, CHO cells deficient in
dihydrofolate reductase (DHFR-) have been shown to require glycine in the culture medium in
order to grow (Urlaub and Chasm, 1980). Previous studies on the effect of glycine on the
growth of the cell line used in the present study have shown that glycine concentrations up to
1.0 mM stimulated cell growth while a further increase in concentration would cause growth
inhibition (J.M. Tong and A.T. Bull, unpublished data). This observation is consistent with the
positive effect found for this nutrient in the range studied i.e., up to 0.25 mM. Proline was
identified as an important component for IFN-y production. The parental CHO-Ki cells are
proline auxothrophs (Kao and Puck, 1967) thus its positive effect may be related to the
dependency of this cell line for prolme. Some other amino acids were identified as enhancers
95
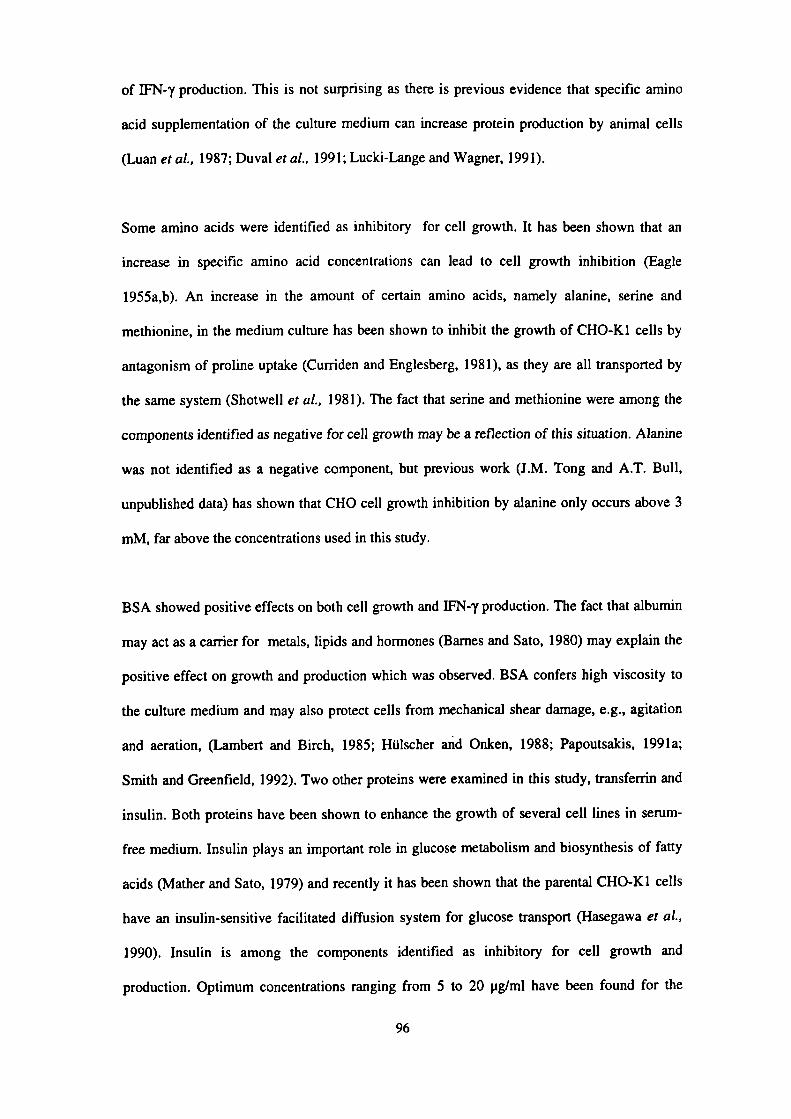
of IFN-y production. This is not surprising as there is previous evidence that specific amino
acid supplementation of the culture medium can increase protein production by animal cells
(Luan eta!., 1987; Duval et al., 1991; Lucki-Lange and Wagner, 1991).
Some amino acids were identified as inhibitory for cell growth. It has been shown that an
increase in specific amino acid concentrations can lead to cell growth inhibition (Eagle
1955a,b). An increase in the amount of certain amino acids, namely alanine, serine and
methionine, in the medium culture has been shown to inhibit the growth of CHO-Ki cells by
antagonism of proline uptake (Curriden and Englesberg, 1981), as they are all transported by
the same system (Shotwell et a!., 1981). The fact that serine and methionine were among the
components identified as negative for cell growth may be a reflection of this situation. Alanine
was not identified as a negative component, but previous work (J.M. Tong and A.T. Bull,
unpublished data) has shown that CHO cell growth inhibition by alanine only occurs above 3
mM, far above the concentrations used in this study.
BSA showed positive effects on both cell growth and IFN-y production. The fact that albumin
may act as a carrier for metals, lipids and hormones (Barnes and Sato, 1980) may explain the
positive effect on growth and production which was observed. BSA confers high viscosity to
the culture medium and may also protect cells from mechanical shear damage, e.g., agitation
and aeration, (Lambert and Birch, 1985; Hülscher and Oaken, 1988; Papoutsakis, 1991a;
Smith and Greenfield, 1992). Two other proteins were examined in this study, transferrin and
insulin. Both proteins have been shown to enhance the growth of several cell lines in serum-
free medium. Insulin plays an important role in glucose metabolism and biosynthesis of fatty
acids (Mather and Sato, 1979) and recently it has been shown that the parental CHO-Ki cells
have an insulin-sensitive facilitated diffusion system for glucose transport (Hasegawa et a!.,
1990). Insulin is among the components identified as inhibitory for cell growth and
production. Optimum concentrations ranging from 5 to 20 pg/mi have been found for the
96
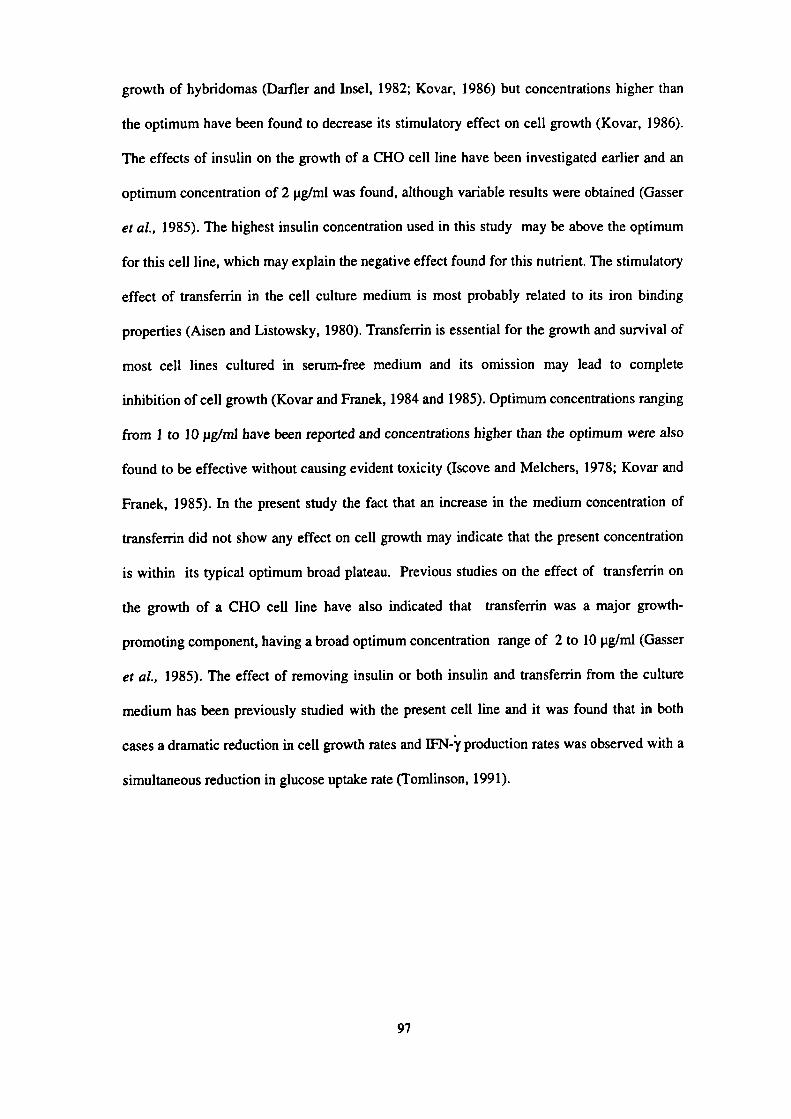
growth of hybridomas (Darfier and Insel, 1982; Kovar, 1986) but concentrations higher than
the optimum have been found to decrease its stimulatory effect on cell growth (Kovar, 1986).
The effects of insulin on the growth of a CHO cell line have been investigated earlier and an
optimum concentration of 2 ig/ml was found, although variable results were obtained (Gasser
et a!., 1985). The highest insulin concentration used in this study may be above the optimum
for this cell line, which may explain the negative effect found for this nutrient. The stimulatory
effect of transferrin in the cell culture medium is most probably related to its iron binding
properties (Aisen and Listowsky, 1980). Transferrin is essential for the growth and survival of
most cell lines cultured in serum-free medium and its omission may lead to complete
inhibition of cell growth (Kovar and Franek, 1984 and 1985). Optimum concentrations ranging
from I to 10 jug/mI have been reported and concentrations higher than the optimum were also
found to be effective without causing evident toxicity (Iscove and Meichers, 1978; Kovar and
Franek, 1985). In the present study the fact that an increase in the medium concentration of
transferrin did not show any effect on cell growth may indicate that the present concentration
is within its typical optimum broad plateau. Previous studies on the effect of transferrin on
the growth of a CHO cell line have also indicated that transferrin was a major growth-
promoting component, having a broad optimum concentration range of 2 to 10 pg/mI (Gasser
et al., 1985). The effect of removing insulin or both insulin and transferrin from the culture
medium has been previously studied with the present cell line and it was found that in both
cases a dramatic reduction in cell growth rates and IFN-y production rates was observed with a
simultaneous reduction in glucose uptake rate (Tomlinson, 1991).
97

3.4- Cluster effect of the positive and negative groups of variables
3.4.1- Cell growth and IFN-y production: titre and product quality
In order to assess the results obtained, the common positive variables found with the Plackett-
Burman design were grouped together and their cluster effect was tested in batch cultures. A
similar procedure was followed for the negative variables. The components included in the
positive group were glycine, BSA, sodium pyruvate, glutamate, and the groups
phenylalanine/tyrosine and proline/histidine/hydroxyproline. The concentrations of these
components were the corresponding high levels for the Plackett-Burman matrix. Insulin,
arginine, alanine, asparagine, cystine, serine, and leucine/tryptophan/lysine were included in
the negative group. A control experiment with all the variables at the normal level was run in
parallel. Cell growth rate, cell production and IFN-y titre were evaluated for each set of
experiments (Table 3.5).
Table 3.5- Effects of the positive and negative variables on CHO cell growth and IFN-y
production.
Specific growth rate
(h-I)
Viable cell production
(105 cells/mI)
IFN-ytitre
(lU/mi)
Positive
Variables
(+ II)
0.030 ± 0.002
(+43%)
11.3± 0.2
(+41%)
9277 ± 1543
(+45%)
Control
(I)
0.021± 0.001
8±0.5
6408± 363
Negative
Variables(-II)
0.018± 0.001
(-14%)
7.1± 0.3
(-11%)
5878± 367
(-8%)
the control in these experiments signifies values obtained with the original growth medium; the values
in parenthesis indicate percentage increase/decrease over the control cultures. Experiments were made
in quadruplicate.
98

An increase in the level of the positive variables led to an improvement of about 40-43% in
cell growth and 45% in the production of IFN-y. An increase in the concentration of the
negative nutritional variables did not produce an overall effect as marked as those of the
positive variables on the same parameters, but an inhibitory effect was noticed. The results
indicated decreases of 8 to 14% for the three parameters. Based on a significance t-test, the
effects of both positive and negative variables were found to be statistically different from the
control experiment (significance levels varying from 95 to 100% for positive effects and from
80 to 95% for negative effects). The statistical design technique used in this study was shown
to be a very valuable one for process optimisation, as it was shown that the identification of
important variables in the process under study could be made without using a factorial
experimental procedure. In fact, a significant improvement of both cell growth and IFN-y
production was achieved based on the variables identified with the Plackett-Burman design.
An improved formulation was obtained, which was based only on parameters of cell growth
and productivity but not product quality. The possibility that the change in the culture
environment could affect the post-translational modification of the product was then
investigated. The glycosylation patterns of the product obtained from control cultures and
cultures supplemented with the positive variables were analysed. The profiles obtained were
very similar (Figure 3.2). A gradual decrease in the proportion of the glycoform occupied at
both sites (2N-glycoform), from ca. 70% at 40 hours to Ca. 50% at 100 hours, with a
simultaneous increase in the glycoform occupied at one site only (1N-glycoform), from ca.
30% at 30 hours to ca. 45% at 100 hours, was observed throughout the culture. In cultures
containing the positive group of variables, a similar pattern was observed for the glycosylated
forms, and the differences detected were too small to relate them to any change in the culture
environment. In both situations, the proportion of non-glycosylated (ON-glycoform) form
remained constant until late in culture, ca. 130 h, representing about 5% of the total product.
Changes in the glycosylation patterns of IFN-y, produced by the same CHO cells, during the
99

course of a culture have been previously noticed (Curling er al., 1990), namely a decrease in
the proportion of the 2N glycoform. Changes in the glycosylation of a monoclonal antibody by
hybridomas throughout a fed-batch culture has been also reported (Robinson et a!., 1993).
These authors found a greater percentage of antibody with incomplete, mannose terminated
glycoforms at the H-chain glycosylation site at late times in the fed-batch culture.
—0-- •Na
£ iNControl (1) _______• 2N
. 401
811
. I
*
Time (I,)
bPositive V.rlthIes (+11)
40
60J
1.;. I
*
0I
0 50 ISO
Time (b)
Figure 3.2- Glycosylation patterns of IFN-y obtained from a) control cultures and b) cultures
containing increased concentrations of the positive group of variables.
100

3.4.2- Analysis of the culture medium
In order to investigate the extent of nutrient depletion in the three different cultures (Control-I,
Positive +11 and Negative -II), glucose and amino acid analysis were carried out. The positive
effect observed could be due to overcoming any nutrient limitation. It was also possible that
changes in cell metabolism were occurring when the concentration of the positive or negative
group was increased in the culture medium. This could provide part of the explanation for the
stimulating effect of the positive group of variables.
Cell growth curves for the original medium and medium containing increased concentrations
of the positive (+11) and negative (-II) group of variables are presented in Figure 3.3. The
metabolism of glucose and amino acids during the culture for the same cultures is shown in
Figure 3.4a-i. Cystine, proline and hydroxyproline are not detected by the HPLC assay and no
data are available for these nutrients; data for histidine are not presented, as the peak for this
amino acid is not very well separated from other components. Here, the interest is in
examining the results in tenns of nutrient depletion and differences between the cultures. A
more detailed examination of the amino acid metabolism is described later in Chapter 4. The
results are to be compared with the control culture (I), i.e., the original medium. Analysis of
the control culture showed that only glutamine and glucose were exhausted from culture and
the depletion of glutamine coincided with the onset of the stationary phase of the cells (Figure
3.4a,b). Asparagine was also consumed rapidly by the cells (Figure 3.4c). The essential amino
acids valine, isoleucine, phenylalanine, methionine, leucine, lysine, tyrosine and threonine
were utilised throughout the cultures, but were not exhausted at the end of the culture (Figure
3.4d-g). Arginine levels remained constant during the culture (Figure 3.4b). The consumption
patterns for glycine and serine (Figure 3.4h) seemed to be closely related. While there was an
initial increase in serine and a decrease in glycine levels, this pattern was reversed later in
culture, ca. 75 h, coinciding with glutamine depletion. There was a net production of alanine
101

(Figure 3.41) and although a net production of glutamate (F igure 3.4i) was also noticed in the
early stages of the culture, its concentration slightly decreased as glutamine was depleted from
culture. The patterns obtained for supplemented cultures were similar to those found for the
control cultures. A few differences were noticed in terms of net production or consumption,
but these were related to the higher or lower level of the particular nutrient in the beginning of
the culture (serine, glycine, arginine, asparagine, tyrosine, phenylalanine, leucine, lysine).
Only glutamate (Figure 3.4i) showed a higher net accumulation in negative cultures, as
compared to the control containing the same initial concentration. In none of the cultures did
the levels of glycine and alanine reach the inhibitory levels referred in the section above.
Differences in glucose and glutamine consumption were seen in both supplemented cultures,
+11 and -II. The initial specific consumption rates for these components in each of the cultures
is shown in Table 3.6. Lower values were obtained for cultures supplemented with the positive
group of variables and higher values for cultures supplemented with the negative group of
variables. In the former case, this seems to indicate a more efficient utilisation of glucose and
glutamine when the concentration of the positive nutrients is increased in the culture medium,
which could account for the improved yield of cells on those nutrients which may become
limiting. It is most likely that cells respond differently to different culture environments.
12
130
w $C.
I.5
S
.! 2
Ii .
0 100 130
TI.. (hi
Figure 3.3- Cell growth in control batch cultures (I), and cultures containing the positive
group of nutrients (+11) or negative group of nutrients (-II).
102
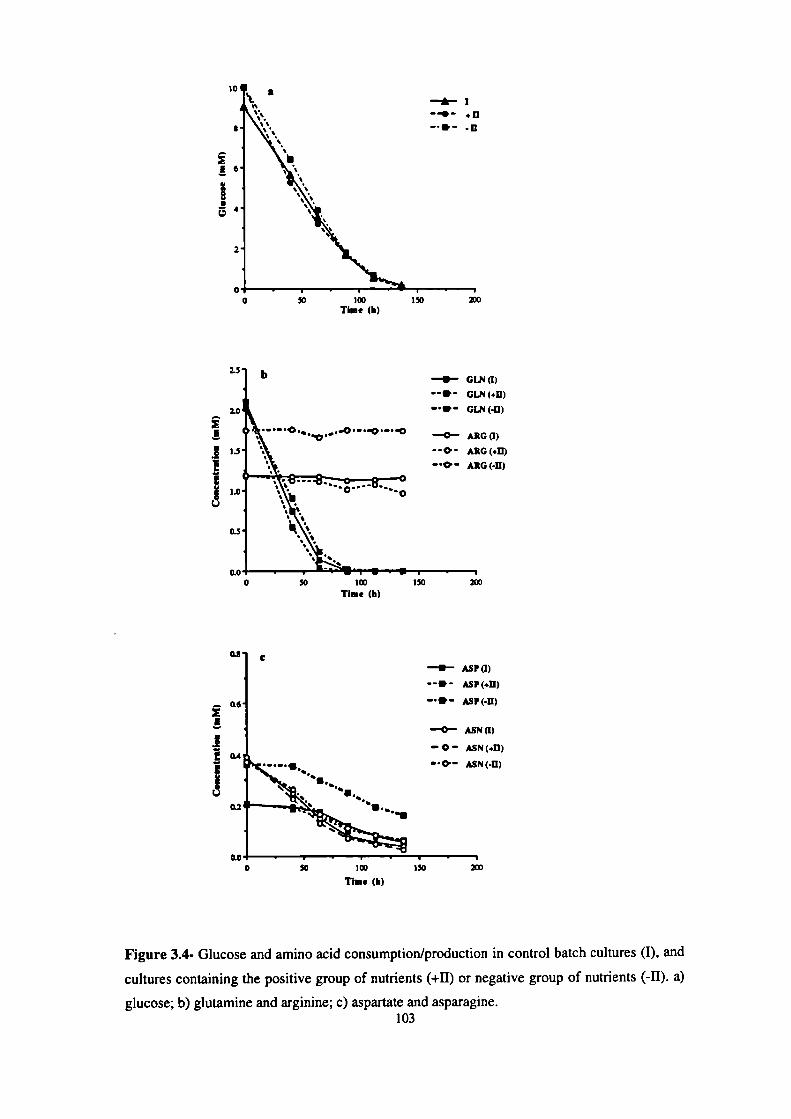
-U- GLN(I)U GLZ(+II)U GLN(.II)
-0- ARG(I)--o- *G(+fl)
0- ARG(-fl)
I
l.0
0.5
10
S
E6
2
00
I
50 100 150Tim. (h)
2.5 i
0 50 100 150 200Tim. (h)
C
0.6
I
I0.4
.
0.2.-U
-U- ASP(I)
--UP - ASP(,il)
-••- ASP&II)
-0- ASN(I)
-0- ASN(.fl)
O ASN(-I1)
0.0,0 50
ISOTi.. (h)
Figure 3.4- Glucose and amino acid consumption/production in control batch cultures (I), and
cultures containing the positive group of nutrients (+11) or negative group of nutrients (-H). a)
glucose; b) glutamine and arginine; c) aspartate and asparagine.103

e—0— PHE(I)
0.8 d—•0— ILE (I)
- -o - P1W (+11)--0- ILE (+11)
-0- PilE (-II)- . 0- ILE(-ll)— 0.6
0.6
-- 'IAL (I)—U— MET (I)--a- VAL(+D)--s- MET+IIj
• -U- VAL(-fl)-U- MET(-II)
0.2--o---- ---------
0.2
.-0 100 0
Time (Ii)Time (h)
I,0.8 g0.8
—U— LEU(I)
U LEU(,II)
U LEU(-II)0.60.6
b —0— LYS(I)
O. --0- LYS(+1T) ! 0.4
' ::
i .
- 0- LYS(U)
0.2 ___
—0— TYR(I)
--0- TYR(.II)
0 TYR(.II)
—U— THR(I)
TIIR(+II)
- • U- ThR(-U)
0•000.0-...-.
Time (h) Time (b)
Figure 3.4- Contd. d) isoleucine and valine; e) phenylalanine and methionine; f) leucine and
lysine; g) tyrosme and threonine.
104

14
1.2
1.0
E
0.8
e 0.6
0.4
0.2
ALA (I)
ALA (+11)
ALA (-II)
GLU (I)
GLU (+11)GLU (-II)
0.8 1 h
0.6
E
0
i- 0.4
V
L)
0.2
._._u.#.# •S•s•s.
/•--o--- --d cf-
—•-- SER(I)
- - .U-- SER(+I1)
-"U- • SER(-H)
—0— GLY(I)
-- •0-- GLY(+ll)
-. 0- • GLY (-II)
0.0 -t
0
50 100 150
200
Time (h)
0.0 I -
0 50 100 150 200
Time (h)
Figure 3.4- Contd. h) serine and glycine; i) alanine and glutamate.
105

Table 3.6- Initial consumption rates of glucose and glutamine in batch control cultures (1)
and batch cultures containing the positive (+11) or negative (-II) groups of variables.
Control Positive Negative
variables variables
(I) (+11) (-II)
Glutamine 75.6 56.2 82.1
nmol/1 O6cells/h
Glucose 0.220 0.187 0.270
pmolIl O6cells/h
Values determined from the exponential growth phase of the cells.
Ammonia and lactate are two major end-products of cell metabolism, arising mainly from
glutamine and glucose metabolism respectively. Both were monitored in these cultures and
similar final titres were found (Table 3.7); the accumulation of ammonia and lactate attained
the same levels in culture. The final concentrations achieved are not inhibitory to the system as
previous studies have shown that these cells were not inhibited by ammonia concentrations of
up to 2 mM and lactate concentrations of up to 17.5 mM (Hayter eta!., 1991a).
Table 3.7- Accumulation of lactate and ammonia in batch control cultures (I) and
batch cultures containing the positive (+11) or negative (-Il) groups of variables.
Control Positive Negative
variables variables
(I) (+11) (-H)
Ammonia (mM) 1.72
1.68
1.74
Lactate (mM) 14.1
13.1
13.9
Maximum titres in culture are shown.
106

3.4.3- The independent effect of BSA
BSA was identified as one of the most influential components in the culture medium. It is a
very poorly defined component and also an expensive one, and an increase in its concentration
is not desirable. In order to determine the actual contribution of BSA to CHO cell growth and
IFN-y production the stimulatory variables were further divided into two groups: (1) the
amino acids plus sodium pyruvate group and (2) BSA, and their separate effects were
determined (Table 3.8).
Table 3.8- Independent effect of the two positive group variables (amino acids plus pyruvate,
and BSA) on CHO cell growth and IFN-y production.
Control A
B
A+B
(I) (Il-A)
(fl-B)
(II)
Specific growth rate
(h- 1)
Viable cell production
(10 5 cells/ ml)
IFN-y titre
(lU/mi)
0.022 ± 0.001 0.031 ± 0.001
(41)
8.6± 0.3 12.2± 0.2
(42)
7775± 310 8495± 420
(10)
0.027 ± 0.001
(23)
11.2± 0.5
(30)
9213± 350
(18)
0.032 ± 0.001
(45)
12.6± 0.2
(47)
9915± 390
(28)
11-A. supplementation with amino acids plus sodium pyruvate. H-B. supplementation with BSA.
The values in parenthesis indicate percentage increases in the measured parameters above the control
culture (I).
The results showed that the positive effect found for the amino acids and sodium pyruvate
group on cell growth was independent of the BSA concentration (Table 3.8) but BSA alone
also caused a significant but not so pronounced positive effect. In terms of IFN-y production, a
more pronounced effect was achieved if both groups were increased in the medium, and BSA
alone was found to be more effective than the other positive group. This reinforced the
107
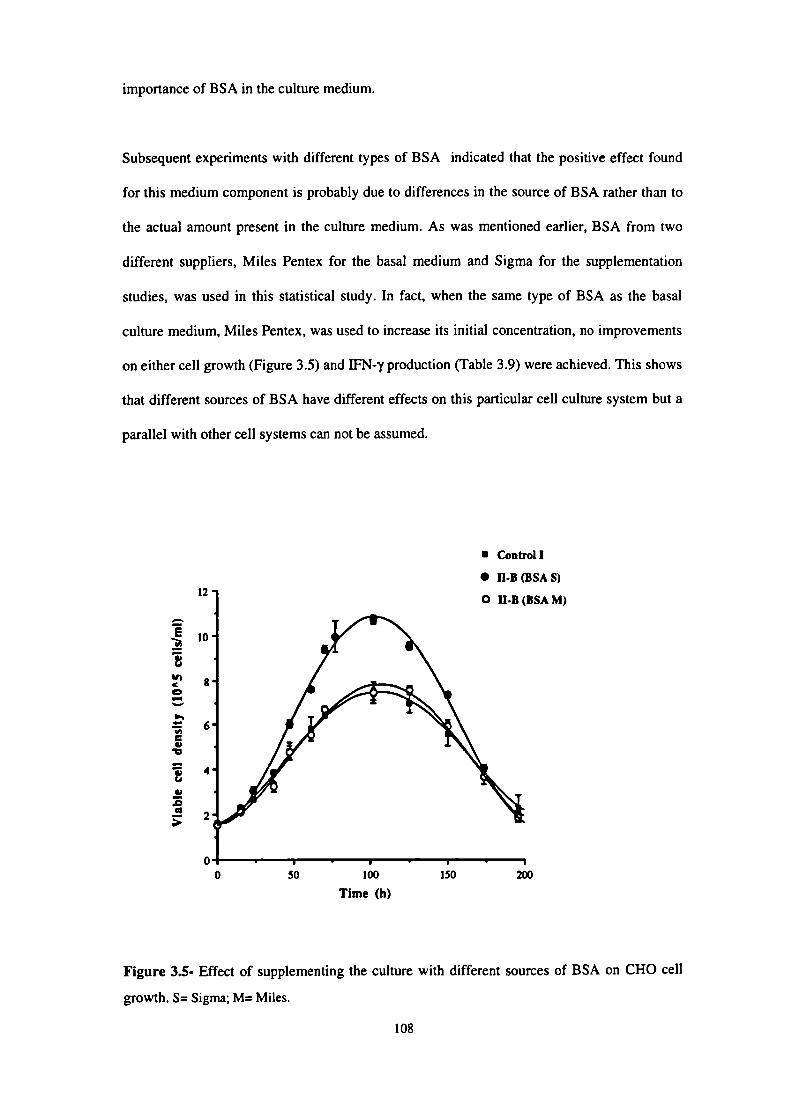
• Controll
• II .B (BSA S)
BSAM)12
E
8
6
importance of BSA in the culture medium.
Subsequent experiments with different types of BSA indicated that the positive effect found
for this medium component is probably due to differences in the source of BSA rather than to
the actual amount present in the culture medium. As was mentioned earlier, BSA from two
different suppliers, Miles Pentex for the basal medium and Sigma for the supplementation
studies, was used in this statistical study. In fact, when the same type of BSA as the basal
culture medium, Miles Pentex, was used to increase its initial concentration, no improvements
on either cell growth (Figure 3.5) and IFN-y production (Table 3.9) were achieved. This shows
that different sources of BSA have different effects on this particular cell culture system but a
parallel with other cell systems can not be assumed.
o I
o 50 100 150 200
Time (h)
Figure 35- Effect of supplementing the culture with different sources of BSA on CHO cell
growth. S= Sigma; M= Miles.
108
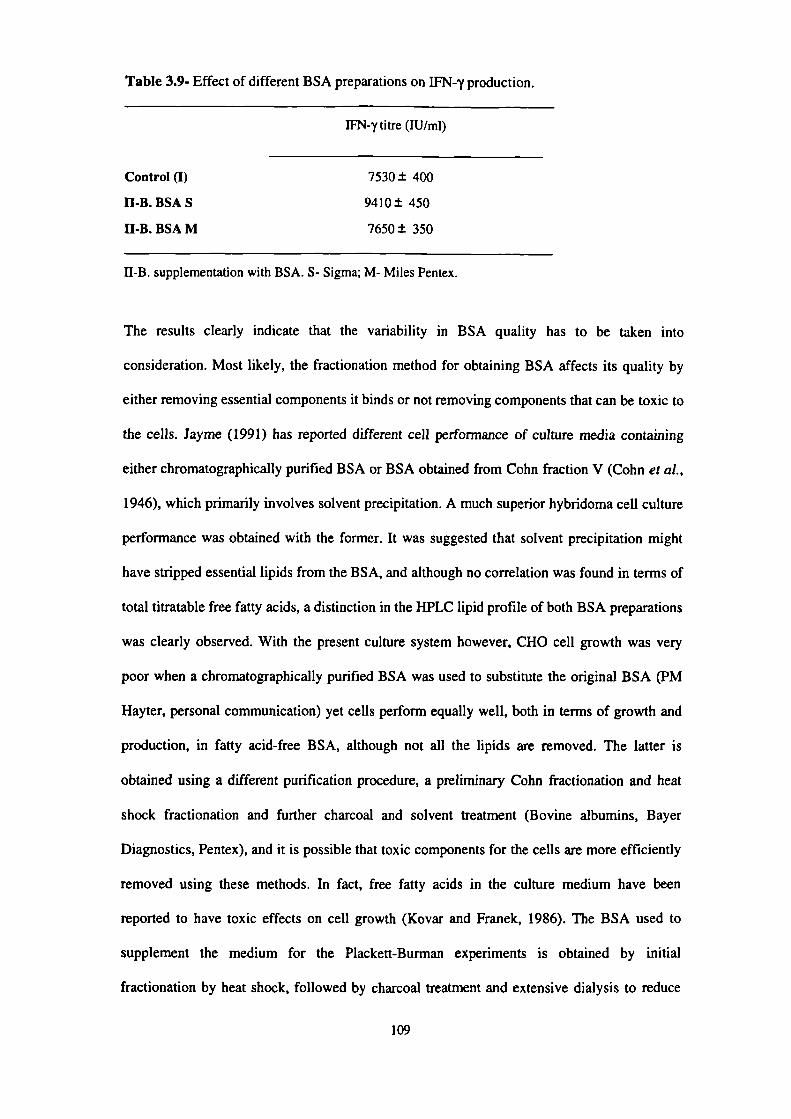
Table 3.9- Effect of different BSA preparations on IFN-y production.
IFN-y titre (lU/mi)
Control (I) 7530 ± 400
11-B. BSAS 9410± 450
11-B. BSA M 7650 ± 350
11-B. supplementation with BSA. S- Sigma; M- Miles Pentex.
The results clearly indicate that the variability in BSA quality has to be taken into
consideration. Most likely, the fractionation method for obtaining BSA affects its quality by
either removing essential components it binds or not removing components that can be toxic to
the cells. Jayme (1991) has reported different cell performance of culture media containing
either chromatographically purified BSA or BSA obtained from Cohn fraction V (Cohn et a!.,
1946), which primarily involves solvent precipitation. A much superior hybridoma cell culture
performance was obtained with the former. It was suggested that solvent precipitation might
have stripped essential lipids from the BSA, and although no correlation was found in terms of
total titratable free fatty acids, a distinction in the HPLC lipid profile of both BSA preparations
was clearly observed. With the present culture system however, CHO cell growth was very
poor when a chromatographically purified BSA was used to substitute the original BSA (PM
Hayter, personal communication) yet cells perform equally well, both in terms of growth and
production, in fatty acid-free BSA, although not all the lipids are removed. The latter is
obtained using a different purification procedure, a preliminary Cohn fractionation and heat
shock fractionation and further charcoal and solvent treatment (Bovine albumins, Bayer
Diagnostics, Pentex), and it is possible that toxic components for the cells are more efficiently
removed using these methods. In fact, free fatty acids in the culture medium have been
reported to have toxic effects on cell growth (Kovar and Franek, 1986). The BSA used to
supplement the medium for the Plackett-Burman experiments is obtained by initial
fractionation by heat shock, followed by charcoal treatment and extensive dialysis to reduce
109

low molecular weight substances (Sigma). The original BSA used in the culture medium is
purified using a mixture of two methods, Cohn fractionation and heat shock fractionation, with
no further treatment (Bovine albumins, Bayer Diagnostics, Pentex). Thus, since different
purification methods are employed, the quality of these BSA preparations may be very
different, and CHO cells appear to behave in accordance to the purification employed. Also,
the level of endotoxins of these preparations is not controlled, and varies considerably from
batch to batch, and this can also be problematic for cell growth.
Based on these considerations, the role of BSA in the culture medium seemed to require a
more detailed investigation (Chapter 5), and was therefore excluded from the positive group of
variables.
3.5 - The stimulating effect of the positive variables on CHO cell growth
Nutrient analysis provided a possible explanation for the stimulating effect of the positive
group of variables as related to a change in glucose and glutamine metabolism, and the effect
did not seem to be due to the replenishment of exhausted nutrients. Further studies were
carried out in order to elucidate the mechanism behind the stimulating effect.
3.5.1 - Effect of methotrexate on CHO cell growth
From the statistical analysis, glycine was the component that had the most significant effect on
cell growth. The use of the carbon skeleton of glycine in the biosynthesis of purines was one
of the possible explanations for its positive effect on cell growth. A conditional factor could be
related to this: since the cells were grown in the presence of methotrexate (MTX), it was
possible that the synthesis of glycine was inhibited. Figure 3.6 shows the metabolic pathway
for glycine synthesis.
110
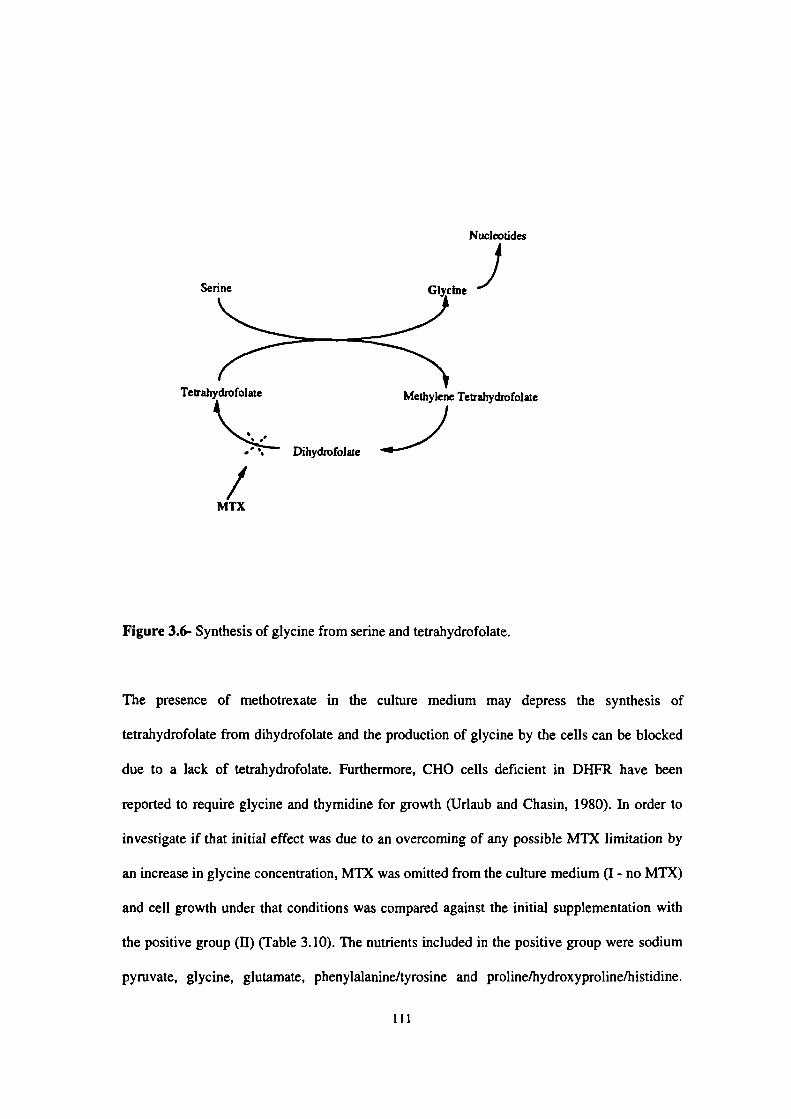
Nucleotides
I
irahydrofo1ate
/MIX
Figure 3.6- Synthesis of glycine from serine and tetrahydrofolate.
The presence of methotrexate in the culture medium may depress the synthesis of
tetrahydrofolate from dihydrofolate and the production of glycine by the cells can be blocked
due to a lack of tetrahydrofolate. Furthermore, CHO cells deficient in DHFR have been
reported to require glycine and thymidine for growth (Urlaub and Chasm, 1980). In order to
investigate if that initial effect was due to an overcoming of any possible MTX limitation by
an increase in glycine concentration, M1'X was omitted from the culture medium (I - no MTX)
and cell growth under that conditions was compared against the initial supplementation with
the positive group (II) (Table 3.10). The nutrients included in the positive group were sodium
pyruvate, glycine, glutamate, phenylalanine/tyrosine and proline/hydroxyproline/histidine.
Ill
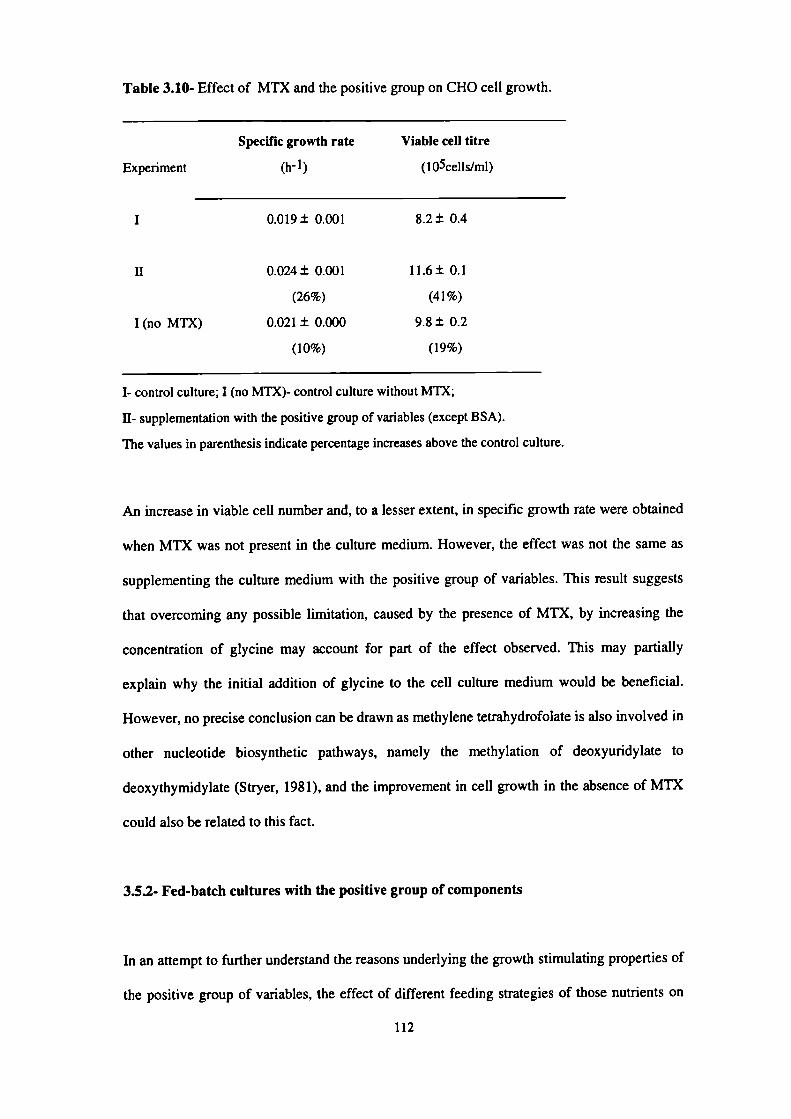
Table 3.10- Effect of M1'X and the positive group on CHO cell growth.
Experiment
I
H
I (no MTX)
Specific growth rate
(h-i)
0.019± 0.001
0.024 ± 0.001
(26%)
0.021 ± 0.000
(10%)
Viable cell titre
(1 O5cells/ml)
8.2± 0.4
11.6± 0.1
(4 1%)
9.8± 0.2
(19%)
I- control culture; I (no MTX)- control culture without MTX;
H- supplementation with the positive group of variables (except BSA).
The values in parenthesis indicate percentage increases above the control culture.
An increase in viable cell number and, to a lesser extent, in specific growth rate were obtained
when M1'X was not present in the culture medium. However, the effect was not the same as
supplementing the culture medium with the positive group of variables. This result suggests
that overcoming any possible limitation, caused by the presence of MTX, by increasing the
concentration of glycine may account for part of the effect observed. This may partially
explain why the initial addition of glycine to the cell culture medium would be beneficial.
However, no precise conclusion can be drawn as methylene tetrahydrofolate is also involved in
other nucleotide biosynthetic pathways, namely the methylation of deoxyuridylate to
deoxythymidylate (Stryer, 1981), and the improvement in cell growth in the absence of MTX
could also be related to this fact.
3.5.2- Fed-batch cultures with the positive group of components
In an attempt to further understand the reasons underlying the growth stimulating properties of
the positive group of variables, the effect of different feeding strategies of those nutrients on
112

cell growth was investigated, with a view to improving the culture conditions. The nutrients
included in this group were the same as in section 3.5.1 (positive group except BSA).
Additions of these nutrients to shake-flask cultures were made as indicated in Table 3.11.
Table 3.11- Scheduled feeding of the positive group of variables to
stirred batch cultures.
Experiment
Time(h) I II III IV V VI
0
+ *
24
+ *
48
+ *
72
+ *
(+) indicates addition at the high level (1 x 100% increase);
(*) indicates addition at 25% of the high level (100% in 4 x 25% aliquots).
The effect of the different time additions on CHO cell growth is shown in Table 3.12. The
stimulating growth effect was marked if the concentration of those variables was increased at
the beginning of the culture, with approximately 38% increase in both specific growth rate and
viable cell titre (II). Intermittent feeding, with only a 25% increase in the initial concentration
of these nutrients (VI) was slightly less effective, but still showing ca. 25% increase of the
same parameters above the control culture. A small improvement in cell yields, ca. 10%, was
apparent when the additions were made later in culture, but it is arguable whether that
difference is significant. All the cultures entered the death phase at approximately the same
time, Ca. 100 h.
113
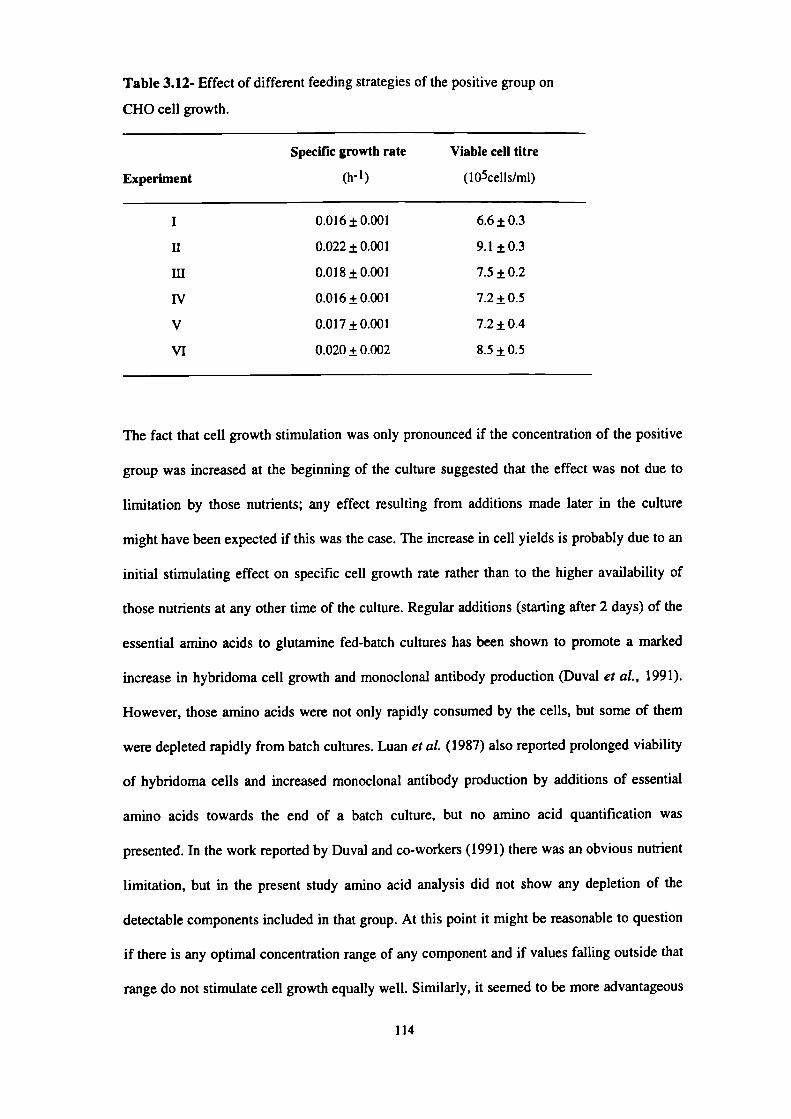
I
II
ifi
IV
V
VI
6.6 ± 0.3
9.1 ±0.3
7.5 ± 0.2
7.2 ± 0.5
7.2 ± 0.4
8.5 ± 0.5
0.016 ± 0.001
0.022 ± 0.001
0.018 ±0.001
0.016 ±0.001
0.017 ± 0.001
0.020 ± 0.002
Table 3.12- Effect of different feeding strategies of the positive group on
CHO cell growth.
Specific growth rate
Viable cell titre
Experiment
(h-I)
(lO5cells/mI)
The fact that cell growth stimulation was only pronounced if the concentration of the positive
group was increased at the beginning of the culture suggested that the effect was not due to
limitation by those nutrients; any effect resulting from additions made later in the culture
might have been expected if this was the case. The increase in cell yields is probably due to an
initial stimulating effect on specific cell growth rate rather than to the higher availability of
those nutrients at any other time of the culture. Regular additions (starting after 2 days) of the
essential amino acids to glutamine fed-batch cultures has been shown to promote a marked
increase in hybridoma cell growth and monoclonal antibody production (Duval et al., 1991).
However, those amino acids were not only rapidly consumed by the cells, but some of them
were depleted rapidly from batch cultures. Luan et al. (1987) also reported prolonged viability
of hybridoma cells and increased monoclonal antibody production by additions of essential
amino acids towards the end of a batch culture, but no amino acid quantification was
presented. In the work reported by Duval and co-workers (1991) there was an obvious nutrient
limitation, but in the present study amino acid analysis did not show any depletion of the
detectable components included in that group. At this point it might be reasonable to question
if there is any optimal concentration range of any component and if values falling outside that
range do not stimulate cell growth equally well. Similarly, it seemed to be more advantageous
114
to keep the concentration of the positive variables at a high level in the beginning of the
culture and to investigate some other possibilities to extend cell growth and IFN-'y production.
3.6- Concluding remarks
In this study, an early investigation into the effects of 20 nutritional variables selected from a
developed serum-free culture medium was undertaken with a statistically designed experiment.
if this approach was not adopted, it would be necessary to change each of those nutrients
independently in order to determine their effect on CHO cell growth and IFN-y production. A
complete factorial design for the screening of that number of variables at two different levels
would require 220 experiments; in other words, it would not be feasible. Such a complete
factorial experiment would account for all the possible interactions between variables, but
most of the time high-order interactions tend to be very small. The Plackett-Burman design
was used for the purpose of identifying important variables for both CHO cell growth and
IFN-y production, while quantifying their effect on the same parameters. That extraordinarily
high number of experiments was thus reduced to 24.
Based on the positive variables identified with the Plackett-Burman design a significant
improvement of CHO cell growth and IFN-y production (approximately 40%) was achieved
when the concentration of the nutrients BSA, glycine, glutamate, sodium pyruvate,
tyrosine/phenylalanine and proline/hydroxyproline/histidine, was increased in the culture
medium. The effect was only marked if the increase was made in the beginning of the culture
and it did not seem to be related to nutrient depletion; there was some evidence that changes in
glucose and glutamine metabolism contributed to that effect. The glycosylation pattern of IFN-
y was not affected by an increase in the initial concentration of the positive nutrients in the
culture medium.
115

Following the identification of key independent variables with the Plackett-Burman procedure,
it would seem reasonable to establish their optimum concentrations, and their interactions.
However, no approaches of this kind were taken in this study, because it was decided that
other points also raised from that statistical analysis merited further investigation. First, it was
evident that glutamine and glucose were strong candidates for cell growth limitation and
simply increasing their initial concentration in the medium was not an efficient methodology;
the question arose of how to efficiently provide the cells with both of these nutrients (Chapter
4). Second, BSA was shown to be a very important component of the medium, but the
complex behaviour of CHO cell growth and IFN-y production towards different sources of
BSA and the awareness of the implications of its presence in the culture medium called for a
more detailed analysis of its role(s), rather than a search for its optimum concentration
(Chapter 5).
116

4- FED-BATCH FERMENTER CULTURES
4.1- Introduction
Based on the Plackett-Burman analysis the initial medium composition was modified to
improve cell growth and IFN-y production. In the previous Chapter, the positive group of
variables was also further subdivided into BSA and amino acids plus sodium pyruvate. It was
shown that the stimulating growth effect of sodium pyruvate plus amino acids was
independent of BSA. Although BSA proved to be a major component per se for both CHO cell
growth and WN-y production, it was not initially included in the positive group due to the
variability it introduces into the culture medium. There are other reasons not to increase its
concentration in the culture medium; it was further analysed as a separate component (see
Chapter 5).
The conditions of the culture medium deteriorate during a batch culture and cell growth
usually becomes limited by nutrient depletion or by the accumulation of toxic components,
which may become the bottleneck of the process. Analysis of nutrient consumption in the
previous Chapter has shown that glutamine was depleted early in the culture, after
approximately 75 h, while glucose was also used extensively and depleted in the later stages;
both conditions could be related to the onset of the stationary phase. Final concentrations of
ammonia and lactate obtained in batch culture, Ca. 1.7 mM and 13 mM respectively, should
not be inhibitory to the cells as 2 mM ammonia and 17.5 mM lactate have shown no effect on
the growth of this cell line (Hayter Ct a!., 1991a). However, cell growth limitation by either
glucose and/or glutamine starvation was a possibility to consider. Simply increasing the initial
concentration of these nutrients in the culture medium is often unsuccessful due to their
inefficient utilisation and an increase in the accumulation of inhibitory metabolites. This
strategy has been investigated for this cell line by increasing initial glutamine and glucose
117

concentrations to 4 mM and 22 mM respectively (Hayter et a!., 1991a), and no improvements
on cell growth or IFN-y production were obtained; nutrient utilisation seemed to be less
effective, as indicated by the higher glucose and glutarnine uptake rates. Higher initial
concentration of glutamine also lead to an increase in ammonia production. Glucose and
glutamine were not identified as positive variables by the Plackett-Burman analysis although
they were depleted early in culture; this may be also related to inefficient utilisation of these
nutrients at higher initial concentrations. As discussed in section 1.3.2.1, ammonia and lactate
are major products of glutamine and glucose metabolism, respectively. Controlled feeding of
these components in order to reduce ammonia and lactate accumulation has been previously
reported (Glacken eta!., 1986; Glacken, 1988; Ljunggren and Haggstrom, 1990). A significant
reduction in ammonia production with a simultaneous increase in cell yield of MDCK cultures
has been achieved by controlled feeding of glutamine, which was maintained at low levels
throughout the culture (Glacken eta!., 1986).
The nutritional environment of the cells may affect the glycosylation patterns of a recombinant
protein. A decrease in the proportion of the 2N-glycoform of IFN-y was previously observed
during batch culture (section 3.4.1). This shift follows the decline in glucose levels and rapid
depletion of glutamine from culture. Glucose-limited chemostat cultures of these cells have
shown an increase in the proportion of the 2N form of IFN-y following transient periods of
excess glucose (Hayter et a!., 1992), suggesting that glycosylation could be affected by the
availability of this nutrient. However, studies from batch cultures with high initial
concentration of glucose (22 mM) did not have the same effect on protein glycosylation
(Hayter eta!., 1991b; Curling eta!., 1990) indicating that factors other than the availability of
glucose per se could be affecting the glycosylation pathway. It has also been reported that
CHO cells utilise an alternate glycosylation pathway when deprived of glucose, and this was
thought to be due to depletion of nucleotide sugar precursors, leading to the synthesis of
glycoproteins with truncated oligosaccharides (Rearick et a!., 1981). This is supported by the
118

early suggestion that the major function of aerobic glycolysis is to maintain high amounts of
glycolytic precursors for macromolecule synthesis (Hume eta!., 1978).
The glycosylation biosynthetic pathway has been already described in section 1.4.1. It starts
with the synthesis of a lipid-linked oligosaccharide, containing glucose, mannose and N-
acetyiglucosamine. The oligosaccharide processing reactions in the Golgi compartments yield
complex oligosaccharide structures and use uridine-diphosphate (IJDP), guanosine
diphosphate (GDP) and cytidine monophosphate (CMP) as co-substrates (e.g. UDP-N-
acetylglucosamine, CMP-sialic acid). It is possible that the supply of glycosylation precursors,
such as aminosugars and nucleotides, are a limiting step for that pathway. Both glucose and
glutamine are involved in the biosynthesis of these precursors. Ribose-5-phosphate, primarily
formed by the pentose-phosphate pathway, and the amino group of glutamine are both
necessary for the synthesis of purine and pyrimidine nucleotides. Glucose and/or glutamine
depletion from the culture medium may thus constitute a block for the efficient glycosylation
of the protein and it is a subject that needs to be addressed.
In this Chapter, glucose and glutamine fed-batch cultures were used in order to avoid the
depletion of these nutrients from the culture, while keeping them at a concentration which
would not allow excessive production of inhibitory metabolites. Cell growth, cell metabolism
and IFN-y production under these conditions were investigated. At the same time, the
possibility that glucose and/or glutamine availability in culture affects the glycosylation of
IFN-y was evaluated.
119
4.2- Cell growth and IFN-y production in fermenter cultures
Cell growth and IFN-y production in fermenter cultures were first characterised. The analysis
was done with a control culture (I) using the original growth medium and a culture with
increased concentrations of the positive variables (II). The effects of the group of positive
variables, including BSA, sodium pyruvate and amino acids, was thus tested under conditions
of controlled dissolved oxygen and pH. Again, a significant improvement of CHO cell growth
and JFN-y production was achieved (Figure 4.la,b) when compared with the control
experiment, although the increase in JFN-y titres was lower than what was previously observed
in shake-flask cultures (ca. 25-30%). In both cases, a decrease in IFN-y production was noticed
before the cells reached the stationary phase.
4.3- Glucose and glutamine fed-batch cultures
The effect on cell growth and IFN-y production of feeding glucose and glutamine to fermenter
cultures was then investigated. These studies used as the basal medium the original growth
medium (I) supplemented with the positive group, sodium pyruvate and amino acids,
excluding BSA for the reasons mentioned previously; this latter became the control culture for
the different feeding strategies used in this Chapter (culture II). In the following sections, the
profiles of glucose and glutamine under the different culture conditions are first characterised,
after which cell growth and IIFN-y production in relation to titre and quality are addressed.
Further considerations on the behaviour of the cultures in relation to glucose and amino acids
metabolism are also made.
120

rol (I)
lye variables (11)
12
E- 10V
SC
V
I'IV.0a
10000
$000
6000
2000
b - Interferon production
iWol (I)
dv. variables (II)
a - Cell growth
0 I0 50 100 150 200
Time (b)
0 I0 50 100 ISO 200
Time (h)
Figure 4.1- a) Cell growth and b) JFN-y production in control fermenter cultures and cultures
containing the positive group of variables.
121

4.3.1- Glucose and glutamine profiles
Fed-batch additions of glucose and glutamine were performed in fermenter cultures, with
controlled pH and dissolved oxygen. An initial estimate for the feeding rates was based on the
nutrient analysis performed and reported in Chapter 3. The feeding regimes used are shown in
Table 4.1. Feeding rates were calculated based on the consumption rates for glucose and
glutamine observed in the experiments earlier described (section 3.4.2). The amount added to
the first fed-batch culture (FF1) was estimated in order to keep the concentration of those
nutrients above 5 mM and 0.5 mM, for glucose and glutamine respectively, considering an
average population of approximately 7.5 x i05 cells/mi. The additions were made 6 times in
each 24 h period, in order to avoid large variations in the concentration profile. The profiles
obtained for this culture were then used to set up the other cultures (FF2 and FF3). Initial
concentration of glucose was the same in all the runs (ca. 1 1mM), while initial glutamine was
set at two different concentrations, 2 and 0.5 mM. The latter was used to compensate the
expected increase in ammonia production by feeding glutamine to the 2 mM cultures. All the
cultures had increased concentrations of the positive group of variables at the beginning of the
culture.
Table 4.1- Feeding regime of glucose and glutamine to fermenter cultures.
Initial concentration
(mM)
GLU
GLN
II 11
2
FF1 11
2
FF2 11
0.5
FF3 11
0.5
a- from 21 to 84 h; b- from 84 h; c-from 4 h.
Increment
(mM/addition)
GLU GLN
0.44a
0.1 56
0.22b
O.078b
0.30C
0.109C
0.22C
0.078C
122
The concentration profiles of glucose and glutamine for the different fermenter modes are
shown in Figures 4.2a,b,c and 4.3a,b,c, where the actual and potential (amount present in
culture if there was no consumption) concentrations during culture are shown. The potential
concentration profiles show the different quantities of glucose and glutamine that each culture
received. As all the cultures started with the same level of glucose, the total amount (potential)
in a culture was dependent only on the different feeding rates and did not vary much, 18 to 20
mM, among the cultures (Figure 4.2a,b,c). On the other hand, different initial glutamine
concentrations were used, 2 mM in FF1 as in the control culture and 0.5 mM in FF2 and FF3,
and as a result the total amount added to the later ones, 3.5 and 4.5 mM respectively, was
lower than FF1, 5.5 mM, but still higher than the control culture (Figure 4.3a,b,c). Apart from
the control culture (II), to which no additions were made, glutamine was never depleted from
the culture, while glucose was always kept above 5 mM. At 100 h the level of glucose in all
the fed cultures was approximately 7.5 mM, as compared to 2.5 mM in the control culture
(Figure 4.2). At the same time point, glutamine was depleted from the control culture, while
the levels for the fed cultures were ca. 1mM, 0.6 mM and 0.3 mM for FF1, FF2 and FF3
respectively (Figure 4.3). The cumulative consumption of glutamine and glucose is shown in
Figure 4.4a,b,c. After approximately 70 h, all the glutamine of the control batch culture (II)
was consumed, while the consumption for FF1 at the same point was higher, ca. 2.7 mM, and
for FF2 and FF3 lower, ca. 1.7 and 1.5 respectively. Consumption of glucose at the same point
was just below 5 mM for the batch culture, and varying from 5.5 to 7.5 for FF1, FF2 and FF3
(increasing order). In all the fed-batch cultures, significant consumption of glutamine and
glucose continued until viable cell titre reached a low value.
123

IS
I
10
5
0,0
a 0 Actual- C.uIroi
—•0— PsteutlaI. Cuatrol•-•-- Actual.FFI
Psk.U- FF1
•
b4 '
0 -0 50 tOO 150 500
Time (ii)
b
13
i10
3
0-0
0 Aclual-Cs.Iroi0 Pste.tld- C..lr,I
--•-- Ad.M.FF2
- P,uatIal- FF2
°b.b
• 'Ioo
0bo•
b0
50 100 150 200
Time (h)
--0- Actual.Cs.traI
0 P.4mtIaI- Cs.tr.l
--.-- Actu-m
- PMua FF3
0,, L.. _.•
b. 'u•
0.'0
bo
50 100 150 500Time (b)
Figure 4.2- Glucose concentration profile in fed-batch cultures a) FF1, b) FF2 and c) FF3.
Growth curves for the same cultures are found in Figure 4.5.
124

6] a
5
a
E3
C
AeI.ai- Co.IroI
•-•O- Pok.IlaI. C..Iral--'•- Aet..I-FF1
- P.le.tlal. FF1
.3. C..*ruI
dial. C..Ir.l
ii. FF3
.11.1. FF3
E
S
o—o,o--oo,0 50
150 200Time (Ii)
b • -0- AcI.al. C..Ird
0 PM.Ij.3.C..lroi5
Adeal. FF2
P.te.Ilal FF2
E3
S
2
b.
I j
G—O,o-Oo0
50 100 130Time (h)
U, . . . -,0 50 100 150
Tim. (b)
Figure 4.3- Glutamine concentration profile in fed-batch cultures a) FF1, b) FF2 and c) FF3.
125

20
15
E
10
C
US
Contrc
FF1
FF2
FF3
5
4
E
0
1
—O--• Cciitrol
FF1h - Glutamine
a - Glucose
0,- .-0 50 100 150 200
Time (b)
o •-- - - •0 50 100 150 200
Thne(b)
Figure 4.4- Cumulative consumption of a) glucose and b) glutamine in fed-batch cultures.
126
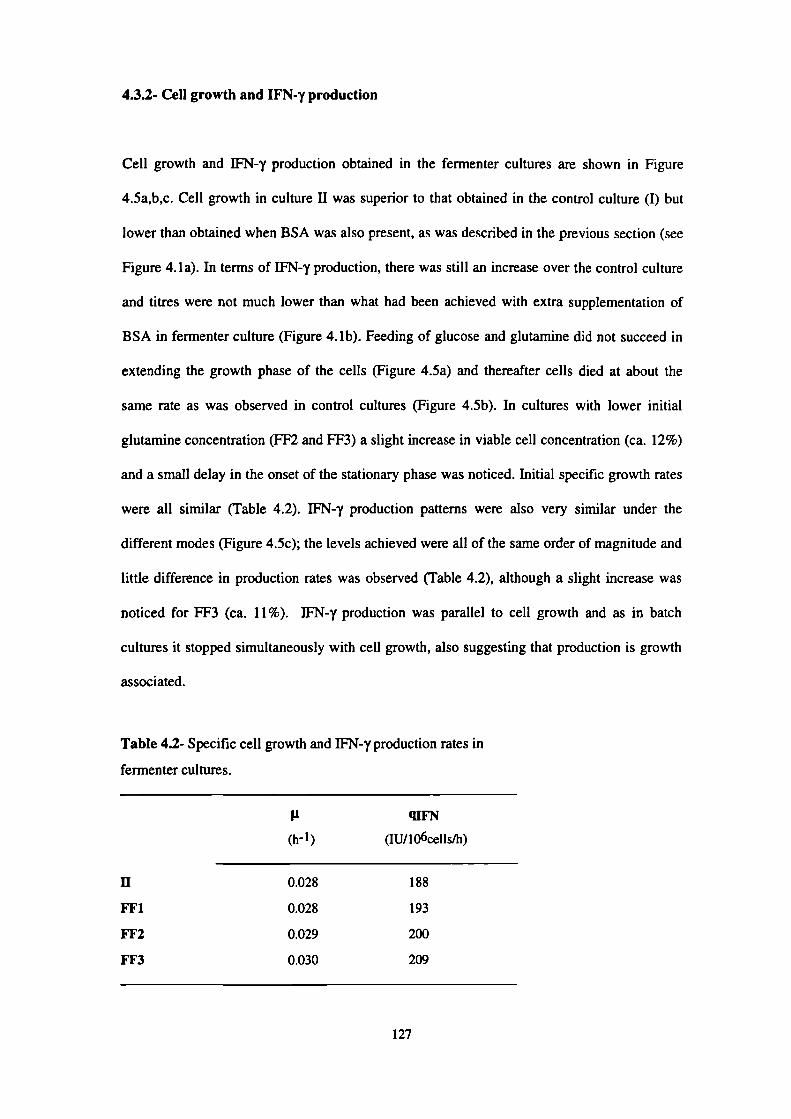
4.3.2- Cell growth and IFN-y production
Cell growth and IFN-y production obtained in the fermenter cultures are shown in Figure
4.5a,b,c. Cell growth in culture II was superior to that obtained in the control culture (I) but
lower than obtained when BSA was also present, as was described in the previous section (see
Figure 4.la). In terms of IFN-y production, there was still an increase over the control culture
and titres were not much lower than what had been achieved with extra supplementation of
BSA in fermenter culture (Figure 4. ib). Feeding of glucose and glutamine did not succeed in
extending the growth phase of the cells (Figure 4.5a) and thereafter cells died at about the
same rate as was observed in control cultures (Figure 4.5b). In cultures with lower initial
glutamine concentration (FF2 and FF3) a slight increase in viable cell concentration (ca. 12%)
and a small delay in the onset of the stationary phase was noticed. Initial specific growth rates
were all similar (Table 4.2). IFN-y production patterns were also very similar under the
different modes (Figure 4.5c); the levels achieved were all of the same order of magnitude and
little difference in production rates was observed (Table 4.2), although a slight increase was
noticed for FF3 (ca. 11%). IFN-y production was parallel to cell growth and as in batch
cultures it stopped simultaneously with cell growth, also suggesting that production is growth
associated.
Table 4.2- Specific cell growth and JFN-y production rates in
fermenter cultures.
p IFN
(h- I ) (IU/lO6celIsJh)
H 0.028 188
FF1 0.028 193
FF2 0.029 200
FF3 0.030 209
127

a • Cell growtb
C0
N
U
N
U
50 100 ISOTime (ii)
U0
I
* 40
50
00
-0— C..(roI
—s— FF1
—0— FF1
—0— m
5000
0 C..Ir,I• FF1o FF2• P73
C Interfrroa production
0 50 100 150Time (h)
b • Cell vabillty
0 50 100 150 200TI.. (h)
Figure 4.5- a) Cell growth, b) cell viability and c) IFN-y production in fed-batch cultures.
128

Cell growth is affected by the availability of glucose and glutamine in the culture medium and
with this cell line, a decrease of the glutamine medium concentration from 2 mM to 1 mM
reduced cell growth by Ca. 25%, and cells were not able to grow in the absence of glutamine
(Hayter eta!., 1991a). The fact that both glucose and glutamine were available throughout the
fed-batch cultures did not result in any net positive effect on cell growth and IFN-y production,
thus other factors have to be implicated in arresting growth and production. Butler and Spier
(1984) reported an increase in BHK cell growth on increasing initial glutamine concentration
from 1 mM to 4 mM but a further increase to 8 mM became inhibitory to cell growth. This
seemed to be related to an increase in ammonia concentration from 2.2 mM to 3 mM. Daily
additions of glucose and glutamine to hybridoma cultures have also been reported to extend
hybridoma cell viability and to increase antibody production by at least 60% (Miller et a!.,
1988; Reuveny et a!., 1986). In both cases the increase in antibody production was due to an
increase in the number of viable cells. Cell death was suggested to be due to an increase in
ammonia levels in those cultures.
Cell growth inhibition by ammonia and/or lactate was a possibility to consider. Figure 4.6a,b
shows the accumulation of both metabolites during the cultures. The fmal levels of ammonia
and lactate in the cultures fed with glutamine and glucose were higher, reflecting the
continuous utilization of both glutamine and glucose during the whole culture period (Figure
4.4a,b,c). Approximately 3.5 mM ammonia was present by the end of culture FF1 and 2.5 mM
by the end of FF2 and FF3, as compared to 1.7 mM in the control culture, level which stopped
to increase after glutamine depletion (ca.75 h). Lactate levels reached Ca. 18mM in all the fed-
batch cultures, compared to ca. 14 mM in the control culture. The level of both ammonia and
lactate at the point when growth stopped in each run is shown in Table 4.3.
129

4
3
E
E
00
trot
50 100 150 200Time (b)
15
110
5
ntrol
I
2
3
0 U - - -
0 50 100 150 200
lime (Ii)
Figure 4.6 Accumulation of a) ammonia and b) lactate in fed-batch cultures.
130
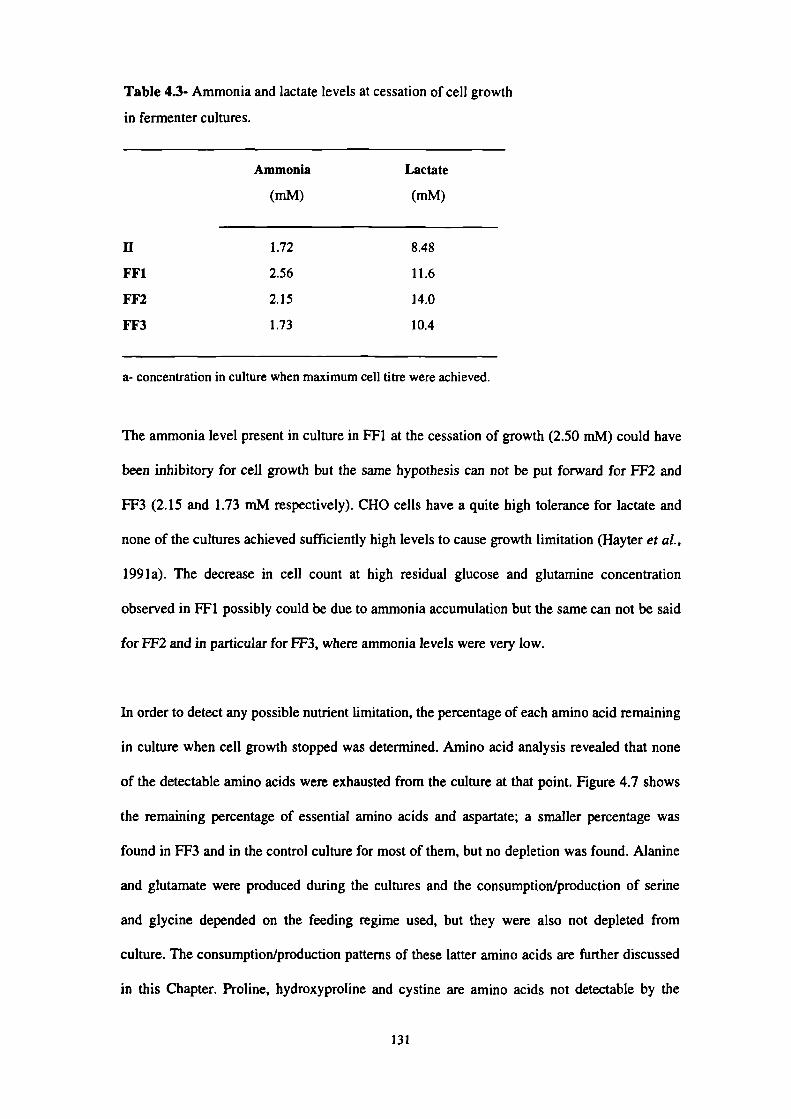
Table 4.3- Ammonia and lactate levels at cessation of cell growth
in fermenter cultures.
Ammonia Lactate
(mM) (mM)
U 1.72 8.48
FF1 2.56 11.6
FF2 2.15 14.0
FF3 1.73 10.4
a- concentration in culture when maximum cell titre were achieved.
The ammonia level present in culture in FF1 at the cessation of growth (2.50 mM) could have
been inhibitory for cell growth but the same hypothesis can not be put forward for FF2 and
FF3 (2.15 and 1.73 mM respectively). CHO cells have a quite high tolerance for lactate and
none of the cultures achieved sufficiently high levels to cause growth limitation (Hayter et al.,
1991a). The decrease in cell count at high residual glucose and glutamine concentration
observed in FF1 possibly could be due to ammonia accumulation but the same can not be said
for FF2 and in particular for FF3, where ammonia levels were very low.
In order to detect any possible nutrient limitation, the percentage of each amino acid remaining
in culture when cell growth stopped was determined. Amino acid analysis revealed that none
of the detectable amino acids were exhausted from the culture at that point. Figure 4.7 shows
the remaining percentage of essential amino acids and aspartate; a smaller percentage was
found in FF3 and in the control culture for most of them, but no depletion was found. Alanine
and glutamate were produced during the cultures and the consumption/production of serine
and glycine depended on the feeding regime used, but they were also not depleted from
culture. The consumption/production patterns of these latter amino acids are further discussed
in this Chapter. Proline, hydroxyproline and cystine are amino acids not detectable by the
131
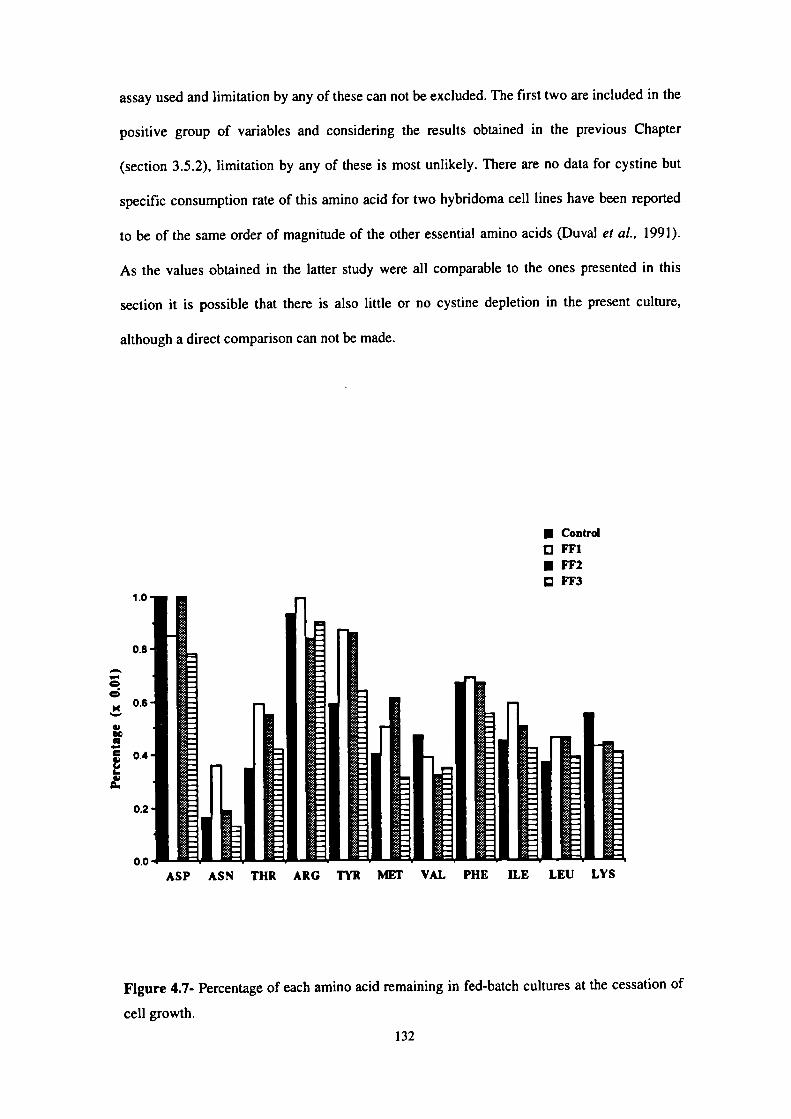
assay used and limitation by any of these can not be excluded. The first two are included in the
positive group of variables and considering the results obtained in the previous Chapter
(section 3.5.2), limitation by any of these is most unlikely. There are no data for cystine but
specific consumption rate of this amino acid for two hybridoma cell lines have been reported
to be of the same order of magnitude of the other essential amino acids (Duval et al., 1991).
As the values obtained in the latter study were all comparable to the ones presented in this
section it is possible that there is also little or no cystine depletion in the present culture,
although a direct comparison can not be made.
• ControltJFF1•FF2
FF31.0
0.8
0.6
!04
0.2
0.0ASP ASH THR ARG TYR MET VAL PIlE ILE LEU LYS
Figure 4.7- Percentage of each amino acid remaining in fed-batch cultures at the cessation of
cell growth.
132

4.3.3- IFN-y glycosylation patterns
The glycosylation pattern of IFN-y obtained under each of the feeding conditions was
determined. The proportions of each of the glycoforms is shown in Figure 4.8a-d. No major
difference was detected between the cultures with high initial glutamine concentration (4.8a,b).
The initial proportion of the non-glycosylated form in the control culture was 5 to 8% and only
increased late in the culture (after 100 h). About 70% of the product was 2N-glycosylated by
the beginning of the culture, but this decreased to about 50% after 100 h in the culture, with a
simultaneous increase in the 1N-glycoform. No significant changes were found for the non-
glycosylated form for FF1 and a similar trend was obtained for the 1N-glycoform and 2N-
glycoform. A lower proportion of the 2N glycoform (Ca. 50%) and a higher proportion of the
non-glycosylated form (ca. 15%) was detected in the beginning of both FF2 and FF3, which
had 0.5 mM initial glutamine concentration. The proportion of the non glycosylated form
decreased during the fermentation to a steady value of approximately 5-7%, after ca. 75 h in
culture with a simultaneous increase in the proportion of the 1N-glycoform. The proportion of
each of the glycoforms in the beginning of the culture did seem to be a function of the initial
concentration of glutamine. Both in FF2 and FF3, with 0.5 mM initial glutamine
concentration, the proportion of the non-glycosylated form in the beginning of the culture was
higher while the proportion of the 2N-glycoform was lower than in a typical batch culture or in
the fed-batch culture which had the same initial glutamine concentration, 2 mM (FF1). The
difference between these runs was only the concentration of glutamine in the beginning of the
culture, as glucose concentration always commenced at the same initial level. Glutamine is an
important nitrogen donor for several biosynthetic pathways, such as nucleotide synthesis, and
a reduced flux through glutaminolysis may reduce the supply of important precursors to some
of the pathways. This may be what is happening with the glycosylation pathway. An initial
glutamine concentration of 0.5 mM may not be enough to cope with the cell demand for
biosynthetic precursors which rely on that component.
133

SO 1(X) 150 2(X)
Time (h)
a Control
!60IN
50
0
—0-- ONa iN• 2N
, b.FF1
Ghonsw .wjd conc . 2 eiM
!:
Time (h)
2(X)
1E c-FF2
Ghaasure mmd conc. OS iiM$0
60
i d.FF3
Gbonmine Id cow. . OS eiM
$0
1
0 50 1(X) 150 5;, 2Time (h)
Time (k)
Figure 4.8- Glycosylation patterns of IFN-y obtained from fermenter cultures with a,b) 2 mM
initial glutamine and c,d) 0.5 mM initial glutamine concentration.
134
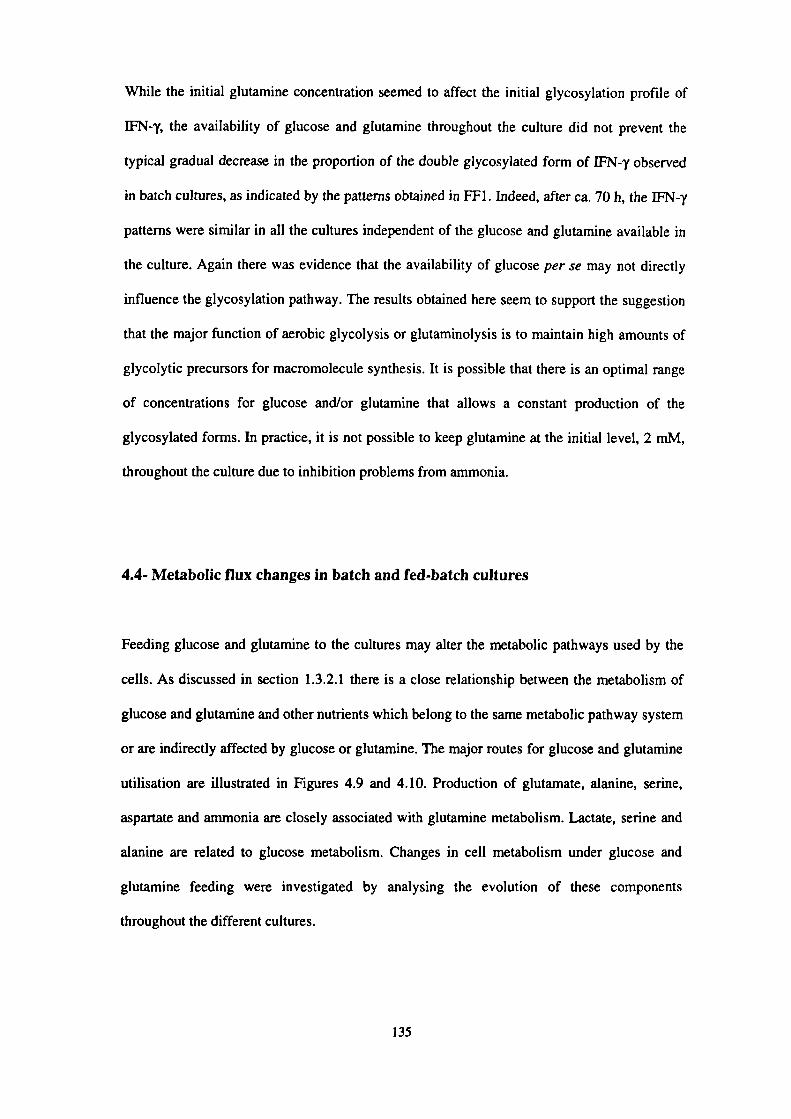
While the initial glutamine concentration seemed to affect the initial glycosylation profile of
IFN-y, the availability of glucose and glutamine throughout the culture did not prevent the
typical gradual decrease in the proportion of the double glycosylated form of IFN-y observed
in batch cultures, as indicated by the patterns obtained in FF1. Indeed, after Ca. 70 h, the IFN-y
patterns were similar in all the cultures independent of the glucose and glutamine available in
the culture. Again there was evidence that the availability of glucose per se may not directly
influence the glycosylation pathway. The results obtained here seem to support the suggestion
that the major function of aerobic glycolysis or glutaminolysis is to maintain high amounts of
glycolytic precursors for macromolecule synthesis. It is possible that there is an optimal range
of concentrations for glucose and/or glutamine that allows a constant production of the
glycosylated forms. In practice, it is not possible to keep glutamine at the initial level, 2 mM,
throughout the culture due to inhibition problems from ammonia.
4.4- Metabolic flux changes in batch and fed-batch cultures
Feeding glucose and glutamine to the cultures may alter the metabolic pathways used by the
cells. As discussed in section 1.3.2.1 there is a close relationship between the metabolism of
glucose and glutamine and other nutrients which belong to the same metabolic pathway system
or are indirectly affected by glucose or glutamine. The major routes for glucose and glutamine
utilisation are illustrated in Figures 4.9 and 4.10. Production of glutamate, alanine, serine,
aspartate and ammonia are closely associated with glutamine metabolism. Lactate, serine and
alanine are related to glucose metabolism. Changes in cell metabolism under glucose and
glutamine feeding were investigated by analysing the evolution of these components
throughout the different cultures.
135
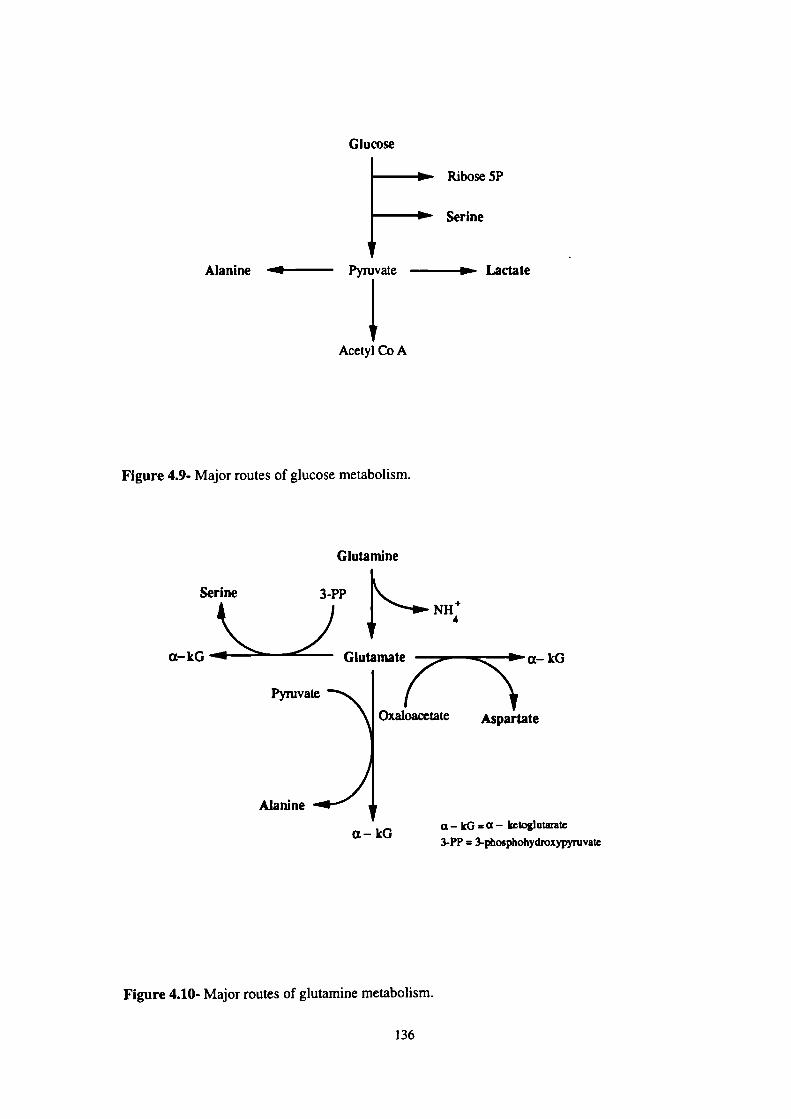
Glucose
Ribose 5?
Serine
Alanine Pyruvate Lactate
Acetyl Co A
Figure 4.9- Major routes of glucose metabolism.
Glutamine
Serine k
a—kG J NH:
Glutamate
Pva
- a— kG
Alanine .11_,0tate
Aspartate
a—kGa—kG=a — ketoglutarate
3-PP = 3-posphohydroxypivatc
Figure 4.10- Major routes of glutamine metabolism.
136
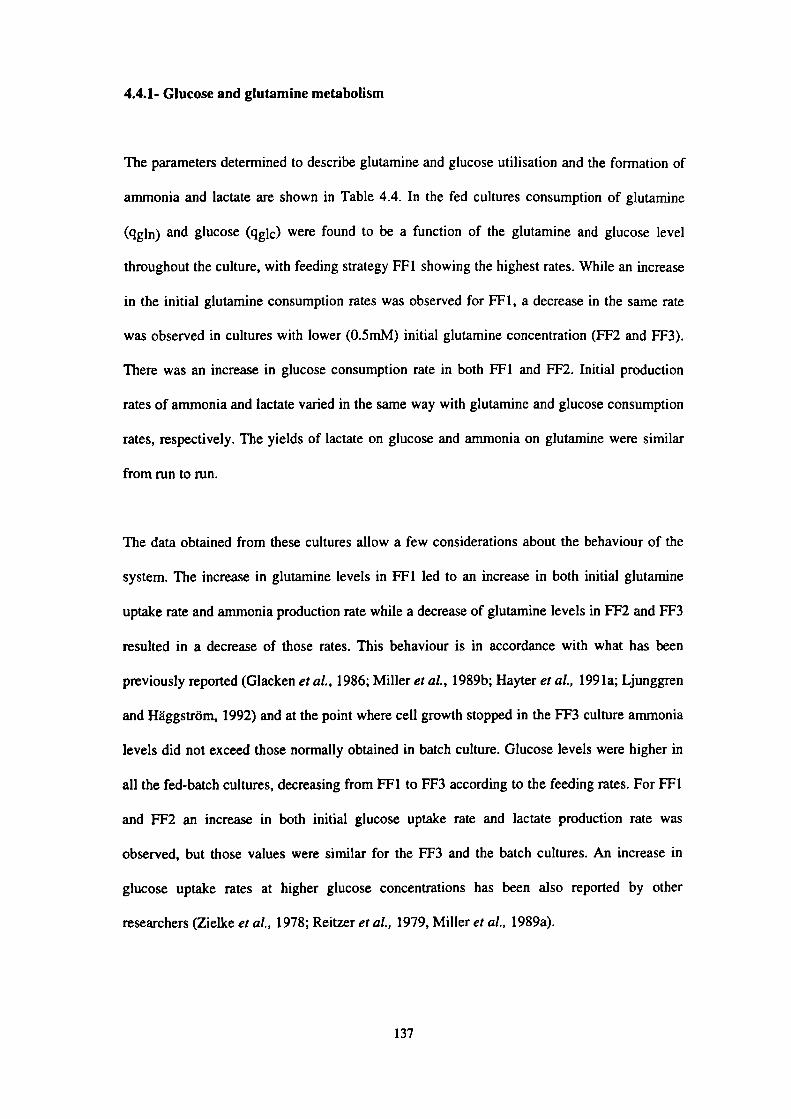
4.4.1- Glucose and glutamine metabolism
The parameters determined to describe glutamine and glucose utilisation and the formation of
ammonia and lactate are shown in Table 4.4. In the fed cultures consumption of glutamine
(qgln) and glucose (qglc) were found to be a function of the glutamine and glucose level
throughout the culture, with feeding strategy FF1 showing the highest rates. While an increase
in the initial glutamine consumption rates was observed for FF1, a decrease in the same rate
was observed in cultures with lower (0.5mM) initial glutamine concentration (FF2 and FF3).
There was an increase in glucose consumption rate in both FF1 and FF2. Initial production
rates of ammonia and lactate varied in the same way with glutamine and glucose consumption
rates, respectively. The yields of lactate on glucose and ammonia on glutamine were similar
from run to run.
The data obtained from these cultures allow a few considerations about the behaviour of the
system. The increase in glutamine levels in FF1 led to an increase in both initial glutamine
uptake rate and ammonia production rate while a decrease of glutamine levels in FF2 and FF3
resulted in a decrease of those rates. This behaviour is in accordance with what has been
previously reported (Glacken et al., 1986; Miller et a!., 1989b; Hayter eta!., 1991a; Ljunggren
and Haggstrom, 1992) and at the point where cell growth stopped in the FF3 culture ammonia
levels did not exceed those normally obtained in batch culture. Glucose levels were higher in
all the fed-batch cultures, decreasing from FF1 to FF3 according to the feeding rates. For FF1
and FF2 an increase in both initial glucose uptake rate and lactate production rate was
observed, but those values were similar for the FF3 and the batch cultures. An increase in
glucose uptake rates at higher glucose concentrations has been also reported by other
researchers (Zielke eta!., 1978; Reitzer eta!., 1979, Miller eta!., 1989a).
137
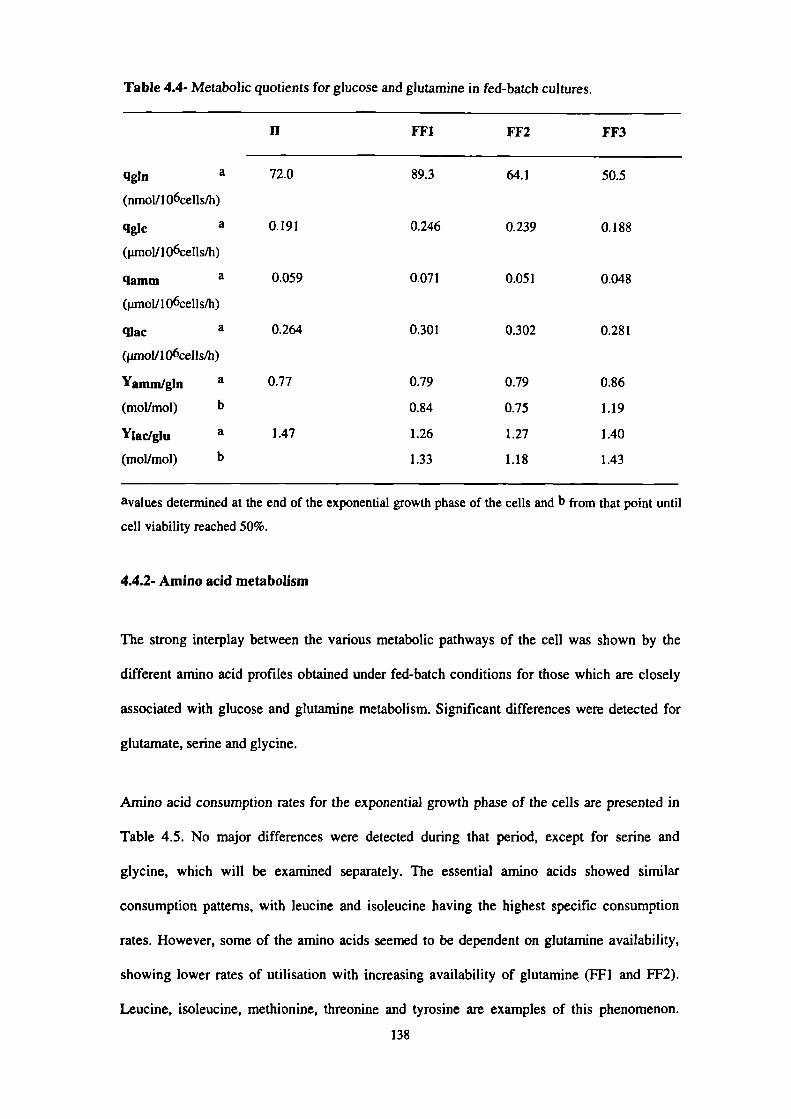
Table 4.4- Metabolic quotients for glucose and glutamine in fed-batch cultures.
II FF1 FF2 FF3
qgln a 72.0 89.3 64.1 50.5
(nmol/l O6ceIIs/h)
qglc a 0.191 0.246 0.239 0.188
(i.imolll06cells/h)
amm a 0.059 0.07 1 0.05 1 0.048
(prnol/1 O6cells/h)
qlac a 0.264 0.301 0.302 0.281
(pmol/1 Oócells/h)
Yamm/gln a 0.77 0.79 0.79 0.86
(mol/mol) b 0.84 0.75 1.19
Ylac/glu a 1.47 1.26 1.27 1.40
(mol/mol) b 1.33 1.18 1.43
avalues determined at the end of the exponential growth phase of the cells and b from that point until
cell viability reached 50%.
4.4.2- Amino acid metabolism
The strong interplay between the various metabolic pathways of the cell was shown by the
different amino acid profiles obtained under fed-batch conditions for those which are closely
associated with glucose and glutamine metabolism. Significant differences were detected for
glutamate, serine and glycine.
Amino acid consumption rates for the exponential growth phase of the cells are presented in
Table 4.5. No major differences were detected during that period, except for serine and
glycine, which will be examined separately. The essential amino acids showed similar
consumption patterns, with leucine and isoleucine having the highest specific consumption
rates. However, some of the amino acids seemed to be dependent on glutamine availability,
showing lower rates of utilisation with increasing availability of glutamine (FF1 and FF2).
Leucine, isoleucine, methionine, threonine and tyrosine are examples of this phenomenon.
138

Table 4.5- Amino acid initial consumption/production rates in fed-batch cultures.
Control
FF1 FF2
FF3
(II)
(nmolIl O6cells/h)
ASP
GLU
ASN
SER
GLY
ThR
ARG
ALA
TYR
MET
VAL
PHE
ILE
LEU
LYS
+0.35
+6.59
-10.8
+0.3 5
+1.04
-3.12
-0.69
+26.0
-2.77
-1.73
-2.77
-1.39
-6.24
-7.28
-3.47
-0.72
+7.53
-7.89
+9.32
-2.15
-1.79
-1.79
+29.1
-1.79
-1.08
-3.59
-1.79
-4.30
-5.38
-3.23
-0.70
+6.52
-7.85
+ 1.76
-0.28
-2.21
-3.59
+30.1
-1.29
-0.80
-3.39
-1.97
-4.95
-5.78
-3.16
+0.32
+6.02
-9.54
+ 1.44
+0.77
-2.82
-1.54
+26.3
-1.92
-1.54
-2.59
-1.60
-5.15
-6.11
-3.81
values determined from the exponential growth phase; (+) production; (-) consumption.
The analysis of the complete time course revealed that some non-essential amino acids
behaved differently, depending on the feeding regime used. In batch culture a net production
of glutamate (Figure 4.11a), alanine (Figure 4.11b), and also serine early in the culture and
glycine later in the culture was observed (Figure 4.12a,b,c). Production of alanine, glutamate
and serine has also been previously reported for this cell line when grown in glucose-limited
chemostat culture (Hayter et a!., 1992) and production of alanine, glutamate and glycine for
other cell types (Butler and Thilly, 1982; Lanks 1987; Miller era!, 1989a; Duval et al., 1991).
The glutamate level ceased to increase in batch culture after complete depletion of glutamine
(ca.75 h), while its level steadily increased throughout the culture under fed-batch mode
(Figure 4.11a). The main mechanism for the metabolism of glutamine seems to be via
139

phosphate dependent glutaminase, yielding glutamate and ammonia (Mckeehan, 1986). This
net increase in glutamate is most likely a reflection of the continuous uptake of glutamine by
the cells. Alanine and aspartate are also closely associated with glutarnine metabolism (see
section 4.4). Alanine was produced throughout all the cultures (Figure 4.11b), which may
reflect transamination of pyruvate. The net production was similar in all of them, although the
final levels seemed to be slightly higher under fed-batch mode, specially for FF2 and FF3.
Ljunggren and Haggstrom (1992) also found that under glutamine limited conditions alanine
production was substantially reduced. Aspartate profiles showed no significant difference
between the different modes; significant proportions of nitrogen derived from glutamate have
been also found in aspartate (Ardawi and Newsholme, 1982; Moreadith and Lehninger, 1984).
This may explain the accumulation of aspartate in these cultures.
The serine and glycine profiles obtained under fed-batch conditions were different from what
was obtained in the control culture (Figure 4.12a,b,c). Typically, serine is produced in the
initial stage of the culture while glycine is consumed; this pattern is reversed later in culture,
coinciding with glutamine depletion. Under fed-batch mode (FF1 and FF2) the serine level
increased throughout the cultures, with a concurrent decrease in glycine level (Figure 4.12a,b);
this pattern was most evident in FF1, where glutamine levels were kept at a higher level
throughout the culture. Serine and glycine levels remained constant until the later stages (75 h)
of the fed-batch process FF3, when a slight increase was seen (Figure 4.1 2c). As discussed
earlier, it is possible that MTX inhibits the pathway for the production of glycine in the
beginning of the culture, leading to a decrease in its level and an increase in serine level. The
initial accumulation of serine may be also linked with glutamine availability. Serine is
synthesised from 3-phosphoglycerate, and its production mechanism involves the
transamination of glutamate to a-ketoglutarate. A high rate of serine metabolism has been
reported for proliferating cells (Snell eta!., 1987) and glycine accumulation by the end of the
culture may reflect that metabolism. The fact that under glutamine feeding the level of serine
140

continuously increased during the culture and that its net accumulation varied with glutamine
consumption may suggest that its production is limited by glutamate availability. Glutamine
pulses to glucose-limited chemostat cultures of this cell line have been shown to transiently
increase the specific rate of serine production in culture (P.M. Hayter, personal
communication), which is in accordance with the findings for fed-batch cultures. Transient
increases of serine concentration after glucose and glutamine pulses to hybridoma chemostat
cultures have also been reported (Miller et a!., 1989a,b). The present data do not allow any
clear explanation, but the behaviour could also indicate less serine utilisation, as the highest
accumulation of serine (FF1) corresponded to net reduction in glycine levels, while the lower
accumulation of serine (FF3) corresponded to the highest net production of glycine. Changes
in the metabolism of non-essential amino acids under glutamine limited fed-batch cultures has
also been reported for myeloma cells (Ljunggren and Haggstrom, 1992). Under fed-batch
glutamine limitation, glycine levels increased while serine was produced in the same way in
batch and fed-batch cultures. These authors suggested that under the limited fed-batch culture
cells use less serine or glycine. In the present study, in the fed-batch cultures net glycine
production also increased as the levels of glutamine decreased but with a simultaneous
decrease in the production of serine, which seemed to be linked with glutamine utiisation.
4.5- Concluding remarks
Providing the cell culture medium with glutamine, the depletion of which coincides with the
end of growth and production phase, and with glucose, which is also depleted by the end of the
culture, did not fail to prevent CHO cell growth and IFN-y from ceasing. Inhibition did not
seem to be caused by ammonia and lactate accumulation, which in the lower feeding regime
did not attain higher levels that those normally found in a batch culture. In the fed-batch
cultures, the initial glycosylation pattern of IFN-y was found to be a function of the initial
concentration of glutamine in the culture medium.
141
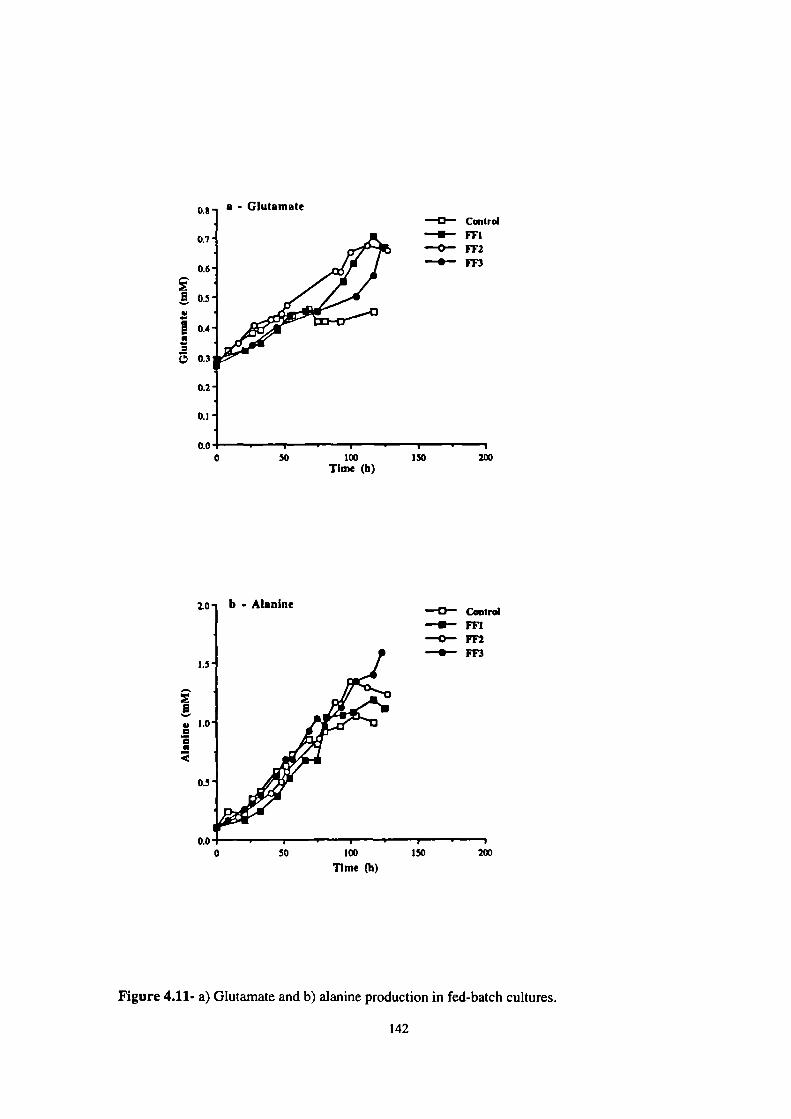
0.8
0.7
0.6
!o.5
0.4
0.3
0.2
0.I
2 - ('.IIIt2m2f
rol
a
NNNN
rol
0.0 I . U 1
0 50 100 150 200Time (h)
-- L AI..1....
0 50 100 ISO 200
Thne (ii)
Figure 4.11- a) Glutamate and b) alanine production in fed-batch cultures.
142
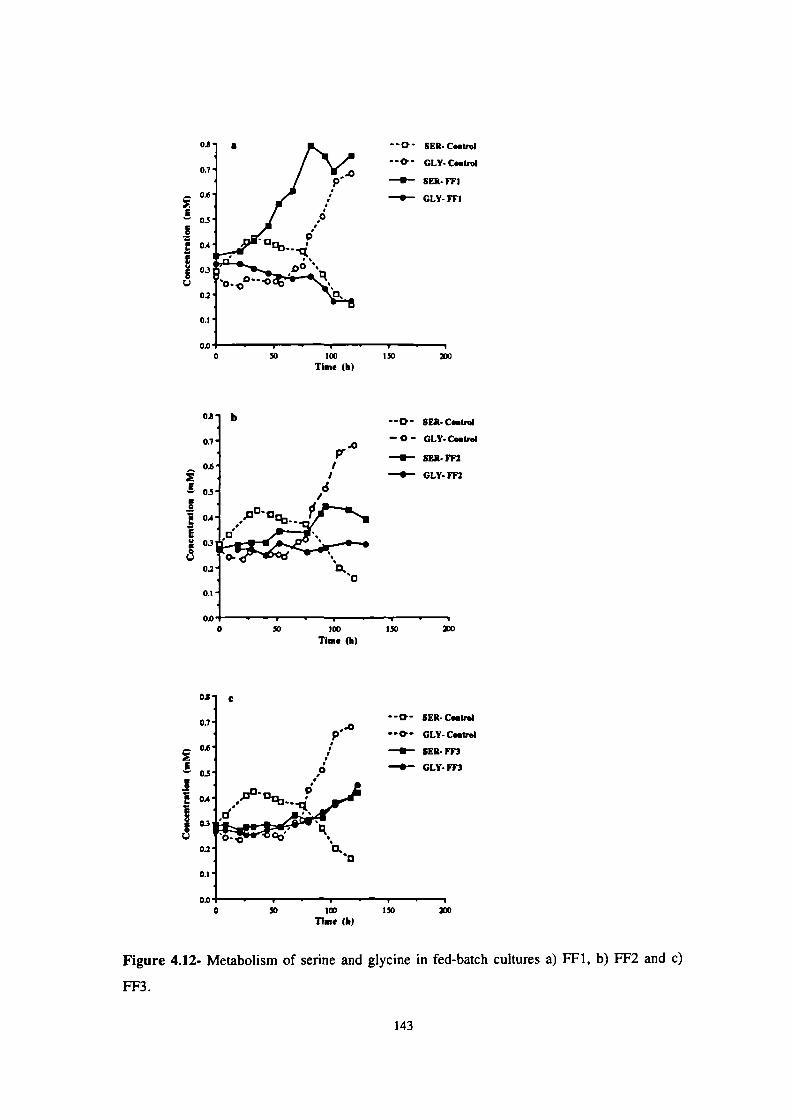
0.! a
03
0.6
E03
g
r
0.3
U0.2
0.l
0.00
0! b
0.7
0.6
03
C
0.6
1 o'0.3
0-0.2
0.1
50 100Time (h)
pr'°
I/
d
•-D•- SER.C..troI
0 GLY-Cs.trol
—s— SEk- FF1
-••- GLY- FF1
150
D SER.C..trol
0 GLY.C..Irol
—U— SER- FF2
—•— GLY- FF2
0 30
0.! c
0.7
0.6
I03
I0.6
U'0-0.2
0.1
0.0
100 150 500Tim. (h)
-0- SER-Cs.Ir,I
p••0 --0.- GLY-C.utroI
/ —U— SER- FF3
—•— GLY- FF3
/
q.
0 30 100 ISO 500Time (k)
Figure 4.12- Metabolism of serine and glycine in fed-batch cultures a) FF1, b) FF2 and c)
FF3.
143

5- THE EFFECTS OF BSA, LIPIDS AND PLURONIC F68 ON CHO CELL
CULTURE
5.1- Introduction
In the first stage of this study the importance of low molecular weight nutrients, including
glucose, amino acids and also protein supplements used in the serum-free medium was
investigated. BSA was identified as an influential component for both cell growth and IFN-y
production. Subsequent experiments with different types of BSA indicated that the positive
effect found for this medium component was probably related to differences in the source of
BSA rather than to the actual amount present in the culture medium. Albumin has the ability
to bind metals, lipids and hormones (Barnes and Sato, 1980; Iscove et a!., 1980). It is likely
that its stimulating properties are due to the effects of unidentified molecules it carries or in the
manner to which other components of the medium bind to it. BSA may also have a protective
function because of its capacity to bind heavy metal ions, detergents and endotoxins. It can act
as a detoxifying agent of the medium for some compounds, e.g., H202, and it has been
reported to strongly inhibit copper-stimulated lipid peroxidation (Darfier and Insel, 1983;
Gutteridge, 1986; HaliweIl, 1988). There is also evidence that BSA may provide animal cells
with protection from shear damage (Lambert and Birch, 1985; Hiilscher and Onken, 1988;
Papoutsakis, 1991a; Smith and Greenfield, 1992).
The trend in animal cell technology is to move towards more weIl-defmed culture media. BSA
is a component that introduces much variability into the culture medium. Its quality varies
with the batch and source, and achievement of an absolute chemical defmition is very difficult.
Usually BSA is included in the culture media at relatively high concentrations, representing
80-90% of the total protein content of the culture medium (Graf et a!., 1991). This fact also
makes downstream processing of the desirable product more difficult and costly.
144

Consequently, a study of possible BSA substitutes was undertaken. Considering the functions
BSA may have in the culture medium, lipids and Pluronic F68 were candidates for this
mvestlgatlon.
Lipids have major functions in animal cells, both as structural components of membranes and
as an energy source (King and Spector, 1981). The growth promoting effects of lipids have
been referred to and they are included in most serum-free medium formulations (Barnes and
Sato, 1980, Glassy et a!., 1988), but the lipid requirements of cells seem to vary considerably
between cell lines. Lipids are usually added to the culture medium in the form of isolated
plasma lipoprotein fractions, free fatty acids complexed to serum albumin, or fatty
acid/phospholipid microemulsions.
The protection that BSA may provide to animal cells against mechanical stress caused by
- agitation and air bubbles may be substituted by polymeric surfactants. Pluronic F68 was
chosen in this study. It is a block copolymer of polyoxyethylene and polyoxypropylene, 80%
of which is polyoxyethylene, and has a relative molecular weight of approximately 8400. The
protective effects of Pluronic F68 in adverse hydrodynamic environments has been often
reported (Kilburn and Webb, 1968; Maiorella et al., 1988; Murhammer and Goochee, 1988;
Handa-Corrigan eta!., 1989; Michaels eta!., 1991; Smith and Greenfield, 1992, Zhang eta!.,
1992a,b), but the mechanisms of protection are still unclear and opinions diverge. Pluronic
F68 has been also reported to affect cell growth independently of shear damaging conditions
caused by agitation or aeration (Bentley et al., 1989; Mizrahi, 1975).
Reduction of the BSA content of the medium could affect IFN-y glycosylation patterns.
Glycosylation of epithelial basement membranes (EBM) has previously been reported to be
influenced by the content of serum in serum-containing cultures (Megaw and Johnson, 1979).
It has been shown recently that a different glycosylation of IgG is obtained if the antibody is
145

expressed in ascites, serum-containing media or serum-free media (Patel et a!., 1992). In this
study, lipid supplementation was planned in conjunction with a reduction in BSA
concentration, and this would alter the lipid composition of the medium. Since the cell fatty
acid composition, either cellular storage lipids or membrane phospholipids, resembles that of
lipids present in the culture medium, cell function could be affected. As referred in section
1.4.1, N-linked glycosylation starts with the synthesis of a lipid-linked oligossacharide moiety
and its transfer en bloc to a nascent polypeptide chain in the ER. Whether the alteration of the
lipid composition of the medium affects this process needed to be considered.
In this Chapter, the approach taken to investigate the possible reduction of BSA in the medium
and its implications on cell growth and WN-y production are described. The effect of the
various medium supplementations on the glycosylation profile of the protein is also addressed.
146
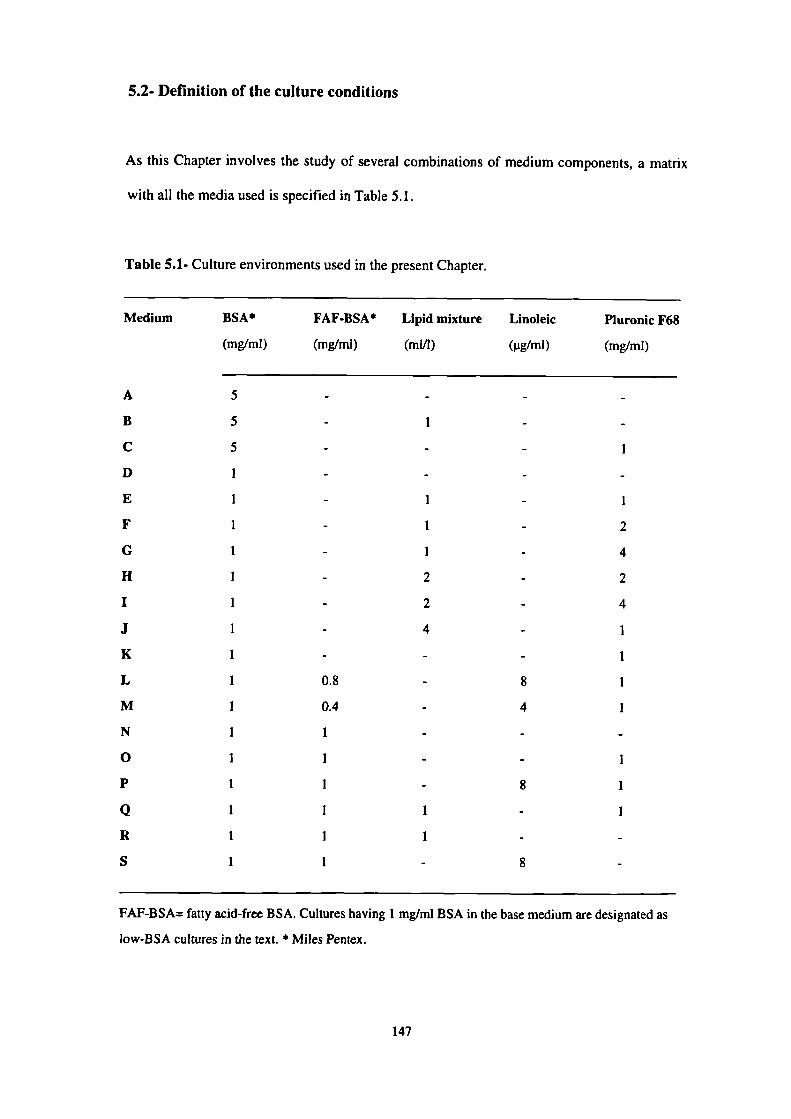
5.2- Definition of the culture conditions
As this Chapter involves the study of several combinations of medium components, a matrix
with all the media used is specified in Table 5.1.
Table 5.1- Culture environments used in the present Chapter.
Medium BSA* FAF.BSA* Lipid mixture Linoleic Pluronic F68
(mg/mi)
(mg/mi) (mi/I)
(tg/mI)
(mg/mi)
A
B
C
D
E
F
C
H
I
J
K
L
M
N
0
P
Q
R
S
5
5
5
I
1
I
1
I
1
1
I
1
I
I
I
1
I
I
0.8
0.4
1
1
1
I
1
I
1
2
2
4
I
1
8
4
8
8
I
1
2
4
2
4
I
1
I
I
I
I
I
FAF-BSA= fatty acid-free BSA. Cultures having I mg/mi BSA in the base medium are designated as
low-BSA cultures in the text. * Miles Pentex.
147

Total Phospholipids
% Phosphatidyl choline
% Lysophosphatidyl choline
11.4± 0.6mg/mI
96.8± 1.6
11.3± 0.8mg/mI
64.9± 15.2
9.7± 7.4
25.4± 7.9
12.5 ± 0.8 mg/mI
51.0± 3.9
2.4± 0.9
59.4 ± 2.3
23.0± 1.9 mg/mI
Total Cholesterol
% HDL Cholesterol
% Sphingomyelin
Total Fatty Acids
% Linoleic
% Arachidonic
% Polyunsaturated
Total Protein
5.3- Effect of reducing the BSA concentration of the culture medium
The effect of reducing the BSA concentration of the culture medium was first investigated.
Cell growth did not occur in cultures completely deprived of BSA. Growth in low BSA
cultures (1 mg/mI) was also not achieved most of the time and when it occuned it was much
poorer than a normal 5 mg/mi BSA culture (Ca. 50% cell yield). A level of I mg/mi was set as
the low limit for BSA concentration and so it was used as the basis for all the supplementation
studies presented. A culture under such conditions was included as a comparative control for
each set of experiments and results for this culture are not presented if there was no cell
growth.
5.3.1- Possible substitutes for BSA- Lipids and Pluronic F68
Considering the nutritional role of BSA in culture media, its replacement by a commercial
lipid mixture was investigated. The mixture chosen for this purpose is a water soluble media
supplement containing lipoprotein, cholesterol, phospholipids and fatty acids, recommended
for serum-free media (Sigma Catalogue). Its composition is as follows:
148

The effect of adding this supplement to cultures containing I mg/mI BSA was initially studied
and it was found that cell growth could not be maintained and cells died very quickly, in the
same manner as with no supplementation. Simply supplying a lipid source to the culture was
not enough to restore cell growth. BSA is also known to function as a protective protein for
cultured cells. Reducing its concentration will affect the physical properties of the culture
medium, such as viscosity and osmolarity, which will influence the cells susceptibilty to shear
damage. Pluronic F68 was subsequently included in these cultures to provide the cells
protection from possible shear damage.
Addition of different combinations of the lipid mixture and Pluronic F68 to the 1 mg/mi BSA
cultures were investigated. The concentration of Pluronic F68 was varied between 0.1 and
0.4%, which is within the range usually reported by other researchers (Bentley et a!., 1989;
Gardner eta!., 1990). The lipid mixture concentration was chosen in such a way as to keep the
concentration of cholesterol and linoleic acid in the new medium within the range commonly
used; usually these vary from 1 to 10 jig/mI for linoleic acid and from I to 20 pg/mi for
cholesterol. Thus, the lipid mixture concentration varied from I to 4 mI/l although the
manufacturer recommends its use between 1-10 mI/i. A summary of the major results obtained
for the various combinations is presented in Table 5.2. Medium E, which contains the lowest
combination of concentrations (0.1% Pluronic F68 and lmI/l lipid mixture) improved growth
significantly, when compared to cells grown with only BSA 1mg/mi (medium D), and cell
titres similar to the control culture (medium A) were obtained. However, product formation
was negatively affected, as indicated by an approximately 35% reduction in maximum titres
obtained. Increasing Piuronic F68 concentration to 0.2% (medium F) caused a slight reduction
in maximum cell titres, but product formation was unaffected. A further increase to 0.4%
Pluronic F68 (medium G) had negative effects both on cell growth and product formation.
Increasing lipid concentration to 2 mIll, keeping Pluronic F68 at 0.2% (cf. medium F and
medium H) had negative effects on cell growth and product formation; when Pluronic F68 was
149

A
D
E
F
G
H
I
J
8423 ± 290
5330 ± 500
5633 ± 300
5725 ± 310
3765 ± 180
4641 ±470
3985± 155
4067 ± 300
9.6 ± 0.8
5.8± 0.2
8.8 ± 0.2
7.3 ± 0.4
6.0 ± 0.3
5.4 ± 0.3
4.5 ± 0.2
5.9 ± 0.3
0.021 ±0.001
0.016±0.001
0.019±0.001
0.019 ± 0.001
0.016 ± 0.002
0.013 ± 0.001
0.013 ± 0.001
0.015±0.001
kept at 0.4% (cf. medium G and medium I) cell growth was reduced but IFN-y production was
not affected. A more drastic increase of the lipid mixture level from I to 4 mI/i, with Pluronic
F68 at 0.1% (cf. medium E and medium J) showed the inhibitory effects of higher doses of
lipids on cell growth and WN-y production.
Table 5.2- Addition of different combinations of a lipid mixture and Pluronic F68
to 1 mg/mi BSA cultures.
p
Viable cell titre
IFN-y production
Medium
(h-I)
(cells/mi x 105)
(lU/nil)
the concentrations of IFN-y are the maximum obtained under each culture condition.
A-BSA5mgIml;D-BSA 1mg/mi
E- BSA I mg/mi + 1 mi/L Lipid mixture + 0.1% Piuronic F68
F- BSA 1 mg/mi + I mI/L Lipid mixture + 0.2% Piuronic F68
0- BSA I mg/mi + I mi/L Lipid mixture + 0.4% Pluronic F68
H- BSA I mg/mI +2 mi/L Lipid mixture + 0.2% Pluronic F68
I- BSA 1 mg/mi +2 mI/L Lipid mixture + 0.4% Pluronic F68
J- BSA I mg/mI + 4 mI/L Lipid mixture + 0.1% Piuronic F68
With specific supplementation of lipids and Pluronic F68 (media E and F), low BSA cultures
could support cell growth to almost the same extent as control cultures (medium A). However,
there was no improvement of product titre as compared to the low BSA non-supplemented
cultures (medium D) despite the higher cell numbers. Furthermore, the IFN-y titres in these
experiments were always lower than the control culture.
150

Time course patterns for cultures grown in media A, D and E are shown in Figure 5.la,b. The
growth patterns of cultures supplemented with the lowest combinations and the control culture
were very similar, but in the lipid supplemented cultures cells remained viable for a slightly
longer period (Figure 5.la). Product titres obtained in low BSA cultures were much lower than
in the control culture. Initial IFN-y production rates were also lower with lipid plus Pluronic
F68 supplementation and similar to low BSA cultures (Table 5.3). In contrast to control
cultures where JFN-y was only associated with the growth phase, the accumulation of IFN-y in
supplemented cultures slowly increased throughout the duration of the culture (Figure 5.1 b).
This could suggest that some component in those additions maintained the production, or, it
could be related to the physiological state of the cells.
Table 5.3- IFN-y production rates in cultures A, D and E.
IFN
Medium (lUll O6cells/h)
A-BSA5mg/rnl
178
D-BSA 1mg/mi
137
E- BSA I mg/mi + 1 mi/L Lipid mixture + 0.1% Pluronic F68 140
At this stage of the investigation it was possible to conclude that CHO cell growth occurred in
low BSA cultures supplemented with a lipid mixture plus Pluronic F68, but IFN-y production
was always lower over the course of the culture. From this set of data it was not possible to
identify the reason for the lower production of IFN-y. Reduction of BSA concentration reduced
the titres of IFN-y achieved in culture; this was consistent with the lower cell numbers,
although a reduction in the initial production rates was also noticed. Furthermore, the lower
production observed in medium E as compared to the control culture could also be related to
either of the supplements, lipids or Pluronic F68.
151
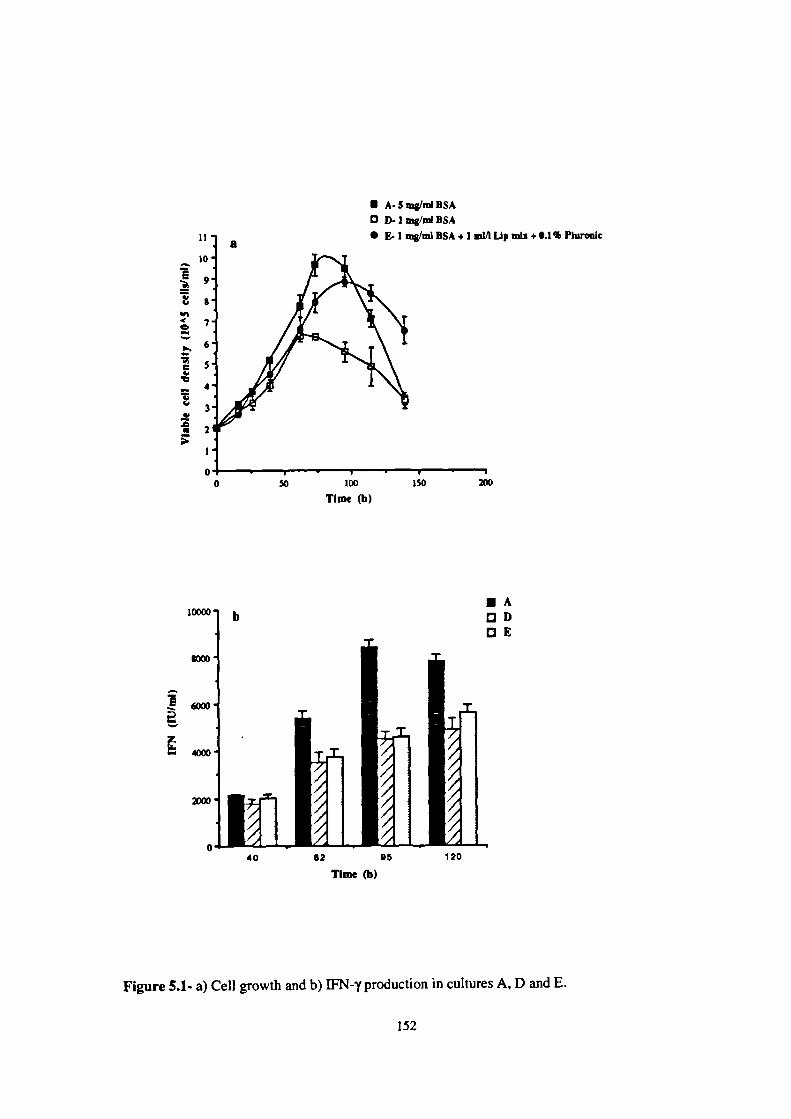
II
I0
E- 9
5
—4
3
00 50 100 ISO
Time (h)
- lUpmix+O.1%Ph*ronlc
Iw00
0
• A.Srng/niIBSAD D.Jmg/mBSA
40 62 95 120
llme(b)
Figure 5.1- a) Cell growth and b) JFN-y production in cultures A, D and E.
152

5.3.2- Influence of individual lipid components on the behaviour of low-BSA cultures:
Plackett-Burman statistical analysis
One of the advantages of reducing the BSA concentration of the culture medium is to provide a
more well defined medium that will be reproducible in terms of its components. The lipid
mixture used was a multicomponent supplement containing lipoprotein, cholesterol,
phospholipids and fatty acids. A search for possible individual lipid components responsible
for the observed differential effects on cell growth and IFN-y production was carried out. The
effect of individual lipids on these parameters was investigated with the same Plackett-Burman
statistical procedure used before (see section 3.3), however with a N=8 matrix (Table 5.4) to
allow the study of 4 real variables against 3 dummy variables.
Table 5.4- Plackett-Burman matrix for the study of 7 variables.
VARIABLES
A B C D E F G
F I + + + - + - -
L 2 - + + + - + -
A 3 - - + + + - +
S 4 + - - + + + -
K 5 - + - - + + +
6 + - + - - + +
7 + + - + - - +
8 - - - - - - -
(+) high level; (-) low level.
Low BSA medium (1 mg/mi) supplemented with 0.1% Pluronic F68 was used as the basis of
the matrix. Linoleic and oleic acids, cholesterol and choline plus ethanolamine were the
components chosen for analysis, with corresponding levels shown in Table 5.5. Cholesterol
and linoleic acid represent a major fraction of the lipid mixture used in the above section. Fatty
acids and cholesterol constitute the basic lipid building blocks for the cells and growth
promotmg effects of these two components have been reported (Darfler and Insel, 1982;
153
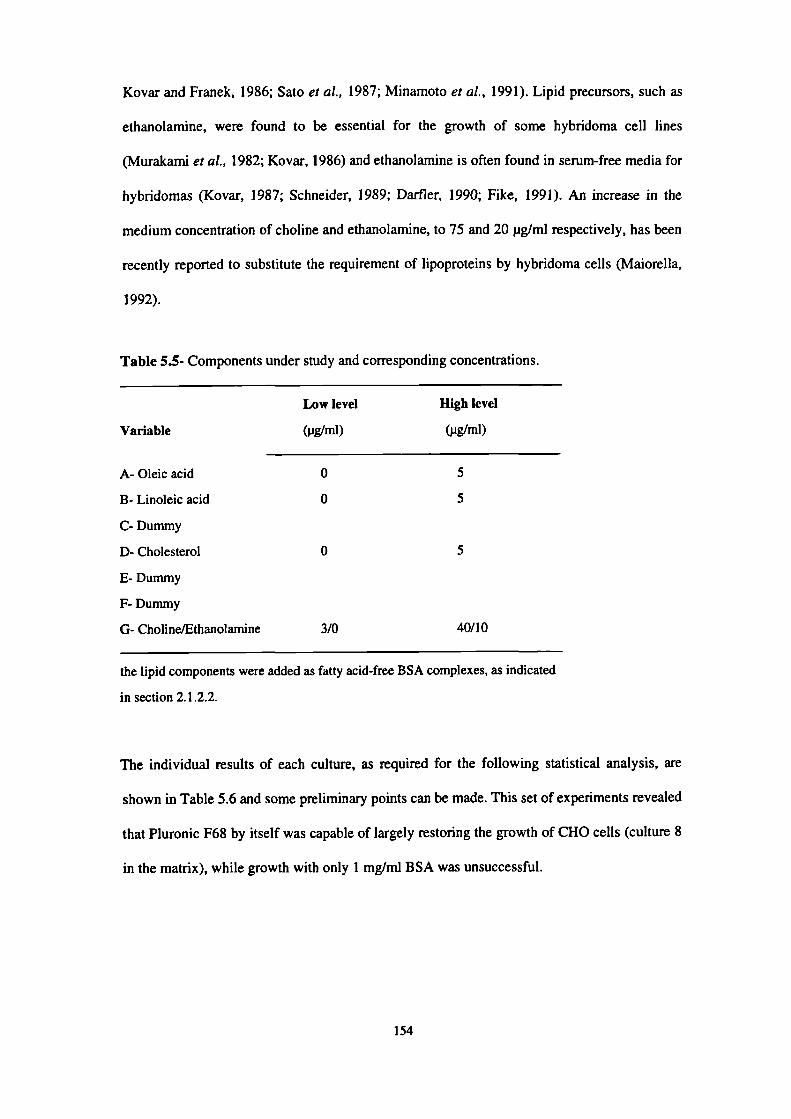
Kovar and Franek, 1986; Sato et a!., 1987; Minamoto et a!., 1991). Lipid precursors, such as
ethanolamine, were found to be essential for the growth of some hybridoma cell lines
(Murakami et al., 1982; Kovar, 1986) and ethanolamine is often found in serum-free media for
hybridomas (Kovar, 1987; Schneider, 1989; Darfler, 1990; Fike, 1991). An increase in the
medium concentration of choline and ethanolamine, to 75 and 20 pg/mI respectively, has been
recently reported to substitute the requirement of lipoproteins by hybridoma cells (Maiorella,
1992).
Table 5.5- Components under study and corresponding concentrations.
Low level High level
Variable (pg/mi) (jig/mi)
A- Oleic acid 0 5
B- Linoleic acid 0 5
C- Dummy
D- Cholesterol 0 5
E- Dummy
F- Dummy
G- ChoiineJEthanolamine 3/0 40/10
the lipid components were added as fatty acid-free BSA complexes, as indicated
in section 2.1.2.2.
The individual results of each culture, as required for the following statistical analysis, are
shown in Table 5.6 and some preliminary points can be made. This set of experiments revealed
that Pluronic F68 by itself was capable of largely restoring the growth of CHO cells (culture 8
in the matrix), while growth with only 1 mg/mI BSA was unsuccessful.
154

2
3
4
5
6
7
8
Control
9.6± 0.4
8.5 ± 0.3
6.2 ± 0.5
5.4 ± 0.2
8.0 ± 0.5
8.7 ± 0. 1
8.0 ± 0.3
7.5 ± 0.2
8.5 ± 0.3
0.025± 0.000
0.022 ± 0.001
0.017± 0.001
0.015± 0.001
0.022 ± 0.000
0.023 ± 0.000
0.024 ± 0.000
0.018± 0.000
0.023 ± 0.001
2114± 196
1714± 245
1364± 84
1672± 112
2878± 78
2236± 113
1539± 61
3110± 450
nd
4594± 196
4749± 158
3299± 605
4498± 429
5312± 746
4378± 157
3783± 552
6298± 640
9500± 320
Table 5.6- Cell growth and IFN-y data for Plackett-Burman analysis [see Table 5.4].
p
Cell titre
lnterferon-y titre (Hi/mi)
(h-I)
(105 cells/mI)
EXP 11°
50 h
116 h
nd= not determined.
A few considerations of this effect can be made. Pluronic polyols have been widely used in
bioreactors as shear protective agents. There is evidence that the mechanism through which
Pluronic F68 prevents cell damage in bioreactors is of a physical nature, by changing the
properties of the gas-liquid interfaces (bubbles), e.g. stabilisation of foams, (Handa-Corrigan et
al., 1989; Michaels et al., 1991; Thang et al., 1992b). However, the protective effect of
Pluronic F68 has also been attributed to its interaction with cell membranes, increasing the cell
membranes strength and resistance to shear damage (Murhammer and Goochee, 1988; Ramirez
and Mutharasan, 1990; Zhang et a!., 1992a). It has also been reported that Pluronic F68 has a
protective effect on the content of specific surface proteins of the cells during agitation
(Lakhotia eta!., 1993) and it is possible that its protective effect is related to this function. On
the other hand, Pluronic F68 has been shown to affect cell growth independently of shear
damaging conditions. Mizhari (1975) suggested that low concentrations of Pluronic F68 (0.05
to 0.1%) could enhance the transport of metabolites into cells by lowering the surface tension
of the medium, thus increasing cell growth rate. A concentration dependent effect in static
155

cultures has also been reported by Bentley et a!. (1989), providing evidence that cell growth
can be affected independent of agitation and aeration. In their study they also found that
commercial Pluronic F68 or further purified Pluronic F68 exerted different effects on cell
growth. The effect of the latter fraction varied with cell line, implying that the observed effect
could in part be related to impurities present in commercial Pluronic F68 preparations. Since
the present study was carried out in shake flasks the protective effect of Pluronic F68 against
bubble damage is excluded. The stimulating effect may still be related to a protection of the
cell integrity in lower protein content environment (1 mg/mI BSA), possibly by interaction
with the cell membranes, and the restoration of the BSA protective effects. At the same time, it
is also possible that any of the effects proposed by Mizrahi (1975) or Bentley et a!. (1989) are
reflected in this study.
A positive control (5 mg/nil BSA) was also included in this set of experiments, to allow a
direct comparison of the results. Cell titres of approximately 8.5x 10 5 cells/mi and maximum
product concentrations of around 9500 IU/ml were obtained. Although some of the cultures
inside the matrix were able to restore CHO cell growth, the resultant IFN-y titres were always
lower. Also, none of the lipid combinations used gave higher titres than cultures supplemented
with only Pluronic F68 (culture 8), although cell titres were higher in some cases (cultures
1,2,6 and 7).
The results obtained from the statistical analysis are presented in Table 5.7. Only linoleic acid
exhibited a significant positive effect for both cell growth rate and viable cell production (90%
and 80% significance respectively) while cholesterol produced a significantly negative effect
on both parameters (80% significance). Product titre at 50 h was used as an indication of the
initial production rates. Cholesterol showed significantly negative effects (99%) for IFN-y
production at that stage of the culture. Product titre at 116 h was used as an indication of
maximum titres obtained. Cholesterol, oleic acid and choline/ethanolamine all showed
156

significantly negative effects (80%, 70% and 80% respectively).
Table 5.7- Components and their effects on CHO cell growth and IFN-y production.
Variable
Oleic acid Linoleic acid Cholesterol Choline/Ethanolamine
Cell growth a 0.002175 0.004625 -0.002625
0.001425
rate b 1.44 3.06 -1.74
0.94
c 70% 90%
80%
V= 0.00000228 SE= 0.0015
Viable cell a 0.375 1.575 -1.425
0.025
production b 0.48 2.01 -1.82
0.03
c 80% 80%
LFN-y titre
(50 h)
IFN-y titre
(116h)
V= 0.616
a -0.1225
b -1.42
c 70%
V= 0.00749
a -0.095
b -1.22
c 70%
V= 0.00602
0.0075
0.09
0
0
SE= 0.785
-0.3275
-3.78
99%
SE= 0.0865
-0.170
-2.19
80%
SE.= 0.0775
0.0525
0.61
-0.135
-1.74
80%
a- effect; b- t-value; c- significance level. Positive variables are shown in bold and negative variables
in italics. V= variance; SE standard error.
Two of the components under study must be pointed out, linoleic acid and cholesterol, the
former for its growth positive effect and the latter for its negative effect on both cell growth
and IFN-y production. The fatty acid composition of membrane phospholipids is similar to that
of the lipids present in the culture medium. Modification of the groups present in the
membrane will be reflected in cell function, most likely affecting cell growth rates. The growth
promoting effects of linoleic acid in serum-free cultures have been reported for hybridomas
(Kovar and Franek, 1986; Schneider, 1989; Darfier, 1991) and it was part of the protein-free
157
medium developed for parental CHO cell lines, including the CHO-Ki (Hamilton and Ham,
1977). The maintenance of the bilayer fluidity seems to be essential for normal cell growth.
Cholesterol is involved in the regulation of membrane fluidity and permeability (Phillips et a!.,
1987) and an increase in cholesterol content tends to reduce the fluidity of the membrane.
Ramirez and Mutharasan (1990) also found a decrease in the plasma membrane fluidity of
hybridoma cells by cholesterol enrichment of the medium, which was claimed to result in a
more robust cell, as measured by their survival to fluid mechanical stress. Doi et a!. (1978)
correlated the unsaturated fatty acid content of membrane phospholipids with cell growth and
found severe growth inhibition if the content of unsaturated fatty acids in the membrane was
reduced to less than 50%. The fact that this study indicated cholesterol as having negative
effects on CHO cell growth and WN-y production may be related to this function. Low density
lipoprotein, which contains cholesterol, has been shown to have either growth promoting or
inhibiting effects, depending on the cell line (Kawamoto et a!., 1986). Albumin has been
substituted by a complex composed of alpha-cyclodextrin with linoleic acid and cholesterol, at
concentrations of 2 ig/m1 and 0.1 pg/mI respectively, for the production of interferon by
lymphoblastoid cells (Minamoto et a!., 1991). The concentration of cholesterol these authors
used was much lower than that in the present investigation. Studies on the effects of lipid
supplements on product formation are however relatively few. Schmid et al. (1991) found that
supplementation of low serum medium with different combinations of fatty acids, namely
oleic and linoleic acids, did not have any effect on BHK cell growth but that anti-thrombin
production was a positive function of these supplements. Of the lipids used in the present
study, there was no indication of any positive effect on IFN-y production.
158

53.3- Linoleic acid substitution of the lipid mixture
The results described above showed that linoleic acid was a positive variable for cell growth,
while no significant effect was detected for JFN-y production, under the conditions of the
study. As a consequence, the differential effect of linoleic acid on these parameters was then
investigated. Low BSA cultures (1 mg/mI) containing 0.1% Pluronic F68 were supplemented
with linoleic acid at two concentrations, 4 and 8 ig/ml, and culture performance was compared
with the addition of the lipid mixture. Time courses for this set of experiments are shown in
Figure 5.2a,b and specific growth and production rates are presented in Table 5.8. Linoleic
acid was found to be a better substitute than the complex lipid mixture for cell growth (Figure
5.2a), as indicated by higher cell yields (ca. 35%) and higher specific growth rates (Table 5.8).
Pluronic F68 supplemented cultures (medium K) showed better growth than cultures with
further addition of the lipid mixture (medium E), stressing the growth inhibitory effects that
some of its constituents, such as cholesterol, may have.
Table 5.8- Specific cell growth and IFN-y production rates in low-BSA cultures.
p
qWN
Medium (h-i)
(IU/iO6cells/h)
235
106
169
121
89
A-BSA5 mg/mi
E- BSA I mg/mi + 1 mI/l lipid mixture + 0.1% Pluronic F68
K- BSA 1 mg/mi + 0.1% Pluronic F68
M- BSA I mg/mi + 4 ig/ml linoleic acid + 0.1% Pluronic F68
L- BSA I mg/rn] + 8 pg/rn] linoieic acid +0.1% Pluronic F68
0.024 ± 0.002
0.022 ± 0.001
0.024 ± 0.001
0.026 ± 0.001
0.026±0.001
159

• A-Smg/in1BSA
N K•InnIBSA+0.1%Pluronk• E-lmg/mIBSA+lmlIIUpmlx+0.1%Piuronic
A M-lmgImIBSA+4pglmiiinoielc+S.1%Piuronic
8 pg/mi linoleic + 0.1% Pluronica
11
10
9V
8
7
6
5V
= 4VU
V 3
10000 h
8000
00
L2000
0
DxDE
01 p
0 50 100 150 200Time (h)
48 62 fl 92.5 134.5Time (h)
Figure 5.2- a) Cell growth and b) IFN-y production in cultures A, K, E, M and L.
160

IFN-y analysis showed a significant reduction in product titres in lipid/linoleic supplemented
cultures (Figure 5.2b). Cultures with only Pluronic F68 supplementation showed higher WN-y
titres than the latter cultures, indicating a detrimental effect of linoleic acid and lipid mixture
on IFN-y production. Although linoleic acid was identified by the Plackett-Burman procedure
as having a positive effect on CHO cell growth, its negative effect on IFN-y production, which
was here determined, was not manifested. This could be a sign of interaction between variables
but could also indicate that the magnitude of the effect of other variables, namely cholesterol,
was high enough to mask the effect of linoleic acid.
Lipid mixture was less effective than linoleic acid itself, suggesting that something in addition
to linoleic acid had a negative effect on IFN-y production. Initially, cultures containing a lower
concentration of linoleic acid (4 pgi'ml; medium M), produced more IFN-y than cultures with
8 pg/mI (medium L), but at ca. 90 h the production titres were the same. In the latter case,
JFN-y gradually increased in culture while in the former maximum titres were achieved earlier.
A dose dependent effect of linoleic acid on IFN-y production is suggested; while 8 pg/mi
initially slowed down production, when compared to 4 pg/mi, it seemed to be more beneficial
later in the culture. Initial production rates of IFN-y are shown in Table 5.8. The lowest
specific production was seen in cultures containing 8 pg/mi linoleic acid (medium L). The
value found for the culture supplemented with the lipid mixture (medium E) was intermediate
between the culture with 8 pg/mi (medium L) and the culture with 4 pg/mi (medium M)
linoleic acid; it is interesting to note that the concentration of the lipid mixture used should
provide the medium with ca. 6.5 pg/mi linoleic acid. It is possible that a cumulative negative
effect of linoleic acid on productivity is reflected here. Although low BSA cultures all showed
lower IFN-y production rates, the decrease was much less pronounced if no lipid addition was
made (cf. medium K and media E,M,L).
The possibility existed that these supplements (lipids, Pluronic F68) were affecting the
161

secretory machinery of the cell at some stage of the process and, as a consequence, the product
was not being properly secreted by the cells. The determination of IFN-y titres on cell lysates
from these cultures indicated that this was probably not the case since the intracellular values
were similar for all the cultures, and much lower than what was secreted (Table 5.9). It was
interesting to note that the specific rate of IFN-y secretion per IO6cellsIh (see Table 5.8) is not
much different from the amount of IFN-y/lO6cells kept intracellularly. As a percentage of the
extracellular component, secretion appears to be affected in the early stages of the culture
(media E,L) as compared with no addition (media A, K).
Table 5.9- Intracellular and extraceilular IFN-y accumulation in low-BSA cultures.
LFN.y (IU/106 viable cells)
Medium A
Medium K
Medium E
Medium L
62 h
Intracellular Extracellular
266
7645
3.48%
173
5876
2.94%
168
2493
6.74%
167
2011
8.30%
92 h
Intracellular Extracellular
242
8354
2.90%
125
6242
2.00%
110
4747
2.32%
93
3717
2.50%
The glycosylation profiles of the product obtained under each condition of medium
supplementation were then determined. Analysis of the proportion of each of the glycoforms
for all BSA-reduced cultures showed a different pattern from control cultures (Figure 5.3a-e).
In Figure 5.4 is an example of the patterns obtained on a gel for a control culture and a low
BSA culture, showing the stronger bands of the non-glycosylated form in the latter cultures.
162

*00 a.A- S mg/mt BSA
0
—0— ON-101-- iN
• 2N
50 200 *50 500
Time (h)
b
K. 1 mg/mI BSA + 0.1% Piuronic
p
0 50 200 250 500
Time (h)
200 c
E- 1 Mg/mi ISA + 1 mIll Up mix + 0.1% PIuronic
Time (h)
100 *1 *00
M. 1 mg/mI ISA + 4 pg/mI IinoIeic + 0.1% PIuronic L- 1 mg/mi ISA + I pig/mi Knoleic + 0.1% Pluronlc
1: 160
Time (h) Time (h)
Figure 5.3- Glycosylation patterns of IFN-y obtained in cultures A, K, E, M and L. [No error
bars are given for culture M as only one set of results were obtained].
163
The control culture (5 mg/mI BSA) produced a relatively low level of non-glycosylated form,
5-7%, up to 100 h, while the 2N glycoform gradually decreased from Ca. 65% at 20 h to ca.
45% after 100 h in culture, with a concomitant increase in the IN glycoform (Figure 5.3a). A
rapid increase in the proportion of the non-glycosylated form was noticed in all the low BSA
cultures (Figure 5.3b-e), ca. 15-25% in 50 h, which for cultures with Pluronic F68 and
Pluronic F68 plus linoleic acid was simultaneous with a rapid decrease in the proportion of the
2N glycoform to 40% and an increase in the IN glycoform to the same value. This decrease
was not so pronounced in cultures supplemented with the lipid mixture, in which the
proportion of the 2N glycoform was maintained at higher levels for longer time (Ca. 50% at 50
h). Since cells with only 1 mg/mI BSA did not grow, it could not be determined whether the
addition of Pluronic F68 or the reduction of the BSA concentration itself was the cause for this
change. As discussed earlier in this Chapter, Pluronic F68 has been shown to alter the cell
membrane (Murhammer and Goochee, 1988; Ramirez and Mutharasan, 1990; Zhang et a!.,
1992b), which may influence the latter's functionality. Reduction of BSA by itself may also
affect the lipid composition of the membrane, which could also possibly affect the
glycosylation process.
The distribution of the initial production rates of each glycoform was determined (Figure 5.5).
Low BSA cultures supplemented with Pluronic F68 alone showed the highest initial rate of
production of the non-glycosylated form. The control culture showed the highest production
rates of IFN-y glycosylated at 1 or 2 sites, while presenting the lowest rate for the non-
glycosylated form. The titres of each of the glycoforms throughout the culture is shown in
Figure 5.6. Lower titres of both glycosylated forms and relatively higher titres of non-
glycosylated form were present at any time in low BSA cultures, as compared to the control
culture (5 mg/ml). In terms of production of the glycosylated forms, none of the low BSA
conditions presents a favourable alternative to the control situation, and among them
supplementation with only Pluronic F68 yields the highest final titres of the iN and 2N
glycoforrns.
164

.
.= u\
• A-5nigfmJBSA
D K.lnig/mJBSA+0.1%Iluroidcfl E-lmeitnIBSA+lmlflhJpmlx+I.1%Plurciik
fnr Unolcie + 0.1% Pluronic150
I00'I
C0
50
0
l I)a
I) -
31
21.:-)
11.3
1 2 3 I 5 i 7 9
Figure 5.4- Analysis of IFN-y variants obtained in cultures A and L. Immunoprecipitated
samples were resolved by SDSIPAGE on a 14% polyacrylamide gel and detected by silver stain, as
described in section 2.2.2.2. The white arrow indicates the direction of migration. Lane 1- MW
markers; lane 2 to 5-samples of culture A at 36, 60, 90 and 110 h, respectively; lane 6 to 9- samples of
culture L at 36, 60, 90 and 110 h, respectively.
0 1 2N -glycoform
Figure 5.5- Initial production rates of the three JFN-y glycoforms in cultures A, K, E and L.
165

ON— A-S mg/mi BSA
a • - K. 1 mg/mi BSA • 0.1% Piurvnic
K- 1 mg/mi BSA + 1 mIll Lip mix • 0.1% Piuronic
-*- L- 1mg/mi BSA .8 pghni iinolesc .0.1% Plurunic
Time (h)
b-iN
—•— A
- K-•-- E
—a— L
8
0 50 lix) ISO
Time (h)
I c - 2N
/ 'I A
—0--K
I—a— L
8
01 . - -
0 50 100 150 200
Time (h)
Figure 5.6- Accumulation of each IFN-y glycoform during cultures A, K, E and L.
166
40
30
00
5.3.4- Effects of fatty acid-free BSA in culture
The results presented in the previous sections have consistently implied that BSA is a critical
component in the culture medium with respect to IFN-y production and glycosylation. One of
the possible reasons for the shift in the proportions of IFN-y glycoforms reported in the
previous section was the decrease in the BSA concentration, which could be related to
components it carries to the culture medium. The investigation of the effect of supplementing
the medium with a more refined BSA, a fatty acid-free BSA (FAF-BSA), could provide more
insight to the importance of the endogenous BSA lipid to the glycosylation of IFN-'y.
Furthermore, linoleic acid itself is added to the medium as a FAF-BSA complex. The fact that
the growth promoting effects observed for linoleic acid were not related to the additional FAF -
BSA was also investigated. The effect of the FAF-BSA alone was studied by supplementing
the same set of cultures as described in the previous section with FAF-BSA, in order to have a
constant concentration I mg/mi. Time courses for those cultures are shown in Figure 5.7a.
Addition of an extra 1 mg/mi FAF-BSA above the Pluronic F68 supplemented cultures did not
have the same stimulating effect on cell growth as the addition of the linoleic acid complex
(cf. medium 0 and medium P), attributing that effect to the linoleic acid itself. Again, Pluronic
F68 showed its own stimulating effect on cell growth (cf. medium N and medium 0). The
extra FAF-BSA had a positive effect on Pluronic F68 plus lipid supplemented cultures
(medium Q), which this time achieved the same growth as Pluronic F68 supplemented cultures
(medium 0), and this could be due to an increase in the total BSA itself or due to a protective
effect of the FAF-BSA against any inhibitory lipid component. Media R and S, which
corresponded to low-BSA cultures supplemented with lipids or linoleic acid but deprived of
Pluronic F68 (specified in Table 5.1), were also studied in this set of experiments, but cell
growth was unsuccessful, which once again reflects the importance of Pluronic F68 in low
BSA cultures.
167

10
9E
II
vi
'4
'3V
N
h12000
11
10000
9000
180007000
6000
5000
4000
3000
2000
1000
0
UAONDQ
• A.Smg/mIBSAO N.lmg/mIBSA.lmg/mIFAF-BSA• Q. 1 mg/nil BSA +1 mg/nil FAF.BSA +1 mI/l Up mix + 0.1% Pluronic
£ P-i mg/mi BSA + 1 mg/nil FAF-BSA + S&g/mI linoleic + 0.1% Pluronic
.1% Pluroiilc
0 I I
0 50 100 150 200Tlme(b)
20 44 68 903 1143 1315Time (b)
Figure 5.7- a) Cell growth and b) WN-y production in cultures A, N, 0, P, and Q.
168

IFN-y production for these cultures is shown in Figure 5.7b. Despite lower cell numbers, the
IFN-'y titres obtained in cultures without lipids and Pluronic F68 supplements (medium N)
were similar to the lipid supplemented cultures (media Q and P), reflecting a higher initial
IFN-y production rate in non-supplemented cultures (Table 5.10). Lipid addition alone was
shown to have a negative effect on IFN-y production, which can be seen by comparing
medium 0 with medium Q, and is also indicated by lower rates of production observed in both
media P and Q. None of the cultures achieved the same titres as the control culture, and no net
positive effect on IFN-y production was observed by adding the extra FAF-BSA.
Table 5.10- Initial IFN-y production rates in low-BSA cultures.
IFN
Medium (lU/i O6ceiIsIh)
A-BSA5mg/nil
203
N- BSA I mg/mi + 1 mg/mi FAF
156
0- BSA 1 mg/mI + 1 mg/mI FAF + 0.1% Pluronic F68 161
P- BSA I mg/mi + I mg/mi FAF + 8 ig/ml linoleic acid + 0.1% Pluronic F68 121
Q- BSA 1 mg/mi + 1 mg/mI FAF + 1 mi/L lipid mixture + 0.1% Pluronic F68 117
Examination of the different glycoforms revealed that the addition of extra FAF-BSA did affect
the glycosylation process. A very low level of non-glycosylated form was observed in both
high and low BSA control cultures (media A and N) while all lipid or Pluronic F68
supplemented cultures (media 0,P and Q) showed a fairly constant level of about 9-12%
(Figure 5.8 a-e). These data seem to indicate that it was not only the reduction in BSA
concentration per se that caused the previous increase in the non-glycosylated form, but this
may have also resulted from the addition of Pluronic F68 or lipids. It is interesting to note that
the proportion of the 2N and IN glycoforms were different in cultures containing FAF-BSA,
as compared to the control culture suggesting that the addition of FAF-BSA alone may affect
the glycosylation pattern of WN-y
169
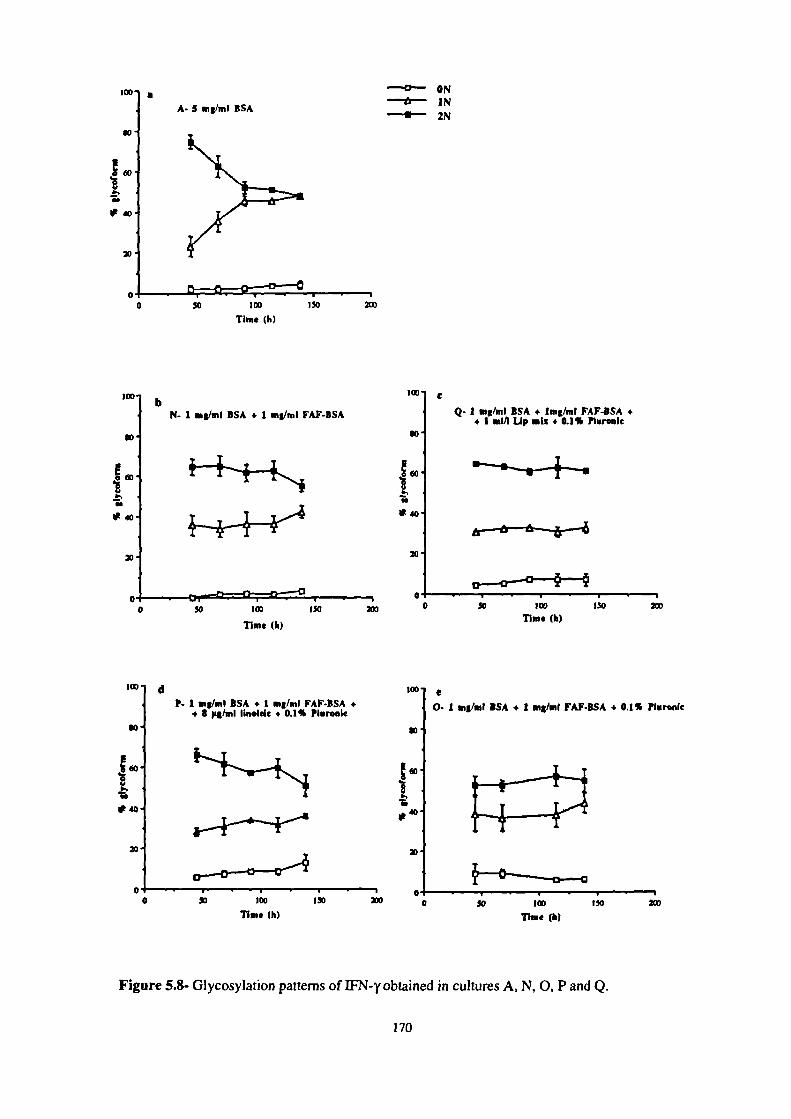
ISO 200
Ioo
A- 5 .ig/mI RSA
1:
0 50 100Tim. (h)
—•°--- ON—LI-- iN
• 2N
00
100
bP4- 1 /mI ISA + 1 .ig/mI FAF-ISA
0 50 100 iSO 200
Tim. (h)
100 c
Q- 1 mg/mI ISA + linghnI PAP-ISA ++ I mi/I Up .iz + 0.1% Pluroiilc
$0
1:
Tim. (h)
dP. 1 mg/mI ISA + 1 mg/mI FAF.3SA +
, $ /ml linoleIc + 0.1% PleronIc
0 50 100 ISO
Time (h)
'' e0- I mg/mi ISA. 1 mg/mI PAP-ISA + 0.1% PiuronIc
II
;Tb". (h)
Figure 5.8- Glycosyiation patterns of JFN-y obtained in cultures A, N, 0, P and Q.
170

Higher proportions of the 2N glycoform were found throughout the cultures containing FAF-
BSA and the ratio of 2N glycoform to iN glycoform seemed to be higher in those cultures
supplemented with lipids, as compared to Pluronic F68 alone. The glycosylation could be
affected by some component that is carried by FAF-BSA. However this is most unlikely,
because the FAF-BSA used here comes from the same supplier as the medium BSA. It is in
fact obtained by subsequent treatment (charcoal and solvent treatment) of the latter one,
resulting in a more purified BSA (see section 3.4.3). Also, why that effect in the glycosylation
of IFN-y was not observed in culture L described in the previous section is not clear, as FAF-
BSA was also used to prepare the linoleic acid complex, although at a lower concentration. A
few considerations can be made. First, it is possible that the effect of FAF-BSA is only
manifested above a certain concentration, below which other factors dominate the process.
Also, it was noticed that 1FN-y obtained from cultures containing only 1 mg/ml BSA plus
1 mg/mI FAF-BSA (medium N) presented higher proportions of the double glycosylated form
than control cultures with 5 mg/mI BSA (medium A). This can lead to the hypothesis that
there is something present in BSA that inhibits glycosylation, for example the fatty acids it
carries. Considering that linoleic acid itself can be one of these components, it is possible that
its effect is only masked if a certain proportion of FAF-BSA is used.
Again, initial rates of production of the non-glycosylated form were higher in cultures
supplemented with Pluronic F68 alone (Figure 5.9). The titre of each of the glycoforms in the
different cultures is shown in Figure 5.1 Oa-c. Despite the lower cell numbers obtained in non-
supplemented low BSA cultures (medium N), the titres of glycosylated IFN-y were either
higher than or similar to those obtained in low supplemented ones (medium O,P,Q). In terms
of production of the 2N glycoform, the level difference between the cultures was reduced,
although the control culture still showed the highest titres. In this respect, among low BSA
cultures a more favourable situation was found when supplementing low BSA cultures with
Pluronic F68 alone.
171

• A.Smg/inIBSA
O N. 1 mg/mI BSA +1 nig/mI FAF.SSA200
0 Q. Img/mIBSA+lmgImIFAF.BSA+liniflLlpmix+O.l %Plurowc
P-lnig/mIBSA+1 FAF.BSA+&/mIlhmielc+O.1 %Pluror,ic
0 0-1 mg/mi BSA +1 mg/mI FAF-BSA +11 % Jluronic
150
100
00 1 2
N -glycoform
Figure 5.9- Initial production rates of the three IFN-y glycoforms in cultures A, N, 0, P and Q.
5.3.5- The independent effects of Pluronic F68 and fatty acid-free BSA
From the previous experiments, it seemed that Pluronic F68 and FAF-BSA per se could
influence the glycosylation patterns of IFN-y obtained from low BSA cultures. As a
consequence, these effects were investigated by a simultaneous comparison of 1 mg/mI
cultures supplemented either with Piuronic F68 or I mg/mi FAF-BSA or both. Cell growth
and product titres for these cultures are shown in Figure 5.11a,b. Again it was observed that
Pluronic F68 assisted cell growth, although its effect did not match that of the control culture
(5 mg/mI). Addition of FAF-BSA alone supported cell growth, but to a lesser extent than
supplementation with Pluronic F68 (cf. medium N and medium K). When Pluronic F68 and
FAF-BSA were added together the effect of the former predominated. The typical reduction in
LFN-y titres was noticed in low BSA cultures (Figure 5.1 Ib), but the final titres obtained in
these cultures did not vary much, despite the lower cell numbers obtained in medium N.
172
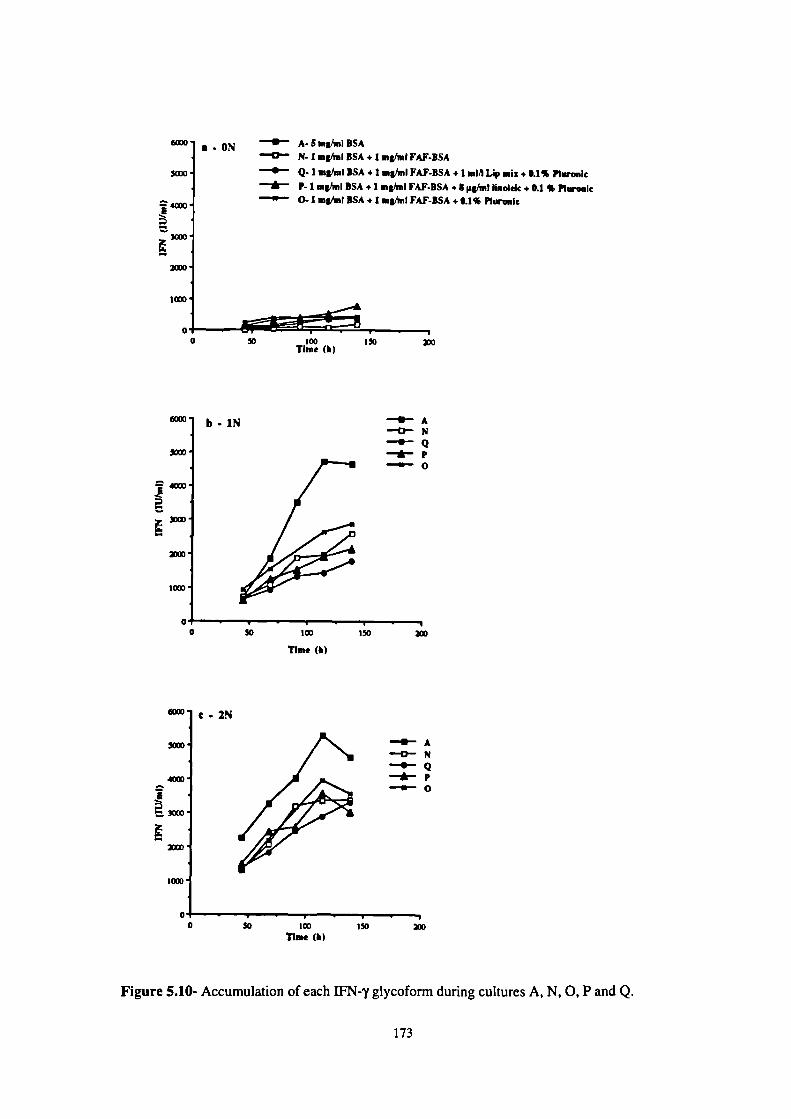
a - ON A-S mgnl ISA0 N. I uignI ISA, I mghnl FAF-BSA
- Q-1mI/mIISA+1.,hnlFAF.BSA.1mILipmjz,Oj%pIurijnjc?.1mghnIBSA.1mghuIFAF.ISA,5p.jc+Ol%pIjc
- 0-1 mg/.iI ISA +1 .ignl FAF.ISA + 0.1% Plurm,k
r
Time (h)
-•- A—•0— N-.- Q—a— p- 0
I
b-iN
u1
050 ISO
Tim. (k)
c - 2N
5w,1 / -•- A—0— N-.- Q.—.*-- p-0- 0
0 50 I ISOTim. (h)
Figure 5.10- Accumulation of each JFN-y glycoform during cultures A, N, 0, P and Q.
173
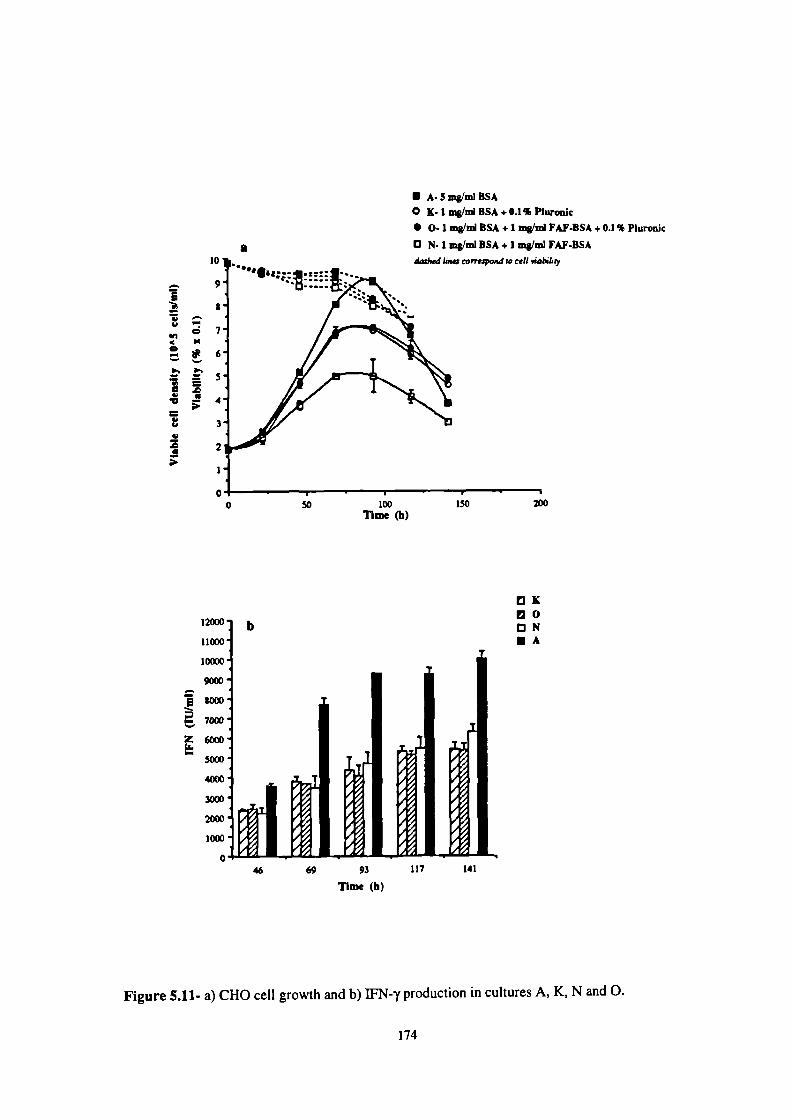
10
- 9E
8
07M
0
3
2
12000
11000
10000
• 8000
7O00
4000
3000
2000
0
OK
DOON
a
• A.Sing/mIBSAo K.1mg/mBSA+0.1%Phiroiüc• 0. 1 mg/ni BSA +1 mg/ni FAF.BSA + 0.1% Pluronic
O N. 1 mg/mI BSA +1 mg/mI FAF.BSA
0 I0 50 100 150 200
Thne(b)
46 69 93 117 141
Time (h)
Figure 5.11- a) CHO cell growth and b) IFN-y production in cultures A, K, N and 0.
174
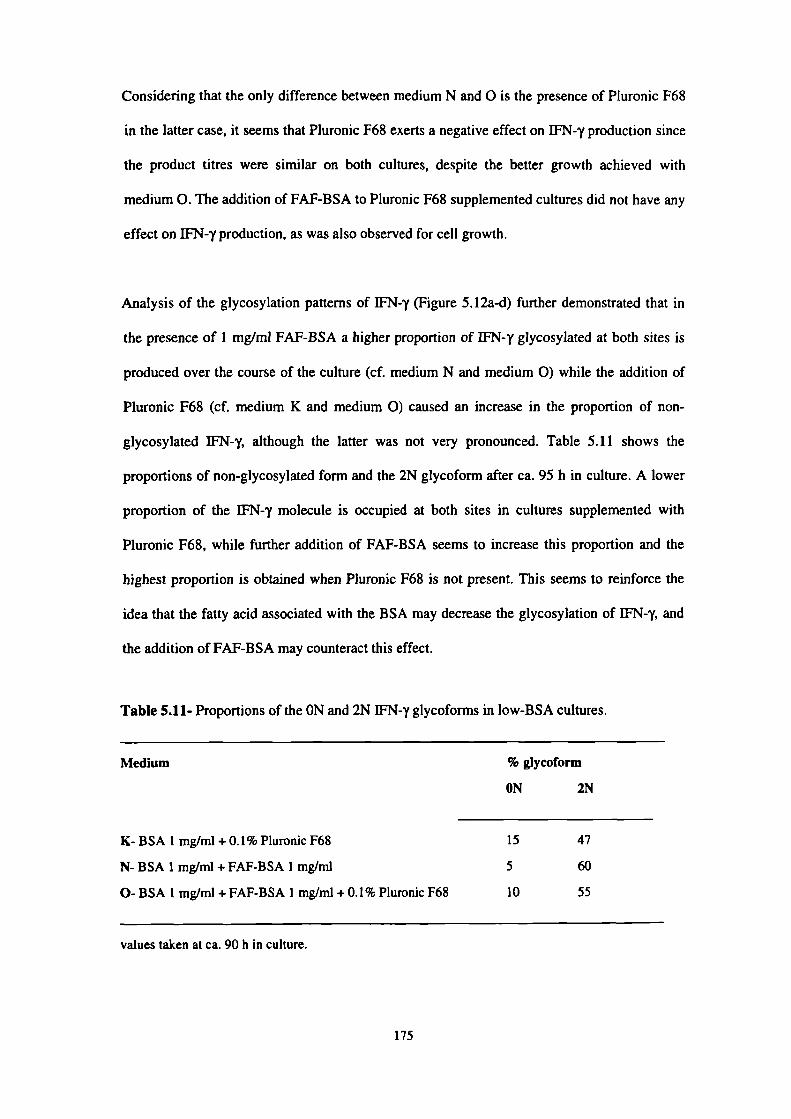
Considering that the only difference between medium N and 0 is the presence of Pluronic F68
in the latter case, it seems that Pluronic F68 exerts a negative effect on IFN-y production since
the product titres were similar on both cultures, despite the better growth achieved with
medium 0. The addition of FAF-BSA to Pluronic F68 supplemented cultures did not have any
effect on IFN-y production, as was also observed for cell growth.
Analysis of the glycosylation patterns of IFN-y (Figure 5.12a-d) further demonstrated that in
the presence of 1 mg/mI FAF-BSA a higher proportion of IFN-y glycosylated at both sites is
produced over the course of the culture (cf. medium N and medium 0) while the addition of
Pluronic F68 (cf. medium K and medium 0) caused an increase in the proportion of non-
glycosylated JFN-y, although the latter was not very pronounced. Table 5.11 shows the
proportions of non-glycosylated form and the 2N glycoform after Ca. 95 h in culture. A lower
proportion of the IFN-y molecule is occupied at both sites in cultures supplemented with
Pluronic F68, while further addition of FAF-BSA seems to increase this proportion and the
highest proportion is obtained when Piuronic F68 is not present. This seems to reinforce the
idea that the fatty acid associated with the BSA may decrease the glycosylation of WN-y and
the addition of FAF-BSA may counteract this effect.
Table 5.11- Proportions of the ON and 2N IFN-y glycoforms in low-BSA cultures.
Medium
% glycoform
ON 2N
K- BSA 1 mg/mi + 0.1% Pluronic F68 15 47
N- BSA 1 mg/mi + FAF-BSA 1 mg/mi 5 60
0- BSA 1 mg/mI + FAF-BSA I mg/ml + 0.1% Pluronic F68 10 55
values taken at ca. 90 h in culture.
175

100
A- S mg/mi ISA
So
—0--- ON-ni iN
• 2N
50
0 - -0 50 100 ISO
Tim. (I,)
100 b
K- I mg/mi 1SA . 0.1% Pharonic
IC
Time (I,)
100 C 100 d
0- 1 mg/mI ISA + 1 mg/mi FAF-ISA + 0.1% Piuronic N- 1 mg/mi ISA + I ig/mi FAP-ISA
SO SO
6O
TI•40
0 50 100 ISO 0 30 100 ISO
Tim. (h) Time (h)
Figure 5.12- Glycosylation patterns of IFN-y obtained in cultures A, K, N and 0.
176

5.4- Supplementation of control cultures with lipids and Pluronic F68
The hypothesis put forward until now were based mostly on low BSA cultures, and it was not
clear how much the reduction in BSA itself could account for the results obtained. Analysis of
the effect of lipid and Pluronic F68 over control cultures (5 mg/mI BSA) on cell growth and
IFN-y production was important to determine their independent effects on these parameters.
5.4.1- Addition of lipids to control cultures
Addition of the previously used lipid mixture (medium B) to high BSA cultures (medium A)
improved cell growth, with approximately 25% increase in cell titres and a slight extension of
the stationary phase (Figure 5.13a), reinforcing the idea that the positive effect of BSA
observed before was of a nutritional nature. The fact that the same lipid supplementation did
not have the same effect on cell growth over I mg/mi BSA plus 0.1% Pluronic F68 cultures
(cf. medium E and medium K, section 5.33) further suggests that the net effect may be
dependent on the overall lipid balance of the medium. However, despite the higher cell
numbers achieved with this formulation, IFN-y titres were reduced and this was more
predominant as the time course of the culture increased (Figure 5.1 3b), with approximately
35% reduction on initial production rates. This result supports the finding that lipid
supplementation has negative effects on IFN-y production.
Analysis of the proportions of the three glycoforms throughout the cultures showed little
difference in the glycosylation patterns of the product (Figure 5.14a,b). Addition of the lipid
mixture over 5 mg/mi BSA cultures did not seem to affect the giycosylation pattern of the
product. This is an indication that the glycosylation process is not directly linked with the rate
of product formation, since cells with lipid supplementation secreted lower amounts of
product. This is consistent with the fmdings of Bulleid et al. (1992), who reported that while
177
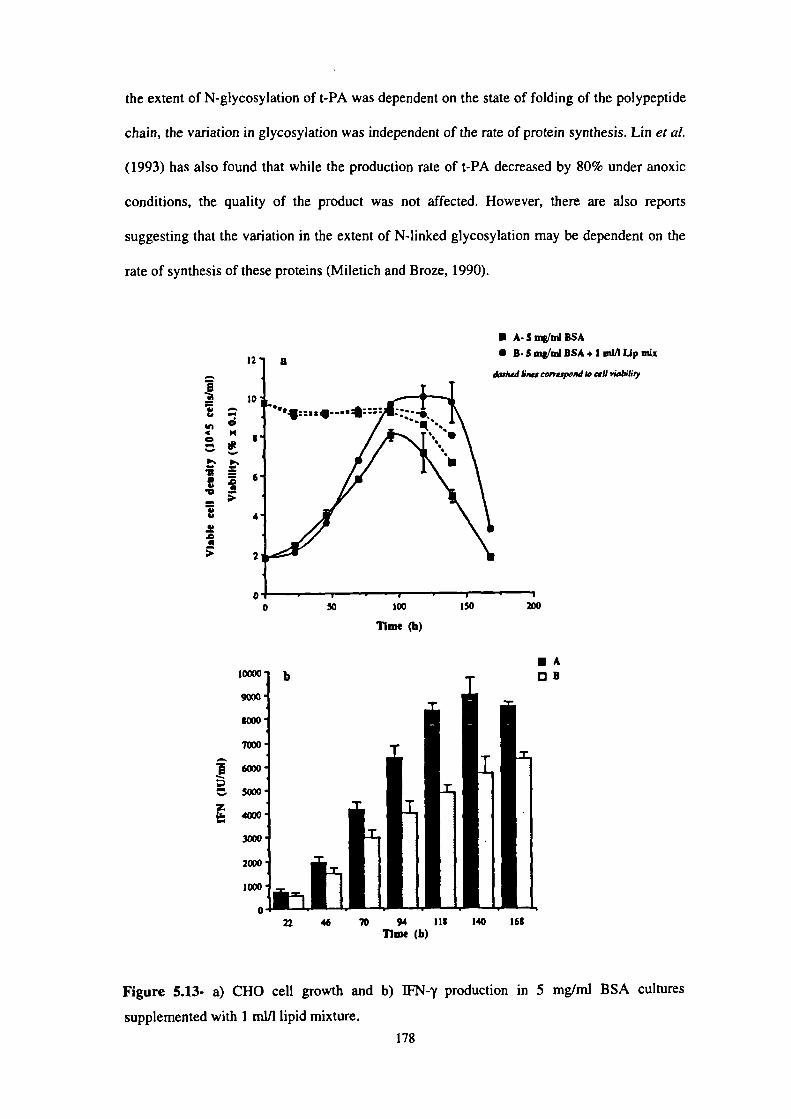
12
30
WI
o I
=
4
I
2
• A.Smg!mIBSA• B.mgurnIBSA+Im1/I Lip mix
ctvv.,pond So cr15 via51iry
10000
9000
$000
7
500O
4000
3000
2000
1000
0
OH
the extent of N-glycosylation of t-PA was dependent on the state of folding of the polypeptide
chain, the variation in glycosylation was independent of the rate of protein synthesis. Lin et a!.
(1993) has also found that while the production rate of t-PA decreased by 80% under anoxic
conditions, the quality of the product was not affected. However, there are also reports
suggesting that the variation in the extent of N-linked glycosylation may be dependent on the
rate of synthesis of these proteins (Miletich and Broze, 1990).
o I -
0 50 100 150 200
llme(h)
22 46 70 94 III 140 16$Time (b)
Figure 5.13- a) CHO cell growth and b) IFN-y production in 5 mg/mI BSA cultures
supplemented with I mill lipid mixture.
178

100 aA- 5 uig/mi BSA —0— ON
£ IN
so • 2N
. 0j
I. I
•
40.J
20
o so isoTime (ii)
ioo- b
B- 5 mg/mi BSA . I mi/i Lip mix
so
. IT.40J
*1
20]
ci -
0 50 100 150 200
Time (h)
Figure 5.14- Glycosylation patterns of JFN-y obtained in 5 mg/mi BSA cultures supplemented
with I mi/I lipid mixture. [No error bars are given for culture B as only one set of results were
obtained].
5.4.2- Addition of Pluronic F68 to control cultures
No significant effect on cell growth was observable with 0.1% Piuronic F68 supplementation
(medium C) of high BSA cultures (Figure 5.15a). This seems to support the idea that the
positive effect observed in low BSA cultures is due to a replacement of the protective effects
of BSA. A decrease in initial production rate of IFN-y was detected, 186 against 235
IU/lO6cells/ml for the control culture, but final product titres were similar (Figure 5.15b).
179
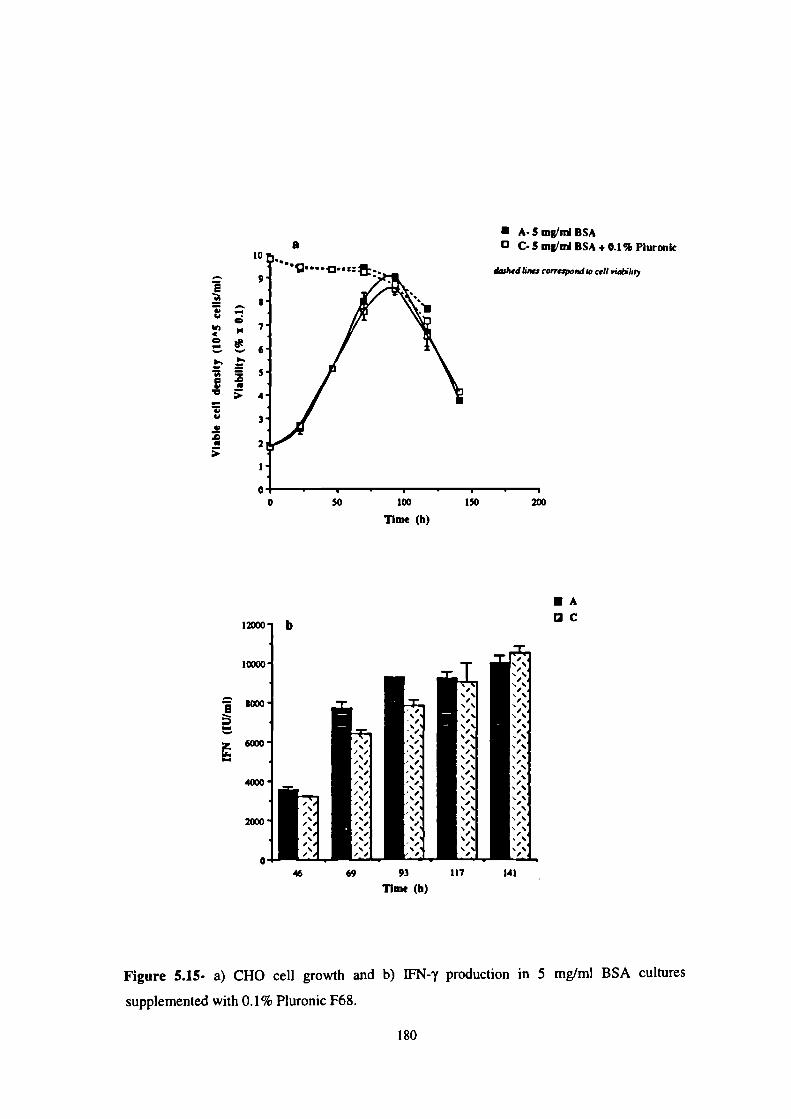
• A-Smg/miBSAD C-S mg/mi BSA +0.1% Pluronk
correrpordto cell viaihty
a
ioo b
Ioo
$000
4O
2O
0
DC
I0
9E
$•i —
-6
VU 3V
2
0
0 50 100 150 200
Time (h)
46 69 93 117 141
Time (h)
Figure 5.15- a) CHO cell growth and b) IFN-y production in 5 mg/mI BSA cultures
supplemented with 0.1% Pluronic F68.
180

A slight increase in the proportion of the non-glycosylated form of IFN-y was noticed in
Pluronic F68 supplemented cultures (Figure 5.16). After 90 h in culture Ca. 5% the non-
glycosylated form was found in control cultures against Ca. 13% in the supplemented ones.
This seems to indicate that the increase in non-glycosylated JFN-y observed in the low BSA
cultures described before could be partially due to the presence of Pluronic F68, but there is no
substantial evidence for this. The level difference in 2N glycoform was even less pronounced,
ca. 45% against 50% respectively. Considering that at that time titres of total IFN-y between
both cultures were not much different, the net effect of Pluronic F68 over high BSA cultures
probably is not significant.
a —0— ON
A- S mg/mi ISA i iN
U 2N
Time (h)
' bC- 5 ag/mI ISA + 0.1% ?I.roaic
so.
Time (h)
Figure 5.16- Glycosylation patterns of IFN-y obtained in 5 mg/ml BSA cultures supplemented
with 0.1% Pluronic F68.
181
5.5- Effect of serum in culture
The process of developing a more defmed medium did not seem to be straightforward and just
looking at cell growth was not enough. All along, BSA seemed to play a major role, both in
the level of JFN-y production and the authenticity of the molecule itself. It seemed sensible to
question cell behaviour and product characteristics in the presence of serum, by making the
medium even less defined. Protein and trace elements supplements were omitted in this
experiment and foetal calf serum was added at a concentration of 8%. Growth was improved to
a large extent, with higher specific growth rates and an increase of Ca. 90% in viable cell titre
(Figure 5.17a). Cell viability was maintained for a longer period. However, there was a great
reduction in product titres (Figure 5.1 7b), in a similar way to that previously observed with
lipid supplementation. The negative effect of serum may be related to the endogenous lipid
fraction that it carries. Serum also carries growth factors, such as EGF and FGF. They have
both been shown to stimulate the growth of these cells, while reducing the specific rate of
production of IFN-'y and in the latter case also reducing the titres achieved in culture
(Tomlin son, 1991 ).The results obtained here reinforce the idea that an optimal medium for cell
growth is not necessarily the best for IFN-y production.
IFN-y glycosylation analysis showed a different distribution pattern of the several variants
within the same major molecular weight glycoform (Figure 5.18), with stronger bands in the
regions of lower range of molecular sizes. In terms of proportion of each of the glycoforms, no
major differences were detected (Figure 5.19). The typical initial decrease of the 2N glycoform
was noticed, and after 70 h the proportions remained the same throughout the culture, with ca.
50% of the 2N glycoform, 40% of the IN glycoform and 10% of the non-glycosylated form.
182

• Serum-free (A)
FcS
lines correspond to cell abiliry
10000
8000
— 4000
2000
0
Serum-tree (A)
-
20
E
__ 15-
C
0 I I
0 50 100 150 200
Time (h)
22 46 70 94 118 140 168
Time (h)
Figure 5.17- a) CHO cell growth and b) IFN-y production in serum supplemented cultures.
183

It is possible that the differences observed in the patterns were due to proteolytic cleavage of
JFN-y by proteases carried by serum, as it has been reported for t-PA (Lin et a!., 1993). In
other reports, there was evidence that serum also affected the sugar content of the
oligosaccharide chains attached to the protein, e.g., changes in the sialic acid content (Megaw
and Jonhson, 1979; Pate! eta!., 1992; Maiorella eta!., 1993). However, in the present study no
studies were conducted to elucidate any of these hypotheses.
5.6- Concluding remarks
The results of studies reported in this chapter have shown clearly that cell growth and
production require different nutritional stimuli, giving support to the proposition made in
Chapter 3. The role of the culture composition was highlighted by the different responses that
were achieved for CHO cell growth, IFN-y production and IFN-y glycosylation towards several
culture environments. This has striking implications on the design of a medium culture for
biological production.
CHO cell growth was successfully achieved in low-BSA (1 mg/mi) cultures, but there was
always a reduction in IFN-y production. The importance of BSA in the culture medium was
once more evidenced. Furthermore, not only cell growth and/or IFN-y titres were altered in
low-BSA cultures, but also different WN-y glycosylation patterns were obtained from different
environments. Both concentration and type of BSA seemed to be important factors for this
process, although the glycosylation analysis was rather puzzling.
Among others, to obtain a more reproducible culture environment while reducing the
fermentation costs, were the main reasons for reducing the BSA concentration of the medium.
The fact that different types of BSA gave different responses in terms of authenticity of the
185

It is possible that the differences observed in the patterns were due to proteolytic cleavage of
JFN-y by proteases carried by serum, as it has been reported for t-PA (Lin et a!., 1993). In
other reports, there was evidence that serum also affected the sugar content of the
oligosaccharide chains attached to the protein, e.g., changes in the sialic acid content (Megaw
and Jonhson, 1979; Patel eta!., 1992; Maiorella eta!., 1993). However, in the present study no
studies were conducted to elucidate any of these hypotheses.
5.6- Concluding remarks
The results of studies reported in this chapter have shown clearly that cell growth and
production require different nutritional stimuli, giving support to the proposition made in
Chapter 3. The role of the culture composition was highlighted by the different responses that
were achieved for CHO cell growth, IFN-y production and !FN-y glycosylation towards several
culture environments. This has striking implications on the design of a medium culture for
biological production.
CHO cell growth was successfully achieved in low-BSA (1 mg/mI) cultures, but there was
always a reduction in IFN-y production. The importance of BSA in the culture medium was
once more evidenced. Furthermore, not only cell growth and/or IFN-y titres were altered in
low-BSA cultures, but also different IFN-y glycosylation patterns were obtained from different
environments. Both concentration and type of BSA seemed to be important factors for this
process, although the glycosylation analysis was rather puzzling.
Among others, to obtain a more reproducible culture environment while reducing the
fermentation costs, were the main reasons for reducing the BSA concentration of the medium.
The fact that different types of BSA gave different responses in terms of authenticity of the
185

product obtained put emphasis on the reproducibility issue and the choice of the starting
material for a production process was given primary attention. This consideration is
particularly important for components which are obtained from fairly undefined sources, such
as BSA.
An estimate of the unit cost of IFN-y obtained from each low-BSA culture in relation to the
cost of the culture medium and compared with the control culture, is shown in Table 5.12.
The culture with serum supplementation is also shown to give evidence of the large
contribution that serum has on the cost of animal cell culture fermentation. These figures do
not reflect commercial production costs because of the differential costs of small and large
scale purchasing and possibly the grades of chemicals used. However, the figures do reveal
valid comparative costs.
No improvements were obtained in terms of cost of production; at least a 50% increase in the
unit cost of IFN-y was obtained in the low-BSA cultures, reflecting the lower titres achieved.
However, the various conditions which were used led to the production of IFN-y with different
glycosylation patterns in terms of macroheterogeneity (proportion of oligosaccharide attached)
in the case of low-BSA cultures, and in relation to the distribution of the molecular weight
variants among the three major forms (proteolytic cleavage and/or type of sugars attached) in
the case of serum supplemented cultures. How much this would affect the biological properties
of the product, such as pharmokinetics and immunotolerance, would be the kind of analysis
required for the evaluation of each production system.
186
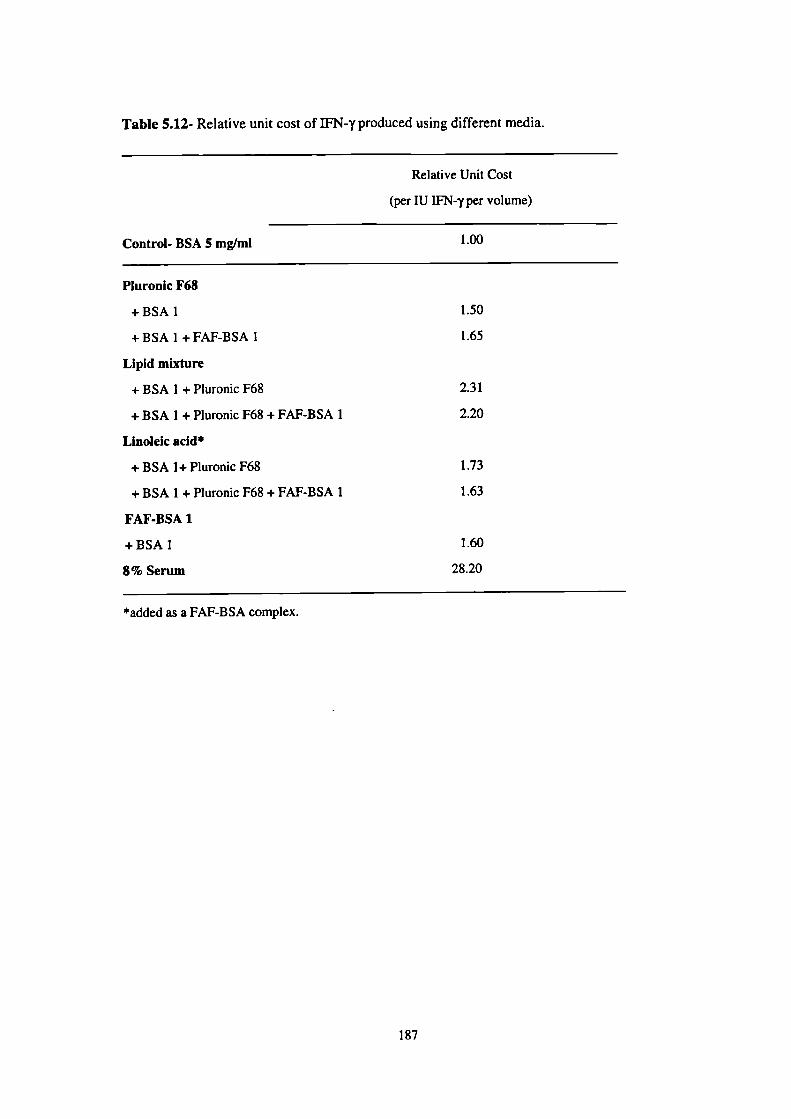
Table 5.12- Relative unit cost of IFN-y produced using different media.
Relative Unit Cost
(per IU IFN-y per volume)
Control- BSA 5 mg/mI
1.00
Pluronic F68
+BSA1 1.50
+ BSA I + FAF-BSA 1 1.65
Lipid mixture
+ BSA 1 + Pluronic F68 2.31
+ BSA 1 + Pluronic F68 + FAF-BSA 1 2.20
Linoleic acids
+ BSA 1+ Pluronic F68 1.73
+ BSA 1 + Pluronic F68 + FAF-BSA 1 1.63
FAF-BSA 1
+BSAI 1.60
8% Serum 28.20
*added as a FAF-BSA complex.
187

6- GENERAL DISCUSSION
6.1- The Plackett-Burman statistical design applied to the optimisation of the cell
culture composition
The benefits arising from using statistically designed experiments have been illustrated in this
study. Clearly, the Plackett-Burman procedure is a very valuable tool to process optimisation.
The identification of important variables to the process could be made using a fairly small
number of experiments and an improvement of both CHO cell growth and IFN-y production
was achieved based on those variables (Chapter 3). In fact, when all the nutrients identified as
positive for both parameters were added simultaneously to the culture, improvements in excess
of 40% were obtained in CHO cell growth and IFN-y production. The effect of individual lipid
components on CHO cell growth and IFN-y production in low-BSA cultures (1 mg/mI) was
also determined with this technique (Chapter 5). A few studies on parameters affecting cell
culture performance have already emphasised the benefits of including such methods in a
rational optimisation procedure (Ganne and Mignot, 1990; Gebert and Gray, 1990; Gaertner
and Dhurjati, 1993). There are limitations to these techniques but a cautious analysis of the
results can identify key factors for further investigation.
The possible interactions between nutrients that may take place in the cell culture medium
were not accounted for in this study. The Plackett-Burman experimental design does have its
limitations, arising from the fact that it is a highly fractionated procedure. Interactive effects
among variables can not be identified, unless the number of experiments N is an integral
power of 2. This is a weak aspect of the technique and must be considered when evaluating the
results. It is possible that an assigned main effect to an independent variable is in fact the result
of two-factor or even higher order interactions between other variables, i.e., the effect of main
variables and interactions between variables are "confounded". However, high-order
188

interactions usually are not as important as main effects. In this study, a more efficient
utilisation of glucose and glutamine was seen when increasing the concentration of the positive
variables in the culture (Chapter 3), possibly due to interactive effects between variables. In
Chapter 5, linoleic acid was identified as having a positive effect on CHO cell growth, but its
negative effect on WN-y production, which was later determined, was not manifested in the
Plackett-Burman analysis. It is possible that the magnitude of the effect of other variables,
namely cholesterol, was high enough to mask the effect of linoleic acid. In fact, other
restrictions of the technique are associated with the choice of the nutrient concentration to
include in the experimental matrix. The difference between the high and low level should be
large enough to allow a measurable effect but there is the danger of masking the results of
other variables if that differential is too high.
Other statistical procedures, also based on fractional factorial studies, allow the quantification
of interactive effects. The effect of the main independent variables may be separated from the
effect of the appointed interactive variables (Gebert and Gray, 1990). However, if the total
number of variables, including main plus interactive variables, exceed the number of
experiments, then not all the effects can be isolated, leading again to the occuence of
"confounding" among the determined effects (Gaertner and Dhurjati, 1993).
6.2- The cell culture environment
The present study gave clear indication that CHO cell growth and IFN-y production exhibit
different dependencies on the cell culture environment. Furthermore, the glycosylation profile
of IFN-y also varied with some of those changes. It is not easy to assign specific roles to each
of the investigated components, and the net effect obtained on either CHO cell growth or IFN-
y production is probably related to interactive effects, e.g., synergism and/or competition,
189

between the various components.
The major effects found for the environmental conditions which were investigated are
summarised in Table 6.1. This overall view is an attempt to provide a better understanding of
the whole process and to illustrate the different behaviour of CHO cell growth and IFN-y
production under some of the culture conditions. The analysis is separated into high-BSA
cultures (5 mg/mi) and low-BSA cultures (1 mg/ml), and a comparison in relation to the
control culture is always provided. This Table will be used as a guideline for the following
discussion. The same numbering system used in the Table for each particular condition is also
used in the text.
6.2.1- CHO cell growth and IFN-y production enhanced by different stimuli
The production kinetics of JFN-'y in a control batch culture showed an apparent relationship
between CHO cell growth and JFN-y production, as IFN-y accumulated during the cell growth
phase (section 3.2). This is supported by earlier observations in batch culture (Hayter et a!.,
199 Ia) and also by studies performed in chemostat cultures (Hayter et a!., 1993). However,
IFN-y production at a relatively high rate has also been achieved when cells were grown under
glutamine starvation (Hayter et a!., 1991a), thus cell growth association kinetics can not be
firmly established.
190
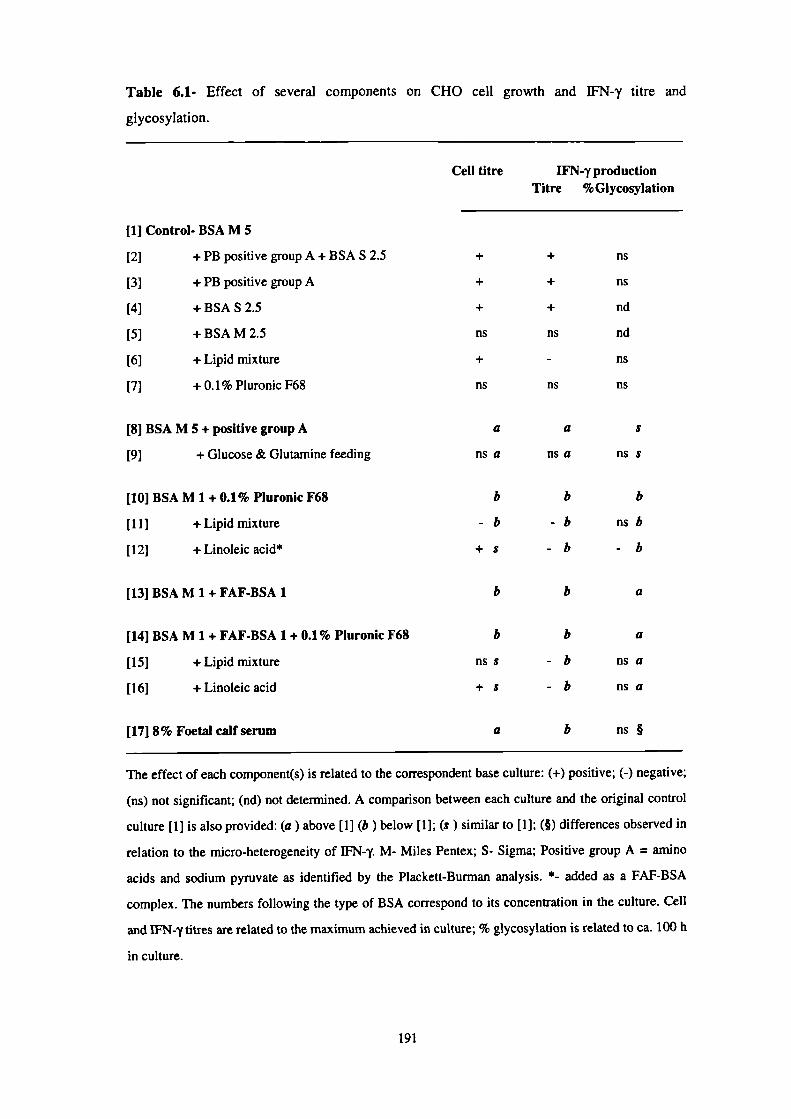
a a S
ns a nsa nss
b
b b
-b -b nsb
+s -b -b
b
b a
b
b a
ns S - b nsa
+5 - b nsa
a
b ns
Table 6.1- Effect of several components on CHO cell growth and IFN-'y titre and
glycosylation.
Cell titre
IFN-y productionTitre % Glycosylation
[1] Control- BSA M 5
[2] + PB positive group A + BSA S 2.5
[3] + PB positive group A
[4] +BSAS2.5
[5] + BSA M 2.5
[6] + Lipid mixture
[7] + 0.1% Pluronic F68
[8] BSA M 5 + positive group A
[9] + Glucose & Glutainine feeding
[10] BSA M 1 + 0.1% Pluronic F68
[11] +Lipidmixture
[12] + Linoleic acid*
[13] BSA M 1+ FAF-BSA 1
[14] BSA M 1 + FAF-BSA 1 + 0.1% Pluronic F68
[15] + Lipid mixture
[16] +Linoleic acid
[1718% Foetal calf serum
+ + ns
+ + ns
+ + nd
ns ns nd
+ ns
ns ns ns
The effect of each component(s) is related to the correspondent base culture: (+) positive; (-) negative;
(ns) not significant; (nd) not determined. A comparison between each culture and the original control
culture [1] is also provided: (a ) above [1] (b ) below [1]; (s ) similar to [1]; () differences observed in
relation to the micro-heterogeneity of IFN-y. M- Miles Pentex; S- Sigma; Positive group A = amino
acids and sodium pyruvate as identified by the Plackett-Burman analysis. - added as a FAF-BSA
complex. The numbers following the type of BSA correspond to its concentration in the culture. Cell
and IFN-y titres are related to the maximum achieved in culture; % glycosylation is related to ca. 100 h
in culture.
191

Evidence that CHO cell growth and IFN-y production may not be enhanced by the same
stimuli was found throughout this investigation. In Chapter 3, an improvement in IFN-y
production was obtained simultaneously with an improvement in cell growth when the
concentration of all the positive variables was increased in the beginning of the culture [2].
However, the individual analysis of the Plackett-Burman experimental data has also shown
that a positive response for CHO cell growth did not always imply a positive response in IFN-
y production. Furthermore, BSA seemed to be one of the major components responsible for the
improvements in IFN-'y production, as revealed by the analysis of the separate effects of BSA.
The results obtained in Chapter 5 strongly supported the latter view. When CHO cell growth in
non supplemented 1 mg/mI BSA cultures was achieved, IFN-y was produced slowly, up to the
end of the culture, although cell decline started prematurely (Ca. 60 h). In addition, whereas
CHO cell growth in low-BSA cultures could be totally restored by adding a mixture of
Pluronic F68 and linoleic acid [(12), (16)- see Table 6.1], IFN-y production was still much less
in those cultures. The more drastic situations were found when clear improvements in cell
growth above control cultures were achieved by lipid or serum supplementation and IFN-y
production was strongly suppressed [(6), (17)].
The apparent relationship between cell growth and JFN-y production may thus not be directly
related to the growth rate per Se, but may be a reflection of other cellular physiological
characteristics, such as the activity of certain metabolic pathways and/or the integrity of the
cell membrane, which are related to the environment that surrounds the cell. As a result, cell
function may be ultimately affected.
192

6.2.2- Influence of BSA on CHO cell growth and IFN-y production
Throughout this investigation there was clear evidence of the influence that BSA exerted on
CHO cell growth and IFN-y production. Although its relevance was manifested early in the
first Plackett-Burman analysis (Chapter 3), the studies reported in Chapter 5, attempting to
establish the role of BSA in culture, helped to clarify some of the questions associated with its
function. BSA seemed to be the major component for IFN-y production within the positive
group of variables identified by the Plackett-Burman procedure, but different types of BSA
had distinct effects on CHO cell growth and IFN-y production [(4), (5)] . Furthermore, none of
the low-BSA cultures [10-16] produced the same levels of IFN-y as the control culture [1],
although CHO cell growth could be totally restored by adding Pluronic F68 and linoleic acid
[(12), (16)].
BSA is a very poorly defined component in the culture and most of the serum-free media that
have been published in the literature include BSA in their formulation (Barnes and Sato, 1980;
Iscove et al, 1980; Glassy et al, 1988; BUntemeyer et al, 1991). However, the mechanism
behind its stimulating effect is the subject of some debate and it has been mostly related to the
following properties: (1) BSA functions as a carrier for several components, including lipids
(Barnes and Sato, 1980; Iscove et al, 1980) and its fatty acid binding properties may prevent
the toxicity of free fatty acids in culture (Darfier and Insel, 1983); (2) BSA provides cells with
protection from shear damage in adverse environments (HUlscher and Onken, 1988;
Papoutsakis, 1991a; Smith and Greenfield, 1992) and, (3) the ability of BSA to inhibit copper-
stimulated peroxidation and the generation of free hydroxyl radicals from H202 prevents
toxicity by oxidation of unsaturated fatty acids in the membranes or oxidation of cellular
proteins (Darfier and Insel, 1983; Gutteridge, 1986; Halliwell, 1988). The data obtained in the
present study seem to provide evidence for both former mechanisms while not excluding the
latter one, and the effects observed on CHO cell growth and JFN-y production will be
discussed in this light.
193

6.2.2.1- Nutritional effect
In this study, a nutritional role for BSA was indicated by the following results: an increased
concentration of one type of BSA exerted a positive response on CHO cell growth and JFN-y
production [4], whereas increasing the concentration of the type of BSA already present in the
culture did not have any effect [5 ] . The growth stimulating effect of BSA was thus dependent
on the source used (BSA Sigma or BSA Miles). This suggests that some undefined component
of BSA may be important for CHO cell growth and IFN-y production. Sigma and Miles do use
different purification strategies to obtain BSA Fraction V, which may be the reason for the
different responses obtained. The work of Jayme (1991) with hybridomas gives support to this
view. The latter study has shown that different sources of BSA have distinct effects on cell
growth, and the authors related that effect to the distinct lipid profile of each preparation, as
determined by HPLC separation. The fact that in the present study the addition of a lipid
mixture to cultures containing 5 mg/mi BSA promoted an increase in cell numbers further
supported the possible nutritional role of BSA. However, there was a decrease in the
production of JFN-y under those conditions, which leads also to the possibility that the positive
effect of BSA Sigma on CHO cell growth and IFN-y production may result from components
other than the lipid fraction.
6.2.2.2- 'Protective" effect
The role of BSA as a protective agent against adverse culture conditions seemed to be
emphasised in this study. An alteration of physical parameters of the culture, such as viscosity,
when reducing the BSA content of the culture was expected. Considering that the cells were
grown in suspension culture, the susceptibility of the cells to mechanical forces, particularly
agitation, could be affected. The results obtained by supplementing the cultures with Pluronic
F68 supported the protective role of BSA. In fact, although Piuronic F68 did not have any
194

significant effect over 5 mg/mI BSA cultures [7], it was able to substantially restore cell
growth in 1 mg/ml BSA cultures [10]. Its effect may be related to its postulated interaction
with the cell membrane, as it was reported for insect cells (Murharnmer and Goochee, 1988),
affording cells shear protection. This view is supported by the studies of Ramirez and
Mutharasan (1990) with hybridomas, which assigned the Pluronic F68 protective properties to
its ability to form a semi-stagnant film at the cell surface, leading to a decrease in the apparent
fluidity of the cell membrane and increased cell resistance to shear. Later studies (Zhang et a!.,
1992a) have also shown that Pluronic F68 had a strengthening effect on the cell membrane of
hybridoma cells. The interaction of Pluronic F68 with the cell membrane is further supported
by the work of Lakhotia et a!. (1993), which has shown that Pluronic F68 has a protective
effect on the content of a specific surface protein of hybridoma membranes, independently of
shear damaging conditions. It is possible that BSA acts by a similar protection mechanism to
that ascribed to Pluronic F68, and the effect of the latter observed in this study in Iow-BSA
cultures is related to a replacement of this function. However, the protection afforded by BSA
seems to be dependent on cell line and culture conditions. HUlscher and Onken (1988) did not
fmd any influence of BSA on hybridoma cell growth and monoclonal antibody production in
static and spinner suspension cultures in the range of 0 to I mg/mi BSA, but the presence of
BSA was absolutely required for growth to occur in an airlift bioreactor. This seemed to be
due to the action of BSA at the gas liquid-interface, as proposed by Handa-Corrigan et a!.
(1989) for Pluronic F68. Given that the present studies were carried out in shake-flasks, this
mechanism is not suitable to explain the observed action of Pluronic F68. Smith and
Greenfield (1992) also reported a protective effect of BSA on hybridoma growth in bioreactors
at high agitation rates (600 rpm) but the presence of BSA was also essential for growth to
occur in static cultures. Thus, while BSA provides protection to the cells in adverse
environmental conditions, which may result from agitation and aeration, there are other factors
which support its importance in culture.
195

6.2.23- Antioxidant effect
The effect of the lipid mixture on 1FN-y production was negative both in low-BSA [(1 1), (15)]
and high-BSA cultures [6], but the cell growth response towards the same component was
dependent on the BSA content of the culture. The growth stimulating effect observed in
cultures containing 5 mg/ml I3SA [6] was not manifested in low-BSA cultures [(1 1), (15)]. In
fact, the effect was negative in cultures containing the lowest BSA content, 1mg/mi Eli], while
no effect was observed if an extra I mg/mI FAF-BSA was included in the culture [15]. It is
feasible that a more extensive oxidation of unsaturated fatty acids in the membranes may occur
at lower BSA concentrations, and this is possibly avoided when extra FAF-BSA is included in
the culture. The following mechanisms could contribute to this protection: (1) inhibition of
peroxidation by an increase in total BSA content and (2) enhanced binding of free fatty acids
by the FAF..BSA, preventing their possible toxic effects as free components in culture. This
could in some way justify the variable effects on cell growth obtained with the lipid mixture in
high and low-BSA cultures, strengthening the role of BSA as an antioxidant agent in culture.
The fact that IFN-y production is lower when the BSA content of the culture is reduced and
when lipids are added to the culture, may indicate that cells respond to these new environments
by increasing the production of antioxidant molecules, as it has been reported for CHO cells
under stressful conditions, e.g. anoxia and hypoxia (Lin and Miller, 1992), and it is possible
that it leads to competition with other cellular activities, such as product formation.
6.2.2.4- Cell structural integrity
The distinct responses obtained for CHO cell growth and IFN-y production obtained under
different culture environments may be related to the structural "integrity" of the cell, namely
the cell membrane. This may be once again reflect the BSA content of the culture, as
suggested by the effect of Pluronic F68 in low-BSA cultures. The lipid composition of the
196
culture is another aspect to consider. Due to the different lipid content expected in each BSA
preparation, the culture lipid composition is expected to be determined by the type and
concentration of BSA used, together with each specific lipid supplementation. This in turn
affects the lipid composition of the cell membrane. It has been long reported for mouse LM
cells that the unsaturated fatty acid content of the membrane strongly affected cell growth, and
less than 50% unsaturated fatty acids on the acyl groups of the membrane phospholipids led to
severe growth inhibition (Doi eta!., 1978). Phospholipids are one of the major components of
the membranes and are critical in maintaining the integrity and regulation of various
membrane functions. Indeed, several components added to the cell culture, including
cholesterol and Pluronic F68, have been shown to affect the fluidity of the membrane (Ramirez
and Mutharasan, 1990). In this study, cholesterol exhibited negative effects on CHO cell
growth while linoleic acid (C 18 with two double-bonds) was shown to have a stimulating
effect. Whether the latter effect is related to a re-establishment of such membrane lipid
equilibrium is a possibility to consider. Also, although cell growth in I mg/mi BSA cultures
was restored, cell function in terms of JFN-y production was affected differently. The
improvement in cell growth, concurrent with a decrease in IFN-y production obtained by
supplementing 5 mg/mI BSA cultures with a lipid mixture, may be also a reflection of the
disparate effects in cell function. This is supported by the work of Schmid et al. (1991), who
reported different effects of linoleic and oleic acids on BHK cell growth and anti-thrombin
production. In their study, an increase in product titre concurrent with no changes in cell
growth was obtained by supplementing batch cultures with those fatty acids. A certain lipid
composition of the membrane may in fact be essential for the cells to achieve an equilibrium
appropriate for both growth and production and this is determined by the cell culture
environment.
197
6.2.3- Glycosylation of IFN-y
In the initial stages of a control batch culture, approximately 70 % of JFN-'y is glycosylated at
2 sites, 25 % is glycosylated at only I site and 5% is not glycosylated. A continuous shift
throughout the duration of the culture leads to the following profile after approximately 100 h:
Ca. 6% remains non glycosylated whereas only ca. 48% is glycosylated at 2 sites and ca. 46%
is glycosylated at I site. There is some evidence that this change in glycosylation profile is not
due to instability of the carbohydrate residues, as the incubation of exogenous 35S-labelled
IFN-y for up to 96 h in cell-free conditioned medium does not affect the proportion of IFN-y
glycoforms (Curling et a!., 1990). It is also important to note that the shift does not reflect the
net production pattern of each of the forms. IFN-y is produced during the growth phase of the
cells, reaching its maximum titre at ca. 100 h, and that is followed by an increase in the
amount of the three forms (see Chapter 5, Figures 5.6 and 5.10). As such, although there is a
decline in the proportion of the 2N glycoform during the culture, its maximum titre is also
reached at ca. lOOh. In some cultures WN-y concentration declined slightly at the end of the
culture (after 100 h); the liberation of intracellular proteases by non-viable cells may lead to
proteolysis of IFN-y and there is evidence that glycosylated forms are more resistant to
proteolysis (Curling et a!., 1990). The data obtained in this study are not sufficient to provide
any further understanding of the dynamics of IFN-y synthesis and degradation.
The changes of the culture environment with the age of the culture, e.g., nutrient depletion,
may be responsible for the shift in the proportions of each IFN-y form observed in batch
cultures. It was also found that the glycosylation pattern of WN-y was affected by some of the
alterations of the cell culture environment, reinforcing the importance of the cell culture
environment on the glycosylation process. Table 6.1 shows that in the present study although
distinct glycosylation responses were obtained under some of the culture conditions, the effect
was dependent on the type of modification. Indeed, in Chapter 3, similar glycosylation patterns
198

of IFN-y were obtained under different culture environments [(1), (2), (6), (7)]. It is worth
pointing out that all these cultures had the same concentration of BSA, 5 mg/mI. However, in
Chapter 5, changes occurred when modifying the concentration [(10), (11), (12)] and type of
BSA [(13), (14), (15), (16)] used in the culture and when supplementing the cultures with
serum [17]. With serum, it was the micro-heterogeneity of IFN-y which was affected. Also, in
Chapter 4, a change in the initial glycosylation pattern of the produced IFN-y was seen when
the initial glutamine concentration in the culture was reduced by 75% [8], although the
patterns were similar to the control [1] after 100 h. This behaviour will be discussed in the
following sections, in light of the existing knowledge of glycosylation and cell functionality.
6.2.3.1- Glycosylation of IFN-y is not dependent on the rate of IFN-y production
Under the conditions of this study, there was evidence that the efficiency of WN-y
glycosylation was not directly related to its production rate or cell growth rate. For example,
the lower production of WN-y obtained with lipid supplementation over 5 mg/mI BSA cultures
[6] did not have any significant effect on the extent of glycosylation. Furthermore, higher
proportions of the 2N glycoform were achieved in some of the low BSA cultures [(13), (14),
(15) and (16)], where a reduced WN-y production was seen. This is consistent with the
findings for glucose-limited chemostat cultures of the same CHO cells (Hayter et a!., 1993). In
the latter case, similar IFN-y glycosylation patterns were obtained at growth rates varying from
0.014 and 0.021 h- 1, for which increases in JFN-y production rate were also noticed. In the
case of t-PA there is also evidence that the extent of N-linked glycosylation is not dependent
on the rate of protein synthesis (Bulleid et a!., 1992; Lin et a!., 1993), while for protein C it
has been suggested that glycosylation may be partially dependent on this rate (Miletich and
Broze, 1990). In the latter case the glycosylation site which presented variable glycosylation
has a Asn-X-Cys sequence, unlike the more common Asn-X-Ser/Thr sequence, and the
postulated relation may well be dependent on each specific type of protein.
199

6.2.3.2- The effect of glucose and glutamine on the glycosylation of IFN-y
Glutamine was one of the components that seemed to influence the efficiency of IFN-y
glycosylation. In fermenter fed-batch cultures containing lower initial concentrations of
glutamine, 0.5 mM, a lower initial proportion of the 2N glycoform (45-50% as compared to a
typical 70%) and higher initial proportion of the ON glycoform (Ca. 15% as compared to a
typical 5%) was obtained. Thus, the availability of glutamine may be an important limiting
factor in the glycosylation pathway. A certain driving force may be required for the
glycosylation process, and this is probably derived from glutamine. Glutamine is a nitrogen
donor for the synthesis of purines and pyrimidines and is also involved in the biosynthesis of
amino sugars. In its initial steps, the glycosylation process requires the nucleotide sugars,
UDP-glucose, GDP-mannose and UDP-N-acetylglucosamine. A limited supply of any of these
precursors may impair the glycosylation process, which may be the reason behind the lower
glycosylation of IFN-y at lower availability of glutamine in the beginning of the culture. A
similar comparison with the reported fmdings for the effect of the glucose supply on the
glycosylation process may also be established. Glucose is required for the assembly of
nucleotide sugars and there is some evidence that a limited supply of glycosylation precursors
derived from glycolytic intermediates may be in the origin of a decrease in the glycosylation of
WN-y obtained from glucose-limited chemostat cultures showing low glucose uptake rates
(Hayter et a!., 1993). Furthermore, it has also been shown that the glycosylation pathway is
impaired by glucose starvation (Rearick eta!., 1981).
In this study the presence of excess glucose throughout fed-batch cultures containing high
initial glutamine concentrations (2 mM) did not prevent the typical shift in the glycosylation
pattern of IFN-y, suggesting that it is not only the availability of glucose which affects the
glycosylation process. In fact, increasing the initial glucose concentration in batch cultures has
proven to be ineffective in maintaining the initial JFN-y glycosylation pattern (Hayter et a!.,
200

1991b). However, glucose pulses in glucose-limited chemostat cultures were able to
temporarily increase the proportion of the 2N glycoform (Hayter et a!., 1992), which was
simultaneous with a marked increase in the uptake rate of glucose. It was postulated then that
the transient increase of the 2N glycoform could be due to changes in cell physiology
following the addition of the growth-limiting nutrient and not to an increase in glucose
concentration.
Goochee et a!. (1992) proposed that an alteration in the cellular energy state, which is
dependent on glucose and glutamine metabolism, may be one of the factors limiting the extent
of the glycosylation process. In this study, the lower extent of IFN-y glycosylation obtained in
cultures with low initial glutamine concentration is consistent with such mechanism. A change
in the metabolism of certain amino acids was in fact detected in those fed-batch cultures. In
particular, a lower initial uptake of glutamine and an alteration in the metabolism of glycine
and serine metabolism, components closely associated with glucose and glutamine, was
observed. It is feasible that changes in glycosylation are associated with changes in the activity
of key metabolic pathways.
6.2.3.3- The extent of IFN-y glycosylation varies with the concentration and type of BSA
in culture
Different patterns of N-glycosylation of 1FN-y were observed in cultures containing high BSA
or low BSA concentrations. Not only the concentration but also the type of BSA affected the
glycosylation process. In order to obtain the maximum possible information from the different
data sets presented in Chapter 5, the results for the various cultures (sections 5.3 and 5.4) were
amalgamated for comparison in Table 6.2, which will be used as a guide in this section. The
values for IFN-y were calculated from the maximum yields achieved in the various cultures.
The same Table provides data for cell productivity (TU/lO 6cells) and volumetric productivity
201

(lU/mi), strenghtening the argument for uncoupled growth and production achieved when
lipids and/or Pluronic F68 were added to the cultures, and the apparently independent effect on
IFN-y glycosylation.
Table 6.2- Effect of BSA and medium supplements on interferon-y production.
Interferon-y production
Relative proportion
Percentage of glycoform
JU/IO6 cells lU/mi
ON iN 2N
Control- BSA 5 mg/mI (A) a
1
6± 1 46± 0.5 48± 1.5
+ P F68 (C) C
0.99
11± 1.5 43± 2 45± 2
+ Lipid mixture (B)
0.53
0.70
4 47 49
P F68
+BSA I (K)b
0.78
0.63
17.5 ± 3 40 ± 0.5 42.5 ± 2.5
+BSA I +F-BSA 1 (0)b
0.76
0.61
9± 1 37± 0.5 54± 1.5
Lipid mixture
+ BSA I + P F68 ()C 0.62 0.47
19± 2.5 35± 0.5 46± 2.5
+ BSA 1 + P F68 + F-BSA I (Q)C 0.62 0.52
7± 2 31.5± 1.5 61.5± I
Linoleic acid*
+BSA 1+PF68 (L)c 0.58 0.58 24± 1.5 38± 4 38± 3
+ BSA I + P F68 + F-BSA I (P)c 0.60 0.60 8.5 ± 1 33 ± 1.5 57.5 ± 2.5
F-BSA I
+BSA I (N)b1.04 0.59 3±0.5 36± 3 61± 2.5
* added as a FAF-BSA complex. P F68= Pluronic F68; F-BSA= fatty-acid free BSA. 1= 1 mglrni.
The letters in brackets correspond to the medium code. Glycosylation values taken at Ca. 95-110 h in
culture; a - 6 observations, b - 4 observations, C - 2 observations.
202

The various media supplementations utilised in Chapter 5 reflect different lipid compositions
of the medium, due to different type/concentration of BSA and/or addition of lipids/linoleic
acid. As discussed before, the lipid composition of the cell membrane reflects that of the
growth environment and exposing the cells to different medium constituents can alter
appreciably the lipid composition of both surface and intracellular membranes, due to a rapid
phospholipid turnover (King and Spector, 1981). Membrane lipid composition, namely the
equilibrium between saturated fatty acids and unsaturated fatty acids, is known to affect cell
growth (Doy et a!., 1978); cell membrane fluidity is affected by cholesterol and Pluronic F68
(Ramirez and Mutharasan, 1990) affecting cell sensitivity to the culture conditions. It is
feasible that the alterations made in the present study (Chapter 5) may be translated into an
altered cell function, e.g., post-translational processing.
The suggestion that the types of lipid, e.g. extent of unsaturation, incorporated by the
membrane may affect the glycosylation process can be partially supported in this study. The
efficiency of N-glycosylation decreased in I mg/mi BSA cultures [media K, E and LI. Among
those, cultures supplemented with linoleic acid [medium LI showed the highest proportion of
the ON form and lowest proportion of the 2N glycoform, suggesting a contribution by linoleic
acid to the change in the glycosylation patterns. Also, the ratio of the 2N to the iN IFN-y
glycoform was higher when cultures were supplemented with the lipid mixture. Common
features of such cultures, in comparison to the control 5 mg/ml BSA cultures, were the
presence of Pluronic and the lower BSA concentration. Pluronic itself was also a likely
candidate for the cause of the change in the glycosylation pattern of IFN-y observed in the low-
BSA cultures. Addition of Pluronic to 5 mg/mi BSA cultures [medium CI did not give very
strong support to this view, but whether Pluronic would have the same global effect in 1
mglml BSA cultures and 5 mg/mI BSA cultures cannot be assured. Also, in the set of 1 mg/mI
BSA cultures supplemented further with 1 mg/mi FAF-BSA [media 0, P Q and M], those
containing Piuronic gave slightly higher levels of ON IFN-y, again suggesting its involvement
203
in the glycosylation process. This can be a reflection of its postulated interaction with the
plasma membrane (Murhammer and Goochee, 1988; Ramirez and Mutharasan, 1990; Zhang et
at., 1992a; Lakhotia et al.,1993). The fact that cell growth was not successful in cultures
containing 1 mg/mI BSA, with no other supplementation, prevented the determination of
whether the changes in glycosylation profile were mainly due to the reduction in BSA
concentration.
The possibility that the lower extent of N-glycosylation was due to the deficiency of some
important component carried by BSA lost its relevance when glycosylation efficiency
increased in I mg/mi BSA cultures supplemented with a further 1 mg/mi FAF-BSA [media 0,
Q, P and NJ, and higher proportions of the 2N glycoform were seen throughout the cultures as
compared to the control 5 mg/mi BSA. Low-BSA cultures supplemented solely with FAF -
BSA (total 2 mg/mi BSA) showed very low proportions of the ON form and higher proportions
of the 2N glycoform [medium N]. The reduction in BSA concentration did not seem to be the
only cause for the previous shift observed in the patterns of IFN-y. There was, however,
possible evidence that the fatty acid-free BSA plays a major role in the glycosylation process.
As the FAF-BSA itself is obtained from the original BSA by subjecting it to further treatment
to remove lipid components (see Chapter 3), it is unlikely that the positive effect was due to
any component carried by the FAF-BSA. The role of FAF-BSA may derive from the fact that
it can complex certain components present in the medium, which might have been carried by
the lipid containing BSA. The fact that the latter is obtained by extensive heat treatment may
result in oxidation of some of its components, e.g., fatty acids, which may be toxic to cultured
cells. This last observation can lead to the hypothesis that lipid components, probably linoleic
acid, carried by the more crude BSA impairs the glycosylation process. The fatty acid may
become complexed by the FAF-BSA and above a certain ratio of fatty-acid to BSA their
potential inhibitory effects may not be manifested. A ratio of 1:100 has been reported as
required to eliminate the toxic effects on hybndoma growth (Kovar and Franek, 1986), but the
204
situation may be different for production purposes. At the same time, the FAF-BSA may have
modified the lipid composition of the culture to something which is more favourable to cell
function, arid this may reflect changes in the state of the membrane, particularly membrane
fluidity. Post-translational processing may be affected by these alterations, as was previously
discussed for JFN-y production.
IFN-y obtained from the 5 mg/mi BSA cultures presented similar extent of N-glycosylation
independently of the additions made to those cultures, such as lipids or Pluronic F68 [media B
and C], or even BSA Sigma [Chapter 3]. This seems to reflect the protective effect that BSA
exerts in the culture medium, which may derive from its binding and antioxidant capacities
(see properties described in section 6.2.2). Components which affect the glycosylation process
in low-BSA cultures, e.g., lipids and Pluronic, may not have the same effect in cultures
containing higher concentrations of BSA, where the effect of BSA probably predominates.
There is also the possibility that the supply of components taking part in the glycosylation
pathway are affected by alterations in the culture environment. The glycosylation process is
initiated by the synthesis of a lipid-linked oligosaccharide moiety, the Glc3Man9GlcNAc2-P-
P-Doiichol. When lipids are available in the culture de novo synthesis of fatty acids and
cholesterol is suppressed and the regulation of their biosynthesis occurs through inhibition of
rate-limiting enzymes. The synthesis of dolichol-P-P happens along the same pathway of
cholesterol biosynthesis, and its formation occurs after the rate-limiting enzyme step
(Lehninger, 1975). It is thus possible that inhibition of cholesterol synthesis, which will be
mainly dictated by the lipid content of the culture, may also limit the supply of dolichol-P-P,
impairing the glycosylation process.
The state of the cell membrane (lipid composition, fluidity), which is largely affected by the
medium composition, does seem to be a critical parameter for cell function and may well be
205
one of the mechanisms controlling the glycosylation process. This kind of rationale seems
more reasonable than attributing the cause of the reduction in IFN-y glycosylation seen early in
the low BSA cultures to the lack of any component carried by BSA. Furthermore, it could also
explain the higher proportion of the 2N glycoform in I mg/mi BSA cultures further
supplemented with FAF-BSA, even if the total concentration of BSA is lower.
6.2.3.4- Serum affects the pattern of IFN-y
Glycosylation analysis showed that the heterogeneity of WN-y was different in serum-free and
serum-containing cultures. In this case, it was the distribution of the molecular weight species
within each major variant (ON, iN and 2N) which was affected. Serum has been reported by
others to influence the glycosylation pattern of glycoproteins. Megaw and Johnson (1979) have
reported major differences in the glycosylation of a glycoprotein, epithelial basement
membranes, in media containing different levels of foetal calf serum; a decrease in sugar
content with a decrease in serum concentration was noticed. Patel et a!. (1992) have shown
that differences in the glycosylation profile of a murine IgG monoclonal antibody ocurred
depending on whether it was produced in ascites, serum-free or serum-supplemented cultures.
These differences were found to be related to the sialic acid content and incidence of outer-arm
galactosylated oligosaccharides, and not to the number of attached N-glycan chains. Also,
studies conducted on the production of 1gM have shown that the monoclonal produced in
ascites had a lower average degree of sialylation than what was obtained in vitro (Maiorella et
al., 1993). In the latter study, the pharmokinetics of the product, namely plasma clearance rate
and binding activity, were clearly affected by the glycosylation changes. Product derived from
ascites had variable plasma clearance rate from batch to batch, as it was previously reported
(Anderson et a!., 1985), while consistent results were obtained for the serum-free cultures.
These data reinforce the importance of evaluating the culture method for product authenticity
and pharmokinetics of the product. Furthermore, the advantage of using serum-free medium in
206

terms of consistency of the product from batch to batch is well illustrated.
In the present study, sialic acid or sugar content was not analysed. Stronger bands were found
for the lower molecular weight variants for the three major IFN-y forms. As such, the third
variant of the non-glycosylated form, which is rarely detected on the gel, was the most
abundant of the 3 non-glycosylated variants. Since this occurred with all the forms, it is
possible that there was proteolytic cleavage of the molecule, which may be due to proteases
present in the serum. Lin et a!. (1993) reported differences between t-PA produced by CHO-
Ki in serum-free and serum-containing cultures. In the latter conditions, the authors found
degradation of the product, which was attributed to proteases present in serum. However, in
the present investigation, no studies were conducted to elucidate this hypothesis, so it was not
determined whether the observed effect is a consequence of protein degradation in the medium
or due to intracellular differences in the post-translational process, as was observed in studies
referred above.
6.2.3.5- The impact of the media composition on the production of glycoproteins
The mechanisms underlying the changes in protein glycosylation patterns under different
culture conditions are not yet clarified and are a subject of major interest because the
implications for the production of recombinant proteins that have therapeutic applications are
great. The pharmacokinetic behaviour of the product in vivo can be affected by the
glycosylation profile of the product (Grinnel et a!., 1991; Delorme et a!., 1992; Maiorella et
a!., 1993) and if such structural changes occur when modifying a production method then any
proposed change must be evaluated before the product goes into clinical trials. The studies of
Grinnel et a!. (1991) and Delorme eta!. (1992) focused on the removal of any of the potential
glycosylation sites of Protein C and EPO, respectively. Glycosylation of Protein C at different
sites had distinct effects on its functional anticoagulant activity; also, one of its carbohydrate
207
chains was found to be essential for efficient protein secretion. Glycosylation of EPO was
found to be essential for its in vivo activity, with each of the carbohydrate chains providing a
distinct contribution. The work of Maiorella et a!. (1993) has shown that variations in the
sugar content of the carbohydrate chains affected biological properties of monoclonal
antibodies, such as plasma clearance rate and binding activity. In the present study, large
variations in IFN-'y glycosylation profile were observed when the medium composition was
modified (Table 6.2). In light of the studies reported so far on the effect of glycosylation on the
pharmacokinetic properties of certain recombinant proteins, it is feasible that changes in
glycosylation profile as those reported here for IFN-y also affect the therapeutic value of such
proteins. Product consistency is another factor to reinforce the importance of characterising the
factors and mechanisms affecting the glycosylation process.
The work described in this study reinforced the importance of the medium composition on the
post-translational processing of glycoproteins. The influence of the extracellular environment
on the glycosylation of other proteins now has been recognised by other researchers (see
Chapter 1, Table 1.5), although such studies are still scarce and the glycosylation pattern of the
product throughout the production process is rarely reported (Curling et a!., 1990; Robinson et
al., 1993). Most of the studies reported allude to the effect of serum on the glycosylation
patterns, mainly sugar composition (Megaw and Johnson, 1979; Patel et al., 1992; Maiorella et
a!., 1993; Lin el a!., 1993). The influence of serum on the pattern of IFN-y also was manifest
in this study, although it was not determined if that was due to changes in sugar content and/or
to proteolytic degradation. Glucose supply does affect the glycosylation process (Rearick et
a!., 1981; Hayter et al., 1992); a similar result was found in this study for glutamine. In both
glycosylation may be related to the supply of important precursors for the glycosylation
pathway.
In the present study, the protein (BSA) content of the medium was also found to be of great
208
significance for the glycosylation profile of IFN-y. The effect was related to both its
concentration and degree of purification. Other components [Pluronic, linoleic acid, lipids]
also affected the efficiency of glycosylation, but the magnitude of their effect was dependent
on the BSA content of the medium. The present trend in culture media design is the removal of
proteins, mainly due to the risk of contaminants, however findings of the type reported here
may have a strong impact on such developments.
No direct relationship between IFN-'y production and IFN-y glycosylation was found in this
study, which emphasizes the necessity of considering the effects of culture media on product
quality as well as on product quantity during process optimisation.
6.3- Nature of CHO cell growth limitation
Providing the cells with glucose and glutamine, the two nutrients most likely to become
limiting, failed to prevent CHO cell growth and IFN-y production from ceasing [9]. Ammonia
accumulation, which could become a limiting factor, was controlled by adding those nutrients
in a fed-batch mode, using low initial concentrations of glutamine and low feeding rates, as it
has been previously reported (e.g., Glacken et al., 1986; Ljunggren and Haggstrom, 1990). Net
improvements in CHO cell growth and IFN-y production were not achieved, and other factors
may be involved in the limitation process.
Another possibility that may also be considered for growth inhibition of CHO cells is self
inhibition by IFN-y. There is some evidence of specific binding of IFN-y (provided by
Welicome Biotech) to CHO 320 cells (N.J. Tomlinson and N. Jenkins, unpublished results),
by a mechanism still unknown. Evidence that intracellular IFN-y may affect cell growth in the
absence of specific receptors was also found (Sanceau eta!., 1987). However, it was postulated
in the former study that JFN-y obtained from Weilcome might have been contaminated with
209
some toxic agent that also showed the protein inhibitory effect. More recent studies with the
same cell line have shown that the levels of JFN-y usually obtained in batch culture do not
cause any growth inhibition, when added in the beginning of batch cultures (J.M. Tong and
A.T. Bull, unpublished results) but a different source of purified IFN-y was used (purification
carried out at the University of Kent). The specific activity of IFN-y used in the two studies
may have not been the same, and further work would be necessary to elucidate this
possibility.
The hypothesis of an optimal range of concentrations necessary to sustain cell growth may be a
reasonable one. Factors such as competition between amino acids for transport, feed-back
effects on metabolic pathways by higher concentrations of particular metabolites, may reflect
the postulated range.
210

7- CONCLUSIONS
The influence of the culture environment on CHO cell growth, IFN-y production and IFN-y
authenticity was well illustrated in this study. These parameters were not always enhanced by
the same stimuli, a conclusion which strongly supports the view of optimising the cell culture
system for the desired biological response.
A Plackett-Burman statistical design proved to be a very useful tool for identifying key factors
in the optimisation procedure. Increasing the initial concentration of a group of growth
medium components, identified as positive by the latter technique, in batch cultures led to
improvements of approximately 40% in CHO cell growth and WN-y production. These effects
were not due to nutrient depletion, showing that the initial composition of the culture medium
is as important as the feeding of depleted nutrients.
Bovine serum albumin was found to be a very important component in culture and its multiple
roles were manifested in this study. Nutritional, protective and possibly antioxidant functions
were apparent. Different types of BSA produced different responses on CHO cell growth and
IFN-y production and this seems to reflect the purification procedures to which BSA is
subjected. BSA introduces much variability to the culture, but it is essential for cell growth to
occur. Pluronic F68, alone or in combination with a lipid mixture or linoleic acid, was able to
restore cell growth in low-BSA cultures (1 mg/mI), to different extents. However, the levels of
IFN-y production were always reduced in these cultures, especially in the presence of lipids. In
fact, the lipid composition of the culture was important for cell function, and CHO cell growth
and IFN-y production were differently affected by both type and concentration of these
components. Furthermore, the extent of IFN-y glycosylation was affected by (1) the
concentration of BSA, (2) the type of BSA, e.g., fatty acid-free BSA, and (3) the lipid
composition of the culture. The latter is affected by both (I) and (2) and all of them, together
with Pluronic F68, contribute to the structural integrity of the cell membrane, which is
211
reflected in cell function. It was also found that the glycosylation of WN-y is not dependent on
its production rate.
The inclusion of serum in the culture medium stimulated cell growth, but had adverse effects
on IFN-y titres, stressing that an optimum environment for CHO cell growth may not be the
same for IFN-'y production. The predominant molecular weight species within each IFN-y
major variant was altered in the presence of serum, indicating cleavage of the core polypeptide.
Glucose and glutamine were depleted early in batch cultures and were prima facie candidates
for growth and/or production limitation. However, the results of fed-batch fermenter studies
with supplementation of glucose and glutamine did not support this hypothesis, as no net
improvements in growth or productivity were obtained when both nutrients were available
throughout the cultures. The glycosylation pattern of IFN-y was, however, affected by the
initial glutamine level of the culture.
The caution that should be taken when dealing with the optimisation of recombinant
glycoprotein production by animal cells was highlighted in this study. The rather undefined
nature of BSA is a major concern when considering the batch consistency of the product and
the characterisation and choice of the starting material is an element that must be addressed
when appraising the design of a reproducible culture system. The development of protein-free
media is an area which deserves more attention. Successful cultures under such conditions
have already been achieved, but there are no reports on the influence of those changes on the
quality of recombinant proteins. Moving towards a more defined culture is most desirable,
however the repercussions for the authenticity of the product need to be assessed. This study
has shown that product consistency would benefit enormously from a clearly defined medium.
The development of this medium would elucidate many of the complex steps involved in the
growth of mammalian cells and their ability to produce authentic recombinant proteins.
212
8- SUGGESTIONS FOR FUTURE WORK
The work described here has stressed the importance of the cell culture environment for the
production of recombinant IFN-y by CHO cells. The study focused on CHO cell growth, WN-y
production and also IFN-y glycosylation. Some of the points raised by this study deserve
further investigations.
The influence of the type and concentration of BSA seen on cell growth and IFN-y production
(titre and glycosylation) and the undefined nature of that component calls for more detailed
investigations on the protein content of the culture medium. Moving towards a more defined
culture medium is of primary importance in terms of reproducibility of culture performance.
There is a need to better define the multiple roles of BSA in culture, such as serving as a
carrier of vitamins, hormones and growth factors (Barnes, 1987). Based on the information
already obtained in this study with Pluronic F68 and some lipids, these components could be
analysed with a further statistical analysis, attempting to eliminate the BSA from the culture.
Considering the antioxidant role of BSA, components with such function, e.g., catalase,
glutathione or vitamin E (Darfier and Insel, 1983; Darfler, 1990), should be included in that
study. The original control cultures without BSA and supplemented with Pluronic F68 could
become the basal culture composition. The analysis of second-order interactions between
components should be also included, if the statistical design selected allows such evaluations
(Gaertner and Dhurjati, 1993).
Studies on specific supplementation strategies of amino acids which have high utilisation rates,
while increasing the initial concentration of the components already identified as important by
the Plackett-Burman design (excluding BSA), could follow.
213

Glycosylation of IFN-y seemed to be, in some way, a function of giutamine concentration at
the beginning of the culture. It is suggested that the main function of glutamine could be the
provision of nucleotide precursors, which are required for the glycosylation process. The effect
of supplementing the cell culture with specific nucleotides on the glycosylation patterns of the
molecule could give some more insight to the understanding of this process.
The microheterogeneity of 1FN-y as a result of differences in carbohydrates, was not analysed
in this study. Analysis of IFN-y glycoforms could be accomplished by a variety of techniques
(reviewed by Dwek et a!., 1993), which can provide more detailed information about the
molecule. Techniques being developed in this laboratory are Capillary Zone Electrophoresis,
which can be used to rapidly profile IFN-y glycoforms, and Laser Desorption-Mass
Spectrometry, which can provide detailed site-specific mass structural information.
214
REFERENCES
Adamson, S.R and Schmidli, B. (1986). Can. J. Chem. Eng., 64, 531-539.
Aisen, P. and Listowsky, I. (1980). Ann. Rev. Biochem., 49, 357-393.
Anderson, D.R., Atkinson, P.H. and Grimes, W.J. (1985). Arch. Biochem. Biophys., 243, 605-
618.
Ardawi, M.S.M. and Newsholme, E.A. (1982). Biochem. J., 208, 743-748.
Augenstein, D.C., Sinskey, A.J. and Wang, D.I.C. (1971). Biotechnol. Bioeng., 13, 409-418.
Aunins, J.G., Croughan, M.S., Wang, D.I.C. and Goldstein J.M. (1986). Biotechnol. Bioeng.
Symp., 17, 699-723.
Avgerinos, G.C., Drapeau, D., Socolow, J.S., Mao, J., Hsiao, K. and Broeze, R.J. (1990).
Biotechnol., 8, 54-58.
Barnes, D. and Sato, G. (1980). Anal. Biochem., 10, 255-270.
Barnes, D. (1987). Biotechniques, 5, 534-542.
Bentley, P.K., Gates, R.M.C., Lowe, K.C., de Pomerai, D.E. and Lucy Walker, J.A. (1989).
Biotechnol. Letts., 11, 111-114.
Berman, P.W. and Lasky, L.A. (1985).Trends BiotechnoL, 3, 5 1-53.
Bialy, H. (1987). Biotechnol., 5, 883-890.
Birch, J.R. (1991). Chimicaoggi, 25-30.
Björk, 1., Ylinenjarvi, K., Olson, S.T., Hermentin, P., Conradt, H.S. and Zettlmeissl, G.
(1992). Biochem. J., 286, 793-800.
Bliem, R. and Katinger, H. (1988). Trends Biotechnol., 6, 225-230.
Bodeker, B.G.D., Newcomb, R., Yuan, P., Braufman, A. and Kelsey, W. (1993). In Animal
Cell Technology: Products of Today, Prospects for Tomorrow. 12th Meeting of the
European Society for Animal Cell Technology, Wurzburg, Germany.
Borys, M.C., Linzer, D.I.H., Papoutsakis, E.T. (1993). Biotechnol., 11, 720-724.
215

Browne, M.J., Tyrell, A.W.R., Chapman, C.G., Carey, J.E., Glover, D.M., Grosveld, F.G.,
Dodd, I. and Robinson, J.H (1985). Gene, 33, 279-284.
Busby, S., Kumar, A., Joseph, M., Halfpap, L., Insley, M., Berkner, K., Kurachi, K. and
Woodbury, R. (1985). Nature, 316, 27 1-273.
Bull, A.T., Huck, T.A., Bushell, M.E. (1990). In Microbial Growth Dynamics (Poole, R.K.,
Bazin, M.J. and Keevil, C.W., eds.), IRL Press, Oxford, pp. 145-168.
Bulleid, N.J., Bassel-Duby, R.S., Freedman, R.B., Sambrook, J.F. and Gething, M.J.H. (1992).
Biochem.. J., 286, 275-280.
Buntemeyer, H., Lutkmeyer, D., Lehman, J. (199 1).Cytotechnol., 5, 57-67.
Butler, M. and Thilly, W.G. (1982). In Vitro, 18, 213-219.
Butler, M. and Spier, R.E. (1984). J. Biotechnol., 1, 187-196.
Butler, M. (1987). In Animal Cell Technology: Principles and Products (Bryant, J.A.,
Greenshields, R.N. and Shelf, C.H. eds.), Open University Press, Milton Keynes, UK, pp
3 1-46.
Chang, D.Y.I., Grodzinsky, A.J. and Wang, DI. (1993). 205th ACS National Meeting, Denver,
Co. (Abstract).
Cohn, E.J., Strong, L.E., Hughes, W.L., Mulford, D.J., Ashworth, J.N., Melin, M. and Taylor,
H.L. (1946). J. Amer. Chem. Soc., 68,459-475.
Cohen, S.N., Chang, A.C.Y., Boyer, H.W. and Helling, R.B. (1973). Proc. Nat!. Academ. Sci.
USA, 70, 3240-3244.
Conradt, H.S., Nimtz, M., Dittmar, K.E.J., Lindenmaier, W., Hopper, J. and Hauser, H.
(1989). J. Biol. Chem., 264, 17368-17373.
Curling, E.M.A., Hayter, P.M., Baines, A.J., Bull, A.T., Gull, K., Strange, P.G. and Jenkins,
N. (1990). Biochem. J., 272, 333-337.
Curriden, S.and Englesberg, E. (1981). J. Cell. Physiol., 106, 245-252.
Darfier, F. (1990). In Vitro CelL Dev. Biol., 26, 769-778.
Darfier, F.J. and Insel, P.A. (1982). Exp. CelL Res., 138, 287-295.
216
Darfier, F.J. and Insel, P.A. (1983).). Cell. Physiol., 115, 3 1-36.
Datar, R.V., Cartwright, T. and Rosen, C-G. (1993). Biotechnol., 11, 349-357.
De Meo, M., Laget, M., Phan Tan Luu, R., Mathieu, D., Dume, G. (1985). Biosciences, 4, 99-
102.
Delorme, E., Lorenzini, T., Giffm, G., Martin, F., Jacobsen, F., Boone, T. and Elliott, S.
(1992). Biochem., 31, 987 1-9876.
Dodge, T.C. and Hu, W.S. (1986). Biotechnol. Lerts., 8, 683-686.
Doi, 0., Doi, F., Schroeder, F., Alberts, A.W. and Vagelos, P.R. (1978). Biochim. et Biophys.
Acta, 509, 239-250.
Donelly, M.and Scheffler, I.E. (1976). J. Cell. Physiol., 89, 39-52.
Doyle, C.and Butler, M. (1990). J. Biotechnol., 15, 91-100.
Drews, J. (1993). Biotechnol., 11, S16-S20.
Dube, S., Fisher, J.W., Powell, J.S. (1988). J. Biol. Chem., 263, 17516-17521.
Duval, D., Demangel, C., Munier-Jolain, K., Miossec, S. and Geahel, I. (1991). Biotechnol.
Bioeng., 38, 56 1-570.
Dwek, R.A., Edge, C.G., Harvey, D.J. and Wormald, M.R. (1993). Annu. Rev. Biochem., 62,
65-100.
Eagle, H. (1955a). J. Biol. Chem., 214, 839-852.
Eagle, H. (1955b). J. Biol. Chem., 116, 29-43.
Eagle, H. (1955c). Science, 122, 501-504.
Eagle, H., Barban, S., Levy, M. and Schulze, H.O. (1958). J. Biol. Chem., 233, 551-558.
Eagle, H. (1959). Science, 130, 432-437.
Ealick, S.E., Cook, W.J., Vijay-Kumar, S., Carson, M., Nagabhushan, T.L., Trotta, P.P. and
Bugg, C.E. (1991). Science, 252, 698-702.
Eigenbrodt, E., Fister, P.and Reinacher, M. (1985). In Regulation of Carbohydrate Metabolism
(Beitner, R., ed.), CRC, Boca Raton, FL, pp. 14 1-179.
Einarsson, M., Brandt, J. and Kaplan, L. (1985). Biochim. Biophys. Acta, 830, 1-10.
217
Familletti, P.C. and Fredericks, i.E. (1988). Biotechnol., 6, 41-44.
Fawcett, J.K.and Scott, J.E. (1960). 1. C/in. Pathol., 13, 156-159.
Fike, R.M., Pfohl, J.L., Epstein, D.A., Jayme, D.W. and Weiss, S. (1991). Biopharm., 26-29.
Fleischaker, R.J. and Sinskey, A.J. (1981). Eur. J. Appi. Microb. BiotechnoL, 12, 193-197.
Frame, K.K. and Hu, W-S. (1985). Biotechnol. Leti., 7, 147-152.
Friedman, i.S., Cofer, C.L., Anderson, C.L., Kushner, J.A., Gray, P.P., Chapman, G.E., Stuart,
M.C., Lazarus, L., Shine, J. and Kushner, P.J. (1989). Biotechnol., 7, 359-362.
Gaertner, J.G. and Dhurjati, P. (1993). Biotechnol. Prog., 9, 298-308.
Ganne, V. and Mignot, 0. (1991). Cytotechnol., 6, 233-240.
Gardner, A.R., Gainer, J.L. and Kirwan, D.J. (1990). Biotechnol. Bioeng., 35, 940-947.
Gasser, F., Mulsant, P. and Gillois, M. (1985). In Vitro Cell. Develop. Biol., 6, 588-592.
Gebert, C.and Gray, P.P. (1990). In Production of biologicals from animal cells in culture
(Spier, R.E., Griffiths, J.B. and Meignier, B., eds.), Butterworths, Sevenoaks, pp. 76-78.
Glacken, M.W., Fleischaker, R.J. and Sinskey, A.J. (1986). Biotechnol. Bioeng., 28, 1376-
1389.
Glacken, M.W. (1988). Biotechnol., 6, 1041-1050.
Glassy, M., Tharakan, J.P., Chan, P.C. (1988). Biotechnol. Bioeng., 32, 1015-1028.
Goochee, C.F. and Monica, T. (1990). BiotechnoL, 8, 421-427.
Goochee, C.F., Gramer, M.J., Andersen, D.C, Bahr, J.B. and Rasmussen, J.R. (1991).
Biotechnol., 9, 1347-1355.
Goochee, C.F., Gramer, M.J., Andersen, DC, Bahr, J.B. and Rasmussen, J.R. (1992). In
Frontiers in Biochemistry II (Todd, P., Silcdar, S.K. and Bier, M., eds.), Washington, D.C.,
USA, American Chemical Society, pp 199-240.
Gottesman, M.M. (1985). In Molecular Cell Genetics (Gottesman, MM. ed.), Wiley-
Interscience Publication, New York, pp. 139-155.
Goto, M., Akai, K., Murakami, A., Hashimoto, C., Tsuda, E., Ueda, M., Kawanishi, G.,
Takahashi, N., Ishimoto, A., Chiba, H and Sasaki, R. (1988). Biotechnol., 6,67-71.
218

Graf, H., Rabaud, J-N and Egly, J-M. (1991). 1. Immunol. Meth., 139, 135-144.
Gray, P.W., Leung, D.W., Pennica, D., Yelverton, E., Najarian, R., Simonsen, C.C., Derynck,
R., Sherwood, P.J., Wallace, D.M., Berger, S.L., Levinson, A.D. and Goeddel, D.V.
(1982). Nature, 295, 503-508.
Greasham, R. and Inamine, E. (1986). In Manual of Industrial Microbiology and
Biotechnology (Demain, A.L. and Solomon, N.A., eds.), American Society for
Microbiology, Washington DC, pp 41-48.
Grinnell, B.W., Walls, J.D. and Gerlitz, B. (1991). J. Biol. Chem., 226, 9778-9785.
Gutteridge, J.M.C. (1986). Biochim. Biophys. Acta, 869, 119-127.
Hahn, T.J. and Goochee, C.F. (1992). J. Biol. Chem., 267, 23982-23987.
Halliwell, B. (1988). Biochem. Pha rinacoL , 37, 569-571.
Hamilton W.G. and Ham, R.G. (1977). In Vitro, 13, 537-547.
Handa-Corrigan, A., Emery, A.N. and Spier, R.E. (1989). Enzyme Microb. Technol., 11, 232-
235.
Harrison, R.G. (1907). Proc. Soc. Exp. Med., 4, 140-143.
Hasegawa, K., Yasuhiro, A., Michihiro, K., Akamatsu, Y., Nishijima, M. (1990). Biochim.
Biophys. Acta, 1051, 221-229.
Hassel, T., Gleave, S. and Butler, M. (1991). App!. Biochem. Biotecnol., 30, 29-41.
Hata, J., Tamura, T., Yokoshima, 5, Yamashita., S., Kabeno, S., Matsumoto, K. and Onodera,
K. (1 992).Cytotechnol., 10, 9-14.
Hayter, P.M., Furlotte, D., Wilcox, M., Curling, E.M.A., Jenkins, N. (1989). In Advances in
Animal Cell Biology and Technology for Bioprocesses (Spier, R.E., Griffiths, J.B.,
Stephenne, J. and Crooy, P.J., eds.), Butterworths, Sevenoaks, pp. 280-282.
Hayter, P.M., Curling, E.M.A., Baines, A.J., Jenkins, N., Salmon, I., Strange, P.G., Bull, A.T.
(1991a). App! Microbiol. Biotechnol., 34, 559-564.
219

Hayter, P.M., Curling, E.M.A., Baines, A.J., Bull, A.T., Salmon, I., Strange, P.G. and Jenkins,
N. (1991b). In Production of Biologicals from Animal Cells in Culture (Spier, R.E.,
Griffiths, J.B. and Meignier, B., eds.), Butterworth-Heinemann, Oxford, UK, pp. 789-795.
Hayter, P.M., Curling, E.M.A., Baines, A.J., Jenkins, N., Salmon, I., Strange, P.G., Tong, J.M.
and Bull, A.T. (1992). Biotech. Bioeng., 39, 327-335.
Hayter, P.M., Curling, E.M.A., Gould, M.L., Baines, A.J., Jenkins, N., Salmon, I., Strange,
P.G. and Bull, A.T. (1993). Biotechnol. Bioeng., In Press.
Hitzman, R.A., Leung, D.W., Perry, L.J., Kohr, W.J., Levine, H.L. and Goeddel, D.V. (1983).
Science, 219, 620-625.
Hogrefe, H.H., McPhie, P., Bekisz, J.B., Enterline, J.C., Dyer, D., Webb, D.S.A., Gerrard, T.L
and Zoon, K.C. (1989). J. Biol. Chem., 264, 12179-12186.
Hu, W-S. and Dodge, T.C. (1985). Biotechnol Prog., 1, 209-215.
Hu, W-S., Meier, J. and Wang, D.I.0 (1986). Biotechnol. Bioeng., 28, 122-125.
Hume, A.D., Radik, J.L., Ferber, E. and Weidemann, M.J. (1978). Biochem. J., 174, 703-709.
HUlscher, M. and Onken, U. (1988). Biotechnol. Lett., 10, 689-694.
Imamura, T., Crespi, C.L., Thilly, W.G. and Brunnengraber, H. (1982). Anal. Biochem., 124,
353-358.
Iscove, N.N. and Melchers, F. (1978). J. Exp. Med., 147, 923-933.
Iscove, N.N., Guilbert, L.J. and Weyman, C. (1980). Exp. Cell Res., 126, 121-126.
Jager, V. (1991). In Production of Biologicals from Animal Cells in Culture (Spier, R.E.,
Griffiths, J.B. and Meignier, B. eds), Butterworth-Heinemann, Oxford, UK, pp. 155-166.
James, D. C., Freedman, R.B., Hoare, M., Sutton, C.W., O'Neil, J.A., Cohrell, J.S. and
Jenkins, N. (1993). CHJ Symposium on Glycotechnology (Abstract).
Jayme, D.W. (1991). Cytotechnol., 5, 15-30.
Kagawa, Y., Takasaki, S., Utsumi, J., Hosoi, K., Shimizu, H., Koshibe, N. and Kobata, A.
(1988). J. Biol. Chem., 263, 17508-17515.
Kao, F.T. and Puck, T.T. (1967). Genetics, 55, 5 13-524.
220

Kaufman, R.J. and Sharp, P.A. (1982).). MoL Biol., 159, 601-621.
Kaufman, R.J., Wastey, L.C. and Domer, A.J. (1988). .1. Biol. Chem., 263, 6352-6362.
Kawamoto, T., Sato, J.D., McClure, D.B., and Sato, G.H. (1986). Methods in Enzymology,
121, 267-277.
Kilburn, D.G. and Webb, F.C. (1968). Biotechnol. Bioeng., 10, 801-814.
Kilburn, D.G., Lilly, M.D., Self, D.A. and Webb, F.C. (1969). J. Cell Sci., 4, 25-37.
King, M.E. and Spector, A.A. (1981). In The Growth Requirements of Vertebrate Cells In
Vitro (Waymouth, C., Ham, R.G. and Chapple, P.J., eds.), Cambridge Univ. Press,
Cambridge, pp. 293-3 12.
Klausner, A. (1993). Biotechnol., 11, S35-S37.
Köler, G. and Milstein, C. (1975). Nature, 256, 495-497.
Kopp, K., Schulter, M., Walz, F. Noé, W. and Werner, R. (1993). In Animal Cell Technology:
Products of Today, Prospects for Tomorrow. 12th Meeting of the European Society for
Animal Cell Technology, Wurzburg, Germany.
Kornfeld, R. and Kornfeld, S. (1985). Ann. Rev. Biochem., 54, 631-664.
Kovar, J. (1986). Folia Biologica, 32, 305-3 10.
Kovar, J. and Franek, F. (1984). Im,nunol. Lett., 7, 339-343
Kovar, J. and Franek, F. (1985). Folia Biologica , 31, 167-175
Kovar, J. and Franek, F. (1986). Methods in Enzymology, 121, 277-292.
Kovar, J. and Franek, F. (1987). Biotechnol. Lett., 9, 259-264.
Kunas, K.T. and Papoutsakis E.T. (1990).). Biotechnol., 15, 57-64.
Kurano, N., Leist, C., Messi, F., Kurano, S. and Fiechter, A. (1990a). J. Biotechnol., 15, 101-
112.
Kurano, N., Leist, C., Messi, F., Kurano, S. and Fiechter, A. (1990b). J. Biotechnol., 15, 113-
128.
Kurano, S., Kurano, N., Leist, C. and Fiechter, A. (1990c). Citotechnol., 4, 243-250.
Lakhotia, S., Bauer, K.D. and Papoutsakis, T. (1993). Biotechnol. Bioeng., 41, 868-877.
221

Lambert, K.J. and Birch, J.R. (1985). In Animal Cell Biotechnology (Spier, R.E. and Griffiths,
J.B., eds.), Academic Press, New York, pp. 85-122.
Lambert, K. and Pirt, S.J. (1975). J. Cell Sci., 17, 397-4 1 1.
Lanks, K.W. (1987). J. Biol. Chem., 262, 10093-10097.
Lazo, P.A. (1981). Eur. J. Biochem., 117, 19-25.
Lehninger, A.L. (1975). In Biochemistry. Worth Publishers, Inc., New York, pp. 659-693.
Leist, C.H., Meyer, H-P. and Fiechter, A. (1986). J. Biotechnol., 4, 235-246.
Leist, C.H., Meyer, H-P. and Fiechter, A. (1990). J. Biotechnol., 15, 1-46.
Leslie, D. (1992).Chemistry and Industry, 7, 634-638.
Lin, A.A. and Miller, W.M. (1992). Biotechnol. Bioeng., 40, 505-5 16.
Lin, A.A, Kimura, R. and Miller, W.M. (1993). Biotechnol. Bioeng., 42, 339-350.
Ljunggren, J. and Haggstrom, L. (1990). Biotechnol. L.etts., 12, 705-710.
Ljunggren, J. and Haggstrom, L. (1992). Cytotechnol., 8, 45-56.
Looby, D. and Griffiths, B. (1990). Trends BiotechnoL , 8, 204-208.
Luan, Y.T., Mutharasan, R. and Magee,W.E. (1987). Biotechnol. Lett., 9, 691-696.
Lubiniecki, A., Arathoon, R., Polastri, G., Thomas, J., Wiebe, M., Garnick, R., Jones, A., Van
Reis, R., and Builder, S. (1989). In Advances in Animal Cell Biology and Technology for
Bioprocesses (Spier, R.E., Griffiths, J.B., Stephenne, J. and Crooy, P.J.,eds.),
Butterworths, Sevenoaks, pp. 442-451.
Lucid-Lange M, Wagner R (1991) In Production of Biologicals from Animal Cells in Culture
(Spier, R.E., Griffiths, J.B. and Meignier, B., eds.), Butterworth-Heinemann, Oxford, UK,
pp. 180-186.
Maiorella, B., Inlow, D., Shauger, A. and Harano, D. (1988). Biotechnol., 6, 1406-1410.
Maiorella, B.L., Winkeihake, J., Young, J., Moyer, B., Bauer, R., Hora, M., Andya, J.,
Thomson, J., Patel, T. and Parekh, R. (1993). Biotechnol., 11, 387-392.
Maiorella, B. (1992). In Harnessing Biotechnology for the 21st Century (Ladisch, MR. and
Bose, A., eds.), American Chemical Society, pp. 25-29.
222

Martinelle, K. and Haggstrom, L. (1993). In Animal Cell Technology: Products of Today,
Prospects for Tomorrow. 12th Meeting of the European Society for Animal Cell
Technology, Wurzburg, Germany.
Mather, J.P. and Sato, G.H. (1979). Exp. Cell Res., 20, 191-200.
McCarthy, K. (1962). Expt. Cell. Res., 27, 230-240.
McCormick, F., Trahey, M., Innis, M, Dieckmann, B. and Ringold, G. (1984). Mo!. Ce!!.
Bio!., 4, 166-172.
McHugh, Y. E., Waithall, B.J. and Steimer, K.M. (1983). Biotechniques , 1, 72-77.
McKeehan, W.L. (1986). In Carbohydrate Metabolism in Cultured Cells (Morgan, M.J., ed.),
Plenum Press, New York, pp. 111-150.
Megaw, J.M. and Johnson, L.D. (1979). Proc. Soc. Exp. Bio!. Med., 161, 60-65.
Merchuk, J.C. (1990). Trends Biotechnol., 8, 66-71.
Merten, O-W., Moeurs, D., Keller, H., Leno, M., Cabanie, L. and Couve, E. (1993). In Animal
Ce!! Technology: Products of Today, Prospects for Tomorrow. 12th Meeting of the
European Society for Animal Cell Technology, Wurzburg, Germany.
Michel, M.L., Sobczak, E., Malpiece, Y, Tiollais, P. and Streeck, R.E. (1985). Biotechnol., 3,
561-566.
Michaels, J.D., Petersen, J.F., Mclntire, LV. and Papoutsakis, E.T. (1991). Biotechnol.
Bioeng., 38, 169-180.
Miletich, J.P. and Broze, G.J., Jr. (1990). J. Biol. Chem., 265, 11397-11404.
Miller, W.M., Blanch, H.W. and Wilke, C.R. (1988). Biotechnol. Bioeng., 32, 947-965.
Miller, W.M., Wilke, C.R. and Blanch, H.W. (1989a). Biotechno!. Bioeng., 33, 477-486.
Miller, W.M., Wilke, C.R. and Blanch, H.W. (1989b). Biotechnol. Bioeng., 33, 487-499.
Minamoto, Y., Ogawa, K., Abe, H., lochi, Y. and Mitsugi, K. (1991). Cytotechnol., 5, 35-5 1.
Mizrahi, A. (1975).J. Clin. Microbiol., 2, 11-13.
Mizrahi, A. (1988). Biotech. Adv., 6, 207-220.
223

Morgan, M.J. and Faik, P. (1986). In Carbohydrate Metabolism in Cultured Cells (Morgan,
M.J., ed.) Plenum Press, New York, pp 29-75.
Moreadith, R.W. and Lehninger, A.L. (1984). J. Biol. Chem., 259, 6215-6221.
Murakami, H., Masui, H., Sato, G., Sueoka, M., Chou, T. and Kano-Suloka, T. (1982). Proc.
Nat!. Acad. Sci. USA ,79, 1158-1162.
Murhammer, D.W. and Goochee, C.F. (1988). Biotechnol., 6, 1411-1416.
Mutsaers, J.H.G.M., Kamerling, J.P., Devos, R., Guisez, Y., Fiers, W. and Vliegenthart, J.F.G.
(1986). Eur. J. Biochem., 156, 65 1-654.
Nahapetian, A.T., Thomas, J.N. and Thilly, W.G. (1986). J. Cell Sci., 81, 65-104.
Nielsen, F.H. (1981). In The Growth Requirements of Animal Cells in Culture (Waymouth, C.,
Ham, R.G. and Chapple, P.J., eds.), Cambridge University Press, Cambridge, pp. 68-8 1.
Nilsson, K., Birnbaum, S. and Mosbach, K. (1988). App!. Microbiol. Biotechno!., 27, 366-37 1.
Ogata, M., Wakita, K., Kimura, K., MAnumoto, Y., Oh-i, K. and Shimizu, S. (1993). App!.
Microbiol. Biotechno!., 38, 520-525.
Ozturk, S.S. and Paisson, B.O. (1991). J. Biotechnol., 18, 13-28.
Pan, C.E., Stem, A.S., Familletti, P.C., Khan, F.R. and Chizzonite, R. (1987). Eur. I.
Biochem., 142, 145-149.
Papoutsakis, E.T. (1991a). Trends Biotechnol., 9, 3 16-324.
Papoutsakis, E.T. (1991b). Trends Biotechno!., 9,427-437.
Parekh, R.B., Dwek, R.A., Edge, C.J. and Rademacher, T.W. (1989a). Trends Biotechnol., 7,
117- 122.
Parekh, R.B., Dwek, R.A., Thomas, J.R., Opdenakker, G., Rademacher, T., Wittwer, A.J.,
Howard, S.C., Nelson, R., Siegel, N.R., Jennings, M.G., Harakas, N.K. and Feder, J.
(1989b). Biochem., 28, 7644-7662.
Parekh, R.B. and Patel, T.P. (1992). Trends Biotechnol., 10, 276-280.
Patel, T.P, Parekh, RB., Moellering, B.J. and Prior, C.P. (1992). Biochem. J., 285, 839-845.
Paviakis, G.N. and Hamer, D. (1983). Proc. Nat!. Acad. Sci. USA, 80, 397-401.
224
Pavirani, A., Meulien, P., Haner, H., Schamber, F., Dott., K., Villeval, D., Cordier, Y., Wiesel,
M.L., Mazurier, C., Van de Pol, H., Piquet, Y., Cazenove, H.P. and Lecocq, J.P. (1987).
Biotechnol., 5, 389-392.
Perez, L., Vega, J, Chuay, C., Menendez, A., Ubieta, R., Montero, M., Padron, G., Silva, A.,
Santizo, C., Besada, V. and Herrera, L. (1990). App!. Microb. Biotechno!., 33,429-434.
Petersen, J.F., Mclntire, L.V. and Papoutsakis, E.T. (1990). Biotechnol. Prog., 6, 114-120.
Phillips, A.W., Ball, G.D., Fantes, K.H., Finter, N.B. and Johnson, M.D. (1985). Experience in
the cultivation of mammalian cells on the 8000 1 scale. In Large-scale mammalian cell
culture (Feder and Tolbert eds.), Academic Press, New York, pp 87-95.
Phillips. M.C., Johnson, W.S. and Rothblat, G.H. (1987). Biochim. Biophys. Acta, 906, 223-
276.
Piret, J.M. and Cooney, C.L. (1990). Biotech. Adv., 8, 763-783.
Plackett, R.L. and Burman, J.P. (1946). Biometrica, 33, 305-325.
PMA report (1988). Biotechnol., 6, 1004-1007.
Prokop, A. and Rosenberg, M.Z. (1989). Adv. Bioch. Eng. Biotechnol., 39, 29-7 1.
Puck, T.T., Ciecuira, S.J. and Robinson, A. (1958). J. Ep. Med., 108, 945-955.
Ramirez, O.T., and Mutharasan, R. (1990). BiotechnoL Bioeng., 36, 9 11-920.
Ray, N.G., Karakare, S.B. and Runstadler Jr, P.W. (1989). Biotechnol. Bioeng., 33, 724-730.
Rearick, J.I., Chapman, A., and Komfeld, S. (1981) J. Biol. Chem., 256, 6255-6261.
Reitzer, L.J., Wice, B.M. and Kenell, D. (1979). J. Biol. Chem., 254, 2669-2676.
Reuveny, S., Velez, D., Macmillan, J.D. and Miller, L. (1986). J. Immonol. Met/i., 86, 53-59.
Rhodes, M. and Birch, J. (1988). Biotechnol., 6, 5 18-523.
Rhodes, P.M. (1989). In Advances in Animal Ce!! Biology and Techno!ogy for Bioprocesses
(Spier, R.E., Griffiths, J.B., Stephenne, J. and Crooy, P.J. eds.), Butterworths, Sevenoaks,
pp. 472-480.
Rinderknecht, E., O'Connor, B.H. and Rodriguez, H. (1984). J. Rio!. Chem., 259, 6790-6797.
225

Robinson, D.K., Chan, C.P., Lee, D.K, Lenny, A.B., Seamans, T.C., Tung, J-S., Tsai, P.K.,
Irwin, J., Yu Ip, C.C., Mark, G.E. and Silberklang, M. (1993) In Animal Cell Technology:
Products of Today, Prospects for Tomorrow. 12th Meeting of the European Society for
Animal Cell Technology, Wurzburg, Germany.
Ryan, W.L. and Cardin, C. (1966). Proc. Soc. Exp. Biol. Med., 123, 27-30.
Sanceau, J., Sondermeyer, P., Beranger, F., Falcoff, R. and Vaquero, C. (1987). Proc. Nat!.
Acad. Sci. USA, 84, 2906-2910.
Sakagushi, M., Honda, S., Ozawa, M. and Nishimura, 0. (1988). FEBS. Lett., 230, 201-204.
Sanders, P.G. (1990). In Animal Cell Biotechnology (Spier, R.E. and Griffiths, J.B. eds).
Academic Press, Inc., New York, pp. 15-70.
Sato, J.D., Kawamoto, T. and Okamoto, T. (1987). J. Exp. Med., 165, 1761-1766.
Scahill, S.J., Devos, R., van der Heyden, J. and Fiers, W. (1983). Proc. Nat!. Acad. Sd. USA,
80, 4654-4658.
Schlaeger, E-J. and Schumpp, B. (1989). In Advances in Animal Cell Biology and Technology
for Bioprocesses (Spier, R.E., Griffiths, J.B., Stephenne, J. and Crooy, P.J., eds.),
Butterworths, Sevenoaks, pp. 386-396.
Schmid, G. (1991). In Production of Biologicals from Animal Cells in Culture (Spier, R.E.,
Griffiths, J.B. and Meignier, B. eds), Butterworth-Heinemann, Oxford, UK, pp 61-66.
Schmid, G., ZiJg, H., Eberhard, U. and Johannsen, K. (1991). J. Biotechnol., 17, 155-167.
Schmid, G., Zilg, H. and Johannsen, K. (1992). Appi. Microb. Biotechno!., 38, 328-333.
Schneider, Y-J. (1989). J. Immunol. Meth., 116, 65-77.
Seaver, S.S, Rudolph, J.L. and Gabriels, J.E. Jr. (1984). Biotechniques, 2, 254-260.
Seeling, G.F., Wijdenes, J., Nagabhashan, T.L. and Trotta, PP. (1988). Biochem., 27, 1981-
1987.
Shaughnessy, T.S. and Kargi, F. (1990). Enzyme Microb. Technol., 12, 669-675.
Shotwell, M.A., Jayme, D.W., Kilberg, M.S. and Oxender, DL. (1981). J. Biol. Chem., 11,
5422-5427.
226

Silberklang, M., Buckland, B. and Aunins, J. (1993). 205th ACS National Meeting, Denver,
Co. (Abstract).
Smiley, A.L., Hu, W-S. and Wang, DJ.C. (1989). Biotechnol. Bioeng., 33, 1182-1190.
Smith, R.A., Duncan, M.J. and Moir, D.T. (1985). Science, 229, 12 19-1225.
Smith, G.C. and Greenfield, P.F. (1992). Biotechnol. Bioeng., 40, 1045-1055.
Snell, K., Natsumeda, Y. and Weber, G. (1987). Biochem. J., 245, 609-612.
Speilman, M.W., Basa, L.J., Leonard, C.K., Chakel, J.A., O'Connor, J.V., Wilson, S. arid Van
Halbeek, H. (1989). J. Biol. Chem., 264, 14100-14111.
Staheli, J. (1987). Dev. Biol. Stand., 66, 143-163.
Stowe, R.A. and Mayer, R.P. (1966). Industrial and Engineering Chemistry, 58, 36-40.
Stryer, L. (1981). In Biochemistry (Freeman, W.H. and Company, ed.), San Francisco, pp. 511-
538.
Takazawa, Y., Tokashik, M., Murakami, H., Yamada, K. and Omura, H. (1988). Biotechnol.
Bioeng., 31, 168-172.
Takeuchi, M., Takasi, S., Miyazaki, H., Takashi, K., Hoshi, 5, Koshibe, N. and Kobata, A.
(1988). J. Biol. Chem., 263, 3657-3663.
Tharakan, J.P. and Chau, P.C. (1986). BiotechnoL Bioeng., 28, 329-342.
Tomlinson, N.J. (1991). Ph.D. Thesis, University of Kent at Canterbury, UK.
Trinchieri, J. and Perrusia, B. (1985). Immunol. Today, 6, 13 1-136.
Urlaub, G. and Chasm, L.A. (1980). Proc. Nat!. Acad. Sci. USA, 77, 4216-4220.
Utsumi, J., Mizuno, Y., Hosoi, K., Okano, K., Sawada, R., Kajitani, M., Sakai, I., Naruto, M.
and Shimizu, H. (1989). Eur. J. Biochem., 181, 545-553.
Wagner, R., Kraft, H. and Lehmann, J. (1989). In Advances in Animal Cell Biology and
Technology for Bioprocesses (Spier, R.E., Griffiths, J.B., Stephenne, J. and Crooy, P.J.,
eds.), Butterworths, Sevenoaks, pp. 374-377.
Wice, B.M., Reitzer, L.J. and Kennell, D. (1981). 1. Biol. Chem., 256, 7812-7819.
Yan, S.C.B., Grinnell, B.W. and Wold, F. (1989). Trends Biochem. Sci., 14, 264-268.
227

Yamada, G., Kitamura, Y., Sonoda, H., Hanada, H., Taki, S., Mulligan, R.C., Osawa, H.,
Diamentstein, T., Yyokoyama, S., and Taniguchi, T. (1987). EMBO 1., 6, 2705-2709.
Zetterberg, A. and Engstrom, W. (1981). J. Cell. Phisiol., 108, 365-373.
Zettlemeissi, G., Ragg, H. and Karges, HE. (1987). Biotechnol., 5, 720-725.
Zhang, S., A1-Rubeai, M. and Thomas, CR. (1992a). Enzyme Microb. TechnoL, 14, 980-983.
Zhang, S., Handa-Corrigan, A. and Spier, R.E. (1992b). J. Biotechnol., 25, 289-306.
Zielke, H.R., Ozand, P.T., Tildon, J.T., Sevdalian, D.A. and Comblath, M. (1976). Proc. Nat!.
Acad. Sci. USA, 73, 4110-4114.
Zielke, H.R., Ozand, P.T., Tildon, J.T., Sevdalian, D.A. and Comblath, M. (1978). J. Cell.
Physiol., 95, 4 1-48.
Zielke, H.R., Zielke, CL. and Ozand, P.T. (1984). Federation Proc., 43, 121-125.
Zinn, K., Mellon, P., Ptashne, M. and Maniatis, T. (1982). Proc. NatL Acad. Sci. USA, 79,
4897-4901.
228tIBt
t0D0N'Jt,lv


![s'i7/f ]u lgoGq0f tyf ckfËtf Joj:yfkg zfvf xfd |f] ;jfn a](https://img.pdfslide.net/doc/110x75/6279b0fca199f040bf7a7192/si7f-u-lgogq0f-tyf-ckftf-jojyfkg-zfvf-xfd-f-jfn-a-.jpg)