Embed Size (px)
Citation preview
Using Plackett Burman partial factorial designs for method robustness testing
By D. A. DurdenCanadian Food Inspection AgencyCalgary Laboratory3650 36 St NWCalgary , AB
Reproducibility of a Method
RuggednessRobustness
Ruggedness of a Method
“the degree of reproducibility of test results obtained by the analysis of the same samples under a variety normal test conditions” USP
Ruggedness test conditions
Differentlaboratoriesanalystsinstrumentsreagent lotsanalysis dayselapsed assay timesassay temperatures
Factors are external to the methodShould show a lack of influenceICH – “intermediate precision”
Robustness of a Method
“a measure of its capacity to remain unaffected by small but deliberate variations in method parameters and provides an indication of its reliability during normal use.“ USP, ICH
Factors are internal to the methodShould show a lack of influence
Typical robustness parameters
HPLCMobile phase compositionNumber, type, and proportion of organic solventsBuffer composition and concentrationpH of the mobile phaseDifferent column lots (same brand and model)TemperatureFlow rateWavelengthGradient; slope and length
Experimental design
The scientists approachUnivariate
Change a single variable at a timeTime consuming, inefficientInteractions may not be detected
Experimental design 2
The statisticians approachMultivariate
Change many variables at a timeMore efficientMay allow observation of interactionsSome main effects may be obscured
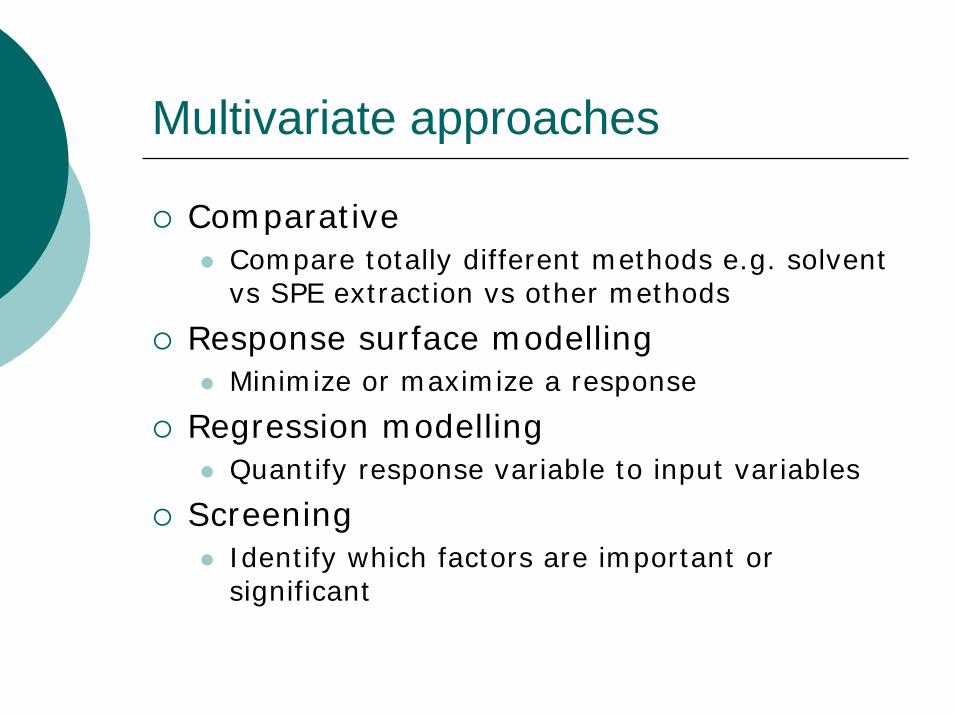
Multivariate approaches
ComparativeCompare totally different methods e.g. solvent vs SPE extraction vs other methods
Response surface modellingMinimize or maximize a response
Regression modellingQuantify response variable to input variables
ScreeningIdentify which factors are important or significant
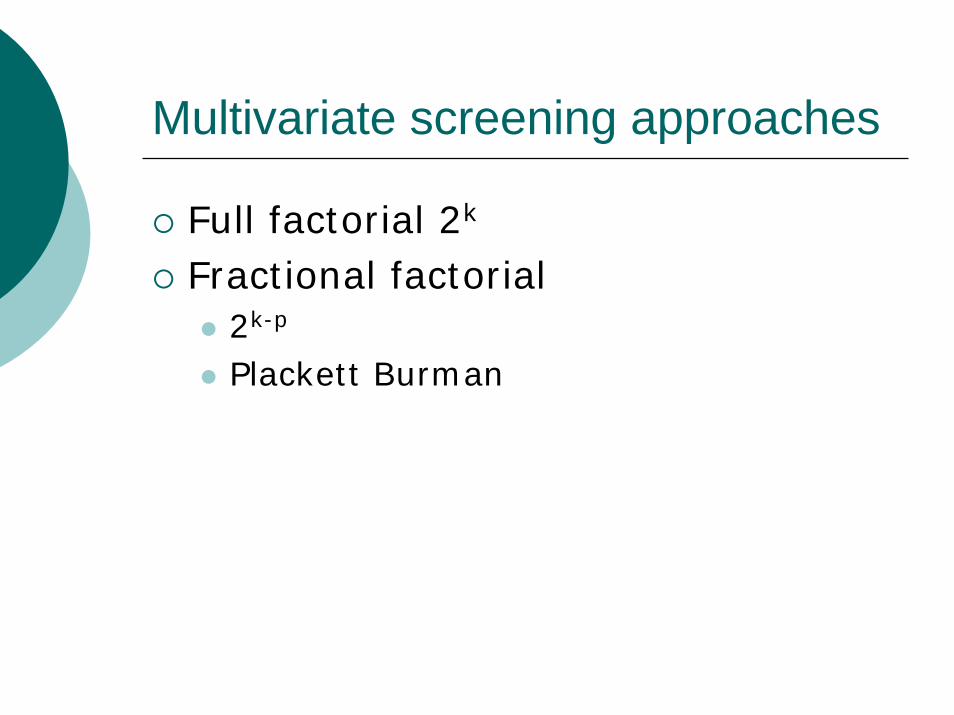
Multivariate screening approaches
Full factorial 2k
Fractional factorial2k-p
Plackett Burman
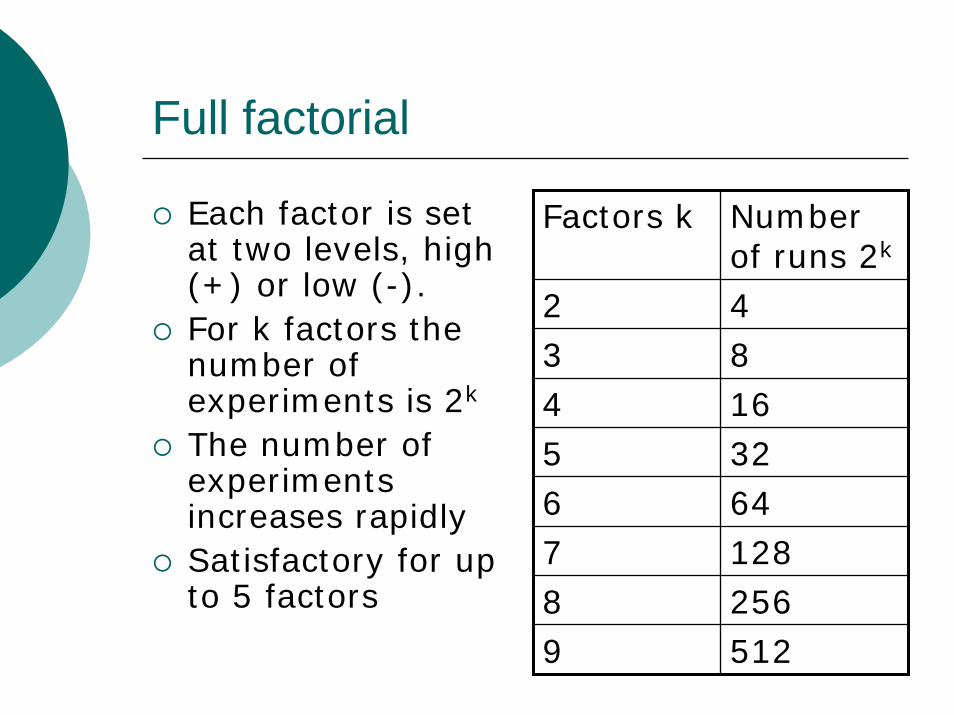
Full factorial
Each factor is set at two levels, high (+) or low (-).For k factors the number of experiments is 2k
The number of experiments increases rapidlySatisfactory for up to 5 factors
Factors k Number of runs 2k
2 43 84 165 326 647 1288 2569 512
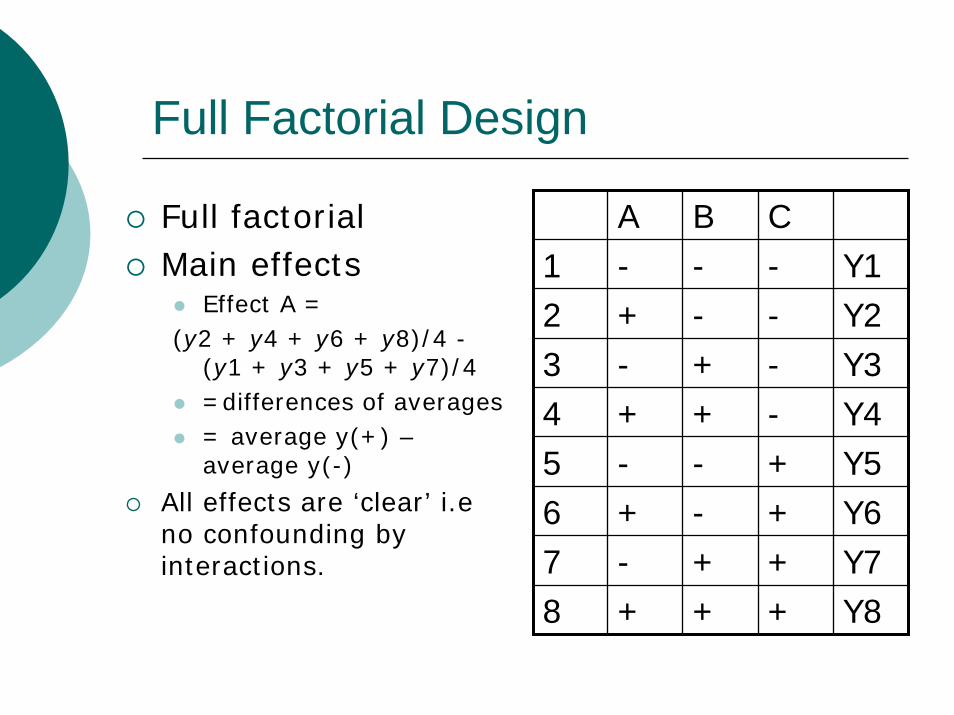
Full Factorial Design
Full factorialMain effects
Effect A = (y2 + y4 + y6 + y8)/4 -
(y1 + y3 + y5 + y7)/4=differences of averages= average y(+) –average y(-)
All effects are ‘clear’ i.eno confounding by interactions.
A B C1 - - -
---++++
2 + -Y1Y2Y3Y4Y5Y6Y7
3 - +4 + +5 - -6 + -7 - +8 + + Y8
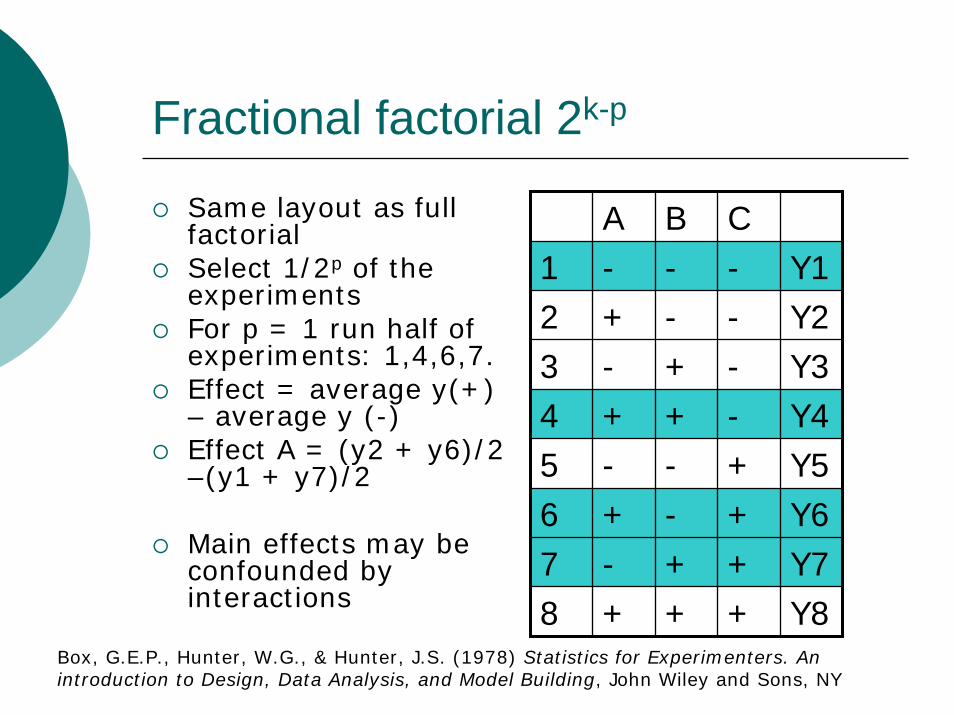
Fractional factorial 2k-p
Same layout as full factorialSelect 1/2p of the experimentsFor p = 1 run half of experiments: 1,4,6,7.Effect = average y(+) – average y (-)Effect A = (y2 + y6)/2 –(y1 + y7)/2
Main effects may be confounded by interactions
A B C1 - - -
---++++
2 + -Y1Y2Y3Y4Y5Y6Y7
3 - +4 + +5 - -6 + -7 - +8 + + Y8
Box, G.E.P., Hunter, W.G., & Hunter, J.S. (1978) Statistics for Experimenters. An introduction to Design, Data Analysis, and Model Building, John Wiley and Sons, NY
Plackett-Burman Designs
A two level fractional factorial designExperiments numbers n are in multiples of 4i.e. n = 8, 12, 20, 24, 28, 32 etcFactors k <= n – 1For k < n-1 use dummy factorsMost commonly used are n=8 and n=12
Plackett, R.L., & Burman, J.P. (1946) Biometrika 33, 305-325
P-B usefulness
LimitationsMain effects may be aliased by two way interactionsChoice of layout by Plackett and Burman was set to minimize these
Thus‘these designs are very useful for economically detecting large main effects, assuming all interactions are negligible when compared with the few important main effects’
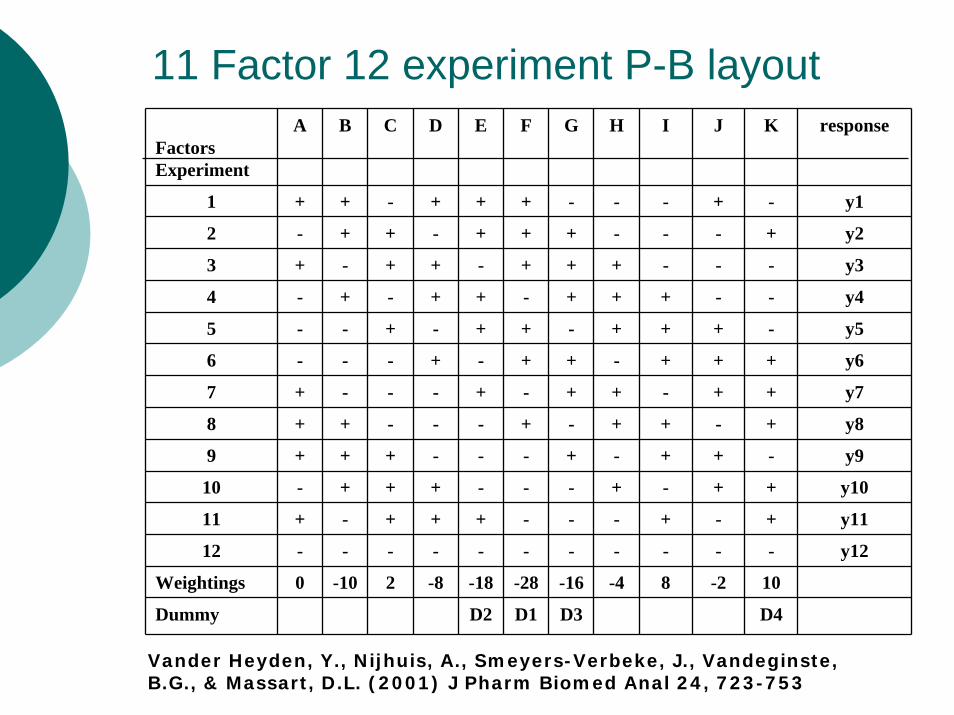
11 Factor 12 experiment P-B layout
Factors Experiment
A B C D E F G H I J K response
1 + + - + + + - - - + - y1
2 - + + - + + + - - - + y2
3 + - + + - + + + - - - y3
4 - + - + + - + + + - - y4
5 - - + - + + - + + + - y5
6 - - - + - + + - + + + y6
7 + - - - + - + + - + + y7
8 + + - - - + - + + - + y8
9 + + + - - - + - + + - y9
10 - + + + - - - + - + + y10
11 + - + + + - - - + - + y11
12 - - - - - - - - - - - y12
Weightings 0 -10 2 -8 -18 -28 -16 -4 8 -2 10
Dummy D2 D1 D3 D4
Vander Heyden, Y., Nijhuis, A., Smeyers-Verbeke, J., Vandeginste, B.G., & Massart, D.L. (2001) J Pharm Biomed Anal 24, 723-753
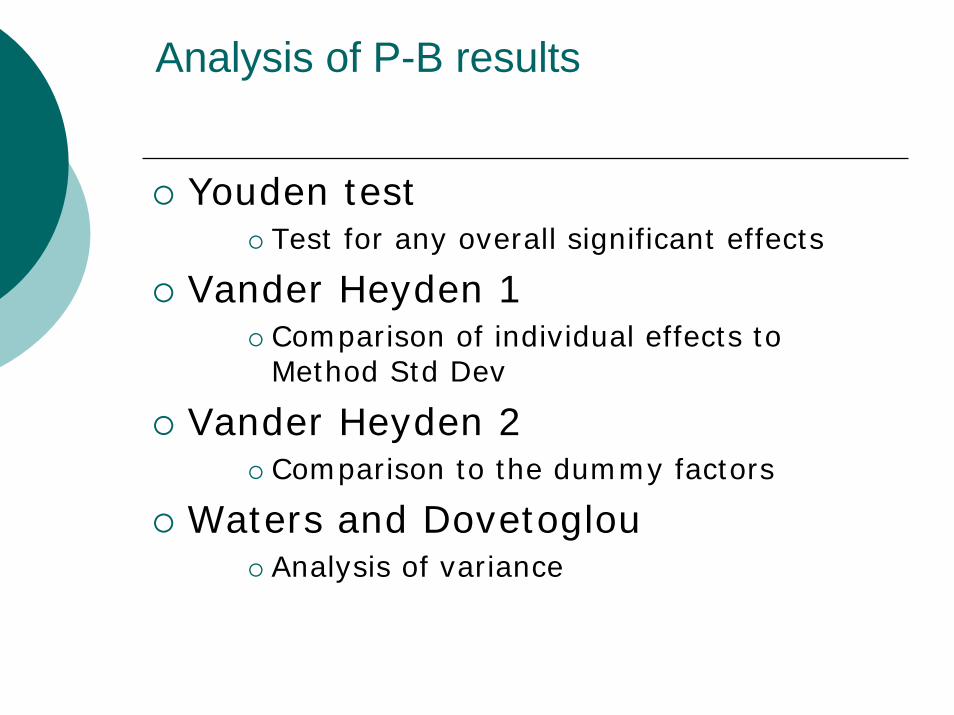
Analysis of P-B results
Youden testTest for any overall significant effects
Vander Heyden 1Comparison of individual effects to Method Std Dev
Vander Heyden 2Comparison to the dummy factors
Waters and DovetoglouAnalysis of variance
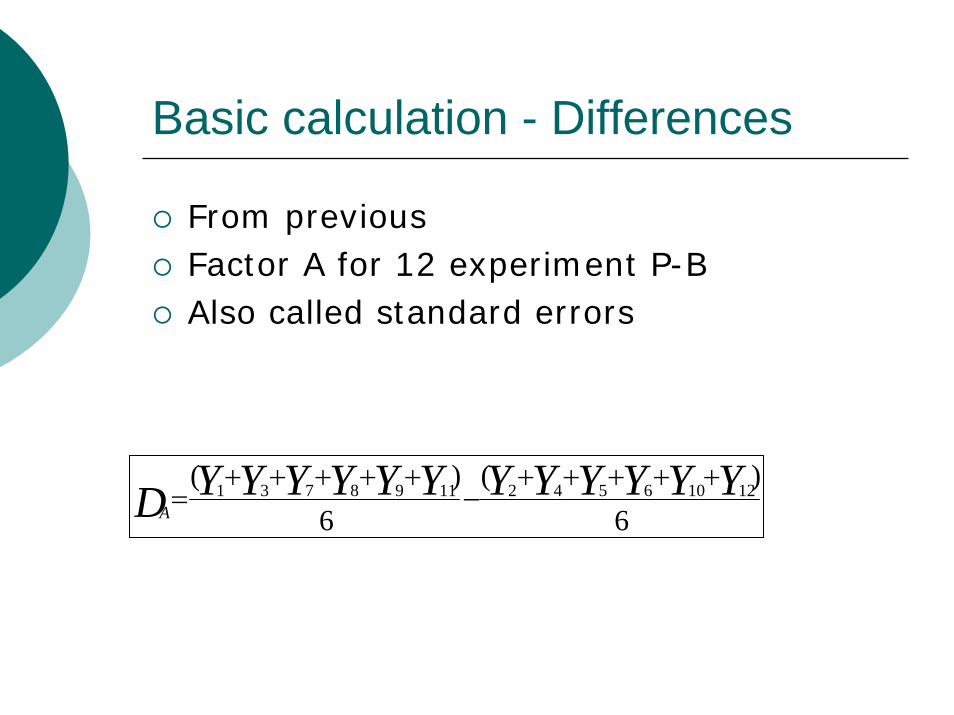
Basic calculation - Differences
From previousFactor A for 12 experiment P-BAlso called standard errors
6)(
6)( 121065421198731 YYYYYYYYYYYYDA
+++++−
+++++=
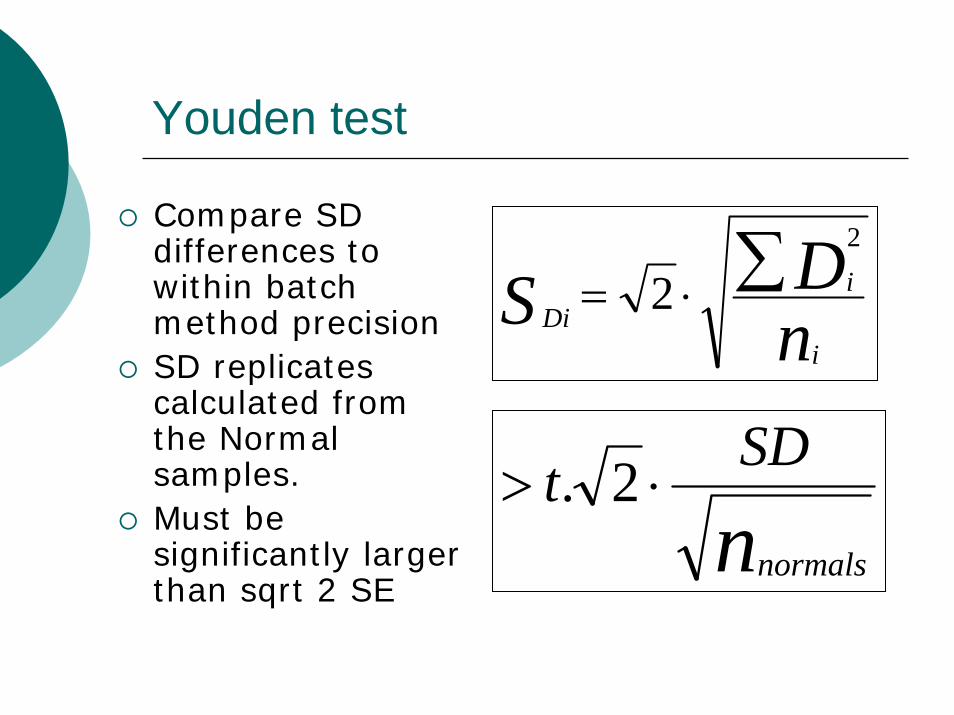
Youden test
Compare SD differences to within batch method precisionSD replicates calculated from the Normal samples.Must be significantly larger than sqrt 2 SE
nnormals
SDt ⋅> 2.
nDS
i
iDi
∑⋅=2
2
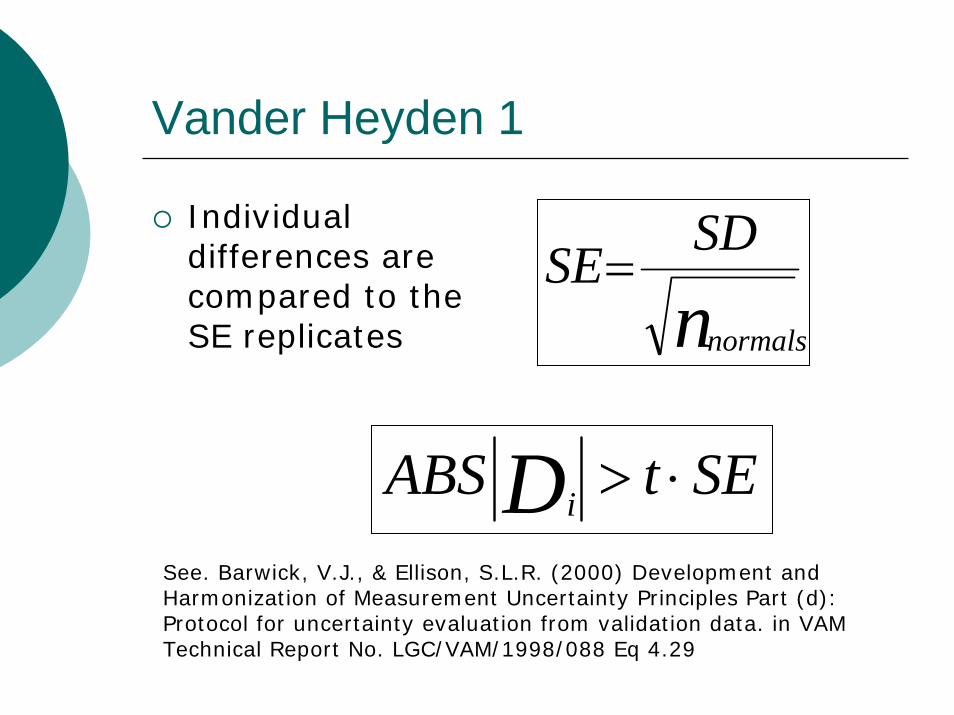
Vander Heyden 1
Individual differences are compared to the SE replicates nnormals
SDSE=
SEtABS Di ⋅>See. Barwick, V.J., & Ellison, S.L.R. (2000) Development and Harmonization of Measurement Uncertainty Principles Part (d): Protocol for uncertainty evaluation from validation data. in VAMTechnical Report No. LGC/VAM/1998/088 Eq 4.29
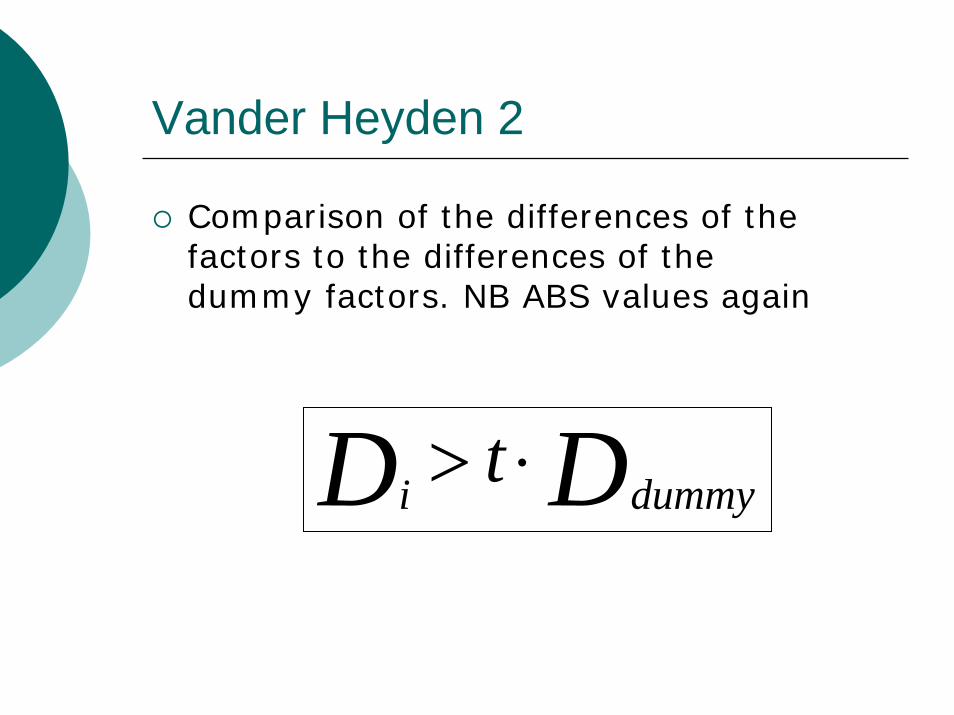
Vander Heyden 2
Comparison of the differences of the factors to the differences of the dummy factors. NB ABS values again
DD dummyi t ⋅>
Waters and Dovetoglou
Comparison of the Yi (+) to the Yi (-) using analysis of variance.Using NCSS calculated as multiple linear regression using the +1, -1 coefficientsAlso calculated in Excel following Spence et. al.
Spence, J.P., Cotton, J.W., Underwood, B.J., & Duncan, C.P. (1990) Elementary Statistics, Prentice Hall
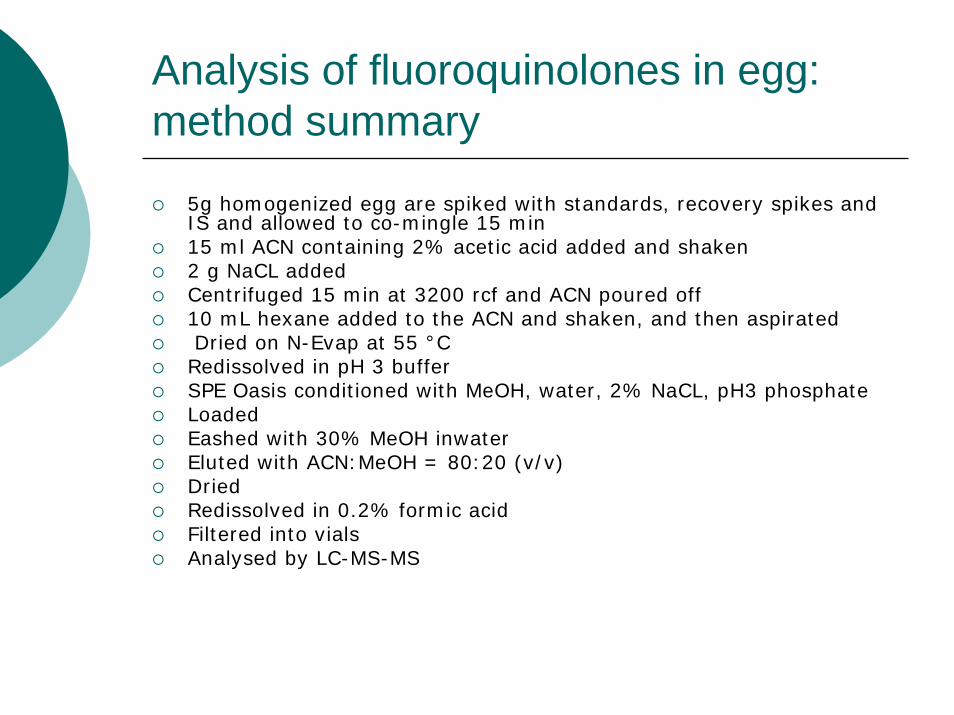
Analysis of fluoroquinolones in egg: method summary
5g homogenized egg are spiked with standards, recovery spikes and IS and allowed to co-mingle 15 min15 ml ACN containing 2% acetic acid added and shaken2 g NaCL addedCentrifuged 15 min at 3200 rcf and ACN poured off10 mL hexane added to the ACN and shaken, and then aspiratedDried on N-Evap at 55 °CRedissolved in pH 3 bufferSPE Oasis conditioned with MeOH, water, 2% NaCL, pH3 phosphateLoadedEashed with 30% MeOH inwaterEluted with ACN:MeOH = 80:20 (v/v)DriedRedissolved in 0.2% formic acidFiltered into vialsAnalysed by LC-MS-MS
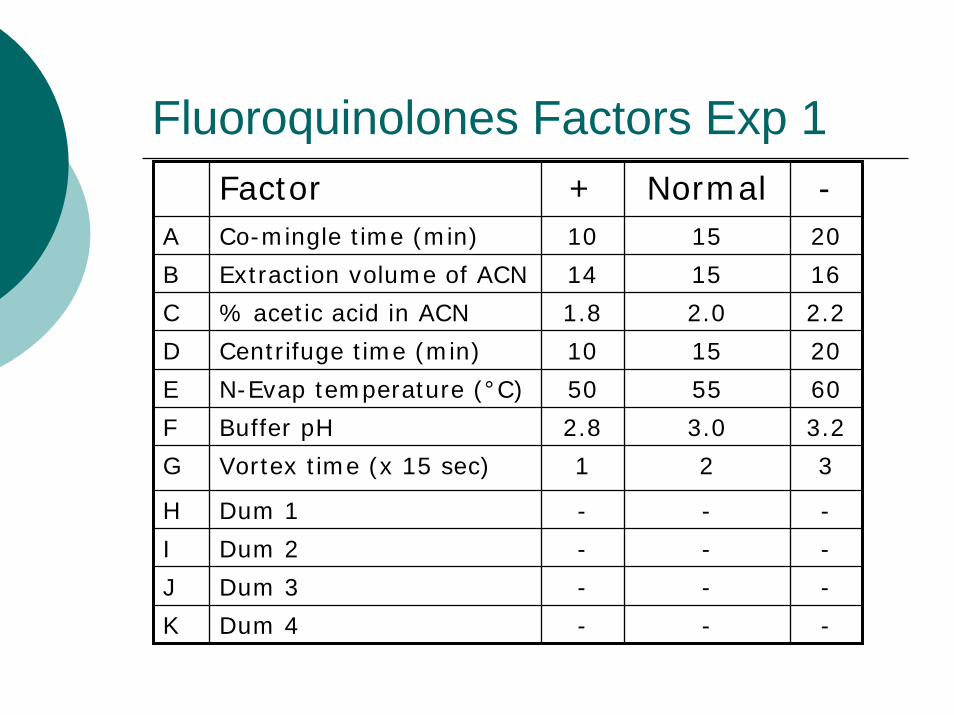
Fluoroquinolones Factors Exp 1Factor + Normal -
A
B
C
D
E
F
G
H
I
J
K
Co-mingle time (min) 10 15 20
Extraction volume of ACN 14 15 16
% acetic acid in ACN 1.8 2.0 2.2
Centrifuge time (min) 10 15 20
N-Evap temperature (°C) 50 55 60
Buffer pH 2.8 3.0 3.2
Vortex time (x 15 sec) 1 2 3
Dum 1 - - -
Dum 2 - - -
Dum 3 - - -
Dum 4 - - -
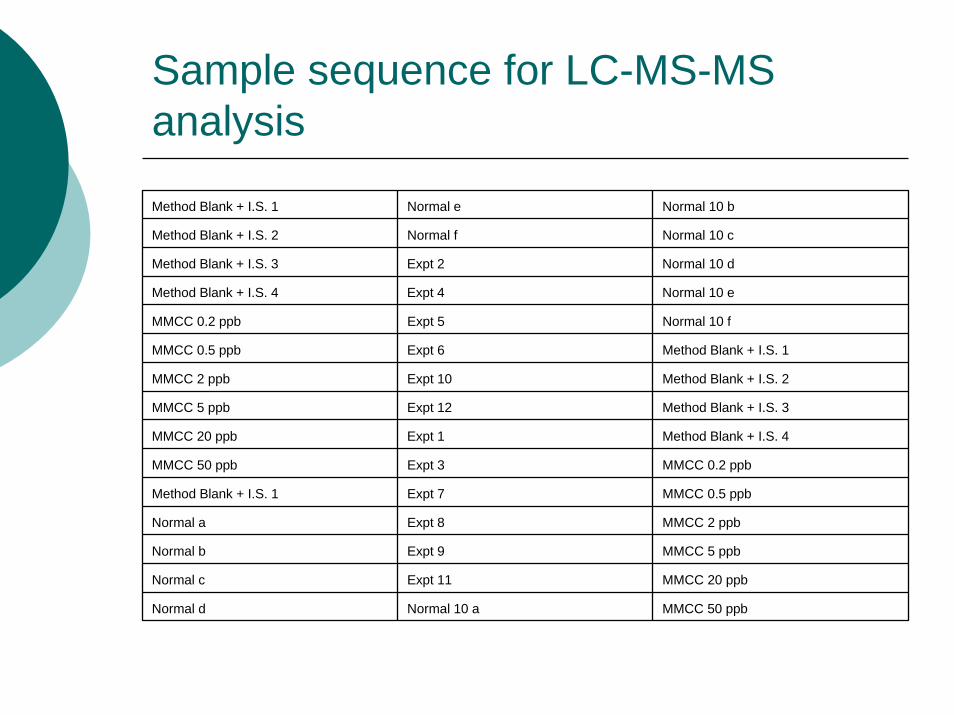
Sample sequence for LC-MS-MS analysis
Method Blank + I.S. 1 Normal e Normal 10 b
Method Blank + I.S. 2 Normal f Normal 10 c
Method Blank + I.S. 3 Expt 2 Normal 10 d
Method Blank + I.S. 4 Expt 4 Normal 10 e
MMCC 0.2 ppb Expt 5 Normal 10 f
MMCC 0.5 ppb Expt 6 Method Blank + I.S. 1
MMCC 2 ppb Expt 10 Method Blank + I.S. 2
MMCC 5 ppb Expt 12 Method Blank + I.S. 3
MMCC 20 ppb Expt 1 Method Blank + I.S. 4
MMCC 50 ppb Expt 3 MMCC 0.2 ppb
Method Blank + I.S. 1 Expt 7 MMCC 0.5 ppb
Normal a Expt 8 MMCC 2 ppb
Normal b Expt 9 MMCC 5 ppb
Normal c Expt 11 MMCC 20 ppb
Normal d Normal 10 a MMCC 50 ppb
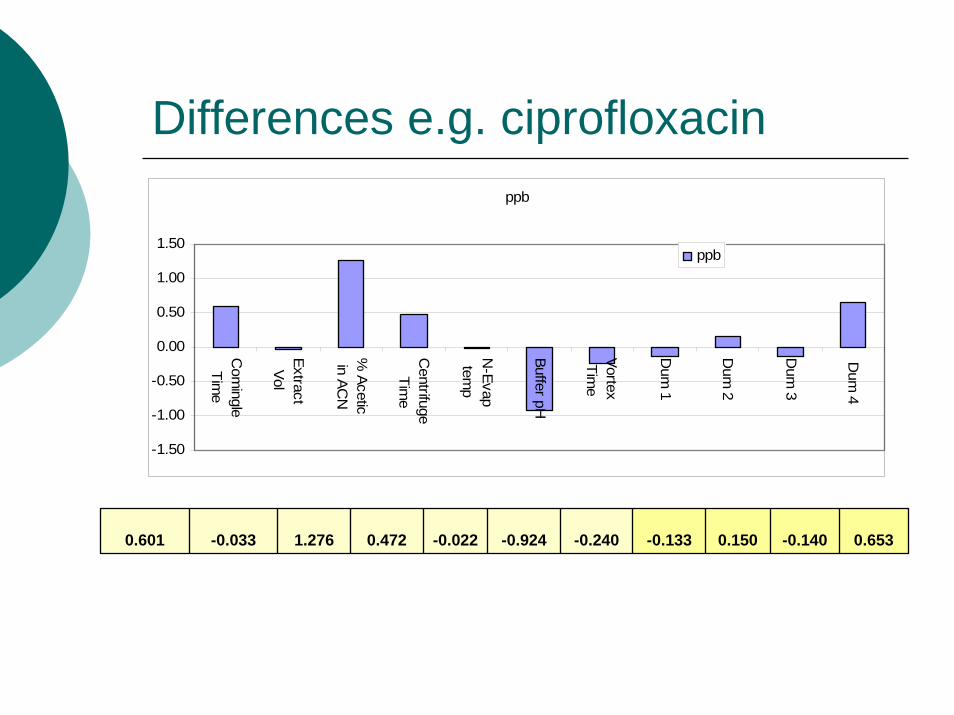
Differences e.g. ciprofloxacinppb
-1.50
-1.00
-0.50
0.00
0.50
1.00
1.50
Com
ingleTim
e
ExtractVol
% Acetic
in ACN
CentrifugeTim
e
N-Evaptem
p
Buffer pH
VortexTim
e
Dum
1
Dum
2
Dum
3
Dum
4
ppb
0.601 -0.033 1.276 0.472 -0.022 -0.924 -0.240 -0.133 0.150 -0.140 0.653
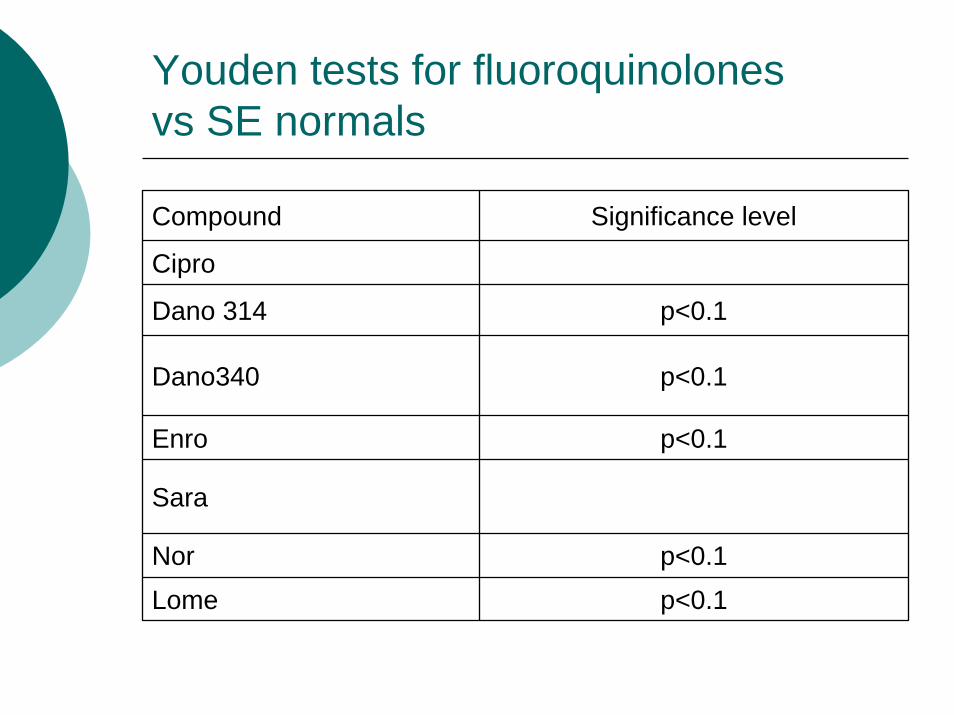
Youden tests for fluoroquinolonesvs SE normals
Compound Significance level
Cipro
Dano 314 p<0.1
Dano340 p<0.1
Enro p<0.1
Sara
Nor p<0.1Lome p<0.1
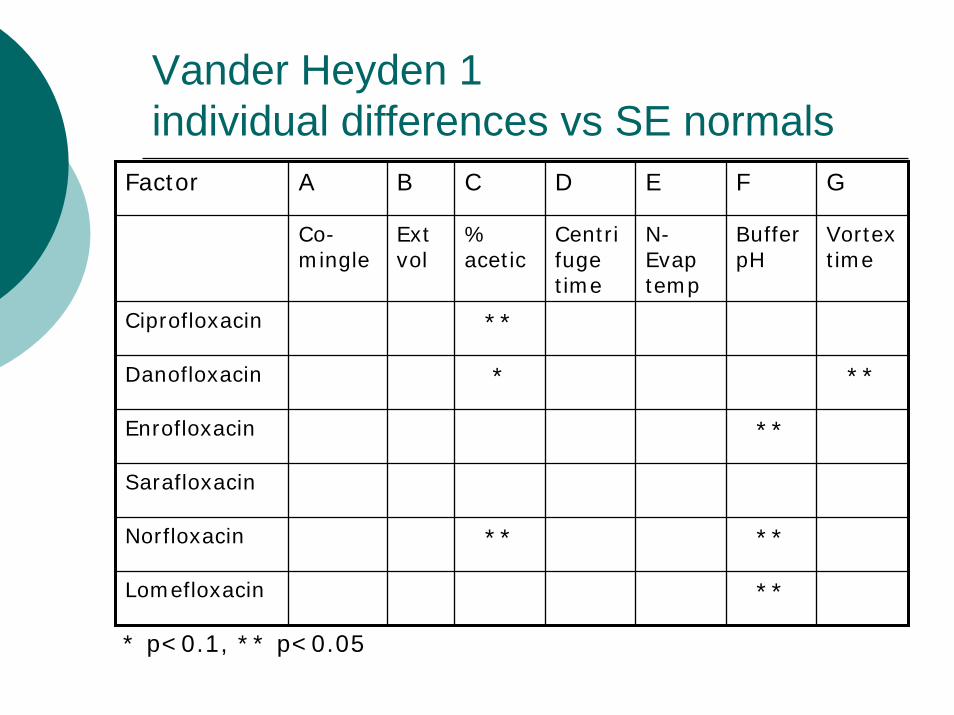
Vander Heyden 1individual differences vs SE normals
Factor A B C D E F G
Co-mingle
Ext vol
% acetic
Centrifuge time
N-Evaptemp
Buffer pH
Vortex time
Ciprofloxacin **
Danofloxacin * **
Enrofloxacin **
Sarafloxacin
Norfloxacin ** **
Lomefloxacin **
* p<0.1, ** p<0.05
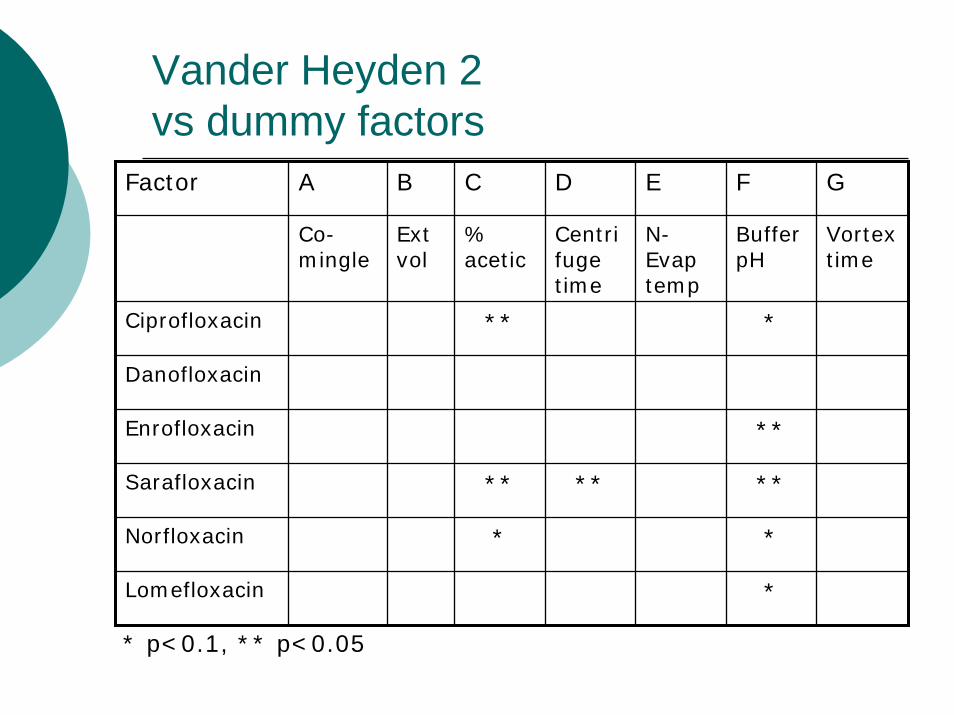
Vander Heyden 2vs dummy factors
Factor A B C D E F G
Co-mingle
Ext vol
% acetic
Centrifuge time
N-Evaptemp
Buffer pH
Vortex time
Ciprofloxacin ** *
Danofloxacin
Enrofloxacin **
Sarafloxacin ** ** **
Norfloxacin * *
Lomefloxacin *
* p<0.1, ** p<0.05
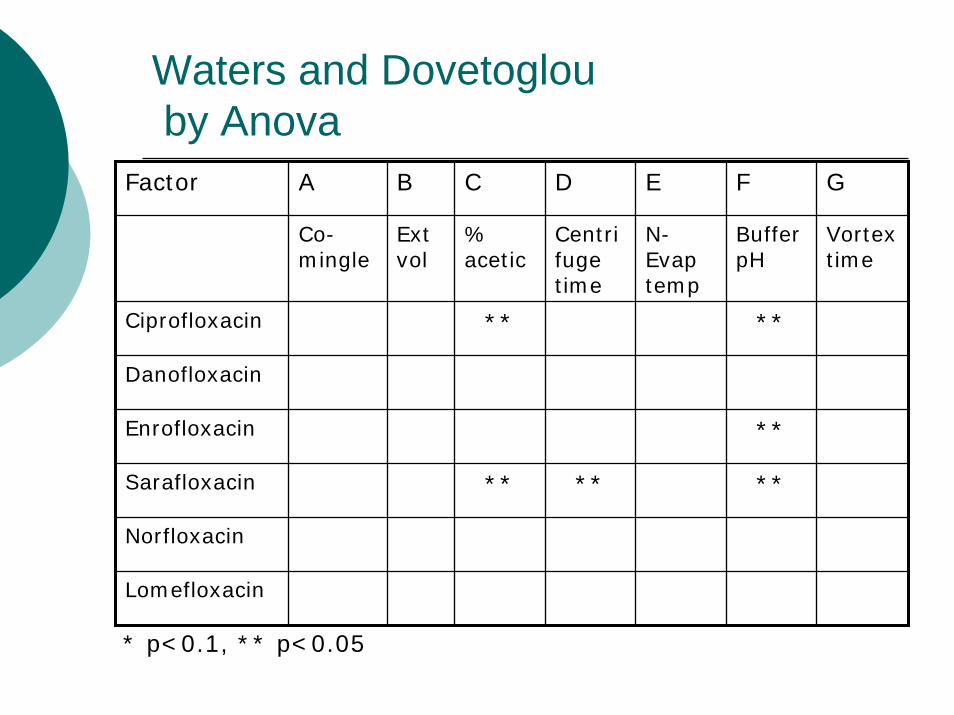
Waters and Dovetoglouby Anova
Factor A B C D E F G
Co-mingle
Ext vol
% acetic
Centrifuge time
N-Evaptemp
Buffer pH
Vortex time
Ciprofloxacin ** **
Danofloxacin
Enrofloxacin **
Sarafloxacin ** ** **
Norfloxacin
Lomefloxacin
* p<0.1, ** p<0.05
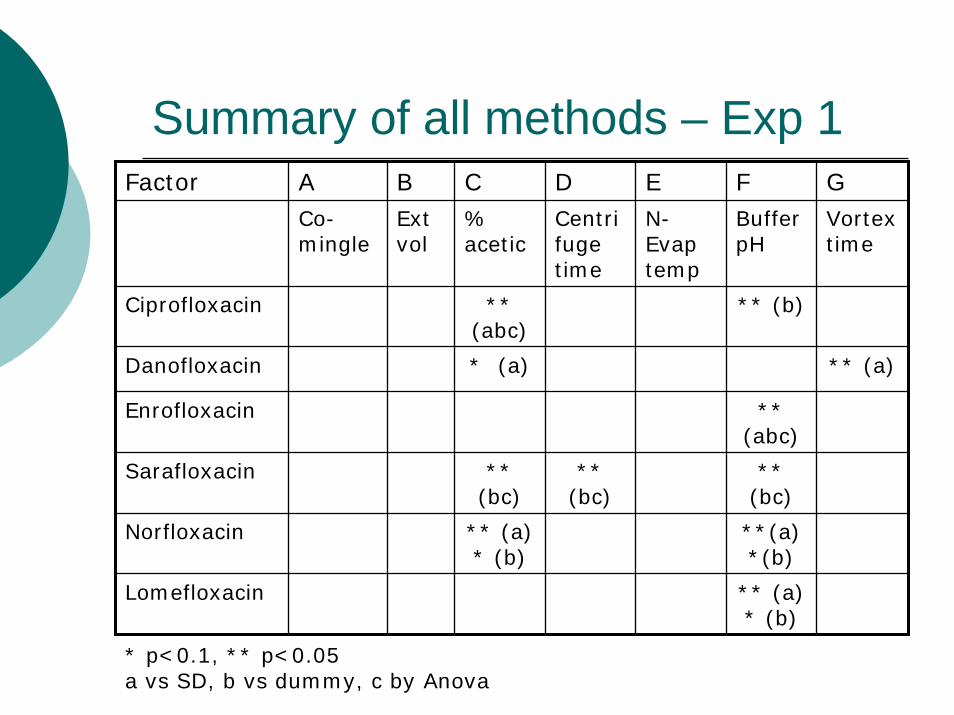
Summary of all methods – Exp 1Factor A B C D E F G
Co-mingle
Ext vol
% acetic
Centrifuge time
N-Evaptemp
Buffer pH
Vortex time
Ciprofloxacin ** (abc)
** (b)
Danofloxacin * (a) ** (a)
Enrofloxacin ** (abc)
Sarafloxacin ** (bc)
** (bc)
** (bc)
Norfloxacin ** (a) * (b)
**(a) *(b)
Lomefloxacin ** (a) * (b)
* p<0.1, ** p<0.05a vs SD, b vs dummy, c by Anova
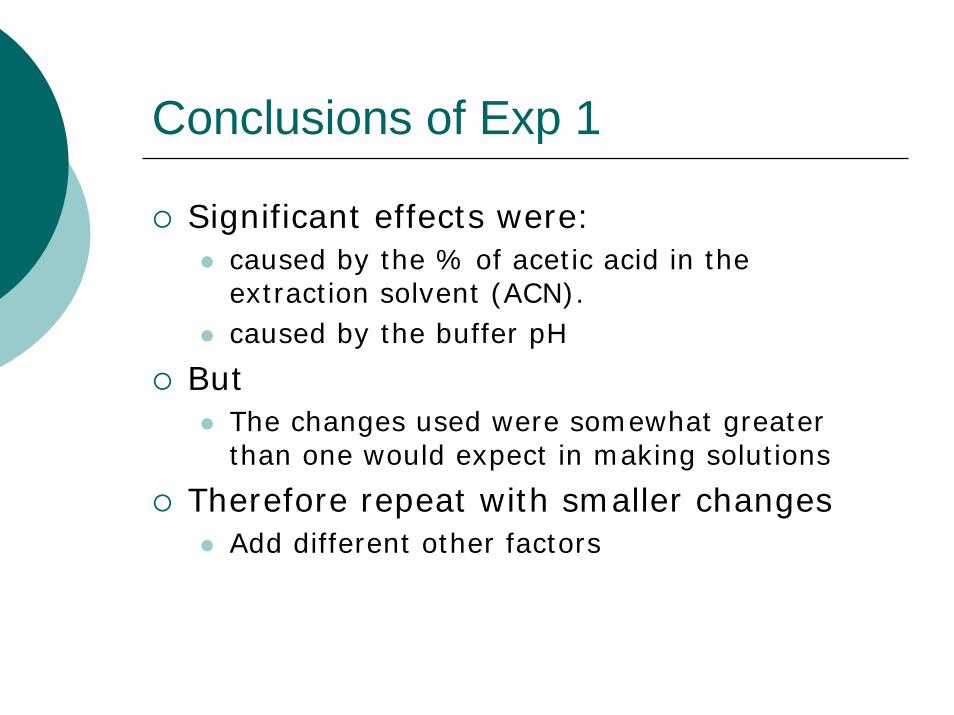
Conclusions of Exp 1
Significant effects were:caused by the % of acetic acid in the extraction solvent (ACN).caused by the buffer pH
ButThe changes used were somewhat greater than one would expect in making solutions
Therefore repeat with smaller changesAdd different other factors
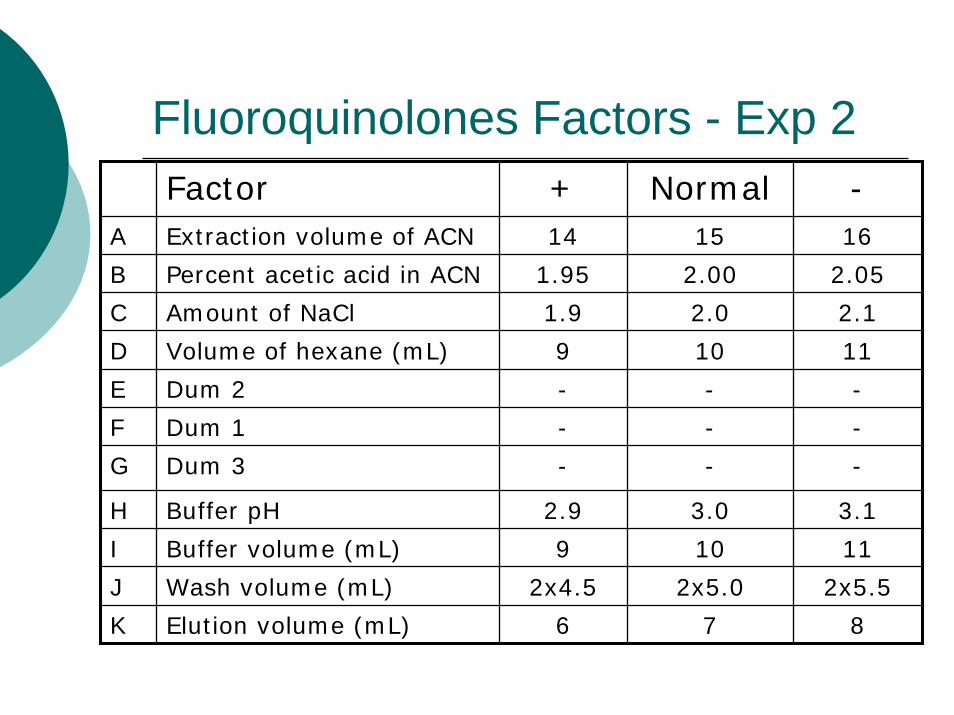
Fluoroquinolones Factors - Exp 2Factor + Normal -
A
B
C
D
E
F
G
H
I
J
K
Extraction volume of ACN 14 15 16
Percent acetic acid in ACN 1.95 2.00 2.05
Amount of NaCl 1.9 2.0 2.1
Volume of hexane (mL) 9 10 11
Dum 2 - - -
Dum 1 - - -
Dum 3 - - -
Buffer pH 2.9 3.0 3.1
Buffer volume (mL) 9 10 11
Wash volume (mL) 2x4.5 2x5.0 2x5.5
Elution volume (mL) 6 7 8
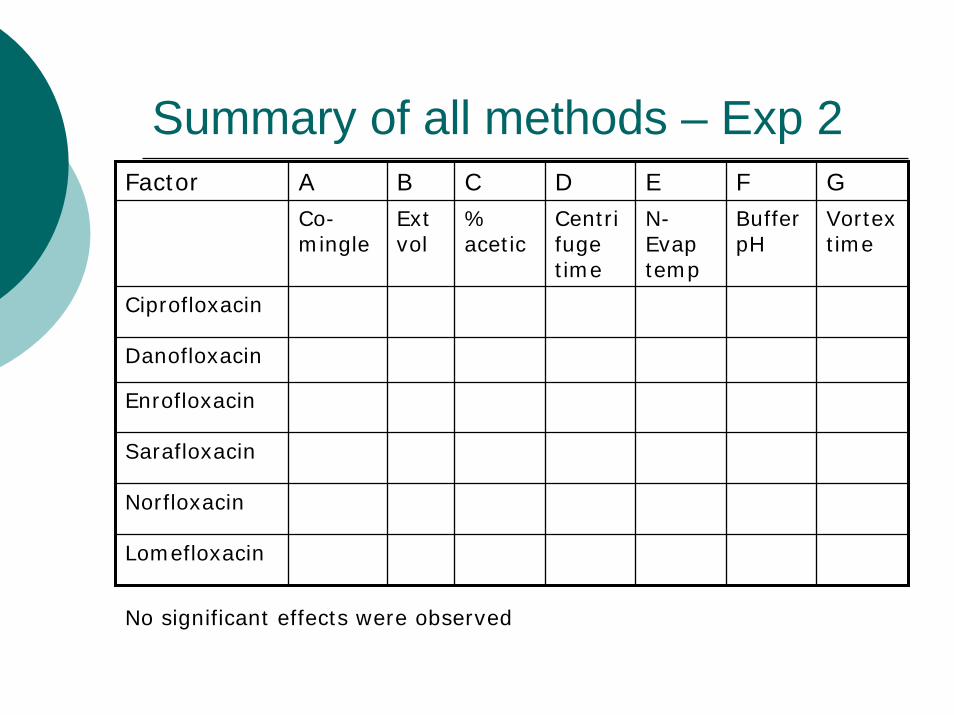
Summary of all methods – Exp 2Factor A B C D E F G
Co-mingle
Ext vol
% acetic
Centrifuge time
N-Evaptemp
Buffer pH
Vortex time
Ciprofloxacin
Danofloxacin
Enrofloxacin
Sarafloxacin
Norfloxacin
Lomefloxacin
No significant effects were observed
Conclusions
All three methods of evaluating the Plackett–Burman design detect the main effects of robustness changes.A 12 experiment P-B layout is ideal for 7 to 8 factors as can include dummy factorsA 12 experiment P-B layout is feasible to run in one dayTotal number of extractions is about 28-30

Acknowledgements
Tanya MacPherson
Dr Jian WangFred ButterworthDugane QuonLesley Rhys-WilliamsCFIA
Some references
Box, G.E.P., Hunter, W.G., & Hunter, J.S. (1978) Statistics for Experimenters. An introduction to Design, Data Analysis, and Model Building, John Wiley and Sons, NYPlackett, R.L., & Burman, J.P. (1946) Biometrika 33, 305-325Vander Heyden, Y., Nijhuis, A., Smeyers-Verbeke, J., Vandeginste, B.G., & Massart, D.L. (2001) J PharmBiomed Anal 24, 723-753Barwick, V.J., & Ellison, S.L.R. (2000) Development and Harmonization of Measurement Uncertainty Principles Part (d): Protocol for uncertainty evaluation from validation data. in VAM Technical Report No. LGC/VAM/1998/088Spence, J.P., Cotton, J.W., Underwood, B.J., & Duncan, C.P. (1990) Elementary Statistics, Prentice HallWaters, R.B., & Dovletoglou, A. (2003) Journal of Liquid Chromatography & Related Technologies 26, 2975 - 2985


![Journal of Renewable Energy and Environment Article...Plackett and Burman in 1946 . Method of BPD has been [22] extensively used to screen a large number of factors for further investigations](https://img.pdfslide.net/doc/110x75/5f0fd7187e708231d4462502/journal-of-renewable-energy-and-environment-plackett-and-burman-in-1946-method.jpg)