Embed Size (px)
Citation preview
Available online on www.ijddt.com
International Journal of Drug Delivery Technology 2016; 6(3); 79-91
ISSN: 0975 4415
Research Article
*Author for Correspondence
Optimization of Composition and Process for Preparing Metaxalone
Nanosuspension using Factorial Design
Lakshmi Prasanna Gubbala1*, Srinivas Arutla2, Vobalaboina Venkateshwarlu3
1Dr Reddys Laboratories Limited, Hyderabad. 2Apotex Research Private Limited, Bangalore.
3Neuheit pharma technologies Private Limited, Hyderabad.
Available Online:30th July, 2016
ABSTRACT
In the current study, the composition and process for preparing the nanosuspension of metaxalone (MX) has been optimized
by using design of experiments (DOE). MX is skeletal muscle relaxant and belongs to BCS class II1, the class wherein in-
vivo drug dissolution is a rate-limiting step for drug absorption2. High pressure homogenization (HPH) method was used
to prepare the nanosuspension and Hydroxy propyl methyl cellulose (HPMC) and sodium lauryl sulfate (SLS) as surface
stabilizers. For optimization studies three square (32) factorial design was used. For the composition optimization,
concentration of the stabilizers and for process optimization homogenization time and pressure are used as independent
variables. The dependent variables were particle size (PS), polydispersity index (PDI), zeta potential (ZP). The relationship
between the dependent and independent variables was studied by response surface plots and contour plots. From the data
it has been observed that 2.5 % HPMC, 0.5 % SLS were optimum concentrations and 1000 bar pressure, 120 minutes of
homogenization were optimum process conditions producing least PS, PDI and high zeta potential. The optimized nano
composition prepared by using optimum process conditions was observed to release more than 80 % within 30 minutes
and found to be stable after 3 months of storage at room temperature. The solid state characterization (XRD, DSC) data
of spray dried nanoparticles of the optimized composition has shown retention of drug crystallinity. IR has shown drug is
compatible with the excipients used. SEM photograph has shown spherical drug nanoparticles. The optimization studies
by applying the DOE resulted in considerable decrease in the experimentation work to achieve the stable nanosuspension
with desired parameters such as PS, PDI and ZP.
Keywords: Metaxalone; nanosuspension; particle size, factorial design.
INTRODUCTION
Aqueous solubility of the drug is one of the important
factors to achieve desired concentration of drug in
systemic circulation. To achieve the pharmacological
activity, the molecules should exhibit certain solubility in
physiological intestinal fluids. The aqueous solubility is a
major indicator for the solubility of the drug in the
intestinal fluids3. Poor aqueous solubility is major limiting
factor for most of the drugs. Improving the aqueous
solubility still remains as a challenging task during
development. Common techniques used to enhance the
solubility include salt formation, co-solvents, surfactants.
micronization, complexation, solid dispersions etc.4. Most
of these techniques are not universally acceptable because
of their own limitations. Nanotechnology is one of the
approaches to overcome challenges of conventional drug
delivery system based on the development and fabrication
of nanostructures. Nanosizing techniques because of their
reduction in size have been reported to enhance the
dissolution rate by increasing the surface area thereby
improving the oral drug bioavailability of poorly water
soluble drugs5,6. A pharmaceutical nanosuspension is a
biphasic system consisting of nanosized drug particles
stabilized by surface stabilizers used for oral, topical,
parenteral or pulmonary administration7. The particle size
distribution of the nanoparticles is usually less than 1
micron with an average particle size ranging between 200-
600 nm8. There are different methods to prepare the
nanosuspensions such as precipitation9, high pressure
homogenization10, wet milling11. In this study high
pressure homogenization is used to prepare the
nanosuspension, because it is most widely used12,13 due to
its advantages such as ease of scale up and little batch to
batch variation14, narrow particle size distribution in final
product15. Metaxalone is a muscle relaxant used to relax
muscles and relieve pain caused by strains, sprains, and
other musculoskeletal conditions. Its exact mechanism of
action is not known, but it may be due to central nervous
system depression. Because of it low solubility and high
permeability it belongs to BCS class II drug16.
Experimental designs such as the factorial designs (FDs)
since 192617 the screening designs since 194618, the central
composite designs (CCDs) since 195119 and mixture
designs (SMDs) since 195820 have long been employed to
optimize various industrial products. The first literature
report on the rational use of optimization appeared in 1967,

Lakshmi et al. / Optimization of Composition…
IJDDT, July 2016 – September 2016, Volume 6, Issue 3 Page 80
Table 2: Process Variables (32 factorial design).
Batch
No.
Homogenization
Pressure (Bar)
Homogenization
time (minutes)
CV RV CV RV
MX-2A -1 750 -1 90
MX-2B -1 750 0 120
MX-2C -1 750 +1 150
MX-2D 0 1000 -1 90
MX-2E 0 1000 0 120
MX-2F 0 1000 +1 150
MX-2G +1 1200 -1 90
MX-2H +1 1200 0 120
MX-2I +1 1200 +1 150
when a tablet of sodium salicylate was optimized using an
FD21. Since then, these systematic approaches have been
put into practice in the development of drug formulations
at steady pace. Central composite design [CCD] is one of
the tools used to investigate the effect of two independent
factors. Quality by design refers to the achievement of
certain predictable quality with desired and predetermined
specifications. Since while preparing the nanosuspensions
there are different interacting variables and operating
conditions it is important to understand these variables and
their interactions. To enable this understanding various
statistical experimental designs have been recognized as
useful techniques22. Optimization through factorial design
and response surface methodology is common practice23,24.
Response surface plots and contour plots describe the
influence of the independent variables on the selected
responses25,26. Factorial design is very useful tool for the
identification of critical parameters and to optimize the
respective composition and process conditions27. The
objective of the present study was to apply 32 factorial
designs to optimize metaxalone nanosuspension and
process of preparing the nanosuspension. A 32 factorial
design was applied to investigate the effect to two
composition variables (independent) such as concentration
of HPMC and SLS. Similarly, for process optimization two
process conditions such as homogenization time and
homogenization pressure were used as two independent
variables. For both composition and process optimization
study, particle size (nm), polydispersity index and zeta
potential were taken as responses (dependent variables).
Response surface plots and contour plots were drawn and
optimization formulation was selected using the
desirability function.
MATERIALS AND METHODS
Metaxalone, Hydroxy propyl methyl cellulose (HPMC;
supplied by Colorcon), sodium lauryl sulfate (SLS,
supplied by JRS), Mannitol from Rouquette Pharma; all
other chemicals and solvents were obtained from Dr
Reddys laboratories limited. All chemicals and solvents
used are of analytical grade. High pressure homogenizer
used is FR-756 Model, Panda 2000 Plus.
Compatibility study
Compatibility of the MX with HPMC. SLS, mannitol used
to formulate nanosuspension was established by Fourier
Transformed Infrared spectral analysis. FT-IR spectral
analysis of MX and its physical mixture with HPMC, SLS
and mannitol was carried out to investigate any change in
chemical composition of the drug after combining it with
the excipients
Preparation of drug suspension
The drug suspension was prepared by dissolving weighed
quantity of HPMC in 100 ml of purified water. To this,
weighed quantity of SLS was added with continuously
stirring until clear solution was obtained and avoid foam
formation. To this weighed quantity of drug MX was
added slowly with continuous stirring. Then finally made
up the volume with purified water and stirred for about 15
minutes. Then the drug suspension was subjected to high
shear homogenization at 3000 rpm for about 30 minutes to
form a uniform dispersion and prevent any lump
formation. This drug suspension was further processed by
high pressure homogenization process and used for the
optimization of the composition as well as the process.
Formulation Optimization
Central composite design was used to optimize and
evaluate the main effects of the composition and process
parameters on the drug nanoparticles. Further these
nanoparticles aggregate and reduce the surface area for
wetting and dissolution. Hence stabilizing the
nanoparticles by surface stabilizers is required. The
amount of the surface stabilizers such as HPMC and SLS
was optimized using 2 factor 3 level (32) factorial designs.
Based on the earlier trial experiments, nine nano
compositions were prepared using 3 different
concentrations of HPMC and SLS (Table 1). In this study,
Table 1: Composition Variables (32 factorial design).
Batch No. Drug Concentration of HPMC Concentration of SLS
% CV RV (%) CV RV (%)
MX-1A 10 -1 1.25 -1 0.25
MX-1B 10 -1 1.25 0 0.5
MX-1C 10 -1 1.25 +1 0.75
MX-1D 10 0 2.5 -1 0.25
MX-1E 10 0 2.5 0 0.5
MX-1F 10 0 2.5 +1 0.75
MX-1G 10 +1 5 -1 0.25
MX-1H 10 +1 5 0 0.5
MX-1I 10 +1 5 +1 0.275
CV: Coded value; RV: Real value %: Percentage
HPMC: Hydroxy propyl methyl cellulose SLS: Sodium lauryl sulphate

Lakshmi et al. / Optimization of Composition…
IJDDT, July 2016 – September 2016, Volume 6, Issue 3 Page 81
the quantity of the drug (10%) and the process conditions
were kept constant. Batch size is 150 ml. The prepared
drug suspension was subjected to high pressure
homogenization at 1000 bar pressure for 90 minutes.
Process Optimization
In the process optimization study, nine compositions were
prepared wherein the concentrations were kept constant
and process conditions varied in all the nine batches. Drug
suspension of 1liter batch size was prepared by using 10%
drug, 0.5% SLS and 2.5 % of HPMC. Homogenization
pressure and homogenization time were chosen as process
variables. Three levels of homogenization pressure namely
800 bar, 1000bar and 1200 bar and three levels of
homogenization time is 90 minutes, 120 minutes and 150
minutes (Table 2) were chosen based on trial experiments
carried out.
Particle size [PS] and Polydispersity index [PDI]
The particle size and particle size distribution (PSD)
affects saturation solubility of nanoparticles. The most
widely used method of describing particle size
distributions are D values. The D10, D50 and D90 are
commonly used to represent the midpoint and range of the
particle sizes of a given sample. A D-value can be thought
of as a “mass division diameter”. It is the diameter which,
when all particles in a sample are arranged in order of
ascending mass, divides the sample's mass into specified
percentages. The percentage mass below the diameter of
interest is the number expressed after the "D". For example
the D10 diameter is the diameter at which 10% of a
sample's mass is comprised of smaller particles, and the
D50 is the diameter at which 50% of a sample's mass is
comprised of smaller particles28. The Z average is the
intensity weighted mean hydrodynamic size of the
ensemble collection of particles measured by dynamic
light scattering (DLS). The polydispersity index (PDI) is a
measure of the distribution of molecular mass in a given
polymer sample. PDI gives the physical stability of
nanosuspensions and should be as lower as possible for the
Figure 1: FTIR spectrum of metaxalone.
Figure 2: FTIR spectrum of physical mixture of MX, HPMC, SLS, and Mannitol.
Table 3: Experimental results of composition optimization.
Z-average Particle size distribution (Intensity) PDI ZP
D10 D50 D90
MX-1A 399.8 148 205 258 0.6 23.2
MX-1B 324 76.4 179 392 1 29
MX-1C 335 143 195 247 0.7 30.1
MX-1D 114.7 10 156 194 0.25 32
MX-1E 119.5 5.7 84 100 0.1 36
MX-1F 127 7 115 136 0.3 30
MX-1G 251 169 223 267 0.6 23
MX-1H 415.4 82.1 412 717 0.488 22.5
MX-1I 211 12 185 261 0.4 15

Lakshmi et al. / Optimization of Composition…
IJDDT, July 2016 – September 2016, Volume 6, Issue 3 Page 82
long-time stability of nanosuspensions. A PDI value of 0.1
to 0.25 shows a fairly narrow size distribution and PDI
value more than 0.5 indicates a very broad distribution29.
The PSD of suspension has been determined for both
formulation optimization and process optimization using
Malvern Zeta Sizer Nano series nano-ZS. The particle
diameter reported was calculated size distribution by
intensity. A refractive index of 1.65 has been used for
measurements. The PS and PDI has been determined for 9
different batches with different concentration of HPMC or
SLS (formulation optimization trials). Similarly, the PS
and PDI has been determined for 9 different batches
(process optimization trials) homogenized at different
pressure (800, 1000, 1200 bar) and different time intervals
(90, 120, 150 minutes). The nanosuspension obtained was
diluted with water to obtain suitable concentrations for
measurement. Diluted nanosuspension was added to the
(3a) (3b)
(3c) (3d)
Figure 3: Response surface methodology plot showing effect of HPMC and SLS on particle size 3a) Z-average; 3b)
D103c) D50 3d) D90.
Figure 4: Response surface methodology plot and its contour
plot showing effect of HPMC and SLS on PDI.
Figure 5: Response surface 3D plot showing effect of
HPMC and SLS on ZP.
Lakshmi et al. / Optimization of Composition…
IJDDT, July 2016 – September 2016, Volume 6, Issue 3 Page 83
sample cell (quartz cuvette) and put into sample holder unit
and measurement was carried out with help of software.
Zeta potential
Zeta potential is a measure of the magnitude of the
electrostatic or charge repulsion/attraction between
particles, and is one of the fundamental parameters known
to affect stability. Its measurement brings detailed insight
into the causes of dispersion, aggregation or flocculation,
and can be applied to improve the formulation of
dispersions, emulsions and suspensions. A prerequisite to
achieve an enhancement of oral bioavailability with drug
nanoparticles is that nanoparticles are finely dispersed in
the gut and do not aggregate. In case they start aggregation,
the bioavailability decreases with increasing aggregate
formation. This is attributed to the fact that they lose
special properties of nanoparticles such as their adhesive
property to the mucosal wall. Therefore, it is necessary to
prepare nanosuspensions with a physical stability as high
as possible. Surface charge properties of the
nanosuspensions are studied through zeta potential. The
value of particle surface charge indicates the stability of
nanosuspensions at the macroscopic level. A minimum
zeta potential of ±30 mV is required for electrostatically
stabilized nanosuspensions30,31 and a minimum of ±20 mV
for steric stabilization32. The zeta potential values are
commonly calculated by determining the particle's
electrophoretic mobility and then converting the
electrophoretic mobility to the zeta potential33. Zeta
potential of the nano suspension prepared during
formulation optimization and process optimization has
been analyzed in Malvern zeta sizer after diluting
nanosuspension with water to obtain suitable
concentration for measurement. Sample was added in
specialized zeta cell and the zeta potential measurement
was carried out with the help of software.
In-vitro drug release
Drug release of MX from the optimized MX composition
was performed in USP dissolution testing apparatus (type
II) with rotating paddles at 50rpm using 900ml of 0.5%
SLS in water as dissolution medium. The temperature was
maintained at 37 ± 0.5 °C throughout the experiment.
Samples were estimated by HPLC [Waters Alliance HPLC
system, USA) method. Diluent is prepared by mixing
buffer: acetonitrile in 65:35 ratio with sonication followed
by centrifugation at 4000 rpm for about 10 minutes. Buffer
is prepared by dissolving potassium dihydrogen phosphate
in water followed by adding triethyl amine and adjusts pH
to 2.5±0.05 by phosphoric acid. The solution was filtered
through 0.45 µm Durapore PVDF membrane filter and was
analyzed by HPLC. The mobile phase is same as diluent.
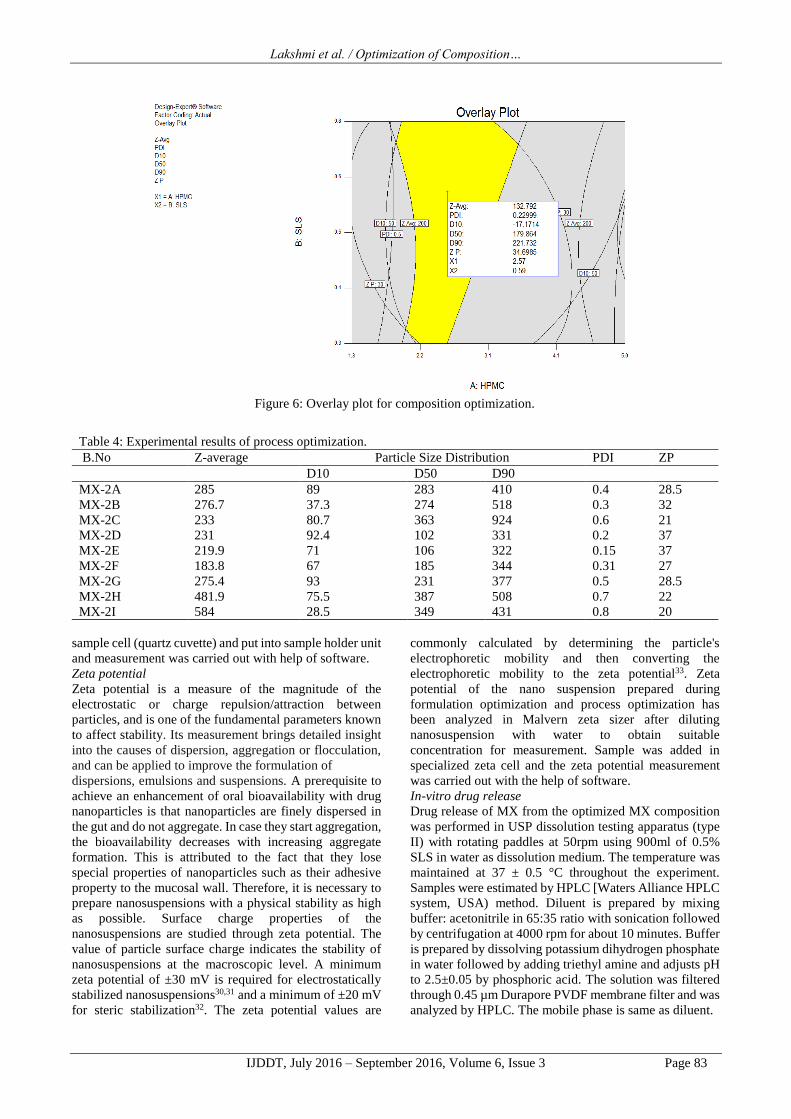
Figure 6: Overlay plot for composition optimization.
Table 4: Experimental results of process optimization.
B.No Z-average Particle Size Distribution PDI ZP
D10 D50 D90
MX-2A 285 89 283 410 0.4 28.5
MX-2B 276.7 37.3 274 518 0.3 32
MX-2C 233 80.7 363 924 0.6 21
MX-2D 231 92.4 102 331 0.2 37
MX-2E 219.9 71 106 322 0.15 37
MX-2F 183.8 67 185 344 0.31 27
MX-2G 275.4 93 231 377 0.5 28.5
MX-2H 481.9 75.5 387 508 0.7 22
MX-2I 584 28.5 349 431 0.8 20

Lakshmi et al. / Optimization of Composition…
IJDDT, July 2016 – September 2016, Volume 6, Issue 3 Page 84
Chromatographic separation was accomplished using
an150x4.6 mm, X terra RP-8, C-8, 5 µmcolumn. The
mobile phase was pumped at a flow rate of 1.0 ml/minute
during analysis and maintained at a column temperature of
25 °C and detection wavelength of 230 nm.
Spray drying
The optimized nanosuspension prepared was converted
into dry powder using the spray drying in Buchi mini spray
dryer using mannitol as redispersant, at inlet temperature
of 140 °C, nitrogen pressure 5 kg/cm2and liquid
suspension feed rate 6-10 ml/minute. The spray dried
nanoparticles is further characterized by XRD, DSC, IR
and SEM.
(7a) (7b)
(7c) (7d)
Figure 7: Response surface methodology plots showing effect of independent variables homogenization time and
pressure on the dependent variables: Z average (7a); D10 (7b); D50(7c); D90(7d).
Figure 8: Response surface 3D plots showing effect of
independent variables homogenization time and pressure
on the dependent variable PDI.
Figure 9: Response surface 3D plots showing effect of
independent variables homogenization time and pressure
on the dependent variable zeta potential.

Lakshmi et al. / Optimization of Composition…
IJDDT, July 2016 – September 2016, Volume 6, Issue 3 Page 85
Table 5: Optimized composition and process conditions.
Ingredients Optimized
parameters
Formulation Metaxalone 10 % w/w
Hydroxy Propyl
methyl cellulose
2.5 % w/w
Sodium lauryl sulfate 0.5 %w/w
Process Homogenization
pressure
1000 bar
Homogenization time 120 minutes.
Solid state characterization
Powder X-day diffraction: [PXRD]
Polymorphic or morphological changes of nanosized
particles can be checked by assessing the crystalline state
and particle morphology34.As nanosuspension formation
experiences high pressure during homogenization, change
in crystalline structure of formulation occurs, which may
be converted to either amorphous or other polymorphic
forms35,36. Alteration in the solid state of the drug particles
if any and the extent of the amorphous portion is
determined by X-ray diffraction analysis37 and
supplemented by differential scanning calorimetry
analysis. The X-ray diffractograms of MX, its physical
mixture and the spray dried nanoparticles were recorded
using a Panalytical Xpert Pro Diffractometer
(PANalytical, The Netherlands) with a Cu line as the
source of radiation. Standard runs using a 40 kV voltage, a
40mA current and a scanning rate of 0.02°min−1 over a 2θ
range of 3 – 45° were used.
Differential scanning calorimetry38 [DSC]
Thermal characteristics of the MX, physical mixture of
MX, HPMC, SLS, mannitol and spray dried nanoparticles
was studied. Thermal properties of powder samples were
investigated using a Perkin-Elmer DSC-7 differential
scanning calorimeter / TAC-7 thermal analysis controller
with an intracooler-2 cooling system (Perkin- Elmer
Instruments, USA). For evaluation about 3 to 5 mg of MX
or physical mixture/spray dried nanoparticles was placed
in perforated aluminum sealed 50 μL pans and the heat
runs for each sample was set from 20 to 200°C at
10°C/minute, an inert environment was maintained using
nitrogen.
Fourier transform Infra –Red Spectroscopy [FTIR]
The infrared spectra are recorded on Fourier Transform
Spectrometer in the mid–infrared region (MIR) within the
range (400-4000 cm-1). Due to the complex interaction of
atoms within the molecule, IR absorption of the functional
groups may vary over a wide range. However, it has been
found that many functional groups give characteristic IR
absorption at specific narrow frequency range. Multiple
functional groups may absorb at one particular frequency
range but a functional group often gives rise to several
characteristic absorptions. Stretching an bending
vibrations are varied after formulation can be observed.
Thus, the spectral interpretations should not be confined to
one or two bands only actually the whole spectrum should
be examined39,40. FT- IR spectra of MX [Figure 1],
physical mixture of MX with excipients used HPMC, SLS,
mannitol [Figure 2] and spray dried nanoparticles [Figure
14] were recorded on the sample prepared in KBr disks,
wherein sample and KBr are taken in 1:100 ratio) using
Shimadzu Fourier Transform Infra-Red spectrometer. The
samples were scanned over a frequency range 4000-400
cm-1.
Scanning electron Microscopy
Scanning electron microscopy is a type of electron
microscopy that images the surface of solid specimen by
using focused beam of high-energy electrons. Scanning
electron microscopy (SEM) is giving morphological
examination with direct visualization. The techniques
based on electron microscopy offer several advantages in
morphological and sizing analysis. For SEM
characterization dry powder is mounted on a sample holder
followed by coating with a conductive metal. The sample
is then scanned with a focused fine beam of electrons41.
The electrons which are scattered and/or generated through
secondary processes, are collected through secondary
electron or back-scattered electron detectors. The
backscattered electron images are sensitive to the atomic
weight of the elements present. The regions of the image
which appear brighter indicate the presence of high atomic
weight elements. The surface characteristics of the sample
Figure 10: Overlay plot for the process optimization.

Lakshmi et al. / Optimization of Composition…
IJDDT, July 2016 – September 2016, Volume 6, Issue 3 Page 86
are obtained from the secondary electrons emitted from the
sample surface. The nanoparticles must be able to
withstand vacuum sometimes the electron beam may
damage the polymer42. MX, physical mixture or spray
dried nanoparticles was placed on the Carbon tape stuck to
the Aluminum SEM stub. Later it was imaged in the SEM
at a low vacuum.
RESULTS AND DISCUSSION
Drug-excipients compatibility studies
To study the compatibility of drug with excipients, IR
spectra analysis of pure drug MX and physical mixture of
drug MX with all the excipients such as SLS, HPMC,
mannitol was studied. IR spectra of MX were shown in
Figure 1; Figure 2 shows IR spectra of physical mixture
and Figure 14 shows IR spectra of the spray dried
nanoparticles. From figure 1 and 2 it has been shown that
there is slight broadening of the peaks and no significant
physical and/or chemical interaction in between drug and
studied excipients. The frequencies of functional groups of
drug quetiapine remained intact in physical mixture. So it
was concluded that there was no major interaction
occurred and are compatible.
Composition optimization.
The aim of the formulation optimization is generally to
find the levels of the variable that affect the chosen
responses and determine the levels of the variable from
which a robust product with high quality characteristics
may be produced. All the measured responses that may
affect the quality of the product were taken into
consideration during the optimization procedure.
Evaluation of MX-1A to MX-1I was done by determining
Z-average, Particle size distribution (PSD), poly dispersity
index and zeta potential for all the compositions as shown
in table 3. Further various response surface methodology
(RSM) plots and 2D contour plots for the composition
optimization study were performed employing Design-
Expert software (Version 9.0.1.0, Stat-Ease Inc.,
Minneapolis, MN). The significance of these parameters
on the variables was assessed by analysis of variance
(ANOVA, 2-way).
Particle size
Mean particle size (MPS) of the formulation for different
batches was found between 84 nm to 412 nm. Figure 3
represents the response surface methodology (RSM) plot
and contour plots for particle size distribution data
including Z-average, D10, D50, D90. From Figure 3a, it has
been observed that with increase in the concentration of
SLS, Z-average almost remained constant and with
increase in concentration of HPMC the particle size
decreased upto midway concentration and then gradually
increased with increase in the concentration. At low or
high concentration of HPMC the effect of SLS
concentration on particle size remained constant.
Similarly, at low or high concentration of SLS the effect of
HPMC on particle size is same, which initially decreases
and then increases with high variability at high
concentration of HPMC when compared to low
concentration. Similar to Z-average with increase in
concentration of HPMC; particle size ie D10 [Figure 3b]
decreased up to mid-point concentration and then
gradually increases with further increase in the
concentration of HPMC with high variability at high
concentration of HPMC. At high concentration of HPMC
with the increase in concentration of SLS the particle size
is reduced with high variability at low concentration of
SLS. Similarly, at low concentration of HPMC the increase
in concentration of SLS, particle size remained constant up
to midway concentration and then increase with high
variability at high concentration of SLS. With respect to
Table 6: Data generated for Optimized batch.
Z-average Particle Size Distribution PDI ZP
D10 D50 D90
Initial 121 53 108 274 0.18 37
1 month 144 61 101 293 0.2 36
2 month 137 43 116 281 0.2 37
3 month 130 38 103 296 0.2 35
Figure 11: In-vitro release profile of Optimized batch at initial and stability conditions.
Lakshmi et al. / Optimization of Composition…
IJDDT, July 2016 – September 2016, Volume 6, Issue 3 Page 87
D50 [figure 3c], it has been observed that with increase in
concentration of HPMC /SLS the particle size is increased.
The increase in particle size is less for SLS than that
observed with concentration of HPMC. At high
concentration of HPMC it is almost constant irrespective
of concentration of SLS. And for D90 [Figure 3d], the
RSM plot shows that effect of SLS at low and high
concentration of HPMC remains same, wherein with
increase in concentration of SLS, the particle size slightly
increases up to midway and then decreases. Irrespective of
SLS concentration, increase in concentration of HPMC the
particle size gradually decreases and then drastically
increase with high variability at high concentration of
HPMC.
Polydispersity index
The combined effect of SLS and HPMC on the PDI was
studied using the response surface methodology. Figure 4
shows the RSM plot of the PDI and its contour plot as
measure for the particle size distribution in response to the
investigated factors. PDI shows more dependence on
concentration of HPMC. With the increase in the
concentration of HPMC, PDI decreases upto midway
concentration and then increases. At lower concentration
of HPMC, with increase in concentration of SLS, the PDI
also increases, however at high concentration of HPMC
the PDI slightly decreases with increase in concentration
of SLS. At mid-point concentration of HPMC, PDI almost
remained constant with increase in the concentration of
SLS.
Zeta potential
From the Figure 5 it has been observed that with increase
in the concentration of HPMC, ZP increased up to certain
point and then gradually decreased. And with increase in
the concentration of SLS, ZP also increased at low
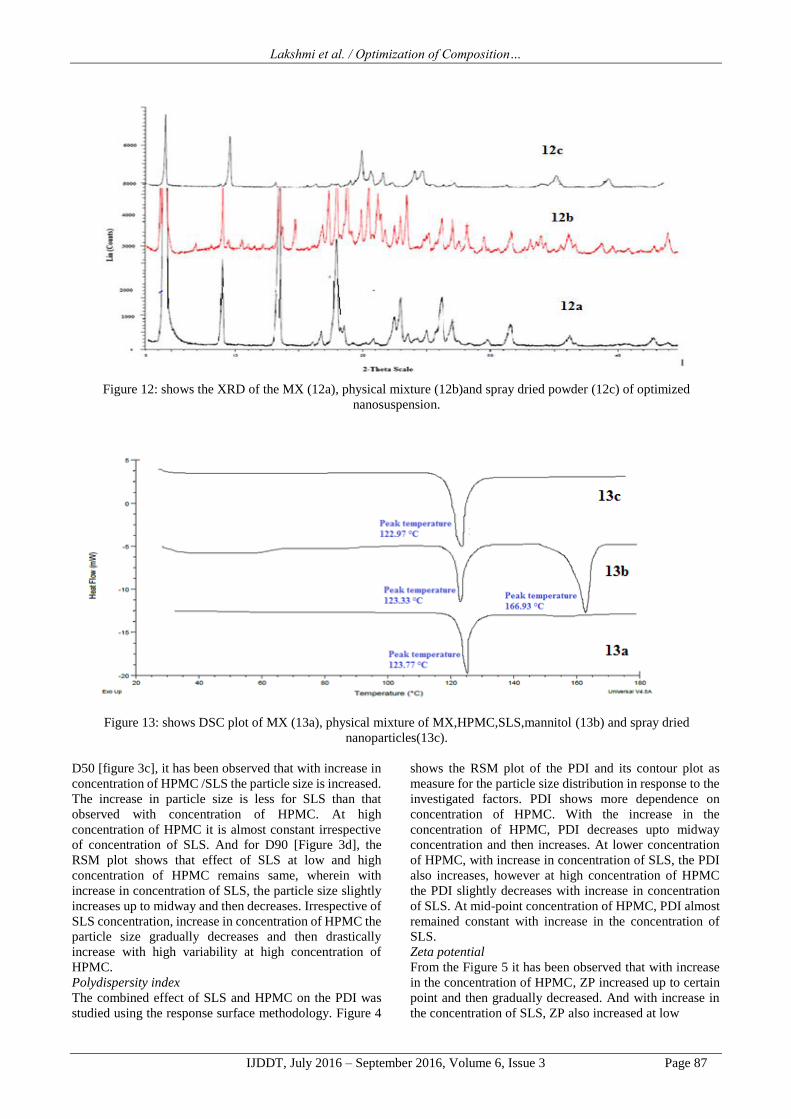
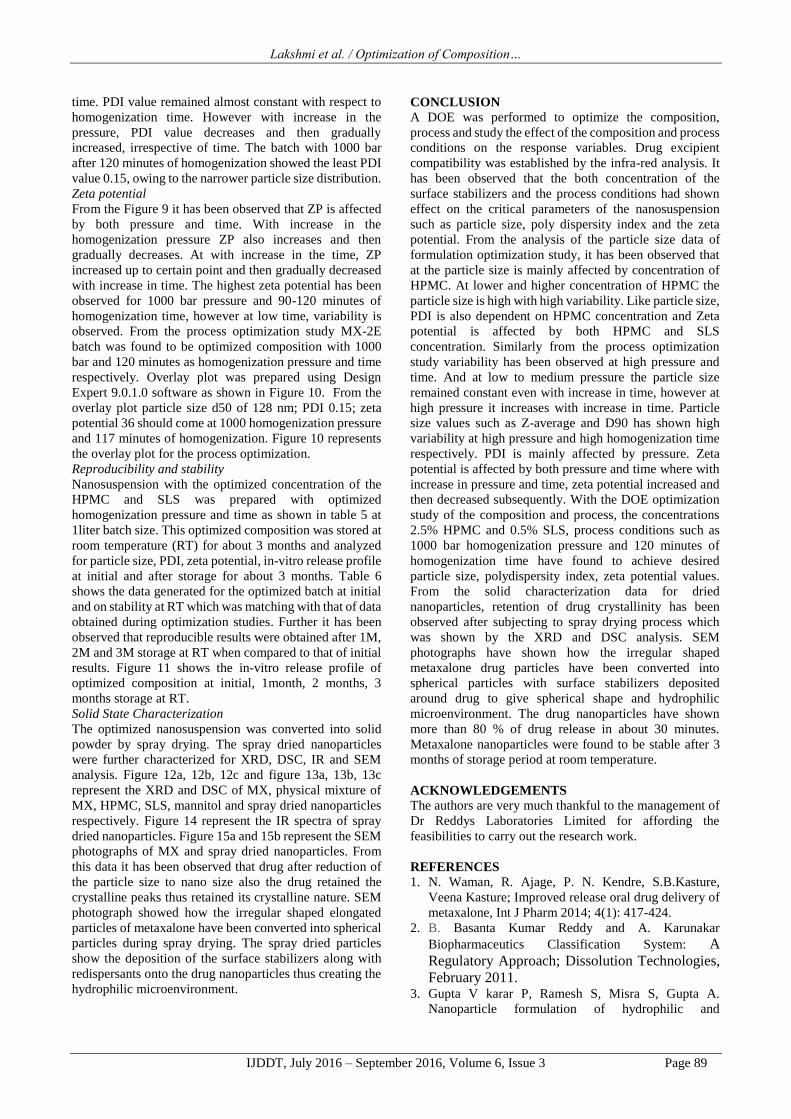
Figure 12: shows the XRD of the MX (12a), physical mixture (12b)and spray dried powder (12c) of optimized
nanosuspension.
Figure 13: shows DSC plot of MX (13a), physical mixture of MX,HPMC,SLS,mannitol (13b) and spray dried
nanoparticles(13c).

Lakshmi et al. / Optimization of Composition…
IJDDT, July 2016 – September 2016, Volume 6, Issue 3 Page 88
concentration of HPMC and from mid-point concentration
to high concentration of HPMC, ZP almost remained
constant with increase in the concentration of the SLS.
From the formulation optimization study MX-1E batch
was found to be optimized composition having 2.5% of
HPMC concentration and 0.5 % SLS concentration.
Overlay plot was prepared using Design Expert 9.0.1
software. From the overlay plot particle size Z-average of
132 nm PDI of 0.2 zeta potential of 34 should come at the
2.57% HPMC concentration and 0.59 % SLS
concentration. Figure 6 represents the overlay plot for the
optimization of the composition.
Process optimization study
Nine compositions MX-2A to MX-2I were prepared and
studied for process optimization. In all the batches the
concentration of drug (10%), HPMC (2.5 %) and SLS
concentration (0.5 %) was kept constant. The data
generated for PS, PDI and ZP was captured in table 4. To
further analyze the effect of the variables on the responses,
RSM plots and its contour plots were generated. The
relationship between the dependable variables and the two
independent variables was further elucidated by
constructing these plots.
Particle size
The effect of the homogenization time and pressure on the
particle size has been studied and the RSM plots along with
their contour plots have been captured in figure 7a to 7d.
From response surface plot of Z-average [Figure 7a] it has
been observed that at low pressure the particle size almost
remained constant with increase in homogenization time,
however at high pressure Z-average increase with increase
in time. Irrespective of time, Z-average initially decreased
and then increase with high variability at high
homogenization time and high homogenization pressure.
With respect to D10 [figure 7b] at low pressure and time
minimum particle size observed with high variability. With
increase in pressure and time, the particle size also
increased. However, at low and high pressure/time there
was high variability observed. From Figure 7c, it has been
observed that irrespective of time, with increase in the
pressure particle size (D50) initially reduced and then
increased. At low pressure and high time, the variability in
particle size in observed. At high pressure, particle size
increase with increase in the time. For d90 [figure 7d] with
increase in the pressure the particle size initially decreased
and then increases. At low pressure with increase in time,
particle size increases with high variability at high time. At
high pressure particle size almost remained constant with
respect to time. At high time, the particle size reduces
drastically up to mid –point of pressure and then slightly
increases.
Polydispersity index [PDI]
From the Figure 8 it has been observed that the PDI is
affected by homogenization pressure than homogenization
Figure 14: FTIR spray dried nanoparticles.
(15a) (15b)
Figure 15: SEM photograph of the MX (15a); spray dried powder of the optimized composition (15 b).
Lakshmi et al. / Optimization of Composition…
IJDDT, July 2016 – September 2016, Volume 6, Issue 3 Page 89
time. PDI value remained almost constant with respect to
homogenization time. However with increase in the
pressure, PDI value decreases and then gradually
increased, irrespective of time. The batch with 1000 bar
after 120 minutes of homogenization showed the least PDI
value 0.15, owing to the narrower particle size distribution.
Zeta potential
From the Figure 9 it has been observed that ZP is affected
by both pressure and time. With increase in the
homogenization pressure ZP also increases and then
gradually decreases. At with increase in the time, ZP
increased up to certain point and then gradually decreased
with increase in time. The highest zeta potential has been
observed for 1000 bar pressure and 90-120 minutes of
homogenization time, however at low time, variability is
observed. From the process optimization study MX-2E
batch was found to be optimized composition with 1000
bar and 120 minutes as homogenization pressure and time
respectively. Overlay plot was prepared using Design
Expert 9.0.1.0 software as shown in Figure 10. From the
overlay plot particle size d50 of 128 nm; PDI 0.15; zeta
potential 36 should come at 1000 homogenization pressure
and 117 minutes of homogenization. Figure 10 represents
the overlay plot for the process optimization.
Reproducibility and stability
Nanosuspension with the optimized concentration of the
HPMC and SLS was prepared with optimized
homogenization pressure and time as shown in table 5 at
1liter batch size. This optimized composition was stored at
room temperature (RT) for about 3 months and analyzed
for particle size, PDI, zeta potential, in-vitro release profile
at initial and after storage for about 3 months. Table 6
shows the data generated for the optimized batch at initial
and on stability at RT which was matching with that of data
obtained during optimization studies. Further it has been
observed that reproducible results were obtained after 1M,
2M and 3M storage at RT when compared to that of initial
results. Figure 11 shows the in-vitro release profile of
optimized composition at initial, 1month, 2 months, 3
months storage at RT.
Solid State Characterization
The optimized nanosuspension was converted into solid
powder by spray drying. The spray dried nanoparticles
were further characterized for XRD, DSC, IR and SEM
analysis. Figure 12a, 12b, 12c and figure 13a, 13b, 13c
represent the XRD and DSC of MX, physical mixture of
MX, HPMC, SLS, mannitol and spray dried nanoparticles
respectively. Figure 14 represent the IR spectra of spray
dried nanoparticles. Figure 15a and 15b represent the SEM
photographs of MX and spray dried nanoparticles. From
this data it has been observed that drug after reduction of
the particle size to nano size also the drug retained the
crystalline peaks thus retained its crystalline nature. SEM
photograph showed how the irregular shaped elongated
particles of metaxalone have been converted into spherical
particles during spray drying. The spray dried particles
show the deposition of the surface stabilizers along with
redispersants onto the drug nanoparticles thus creating the
hydrophilic microenvironment.
CONCLUSION
A DOE was performed to optimize the composition,
process and study the effect of the composition and process
conditions on the response variables. Drug excipient
compatibility was established by the infra-red analysis. It
has been observed that the both concentration of the
surface stabilizers and the process conditions had shown
effect on the critical parameters of the nanosuspension
such as particle size, poly dispersity index and the zeta
potential. From the analysis of the particle size data of
formulation optimization study, it has been observed that
at the particle size is mainly affected by concentration of
HPMC. At lower and higher concentration of HPMC the
particle size is high with high variability. Like particle size,
PDI is also dependent on HPMC concentration and Zeta
potential is affected by both HPMC and SLS
concentration. Similarly from the process optimization
study variability has been observed at high pressure and
time. And at low to medium pressure the particle size
remained constant even with increase in time, however at
high pressure it increases with increase in time. Particle
size values such as Z-average and D90 has shown high
variability at high pressure and high homogenization time
respectively. PDI is mainly affected by pressure. Zeta
potential is affected by both pressure and time where with
increase in pressure and time, zeta potential increased and
then decreased subsequently. With the DOE optimization
study of the composition and process, the concentrations
2.5% HPMC and 0.5% SLS, process conditions such as
1000 bar homogenization pressure and 120 minutes of
homogenization time have found to achieve desired
particle size, polydispersity index, zeta potential values.
From the solid characterization data for dried
nanoparticles, retention of drug crystallinity has been
observed after subjecting to spray drying process which
was shown by the XRD and DSC analysis. SEM
photographs have shown how the irregular shaped
metaxalone drug particles have been converted into
spherical particles with surface stabilizers deposited
around drug to give spherical shape and hydrophilic
microenvironment. The drug nanoparticles have shown
more than 80 % of drug release in about 30 minutes.
Metaxalone nanoparticles were found to be stable after 3
months of storage period at room temperature.
ACKNOWLEDGEMENTS The authors are very much thankful to the management of
Dr Reddys Laboratories Limited for affording the
feasibilities to carry out the research work.
REFERENCES
1. N. Waman, R. Ajage, P. N. Kendre, S.B.Kasture,
Veena Kasture; Improved release oral drug delivery of
metaxalone, Int J Pharm 2014; 4(1): 417-424.
2. B. Basanta Kumar Reddy and A. Karunakar
Biopharmaceutics Classification System: A
Regulatory Approach; Dissolution Technologies,
February 2011. 3. Gupta V karar P, Ramesh S, Misra S, Gupta A.
Nanoparticle formulation of hydrophilic and

Lakshmi et al. / Optimization of Composition…
IJDDT, July 2016 – September 2016, Volume 6, Issue 3 Page 90
hydrophobic drugs. International Journal of Research
Pharmaceutical Sciences 1(2): 163-169.
4. Shabnam A, Qurratul A, Sharma P. An overview on
various approaches used for solubilization of poorly
soluble drugs. The Pharma Research 2009, 2, 84-104.
5. Liversidge, G.; Cundy, K. Particle size reduction for
improvement of oral bioavailability of hydrophobic
drugs: I. Absolute oral bioavailability of
nanocrystalline danazole in beagle dogs. Int. J. Pharm.
1995, 125, 91–97.
6. Muller, R. H.; Jacobs, C.; Kayser, O. Nanosuspensions
as particulate drug formulations in therapy: rationale
for development and what we can expect in the future.
Adv. Drug Deliv. Rev. 2001, 47, 3–19.
7. Patil SA, Rane BR, Bakliwal SR, Pawar SP.
Nanosuspension at a glance. International Journal of
Pharmaceutical Sciences (2011); 3, 947-960.
8. Verma S, Diane Burgress. Solid nanosuspensions: The
emerging technology and pharmaceutical applications
as Nanomedicine, AAPS press 285-318.
9. Kakrana, M.; Sahooa, N. G.; Lia, L.; Judeh, Z.; Wang,
Y.; Chong, K.; Loh, L. Fabrication of drug
nanoparticles by evaporative precipitation of
nanosuspension. Int. J. Pharm. 2010, 383, 285–292.
10. Liversidge, G. G.; Conzentino, P. In vivo evaluation of
matrix pellets containing nanocrystalline ketoprofen.
Int. J. Pharm. 1995, 20, 79–84.
11. Sharma, P.; Denny, W. A.; Garg, S. Effect of wet
milling process on the solid state of indomethacin and
simvastatin. Int. J. Pharm. 2009, 380, 40–48.
12. Müller RH and Jacobs C: Buparvaquone mucoadhesive
nanosuspension: preparation, optimization and long-
term stability. Int J Pharm, 2002; 237, 151-61.
13. Moschwitzer J, Achleitner G, Promper H, Muller RH:
Development of an intravenously injectable chemically
stable aqueous omeprazole formulation using
nanosuspension technology. Eur J Pharm Biopharm,
2004; 58, 615-9.
14. Grau, M. J., Kayser, O., Muller, R. H. (2000)
Nanosuspensions of poorly soluble drugs –
reproducibility of small-scale production. Int. J. Pharm.
196: 155–157.
15. Muller, R. H., Bohm, B. H. L. (1998) Nanosuspensions.
In: Muller, R. H., Benita, S., Bohm, B. H. L. (eds)
Emulsions and nanosuspensions for the formulation of
poorly soluble drugs. Medpharm Scientific Publishers,
Stuttgart, pp 149–174.
16. R.Chou, K.Peterson and M.J.Helfand. Pain Sym.
Manag. 2004, 28(2), 140-175.
17. Fısher RA. The Design of Experiments. 1 ed.
Edinburgh: Oliver and Boyd, 1935.
18. Plackett RL, Burman JP. The design of optimum
multifactorial experiments. Biometrika 1946; 33:305–
325.
19. Box GEP, Wilson KB. On the experimental attainment
of optimum conditions. J Royal Stat Soc Ser B 1951;
13:1–45.
20. Scheffe H. Experiments with mixtures. J Royal Stat
Soc Ser B 1958; 20:344–360.
21. Marlowe E, Shangraw RF. Dissolution of sodium
salicylate from tablet matrices prepared by wet
granulation and direct compression. J Pharm Sci 1967;
56:498–504.
22. Bhanu P Sahu and Malay K Das; Optimization of
felodipine nanosuspensions using Full Factorial
Design; International Journal of PharmTech Research;
Vol.5, No.2, pp 553-561.
23. Rafati H, Talebpour Z, Adlnasab L. And Ebrahimi S.N,
Quality by design: optimization of a liquid filled pH-
responsive macroparticles using draper-lin composite
design, J. Pharma. Sci., 2009, 1-11.
24. Zidan A S, Sammourb O A, Hammad M. A, Megrab N
A, Habib M J, Khana M A, Quality by design:
Understanding the formulation variables of
acyclosporine a self-nanoemulsified drug delivery
systems by Box–Behnken design and desirability
function. Int. J. Pharm., 2007,332, 55–63.
25. Singh B, Chakkal S, Ahuja N, Formulation and
optimization of controlled release mucoadhesive
tablets of atenolol using response surface methodology,
AAPS PharmSciTech, 2006,7, 19–28.
26. Devi K V, Bhosale U V, Formulation and optimization
of polymeric nano drug delivery system of acyclovir
using 3² full factorial design, Int.J. PharmTech Res. ,
2009. 1(3), 644-653.
27. S. Verma, Y. Lan, R. Gokhale and D.J. Burgess.
Quality by design approach to understand the process
of nanosuspension preparation. International Journal of
Pharmaceutics 2009: 377 (1): 185-198.
28. Holdich, R. G., 2002, Fundamentals of Particle
Technology, Midland Information Technology and
Publishing, Leicestershire, UK.
29. Chen Y, Liu J, Yang X, Zhao X, Xu H. Oleanolic acid
nanosuspensions: Preparation, in-vitro characterization
and enhanced hepatoprotective effect. J Pharm
Pharmacol. 2005; 57: 259–64.
30. Muller RH, Jacobs C. Production and characterization
of a budesonide nanosuspension for pulmonary
administration. Pharm Res 2002; 19:189–94.
31. Yang JZ, Young AL, Chiang PC, Thurston A, Pretzer
DK. Fluticasone and budesonide nanosuspensions for
pulmonary delivery: Preparation, characterization, and
pharmacokinetic studies. J Pharm Sci 2008; 97:4869–
78.
32. Liang YC, Binner JG. Effect of triblock copolymer
non-ionic surfactants on the rheology of 3 mol % yttria
stabilized zirconia nanosuspensions. Ceram Int. 2008;
34(2):293–7.
33. Muller RH, Grau MJ. Increase of dissolution rate and
solubility of poorly water soluble drugs as
nanosuspension. Proceedings. World Meeting
APGI/APV, Paris, 1998; 2:62–624.
34. Young TJ, Mawson S, Johnston KP, Henriska IB, Pace
GW, Mishra AK. Rapid expansion from supercritical to
aqueous solution to produce submicron suspension of
water insoluble drugs. Biotechnol Prog. 2000;16: 402–
7.
35. Jens-Uwe A H Junghanns and Rainer H Müller.
Nanocrystal technology, drug delivery and clinical

Lakshmi et al. / Optimization of Composition…
IJDDT, July 2016 – September 2016, Volume 6, Issue 3 Page 91
applications.; Int J Nanomedicine. Sep 2008; 3(3):
295–310.
36. Kumar AN, Deecaraman M, Rani C. Nanosuspension
technology and its applications in drug delivery. Asian
J Pharma. 2009;3: 168–73.
37. Setler P. London: Identifying new oral technologies to
meet your drug delivery needs for the delivery of
peptides and proteins and poorly soluble molecules. IIR
Limited Drug delivery system; 1999.
38. Kocbek P, Baumgartner S, Kristi J. Preparation and
evaluation of nanosuspensions for enhancing
dissolution of poorly soluble drugs. Int J Pharm., 2006,
312 (1-2), 179-186.
39. Silverstein RM and Webster FX, Ed.v, Spectrometric
Identification of Organic, Compounds, 6th Edn, Jhon
Wiley, and Sons, New York: 71-109, (2002), p 72- 126.
40. Ashutosh Kar, Text book of Pharmaceutical Drug
Analysis, ISBN (13) p.293-311.
41. Jores K., Mehnert W., Drecusler M., Bunyes H., Johan
C., MAder K. Investigation on the stricter of solid lipid
nanoparticles and oil-loaded solid nanoparticles by
photon correlation spectroscopy, field flow
fractionisation and transmission electron microscopy. J
Control Release. 2004; 17: 217- 227.
42. Sovan Lal Pal, Utpal Jana, P. K. Manna, G. P. Mohanta,
R. Manavalan. Journal of Applied Pharmaceutical
Science 01 (06); 2011: 228-234.