Embed Size (px)
Citation preview

ORIGINAL ARTICLE
Optimization of protease production from surface-modified coffeepulp waste and corncobs using Bacillus sp. by SSF
Selvam Kandasamy1 • Govarthanan Muthusamy2 • Senthilkumar Balakrishnan1,3 •
Senbagam Duraisamy4 • Selvankumar Thangasamy5 • Kamala-Kannan Seralathan6 •
Sudhakar Chinnappan5
Received: 15 March 2016 / Accepted: 1 August 2016 / Published online: 12 August 2016
� The Author(s) 2016. This article is published with open access at Springerlink.com
Abstract The aim of the study was to identify new sources
of substrate from agro-industrial waste for protease pro-
duction using Bacillus sp., a local bacteria isolated from an
agro-waste dumping site. The strain was identified as
Bacillus sp. BT MASC 3 by 16S rRNA sequence followed
by phylogenic analysis. Response surface methodology-
based Box–Behnken design (BBD) was used to optimize the
variables such as pH, incubation time, coffee pulp waste
(CPW) and corncob (CC) substrate concentration. The BBD
design showed a reasonable adjustment of the quadratic
model with the experimental data. Statistics-based contour
and 3-D plots were generated to evaluate the changes in the
response surface and understand the relationship between
the culture conditions and the enzyme yield. The maximum
yield of protease production (920 U/mL) was achieved after
60 h of incubationwith 3.0 g/L of CPWand 2.0 g/L of CC at
pH 8 and temperature 37 �C in this study. The molecular
mass of the purified enzyme was 46 kDa. The highest
activity was obtained at 50 �C and pH 9 for the purified
enzymes.
Keywords Protease � SSF � Bacillus sp. � Coffee pulp
waste � Corncobs � Response surface methodology
Introduction
Proteases (EC 3.4.21–24) are a cluster of enzyme which
hydrolyzes proteins, that is, catabolizes proteins by
hydrolysis of the peptide bonds that link amino acids
together in the polypeptide chain forming the proteins.
Proteases also known as peptidyl-peptide hydrolase and
constitute 60–65 % of the global enzyme market (Shankar
et al. 2011). Proteases are commercially important
enzymes having a wide range of applications in various
industrial, biotechnological, medicinal and basic research
fields (Das and Prasad 2010).
Proteases are widely distributed in the microbial popula-
tion, viz. bacteria, actinomycetes and fungi. Although pro-
teases arewidespread in nature,microbes serve as a preferred
source of these enzymes and account for around two-thirds of
commercial production worldwide. Though proteases are
produced by a variety of bacteria such as Pseudomonas
aeruginosa, Flavobacterium, Clostridium, Achromobacter,
Thermo actinomyces and species belonging to Streptomyces,
Bacillus sp. is the major source which secretes a variety of
S. Kandasamy and G. Muthusamy are contributed equally to this work.
& Senthilkumar Balakrishnan
& Selvankumar Thangasamy
1 Centre for Biotechnology, Muthayammal College of Arts and
Science, Rasipuram, Namakkal, Tamil Nadu 637 408, India
2 Department of Applied Sciences, College of Environmental
Technology, Muroran Institute of Technology, 27-1
Mizumoto, Muroran, Hokkaido 050-8585, Japan
3 Department of Medical Microbiology, College of Health and
Medical Sciences, Haramaya University, P.O. Box 235,
Harar, Ethiopia
4 Department of Marine Biotechnology, Bharathidasan
University, Tiruchirappalli, Tamil Nadu 620 024, India
5 PG and Research Department of Biotechnology, Mahendra
Arts and Science College (Autonomous), Kalippatti,
Namakkal, Tamil Nadu 637501, India
6 Division of Biotechnology, Advanced Institute of
Environment and Bioscience, College of Environmental and
Bioresource Sciences, Chonbuk National University, Iksan
570752, South Korea
123
3 Biotech (2016) 6:167
DOI 10.1007/s13205-016-0481-z

soluble extracellular enzymes (Selvam et al. 2016; Jellouli
et al. 2008; Ellaiah et al. 2002). These strains are specific
producers of extracellular proteases and can be cultivated
under extreme temperature (40–60 �C) and pH (9–11) con-
ditions to give rise to products that are, in turn, stable in a
wide range of harsh environments (Eichler 2001; Han and
Damodaran 1997). Currently, many economically important
industrial enzymes are produced by cultivation of bacteria,
such as Bacillus sp. (Hoa et al. 2000).
Solid-state fermentation (SSF) has been defined as the
fermentation process which involves solid matrix and is
carried out in the absence or near absence of free water;
however, the substrate must possess enough moisture to
support growth and metabolism of the microorganism.
The solid matrix could be either the source of nutrients
or simply a support impregnated by the proper nutrients
that allows the development of the microorganisms
(Pandey 2003). Recently, SSF has generated much
interest because of lower manufacturing costs by utiliz-
ing unprocessed or moderately processed raw materials.
SSF is generally a simpler process and requires less pre-
processing energy than submerged fermentation. Other
advantages are superior productivity, low waste water
output and improved product recovery. It therefore
becomes very important to determine the environmental
conditions of the microorganism for maximum produc-
tion (Pandey et al. 2000). However, several bacterial
enzymes, such as alpha amylase, cutinase, cellulase,
protease, xylanase and keratinase have been successfully
produced in SSF using a wide range of bacteria (Dhillon
et al. 2012).
Response surface methodology (RSM) is now being rou-
tinely used for optimization studies in several biotechnologi-
cal and industrial processes (Beg et al. 2003). A statistically
designed optimization study is helpful in confirming previous
effects and interactions of fermentation variables and in
determining the optimum values of the critical factors (He
et al. 2004). The application of statistical experimental design
techniques in fermentation process development can result in
an improvement of product yield, reduce process variability,
give closer confirmation of the output response to the exper-
imental values and reduce overall costs. RSM can be used to
evaluate the relative significance of several factors even in the
presence of complex interactions (Selvam et al. 2014; Pan-
suriya and Singhal 2010).
The selection of an ideal agro-biotech waste for enzyme
production in a solid-state fermentation process depends
upon several factors, mainly related to the cost and avail-
ability of the substrate material, and thus may involve
screening of several agro-industrial residues. Coffee pulp
wastes (CPW) are generated during the industrial
processing of coffee cherries by wet and/or dry process.
These wastes are generated by coffee-producing countries
(India, Brazil, Vietnam, etc.) in large amount throughout
the year and are the most abundant renewable resources
(Pandey et al. 2000, Roussos et al. 1995). Corncobs (CC),
the central part of maize (Zea mays), are either thrown out
as waste or burnt, an application with low added value,
causing environmental concern. So it is an exciting
research area to use corncob for chemical processing to
obtain end products with added values worldwide at a very
low price (Kumar et al. 2010).
The objectives of this study were as follows: (1) iden-
tification and screening of protease-producing bacteria
from agro-waste dumping site, (2) evaluation of the
potential of the agro-industrial wastes, CPW and CC as a
substrates for protease production under SSF, and (3)
optimization of the physicochemical condition by BBD.
Materials and methods
Isolation and screening of protease-producing
bacteria
The soil sample was collected from the agricultural waste
dumping area in Salem, Tamil Nadu, India. The bacteria
were isolated from the soil samples according to Kamala-
Kannan and Krishnamoorthy (2006) with minor modifica-
tions. 1 g of soil sample was taken in a 250 mL conical
flask containing 100 mL of sterile distilled water and the
contents were mixed well in an orbital shaker to get a
homogeneous suspension. The suspension was serially
diluted 107 times and using pour plate technique the diluted
samples were transferred to Petri dishes containing sterile
nutrient agar medium. After inoculation, the plates were
incubated at 37 �C for 48 h. After incubation, the isolated
colonies were identified.
The isolated bacterial culture was inoculated on casein
agar medium containing casein 2.0 %; peptone 0.5 % and
agar 1.5 % and then incubated at 37 �C for 24 h and
observed in the clear halo zone around the colonies.
Depending on the zone of clearance, the strain of BT
MASC 3 was selected for further experimental studies.
16S rRNA amplification and partial genesequencing of the bacterial isolate BT MASC 3
Genomic DNA was extracted according to Sambrook and
Russell (2001). Thepartial 16S rRNAgenewas amplifiedusing
universal primers 27f (50AGAGTTTGATCCTGGCTCAG30)
167 Page 2 of 11 3 Biotech (2016) 6:167
123
and 907r (50CCCCGTCAATTCATTTGAGTTT30). The
amplicon was purified (QIAGEN, CA, USA) and sequenced
usingABIPRISM(Model 3700,CA, andUSA).The sequences
were compared using BLAST (NCBI) for the identification of
bacterial isolate BT MASC 3. Phylogenetic analysis was per-
formed using the neighbor-joining method in the CLC
WORKBENCH 6 software (CLC bio, MA, USA).
Substrate
The CPWwas procured from the coffee-processing industry
at Yercaud, Salem, Tamil Nadu, India. CC was collected
from the local agricultural field, Salem, Tamil Nadu, India,
and dried in a hot air oven for 10 min at 100 �C. Then the
huskwas ground in a blender to prepare particleswith amean
size of 1.0–2.0 mm. The alkali pre-treatment of substrates
was conductedwith 1:10 ratio using 1 % (w/v) NaOH (1 g of
substrate in 10 mL of 1 % NaOH solution) (Wang et al.
2004). Alkali pre-treated substrates were then washed with
distilled water and neutralized to around pH 7 and base fol-
lowed by drying (Bansal et al. 2011).
Scanning electron microscopy
Scanning electron microscopy (Jeol JSM 6390 model) was
used to examine the morphological modifications of CPW
and CC before and after the alkaline pre-treatment according
to Dıaz-Malvaez et al. (2013) Samples were dehydrated and
mounted on stubs and sputter-coated with gold for 300 s
using high vacuum and a voltage acceleration of 10 kV.
Characterization of alkali-treated substrates
FTIR spectroscopy was used as an analytical tool to
qualitatively determine the chemical changes in the
lignocellulosic material upon pre-treatment. FTIR spectra
of untreated and alkali-treated substrates were obtained by
direct transmittance using the KBr pellet technique (Shi-
madzu). The spectra of 400–4000 cm-1 were used at a
spectral resolution of 1 cm-1 (Sun et al. 2007).
Solid-state fermentation
Five grams of CPW and CC was put in Erlenmeyer flasks
and moistened (60–70 %) with ultrapure water. The con-
tents were vigorously mixed, and the flasks were auto-
claved at 121 �C for 15 min. After sterilization, the flasks
were cooled to 50 �C and inoculated with 3 mL of BT
MASC 3 isolate carrying 108 cells/mL (0.8 OD at 600 nm)
as a seed culture under aseptic condition. The contents of
the flasks were well mixed and incubated at 36 ± 1 �C for
96 h.
Statistical optimization of protease production
The experiment is a well accepted statistical technique able
to design and optimize the experimental process that
involves choosing the optimal experimental design and
estimate the effect of the several variables independently
and also the interactions simultaneously. Response surface
methodology combined with BBD was established using
Design Expert software (9.0.0.7 trial version). Four factors,
namely, pH, incubation time, CPW and CC, were opti-
mized for enhanced protease production using the isolate
BT MASC 3 under SSF. Based on BBD, the factors were
analyzed at two levels: -1, for low level, and ?1, for high
level. A total of 29 runs were performed to optimize the
process parameters, and experiments were performed
according to the experimental design matrix. The results
were evaluated by applying the coefficient of determination
Fig. 1 16S rRNA-based phylogenetic analysis of Bacillus sp. BT MASC 3. Bootstrap values and scale bar depicting the substitution rate per site
are indicated. The phylogenetic tree constructed by the neighbor-joining method showing the position of isolate BT MASC 3
3 Biotech (2016) 6:167 Page 3 of 11 167
123

(R2), analysis of variance (ANOVA) and response plots.
Employing RSM, the most widely used second-order
polynomial equation was developed to fit the experimental
results and identify the relevant model terms:
Y ¼ b0RbiXi þ RbiXibij þ RXiXj; ð1Þ
where Y is the predicted response; b0, bi, and bij are con-
stant regression coefficients of the model; and Xi and Xj
represent independent variables. The experimental design
chosen for the study was a Box–Behnken design that helps
in investigating linear, quadratic and cross product effects
of these factors, each varied at these levels, and also
includes three center points for replication (Govarthanan
et al. 2015; Ellaiah et al. 2002).
Enzyme recovery and purification
The enzyme was extracted after the incubation period from
the fermentationmedium bymixing thoroughly with 50 mM
glycine–NaOHbuffer, pH11, for 30 min, and the extractwas
separated by filtering initially through Whatman No. 1 filter
paper followed by 0.2 lmmembrane filter and centrifuged at
6000 rpm for 10 min. The supernatant was subjected to
65 % ammonium sulfate saturation. After that, the solution
was centrifuged at 10,000 rpm, 4 �C for 30 min, and the
precipitate containing the enzyme was collected. The pellet
was re-dissolved in 0.2 M phosphate buffer (pH 7.0). Then,
the suspension was dialyzed thoroughly against the same
buffer for desalting. The purified enzyme was used for pro-
tease assay (Prakasham et al. 2006).
Enzyme assay
Protease activity was estimated by the Anson–Hagihara
method (Patel et al. 2006). The enzyme (0.5 mL)was added to
3.0 mL casein (0.6 % in 20 mM glycine–NaOH buffer, pH
10) and the reactionmixturewas incubatedat 37 �Cfor10 min
before the addition of 3.2 mL of M trichloroacetic acid (TCA
Fig. 2 a Scanning electron microscopy (SEM) of the coffee pulp
waste (CPW) surface. A Untreated CPW; B pre-treated with NaOH,
corncob (CC) surface. C untreated CC; D pre-treated with NaOH,
b FTIR of the coffee pulp waste (CPW). A untreated CPW; B pre-
treated with NaOH, corncob (CC); C untreated CC; D pre-treated with
NaOH
167 Page 4 of 11 3 Biotech (2016) 6:167
123

mixture 0.11 M TCA, 0.22 M sodium acetate, 0.33 M acetic
acid). The terminated reaction mixture was incubated for
30 min at 30 �C temperature. The precipitates were removed
by filtration through Whatman No. 1 filter paper and the
absorbance of the filtrate wasmeasured at 280 nm.One unit of
protease activity was defined as the amount of enzyme liber-
ating 1 lg of tyrosine per minute under the assay conditions.
Enzyme units were measured using tyrosine (0–100 lg) as astandard (Satbir and Bijender 2016; Govarthanan et al. 2014).
Determination of protein concentration
The protein concentration of the crude enzyme as well as the
purified enzyme was determined by the method of Lowry
et al. (1951) using bovine serum albumin as a standard.
Determination of molecular weight of the protease
enzyme using SDS-PAGE and zymogram
The molecular mass of the purified enzyme was determined
on 12 % sodium dodecyl sulfate polyacrylamide gel elec-
trophoresis (SDS-PAGE) according to the method of
Leammli (1970). About 10 lg of the purified protein was
loaded on 12 % SDS-PAGE with standard molecular mass
markers (GENEI, Bangalore, India) and electrophoresis
was carried out at a constant current of 30 mA. After
electrophoresis, the gel was stained with Coomassie Bril-
liant Blue R-250 (CBB R-250) and destained to visualize
protein bands over the UV-Transilluminator (Biotech,
Yercaud, Salem, Tamil Nadu, India).
The zymogram was performed using 10 mg/mL gelatin
in 10 % polyacrylamide mixture. The purified and con-
centrated sample of the enzyme was loaded without sub-
jecting it to the heat treatment in the gel loading buffer
devoid of b-mercaptoethanol. Electrophoresis was per-
formed at a constant voltage of 80 V and 10 mA for 3–5 h.
On completion, the gel was treated with Triton X-100
(2.5 % v/v) by soaking for 20 min with three repetitions of
the process. The gel was incubated for 12 h in 50 mM
glycine–NaOH buffer of pH 8.5 at room temperature. The
gel was stained with Coomassie Brilliant Blue R-250
(0.5 %) and destained with methanol–glacial acetic acid–
water (30:10:60). The digestion of the substrate is indicated
by clear areas.
Effect of pH and temperature on protease activity
and stability
Optimum pH was determined by estimating the protease
activity at 50 �C and pH values ranging from 6 to 11 (ci-
trate, pH 6; phosphate, pH 7; Tris–HCl, pH 8; carbonate,
pH 9 and 10; sodium phosphate–NaOH, pH 11). The sta-
bility of protease was examined by incubating the enzyme
at 28 �C in buffers at pH values ranging from 6 to 11 for
1 h. Residual activity was estimated as described earlier
and expressed as percentage of the initial activity taken as
100 %.
The optimum temperature was determined by estimating
the protease activity at pH 9 and temperatures ranging from
30 to 70 �C for 10 min. The thermal stability was exam-
ined by incubating the enzyme at temperatures ranging
from 30 to 70 �C for 1 h and the residual activity was
measured at 50 �C, pH 9, and expressed as percentage of
initial activity taken as 100 %.
Results and discussion
Isolation, identification, screening
and characterization of protease-producing bacteria
This study represents an attempt to evaluate the potential of
CPW, CC and bacteria from agricultural waste for the
production of industrially important protease by SSF. The
protease producing bacteria was isolated from waste
Fig. 2 continued
3 Biotech (2016) 6:167 Page 5 of 11 167
123

dumping site and screened on skimmed milk agar plates for
caseinolytic activity. The results showed that the isolate,
designated BT MASC 3, exhibited maximum caseinolytic
activity.
The isolate BT MASC 3 was selected for SSF studies.
Polymerase chain reaction amplification of the partial 16S
rRNA resulted in the predicted 907-bp amplicon in the
isolate BT MASC. The amplicon sequences were com-
pared with 16S rRNA sequences in the NCBI database, and
the sequences exhibited 99 % identity with Bacillus sp.
The partial 16S rRNA of the isolate BT MASC 3 was
deposited in GenBank (Accession Number: KJ447124).
The results are in accordance with several studies reporting
the protease-producing Bacillus sp. under SSF (Prakasham
et al. 2006). A phylogenetic tree was derived from the
partial 16S rRNA sequences of the isolate BT MASC 3
with existing sequences in the database, and the results are
shown in Fig. 1. The phylogenetic tree was constructed
from the sequence data by the neighbor-joining method.
Expectedly, the isolate BT MASC 3 and Bacillus sp. were
in the same clusters and which further confirms the identity
of the 16S rRNA sequence with Bacillus sp. The Bacillus
species are considered to be the most important sources of
protease and have been used for enzyme production using
SSF (Prakasham et al. 2006).
Scanning electron microscopy
The SEM analysis clearly indicated that the NaOH pre-
treatment modified the outer layer of the substrates CPW
and CC (Fig. 2a). The untreated substrates (CPW and CC)
showed a smooth, rigid and highly ordered structure,
whereas pre-treatment induced changes in the structure.
The pre-treated substrates were uneven, rough and more
porous on the surface. These findings indicate that pre-
treatment promoted the removal of some external fibers.
Table 1 Box–Behnken design for the variables and the experimentally observed responses
Run pH Incubation time Coffee pulp waste (%) Corncobs (%) Protease (U/mL)
1 10 60 3.00 3.00 452
2 6 96 3.00 2.00 456
3 8 60 1.00 1.00 670
4 8 60 5.00 3.00 780
5 8 60 3.00 2.00 914
6 6 60 1.00 2.00 510
7 8 24 3.00 3.00 530
8 8 60 5.00 1.00 487
9 8 24 1.00 2.00 535
10 8 96 1.00 2.00 625
11 8 96 3.00 1.00 513
12 10 60 1.00 2.00 475
13 6 60 3.00 3.00 445
14 6 60 5.00 2.00 460
15 8 96 5.00 2.00 745
16 8 96 3.00 3.00 750
17 8 60 1.00 3.00 655
18 8 60 3.00 2.00 910
19 6 24 3.00 2.00 440
20 10 96 3.00 2.00 445
21 8 60 3.00 2.00 900
22 6 60 3.00 1.00 537
23 8 60 3.00 2.00 920
24 10 60 3.00 1.00 560
25 8 60 3.00 2.00 918
26 8 24 5.00 2.00 600
27 10 60 5.00 2.00 475
28 10 24 3.00 2.00 435
29 8 24 3.00 1.00 615
167 Page 6 of 11 3 Biotech (2016) 6:167
123

The removal of the external fibers leads to an increase in
the external surface area and the porosity of the substrates.
The same changes have been reported after the rice straw
was pre-treated by aqueous ammonia (Ko et al. 2009).
Characterization of alkali-treated substrates
FTIR was used to demonstrate the physical structure and
changes in functional groups of CPW and CC before and
after pre-treatment (Fig. 2b). FTIR spectroscopy analysis
showed obvious changes in the functional groups during
the pre-treatment. The chemical bonds of the substrates
were investigated in the region of 400–4000 cm-1. The
pre-treated CPW peaks were located at 3695.61 cm-1 and
3726; CC peaks were located at 3311.78 cm-1 and
3861.49, respectively. The peaks located at 3726 cm-1 and
3861 cm-1 correspond to –OH stretching and –CH2
stretching, respectively (Sun et al. 2007).
Optimization of protease production using BBD
The application of modern statistical models to optimize
the physicochemical components of the cultural conditions
has been increased in current industrial biotechnology
because of its universal applicability and suitability. The
BBD was applied to identify the optimal conditions for the
enhanced production of the protease enzyme. The experi-
mental design is presented in Table 1. The ANOVA of the
quadratic regression model (Table 2) exhibits that it was a
highly significant model, as evident from the Fisher’s F test
with a very low probability value (F value = 15.67).
Values of ‘Prob[F’ (0.0001) indicate that the term of the
model was significant. The model F value of 15.67 implies
that the model was significant. There was only a 0.01 %
chance that a model F value could occur due to noise. The
predicted R2 (0.6559) and adjusted R2 (0.8801) values for
protease production were in reasonable agreement with the
value of R2 (0.9400), which is closer to 1.0, indicating the
better fitness of the model in the experimental data. The
model for protease production by SSF, three different tests,
namely, sequential model sum of squares, lack of fit tests
and model summary statistics, were carried out in the
present study.
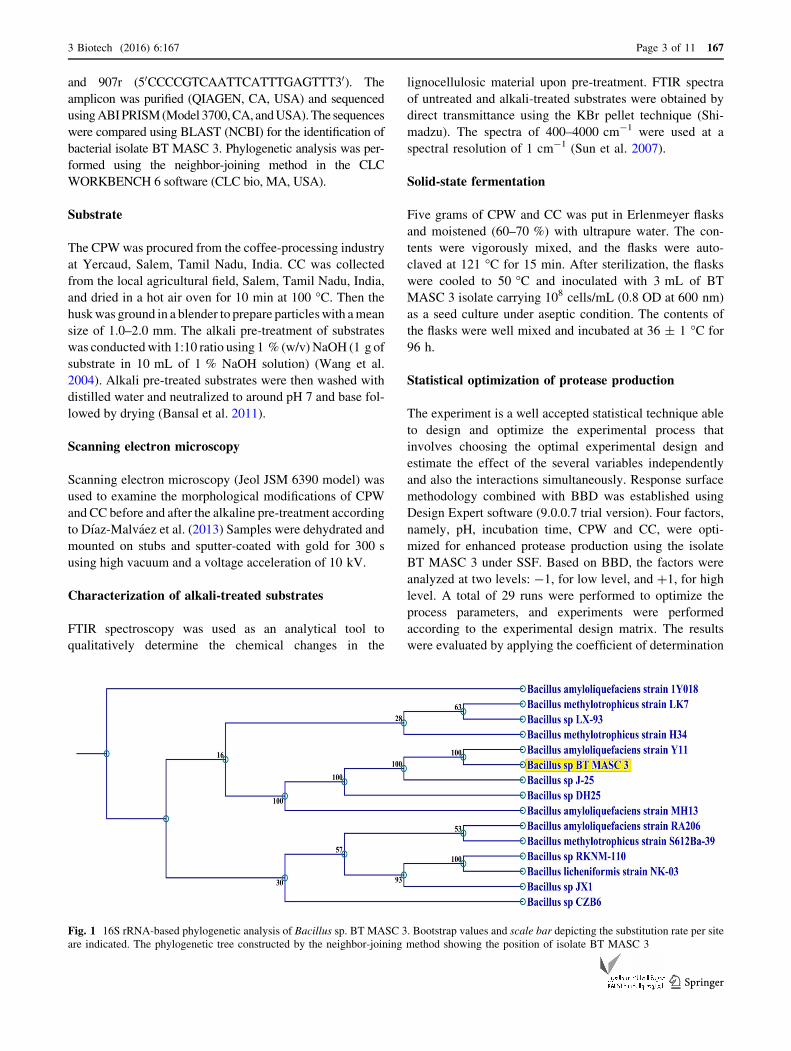
The 3-D plot graphical representations were generated
(Fig. 3). The results demonstrate that there was a signifi-
cant relation of pH, incubation time, CPW and CC con-
centrations for protease production. The optimum levels of
the variables were obtained by using BBD. The model
predicted a maximum protease activity of 920 U/mL
appearing after 60 h cultivation with CPW 3.0 g/L, CC
2.0 g/L of substrate, pH 8 and temperature 37 �C. The
results are consistent with previous study reporting the
maximum protease (821 U/mL) production by Bacillus sp.
SKK11 (Govarthanan et al. 2014). The predicted model
was validated and experiments were conducted using these
optimal conditions. The predicted model values were in
Table 2 Analysis of variance (ANOVA) for the response surface quadratic model
Source Sum of squares Df Mean square F value P value prob[F
Model 7.577E ? 005 14 54120.14 15.67 \0.0001
A––pH 3.00 1 3.00 8.688E - 004 0.9769
B––incubation time 11970.08 1 11970.08 3.47 0.0837
C—CPW 494.08 1 494.08 0.14 0.7109
D—CC 4408.33 1 4408.33 1.28 0.2775
AB 9.00 1 9.00 2.607E - 003 0.9600
AC 625.00 1 625.00 0.18 0.6770
AD 64.00 1 64.00 0.019 0.8936
BC 756.25 1 756.25 0.22 0.6470
BD 25921.00 1 25921.00 7.51 0.0160
CD 23716.00 1 23716.00 6.87 0.0201
A2 5.635E ? 005 1 5.635E ? 005 163.20 \0.0001
B2 1.872E ? 005 1 1.872E ? 005 54.21 \0.0001
C2 1.077E ? 005 1 1.077E ? 005 31.20 \0.0001
D2 1.126E ? 005 1 1.126E ? 005 32.60 \0.0001
Residual 48340.28 14 3452.88 – –
Lack of fit 48089.08 10 4808.91 76.57 0.0004
Pure error 251.20 4 62.80 – –
Cor total 8.060E ? 005 28 – – –
3 Biotech (2016) 6:167 Page 7 of 11 167
123

24 33
42 51
60 69
78 87
96
6 7
8 9
10
400
500
600
700
800
900
1000 P
rote
ase
activ
ity (U
/mL)
A: pHB: Incubation time1
2 3
4 5
6 7
8 9
10
400
500
600
700
800
900
1000
Pro
teas
e ac
tivity
(U/m
L)
A: pHC: Coffee pulp waste
1 1.5
2 2.5
3
6 7
8 9
10
400
500
600
700
800
900
1000
Prot
ease
act
ivity
(U/m
L)
A: pHD: Corn cobs1
2 3
4 5
24 33
42 51
60 69
78 87
96
400
500
600
700
800
900
1000
Pro
teas
e ac
tivity
(U/m
L)
B: Incubation timeC: Coffee pulp waste
1 1.5
2 2.5
3
24 33
42 51
60 69
78 87
96
400
500
600
700
800
900
1000
Pro
teas
e ac
tivity
(U/m
L)
B: Incubation timeD: Corn cobs1
1.5 2
2.5 3
1 2
3 4
5
400
500
600
700
800
900
1000
Pro
teas
e ac
tivity
(U
/mL)
C: Coffee pulp wasteD: Corn cobs
Fig. 3 3-D plots of the combined effects of two variables on protease production by Bacillus sp. BT MASC 3
167 Page 8 of 11 3 Biotech (2016) 6:167
123

good agreement with the values measured in these exper-
iments, thus mitigating the validity of the response model
and the necessity for optimal conditions. The graphs
highlighted the roles played by the variables for the pro-
duction of protease.
The coefficients of the regression equation were calcu-
lated and the following regression equation was obtained:
Y ¼ 912:40 � 0:50A þ 31:58B þ 6:42C þ 19:17D
� 1:50AB þ 12:50AC � 4:00AD þ 13:75BC
þ 80:50BD þ 77:00CD � 294:74A2
� 169:87B2 � 128:87C2 � 131:74D2
ð2Þ
where Y stands for protease activity, A is pH, B is incu-
bation time, C is CPW and D is CC concentration,
respectively. A high degree of similarity of experimental
values was observed, thus reflecting the precision and
applicability of RSM to optimize the process for protease
production. The results are in agreement with the previous
studies reporting the significant role of RSM on the
enhanced production of secondary metabolites using
microorganisms. Optimization of fermentation conditions
for the production of protease showed the progress in the
rate of production economics and it is also an attractive
technology. CPW and CC which are cheap and easily
available can be used in SSF for protease production. This
indicates the feasibility of the economical production of
protease using Bacillus sp. MASC 3.
Determination of molecular weight of protein
SDS-PAGE of the partially purified enzyme from BT
MASC 3 showed a single band (Fig. 4a); to confirm it is an
enzyme protein band, the protease activity of the purified
enzyme was also observed and the apparent molecular
weight of the purified protease was 46 kDa. Our results are
more or less similar to that of Akel et al. (2009). WHO
reported that the purified protease enzyme revealed a
molecular mass of 49 kDa. A variety of molecular mass for
proteases from other Bacillus species had been reported:
75.0 kDa Bacillus sp. S17110; (Jung et al. 2007) 30.9 kDa
thermophilic Bacillus strain HS08. The purified protease
enzyme was also subjected to zymogram analysis by SDS-
PAGE containing 0.1 % gelatin. The proteolytic activity of
the protein is indicated by the clear band (b). Ramakrishna
Fig. 4 a SDS-PAGE, b zymogram of purified protease produced by
Bacillus sp. BT MASC 3, M molecular weight marker (phosphorylase
B 97.4 kDa, albumin 66 kDa, ovalbumin 43 kDa, carbonic anhydrase
29 kDa, trypsin inhibitor 20.1 kDa, a-lactalbumin 14.3 kDa), E-pu-
rified protease enzyme
Fig. 5 a Effect of temperature on the activity and stability of purified
protease of Bacillus sp. BT MASC 3. b Effect of pH on the activity
and stability of purified protease of Bacillus sp. BT MASC 3
3 Biotech (2016) 6:167 Page 9 of 11 167
123

et al. (2010) conducted zymography for protease produced
by Bacillus subtilis (MTTC N0-10110) on 7 % SDS-PAGE
gels containing casein as the substrate at 4 �C.
Effect of pH and temperature on enzyme activity
The purified protease was found to be active over a broad
range of pH values between 6 and 11 at 37 �C with the
maximum pH 9 for hydrolysis of casein. The pH stability
of the purified protease showed that the enzyme possessed
remarkable stability at pH 8.0–10.0 (97.4–100 %)
(Fig. 5a). Based on this observation, BT MASC 3 protease
could be classified as an alkaline protease. Similar results
were obtained for the optimum pH for enzymatic activity
of other Bacillus species: pH 7.5 for Bacillus sp. S17110,
Bacillus sp. HS08 (Huang et al. 2006) and Bacillus subtilis
ITBCCB 148, (Yandri et al. 2008) pH 8.0 for Bacillus
cereus KCTC 3674, (Kim et al. 2001).
The protease activity of the purified enzyme was mea-
sured at temperatures ranging from 30 to 70 �C. The opti-
mum activity of the purified enzyme was exhibited at 50 �C,while only about 10 % of the activity was inactivated after
exposure to 60 �C for 10 min. The thermostability of the
purified protease showed that it was stable at 40–60 �C for
10 min (Fig. 5b). Previous studies reported that the optimum
temperature for production of protease by B. subtilis CN2
and B. pumilus was at 50 �C B. subtilis CN2 and B. pumilus
was at 50 �C (Aoyama et al. 2000; Uchida et al. 2004). This
was supported by Li et al. (1997) who reported that alkaline
protease isolated fromThermomyces lanuginosusP134 had a
broad temperature optimum of 50 �C. Samal et al. (1991)
also reported an alkaline protease from Tritirachium album
Limber to be quite thermostable even up to 50 �C.
Conclusions
Protease production byBacillus sp. BTMASC3 under solid-
state fermentation was influenced by the physiological and
chemical nature of the CPW and CC. The feasibility of using
an agro-residue as a possible substrate for protease produc-
tion was studied using the response surface methodological
approach. The optimum conditions for the maximum pro-
tease production 920 U/mL using CPW and CC are as fol-
lows: pH8, fermentation time 60 h,with 3.0 g/L ofCPWand
2.0 g/L ofCC. The enzyme production in this range from this
vastly available by-product is significant. The molecular
weight of protease enzyme was determined as 46 kDa. The
study has demonstrated the suitability of using CPW and CC
as a substrate for the production of protease by the statistical
optimization process, thereby reducing the cost of protease
and could be explored further for wastemanagement through
its reuse into value-added products.
Compliance with ethical standards
Conflict of interest The authors declare that they have no conflict of
interest.
Open Access This article is distributed under the terms of the
Creative Commons Attribution 4.0 International License (http://
creativecommons.org/licenses/by/4.0/), which permits unrestricted
use, distribution, and reproduction in any medium, provided you give
appropriate credit to the original author(s) and the source, provide a
link to the Creative Commons license, and indicate if changes were
made.
References
Akel H, Al-Quadan F, Yousef TK (2009) Characterization of a
purified thermostable protease from Hyperthermophilic Bacillus
strain HUTBS71. Eur J Sci Res 31:280–288
Aoyama M, Yasuda M, Nakachi K, Kobamoto N, Oku H, Kato F
(2000) Soybean-milk-coagulating activity of Bacillus pumilus
derives from a serine proteinase. Appl Microbiol Biotechnol
53:390–395
Bansal N, Tewari R, Gupta JK, Soni SK, Soni R (2011) A novel strain
of Aspergillus niger producing a cocktail of industrial depoly-
merising enzymes for the production of second generation
biofuels. BioResources 6:552–569
Beg QK, Sahai V, Gupta R (2003) Statistical media optimization and
alkaline protease production from Bacillus mojavensis in a
bioreactor. Process Biochem 39:203–209
Das G, Prasad MP (2010) Isolation, purification and mass production
of protease enzyme from Bacillus subtilis. Int Res J Microbiol
1:26–31
Dhillon GS, Kaura S, KaurBrara S, Verma M (2012) Potential of
apple pomace as a solid substrate for fungal cellulase and
hemicellulase bio production through solid state fermentation.
Ind Crop Prod 38:6–13
Dıaz-Malvaez FI, Garcıa-Almendarez BE, Hernandez-Arana A,
Amaro-Reyes A, Regalado-Gonzalez C (2013) Isolation and
properties of b-xylosidase from Aspergillus niger GS1 using
corn peri carp upon solid state fermentation. Process Biochem
48:1018–1024
Eichler J (2001) Biotechnological uses of archaeal extremozymes.
Biotechnol Adv 19(4):261–278
Ellaiah P, Srinivasulu B, Adinarayana K (2002) A review on
microbial alkaline proteases. J Sci Ind Res 61:690–704
GovarthananM, Park SH, Kim JW, Lee KJ, ChoM, Kamala-Kannan S,
Oh BT (2014) Statistical optimization of alkaline protease
production from brackish environment Bacillus sp. SKK11 by
SSF using horse gramhusk. PrepBiochemBiotechnol 44:119–131
Govarthanan M, Selvankumar T, Selvam K, Sudhakar C, Aroulmoji
Vincent, Kamala-Kannan S (2015) Response surface methodol-
ogy based optimization of keratinase production from alkali-
treated feather waste and horn waste using Bacillus sp. MG-
MASC-BT. J Ind Eng Chem 27:25–30
Han XQ, Damodaran S (1997) Isolation, identification and fermen-
tation of Bacillus species producing a detergent-stable endopep-
tidase. J Agric Food Chem 45:4191–4195
He GQ, Kong Q, Dingm LX (2004) Response surface methodology
for optimizing the fermentation medium of Clostridium
butyricum. Let Appl Microbiol 39:363–368
Hoa NT, Baccigalupi L, Huxham A (2000) Characterization of
Bacillus species used for oral bacteriotherapy and bacteriopro-
phylaxis of gastrointestinal disorders. Appl Environ Microbiol
66(12):5241–5247
167 Page 10 of 11 3 Biotech (2016) 6:167
123

Huang G, Ying T, Huo P, Jiang YZ (2006) Purification and
characterization of a protease from thermophilic Bacillus strain
HS08. Afr J Biotechnol 5:2433–2438
Jellouli K, Bayoudh A, Manni L, Agrebi R, Nasri M (2008)
Purification, biochemical and molecular characterization of a
metalloprotease from Pseudomonas aeruginosa MN7 grown on
shrimp wastes. Appl Microbiol Biotechnol 79:989–999
Jung SC, Paik H, Kim MS, Baik KS, Lee W, Seong CN, Choi SK
(2007) InhA like protease secreted by Bacillus sp. S17110
inhabited in turban shell. J Microbiol 45:402–408
Kamala-Kannan S, Krishnamoorthy R (2006) Isolation of mercury
resistant bacteria and influence of abiotic factors on bioavail-
ability of mercury—a case study in Pulicat Lake north of
Chennai, south east India. Sci Total Environ 367:341–353
Kim SS, Kim YJ, Rhee I (2001) Purification and characterization of a
novel extracellular protease from Bacillus cereus KCTC 3674.
Arch Microbiol 175:458–461
Ko JK, Bak JS, Jung MW, Lee HJ, Choi I-G, Kim TH, Kim KH
(2009) Ethanol production from rice straw using optimized
aqueous-ammonia soaking pretreatment and simultaneous sac-
charification and fermentation processes. Biores Technol
100:4374–4380
Kumar S, Upadhyaya JS, Negi YS (2010) Preparation of nanopar-
ticles from corn cobs by chemical treatment methods. Biore-
source 5(2):1292–1300
Leammli UK (1970) Cleavage of structure protein during assembly of
the head of Bacteriophage T4. Nature 277:680–685
Li DC, Yang YJ, Shem CY (1997) Protease production by the
thermophilic fungus Thermomyce lanuginosus. Myco Res
101:18–22
Lowry OH, Rosebrough NJ, Farr AL, Randall RJ (1951) Protein
measurement with the folin phenol reagent. J Biol Chem
193:265–275
Pandey A (2003) Solid-state fermentation. Biochem Eng J 13:81–84
Pandey A, Soccol CR, Mitchell DA (2000) New developments in
solid state fermentation: I-Bioprocess and products. Process
Biochem 35:1135–1169
Pansuriya RC, Singhal RS (2010) Response surface methodology for
optimization of production of lovastatin by solid state fermen-
tation. Braz J Microbiol 41:164–172
Patel RK, Dodia MS, Joshi RH, Singh SP (2006) Production of
extracellular halo-alkaline protease from a newly isolated
haloalkaliphilic Bacillus sp. isolated from seawater in Western
India. World J Microbiol Biotechnol 22:375–382
Prakasham RS, Rao CH, Sarma PN (2006) Green gram husk-an
inexpensive substrate for alkaline protease production by
Bacillus sp. in solid-state fermentation. Biores Technol
97:1449–1454
Ramakrishna DPN, Gopi Reddy N, Rajagopal SV (2010) Purification
and properties of an extra cellular alkaline protease produced by
Bacillus subtilis (MTTC N0-10110). Int J Biotechnol Biochem
6(4):493–504
Roussos S, Angeles Aquiahautl MD, Trejo-Hernandez M, Gaime
Perraud I, Favela E, Ramakrishna M, Viniegra Raimbault M,
Gonzalez G (1995) Biotechnological management of coffee
pulp, isolation, screening, characterization, selection of caffeine
degrading fungi and natural microflora present in coffee pulp and
husk. Appl Microbiol Biotechnol 42:756–762
Samal BB, Karan B, Parker C, Stabinsky Y (1991) Isolation and
thermal stabilities of two novel serine proteinases from the
fungus Tritirachium album Limber. Enzyme Microbio Technol
13:66–70
Sambrook J, Russell D (2001) Molecular cloning: a laboratory
manual, 3rd edn. Cold Spring Harbor Laboratory Press, NY
Satbir S, Bijender KB (2016) Bioprocess optimization for production
of thermoalkali-stable protease from Bacillus subtilis K-1 under
solid state fermentation. Prep Biochem Biotech. doi:10.1080/
10826068.2015.1135455
Selvam K, Govarthanan M, Kamala-Kannan S, Govindharaju M,
Senthilkumar B, Selvankumar T, Sengottaiyan A (2014) Process
optimization of cellulose production from alkali-treated coffee
pulp and pineapple waste using Acinetobacter sp. TSK-MASC.
RSC Adv 4:13045
Selvam K, Selvankumar T, Rajiniganth R, Srinivasan P, Sudhakar C,
Senthilkumar B, Govarthanan M (2016) Enhanced production of
amylase from Bacillus sp. using groundnut shell and cassava
waste as a substrate under process optimization: waste to wealth
approach. Biocatal Agric Biotechnol. doi:10.1016/j.bcab.2016.
06.013
Shankar S, Rao M, Seeta Laxman R (2011) Purification and
characterization of an alkaline protease by a new strain of
Beauveria sp. Process Biochem 46(2):579–585
Sun Y, Lin L, Pang C, Deng H, Peng H, Li J (2007) Hydrolysis of
cotton fiber cellulose in formic acid. Energy Fuels 21:2386–2389
Uchida H, Kondo D, Yamashita S, Tanaka T, Tran HL, Nagano H,
Uwajima T (2004) Purification and properties of a protease
produced by Bacillus subtilis CN2 isolated from a Vietnamese
fish sauce. World J Microbiol Biotechnol 20:579–582
Wang Y, Spratting BM, Zobell D, Wiedmeier RO, Meallister TA
(2004) Effect of alkaline treatment of wheat strew. Am Soc
Anim Sci 82:195–208
Yandri TS, Dian H, Sutopo H (2008) The chemical modification of
protease enzyme isolated from local bacteria isolate, Bacillus
subtilis ITBCCB148 with cyanuric chloride polyethylenglycol.
Eur J Sci Res 23:177–186
3 Biotech (2016) 6:167 Page 11 of 11 167
123


![CORONAVIRUS Copyright © 2020 3C-like protease inhibitors ...€¦ · 3C-like protease [3CLpro or main protease (MPro)] (11 cleavage sites) and a papain-like protease (PLpro) (3 cleavage](https://img.pdfslide.net/doc/110x75/5fd90b68b79bf5590319f032/coronavirus-copyright-2020-3c-like-protease-inhibitors-3c-like-protease-3clpro.jpg)