Embed Size (px)
Citation preview

J. Mater. Environ. Sci. 7 (12) (2016) 4348-4360 Ridha et al.
ISSN : 2028-2508
CODEN: JMESCN
4348
Optimization of the pretreatment step conditions for biodiesel production
from waste frying oil using Box-Behnken design
B. Ridha
1,3*, A. Abdelkarim
1,4*, O. Nabil
1, B. Mounir
2, A. Manef
1.
1 Laboratory of Materials, Molecules and Applications, University of Carthage, IPEST La Marsa Tunisia.
2 Biodex, Company, Industrial zone Mghira, Ben Arous, Tunisia.
3 Faculty of sciences of Bizerte, Tunisia.
4 Northern Border University, Department of Chemical and Materials Engineering, Saudi Arabia.
Received 05 Jun 2016, Revised 29 Aug 2016, Accepted 03 Sep 2016
*Corresponding author. E-mail: [email protected]; [email protected];
Abstract In Tunisia, the emergence of various restaurants is generating a huge amount of waste frying oil.
The valorization of this harmful waste into biodiesel production is a new trend. This valorization is necessary in
order to avoid the waste’s negative effects on the human health and the environment. Due to the high free fatty
acid content, the pretreatment of this oil by an esterification reaction with homogenous acid in the presence of
methanol was required to reduce the acid value of this oil to reach the necessary threshold in order to achieve
the second step. The aim of this study was to determine the optimum conditions of the pretreatment step, using
the Box-Behnken as an experimental design. The effects of the five parameters, namely, the volume of
methanol, volume of sulfuric acid, stirring rate, temperature and reaction time on the acid value were studied.
The optimum conditions for the pretreatment step were found as written below: reaction temperature at 60 °C,
reaction time one hour, 1.02 ml of sulfuric acid, 56 ml of methanol and the stirring rate at 905 rpm. With these
optimum conditions the biodiesel yield was always higher than 95%.
Keywords: Box-Behnken design, Optimization, Pretreatment, Waste frying oil, Biodiesel
1. Introduction Human population and urbanization explosion and the new life style, are the causes responsible of the
exhaustion of natural oil reserves. Thus, the issues of the awareness of environmental protection against the
impact caused by emissions of greenhouse gases is a must be reviewed subject [1]. These factors have pushed
the scientists to find an alternative source of energy to replace the fossil fuels (conventional sources). Biodiesel
is a significant alternative to overcome the future lack of energy [1, 2]. The biodiesel production is an alternative
clean fuel, biodegradable, non-toxic and renewable (environment friendly) [3]. It will reduce the CO2 emissions
by approximately 80%, carbon monoxide, and can ensure the independence towards conventional diesel [4, 5,
6]. Biodiesel can be derived from vegetable oils (refined or acid) or animal fat, combined with an alcohol
(usually methanol) [3, 7]. The transformation of these products by the transesterification reaction gives reaction
gives as final products biodiesel and glycerol. Biodiesel properties depend mainly of the raw material and
alcohol type [3, 7].
Currently, at the industrial scale, the refined vegetable oil was used to produce biodiesel using
transesterification as process in the presence of a homogeneous or heterogeneous catalysis [8, 9, 10, 11, 12].
However, this production is not economically profitable, due to the high cost of the aforementioned and the
depletion of the food equilibrium [3, 7, 13]. These factors have forced the producers countries to find other

J. Mater. Environ. Sci. 7 (12) (2016) 4348-4360 Ridha et al.
ISSN : 2028-2508
CODEN: JMESCN
4349
sources with the lowest costs, which can minimize the global production cost [14, 15, 16, 17]. Tunisia, the
valorization of the wastes (such as acidic oils) for biodiesel production constitutes a new trend for solving this
problem. The waste frying oil with high level of free fatty acids was selected as a potential source for biodiesel
production [14, 15, 16]. The use of this acid oil for biodiesel production has many benefits; economically (the
reduction of the production’s cost), environmentally (the prevention of water’s pollution and the avoidance of
the negative effects of the harmful waste) [18, 19]. It also allows the access to greater energy independence for
low level petroleum resource countries like Tunisia. However, the high contents of free fatty acids in this oil can
prevent the biodiesel manufacture. In fact, the transesterification reaction of waste frying oil in the presence of
homogenous basic catalysts can cause the soap formation which blocks the installation of the production
machine [20-24]. The oil’s pretreatment should be relevant in order to avoid the saponification reaction and
improve the production’s profitability. Once the optimum conditions of the first step were determined, the
second step (transesterification process) was applied in the presence of the potassium hydroxide as the basic
catalyst [25, 26, 27].
In order to track the simultaneous effects of the five parameters on the acid value and the interactions
between them during the pretreatment step, the response surface methodology (RSM) using Box-Behnken as
experimental design and the quadratic model from the Box-Behnken design were used. In the presence of
various factors (volume of methanol, volume of sulfuric acid, stirring rate, temperature and reaction time), Box-
Behnken design offers some advantages compared to a factorial design or central composite design, such as a
fewer number of experiments and a good optimization [28- 32].
Response surface methodology (RSM) was employed to determine the optimum conditions of these five
independent variables. The relevance of these factors, their effects and interactions were tested by the analysis
of variance with best confidence limits 0.05%. Thus, the values of the determination coefficient (R2) and the
adjusted coefficient (R2 adj). The optimum conditions of the selected variables were obtained by solving the
quadratic regression model, as well as by analyzing the response surface contour plots [30, 31, 32, 33].
The purpose of this work was to determine the optimum conditions which give the low acid value during the
pretreatment steps of waste frying oil. The experimental data to the second-order polynomial model were fitted
to the quadratic response surface models using multiple regression analysis with high coefficient of
determination value (R2) of 0.988. In the second step, the pretreated waste frying oil in the optimum conditions
was directly converted into methyl ester. Finally, the physicochemical proprieties of the biodiesel obtained with
the best experimental configuration were determined. Thus, the main components in the biodiesel were
identified by gas chromatography-mass spectrometry (GC/MS).
2. Materials and methods In this current study, the waste frying oil was used to produce biodiesel by a two-step process. This oil was
collected from Tunisian restaurants and kept in best conditions in order to obtain the same acid value along this
study (because the acid value of the waste oil always changes due to the variation in sources and preservation
conditions). Methanol (98% purity) was used as alcohol for this study. Sulfuric acid (97% purity) and potassium
hydroxide (98% purity) were used as acid and alkali catalysts. Around bottom flask was used as a reactor, a hot
plate with a magnetic stirrer.
An experiment design (Box-Behnken design) was used in this work. The used oil had an acid value of 33 mg
KOH/g-oil. In the first step, the free fatty acids were converted into fatty acids methyl ester by the pretreatment
process using a sulfuric acid as catalyst in methanol excess. In the next step, the pretreated waste frying oil was
converted into biodiesel by transesterification reaction, using methanol as a reagent, and potassium hydroxide as
an alkaline catalyst.
2.1. Biodiesel production from waste frying oil by two-step catalyzed process
In the current study, different dosages of sulfuric acid (0.5-1.5 ml), different methanol-to-oil volume ratios:
40ml, 45ml, 50ml, 55ml, 60ml, 65ml and 70ml (v/v),stirring rate (300-1300 rpm), temperature (40-60 °C) and
time of reaction (40-60 min) were used to track their influence on the acid value during the pretreatment step.
The value ranges for these five independent variables are chosen based on the literature and the practical
experience. The effects of these parameters on this oil’s acid value were evaluated to determine the optimum
conditions which give the lowest acid value in this step. For a five factors-three-levels, Box-Behnken design
J. Mater. Environ. Sci. 7 (12) (2016) 4348-4360 Ridha et al.
ISSN : 2028-2508
CODEN: JMESCN
4350
indicated that 45 experiments were required during the pretreatment step to ensure a good optimization. Before
each experiment, 100 ml of waste frying oil was poured in the flask and heated up to 60 °C for 10 min. The
preheated oil was mixed with different combinations of these five factors: volume of sulfuric acid, volume of
methanol, reaction temperature, reaction time and stirring rate (table 3). After one hour of the occurrence of the
reaction, the mixture for the first step was kept untouched for two hours in separating funnel. Afterwards, the
methanol which remained at the top was removed using a separating funnel, whereas the acid value of the
bottom product containing pretreated waste frying oil was further measured before carrying out the
transesterification reaction. Then, the pretreated oil with optimum condition (a low acid value) was converted
into biodiesel and glycerol by transesterification process (under the following optimum conditions: 20ml of
methanol, 1 g of potassium hydroxide, 60 °C, 60 min and 800 rpm). After the reaction was completed, the
product was allowed to settle for two hour resulting in the formation of two distinct liquid phases, the biodiesel
phase at the top and the glycerol at the bottom. With this optimum combination the yield of biodiesel production
was higher than 95% after purification and drying.
2.2. Experimental design
In the current study, the response surface methodology was used to find the optimum conditions for the
pretreatment step (esterification process).The effects of five independent variables, volume of sulfuric acid,
volume of methanol, stirring rate, temperature and reaction time on the acid value were investigated in the first
step. The Box-Behnken design was carried in this study to minimize the number of experiments in the presence
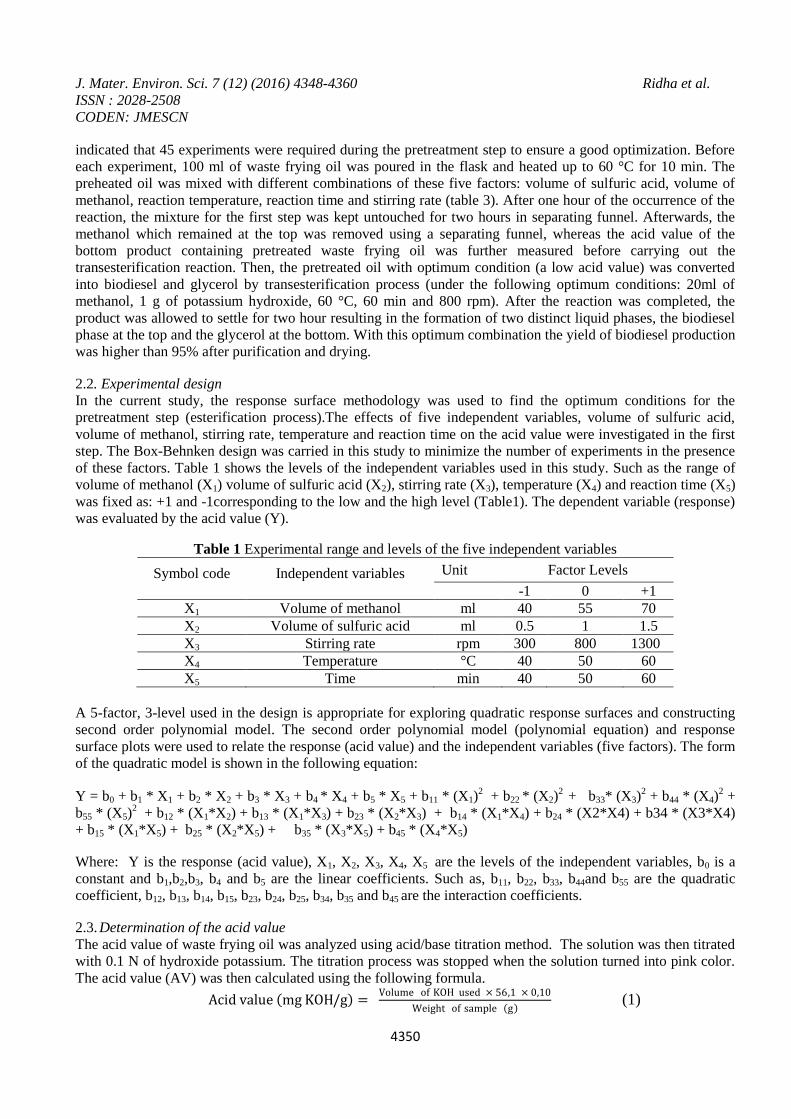
of these factors. Table 1 shows the levels of the independent variables used in this study. Such as the range of
volume of methanol (X1) volume of sulfuric acid (X2), stirring rate (X3), temperature (X4) and reaction time (X5)
was fixed as: +1 and -1corresponding to the low and the high level (Table1). The dependent variable (response)
was evaluated by the acid value (Y).
Table 1 Experimental range and levels of the five independent variables
Symbol code Independent variables Unit Factor Levels
-1 0 +1
X1 Volume of methanol ml 40 55 70
X2 Volume of sulfuric acid ml 0.5 1 1.5
X3 Stirring rate rpm 300 800 1300
X4 Temperature °C 40 50 60
X5 Time min 40 50 60
A 5-factor, 3-level used in the design is appropriate for exploring quadratic response surfaces and constructing
second order polynomial model. The second order polynomial model (polynomial equation) and response
surface plots were used to relate the response (acid value) and the independent variables (five factors). The form
of the quadratic model is shown in the following equation:
Y = b0 + b1 * X1 + b2 * X2 + b3 * X3 + b4 * X4 + b5 * X5 + b11 * (X1)2 + b22 * (X2)
2 + b33* (X3)
2 + b44 * (X4)
2 +
b55 * (X5)2 + b12 * (X1*X2) + b13 * (X1*X3) + b23 * (X2*X3) + b14 * (X1*X4) + b24 * (X2*X4) + b34 * (X3*X4)
+ b15 * (X1*X5) + b25 * (X2*X5) + b35 * (X3*X5) + b45 * (X4*X5)
Where: Y is the response (acid value), X1, X2, X3, X4, X5 are the levels of the independent variables, b0 is a
constant and b1,b2,b3, b4 and b5 are the linear coefficients. Such as, b11, b22, b33, b44and b55 are the quadratic
coefficient, b12, b13, b14, b15, b23, b24, b25, b34, b35 and b45 are the interaction coefficients.
2.3. Determination of the acid value The acid value of waste frying oil was analyzed using acid/base titration method. The solution was then titrated
with 0.1 N of hydroxide potassium. The titration process was stopped when the solution turned into pink color.
The acid value (AV) was then calculated using the following formula.
Acid value mg KOH/g = Volume of KOH used × 56,1 × 0,10
Weight of sample g (1)
J. Mater. Environ. Sci. 7 (12) (2016) 4348-4360 Ridha et al.
ISSN : 2028-2508
CODEN: JMESCN
4351
The conversion percentage of free fatty acids (FFA) to free fatty methyl ester (FAME) was calculated using the
following formula (2).
% Conversion (conversion of FFA to FAME) = Nso − Ns
Nso (2)
Where:
Nso: free fatty acids (FFA) content at the start of reaction (%)
Ns = free fatty acids (FFA) content at the end of pretreatment step (%)
2.4. Determination of yield
The yield of biodiesel produced was calculated using the equation 3. Product yield is defined as the weight
percentage of the final product which is relative to the weight of the waste frying oil at the beginning of the
experiment.
%Yield = Weight of product (g)
Weight of raw oil (g)× 100 (3)
2.5. Purification The crude biodiesel was washed with an equal quantity of acid water with 10% and 5% phosphoric followed by
a step of hot distilled water washing. The purification step aims to remove the traces of impurities and the
catalyst. The moisture from the biodiesel was removed by a step of heating at 100-110°C for 20 min.
After that, the physicochemical properties of the purified biodiesel were determined to evaluate its quality.
2.6. Determination of physicochemical properties of pure biodiesel in the optimal conditions
In this study, the most important physicochemical parameters were determined, the acid value, saponification
value, density, viscosity, flash point, the cloud point, the water content, sulfur content, and potassium content.
The determination of these physicochemical proprieties allowed us to evaluate the quality of biodiesel derived
from the waste frying oil. The physicochemical properties of pure biodiesel are compared with those indicated
in the European standard (EN14214).
2.7. Analysis of pure biodiesel using gas chromatography-mass spectrometry (GC/MS)
Gas chromatography coupled to mass spectrometry (GC/MS) (Trace GC Ultra-Thermo Scientific-DSQ II) was
used to determine the composition of esters present in the biodiesel derived from waste frying oil. The GC was
equipped with a capillary column (30 m/0.25 μm and an internal diameter of 0.25 mm). Helium was used as the
carrier gas at a constant flow rate of 1.3ml/min. The analysis of biodiesel was carried out by dissolving 1 mg of
biodiesel in the hexane. The mixture was stirred for 15 minutes at room temperature. Then, 1 μl diluted cold
mixture was injected in the column injection. Esters content were analyzed using GC/FID; split mode of
injector, and the injector temperature was kept at 250 °C.
3. Results and discussions 3.1. Analysis of waste frying oil
The compositions of the waste frying oil are very complex. Therefore, the essential step of this study is to find
suitable methods to determine these compositions. The methylation process is one of methods can be used to
analyze its content. There are a two main step used to identify the different free fatty acids in this acidic oil.
The first step, the free fatty acids were converted into fatty acid methyl ester. The second step is the
quantification of fatty acids methyl ester (FAME) by the gas chromatography mass spectrometry (GC/MS).
After methylation, it was found that five majority compounds were detected in this oil, namely; methyl
palmitate, methyl stearate, methyl oleate, methyl linoleate and methyl linolenate (figure 1). From the below
chromatogram, the methyl palmitate appears at a retention time of 11.06 min followed by methyl stearate
(C18:0) which appeared at a retention time of 12.80 min. The next compounds are the methyl oleate (C18:1) and
methyl linoleate (C18:2) which peaks appeared at a retention time of 12.94 min and 13.32 min respectively.
Finally, methyl linolenate (C18:3) appeared at a retention time of 13.85 min (figure 1).
As the methylation process does not modify the free fatty acids composition of the raw materials. In addition,
this process converts the free fatty acids into fatty acids methyl ester by derivatization. Therefore, it could be

J. Mater. Environ. Sci. 7 (12) (2016) 4348-4360 Ridha et al.
ISSN : 2028-2508
CODEN: JMESCN
4352
concluded that there are five main components present in the waste frying oil, namely palmitic acid, stearic acid,
oleic acid, linoleic acid and linolenic acid. The free fatty compositions are summarized in the table 2.
Figure1: Chromatogram showing the quantification of FAME by gas chromatography-mass spectrometry
(GC/MS) after methylation process
Table 2: The main fatty acids composition in waste frying oil used in this study
3.2. Optimization of the pretreatment step by using an experiment design
During the pretreatment of the waste frying oil, it is difficult to determine the interactions between five
independent variables and to predict their effects on the acid value using the conventional method. For that, the
statistical and mathematical tools were required to solve this problem. Therefore, Nemrod software was used in
this work. In addition, the interactions between these factors and their influence on the response were studied by
response surface methodology (RSM) using Box-Behnken as experimental design. Then, the quadratic model
from the Box-Behnken design was used to estimate or predict the optimum conditions during the pretreatment
step. The Box-Behnken design able to minimize the number of experiments performed during this step. The
effect of these independent variables on the acid value (response) during the esterification reaction was
investigated by the analysis of the response surface contours plots. This was achieved by a mathematical model
that allowed us to trace the response surface contour plots. Consequently, several form of these contours plots
are shown in two-dimensional contour response surface plots representing the variation of the acid value during
this step (figure 2a-2j). After the analysis of these two-dimensional contour responses surface plots the optimal
conditions during the pretreatment step can be determined. The results indicated that the five factors have
significant effects on the reduction of the response, but for a specific combination. Table 3 shows that the values
of the response predicted by the model are very close to the values of the experimental response; this proves that
both values were accurate and reliable. In order to estimate the 21 unknown parameters of this model (the
general average effect, five linear effects, five quadratic effects and 10 effects resulting of the interactions), the
Box-Behnken design shows that 45 experiments should be conducted during the pretreatment step (Table 3).
Name of
fatty acid
Methyl ester (trivial name / rational
name) Structure
Acid
Composition
(%)
Palmitic acid Methyl palmitate /Methyl Hexadecanoate C16:0 15.86%
Stearic acid Methyl stearate/Methyl Octadecanoate C18:0 4.87%
Oleic acid Methyl oleate/ Methyl 9(E)
Octadecenoate C18:1 (E) 29.83%
Linoleic acid Methyl linoleate /Methyl 9(Z),12(Z)
octadecadienoate C18:2 (Z,Z) 28.85%
Linolenic acid
Methyl linolenate /Methyl
9(Z),12(Z),15(Z)- octadecadienoate C18:3 (Z,Z,Z) 2.49%

J. Mater. Environ. Sci. 7 (12) (2016) 4348-4360 Ridha et al.
ISSN : 2028-2508
CODEN: JMESCN
4353
From the analysis of the response of the surface contour plots, it has been found that the predicted lowest value
of the acid value was 3.62 mg KOH/g-oil, however the actual experimental value was 2.24 mg KOH/g-oil.
Table 3: Observed response (Y) in Box–Behnken design
Run Volume of
methanol
Volume of
sulfuric acid Stirring rate Temperature Time
Acid value
mg KOH/g-oil
mL mL rpm °C min Y experimental Y predicted
1 40 0.50 800 50 50 13.83 13.554
2 70 0.50 800 50 50 11.85 11.663
3 40 1.50 800 50 50 10.87 11.559
4 70 1.50 800 50 50 8.24 9.018
5 40 1.00 300 50 50 22.43 22.026
6 70 1.00 300 50 50 20.74 20.635
7 40 1.00 1300 50 50 12.65 13.130
8 70 1.00 1300 50 50 9.31 10.088
9 40 1.00 800 40 50 14.73 14.164
10 70 1.00 800 40 50 11.86 11.257
11 40 1.00 800 60 50 8.91 8.264
12 70 1.00 800 60 50 7.42 6.737
13 40 1.00 800 50 40 10.89 11.436
14 70 1.00 800 50 40 7.71 7.904
15 40 1.00 800 50 60 8.29 8.468
16 70 1.00 800 50 60 7.74 7.567
17 55 0.50 300 50 50 23.49 23.494
18 55 1.50 300 50 50 21.25 21.749
19 55 0.50 1300 50 50 14.35 14.347
20 55 1.50 1300 50 50 10.96 11.452
21 55 0.50 800 40 50 14.87 15.354
22 55 1.50 800 40 50 13.43 12.649
23 55 0.50 800 60 50 9.21 9.759
24 55 1.50 800 60 50 8.54 7.824
25 55 0.50 800 50 40 12.84 12.898
26 55 1.50 800 50 40 9.16 9.023
27 55 0.50 800 50 60 10.32 9.691
28 55 1.50 800 50 60 9.75 8.926
29 55 1.00 300 40 50 23.93 24.410
30 55 1.00 1300 40 50 13.43 13.634
31 55 1.00 300 60 50 18.24 18.145
32 55 1.00 1300 60 50 9.85 9.479
33 55 1.00 300 50 40 21.64 21.692
34 55 1.00 1300 50 40 10.82 10.271
35 55 1.00 300 50 60 18.77 18.340
36 55 1.00 1300 50 60 11.35 10.319
37 55 1.00 800 40 40 11.23 10.852
38 55 1.00 800 60 40 8.17 8.382
39 55 1.00 800 40 60 10.78 11.940
40 55 1.00 800 60 60 2.24 3.990
41 55 1.00 800 50 50 6.34 6.268
42 55 1.00 800 50 50 6.23 6.268
43 55 1.00 800 50 50 6.16 6.268
44 55 1.00 800 50 50 6.32 6.268
45 55 1.00 800 50 50 6.29 6.268

J. Mater. Environ. Sci. 7 (12) (2016) 4348-4360 Ridha et al.
ISSN : 2028-2508
CODEN: JMESCN
4354
3.3. Fitting of the model
The polynomial equation with the statistical analysis (surface plots) allows us to establish the proportionality
between the response and the independent variables, in order to evaluate the effect of these independent factors
on the acid value. It is required to analyze the significance and relevance of the model through the analysis of
variance. Once the modeling and the optimization step have been determined, it is possible to judge the quality
of the fitted model. For this, the statistical analysis of this model lead to analysis of variance (ANOVA) (Table
4). The model confirmed that the adjustment was significant and clear. Therefore the sum of squares due to
residues is less than the sum of squares due to regression. Moreover, the sum of squares due to error is very
small compared with the total sum. From these results it can be confirmed that the model seems to be well
adjusted.
Table 4: Analysis of variance (ANOVA)
Source of
variation
Sum of squares Degrees of
freedom
mean square Ratio Significance
Regression 1.16271E+0003 20 5.81354E+0001 10825.9605 ***
Residual 1.40029E+0001 24 5.83457E-0001
Validity 1.39814E+0001 20 6.99075E-0001 130.1815 ***
Error 2.14800E-0002 4 5.37000E-0003
Total 1.17671E+0003 44
(***) p-value significant at 0.1% level
Another thorough study can be performed to confirm the adjustment of this model; it is done to determine the
values of the determination coefficient (R2) and the adjusted coefficient (R
2 adj.). The results indicated
that these coefficients are very high and close to one previously found (R2= 0.988) and (R
2 adj = 0.978)
(Table 5). In this study, the high value of the coefficient determined (R2
> 98%) indicates the reliability of the
design. In addition, the smaller p-values (lower than 0.05), which further strengthened the reliability of the
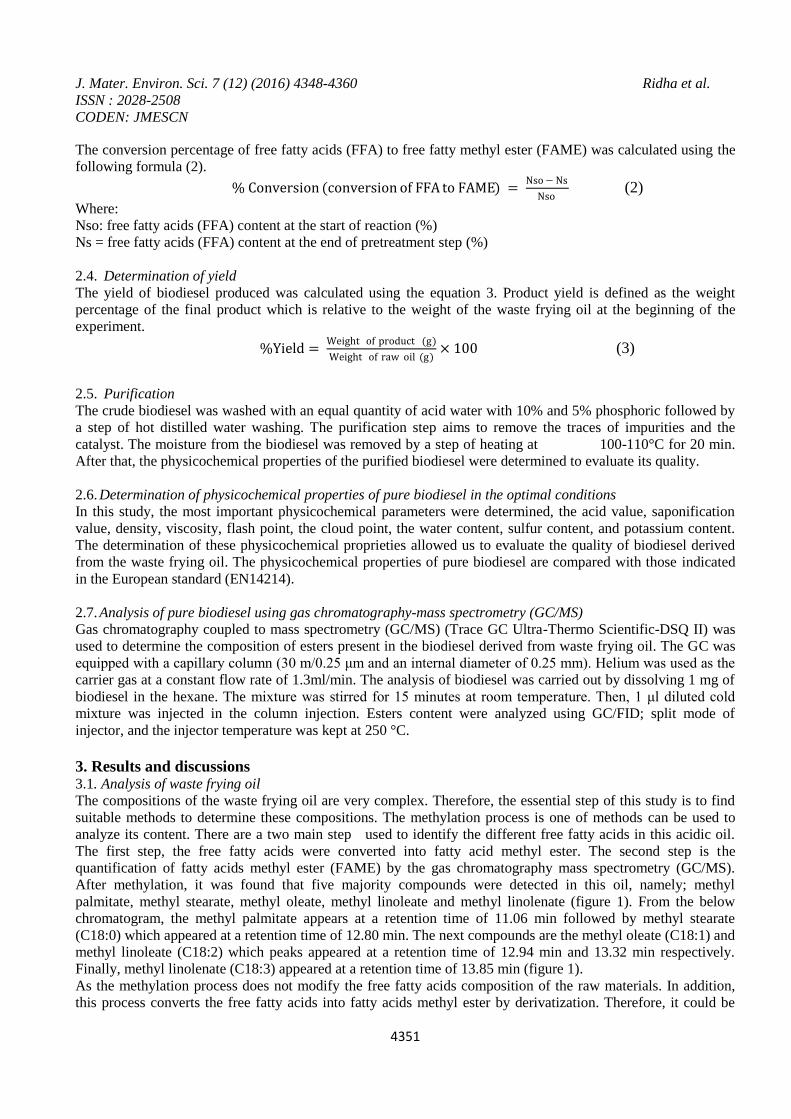
models. Finally, the results validated the model. The significance of the coefficients (linear,
quadratic and interaction) of the model was determined by applying the t-test and p-values of each of them as
summarized in table 5. Since, the p-values of the coefficients were higher than 5% (p > 0.05), it implies that
they are not significant. The significant of the level was estimated by three p-values: *** P <0.001 (0.1%); ** P
<0.01 (1%) and * P <0.05 (5%). The table 5 shows that the p-values of the model were always lower than 0.05,
which indicated that the model was suitable and relevant to be developed in this study. From these results, the
linear and quadratic effect between the different factors was considered significant, due to their low p-values
which did not exceed 5% (Table 5). A positive sign of coefficient indicates a synergistic effect while a negative
term indicates an antagonistic effect upon the acid value [33]. Therefore, the linear effect coefficient can be
deduced and the five factors have an antagonistic effect for the reduction of the acid value during the
pretreatment step. Table 5 depicted that the stirring rate had a significant linear effect, followed by temperature,
sulfuric acid concentration, methanol concentration and finally the reaction time. In terms of quadratic effect, all
factors have significant influences on the response due to p < 0.001. However, the interaction effect between the
reaction time and temperature was more significant which was confirmed by the negative interaction coefficient
and the low p-value level at 0.1%.
Table 5: Regression coefficients of predicted full quadratic model for the first step variables
Standard deviation of the response 0.073
R2 0.988
R2adj 0.978
J. Mater. Environ. Sci. 7 (12) (2016) 4348-4360 Ridha et al.
ISSN : 2028-2508
CODEN: JMESCN
4355
Name Coefficient F.Inflation Standard
Deviation T.exp. Signif. %
b0 6.268 0.033 191.26 ***
b1 -1.108 1.00 0.018 -60.49 ***
b2 -1.160 1.00 0.018 -63.32 ***
b3 -4.861 1.00 0.018 -265.32 ***
b4 -2.605 1.00 0.018 -142.19 ***
b5 -0.826 1.00 0.018 -45.10 *** b11 1.945 1.27 0.026 75.70 ***
b22 3.236 1.27 0.026 125.95 ***
b33 8.257 1.27 0.026 321.37 ***
b44 1.892 1.27 0.026 73.66 ***
b55 0.631 1.27 0.026 24.55 ***
b12 -0.162 1.00 0.037 -4.44 *
b13 -0.412 1.00 0.037 -11.26 ***
b23 -0.288 1.00 0.037 -7.85 **
b14 0.345 1.00 0.037 9.42 **
b24 0.192 1.00 0.037 5.25 **
b34 0.528 1.00 0.037 14.40 ***
b15 0.658 1.00 0.037 17.94 ***
b25 0.777 1.00 0.037 21.22 ***
b35 0.850 1.00 0.037 23.20 ***
b45 -1.370 1.00 0.037 -37.39 ***
(*) p-value significant at 5% level; (**) p-value significant at 1% level; (***) p-value significant at 0.1% level.
3.4. The contour plots and response surface analysis
The effects of the interaction between these factors on the acid value are presented in two-dimensional contour
response surface plots (figure 2a-2j). It is useful to determine these effect types after analysis of the contour
plots. In all figures, the five factors have a significant effect on the reduction of the acid value, provided that
they are combined in a specific manner. In each two-dimensional contour response surface plots, the response
(acid value) formed an optimum contour plot. In these optimal contour plots, the pretreated waste frying oil had
an optimal acid value which is always lower than 4 mg KOH/g-oil. Consequently, in these conditions, the
probability of soap formation in the presence of a basic catalyst in the second step is negligible. It was observed
that the low volume of methanol, volume of sulfuric acid, stirring rate, reaction time and reaction temperature
had no significant effect of decreasing the acid value (figure 2a-2j). In these conditions the acid values of the
pretreated oil were always higher than the necessary limit to realize the second step. However, the response has
decreased significantly to an optimum value while increasing the value of these parameters. According to the
figures (Figure 2a-2j), the optimum response surface plots is reached when the temperature varied from 57 °C to
60 °C, the volume of methanol from 50 to 61 ml, the volume of sulfuric acid from 0.88 ml to 1.14 ml, the
stirring rate from 771 to 1035 rpm and the reaction time from 58 to 60 min. It was also observed that the
experimental optimum conditions were always located in the optimum contour plots which can be pointed out
from the model. Figure 2c shows that the amount of catalyst and solvent are important parameters as they
significantly influence the acid value, but only for a specific range. In this case, the acid value was high (8.16
mg KOH/g) at a low volume of sulfuric acid and methanol due to the poor solubility of reaction mixture (poor
interaction between catalyst and free fatty acids). Although, an enhancement solubility of mixture was observed
when the catalyst and solvent concentration increased. It is depicted that the acid value decreased steadily when
the volume of catalyst is closer to 1ml; thereafter it was practically constant. Hence the lowest acid value was
obtained at 1.02 ml of sulfuric acid and 56 ml of methanol. The results depicted that the increase of the volume
of methanol, volume of sulfuric acid, the stirring rate, temperature and reaction time contributed significantly to
the decrease of the acid value to an optimum value (3.62 mg KOH/oil). However, beyond this optimum
value, the increase of the volume of methanol, the volume of sulfuric acid and stirring rate had no significant

J. Mater. Environ. Sci. 7 (12) (2016) 4348-4360 Ridha et al.
ISSN : 2028-2508
CODEN: JMESCN
4356
effect on the reduction of the acid value, which lead to the obtention of low conversion percentages of FFA to
FAME) (figure 2a, 2b, 2c). This might be due to the antagonistic linear effect resulting in the negative
coefficients, which was very significant at 0.1% level, as well as the quadratic effect that was significant and did
not exceed 5% level (table 5). The stirring rate had the most important quadratic effect followed by the sulfuric
catalyst and the volume of methanol with low p-values (P<0.001
Figure.2a-2j: Response surface contour plots of the acid value, showing the effect operating parameters during
the pretreatment step
). In addition, it was found that the interaction effect was significant and did not exceed 1% level (table 5). One
of the parameters affecting the acid value is the reaction temperature, resulting by the negative linear coefficient
and the significant p-value (P< 0.001) (table 5). The temperature should be optimized to avoid the evaporation
of the methanol during the pretreatment step, for this, the reaction temperatures varied as follow (40 °C, 50 °C
and 60 °C). Figure 2d shows that the increasing of reaction time and temperature contributed significantly to
decrease the acid value; this is maybe due to the negative interaction coefficient between these two factors at
0.1% level (table 5). Furthermore, it was observed that at low reaction temperature and reaction time the
response was higher than the optimum predicted by the experimental design. In addition, in this case, these two

J. Mater. Environ. Sci. 7 (12) (2016) 4348-4360 Ridha et al.
ISSN : 2028-2508
CODEN: JMESCN
4357
factors have no interaction effect, which was confirmed by the contour shapes which were always parallel to the
x-axis (X5). However, the interaction effect increased by increasing the temperature and the reaction time.
Under these conditions, the interaction term can be considered significant on the reduction of the acid value due
to the low p-value which is almost less than 0.1%. The contour response surface plots indicate that 60 °C and 60
min were required to realize the pretreatment step. This affirmation was confirmed by the optimum contour
plots positions which are always taken in the vicinity of the optimal parameter values (60 °C and 60 min) (figure
2d-2j). Finally, all effects (linear, quadratic and interaction) of these five factors were significant for the
response. The stirring rate factor has the greatest quadratic effect at 0.1%. The optimum acid value may be
reached when the temperature is closer to the boiling point of methanol. The contour response surface plots are
shown in the following figure (2a-2j):
3.5. Research of the optimum conditions
After replacement of the linear, quadratic and interaction coefficient with their values (table 5), the second order
polynomial model can be changed in the following equation:
Y (X1,X2,X3,X4, X5) = 6.268 – 1.108 X1 – 1.160 X2 – 4.861 X3 – 2.605 X4 – 0.826 X5 + 1.945 (X1)2 +3.236
(X2)2
+ 8.257 (X3)2 + 1.892 (X4)
2 + 0.631 (X5)
2– 0.162 (X1*X2) – 0.412 (X1*X3) – 0.288 (X2*X3) + 0.345
(X1*X4) + 0.192 (X2*X4) + 0.528 (X3*X4) + 0.658 (X1*X5) + 0.777 (X2*X5) + 0.850 (X3*X5) –1.370 (X4*X5)
From mathematical tools, any critical point of function (Y) (each point that nullifies the partial derivatives) has
the coordinates X1, X2 and X3, X4 and X5 were solutions of the following equations system:
dy
dX 1 X1, X2, X3, X4, X5 = −1.108 + 3.89 X1 − 0.162X2– 0.412 X3 + 0.345 X4 + 0.658 X5 = 0
dy
dX 2 X1, X2, X3, X4, X5 = −1.160 − 0.162 X1 + 6.472 X2–0.288 X3 + 0.192 X4 + 0.777 X5 = 0
dy
dX 3 X1, X2, X3, X4, X5 = −4.861 + 16.514 X3– 0.412 X1–0.288 X2 + 0.528 X4 + 0.850 X5 = 0
dy
dX 4 X1, X2, X3, X4, X5 = −2.605 + 3.784 X4 + 0.345 X1 + 0.192 X2 + 0.528 X3 − 1.370 X
5= 0
dy
dX 5 X1, X2, X3, X4, X5 = −0.826 + 1.262 X5
+ 0.658 X + 0.777 X + 0.850 X3 −1.370 X = 0
The problem is to find the minimum of the multivariate function (Y) coerced to remain still in the experimental
field. The optimum response was established after the determination of the optimums encoded values X1, X2,
X3, X4 and X5, which were determined by solving the system equations by using the program Matlab. The
system equations could be writing under the following matrix form:
A*X= Constant vector (4)
Where:
A: matrix corresponding to a system
X: variable vector (X1, X2, X3, X4, X5)
Constant vector (-1.108; -1.160; - 4.861; - 2.605; - 0.826)
To solve this system, it is necessary to determine the inverse matrix (A-1
) by using the Matlab program. Finally,
the equation number (4) can be written as follows: inverse matrix determination
A-1
*A* X=A-1
*constant vector (5)
The results show that this equations system has a single solution, given as follow:
X1= 0.0873; X2= 0.0806; X3= 0.210; X4= 0.988; X5= 0.988
The results noticed that these encoded values were located in the optimum contour surface plots of the acid
value. The replacement of these encoded factors in the second order polynomial model can give the optimum
response predicted by the model at this critical point.
J. Mater. Environ. Sci. 7 (12) (2016) 4348-4360 Ridha et al.
ISSN : 2028-2508
CODEN: JMESCN
4358
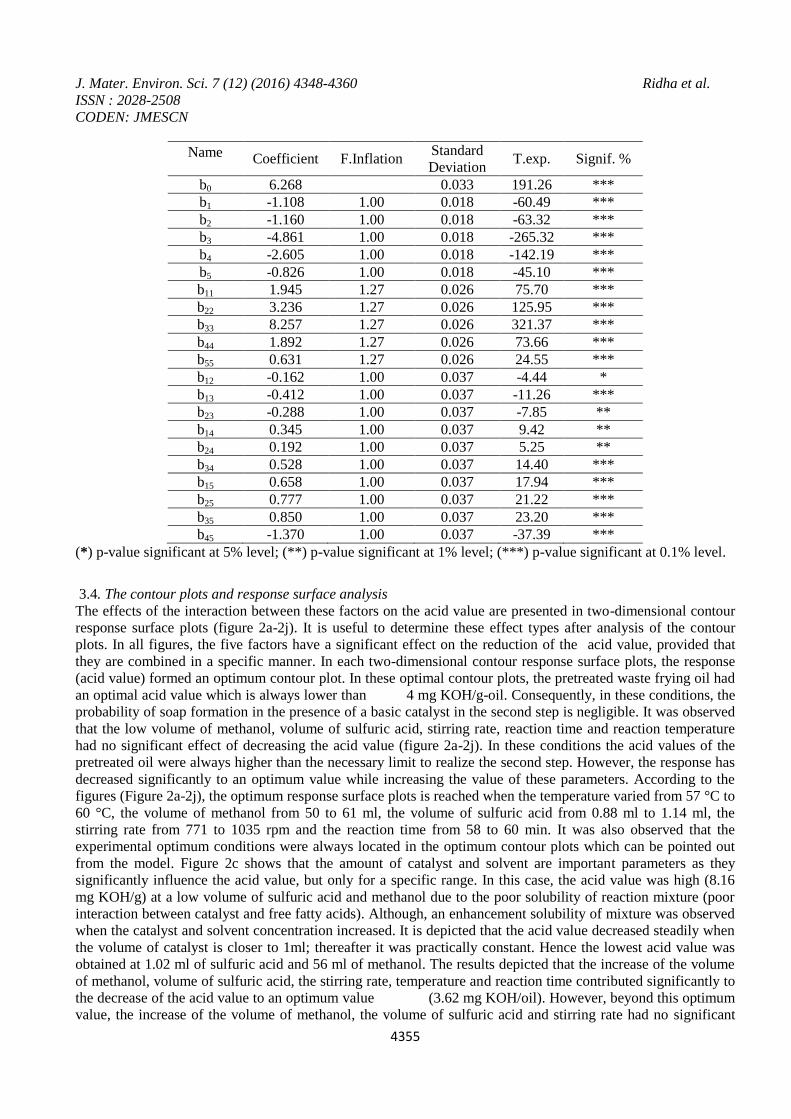
Y (X1= 0.0873; X2= 0.0806; X3= 0.210; X4= 0.988; X5=0.988) = 3.99 mg KOH/g-oil.
This study showed that the second order polynomial model appears correctly the studied phenomenon. It was
found that the optimal experimental conditions, which minimize the acid value of the waste frying oil acid was
obtained for the following coded levels: X1= 0.0873; X2= 0.0806; X3= 0.210; X4= 0.988; X5= 0.988,
from these encoded levels, the five factors take over these values (table 6):
Table 6: The optimum condition predicted by the Box-Behnken design
Encoded levels Factors Values
X1 Volume of methanol 56 mL
X2 Volume of sulfuric acid 1.02 mL
X3 Stirring rate 905 rpm
X4 Temperature 60 °C
X5 Time 60 min
Y (X1, X2, X3, X4,
X5)
Response 3.99 mg
KOH/g-oil
4. Characteristics of produced biodiesel obtained in the optimum conditions 4.1. Physicochemical properties of purified biodiesel obtained in the optimum conditions
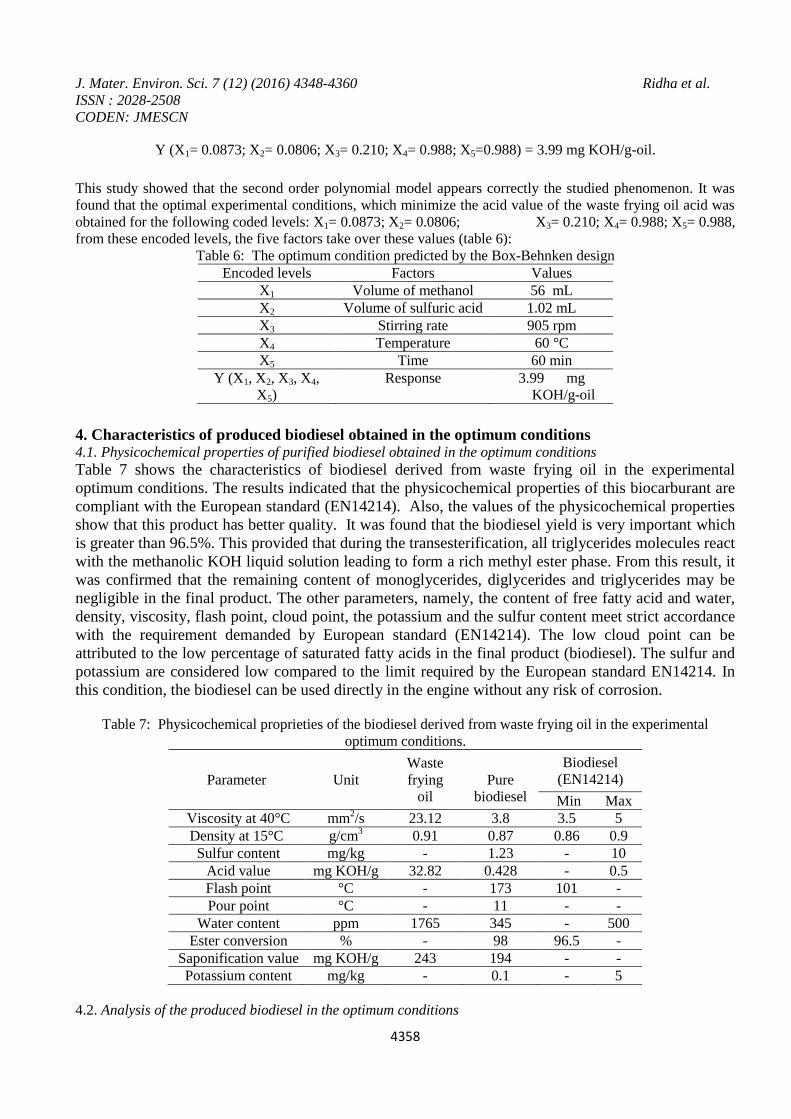
Table 7 shows the characteristics of biodiesel derived from waste frying oil in the experimental
optimum conditions. The results indicated that the physicochemical properties of this biocarburant are
compliant with the European standard (EN14214). Also, the values of the physicochemical properties
show that this product has better quality. It was found that the biodiesel yield is very important which
is greater than 96.5%. This provided that during the transesterification, all triglycerides molecules react
with the methanolic KOH liquid solution leading to form a rich methyl ester phase. From this result, it
was confirmed that the remaining content of monoglycerides, diglycerides and triglycerides may be
negligible in the final product. The other parameters, namely, the content of free fatty acid and water,
density, viscosity, flash point, cloud point, the potassium and the sulfur content meet strict accordance
with the requirement demanded by European standard (EN14214). The low cloud point can be
attributed to the low percentage of saturated fatty acids in the final product (biodiesel). The sulfur and
potassium are considered low compared to the limit required by the European standard EN14214. In
this condition, the biodiesel can be used directly in the engine without any risk of corrosion.
Table 7: Physicochemical proprieties of the biodiesel derived from waste frying oil in the experimental
optimum conditions.
Parameter Unit
Waste
frying
oil
Pure
biodiesel
Biodiesel
(EN14214)
Min Max
Viscosity at 40°C mm2/s 23.12 3.8 3.5 5
Density at 15°C g/cm3 0.91 0.87 0.86 0.9
Sulfur content mg/kg - 1.23 - 10
Acid value mg KOH/g 32.82 0.428 - 0.5
Flash point °C - 173 101 -
Pour point °C - 11 - -
Water content ppm 1765 345 - 500
Ester conversion % - 98 96.5 -
Saponification value mg KOH/g 243 194 - -
Potassium content mg/kg - 0.1 - 5
4.2. Analysis of the produced biodiesel in the optimum conditions
J. Mater. Environ. Sci. 7 (12) (2016) 4348-4360 Ridha et al.
ISSN : 2028-2508
CODEN: JMESCN
4359
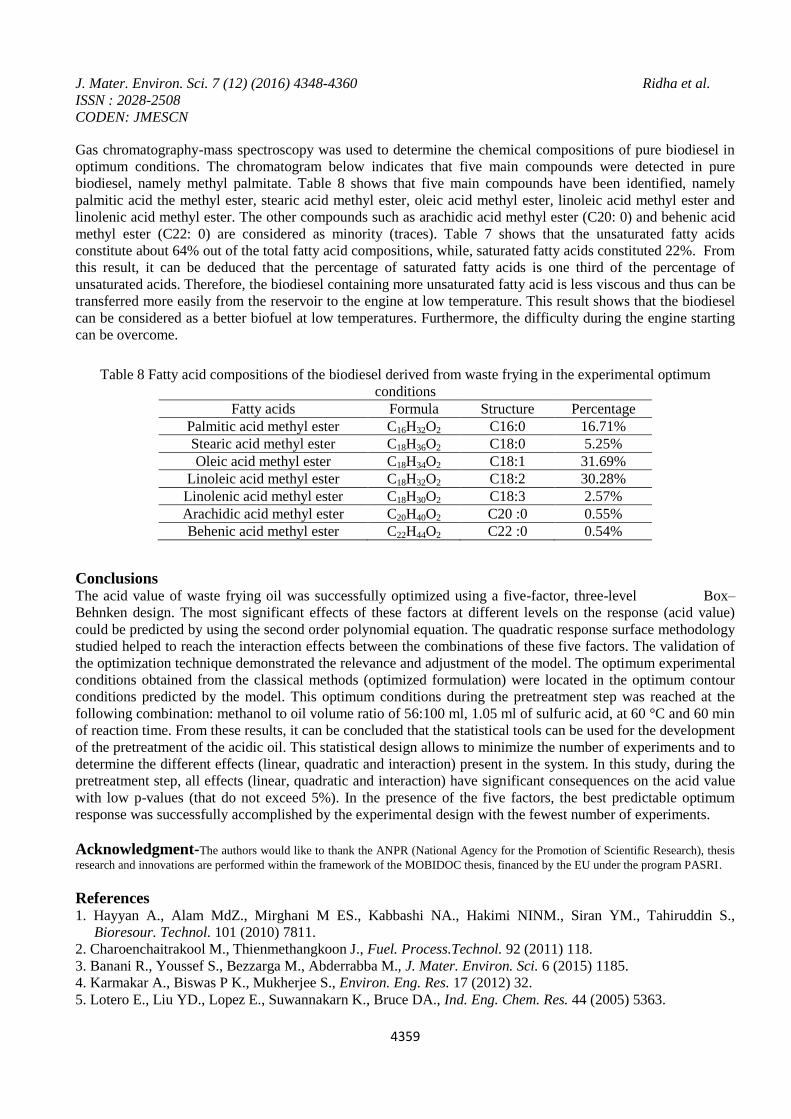
Gas chromatography-mass spectroscopy was used to determine the chemical compositions of pure biodiesel in
optimum conditions. The chromatogram below indicates that five main compounds were detected in pure
biodiesel, namely methyl palmitate. Table 8 shows that five main compounds have been identified, namely
palmitic acid the methyl ester, stearic acid methyl ester, oleic acid methyl ester, linoleic acid methyl ester and
linolenic acid methyl ester. The other compounds such as arachidic acid methyl ester (C20: 0) and behenic acid
methyl ester (C22: 0) are considered as minority (traces). Table 7 shows that the unsaturated fatty acids
constitute about 64% out of the total fatty acid compositions, while, saturated fatty acids constituted 22%. From
this result, it can be deduced that the percentage of saturated fatty acids is one third of the percentage of
unsaturated acids. Therefore, the biodiesel containing more unsaturated fatty acid is less viscous and thus can be
transferred more easily from the reservoir to the engine at low temperature. This result shows that the biodiesel
can be considered as a better biofuel at low temperatures. Furthermore, the difficulty during the engine starting
can be overcome.
Table 8 Fatty acid compositions of the biodiesel derived from waste frying in the experimental optimum
conditions
Fatty acids Formula Structure Percentage
Palmitic acid methyl ester C16H32O2 C16:0 16.71%
Stearic acid methyl ester C18H36O2 C18:0 5.25%
Oleic acid methyl ester C18H34O2 C18:1 31.69%
Linoleic acid methyl ester C18H32O2 C18:2 30.28%
Linolenic acid methyl ester C18H30O2 C18:3 2.57%
Arachidic acid methyl ester C20H40O2 C20 :0 0.55%
Behenic acid methyl ester C22H44O2 C22 :0 0.54%
Conclusions The acid value of waste frying oil was successfully optimized using a five-factor, three-level Box–
Behnken design. The most significant effects of these factors at different levels on the response (acid value)
could be predicted by using the second order polynomial equation. The quadratic response surface methodology
studied helped to reach the interaction effects between the combinations of these five factors. The validation of
the optimization technique demonstrated the relevance and adjustment of the model. The optimum experimental
conditions obtained from the classical methods (optimized formulation) were located in the optimum contour
conditions predicted by the model. This optimum conditions during the pretreatment step was reached at the
following combination: methanol to oil volume ratio of 56:100 ml, 1.05 ml of sulfuric acid, at 60 °C and 60 min
of reaction time. From these results, it can be concluded that the statistical tools can be used for the development
of the pretreatment of the acidic oil. This statistical design allows to minimize the number of experiments and to
determine the different effects (linear, quadratic and interaction) present in the system. In this study, during the
pretreatment step, all effects (linear, quadratic and interaction) have significant consequences on the acid value
with low p-values (that do not exceed 5%). In the presence of the five factors, the best predictable optimum
response was successfully accomplished by the experimental design with the fewest number of experiments.
Acknowledgment-The authors would like to thank the ANPR (National Agency for the Promotion of Scientific Research), thesis
research and innovations are performed within the framework of the MOBIDOC thesis, financed by the EU under the program PASRI.
References 1. Hayyan A., Alam MdZ., Mirghani M ES., Kabbashi NA., Hakimi NINM., Siran YM., Tahiruddin S.,
Bioresour. Technol. 101 (2010) 7811.
2. Charoenchaitrakool M., Thienmethangkoon J., Fuel. Process.Technol. 92 (2011) 118.
3. Banani R., Youssef S., Bezzarga M., Abderrabba M., J. Mater. Environ. Sci. 6 (2015) 1185.
4. Karmakar A., Biswas P K., Mukherjee S., Environ. Eng. Res. 17 (2012) 32.
5. Lotero E., Liu YD., Lopez E., Suwannakarn K., Bruce DA., Ind. Eng. Chem. Res. 44 (2005) 5363.
J. Mater. Environ. Sci. 7 (12) (2016) 4348-4360 Ridha et al.
ISSN : 2028-2508
CODEN: JMESCN
4360
6. Chongkhong S., Tongurai C., Chetpattananondh P., Bunyakan C., Biomass.Bioener. 31 (2007) 568.
7. Dwivedi G., Jain S., Sharma MP., J. Mater. Environ. Sci. 4 (2013) 447.
8. Banani R., Ayadi M., Ben hassine D., Snoussi Y., Bezzarga M., Abderrabba M., J. Chem. Pharm. Res. 6
(2014) 915.
9. Wang Y., Ou S., Liu P., Xue F., Tang S., J. Mol. Catal .A-Chem. 252 (2006) 112.
10. Corro G., Tellez N., Ayala E., Marinez-Ayala A., Fuel. 89 (2010) 2821.
11. Lam MK., Lee KT., Mohamed AR., Biotechnol Adv. 28 (2010) 518.
12. Refaat AA., Attia NK., Sibak HA., El Sheltawy ST., El Diwani G I., Int.J.Environ.Sci.Tech. 5 (2008) 82.
13. Ahmad A L., Mat Yasin NH., Derek CJC., Lim J K.., Renew.Sustain.Energy.Rev. 15 (2011) 593.
14. Zhang Y., Dube MA., McLean DD., Kates M., Bioresour.Technol. 89 (2003) 16.
15. Berchmans HJ., Hirata S., Bioresour.Technol. 99 (2008) 1721.
16. Goyal P., Sharma, MP., Jain S., J.Mater.Environ.Sci. 6 (2012) 1100.
17. Mathiyazhagan M., Ganapathi A., Jaganath B., Renganayaki N., Sasireka N.. Sasireka, Int. J. Chem.
Environ. Eng. 2 (2011) 122.
18. Bojan SG., Durairaj SK., J. Sustain. Energy. Environ. 3 (2012) 66.
19. Canakci M., Van Gerpen J., Am.Soc.Agric.Eng (ASAE). 44 (2001) 1436.
20. Gnanaprakasam A., Sivakumar VM., Surendhar A., Thirumarimurugan M., Kannadasan T., J. Energy.
(2013) 10.
21. Canakci M., Van Gerpen J., Am.Soc.Agric.Eng. 46 (2003) 955.
22. Demirbas A., Energy.Convers.Manage. 50 (2009) 927.
23. Van Gerpen J., Fuel.Process.Technol. 86 (2005) 1107.
24. Bhosle BM., Subramanian R., J. Food.Eng. 69 (2005) 494.
25. Veljkovic VB., Lakicevic SH., Stamenkovic OS., Todorovi ZB., Lazic ML., Fuel 85 (2006) 2675.
26. Ramadhas AS., Jayaraj S., Muraleedharan C., Fuel. 84 (2004) 340.
27. Davim J P., Mata F., Int. J. Adv. Manuf. Technol. 26 (2005) 323.
28. Ragonese R., Macka M., Hughes J., Petocz P., J. Pharm. Biomed. Anal. 27 (2002) 1007.
29. Bong-yul T., Bong-sik T., Young-ju K P., Young-hun Y., Gil-ho M., J. Ind. Eng. Chem. 28 (2015) 315.
30. Aslan N., Cebeci Y., Fuel. 86 (2007) 97.
31. Manohar M., Joseph J., Selvaraj T., Sivakumar D., Int. J. Sci. Eng. Res. 4 (2013) 642.
32. Mujtaba A., Mushir A., Kohli K., Chem. Eng. Res. Des. 92 (2014) 165.
33. Prakash Maran J., Manikandan S., Thirugnanasambandham K., Vigna Nivetha C., Dinesh R., Carbohyd.
Polym. 92 (2013) 611.
(2016) ; http://www.jmaterenvironsci.com/