Embed Size (px)
Citation preview
[ ACQUITY UPLC SYSTem ACCeSSorIeS ]
[ ]1
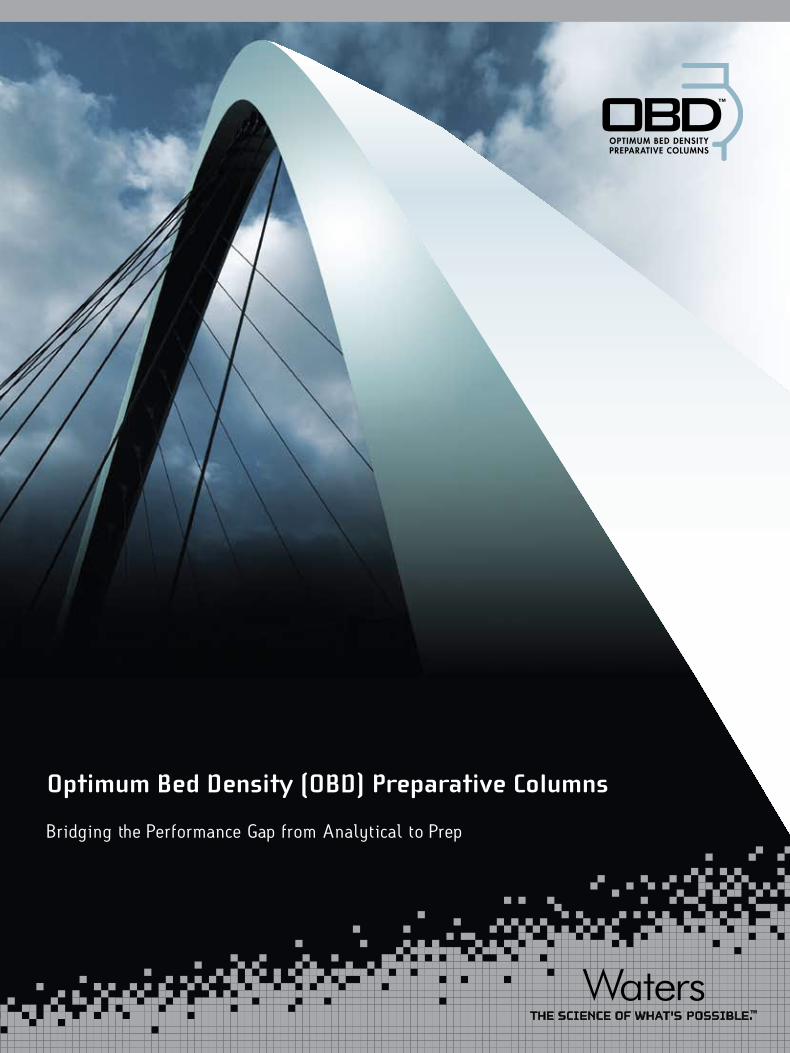
Optimum Bed Density (OBD) Preparative Columns
Bridging the Performance Gap from Analytical to Prep
“Using XBridge™ Prep OBD™ columns has significantly reduced our column spend for high pH work. T he
robustness of the XBridge material enables good column lifetimes and keeps the price per purification low. Also,
this range of columns has serviced the group well for the majority of the samples run in 2007.”
Mandy Crowther
Associate Principal Scientist, Cancer and Infection Research Area AstraZeneca R&D, Alderley Park, UK
“Being able to load more compound per injection is valuable for saving time without sacrificing purity. Mass recoveries using the Prep OBD Columns are excellent and
are higher than other columns I have used. Even after 1,000+ injections, the columns are still performing as they did fresh out of the box.”
Michael J. Mayer, pH.D. Senior Research Scientist II
Discovery Services - Medicinal Chemistry AMRI, Albany, NY, USA (Contract Laboratory)
Peptide Separation Technology
Optimum Bed Density (OBD) Preparative Columns
oPTImUm Bed denSITY (oBd) PrePArATIve CoLUmn deSIgn
[ ]4
Column PerformanC e—Ident If yIng t he P roblem
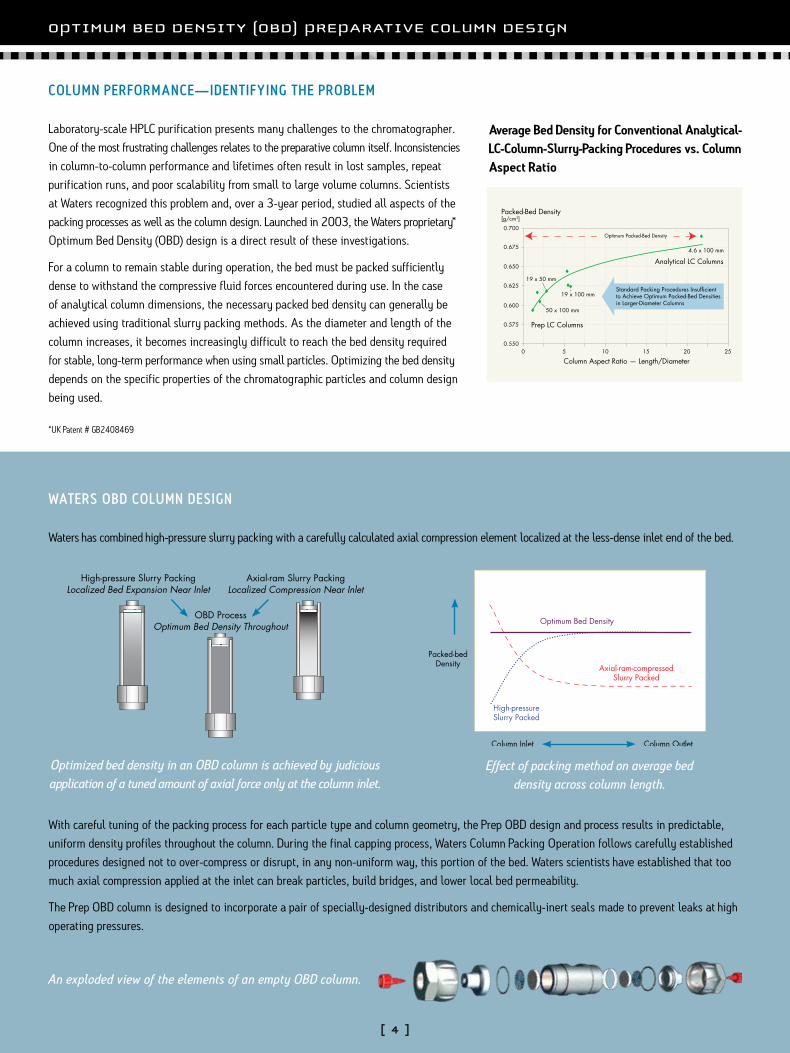
Laboratory-scale HPLC purification presents many challenges to the chromatographer. One of the most frustrating challenges relates to the preparative column itself. Inconsistencies in column-to-column performance and lifetimes often result in lost samples, repeat purification runs, and poor scalability from small to large volume columns. Scientists at Waters recognized this problem and, over a 3-year period, studied all aspects of the packing processes as well as the column design. Launched in 2003, the Waters proprietary* Optimum Bed Density (OBD) design is a direct result of these investigations.
For a column to remain stable during operation, the bed must be packed sufficiently dense to withstand the compressive fluid forces encountered during use. In the case of analytical column dimensions, the necessary packed bed density can generally be achieved using traditional slurry packing methods. As the diameter and length of the column increases, it becomes increasingly difficult to reach the bed density required for stable, long-term performance when using small particles. Optimizing the bed density depends on the specific properties of the chromatographic particles and column design being used.
4
0.550
0.575
0.600
0.625
0.650
0.675
0.700
Column Aspect Ratio — Length/Diameter
4.6 x 100 mm
19 x 100 mm
19 x 50 mm
50 x 100 mm
Standard Packing Procedures Insufficientto Achieve Optimum Packed-Bed Densitiesin Larger-Diameter Columns
Optimum Packed-Bed Density
Packed-Bed Density[g/cm3]
2520151050
Prep LC Columns
Analytical LC Columns
Average Bed Density for Conventional Analytical- LC-Column-Slurry-Packing Procedures vs. Column Aspect Ratio
Wat ers obd Column desIgn
Waters has combined high-pressure slurry packing with a carefully calculated axial compression element localized at the less-dense inlet end of the bed.
With careful tuning of the packing process for each particle type and column geometry, the Prep OBD design and process results in predictable, uniform density profiles throughout the column. During the final capping process, Waters Column Packing Operation follows carefully established procedures designed not to over-compress or disrupt, in any non-uniform way, this portion of the bed. Waters scientists have established that too much axial compression applied at the inlet can break particles, build bridges, and lower local bed permeability.
The Prep OBD column is designed to incorporate a pair of specially-designed distributors and chemically-inert seals made to prevent leaks at high operating pressures.
An exploded view of the elements of an empty OBD column.
Optimized bed density in an OBD column is achieved by judicious application of a tuned amount of axial force only at the column inlet.
Effect of packing method on average bed density across column length.
High-pressure Slurry PackingLocalized Bed Expansion Near Inlet
OBD ProcessOptimum Bed Density Throughout
Axial-ram Slurry PackingLocalized Compression Near Inlet
Packed-bedDensity Axial-ram-compressed
Slurry Packed
High-pressureSlurry Packed
Optimum Bed Density
Column Outlet Column Inlet
*UK Patent # GB2408469
BrIdgIng The PerformAnCe gAP from AnALYTICAL To PreP
[ ]5
Column stabIl It y and relIabIl It y— long, P redICtable l Ifet Imes
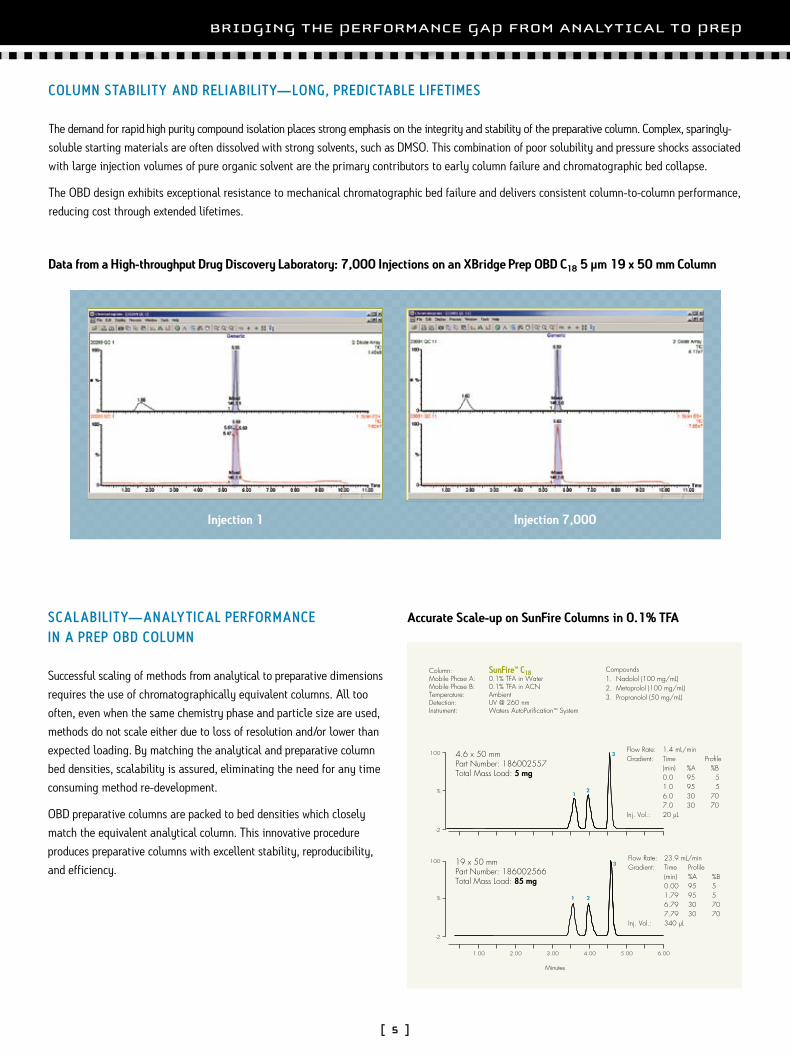
The demand for rapid high purity compound isolation places strong emphasis on the integrity and stability of the preparative column. Complex, sparingly-soluble starting materials are often dissolved with strong solvents, such as DMSO. This combination of poor solubility and pressure shocks associated with large injection volumes of pure organic solvent are the primary contributors to early column failure and chromatographic bed collapse.
The OBD design exhibits exceptional resistance to mechanical chromatographic bed failure and delivers consistent column-to-column performance, reducing cost through extended lifetimes.
Data from a High-throughput Drug Discovery Laboratory: 7,000 Injections on an XBridge Prep OBD C18 5 µm 19 x 50 mm Column
Injection 1 Injection 7,000
Accurate Scale-up on SunFire Columns in 0.1% TFA
Compounds1. Nadolol (100 mg/mL)2. Metoprolol (100 mg/mL)3. Propranolol (50 mg/mL)
1.00 2.00 3.00 4.00 5.00 6.00
1 2
3
12
3
-2
100
%
-2
100
%
Column: SunFire™ C18 Mobile Phase A: 0.1% TFA in WaterMobile Phase B: 0.1% TFA in ACNTemperature: AmbientDetection: UV @ 260 nmInstrument: Waters AutoPurification™ System
Flow Rate: 1.4 mL/minGradient: Time Profile (min) %A %B 0.0 95 5 1.0 95 5 6.0 30 70 7.0 30 70Inj. Vol.: 20 µL
4.6 x 50 mmPart Number: 186002557Total Mass Load: 5 mg
Flow Rate: 23.9 mL/minGradient: Time Profile (min) %A %B 0.00 95 5 1.79 95 5 6.79 30 70 7.79 30 70Inj. Vol.: 340 µL
19 x 50 mmPart Number: 186002566Total Mass Load: 85 mg
Minutes
sCalabIl It y—analyt ICal PerformanC e In a P reP obd Column
Successful scaling of methods from analytical to preparative dimensions requires the use of chromatographically equivalent columns. All too often, even when the same chemistry phase and particle size are used, methods do not scale either due to loss of resolution and/or lower than expected loading. By matching the analytical and preparative column bed densities, scalability is assured, eliminating the need for any time consuming method re-development.
OBD preparative columns are packed to bed densities which closely match the equivalent analytical column. This innovative procedure produces preparative columns with excellent stability, reproducibility, and efficiency.
met hod dev eloPment flexIbIl It y—t he unIv ersal famIly of Columns
The development route to a final, robust LC method may require investigation of many selectivity tools, such as bonded ligands, solvent type, modifiers, temperature, and most importantly, pH. This route is complicated further by the fact that modern column chemistries are usually designed to excel in only a limited combination of these conditions, making the selection of the most suitable column extremely difficult.
The XBridge family of columns is designed to eliminate this compromise and deliver the flexibility to work under any mobile phase, temperature, and pH conditions, thus speeding up the process to an optimum and rugged final method.
a mIlestone In P reParat Iv e ChromatograPhy
First introduced in 1999 in XTerra® columns, Waters patented organic/inorganic Hybrid Particle Technology [HPT] surmounted significant limitations of silica-based reversed-phase packing materials, particularly their hydrolytic instability at high pH. In 2005, second-generation HPT, branded as BEH Technology™, embodied in new ACQUITY UPLC® BEH columns and in XBridge HPLC columns, marked a milestone in chromatography.
Patented BEH Technology hybrid particles, coupled with the OBD column design, provide reliable solutions to the most challenging purification problems.
XBridge preparative columns define the benchmark for HPLC purification chromatographic performance and consistency.
BEH Technology synthesis creates particles that ensure extreme column performance and long column lifetime under harsh operating conditions. These particles (see figure on right) are prepared from two high purity monomers: tetraethoxysilane [TEOS] and bis(triethoxysilyl)ethane [BTEE, which incorporates a pre-formed ethylene bridge].
XBrIdge hYBrId PArTICLe CoLUmnS
[ ]6
Anal. Chem. 2003, 75, 6781-6788
Tetraethoxysilane(TEOS)
Polyethoxysilane(BPEOS)
Bis(triethoxysilyl)ethane(BTEE)
+4
Si
EtO
EtO OEtEtO
Si
E tOE tO
EtO
Si
OEt
OEt
OEt
Ethylene Bridgesin Silica Matrix
Si
E tO
O
C H2 CH2
CH2
CH2
Si O Si
E tO
OE t
Si
O
O
OEt
Si
O
SiOO
Et
OOO
Et
E t Et n
*Patent No. 6,686,035 B2
BEH Technology Particle Synthesis
XBridge Column Characteristics
Chemistry Ligand Density
Carbon Load
pH Range
Pore Diameter
Surface Area
3.1 µmol/m2 18% 1-12 135 Å 185 m2/g
3.2 µmol/m2 13% 1-12 135 Å 185 m2/g
3.3 µmol/m2 17% 2-11 135 Å 185 m2/g
3.0 µmol/m2 15% 1-12 135 Å 185 m2/g
O Si
O
O
O SiO
O
O SiO
O
O Si
CHPolar Group
3
CH3
O Si
O
O
O SiO
O
O SiO
O
O Si
CHPolar Group
3
CH3
O Si
O
O
O SiO
O
O SiO
O
O Si
CHPolar Group
3
CH3
O Si
O
O
O SiO
O
O SiO
O
O Si
CHPolar Group
3
CH3
Trifunctional C18
Trifunctional C8
Monofunctional Embedded Polar Group (Shield RP18)
Trifunctional C6 Phenyl
a Part ICle desIgned for PurIf ICat Ion
Preparative packing materials are routinely offered with a much wider particle size distribution than the equivalent analytical particle. While this approach does reduce the cost of material manufacturing, the chromatographic performance is almost certainly compromised.
XBridge Prep packing materials are fully optimized to deliver maximum efficiency and the highest loadability at the lowest possible back pressures. These attributes allow the purification chemist the flexibility to choose the best combination of particle size and column dimension to easily purify even the most complex of samples.
XBridge Prep OBD columns provide the flexibility required for fast purification method development. Wide pH operating range and high loadability have ensured that XBridge columns provide reliable solutions to the most challenging purification problems.
PUrIfICATIon meThod fLeXIBILITY
[ ]7
0.00 2.00 4.00 6.00
1 2
3
45
8.00 10.00 12.00 14.00 16.00 18.00 20.00
0.00 2.00 4.00 6.00
1 2
3
45
8.00 10.00 12.00 14.00 16.00 18.00 20.00
XTerra Prep MS C18, 19 x 50 mm, 5 µmPart Number: 186001930Injection Volume: 660 µLTotal Mass Load: 198 mgMaximum Backpressure: 1000 psi
XBridge Prep C18, 19 x 50 mm, 5 µmPart Number: 186002977Injection Volume: 660 µLTotal Mass Load: 198 mgMaximum Backpressure: 700 psi
Mobile Phase A: 0.1% DEA in waterMobile Phase B: 0.1% DEA in acetonitrileSample Concentration: 300 mg/mL in DMSOInstrument: AutoPurification SystemDetection: UV @ 260 nm
Compounds1. Labetolol (50 mg/mL)2. Quinine (50 mg/mL)3. Diltiazem (50 mg/mL)4. Verapamil (100 mg/mL)5. Amitriptyline (50 mg/mL)
Minutes
Flow Rate: 23.8 mL/minGradient: Time Profile (min) %A %B 0.0 95 5 1.79 95 5 6.79 5 95 7.79 5 95
Flow Rate: 23.8 mL/minGradient: Time Profile (min) %A %B 0.0 95 5 1.79 95 5 6.79 5 95 7.79 5 95
Maximum Efficiency/30% Lower Backpressure
Inj . #1
Inj . #999
Inj . #1999
Inj . #2999
Low pH(0.2% Formic Acid)
V 0B A
N
B = baseA = acidN = neutral V 0 BA
N
High pH(0.2% Ammonium Hydroxide)
Minutes
0.50 1.00 1.50 2.00 2.50 3.00 3.50 4.00 4.50 5.00
Inj . #3999
Inj . #4799
Minutes
0.50 1.00 1.50 2.00 2.50 3.00 3.50 4.00 4.50 5.00
Inj . #2
Inj . #1000
Inj . #2000
Inj . #3000
Inj . #4000
Inj . #4800
Chromatograms run at alternating high and low pH for each injection show excellent stability after thousands of injections with no change in peak shape or retention.
reaChIng a neW lev el In P reParat Iv e Column durabIl It y
Poor lifetimes and the lack of consistent performance of preparative columns have been a significant element of concern to the purification chemist. Cost per purification needs to be reduced, in addition, the loss of samples due to early column failure must be minimized. After many years of research into column packing and design, Waters introduced the proprietary Optimum Bed Density (OBD) preparative column designs, effectively answering these concerns. This format is now recognized in the industry as delivering the most stable efficient and reproducible preparative columns.
The combination of the rugged XBridge packings and the OBD design takes preparative column performance to a new level, ensuring direct scalability, maximum efficiencies, and the longest column lifetimes.
XBridge Columns Exhibit Unsurpassed Stability with Alternating High and Low pH Mobile Phases
set t Ing t he neW standard for Peak shaPe
SunFire columns set the standard for state-of-the-art silica-based HPLC columns. By combining new bonding and endcapping technologies with a perfectly controlled particle synthesis route, Waters has developed two phases with superior peak shape performance. SunFire Prep C18 and C8 columns provide symmetrical peaks for improved resolution and purification of acidic, neutral, and basic compounds at low and intermediate pH ranges.
stabIl It y In loW ph mobIle Phase
Silica-based columns have traditionally been the first choice for routine purification methods. Many different phases are commercially available, but few have been specifically designed to meet the demands of the purification laboratory. At the low pH range of 2-3, the primary mode of column failure relates to the acid hydrolysis of the chemically bonded ligand. The proprietary bonding and endcapping techniques utilized in the manufacture of SunFire products results in a phase with much greater low pH chemical stability and extended column lifetime.
SUnfIre STATe-of-The-ArT SILICA CoLUmnS
[ ]8
Best Peak Shape
Minutes
0.00
12
3
4
5 6
5.00 10.00 15.00 20.00 25.00 30.00 35.00 40.00
T usp ami – 1.35
T usp ami – 1.79
Isolation of Nimodipine and its Impurities
loadabIl It y by desIgn
A successful isolation and purification process is not only a function of column efficiency, but is also related to the loadability of the chromatographic material for different analytes, and under different mobile phase conditions.
The physical characteristics of preparative phases, such as surface area and ligand density, do not always correlate well with the mass load-ability of ionizable compounds. SunFire Prep silica particles have been synthetically designed under cGMP protocols to deliver maximum loadability in acidic to moderate pH mobile phase conditions.
1
2
3
1
2
3
4
4
2.00 4.00 6.00 8.00 10.00 12.00 14.00
-1
100
%
-1
100
%
1
2
3
1
2
3
4
4
2.00 4.00 6.00 8.00 10.00 12.00 14.00
-1
100
%
-1
100
%
Mobile Phase A: Water with 0.1% FA Mobile Phase B: ACN with 0.1% FAAnalyte: Nimodipine at 30 mg/mL in DMSODetection: UV @ 290 nmInstruments: Waters AutoPurification Systems
SunFire Prep OBD C1819 x 100 mm, 5 µmPart Number: 186002567Total Mass Load: 102 mg
SunFire C18 4.6 x 100 mm, 5 µmPart Number: 186002558Total Mass Load: 6 mg
Minutes
Flow Rate: 1.4 mL/minGradient: Time Profile (min) %A %B 0.00 70 30 1.00 70 30 11.00 10 90 12.00 10 90 12.10 70 30 16.00 70 30Inj. Vol.: 200 µL
Flow Rate: 23.9 mL/minGradient: Time Profile (min) %A %B 0.00 70 30 1.97 70 30 11.97 10 90 12.97 10 90 13.10 70 30 16.00 70 30Inj. Vol.: 3.4 mL
Nimodipine
Isocratic separationMobile Phase A: 35% 20 mM K2HPO4/ 20 mM KH2PO4, pH 7.0 Mobile Phase B: 65 % MethanolWavelength: 254 nmFlow rate: 1.0 mL/minInjection volume: 14 µLTemperature: 23 ˚CInstrument: Waters Alliance® 2695 2487 Dual Wavelength Absorbance Detector
Compounds1. Uracil2. Propranolol3. Butylparaben4. Naphthalene5. Acenaphthene6. Amitriptyline
SunFire C18 Part Number: 186002559 4.6 x 150 mm, 5 µm
Phenomenex Luna® C18 (2) 4.6 x 150 mm, 5 µm
ACT Ace® C18
4.6 x 150 mm, 5 µm
T usp ami – 1.26
“SunFire columns were selected for their resolving power and reliability to meet both our analytical and preparative needs. SunFire Prep OBD columns allowed us to load up to 50% more sample, with similar results, and run up to twice as many prep injections than we had done previously.”
Anthony Paiva Senior Research Scientist, now at PhytoCeutica, Inc.
Impurity levels: Peak % by Area 1. 3.1 2. 0.6 3. 6.5 4. 4.9
0.00 2.00 4.00 6.00 8.00 10.00 12.00 14.00
2
2
1
1
-3
100
%
-2
100
%
0.00 2.00 4.00 6.00 8.00 10.00 12.00 14.00
2
2
1
1
-3
100
%
-2
100
%
Flow Rate: 1.05 mL/minGradient: Time Profile (min) %A %B 0.0 95 5 0.15 95 5 10.15 10 90 15.15 10 90Inj. Vol.: 180 µL
Flow Rate: 18 mL/minGradient: Time Profile (min) %A %B 0.0 95 5 1.0 95 5 11.0 10 90 16.0 10 90Inj. Vol.: 3.0 mL
Compounds1. Econazole (10 mg/mL)2. Miconazole (10 mg/mL)
SunFire C18 4.6 x 100 mm, 5 µmPart Number: 186002558Total Mass Load: 3.6 mg
SunFire Prep OBD C18 19 x 100 mm, 5 µmPart Number: 186002567Total Mass Load: 60 mg
Mobile Phase A: 0.1% TFA in waterMobile Phase B: 0.1% TFA in acetonitrileSample Concentration: 20 mg/mL in DMSOTemperature: AmbientInstrument: Waters AutoPurification SystemDetection: UV @ 285 nm
Minutes
Scale-up of the Separation of Two Antifungal Critical Pairs on SunFire Columns
oPTImIzed for Low ph PUrIfICATIonS
[ ]9
eff IC IenCy and sCalabIl It y
The isolation and purification of critical compound pairs is a major challenge to purification scientists. Often a successful analytical separation will not scale-up directly due to the reduced performance of the preparative column.
The OBD design, in combination with the efficient SunFire particles, ensures equivalent chromatographic performance from analytical to preparative dimensions, eliminating the need for any subsequent time consuming method redevelopment.
Column: SunFire Prep Silica 19 x 150 mm, 5 µmPart Number: 186002568Mobile Phase: 80/20 Hexane/Ethyl acetateFlow Rate: 18 mL/minTotal Load: 100 mgInstrument: Waters Autopurification System
Analytes:1. Propyl p-phenylacetobenzoate2. Methyl p-phenylacetobenzoate3. Propyl p-hydroxybenzoate4. Methyl p-hydroxybenzoate
0.00 2.00 4.00 10.006.00 12.008.00
12
3 4
Purification of Diesters from Standard DCC/DMAP Protocol*normal-Phase sunfIre P reP sIl ICa Columns
Normal-phase silica columns allow for the purification of analytes that can not be separated in RPLC, such as highly hydrophilic analytes or analytes that are unstable in water. The benefits of SunFire silica are:
n High theoretical plates (similar to analytical column efficiencies)
n Excellent scale-up capability
n Low backpressure
n Fast dry down times
SunFire Prep columns, available in 5 μm and 10 μm particle sizes, show an excellent column life and stability due to the OBD design, as well as excellent peak shapes and a high mass loading.
Time (Mins)
* DCC/DMAP Protocol is a base catalyzed (DMAP) esterification reaction, driven to product using a dehydrating agent (DCC). RCOOH + R’OH ↔ RCOOR’ + H20
Impurity levels: Peak % by Area 1. 3.1 2. 0.6 3. 6.5 4. 4.9
ATLAnTIS T3 PoLAr ComPoUnd CoLUmnS
[ ]10
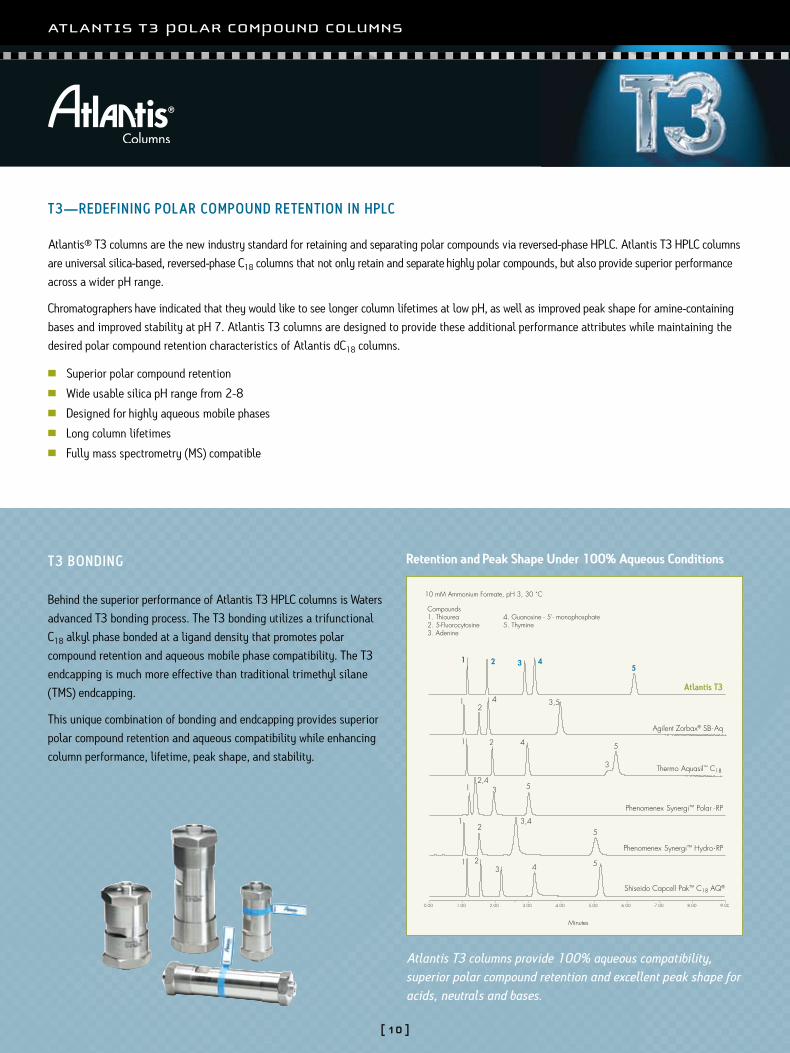
Atlantis® T3 columns are the new industry standard for retaining and separating polar compounds via reversed-phase HPLC. Atlantis T3 HPLC columns are universal silica-based, reversed-phase C18 columns that not only retain and separate highly polar compounds, but also provide superior performance across a wider pH range.
Chromatographers have indicated that they would like to see longer column lifetimes at low pH, as well as improved peak shape for amine-containing bases and improved stability at pH 7. Atlantis T3 columns are designed to provide these additional performance attributes while maintaining the desired polar compound retention characteristics of Atlantis dC18 columns.
n Superior polar compound retentionn Wide usable silica pH range from 2-8n Designed for highly aqueous mobile phasesn Long column lifetimesn Fully mass spectrometry (MS) compatible
t3 bondIng
Behind the superior performance of Atlantis T3 HPLC columns is Waters advanced T3 bonding process. The T3 bonding utilizes a trifunctional C18 alkyl phase bonded at a ligand density that promotes polar compound retention and aqueous mobile phase compatibility. The T3 endcapping is much more effective than traditional trimethyl silane (TMS) endcapping.
This unique combination of bonding and endcapping provides superior polar compound retention and aqueous compatibility while enhancing column performance, lifetime, peak shape, and stability.
0.00 1.00 2.00 3.00 4.00 5.00 6.00 7.00 8.00 9.00
1 2 3 45
Atlantis T3
12
4 3,5
Agilent Zorbax® SB-Aq
1 2 4
3
5
Thermo Aquasil™ C18
12,4
3 5
Phenomenex Synergi™ Polar - RP
12
Phenomenex Synergi™ Hydro- RP
3,45
1 23 4 5
Shiseido Capcell Pak™ C18 AQ®
Atlantis T3 columns provide 100% aqueous compatibility, superior polar compound retention and excellent peak shape for acids, neutrals and bases.
Compounds 1. Thiourea 4. Guanosine - 5’- monophosphate2. 5-Fluorocytosine 5. Thymine3. Adenine
Retention and Peak Shape Under 100% Aqueous Conditions
t3— redefInIng Polar ComPound ret ent Ion In hPlC
Minutes
10 mM Ammonium Formate, pH 3, 30 ˚C
1
2
3
V0 = 1.5 min
V0 = 1.5 min 1
2
3
Minutes
0 2 4 6 8 10 12
AU
0.0
1.0
2.0
3.0
AU
0.0
1.0
2.0
3.0
AU
0.0
1.0
2.0
3.0
V0 = 1.5 min1
2
3
sCalabIl It y and mass loadIng
One of the most frustrating and time-consuming aspects of the purification process occurs when an analytical separation does not scale-up linearly to semi-preparative and preparative dimensions. All Waters preparative column chemistries contain the same high-quality, fully tested stationary-phase material as their equivalent analytical dimension.
Atlantis T3 preparative columns also provide high mass loading for polar compounds. The isolation and purification scientist can choose to use either a larger preparative column that provides a capacity safety margin for unknown sample sets, or a smaller preparative column that decreases solvent consumption, operating backpressures, and peak volumes. This ability to inject high mass loads translates into fewer preparative runs and faster library screening and purification.
PurIf ICat Ion of Polar analyt es
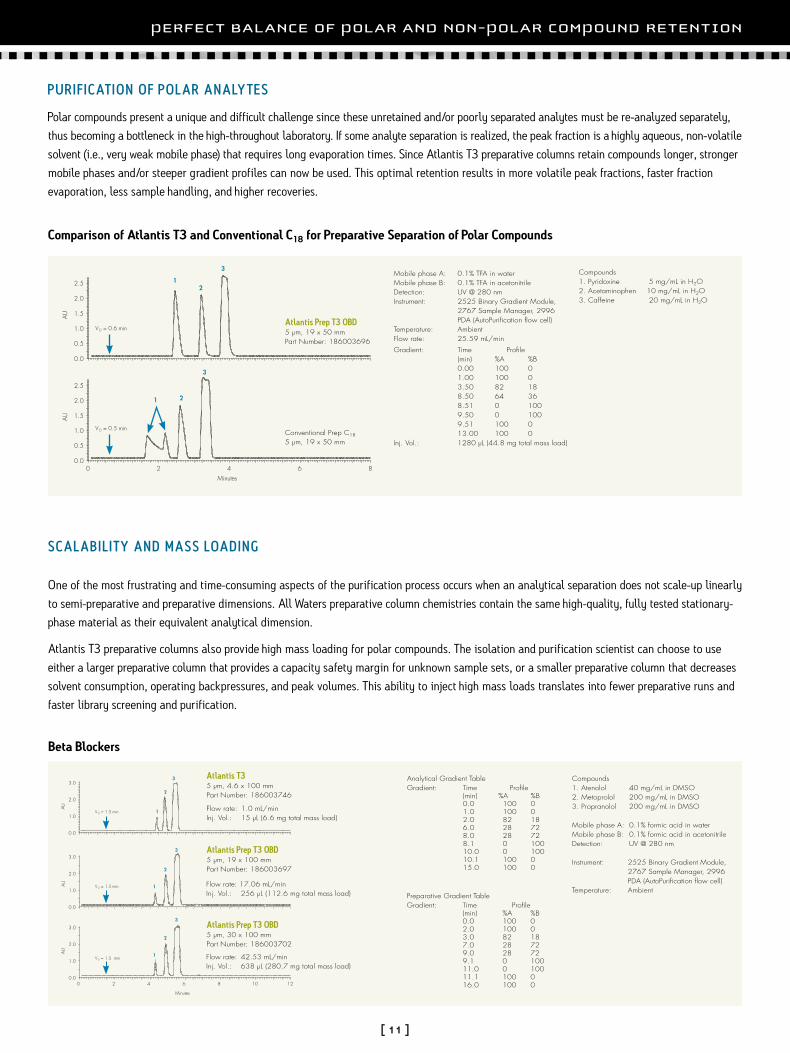
Polar compounds present a unique and difficult challenge since these unretained and/or poorly separated analytes must be re-analyzed separately, thus becoming a bottleneck in the high-throughout laboratory. If some analyte separation is realized, the peak fraction is a highly aqueous, non-volatile solvent (i.e., very weak mobile phase) that requires long evaporation times. Since Atlantis T3 preparative columns retain compounds longer, stronger mobile phases and/or steeper gradient profiles can now be used. This optimal retention results in more volatile peak fractions, faster fraction evaporation, less sample handling, and higher recoveries.
PerfeCT BALAnCe of PoLAr And non-PoLAr ComPoUnd reTenTIon
[ ]11
Minutes0 2 4 6 8
AU
0.0
1.0
1.5
2.0
2.5
AU
0.0
1.0
1.5
2.0
2.5
0.5
0.5
12
3
V0 = 0.6 min
V0 = 0.5 min
1 2
3
Comparison of Atlantis T3 and Conventional C18 for Preparative Separation of Polar Compounds
Gradient: Time Profile (min) %A %B 0.00 100 0 1.00 100 0 3.50 82 18 8.50 64 36 8.51 0 100 9.50 0 100 9.51 100 0 13.00 100 0 Inj. Vol.: 1280 µL (44.8 mg total mass load)
Compounds1. Pyridoxine 5 mg/mL in H2O2. Acetaminophen 10 mg/mL in H2O3. Caffeine 20 mg/mL in H2O
Atlantis Prep T3 OBD 5 µm, 19 x 50 mmPart Number: 186003696
Conventional Prep C18 5 µm, 19 x 50 mm
Mobile phase A: 0.1% TFA in waterMobile phase B: 0.1% TFA in acetonitrileDetection: UV @ 280 nm Instrument: 2525 Binary Gradient Module, 2767 Sample Manager, 2996 PDA (AutoPurification flow cell)Temperature: AmbientFlow rate: 25.59 mL/min
Atlantis T3 5 µm, 4.6 x 100 mmPart Number: 186003746
Atlantis Prep T3 OBD 5 µm, 19 x 100 mmPart Number: 186003697
Atlantis Prep T3 OBD 5 µm, 30 x 100 mmPart Number: 186003702
Analytical Gradient TableGradient: Time Profile (min) %A %B 0.0 100 0 1.0 100 0 2.0 82 18 6.0 28 72 8.0 28 72 8.1 0 100 10.0 0 100 10.1 100 0 15.0 100 0
Compounds1. Atenolol 40 mg/mL in DMSO2. Metoprolol 200 mg/mL in DMSO3. Propranolol 200 mg/mL in DMSO
Mobile phase A: 0.1% formic acid in waterMobile phase B: 0.1% formic acid in acetonitrileDetection: UV @ 280 nm
Instrument: 2525 Binary Gradient Module, 2767 Sample Manager, 2996 PDA (AutoPurification flow cell)Temperature: Ambient
Flow rate: 1.0 mL/minInj. Vol.: 15 µL (6.6 mg total mass load)
Flow rate: 17.06 mL/minInj. Vol.: 256 µL (112.6 mg total mass load)
Flow rate: 42.53 mL/minInj. Vol.: 638 µL (280.7 mg total mass load)
Beta Blockers
Preparative Gradient TableGradient: Time Profile (min) %A %B 0.0 100 0 2.0 100 0 3.0 82 18 7.0 28 72 9.0 28 72 9.1 0 100 11.0 0 100 11.1 100 0 16.0 100 0
PePTIde SePArATIon TeChnoLogY PreP oBd CoLUmnS
[ ]12
Peptide Separation Technology
Isolat Ion and PurIf ICat Ion of PePt Ides
The isolation and purification of peptides from both natural and synthetic sources have been the focus of many scientists in research and development. This process has been difficult because of unpredictable separations, short column lifetime, and lack of scalability.
Samples can be complex, so separations must be developed and optimized. These experiments are usually performed on pilot or analytical-scale columns, but inconsistent performance of preparative columns complicates the development of purification protocols. Peptide Separation Technology columns provide a stable surface chemistry that can be used for most peptides. Scaling the optimized separation requires identical column chemistry and performance across a range of column dimensions. Peptide Separation Technology column chemistry is consistent across all particle sizes and column dimensions.
The loss of samples due to early column failure must be minimized. When the OBD preparative column design is coupled with the stable surface chemistry of Peptide Separation Technology columns in a range of particle sizes, the process of peptide isolation and purification becomes more efficient, and overall costs are reduced.
utIlIty and suItabIlIty for a WIde range of PePtIdes
Peptide Separation Technology columns are suitable for a wide variety of peptides, including acidic and basic, long and short, hydrophilic and hydrophobic, and modified sequences. There is little need for screening columns to match a particular sample, or for maintaining an inventory of different column chemistries. Peptide Separation Technology columns are compatible with alternative mobile phases for flexibility in devel-oping purification methods. Good peak shapes and separations can be obtained with both TFA and short chain organic acids, as mobile phase modifiers, and the columns can be used with both acetonitrile and alcohols. Good purification and yield can be obtained with bio-compatible solvents so that the isolated peptide can be used in bio-assays.
AU
0.00
0.05
0.10
0.15
0.20
0.25
0.30
0.35
0.40
0.45
0.50
0.55
0.60
0.65
0.70
Minutes
15.00 20.00 25.00 30.00 35.00 40.00 45.00 50.00 55.00 60.00 65.00 70.00 75.00 80.00 85.00 90.00
Average pI 6.417 Residues1772 da
Large pI 4.7~ 40 Residues4000 da
Preservative
Peptide
0.00
0.05
0.10
0.15
0.20
0.25
0.30
0.35
0.40
0.45
0.50
0.55
0.60
0.65
0.70
Minutes
15.00 20.00 25.00 30.00 35.00 40.00 45.00 50.00 55.00 60.00 65.00 70.00 75.00 80.00 85.00 90.00
AU
~ ~ ~
Basic pI 10.315 Residues1809 da
0.00
0.02
0.04
0.06
0.08
0.10
0.12
0.14
0.16
0.18
0.20
0.22
0.24
0.26
0.28
0.30
0.32
0.34
0.36
0.38
Minutes15.00 20.00 25.00 30.00 35.00 40.00 45.00 50.00 55.00 60.00 65.00 70.00 75.00 80.00 85.00 90.00
AU
Hydrophobic pI 7.316 Residues1872 da
AU
0.00
0.02
0.04
0.06
0.08
0.10
0.12
0.14
0.16
0.18
0.20
0.22
0.24
0.26
0.28
0.30
0.32
0.34
Minutes15.00 20.00 25.00 30.00 35.00 40.00 45.00 50.00 55.00 60.00 65.00 70.00 75.00 80.00 85.00 90.00
Peptide Separation Technology columns are compatible with a broad range of peptides. A single column can be used to purify the wide range of sample types generated in a peptide synthesis laboratory. There is no need to switch columns for separating peptides of extreme sizes, isoelectric point, or hydrophobicity.
Versatility for Peptide Isolation and Purification
SCALeABLe 130Å And 300Å offerIngS
sCale-uP
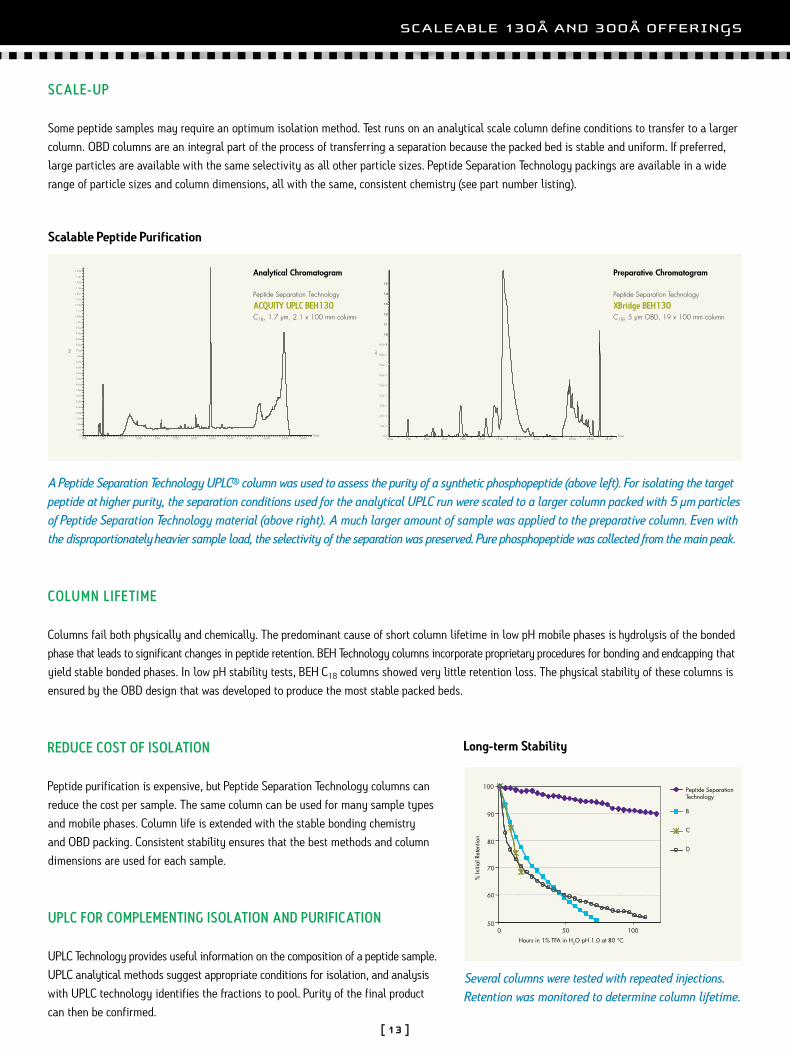
Some peptide samples may require an optimum isolation method. Test runs on an analytical scale column define conditions to transfer to a larger column. OBD columns are an integral part of the process of transferring a separation because the packed bed is stable and uniform. If preferred, large particles are available with the same selectivity as all other particle sizes. Peptide Separation Technology packings are available in a wide range of particle sizes and column dimensions, all with the same, consistent chemistry (see part number listing).
Scalable Peptide Purification
A Peptide Separation Technology UPLC® column was used to assess the purity of a synthetic phosphopeptide (above left). For isolating the target peptide at higher purity, the separation conditions used for the analytical UPLC run were scaled to a larger column packed with 5 µm particles of Peptide Separation Technology material (above right). A much larger amount of sample was applied to the preparative column. Even with the disproportionately heavier sample load, the selectivity of the separation was preserved. Pure phosphopeptide was collected from the main peak.
Column lIfet Ime
Columns fail both physically and chemically. The predominant cause of short column lifetime in low pH mobile phases is hydrolysis of the bonded phase that leads to significant changes in peptide retention. BEH Technology columns incorporate proprietary procedures for bonding and endcapping that yield stable bonded phases. In low pH stability tests, BEH C18 columns showed very little retention loss. The physical stability of these columns is ensured by the OBD design that was developed to produce the most stable packed beds.
reduCe Cost of IsolatIon
Peptide purification is expensive, but Peptide Separation Technology columns can reduce the cost per sample. The same column can be used for many sample types and mobile phases. Column life is extended with the stable bonding chemistry and OBD packing. Consistent stability ensures that the best methods and column dimensions are used for each sample.
uPlC for ComPlementIng IsolatIon and PurIfICatIon
UPLC Technology provides useful information on the composition of a peptide sample. UPLC analytical methods suggest appropriate conditions for isolation, and analysis with UPLC technology identifies the fractions to pool. Purity of the final product can then be confirmed.
Time0.00 2.00 4.00 6.00 8.00 10.00 12.00 14.00 16.00 18.00 20.00 22.00 24.00
AU
0.0
5.0e-3
1.0e-2
1.5e-2
2.0e-2
2.5e-2
3.0e-2
3.5e-2
4.0e-2
4.5e-2
5.0e-2
5.5e-2
6.0e-2
6.5e-2
7.0e-2
7.5e-2
8.0e-2
8.5e-2
9.0e-2
9.5e-2
1.0e-1
1.05e-1
1.1e-1
1.15e-1
1.2e-1
1.25e-1
1.3e-1
1.35e-1
1.4e-1
1.45e-1
-
Time0.00 2.00 4.00 6.00 8.00 10.00 12.00 14.00 16.00 18.00 20.00 22.00 24.00
AU
0.0
1.0e-1
2.0e-1
3.0e-1
4.0e-1
5.0e-1
6.0e-1
7.0e-1
8.0e-1
9.0e-1
1.0
1.1
1.2
1.3
1.4
1.5
-1
1.0
1.1
1.2
1.3
1.4
1.5
-1
1.0
1.1
1.2
1.3
1.4
1.5
Analytical Chromatogram
Peptide Separation Technology
ACQUITY UPLC BEH130
C18, 1.7 µm, 2.1 x 100 mm column
Preparative Chromatogram
Peptide Separation Technology
XBridge BEH130 C18, 5 µm OBD, 19 x 100 mm column
50
60
70
80
90
100
0 50 100
Hours in 1% TFA in H2O pH 1.0 at 80 °C
% In
itial
Ret
entio
n
Peptide Separation Technology
B
C
D
Long-term Stability
Several columns were tested with repeated injections. Retention was monitored to determine column lifetime.
[ ]13
UPLC TeChnoLogY To PrePArATIve SCALe
method mIgratIon from uPlC t eChnology to PreParatIv e hPlC
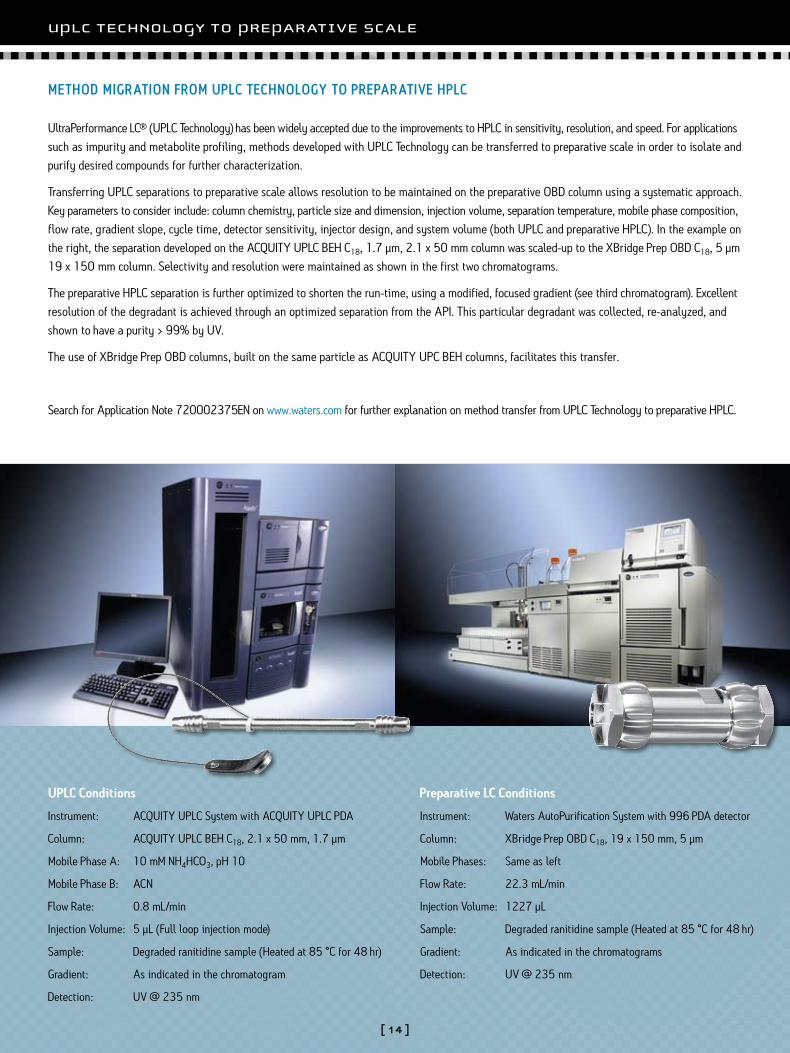
UPLC Conditions
Instrument: ACQUITY UPLC System with ACQUITY UPLC PDA
Column: ACQUITY UPLC BEH C18, 2.1 x 50 mm, 1.7 µm
Mobile Phase A: 10 mM NH4HCO3, pH 10
Mobile Phase B: ACN
Flow Rate: 0.8 mL/min
Injection Volume: 5 µL (Full loop injection mode)
Sample: Degraded ranitidine sample (Heated at 85 °C for 48 hr)
Gradient: As indicated in the chromatogram
Detection: UV @ 235 nm
Preparative LC Conditions
Instrument: Waters AutoPurification System with 996 PDA detector
Column: XBridge Prep OBD C18, 19 x 150 mm, 5 µm
Mobile Phases: Same as left
Flow Rate: 22.3 mL/min
Injection Volume: 1227 µL
Sample: Degraded ranitidine sample (Heated at 85 °C for 48 hr)
Gradient: As indicated in the chromatograms
Detection: UV @ 235 nm
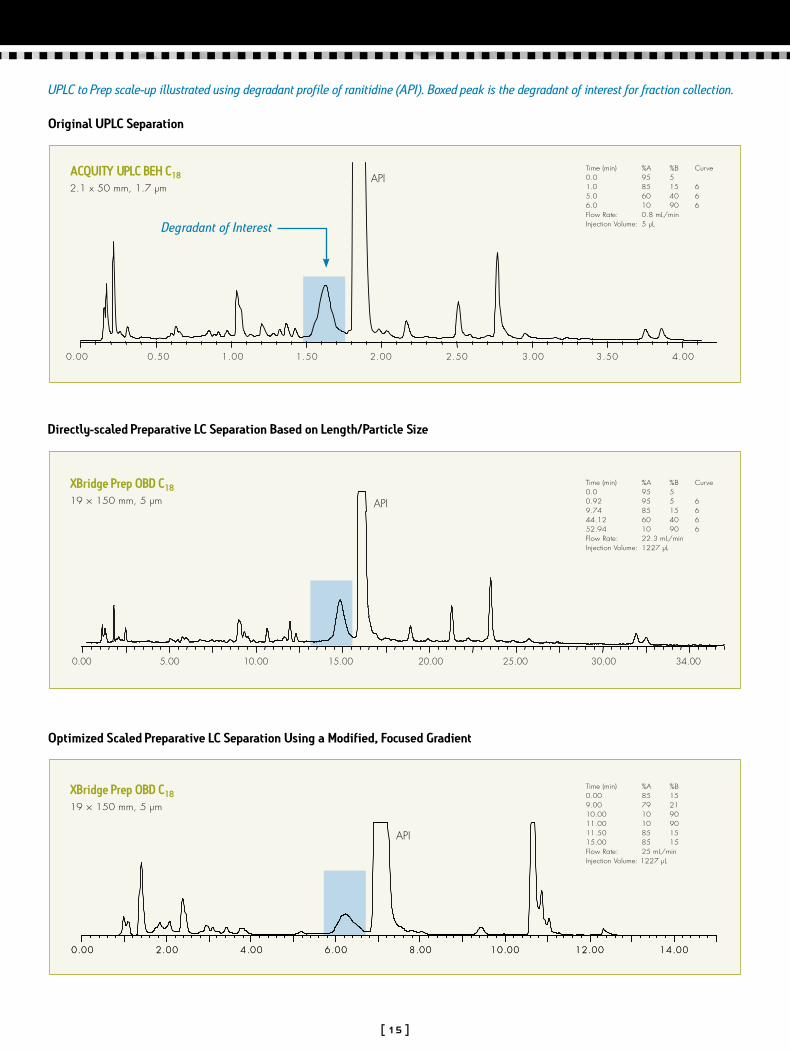
UltraPerformance LC® (UPLC Technology) has been widely accepted due to the improvements to HPLC in sensitivity, resolution, and speed. For applications such as impurity and metabolite profiling, methods developed with UPLC Technology can be transferred to preparative scale in order to isolate and purify desired compounds for further characterization.
Transferring UPLC separations to preparative scale allows resolution to be maintained on the preparative OBD column using a systematic approach. Key parameters to consider include: column chemistry, particle size and dimension, injection volume, separation temperature, mobile phase composition, flow rate, gradient slope, cycle time, detector sensitivity, injector design, and system volume (both UPLC and preparative HPLC). In the example on the right, the separation developed on the ACQUITY UPLC BEH C18, 1.7 μm, 2.1 x 50 mm column was scaled-up to the XBridge Prep OBD C18, 5 μm 19 x 150 mm column. Selectivity and resolution were maintained as shown in the first two chromatograms.
The preparative HPLC separation is further optimized to shorten the run-time, using a modified, focused gradient (see third chromatogram). Excellent resolution of the degradant is achieved through an optimized separation from the API. This particular degradant was collected, re-analyzed, and shown to have a purity > 99% by UV.
The use of XBridge Prep OBD columns, built on the same particle as ACQUITY UPC BEH columns, facilitates this transfer.
Search for Application Note 720002375EN on www.waters.com for further explanation on method transfer from UPLC Technology to preparative HPLC.
[ ]14
[ ]15
UPLC to Prep scale-up illustrated using degradant profile of ranitidine (API). Boxed peak is the degradant of interest for fraction collection.
For More Information Circle #
API
API
Waters Corporation
34 Maple Street, Milford, MA 01757tel. (508)478-2000, fax (508) 478-1990
www.waters.com
0.00 2.00 4.00 6.00 8.00 10.00 12.00 14.000.00 2.00 4.00 6.00 8.00 10.00 12.00 14.00
API
For More Information Circle #
API
API
Waters Corporation
34 Maple Street, Milford, MA 01757tel. (508)478-2000, fax (508) 478-1990
www.waters.com
0.00 2.00 4.00 6.00 8.00 10.00 12.00 14.000.00 2.00 4.00 6.00 8.00 10.00 12.00 14.00
API
For More Information Circle #
API
API
Waters Corporation
34 Maple Street, Milford, MA 01757tel. (508)478-2000, fax (508) 478-1990
www.waters.com
0.00 2.00 4.00 6.00 8.00 10.00 12.00 14.000.00 2.00 4.00 6.00 8.00 10.00 12.00 14.00
API
Original UPLC Separation
Optimized Scaled Preparative LC Separation Using a Modified, Focused Gradient
Directly-scaled Preparative LC Separation Based on Length/Particle Size
ACQUITY UPLC BEH C182.1 x 50 mm, 1.7 µm
XBridge Prep OBD C1819 × 150 mm, 5 µm
XBridge Prep OBD C1819 × 150 mm, 5 µm
Time (min) %A %B 0.00 85 159.00 79 21 10.00 10 90 11.00 10 90 11.50 85 1515.00 85 15 Flow Rate: 25 mL/minInjection Volume: 1227 µL
Time (min) %A %B Curve0.0 95 50.92 95 5 69.74 85 15 644.12 60 40 652.94 10 90 6Flow Rate: 22.3 mL/minInjection Volume: 1227 µL
Time (min) %A %B Curve0.0 95 51.0 85 15 65.0 60 40 66.0 10 90 6Flow Rate: 0.8 mL/minInjection Volume: 5 µLDegradant of Interest
wATerS AT-CoLUmn dILUTIon TeChnoLogY
[ ]16
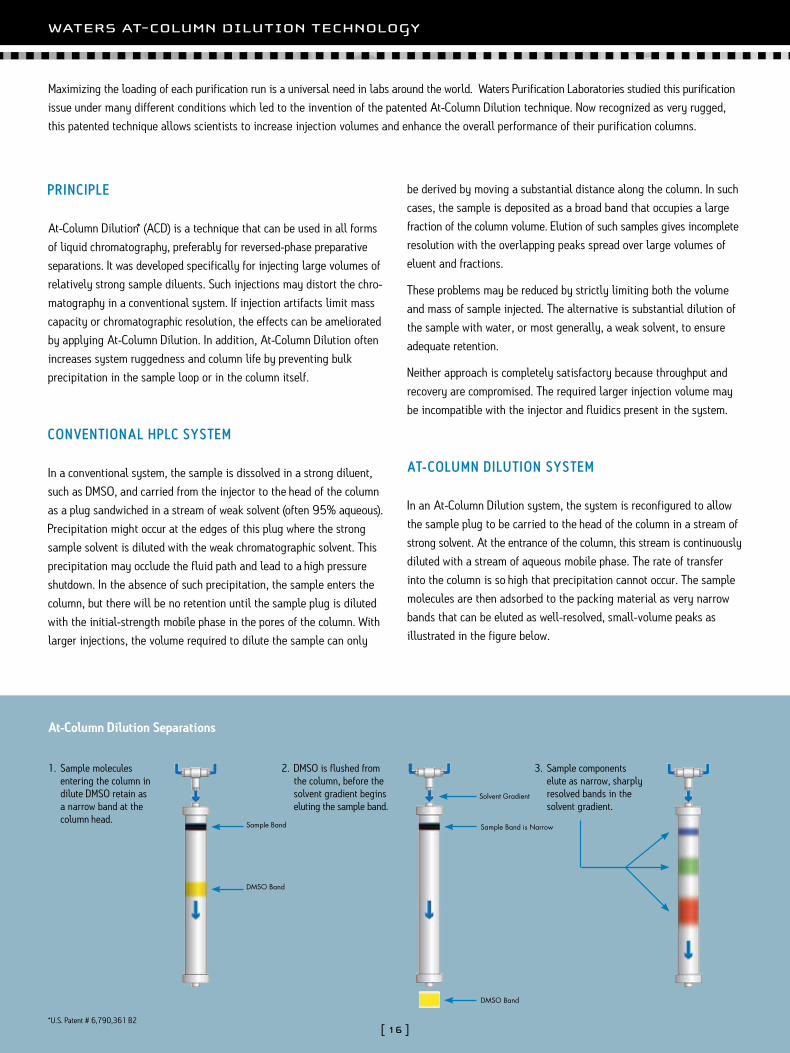
Maximizing the loading of each purification run is a universal need in labs around the world. Waters Purification Laboratories studied this purification issue under many different conditions which led to the invention of the patented At-Column Dilution technique. Now recognized as very rugged, this patented technique allows scientists to increase injection volumes and enhance the overall performance of their purification columns.
1. Sample molecules entering the column in dilute DMSO retain as a narrow band at the column head.
2. DMSO is flushed from the column, before the solvent gradient begins eluting the sample band.
3. Sample components elute as narrow, sharply resolved bands in the solvent gradient.
Sample Band
DMSO Band
Sample Band is Narrow
Solvent Gradient
DMSO Band
At-Column Dilution Separations
P rInCIPle
At-Column Dilution* (ACD) is a technique that can be used in all forms of liquid chromatography, preferably for reversed-phase preparative separations. It was developed specifically for injecting large volumes of relatively strong sample diluents. Such injections may distort the chro-matography in a conventional system. If injection artifacts limit mass capacity or chromatographic resolution, the effects can be ameliorated by applying At-Column Dilution. In addition, At-Column Dilution often increases system ruggedness and column life by preventing bulk precipitation in the sample loop or in the column itself.
Conv ent Ional hPlC syst em
In a conventional system, the sample is dissolved in a strong diluent, such as DMSO, and carried from the injector to the head of the column as a plug sandwiched in a stream of weak solvent (often 95% aqueous). Precipitation might occur at the edges of this plug where the strong sample solvent is diluted with the weak chromatographic solvent. This precipitation may occlude the fluid path and lead to a high pressure shutdown. In the absence of such precipitation, the sample enters the column, but there will be no retention until the sample plug is diluted with the initial-strength mobile phase in the pores of the column. With larger injections, the volume required to dilute the sample can only
be derived by moving a substantial distance along the column. In such cases, the sample is deposited as a broad band that occupies a large fraction of the column volume. Elution of such samples gives incomplete resolution with the overlapping peaks spread over large volumes of eluent and fractions.
These problems may be reduced by strictly limiting both the volume and mass of sample injected. The alternative is substantial dilution of the sample with water, or most generally, a weak solvent, to ensure adequate retention.
Neither approach is completely satisfactory because throughput and recovery are compromised. The required larger injection volume may be incompatible with the injector and fluidics present in the system.
at-Column dIlut Ion syst em
In an At-Column Dilution system, the system is reconfigured to allow the sample plug to be carried to the head of the column in a stream of strong solvent. At the entrance of the column, this stream is continuously diluted with a stream of aqueous mobile phase. The rate of transfer into the column is so high that precipitation cannot occur. The sample molecules are then adsorbed to the packing material as very narrow bands that can be eluted as well-resolved, small-volume peaks as illustrated in the figure below.
*U.S. Patent # 6,790,361 B2
[ ]17
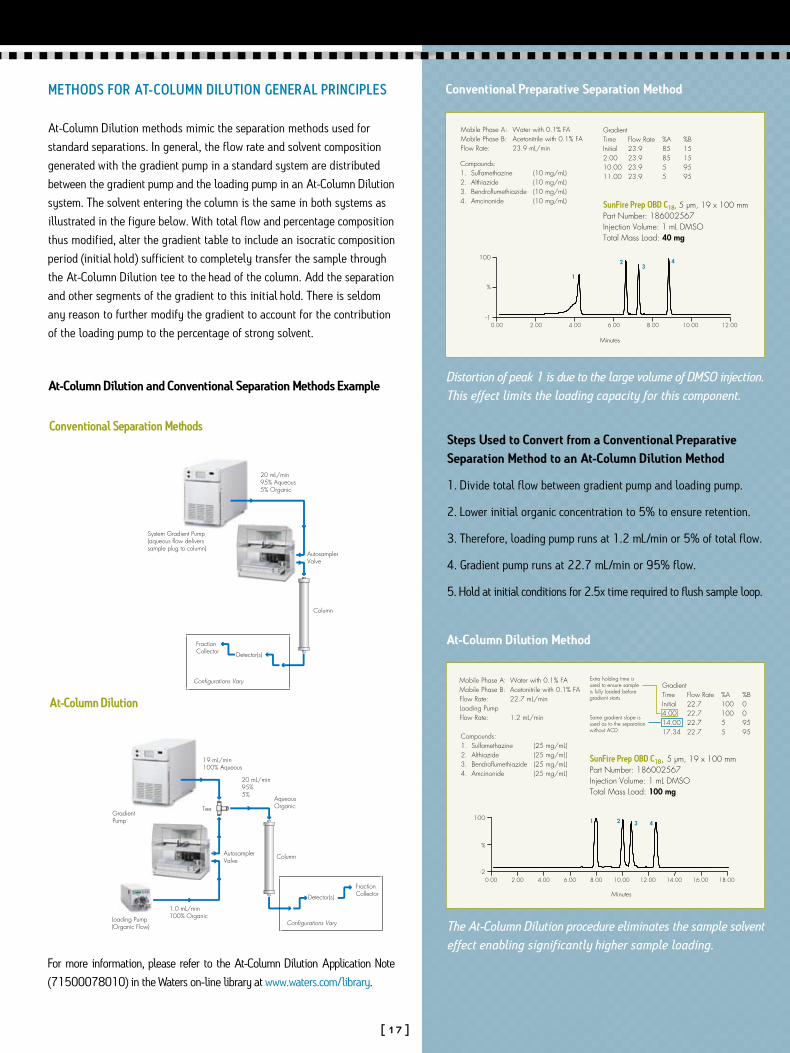
methods for at-Column dIlutIon general PrInCIPles
At-Column Dilution methods mimic the separation methods used for standard separations. In general, the flow rate and solvent composition generated with the gradient pump in a standard system are distributed between the gradient pump and the loading pump in an At-Column Dilution system. The solvent entering the column is the same in both systems as illustrated in the figure below. With total flow and percentage composition thus modified, alter the gradient table to include an isocratic composition period (initial hold) sufficient to completely transfer the sample through the At-Column Dilution tee to the head of the column. Add the separation and other segments of the gradient to this initial hold. There is seldom any reason to further modify the gradient to account for the contribution of the loading pump to the percentage of strong solvent.
At-Column Dilution and Conventional Separation Methods Example
For more information, please refer to the At-Column Dilution Application Note (71500078010) in the Waters on-line library at www.waters.com/library.
FractionCollector
AutosamplerValve
Column
Detector(s)
19 mL/min100% Aqueous
Gradient Pump
20 mL/min95%5%
AqueousOrganicTee
1.0 mL/min100% OrganicLoading Pump
(Organic Flow) Configurations Vary
AutosamplerValve
Column
Detector(s)
FractionCollector
System Gradient Pump(aqueous flow deliverssample plug to column)
20 mL/min95% Aqueous5% Organic
Configurations Vary
Conventional Separation Methods
-2
100
%
0.00 2.00 4.00 6.00 8.00 10.00 12.00 14.00 16.00 18.00
1 2 3 4
0.00 2.00 4.00 6.00 8.00 10.00 12.00-1
100
%
1
23
4
Mobile Phase A: Water with 0.1% FAMobile Phase B: Acetonitrile with 0.1% FAFlow Rate: 23.9 mL/min
Mobile Phase A: Water with 0.1% FAMobile Phase B: Acetonitrile with 0.1% FAFlow Rate: 22.7 mL/minLoading Pump Flow Rate: 1.2 mL/min
SunFire Prep OBD C18, 5 µm, 19 x 100 mmPart Number: 186002567Injection Volume: 1 mL DMSOTotal Mass Load: 40 mg
Compounds: 1. Sulfamethazine (10 mg/mL)2. Althiazide (10 mg/mL)3. Bendroflumethiazide (10 mg/mL)4. Amcinonide (10 mg/mL)
GradientTime Flow Rate %A %BInitial 23.9 85 152.00 23.9 85 1510.00 23.9 5 9511.00 23.9 5 95
Compounds: 1. Sulfamethazine (25 mg/mL)2. Althiazide (25 mg/mL)3. Bendroflumethiazide (25 mg/mL)4. Amcinonide (25 mg/mL)
GradientTime Flow Rate %A %BInitial 22.7 100 0 4.00 22.7 100 014.00 22.7 5 95 17.34 22.7 5 95
Extra holding time is used to ensure sample is fully loaded before gradient starts
Same gradient slope is used as to the separation without ACD.
Minutes
Minutes
Distortion of peak 1 is due to the large volume of DMSO injection. This effect limits the loading capacity for this component.
The At-Column Dilution procedure eliminates the sample solvent effect enabling significantly higher sample loading.
Conventional Preparative Separation Method
At-Column Dilution Method
At-Column Dilution
SunFire Prep OBD C18, 5 µm, 19 x 100 mmPart Number: 186002567Injection Volume: 1 mL DMSOTotal Mass Load: 100 mg
Steps Used to Convert from a Conventional Preparative Separation Method to an At-Column Dilution Method
1. Divide total flow between gradient pump and loading pump.
2. Lower initial organic concentration to 5% to ensure retention.
3. Therefore, loading pump runs at 1.2 mL/min or 5% of total flow.
4. Gradient pump runs at 22.7 mL/min or 95% flow.
5. Hold at initial conditions for 2.5x time required to flush sample loop.
how To SCALe UP A SePArATIon
[ ]18
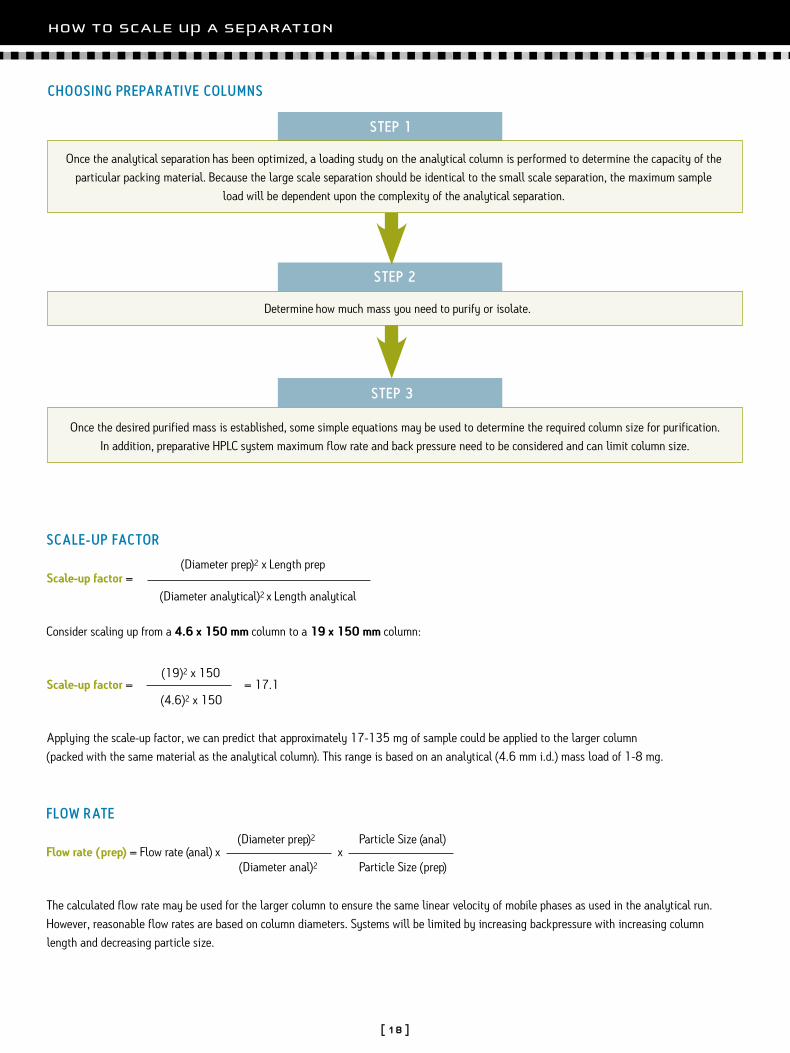
st eP 1
Once the analytical separation has been optimized, a loading study on the analytical column is performed to determine the capacity of the particular packing material. Because the large scale separation should be identical to the small scale separation, the maximum sample
load will be dependent upon the complexity of the analytical separation.
sCale-uP faCtor
Scale-up factor =
Consider scaling up from a 4.6 x 150 mm column to a 19 x 150 mm column:
Scale-up factor = = 17.1
Applying the scale-up factor, we can predict that approximately 17-135 mg of sample could be applied to the larger column (packed with the same material as the analytical column). This range is based on an analytical (4.6 mm i.d.) mass load of 1-8 mg.
floW rat e
Flow rate (prep) = Flow rate (anal) x
The calculated flow rate may be used for the larger column to ensure the same linear velocity of mobile phases as used in the analytical run. However, reasonable flow rates are based on column diameters. Systems will be limited by increasing backpressure with increasing column length and decreasing particle size.
(Diameter prep)2 x Length prep
(Diameter analytical)2 x Length analytical
(19)2 x 150
(4.6)2 x 150
st eP 2
Determine how much mass you need to purify or isolate.
st eP 3
Once the desired purified mass is established, some simple equations may be used to determine the required column size for purification. In addition, preparative HPLC system maximum flow rate and back pressure need to be considered and can limit column size.
(Diameter prep)2 Particle Size (anal)
(Diameter anal)2 Particle Size (prep)x
ChoosIng P reParat Iv e Columns
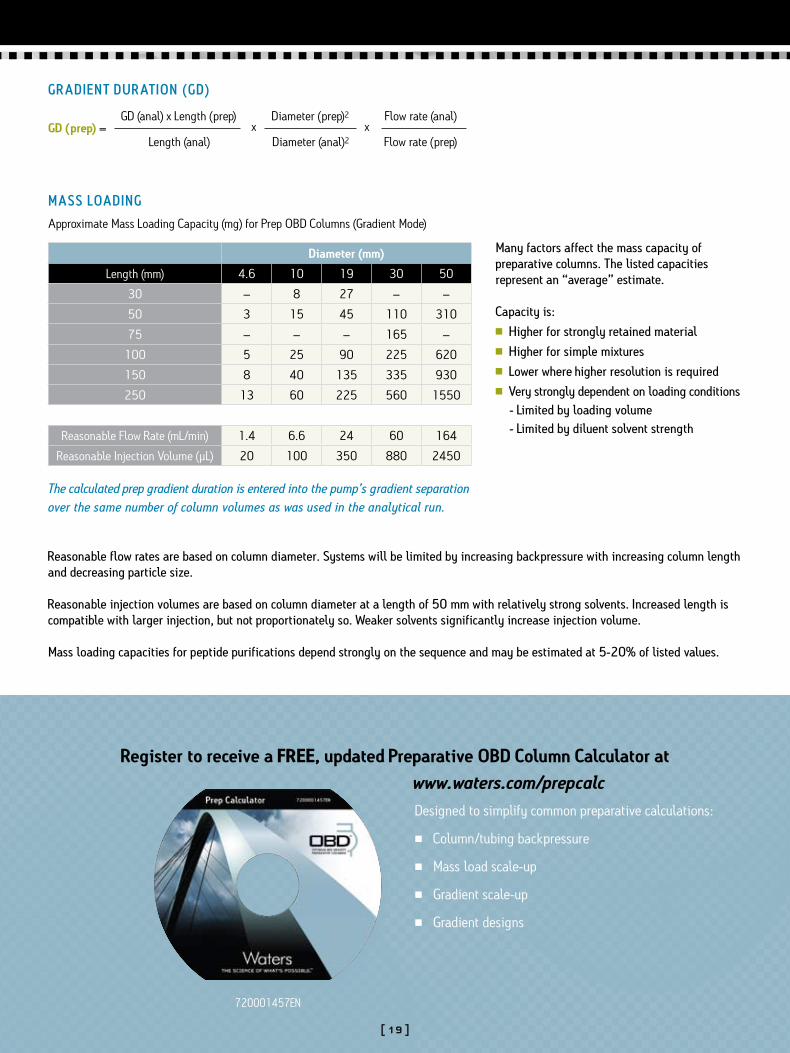
gradIent durat Ion (gd)
GD (prep) =
GD (anal) x Length (prep) x
Diameter (prep)2 x
Flow rate (anal)
Length (anal) Diameter (anal)2 Flow rate (prep)
Register to receive a FREE, updated Preparative OBD Column Calculator at www.waters.com/prepcalc
Designed to simplify common preparative calculations:
n Column/tubing backpressure
n Mass load scale-up
n Gradient scale-up
n Gradient designs
Many factors affect the mass capacity of preparative columns. The listed capacities represent an “average” estimate.
Capacity is:n Higher for strongly retained materialn Higher for simple mixturesn Lower where higher resolution is requiredn Very strongly dependent on loading conditions - Limited by loading volume - Limited by diluent solvent strength
Reasonable flow rates are based on column diameter. Systems will be limited by increasing backpressure with increasing column length and decreasing particle size.
Reasonable injection volumes are based on column diameter at a length of 50 mm with relatively strong solvents. Increased length is compatible with larger injection, but not proportionately so. Weaker solvents significantly increase injection volume.
Mass loading capacities for peptide purifications depend strongly on the sequence and may be estimated at 5-20% of listed values.
Diameter (mm)
Length (mm) 4.6 10 19 30 50
30 – 8 27 – –
50 3 15 45 110 310
75 – – – 165 –
100 5 25 90 225 620
150 8 40 135 335 930
250 13 60 225 560 1550
Reasonable Flow Rate (mL/min) 1.4 6.6 24 60 164
Reasonable Injection Volume (µL) 20 100 350 880 2450
The calculated prep gradient duration is entered into the pump’s gradient separation over the same number of column volumes as was used in the analytical run.
mass loadIng
720001457EN
[ ]19
Approximate Mass Loading Capacity (mg) for Prep OBD Columns (Gradient Mode)
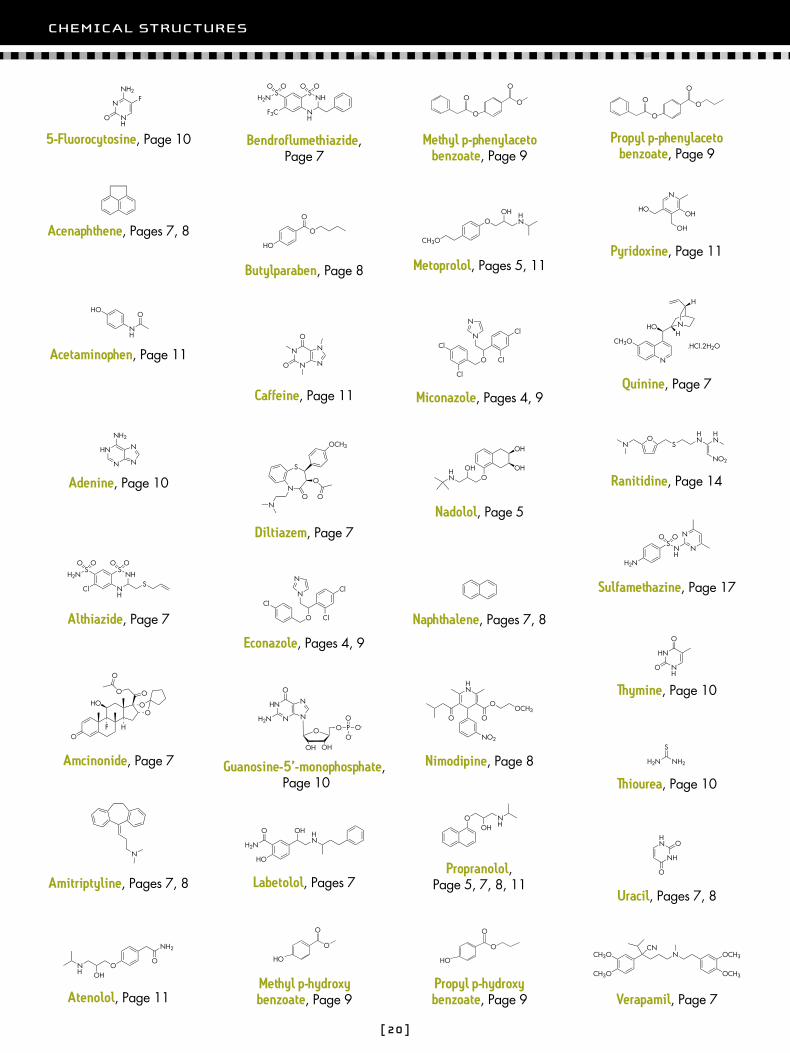
ChemICAL STrUCTUreS
[ ]20
Acenaphthene, Pages 7, 8
5-Fluorocytosine, Page 10
Acetaminophen, Page 11
Adenine, Page 10
Guanosine-5’-monophosphate, Page 10
Ranitidine, Page 14
Thymine, Page 10
H2N NH2
S
Thiourea, Page 10
N
S
O
ON
O
OCH3
Diltiazem, Page 7
O
N
N
Cl
Cl
Cl
Econazole, Pages 4, 9
NH2
OON
H OH
Atenolol, Page 11
NH
NHSS
H2N
F3C
O O O O
Bendroflumethiazide, Page 7
HO
O
O
Butylparaben, Page 8
N
N N
N
O
O
Caffeine, Page 11
O
O
O
O
Methyl p-phenylaceto benzoate, Page 9
CH3O
OHN
OH
Metoprolol, Pages 5, 11
Cl
Cl
O
N
NCl
Cl
Miconazole, Pages 4, 9
OH
OHO
OHHN
Nadolol, Page 5
Naphthalene, Pages 7, 8
HN
NO2
OOCH3
OO
Nimodipine, Page 8
N
HO
OH
OH
Pyridoxine, Page 11
OOH
NH
Propranolol, Page 5, 7, 8, 11
O
O
HO
Propyl p-hydroxy benzoate, Page 9
O
O
O
O
Propyl p-phenylaceto benzoate, Page 9
SNH
N
NO O
H2N
Sulfamethazine, Page 17
NH
HN
O
O
Uracil, Pages 7, 8
CH3O
CH3O
NCN
OCH3
OCH3
Verapamil, Page 7
N
NHOH
CH3O
H
.HCl.2H2O
Quinine, Page 7
O
O
HO
Methyl p-hydroxy benzoate, Page 9
H2N
HO
HN
OHO
Labetolol, Pages 7
N
Amitriptyline, Pages 7, 8
NH
NHSS
H2N
ClS
O O O O
Althiazide, Page 7
O
HO
O
HF
O
O
OO
Amcinonide, Page 7
orderIng InformATIon
[ ]21
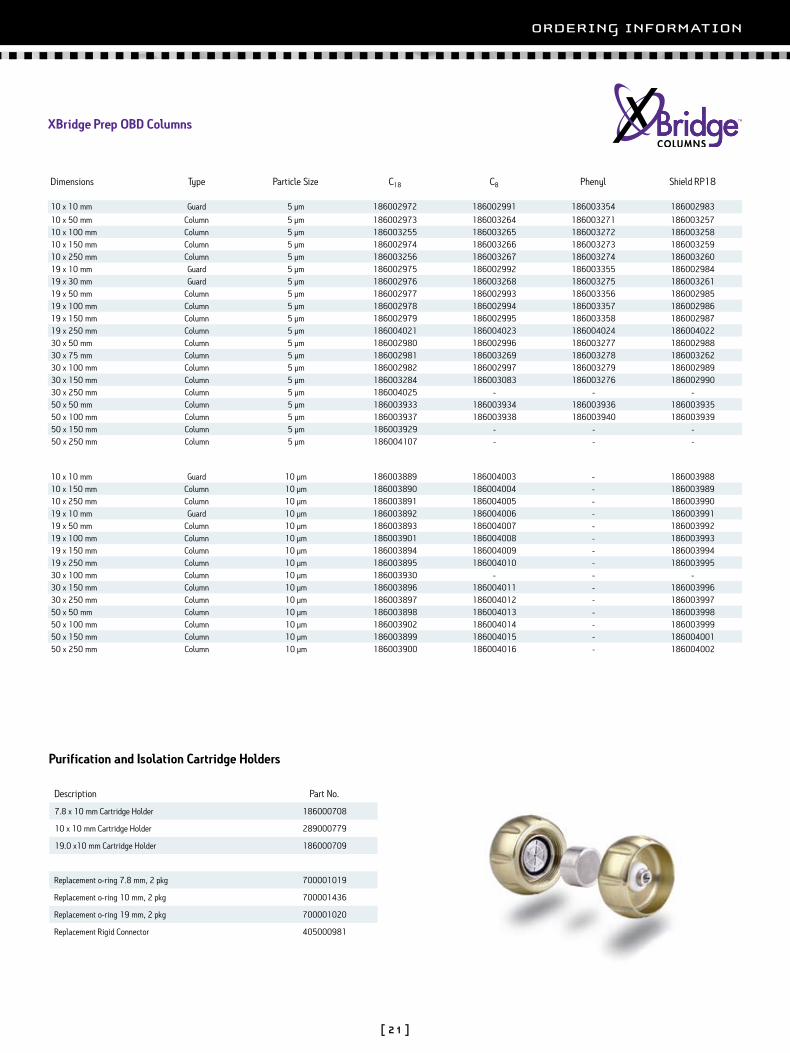
XBridge Prep OBD Columns
Dimensions Type Particle Size C18 C8 Phenyl Shield RP18
10 x 10 mm Guard 5 µm 186002972 186002991 186003354 186002983
10 x 50 mm Column 5 µm 186002973 186003264 186003271 18600325710 x 100 mm Column 5 µm 186003255 186003265 186003272 18600325810 x 150 mm Column 5 µm 186002974 186003266 186003273 18600325910 x 250 mm Column 5 µm 186003256 186003267 186003274 18600326019 x 10 mm Guard 5 µm 186002975 186002992 186003355 18600298419 x 30 mm Guard 5 µm 186002976 186003268 186003275 18600326119 x 50 mm Column 5 µm 186002977 186002993 186003356 18600298519 x 100 mm Column 5 µm 186002978 186002994 186003357 18600298619 x 150 mm Column 5 µm 186002979 186002995 186003358 18600298719 x 250 mm Column 5 µm 186004021 186004023 186004024 18600402230 x 50 mm Column 5 µm 186002980 186002996 186003277 18600298830 x 75 mm Column 5 µm 186002981 186003269 186003278 18600326230 x 100 mm Column 5 µm 186002982 186002997 186003279 18600298930 x 150 mm Column 5 µm 186003284 186003083 186003276 18600299030 x 250 mm Column 5 µm 186004025 - - -50 x 50 mm Column 5 µm 186003933 186003934 186003936 18600393550 x 100 mm Column 5 µm 186003937 186003938 186003940 18600393950 x 150 mm Column 5 µm 186003929 - - -50 x 250 mm Column 5 µm 186004107 - - -
10 x 10 mm Guard 10 µm 186003889 186004003 - 18600398810 x 150 mm Column 10 µm 186003890 186004004 - 18600398910 x 250 mm Column 10 µm 186003891 186004005 - 18600399019 x 10 mm Guard 10 µm 186003892 186004006 - 18600399119 x 50 mm Column 10 µm 186003893 186004007 - 18600399219 x 100 mm Column 10 µm 186003901 186004008 - 18600399319 x 150 mm Column 10 µm 186003894 186004009 - 18600399419 x 250 mm Column 10 µm 186003895 186004010 - 18600399530 x 100 mm Column 10 µm 186003930 - - -30 x 150 mm Column 10 µm 186003896 186004011 - 18600399630 x 250 mm Column 10 µm 186003897 186004012 - 18600399750 x 50 mm Column 10 µm 186003898 186004013 - 18600399850 x 100 mm Column 10 µm 186003902 186004014 - 18600399950 x 150 mm Column 10 µm 186003899 186004015 - 18600400150 x 250 mm Column 10 µm 186003900 186004016 - 186004002
Description Part No.
7.8 x 10 mm Cartridge Holder 186000708
10 x 10 mm Cartridge Holder 289000779
19.0 x10 mm Cartridge Holder 186000709
Replacement o-ring 7.8 mm, 2 pkg 700001019
Replacement o-ring 10 mm, 2 pkg 700001436
Replacement o-ring 19 mm, 2 pkg 700001020
Replacement Rigid Connector 405000981
Purification and Isolation Cartridge Holders
orderIng InformATIon
[ ]22
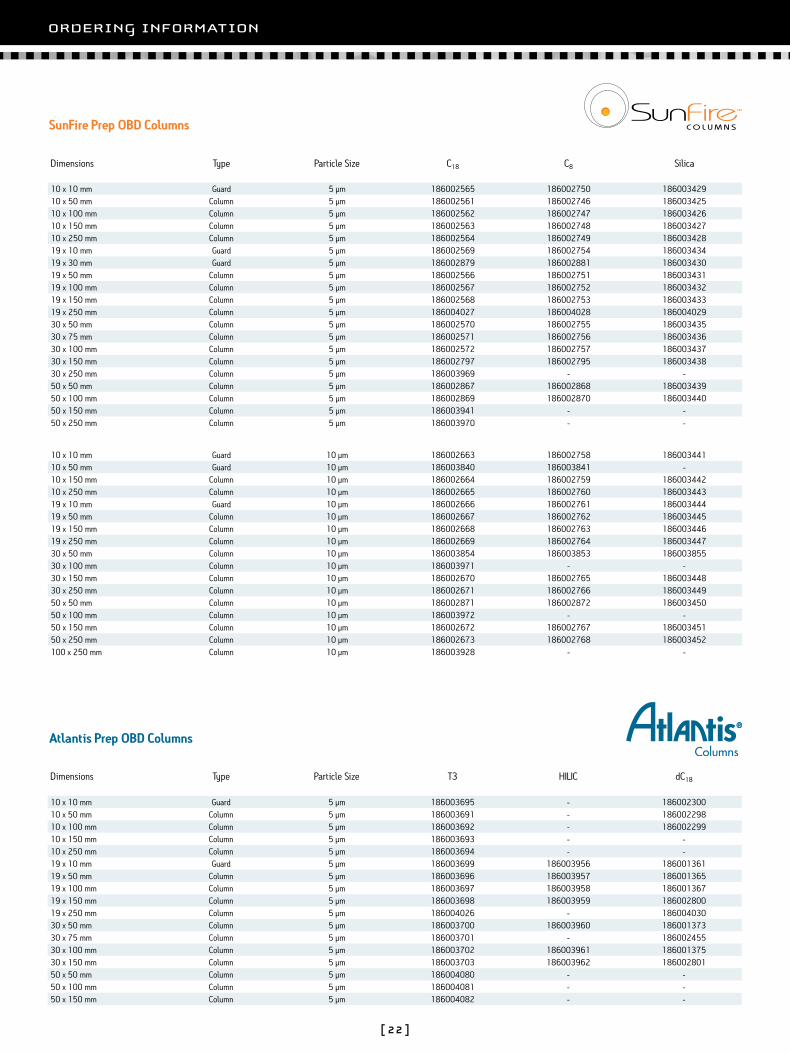
SunFire Prep OBD Columns
Dimensions Type Particle Size C18 C8 Silica
10 x 10 mm Guard 5 µm 186002565 186002750 18600342910 x 50 mm Column 5 µm 186002561 186002746 18600342510 x 100 mm Column 5 µm 186002562 186002747 18600342610 x 150 mm Column 5 µm 186002563 186002748 18600342710 x 250 mm Column 5 µm 186002564 186002749 18600342819 x 10 mm Guard 5 µm 186002569 186002754 18600343419 x 30 mm Guard 5 µm 186002879 186002881 18600343019 x 50 mm Column 5 µm 186002566 186002751 18600343119 x 100 mm Column 5 µm 186002567 186002752 18600343219 x 150 mm Column 5 µm 186002568 186002753 18600343319 x 250 mm Column 5 µm 186004027 186004028 18600402930 x 50 mm Column 5 µm 186002570 186002755 18600343530 x 75 mm Column 5 µm 186002571 186002756 18600343630 x 100 mm Column 5 µm 186002572 186002757 18600343730 x 150 mm Column 5 µm 186002797 186002795 18600343830 x 250 mm Column 5 µm 186003969 - -50 x 50 mm Column 5 µm 186002867 186002868 18600343950 x 100 mm Column 5 µm 186002869 186002870 18600344050 x 150 mm Column 5 µm 186003941 - -50 x 250 mm Column 5 µm 186003970 - -
Atlantis Prep OBD Columns
Dimensions Type Particle Size T3 HILIC dC18
10 x 10 mm Guard 5 µm 186003695 - 18600230010 x 50 mm Column 5 µm 186003691 - 18600229810 x 100 mm Column 5 µm 186003692 - 18600229910 x 150 mm Column 5 µm 186003693 - -10 x 250 mm Column 5 µm 186003694 - -19 x 10 mm Guard 5 µm 186003699 186003956 18600136119 x 50 mm Column 5 µm 186003696 186003957 18600136519 x 100 mm Column 5 µm 186003697 186003958 18600136719 x 150 mm Column 5 µm 186003698 186003959 18600280019 x 250 mm Column 5 µm 186004026 - 18600403030 x 50 mm Column 5 µm 186003700 186003960 18600137330 x 75 mm Column 5 µm 186003701 - 18600245530 x 100 mm Column 5 µm 186003702 186003961 18600137530 x 150 mm Column 5 µm 186003703 186003962 18600280150 x 50 mm Column 5 µm 186004080 - -50 x 100 mm Column 5 µm 186004081 - -50 x 150 mm Column 5 µm 186004082 - -
10 x 10 mm Guard 10 µm 186002663 186002758 18600344110 x 50 mm Guard 10 µm 186003840 186003841 -10 x 150 mm Column 10 µm 186002664 186002759 18600344210 x 250 mm Column 10 µm 186002665 186002760 18600344319 x 10 mm Guard 10 µm 186002666 186002761 18600344419 x 50 mm Column 10 µm 186002667 186002762 18600344519 x 150 mm Column 10 µm 186002668 186002763 18600344619 x 250 mm Column 10 µm 186002669 186002764 18600344730 x 50 mm Column 10 µm 186003854 186003853 18600385530 x 100 mm Column 10 µm 186003971 - -30 x 150 mm Column 10 µm 186002670 186002765 18600344830 x 250 mm Column 10 µm 186002671 186002766 18600344950 x 50 mm Column 10 µm 186002871 186002872 18600345050 x 100 mm Column 10 µm 186003972 - -50 x 150 mm Column 10 µm 186002672 186002767 18600345150 x 250 mm Column 10 µm 186002673 186002768 186003452100 x 250 mm Column 10 µm 186003928 - -
orderIng InformATIon
[ ]23
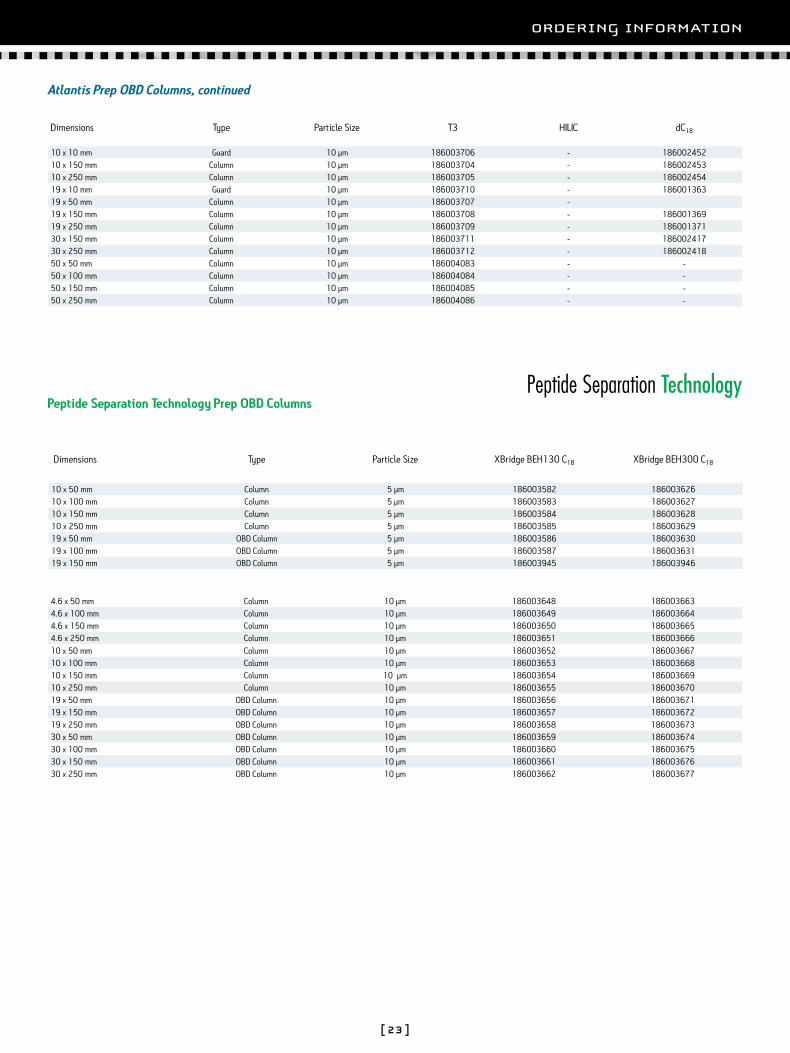
Atlantis Prep OBD Columns, continued
Peptide Separation Technology Prep OBD Columns
Dimensions Type Particle Size T3 HILIC dC18
10 x 10 mm Guard 10 µm 186003706 - 18600245210 x 150 mm Column 10 µm 186003704 - 18600245310 x 250 mm Column 10 µm 186003705 - 18600245419 x 10 mm Guard 10 µm 186003710 - 18600136319 x 50 mm Column 10 µm 186003707 -19 x 150 mm Column 10 µm 186003708 - 18600136919 x 250 mm Column 10 µm 186003709 - 18600137130 x 150 mm Column 10 µm 186003711 - 18600241730 x 250 mm Column 10 µm 186003712 - 18600241850 x 50 mm Column 10 µm 186004083 - -50 x 100 mm Column 10 µm 186004084 - -50 x 150 mm Column 10 µm 186004085 - -50 x 250 mm Column 10 µm 186004086 - -
Dimensions Type Particle Size XBridge BEH130 C18 XBridge BEH300 C18
10 x 50 mm Column 5 µm 186003582 18600362610 x 100 mm Column 5 µm 186003583 18600362710 x 150 mm Column 5 µm 186003584 18600362810 x 250 mm Column 5 µm 186003585 18600362919 x 50 mm OBD Column 5 µm 186003586 18600363019 x 100 mm OBD Column 5 µm 186003587 18600363119 x 150 mm OBD Column 5 µm 186003945 186003946
10 x 50 mm Column 10 µm 186003652 18600366710 x 100 mm Column 10 µm 186003653 18600366810 x 150 mm Column 10 µm 186003654 18600366910 x 250 mm Column 10 µm 186003655 18600367019 x 50 mm OBD Column 10 µm 186003656 18600367119 x 150 mm OBD Column 10 µm 186003657 18600367219 x 250 mm OBD Column 10 µm 186003658 18600367330 x 50 mm OBD Column 10 µm 186003659 18600367430 x 100 mm OBD Column 10 µm 186003660 18600367530 x 150 mm OBD Column 10 µm 186003661 18600367630 x 250 mm OBD Column 10 µm 186003662 186003677
Peptide Separation Technology
4.6 x 50 mm Column 10 µm 186003648 1860036634.6 x 100 mm Column 10 µm 186003649 1860036644.6 x 150 mm Column 10 µm 186003650 1860036654.6 x 250 mm Column 10 µm 186003651 186003666

Austria and European Export (Central South Eastern Europe, CIS and Middle East) 43 1 877 18 07
Australia 61 2 9933 1777
Belgium 32 2 726 1000
Brazil 55 11 5094-3788
Canada 1 800 252 4752 x2205
China 86 21 6879 5888
CIS/Russia +7 495 3367000
Czech Republic 420 2 617 1 1384
Denmark 45 46 59 8080
Finland 09 5659 6288
France 33 1 30 48 72 00
Germany 49 6196 400600
Hong Kong 852 29 64 1800
Hungary 36 1 350 5086
India and India Subcontinent 91 80 2837 1900
Ireland 353 1 448 1500
Italy 39 02 27 421 1
Japan 81 3 3471 7191
Korea 82 2 820 2700
Mexico 52 55 5200 1860
The Netherlands 31 76 508 7200
Norway 47 63 84 60 50
Poland 48 22 833 4400
Puerto Rico 1 787 747 8445
Singapore 65 6273 1221
Spain 34 93 600 9300
Sweden 46 8 555 11 500
Switzerland 41 56 676 70 00
Taiwan 886 2 2543 1898
United Kingdom 44 208 238 6100
All other countries: Waters Corporation U.S.A. 1 508 478 2000
1 800 252 4752
www.waters.com
sales offices
© 2007 Waters Corporation. Waters, OBD, XBridge, SunFire, XTerra, BEH Technology, ACQUITY UPLC,
Alliance, Atlantis, UPLC, UltraPerformance LC and AutoPurification are trade-marks of Waters Corporation. All other trademarks are acknowledged.
720002336EN September 2007 SC-GW
The quality management system of Waters’ manufacturing facilitiesin Taunton, Massachusetts and Wexford, Ireland complies with the Interna-tional Standard ISO 9001:2000 Quality Management and Quality Assurance Standards. Waters’ quality management system is periodically audited by the registering body to ensure compliance.