Embed Size (px)
Citation preview
1232 JOURNAL OF LIGHTWAVE TECHNOLOGY, VOL. 23, NO. 3, MARCH 2005
Optimum Optical Fiber Design for a DRA-BasedDWDM Transmission System
Chisato Fukai, Kazuhide Nakajima, Jian Zhou, Katsusuke Tajima, Kenji Kurokawa, and Izumi Sankawa
Abstract—This paper describes the distributed Raman amplifi-cation (DRA) transmission characteristic in an optical fiber bothnumerically and experimentally. The paper clarifies the relation-ship between optical fiber parameters and DRA transmissionperformance with regard to the signal-to-noise ratio (SNR) char-acteristics and nonlinear impairments. These relationships can besuccessfully discussed, taking account of various fiber parameters,including Raman gain efficiency, the attenuation coefficient atsignal and pump wavelengths, the Rayleigh scattering coefficient,and the nonlinear refractive index, as a function of the relativeindex difference in an optical fiber. An example of an optimumfiber design for a DRA-based dense-wavelength-division-multi-plexing (DWDM) transmission system is also discussed.
Index Terms—Dense-wavelength-division multiplexing(DWDM), distributed Raman amplification, dopant dependence,nonlinear impairment, optical fiber, signal-to-noise ratio (SNR).
I. INTRODUCTION
RAMAN amplification is a key technology for increasingthe transmission capacity in an optical fiber network. In re-
cent years, dense-wavelength-division-multiplexing (DWDM)transmission experiments utilizing a distributed Raman ampli-fication (DRA) technique with a capacity of several terabits persecond have been reported [1], [2]. The DRA technique gener-ally achieves a better signal-to-noise ratio (SNR) than conven-tional erbium-doped fiber amplifier (EDFA)-based transmission[3]. Moreover, DRA transmission can be employed in an arbi-trary wavelength region by designing the pump wavelength.
The Raman gain in an optical fiber depends on the Ramangain coefficient, which is strongly related to the dopant materialsand their concentration [4], [5]. Therefore, the Raman gain char-acteristics of various types of optical fiber have been researched[6], [7]. In addition, the SNR characteristic in a DRA transmis-sion system has been numerically clarified, taking the conven-tional fiber parameters into consideration [8]. However, the ef-fective parameter values in an actual fiber are closely relatedto the refractive-index profile and electric-field pattern. Further-more, it is essential to optimize the chromatic dispersion char-acteristic in an optical fiber for high-bit-rate and/or long-dis-tance DWDM transmission systems [9]. Therefore, it is veryimportant to clarify the optimum fiber for effective applicationto DRA-based DWDM transmission systems.
This paper describes the DRA transmission characteristic andan optical fiber optimization technique, both numerically andexperimentally. Both the SNR characteristic and the nonlinear
Manuscript received July 8, 2004; revised October 6, 2004.The authors are with NTT Access Network Service Systems Laboratories,
Ibaraki 305 0805, Japan (e-mail: [email protected]).Digital Object Identifier 10.1109/JLT.2004.840354
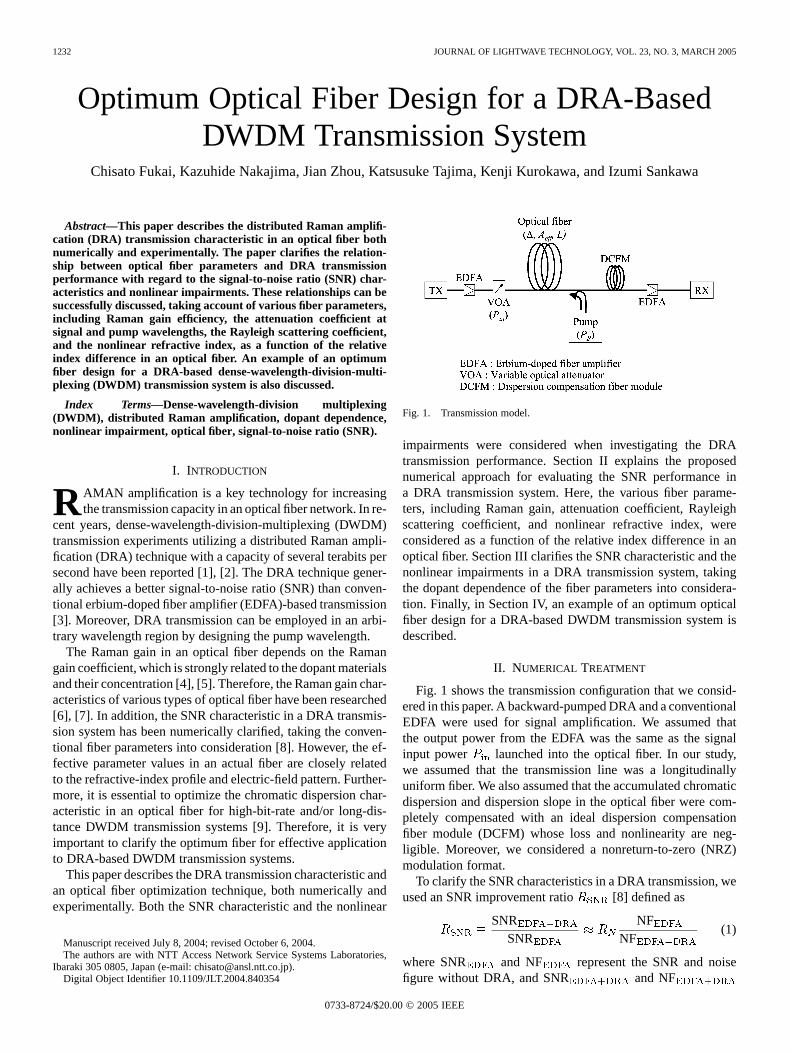
Fig. 1. Transmission model.
impairments were considered when investigating the DRAtransmission performance. Section II explains the proposednumerical approach for evaluating the SNR performance ina DRA transmission system. Here, the various fiber parame-ters, including Raman gain, attenuation coefficient, Rayleighscattering coefficient, and nonlinear refractive index, wereconsidered as a function of the relative index difference in anoptical fiber. Section III clarifies the SNR characteristic and thenonlinear impairments in a DRA transmission system, takingthe dopant dependence of the fiber parameters into considera-tion. Finally, in Section IV, an example of an optimum opticalfiber design for a DRA-based DWDM transmission system isdescribed.
II. NUMERICAL TREATMENT
Fig. 1 shows the transmission configuration that we consid-ered in this paper. A backward-pumped DRA and a conventionalEDFA were used for signal amplification. We assumed thatthe output power from the EDFA was the same as the signalinput power launched into the optical fiber. In our study,we assumed that the transmission line was a longitudinallyuniform fiber. We also assumed that the accumulated chromaticdispersion and dispersion slope in the optical fiber were com-pletely compensated with an ideal dispersion compensationfiber module (DCFM) whose loss and nonlinearity are neg-ligible. Moreover, we considered a nonreturn-to-zero (NRZ)modulation format.
To clarify the SNR characteristics in a DRA transmission, weused an SNR improvement ratio [8] defined as
SNRSNR
NFNF
(1)
where SNR and NF represent the SNR and noisefigure without DRA, and SNR and NF
0733-8724/$20.00 © 2005 IEEE
FUKAI et al.: OPTIMUM OPTICAL FIBER DESIGN 1233
indicate the respective values with DRA. denotes the non-linearity ratio. Here, and NF are written as
(2)
NF
(3)
where , , , , , and are effective length[4], optical noise power density, photon energy, double Rayleighscattering noise power, and the bandwidths of the electrical andoptical filters, respectively. Moreover, is the netgain over the distance to , and this can be expressed as
by using the Raman gain and thetransmission loss . Here, and can be written as (4)and (5), shown at the bottom of the page, where is the back-ward pump power. Moreover, and show theRaman gain efficiency and attenuation coefficient at wavelength
, which can be expressed as [10], [11]
(6)
(7)
where is the effective area andis the infrared absorption loss. Further-
more, denotes the relative index difference in an optical fiber,which is defined as (8) using the refractive indexes of the core
and SiO .
(8)
The coefficient in (6) and in (7) represent constants thatdepend on the fiber material. The values for germanium (Ge)-and fluorine (F)-doped fiber are 2.16 and 0.32, respectively [10],and the values for Ge- and F-doped fiber are 0.44 and 0.41,respectively [11]. In addition, and are expressed as
(9)
(10)
TABLE ISYSTEM PARAMETERS
where is the Rayleigh backscatter coefficient, which isshown as [12]
(11)
Thus, the SNR performance in a DRA transmission system withvarious fibers can be evaluated as a function of and .In the later discussion, we assumed a conventional 1.3- m zero-dispersion single-mode fiber (SMF) for a solely EDFA-basedtransmission system as a reference.
By contrast, we calculated the nonlinear impairments usingthe split-step Fourier method [13]. Here, we also considered thedopant dependence of the nonlinear refractive index as
(12)
where the values for Ge- and F-doped fiber are 0.505 and0.220, respectively [14].
III. DRA TRANSMISSION PERFORMANCE IN AN OPTICAL FIBER
A. SNR Characteristic
We then discussed the DRA performance of an optical fiber.In our study, we assumed the system parameters as summarizedin Table I. The signal wavelength and pump wavelengthwere set at 1550 and 1450 nm or 1580 and 1480 nm, respec-tively. We assumed a fiber length of 80 km. Moreover, we setthe noise figure of the EDFA at 6.5 dB. We also set the signal bitrate at 10 or 40 Gb/s. The optical and electrical filter band-widths and were set at and , respectively.Moreover, the signal was modulated with an NRZ modulationformat with a mark ratio of 1/2 using a LiNbO intensity modu-lator. We also set the pseudorandom sequence length at .
Table II summarizes the test fiber parameters. We preparedthree fibers with different relative index differences for the ex-perimental discussion. Here, 0 for fiber C denotes puresilica core fiber with fluorine-doped cladding. Each fiber wascomposed of three or four fiber spools whose dispersion varia-tion was less than 0.7 ps/nm km. Moreover, the absolute valueof the total dispersion at the end of the DCFM was controlled sothat it was less than 200 ps/nm km. Here, the residual dispersion
(4)
(5)
1234 JOURNAL OF LIGHTWAVE TECHNOLOGY, VOL. 23, NO. 3, MARCH 2005
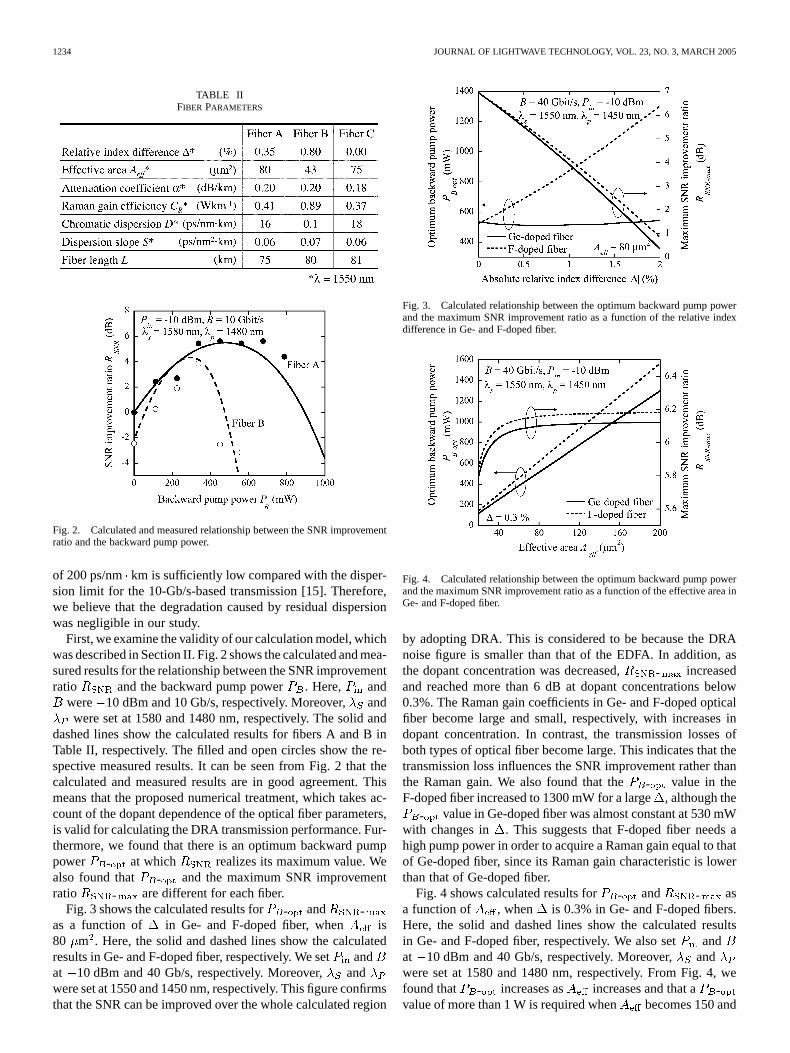
TABLE IIFIBER PARAMETERS
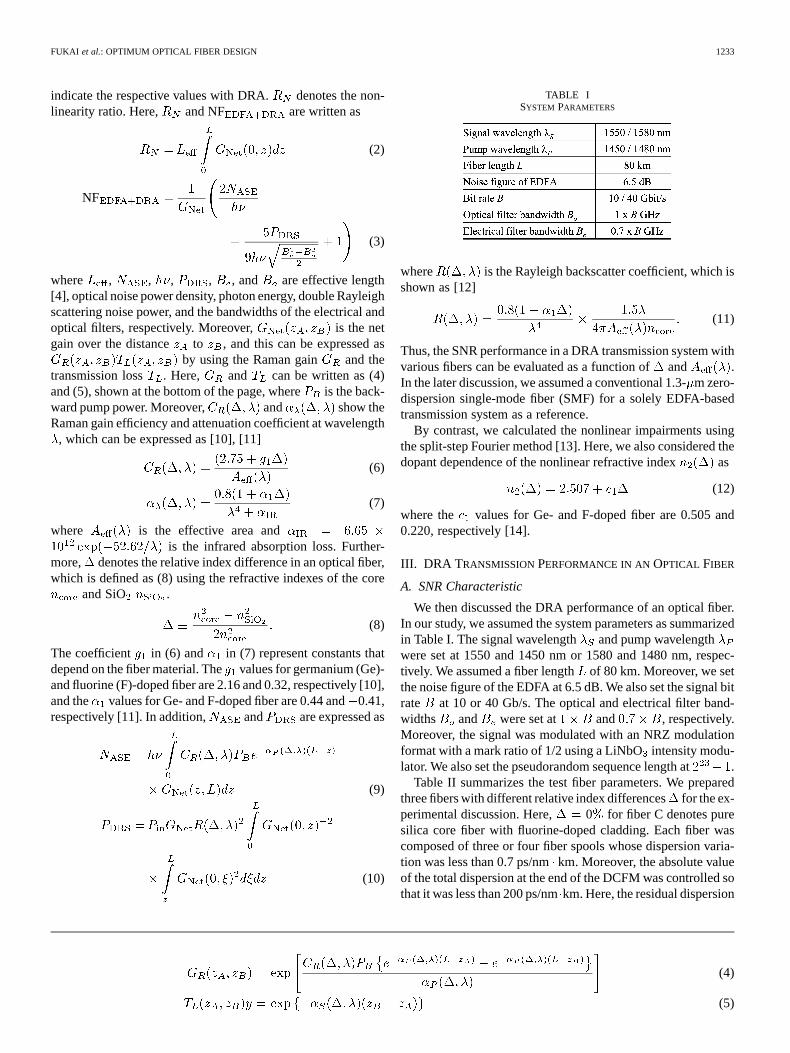
Fig. 2. Calculated and measured relationship between the SNR improvementratio and the backward pump power.
of 200 ps/nm km is sufficiently low compared with the disper-sion limit for the 10-Gb/s-based transmission [15]. Therefore,we believe that the degradation caused by residual dispersionwas negligible in our study.
First, we examine the validity of our calculation model, whichwas described in Section II. Fig. 2 shows the calculated and mea-sured results for the relationship between the SNR improvementratio and the backward pump power . Here, and
were 10 dBm and 10 Gb/s, respectively. Moreover, andwere set at 1580 and 1480 nm, respectively. The solid and
dashed lines show the calculated results for fibers A and B inTable II, respectively. The filled and open circles show the re-spective measured results. It can be seen from Fig. 2 that thecalculated and measured results are in good agreement. Thismeans that the proposed numerical treatment, which takes ac-count of the dopant dependence of the optical fiber parameters,is valid for calculating the DRA transmission performance. Fur-thermore, we found that there is an optimum backward pumppower - at which realizes its maximum value. Wealso found that - and the maximum SNR improvementratio - are different for each fiber.
Fig. 3 shows the calculated results for - and -as a function of in Ge- and F-doped fiber, when is80 m . Here, the solid and dashed lines show the calculatedresults in Ge- and F-doped fiber, respectively. We set andat 10 dBm and 40 Gb/s, respectively. Moreover, andwere set at 1550 and 1450 nm, respectively. This figure confirmsthat the SNR can be improved over the whole calculated region
Fig. 3. Calculated relationship between the optimum backward pump powerand the maximum SNR improvement ratio as a function of the relative indexdifference in Ge- and F-doped fiber.
Fig. 4. Calculated relationship between the optimum backward pump powerand the maximum SNR improvement ratio as a function of the effective area inGe- and F-doped fiber.
by adopting DRA. This is considered to be because the DRAnoise figure is smaller than that of the EDFA. In addition, asthe dopant concentration was decreased, - increasedand reached more than 6 dB at dopant concentrations below0.3%. The Raman gain coefficients in Ge- and F-doped opticalfiber become large and small, respectively, with increases indopant concentration. In contrast, the transmission losses ofboth types of optical fiber become large. This indicates that thetransmission loss influences the SNR improvement rather thanthe Raman gain. We also found that the - value in theF-doped fiber increased to 1300 mW for a large , although the
- value in Ge-doped fiber was almost constant at 530 mWwith changes in . This suggests that F-doped fiber needs ahigh pump power in order to acquire a Raman gain equal to thatof Ge-doped fiber, since its Raman gain characteristic is lowerthan that of Ge-doped fiber.
Fig. 4 shows calculated results for - and - asa function of , when is 0.3% in Ge- and F-doped fibers.Here, the solid and dashed lines show the calculated resultsin Ge- and F-doped fiber, respectively. We also set andat 10 dBm and 40 Gb/s, respectively. Moreover, andwere set at 1580 and 1480 nm, respectively. From Fig. 4, wefound that - increases as increases and that a -value of more than 1 W is required when becomes 150 and
FUKAI et al.: OPTIMUM OPTICAL FIBER DESIGN 1235
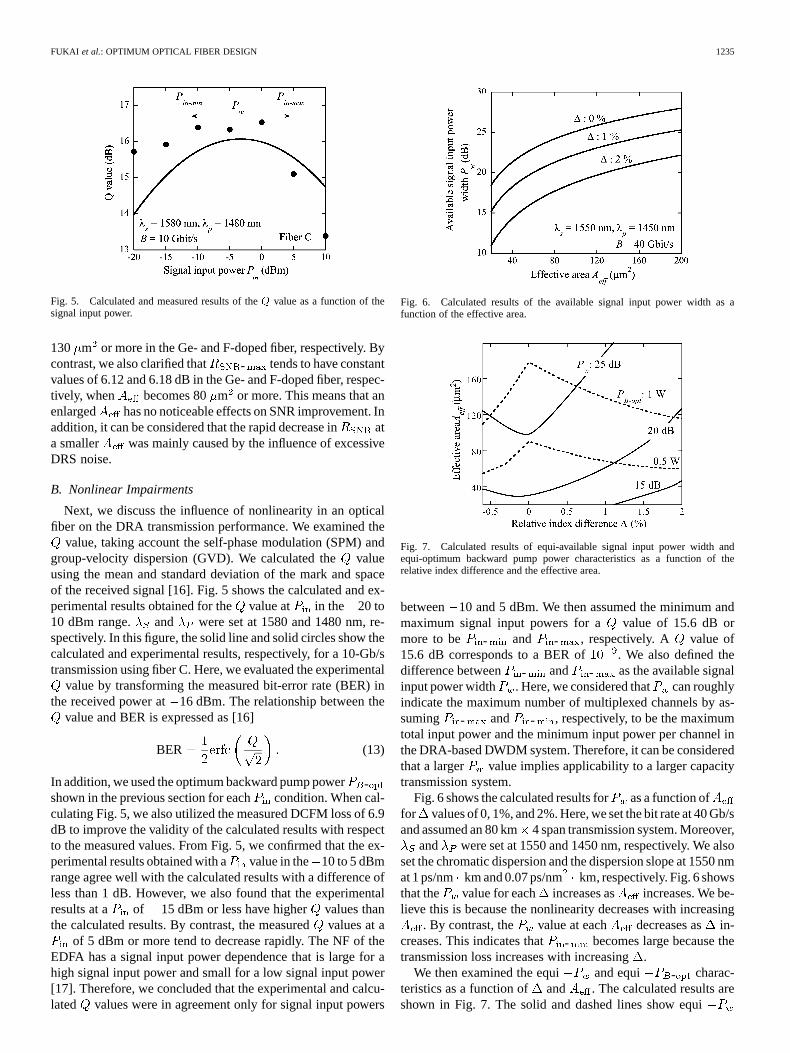
Fig. 5. Calculated and measured results of the � value as a function of thesignal input power.
130 m or more in the Ge- and F-doped fiber, respectively. Bycontrast, we also clarified that - tends to have constantvalues of 6.12 and 6.18 dB in the Ge- and F-doped fiber, respec-tively, when becomes 80 m or more. This means that anenlarged has no noticeable effects on SNR improvement. Inaddition, it can be considered that the rapid decrease in ata smaller was mainly caused by the influence of excessiveDRS noise.
B. Nonlinear Impairments
Next, we discuss the influence of nonlinearity in an opticalfiber on the DRA transmission performance. We examined the
value, taking account the self-phase modulation (SPM) andgroup-velocity dispersion (GVD). We calculated the valueusing the mean and standard deviation of the mark and spaceof the received signal [16]. Fig. 5 shows the calculated and ex-perimental results obtained for the value at in the 20 to10 dBm range. and were set at 1580 and 1480 nm, re-spectively. In this figure, the solid line and solid circles show thecalculated and experimental results, respectively, for a 10-Gb/stransmission using fiber C. Here, we evaluated the experimental
value by transforming the measured bit-error rate (BER) inthe received power at 16 dBm. The relationship between the
value and BER is expressed as [16]
BER (13)
In addition, we used the optimum backward pump power -shown in the previous section for each condition. When cal-culating Fig. 5, we also utilized the measured DCFM loss of 6.9dB to improve the validity of the calculated results with respectto the measured values. From Fig. 5, we confirmed that the ex-perimental results obtained with a value in the 10 to 5 dBmrange agree well with the calculated results with a difference ofless than 1 dB. However, we also found that the experimentalresults at a of 15 dBm or less have higher values thanthe calculated results. By contrast, the measured values at a
of 5 dBm or more tend to decrease rapidly. The NF of theEDFA has a signal input power dependence that is large for ahigh signal input power and small for a low signal input power[17]. Therefore, we concluded that the experimental and calcu-lated values were in agreement only for signal input powers
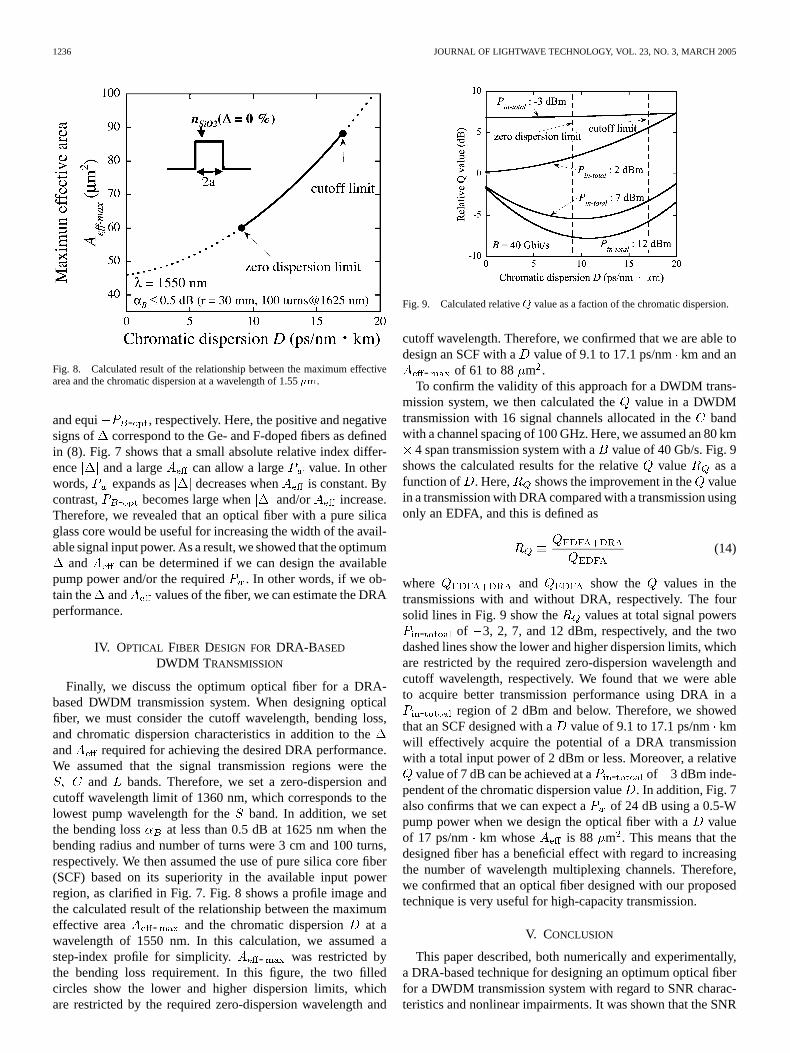
Fig. 6. Calculated results of the available signal input power width as afunction of the effective area.
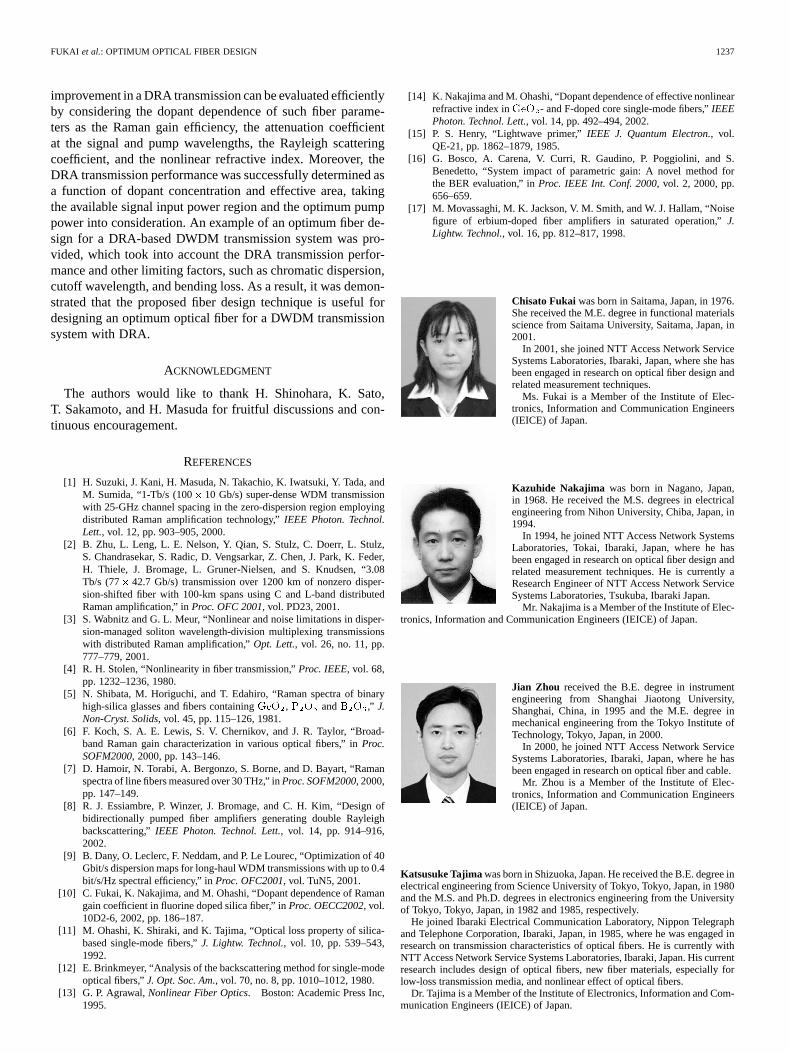
Fig. 7. Calculated results of equi-available signal input power width andequi-optimum backward pump power characteristics as a function of therelative index difference and the effective area.
between 10 and 5 dBm. We then assumed the minimum andmaximum signal input powers for a value of 15.6 dB ormore to be - and - , respectively. A value of15.6 dB corresponds to a BER of . We also defined thedifference between - and - as the available signalinput power width . Here, we considered that can roughlyindicate the maximum number of multiplexed channels by as-suming - and - , respectively, to be the maximumtotal input power and the minimum input power per channel inthe DRA-based DWDM system. Therefore, it can be consideredthat a larger value implies applicability to a larger capacitytransmission system.
Fig. 6 shows the calculated results for as a function offor values of 0, 1%, and 2%. Here, we set the bit rate at 40 Gb/sand assumed an 80 km 4 span transmission system. Moreover,
and were set at 1550 and 1450 nm, respectively. We alsoset the chromatic dispersion and the dispersion slope at 1550 nmat 1 ps/nm km and 0.07 ps/nm km, respectively. Fig. 6 showsthat the value for each increases as increases. We be-lieve this is because the nonlinearity decreases with increasing
. By contrast, the value at each decreases as in-creases. This indicates that - becomes large because thetransmission loss increases with increasing .
We then examined the equi and equi - charac-teristics as a function of and . The calculated results areshown in Fig. 7. The solid and dashed lines show equi
1236 JOURNAL OF LIGHTWAVE TECHNOLOGY, VOL. 23, NO. 3, MARCH 2005
Fig. 8. Calculated result of the relationship between the maximum effectivearea and the chromatic dispersion at a wavelength of 1.55 ��.
and equi - , respectively. Here, the positive and negativesigns of correspond to the Ge- and F-doped fibers as definedin (8). Fig. 7 shows that a small absolute relative index differ-ence and a large can allow a large value. In otherwords, expands as decreases when is constant. Bycontrast, - becomes large when and/or increase.Therefore, we revealed that an optical fiber with a pure silicaglass core would be useful for increasing the width of the avail-able signal input power. As a result, we showed that the optimum
and can be determined if we can design the availablepump power and/or the required . In other words, if we ob-tain the and values of the fiber, we can estimate the DRAperformance.
IV. OPTICAL FIBER DESIGN FOR DRA-BASED
DWDM TRANSMISSION
Finally, we discuss the optimum optical fiber for a DRA-based DWDM transmission system. When designing opticalfiber, we must consider the cutoff wavelength, bending loss,and chromatic dispersion characteristics in addition to theand required for achieving the desired DRA performance.We assumed that the signal transmission regions were the
and bands. Therefore, we set a zero-dispersion andcutoff wavelength limit of 1360 nm, which corresponds to thelowest pump wavelength for the band. In addition, we setthe bending loss at less than 0.5 dB at 1625 nm when thebending radius and number of turns were 3 cm and 100 turns,respectively. We then assumed the use of pure silica core fiber(SCF) based on its superiority in the available input powerregion, as clarified in Fig. 7. Fig. 8 shows a profile image andthe calculated result of the relationship between the maximumeffective area - and the chromatic dispersion at awavelength of 1550 nm. In this calculation, we assumed astep-index profile for simplicity. - was restricted bythe bending loss requirement. In this figure, the two filledcircles show the lower and higher dispersion limits, whichare restricted by the required zero-dispersion wavelength and
Fig. 9. Calculated relative� value as a faction of the chromatic dispersion.
cutoff wavelength. Therefore, we confirmed that we are able todesign an SCF with a value of 9.1 to 17.1 ps/nm km and an
- of 61 to 88 m .To confirm the validity of this approach for a DWDM trans-
mission system, we then calculated the value in a DWDMtransmission with 16 signal channels allocated in the bandwith a channel spacing of 100 GHz. Here, we assumed an 80 km
4 span transmission system with a value of 40 Gb/s. Fig. 9shows the calculated results for the relative value as afunction of . Here, shows the improvement in the valuein a transmission with DRA compared with a transmission usingonly an EDFA, and this is defined as
(14)
where and show the values in thetransmissions with and without DRA, respectively. The foursolid lines in Fig. 9 show the values at total signal powers
- of 3, 2, 7, and 12 dBm, respectively, and the twodashed lines show the lower and higher dispersion limits, whichare restricted by the required zero-dispersion wavelength andcutoff wavelength, respectively. We found that we were ableto acquire better transmission performance using DRA in a
- region of 2 dBm and below. Therefore, we showedthat an SCF designed with a value of 9.1 to 17.1 ps/nm kmwill effectively acquire the potential of a DRA transmissionwith a total input power of 2 dBm or less. Moreover, a relative
value of 7 dB can be achieved at a - of 3 dBm inde-pendent of the chromatic dispersion value . In addition, Fig. 7also confirms that we can expect a of 24 dB using a 0.5-Wpump power when we design the optical fiber with a valueof 17 ps/nm km whose is 88 m . This means that thedesigned fiber has a beneficial effect with regard to increasingthe number of wavelength multiplexing channels. Therefore,we confirmed that an optical fiber designed with our proposedtechnique is very useful for high-capacity transmission.
V. CONCLUSION
This paper described, both numerically and experimentally,a DRA-based technique for designing an optimum optical fiberfor a DWDM transmission system with regard to SNR charac-teristics and nonlinear impairments. It was shown that the SNR
FUKAI et al.: OPTIMUM OPTICAL FIBER DESIGN 1237
improvement in a DRA transmission can be evaluated efficientlyby considering the dopant dependence of such fiber parame-ters as the Raman gain efficiency, the attenuation coefficientat the signal and pump wavelengths, the Rayleigh scatteringcoefficient, and the nonlinear refractive index. Moreover, theDRA transmission performance was successfully determined asa function of dopant concentration and effective area, takingthe available signal input power region and the optimum pumppower into consideration. An example of an optimum fiber de-sign for a DRA-based DWDM transmission system was pro-vided, which took into account the DRA transmission perfor-mance and other limiting factors, such as chromatic dispersion,cutoff wavelength, and bending loss. As a result, it was demon-strated that the proposed fiber design technique is useful fordesigning an optimum optical fiber for a DWDM transmissionsystem with DRA.
ACKNOWLEDGMENT
The authors would like to thank H. Shinohara, K. Sato,T. Sakamoto, and H. Masuda for fruitful discussions and con-tinuous encouragement.
REFERENCES
[1] H. Suzuki, J. Kani, H. Masuda, N. Takachio, K. Iwatsuki, Y. Tada, andM. Sumida, “1-Tb/s (100� 10 Gb/s) super-dense WDM transmissionwith 25-GHz channel spacing in the zero-dispersion region employingdistributed Raman amplification technology,” IEEE Photon. Technol.Lett., vol. 12, pp. 903–905, 2000.
[2] B. Zhu, L. Leng, L. E. Nelson, Y. Qian, S. Stulz, C. Doerr, L. Stulz,S. Chandrasekar, S. Radic, D. Vengsarkar, Z. Chen, J. Park, K. Feder,H. Thiele, J. Bromage, L. Gruner-Nielsen, and S. Knudsen, “3.08Tb/s (77� 42.7 Gb/s) transmission over 1200 km of nonzero disper-sion-shifted fiber with 100-km spans using C and L-band distributedRaman amplification,” in Proc. OFC 2001, vol. PD23, 2001.
[3] S. Wabnitz and G. L. Meur, “Nonlinear and noise limitations in disper-sion-managed soliton wavelength-division multiplexing transmissionswith distributed Raman amplification,” Opt. Lett., vol. 26, no. 11, pp.777–779, 2001.
[4] R. H. Stolen, “Nonlinearity in fiber transmission,” Proc. IEEE, vol. 68,pp. 1232–1236, 1980.
[5] N. Shibata, M. Horiguchi, and T. Edahiro, “Raman spectra of binaryhigh-silica glasses and fibers containing ��� , � � and � � ,” J.Non-Cryst. Solids, vol. 45, pp. 115–126, 1981.
[6] F. Koch, S. A. E. Lewis, S. V. Chernikov, and J. R. Taylor, “Broad-band Raman gain characterization in various optical fibers,” in Proc.SOFM2000, 2000, pp. 143–146.
[7] D. Hamoir, N. Torabi, A. Bergonzo, S. Borne, and D. Bayart, “Ramanspectra of line fibers measured over 30 THz,” in Proc. SOFM2000, 2000,pp. 147–149.
[8] R. J. Essiambre, P. Winzer, J. Bromage, and C. H. Kim, “Design ofbidirectionally pumped fiber amplifiers generating double Rayleighbackscattering,” IEEE Photon. Technol. Lett., vol. 14, pp. 914–916,2002.
[9] B. Dany, O. Leclerc, F. Neddam, and P. Le Lourec, “Optimization of 40Gbit/s dispersion maps for long-haul WDM transmissions with up to 0.4bit/s/Hz spectral efficiency,” in Proc. OFC2001, vol. TuN5, 2001.
[10] C. Fukai, K. Nakajima, and M. Ohashi, “Dopant dependence of Ramangain coefficient in fluorine doped silica fiber,” in Proc. OECC2002, vol.10D2-6, 2002, pp. 186–187.
[11] M. Ohashi, K. Shiraki, and K. Tajima, “Optical loss property of silica-based single-mode fibers,” J. Lightw. Technol., vol. 10, pp. 539–543,1992.
[12] E. Brinkmeyer, “Analysis of the backscattering method for single-modeoptical fibers,” J. Opt. Soc. Am., vol. 70, no. 8, pp. 1010–1012, 1980.
[13] G. P. Agrawal, Nonlinear Fiber Optics. Boston: Academic Press Inc,1995.
[14] K. Nakajima and M. Ohashi, “Dopant dependence of effective nonlinearrefractive index in ��� - and F-doped core single-mode fibers,” IEEEPhoton. Technol. Lett., vol. 14, pp. 492–494, 2002.
[15] P. S. Henry, “Lightwave primer,” IEEE J. Quantum Electron., vol.QE-21, pp. 1862–1879, 1985.
[16] G. Bosco, A. Carena, V. Curri, R. Gaudino, P. Poggiolini, and S.Benedetto, “System impact of parametric gain: A novel method forthe BER evaluation,” in Proc. IEEE Int. Conf. 2000, vol. 2, 2000, pp.656–659.
[17] M. Movassaghi, M. K. Jackson, V. M. Smith, and W. J. Hallam, “Noisefigure of erbium-doped fiber amplifiers in saturated operation,” J.Lightw. Technol., vol. 16, pp. 812–817, 1998.
Chisato Fukai was born in Saitama, Japan, in 1976.She received the M.E. degree in functional materialsscience from Saitama University, Saitama, Japan, in2001.
In 2001, she joined NTT Access Network ServiceSystems Laboratories, Ibaraki, Japan, where she hasbeen engaged in research on optical fiber design andrelated measurement techniques.
Ms. Fukai is a Member of the Institute of Elec-tronics, Information and Communication Engineers(IEICE) of Japan.
Kazuhide Nakajima was born in Nagano, Japan,in 1968. He received the M.S. degrees in electricalengineering from Nihon University, Chiba, Japan, in1994.
In 1994, he joined NTT Access Network SystemsLaboratories, Tokai, Ibaraki, Japan, where he hasbeen engaged in research on optical fiber design andrelated measurement techniques. He is currently aResearch Engineer of NTT Access Network ServiceSystems Laboratories, Tsukuba, Ibaraki Japan.
Mr. Nakajima is a Member of the Institute of Elec-tronics, Information and Communication Engineers (IEICE) of Japan.
Jian Zhou received the B.E. degree in instrumentengineering from Shanghai Jiaotong University,Shanghai, China, in 1995 and the M.E. degree inmechanical engineering from the Tokyo Institute ofTechnology, Tokyo, Japan, in 2000.
In 2000, he joined NTT Access Network ServiceSystems Laboratories, Ibaraki, Japan, where he hasbeen engaged in research on optical fiber and cable.
Mr. Zhou is a Member of the Institute of Elec-tronics, Information and Communication Engineers(IEICE) of Japan.
Katsusuke Tajima was born in Shizuoka, Japan. He received the B.E. degree inelectrical engineering from Science University of Tokyo, Tokyo, Japan, in 1980and the M.S. and Ph.D. degrees in electronics engineering from the Universityof Tokyo, Tokyo, Japan, in 1982 and 1985, respectively.
He joined Ibaraki Electrical Communication Laboratory, Nippon Telegraphand Telephone Corporation, Ibaraki, Japan, in 1985, where he was engaged inresearch on transmission characteristics of optical fibers. He is currently withNTT Access Network Service Systems Laboratories, Ibaraki, Japan. His currentresearch includes design of optical fibers, new fiber materials, especially forlow-loss transmission media, and nonlinear effect of optical fibers.
Dr. Tajima is a Member of the Institute of Electronics, Information and Com-munication Engineers (IEICE) of Japan.

1238 JOURNAL OF LIGHTWAVE TECHNOLOGY, VOL. 23, NO. 3, MARCH 2005
Kenji Kurokawa was born in Japan in April 1962.He received the B.S. and M.S. degrees in physicsand the Ph.D. degree from the University of Tokyo,Tokyo, Japan, in 1985, 1987, and 1997, respectively.
He joined the Ibaraki Electrical CommunicationLaboratory, Nippon Telegraph and Telephone Corpo-ration (now the NTT Access Network Service Sys-tems Laboratories), Ibaraki, Japan, in 1987, wherehe has been engaged in research on ultrashort op-tical pulse generation and nonlinear effects in opticalfibers.
Dr. Kurokawa is a Member of the Physical Society of Japan, the Japan Societyof Applied Physics, and the Institute of Electronics, Information and Commu-nication Engineers (IEICE) of Japan.
Izumi Sankawa received the B.S. and Dr. Eng. de-grees in electrical engineering from Waseda Univer-sity, Tokyo, Japan, in 1979 and 1991, respectively.
He joined the Ibaraki Electrical CommunicationLaboratories, NTT, Ibaraki, Japan, in 1979, where hehas been engaged in research on optical fiber splicing,testing technologies, and optical fiber measurementand surveillance systems. He is currently Senior Re-search Engineer, Supervisor, of NTT Access NetworkService Systems Laboratories, Ibaraki, Japan.
Dr. Sankawa is a Member of the Institute of Elec-tronics, Information and Communication Engineers (IEICE) of Japan, the JapanSociety of Applied Physics, and the Japan Society of Physics.