Embed Size (px)
Citation preview
OPWP’s 7-YEAR STATEMENT
(2014 – 2020)
APPROVED BY
THE AUTHORITY FOR ELECTRICITY REGULATION, OMAN
(Issue 8)
March, 2014
OMAN POWER AND WATER PROCUREMENT CO. (SAOC)
PO BOX 1388, RUWI PC 112
SULTANATE OF OMAN
Tel: +968 24508400
Fax: +968 24399946
www.omanpwp.com
7-Year Statement (2014-2020) Page i
CONTENTS
LIST OF TABLES ................................................................................................................................................ ii
LIST OF FIGURES ............................................................................................................................................... ii
GLOSSARY ....................................................................................................................................................... iii
OVERVIEW ....................................................................................................................................................... 1
SECTION 1 MAIN INTERCONNECTED SYSTEM ............................................................................................. 3
1.1 DEMAND FOR ELECTRICITY ..................................................................................................................... 3
1.2 POWER GENERATION RESOURCES .......................................................................................................... 7
1.3 ADDITIONAL POWER GENERATION REQUIREMENTS ............................................................................ 14
1.4 DESALINATED WATER REQUIREMENTS ................................................................................................ 17
1.5 COMBINING POWER GENERATION AND WATER DESALINATION ......................................................... 23
1.6 PROCUREMENT ACTIVITIES ................................................................................................................... 24
1.7 FUEL REQUIREMENTS ........................................................................................................................... 26
SECTION 2 SALALAH SYSTEM .................................................................................................................... 29
2.1 DEMAND FOR ELECTRICITY ................................................................................................................... 30
2.2 POWER GENERATION RESOURCES ........................................................................................................ 32
2.3 ADDITIONAL POWER GENERATION REQUIREMENTS ............................................................................ 34
2.4 DESALINATED WATER REQUIREMENTS ................................................................................................ 36
2.5 COMBINING POWER GENERATION AND WATER DESALINATION ......................................................... 38
2.6 PROCUREMENT ACTIVITIES ................................................................................................................... 38
2.7 FUEL REQUIREMENTS ........................................................................................................................... 39
SECTION 3 AD DUQM & MUSANDAM ...................................................................................................... 42
3.1 DEMAND FOR ELECTRICITY ................................................................................................................... 43
3.2 POWER GENERATION RESOURCES ........................................................................................................ 46
3.3 DESALINATED WATER REQUIREMENTS ................................................................................................ 47
3.4 PROCUREMENT ACTIVITIES ................................................................................................................... 50
7-Year Statement (2014-2020) Page ii
LIST OF TABLES
Table 1 Details of P(W)PAs – MIS .................................................................................................................... 8
Table 2 Prospective Contract Extensions ...................................................................................................... 12
Table 3 MIS Procurement Activities in 2014 ................................................................................................. 24
LIST OF FIGURES
Figure 1 Electricity Demand Projections – MIS ................................................................................................. 5
Figure 2 Contracted Generation Capacity – MIS .............................................................................................. 9
Figure 3 Total Power Generation Resources – MIS ........................................................................................ 13
Figure 4 Future Power Generation Capacity Requirements – MIS ................................................................. 15
Figure 5 Water Demand Projections – Main Supply Zones (excluding Dhofar) .............................................. 18
Figure 6 Desalinated Water Demand / Supply Balance – “Interconnected Zone” ......................................... 20
Figure 7 Desalinated Water Demand / Supply Balance – “Sur Zone” ............................................................. 22
Figure 8 Projected Fuel Requirements – MIS ................................................................................................. 27
Figure 9 Electricity Demand Projections – Salalah System ............................................................................. 31
Figure 10 Total Power Generation Resources – Salalah System ...................................................................... 33
Figure 11 Future Power Generation Capacity Requirements – Salalah System ............................................... 35
Figure 12 Water Demand Projections – Dhofar (Salalah/Taqa/Mirbat) ........................................................... 36
Figure 13 Desalinated Water Demand / Supply Balance – Dhofar (Salalah/Taqa/Mirbat) .............................. 37
Figure 14 Projected Fuel Requirements – Salalah System ................................................................................ 40
Figure 15 Electricity Demand Projections – Ad Duqm ...................................................................................... 44
Figure 16 Electricity Demand Projections – Musandam Governorate ............................................................. 45
Figure 17 Water Demand Projections – Ad Duqm Zone ................................................................................... 48
Figure 18 Desalinated Water Supply / Demand Balance – “Ad Duqm Zone” ................................................... 49
7-Year Statement (2014-2020) Page iii
GLOSSARY
AER Authority for Electricity Regulation, Oman
BTU/scf British thermal units per standard cubic foot
CCGT Combined-cycle gas turbine
DGC Dhofar Generating Company
DGW Directorate General of Water (in the Office of the Minister of State and Governor of Dhofar)
DPC Dhofar Power Company (SAOC)
GJ Gigajoule(s)
GPDC Al Ghubrah Power and Desalination Company (SAOC)
HHV Higher Heating Value
IPP Independent power project
IWP Independent water project
IWPP Independent water and power project
kWh Kilowatt hour(s)
LOLH Loss of load hours
m3 Cubic metre(s)
m3/d Cubic metres per day
MEDC Muscat Electricity Distribution Company (SAOC)
MIGD Million imperial gallons per day
MIS Main Interconnected System
MISC Majis Industrial Services Company (SAOC)
MJEC Majan Electricity Company (SAOC)
MOG Ministry of Oil and Gas
MSF Multi-stage flash (desalination technology)
MW Megawatt(s)
MZEC Mazoon Electricity Company (SAOC)
OCGT Open-cycle gas turbine
OETC Oman Electricity Transmission Company (SAOC)
OPWP Oman Power and Water Procurement Company (SAOC)
PAEW Public Authority for Electricity and Water
PDO Petroleum Development Oman (LLC)
PPA Power purchase agreement
PWPA Power and water purchase agreement
RAEC Rural Areas Electricity Company (SAOC)
RO Reverse osmosis (desalination technology)
Sm3 Standard cubic metre(s)
Sm3/d Standard cubic metres per day
TWh Terawatt hour(s) = billion (109) kWh
7-Year Statement (2014-2020) Page 1
OVERVIEW
This Statement provides a 7-year outlook for power and desalinated water supply in the two main systems of
Oman – the Main Interconnected System (MIS) and the Salalah System. It also addresses OPWP’s anticipated
activities with respect to Ad Duqm and Musandam during this period. OPWP prepares the 7-Year Statement
annually in accordance with Condition 5 of its license. This is Issue 8, for the period 2014 to 2020; previous
issues and additional information are available on the OPWP website at www.omanpwp.com.
Demand for Electricity
In the MIS, Under the Expected Demand forecast, peak demand is expected to grow at about 11% per year,
from 4455 MW in 2013 to 9133 MW in 2020. Average demand is expected to grow from 2597 MW
(corresponding to 23 TWh) in 2013 to 5023 MW (44 TWh) in 2020, an average increase of around 10% per
year. Increasing personal income, housing starts, and continuing government investment in infrastructure
projects are major contributors to continued high growth in electricity demand.
Two additional demand scenarios are considered: the Low Case projects 8% annual growth and peak demand
at 7714 MW in 2020, about 1420 MW below Expected Demand. The High Case projects 14% annual growth
and peak demand at 11284 MW in 2020, exceeding Expected Demand by about 2100 MW.
In Salalah, peak demand is expected to grow at 10% per year, from 420 MW in 2013 to 800 MW in 2020. The
Low Case considers 7% growth, reaching 676 MW by 2020, about 120 MW below Expected Demand. The High
Case considers higher growth across all economic sectors, with peak demand increasing at 12% per year to 940
MW in 2020, exceeding Expected Demand by 140 MW.
Power Generation Requirements
In the MIS, the major expected developments through 2020 include: (1) completion of the Sur IPP, which will
add 2000 MW to the generation capacity in 2014; (2) addition of a new IPP in 2017/2018, potentially at two
sites, with aggregate capacity in the range of 2600 to 2850 MW, (3) expiration of contracts at existing plants
summing to 1382 MW, of which much of the expiring capacity is expected to be extended.
In Salalah, the Raysut NPS is planned for privatization in 2014, and the Salalah 2 IPP will be developed for
service in 2018 on a power-only basis with capacity in the range of 300 to 400 MW.
OPWP is also assisting RAECO with the procurement of an IPP in Musandam with net firm capacity of about
100 MW, for operation in 2016.
Desalinated Water Requirements
Water demand in the northern region (the Interconnected Zone, and Sur Zone) is projected to increase by 6%
per year, from 238 million m3 in 2013 to 349 million m3 (i.e., 956,000 m3/d) in 2020.
In the Interconnected Zone, the principal developments include: (1) addition of 45,000 m3/d (10 MIGD) at
Barka I in Q1 2014; (2) another addition of 57,000 m3/d (12.5 MIGD) at Barka I in Q3 2015; (3) addition of the
Muscat City Desalination Plant, at Ghubrah, with capacity of 191,000 m3/d (42 MIGD) in Q4 2014; (4) addition
of a new desalination plant at Qurayyat at 200,000 m3/d (44 MIGD) in 2017; (5) addition of a new desalination
plant at As Suwayq at up to 225,000 m3/d (50 MIGD) in 2018; and (6) expiration of PWPAs at Barka I and
7-Year Statement (2014-2020) Page 2
remaining units at the Ghubrah desalination plant in 2018. OPWP will also consider the potential for contract
extension of the Barka I desalination plant at this time (193,200 m3/d in total, or 43 MIGD).
For the Sur Zone, the principal developments include: (1) the WPA for the existing Sur IWP is expected to be
novated from PAEW to OPWP, and (2) OPWP plans to procure an extension to the Sur IWP with capacity of
50,000 m3/d (11 MIGD) for COD in late 2015.
In Salalah, DGW projects water demand to grow at 8%, and peak water demand to increase from 75,000 m3/d
in 2013 to 132,000 m3/d in 2020. On this basis, the Salalah IWPP, with capacity 68,190 m3/d (15 MIGD), is
already at maximum output and demand exceeds the available supply of desalinated water. There are
sufficient groundwater resources available to meet requirements for several years, and OPWP expects to
consult with DGW in 2014 with respect to capacity additions for desalinated water.
PAEW has requested OPWP to procure desalination capacity to serve Ad Duqm and Musandam. The Duqm
IWP is planned for late 2017 with capacity of 30,000 m3/d (7 MIGD). The Musandam IWP is planned for late
2015 at Khasab with capacity of about 13,000 m3/d (3 MIGD).
Procurement Activities
In 2014, OPWP expects the following procurement activities for the MIS: (1) to execute contract extensions to
2020 with the owners of the Al Kamil, Barka I, Wadi Jizzi, and Ghubrah power plants for all or a portion of
capacity associated with expiring contracts; (2) to issue the tender for a new IPP with capacity in the range of
2600 to 2850 MW; (3) to contract for an additional 50,000 m3/d (11 MIGD) desalination capacity at Sur; (4) to
contract for a new 200,000 m3/d (44 MIGD) desalination plant at Qurayyat; and (5) to issue the tender for a
new IWP with capacity of 225,000 m3/d (50 MIGD) at As Suwayq.
For Salalah, OPWP plans to issue a tender in Q1 2014 for the Salalah 2 IPP, with a capacity range of 300-400
MW. OPWP also plans to work closely with DGW to define requirements for additional desalination capacity
which may result in an IWP procurement in the near future.
OPWP also expects in 2014 to contract for the Musandam IPP, at about 100 MW net capacity, and to initiate
procurement for both the Khasab IWP at 13,000 m3/d (3 MIGD) and the Duqm IWP at 30,000 m3/d (6 MIGD).
Fuel Requirements
In the MIS, efficiency improvements in the generation fleet are expected to limit growth in fuel requirements
to 6% per year through 2020, despite nearly 10% growth in electricity production. OPWP achieved a reduction
in gas use from 2012 to 2013, due to new, high efficient plant. Total gas consumption by the main power and
desalination plants is projected to increase from 6.7 billion Sm3 in 2013 to 9.9 billion Sm3 in 2020.
In Salalah, gas requirements are projected to increase at 8% per year, reaching 1.2 billion Sm3 by 2020 as
power requirements grow rapidly at about 10% per year.
7-Year Statement (2014-2020) Page 3
SECTION 1 MAIN INTERCONNECTED SYSTEM
The Main Interconnected System (MIS) extends throughout the Governorates of Muscat and Buraymi, and
most of the Governorates of Al Batinah North, Al Batinah South, Ad Dakhiliyah, Ash Sharqiyah North, Ash
Sharqiyah South and Ad Dhahirah, serving around 736,000 electricity customers.
It comprises a number of power generation facilities, owned and operated by various companies; a single
220/132 kV transmission grid, owned and operated by Oman Electricity Transmission Co. (OETC); and three
distribution networks, owned and operated by Muscat Electricity Distribution Co. (MEDC), Mazoon
Electricity Co. (MZEC) and Majan Electricity Co. (MJEC). The three distribution network operators also act as
“licensed electricity suppliers”, supplying existing and new electricity customers in their respective service
areas. The MIS is presently interconnected with the power systems of Petroleum Development Oman (PDO)
and the Emirate of Abu Dhabi.
Several of the power generation facilities connected to the MIS produce desalinated water in conjunction
with electricity, to meet the regional requirements of “water departments” responsible for supplying water
to customers (including the Public Authority for Electricity and Water (PAEW) and Majis Industrial Services
Co. (MISC)). Several water-only desalination plants also supply these water departments.
OPWP’s role is to aggregate the power and desalinated water requirements of licensed electricity suppliers
and water departments, and to economically procure the required power and desalinated water in bulk
from generation/production facilities connected to the MIS and water transmission systems. OPWP is
required to ensure that sufficient power generation resources are available to meet licensed electricity
suppliers’ demands. Wherever beneficial, OPWP co-procures desalinated water to meet the needs of water
departments in joint power-water facilities, and procures stand-alone desalinated water facilities upon the
direction of PAEW in accordance with Article 78 of the Sector Law.
1.1 DEMAND FOR ELECTRICITY
OPWP evaluates electricity demand at the system level, including transmission and distribution system losses
with consumer-level loads. This equates with the output of power generation plants at the delivery point(s) to
the power system, excluding the internal power consumption of auxiliary systems.1 OPWP follows a similar
approach with respect to estimating water demand, the output of desalinated water plants, and the
consumption of auxiliary systems of combined power and water plants.
1 This approach assures equivalence toward planning the generation supply required to meet consumer demand. However, from the perspective of power system operations, electricity demand and output are monitored at available metering points located at substations and power plants. The system “gross demand” at any point in time is the sum of the metered output at all power generators, although a portion of that generator output must be consumed by plant auxiliary systems. System peak demand is considered as net of plant auxiliaries and any exports to other power systems. The hourly consumption of plant auxiliary systems is not measured directly at some plants and in these cases must be estimated. Consequently, there may be differences in peak demand reports, depending on how auxiliary consumption at each plant is estimated.
7-Year Statement (2014-2020) Page 4
Historical Demand
In 2013, electricity demand growth was modest compared to the growth in the previous three years. Peak
demand increased by 3.8% to 4455 MW, whilst average demand increased by 5.5% to 2597 MW
(corresponding to 22.8 TWh of energy). This followed growth in average demand of 14% in 2012, 12% in 2011,
7% in 2010, and 12-13% per year in 2008 and 2009.
The low growth rate in 2013 was due mainly to abnormally low temperatures, although economic growth was
also somewhat lower than the recent trend. It is not unusual for single-year growth rates in the MIS to
fluctuate widely, influenced by both weather and economic activity.
Demand Projections
OPWP’s 7-year electricity demand projections for the MIS have been developed on the basis of: (1)
consultations with the distribution companies including MEDC, MZEC and MJEC and other relevant entities; (2)
consideration of historical average growth rates and their distribution; and (3) assessment of past forecasts
against out-turns.
The projections cover both average demand (i.e. energy) and peak demand. The latter is most relevant for
purposes of assessing capacity requirements. This accords with the basis on which OPWP transacts with power
and desalination plants. Energy projections are necessary towards securing the fuel requirement for power
generation.
The central, “Expected Demand” projection is based on an assumption of “normal” weather, considering a
baseline developed from historical patterns of the past 10 years. Variations in weather in any particular year
can have a significant impact on electricity demand, and particularly on peak demand – as occurred in 2013
and 2010. The impact of weather in future years is an inherent uncertainty in the projections. Potential
weather impacts are considered in the development of Low Case and High Case demand scenarios.
The projections are built up from separate analyses of distribution system demands, which are assessed on a
“macro” basis by distribution companies zones, and certain bulk loads that are connected directly to the
transmission system and which are assessed on a specific load-wise basis. Distribution system demand is
comprised mainly of residential, service sector (including government and commercial buildings, tourism
facilities), and small- to medium-scale industrial demands in all MIS regions. The principal growth drivers
include population growth, household formation, general economic development and infrastructure
expansion.
The growth in demand from grid-connected loads (generally large industries and infrastructure projects)
comprises both new projects and expansion at existing industrial plants. Industrial projects are focused mainly
in the Sohar Industrial Port and Sohar Free Zone, and to a lesser extent at Sur. Infrastructure projects include,
for example, the stand-alone desalination plants.
The projections are presented as a range bounded by Low Case and High Case scenarios, and a central,
Expected Demand forecast. They are summarized in Figure 1 below.
7-Year Statement (2014-2020) Page 5
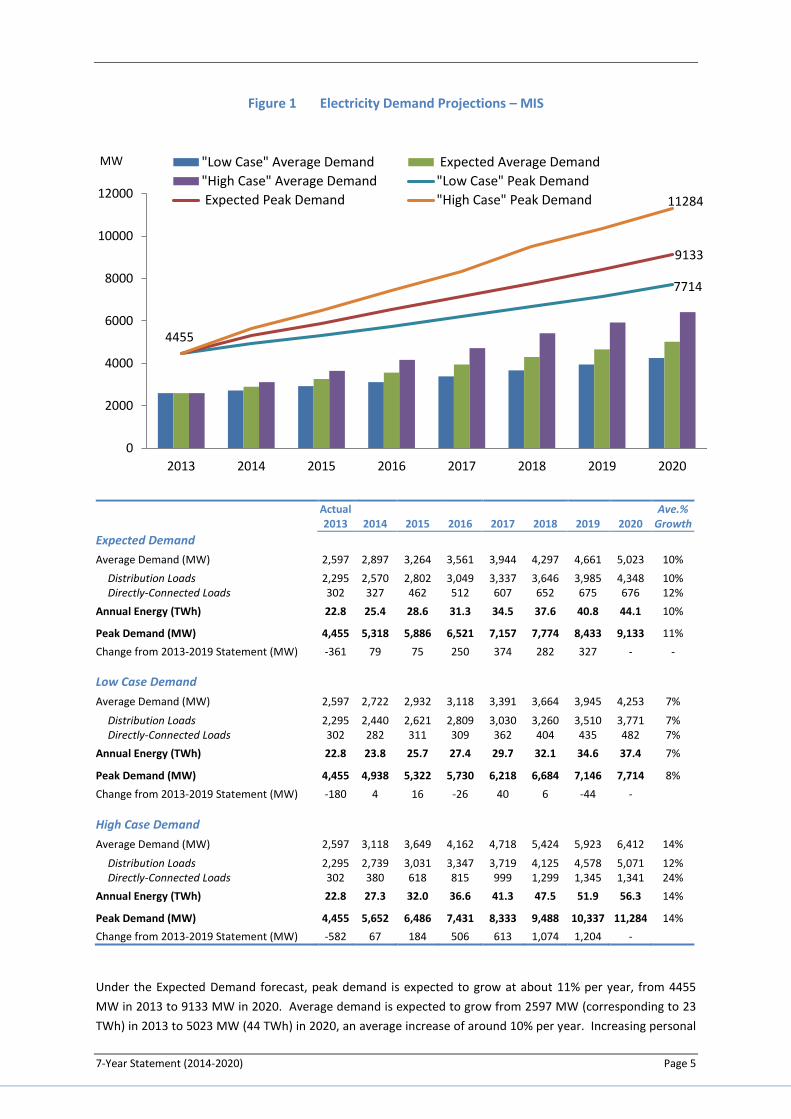
Figure 1 Electricity Demand Projections – MIS
Actual 2013 2014 2015 2016 2017 2018 2019 2020
Ave.% Growth
Expected Demand
Average Demand (MW) 2,597 2,897 3,264 3,561 3,944 4,297 4,661 5,023 10%
Distribution Loads 2,295 2,570 2,802 3,049 3,337 3,646 3,985 4,348 10% Directly-Connected Loads 302 327 462 512 607 652 675 676 12%
Annual Energy (TWh) 22.8 25.4 28.6 31.3 34.5 37.6 40.8 44.1 10%
Peak Demand (MW) 4,455 5,318 5,886 6,521 7,157 7,774 8,433 9,133 11%
Change from 2013-2019 Statement (MW) -361 79 75 250 374 282 327 - -
Low Case Demand
Average Demand (MW) 2,597 2,722 2,932 3,118 3,391 3,664 3,945 4,253 7%
Distribution Loads 2,295 2,440 2,621 2,809 3,030 3,260 3,510 3,771 7% Directly-Connected Loads 302 282 311 309 362 404 435 482 7%
Annual Energy (TWh) 22.8 23.8 25.7 27.4 29.7 32.1 34.6 37.4 7%
Peak Demand (MW) 4,455 4,938 5,322 5,730 6,218 6,684 7,146 7,714 8%
Change from 2013-2019 Statement (MW) -180 4 16 -26 40 6 -44 -
High Case Demand
Average Demand (MW) 2,597 3,118 3,649 4,162 4,718 5,424 5,923 6,412 14%
Distribution Loads 2,295 2,739 3,031 3,347 3,719 4,125 4,578 5,071 12% Directly-Connected Loads 302 380 618 815 999 1,299 1,345 1,341 24%
Annual Energy (TWh) 22.8 27.3 32.0 36.6 41.3 47.5 51.9 56.3 14%
Peak Demand (MW) 4,455 5,652 6,486 7,431 8,333 9,488 10,337 11,284 14%
Change from 2013-2019 Statement (MW) -582 67 184 506 613 1,074 1,204 -
Under the Expected Demand forecast, peak demand is expected to grow at about 11% per year, from 4455
MW in 2013 to 9133 MW in 2020. Average demand is expected to grow from 2597 MW (corresponding to 23
TWh) in 2013 to 5023 MW (44 TWh) in 2020, an average increase of around 10% per year. Increasing personal
7714
9133
4455
11284
0
2000
4000
6000
8000
10000
12000
2013 2014 2015 2016 2017 2018 2019 2020
MW "Low Case" Average Demand Expected Average Demand
"High Case" Average Demand "Low Case" Peak Demand
Expected Peak Demand "High Case" Peak Demand
7-Year Statement (2014-2020) Page 6
income, housing starts, and continuing government investment in infrastructure projects are major
contributors to continued high growth in electricity demand.
In this forecast, growth in distribution-level loads is broadly consistent with the 7-Year Statement forecast of
last year. Bulk customer loads have increased though, recognizing a higher-than-expected pace of industrial
development confirmed for the near term, as well as progress on large government buildings, universities, and
other non-industrial projects. The forecast is supported by an expectation of continuing strong growth in the
national economy of about 4% annually on average.
The High Case scenario reflects the possibility of stronger-than-expected economic growth, and represents a
contingency case for OPWP’s provision of adequate generation capacity. In this scenario, we expect more
private sector projects to reach their growth targets, in all sectors. Average and peak demands are projected
to increase at 14% per year in the High Case. This growth rate is only slightly greater than the growth rates
sustained in 2008-2009 and 2011-2012, and thus represents a plausible upper-bound scenario that compounds
the potential effects of extreme weather and higher-than-expected economic activity.
The Low Case scenario is constructed as a mirror image of the High Case around the Expected Demand
forecast, with respect to the growth rate of distribution system loads. This scenario generally reflects the
possibility of weaker than expected economic growth. Peak demand under this scenario, at 8% per year, is
roughly equivalent to the average growth rate since 2005.
Over the forecast period, aggregate demand growth is greatest under the High Case and least under the Low
Case, but in some individual years one may observe a change in the growth pattern against the overall trend,
or relatively higher growth in one scenario than another. This is due primarily to assumptions about grid-
connected loads which differ among the demand scenarios. In the High Case, grid-connected loads are
assumed to develop at or near the pace and extent of customer forecasts. The Expected Demand and Low
Case assume successively lower levels of demand realization from these projects, as has been commonly
observed due to project schedule delays, delayed realization of demand, downsizing, and project cancellations.
These differing schedules may result in apparent anomalies, such as when several projects cause a load
increase in the Low Case that is absent in the High Case in the same year; this may occur because the same
projects are realized in an earlier year in the more optimistic demand scenario.
Whilst considered much less likely than the Expected Demand scenario, the Low Case and High Case scenarios
are intended to represent the range of potential future demand paths around the Expected Demand
projection. The requirements for generation resources need to be assessed against all three scenarios to
develop an appropriate generation procurement strategy. In particular, OPWP has to balance the need to
have a feasible plan to meet High Case demands at reasonable cost should these arise (taking into account the
lead times associated with procuring capacity), whilst at the same time minimizing the risks of finding itself
over-committed to costly generation capacity in the event of demand following the Low Case path.
Exports to Interconnected Systems
The MIS is interconnected with the PDO power system at Nizwa through a 132 kV link, and with the power
system of the Emirate of Abu Dhabi through a 220 kV link at Mahadha. These interconnections provide
reliability benefits through the sharing of generation reserves. There are currently no arrangements for
commercial export or import of power with those systems. However, the interconnects provide the
opportunity for commercial power transactions in the future, which could then have implications for the
expected demand to be served by generation resources in the MIS. The current MIS demand projections do
not include power exports, comprising only the native demands of the MIS.
7-Year Statement (2014-2020) Page 7
1.2 POWER GENERATION RESOURCES
Sources of Power
In order to meet demand for electricity in the MIS, OPWP purchases power from a number of sources via
power purchase agreements (PPAs), power and water purchase agreements (PWPAs) and other similar
agreements. The contractual arrangements for power delivery under these agreements may be differentiated
as firm capacity, reserve-sharing, non-firm capacity, and energy-only. These terms are relevant for generation
planning purposes.
All of the main power (and desalination) plants in the MIS are contractually committed to provide a specific
generation capacity (in MW) upon demand, to be dispatched by the OETC, and to maintain specific availability
levels. These are firm capacity contracts, also termed “contracted capacity”. Temporary generation also
belongs with this group.
OPWP also purchases power from a number of sources where the contractual arrangements do not provide
sufficient reliability for resource adequacy plans. These may be termed collectively as “non-firm resources”.
They currently include reserve-sharing arrangements with other power systems via interconnection
agreements, and capacity exchanges or energy purchases from industries with captive power generation
facilities used mainly for self-supply. In these cases no specific capacity is committed to OPWP, and the
availability of capacity for use by OPWP at any particular time will generally be subject to the other party’s first
use. These resources provide reliability benefits to the MIS, in that capacity is generally available according to
pre-arranged schedules (though not committed as dispatch-able capacity). Importantly, some of these
resources may represent prospective contractual opportunities for firm, dispatch-able capacity (such as the
interconnects) in the future.
In addition to the resources currently under contract, there are “prospective resources” that are under
consideration by OPWP. For example, certain power generation units among the currently contracted plants
will fall out of contract during this seven-year period, and OPWP must consider whether to allow these units to
retire, to extend the term of the contract, or to contract for refurbishment or performance-related
modifications of the units. This category also includes resources that are under evaluation or for which the
tendering process has begun but is not complete.
Contracted Capacity
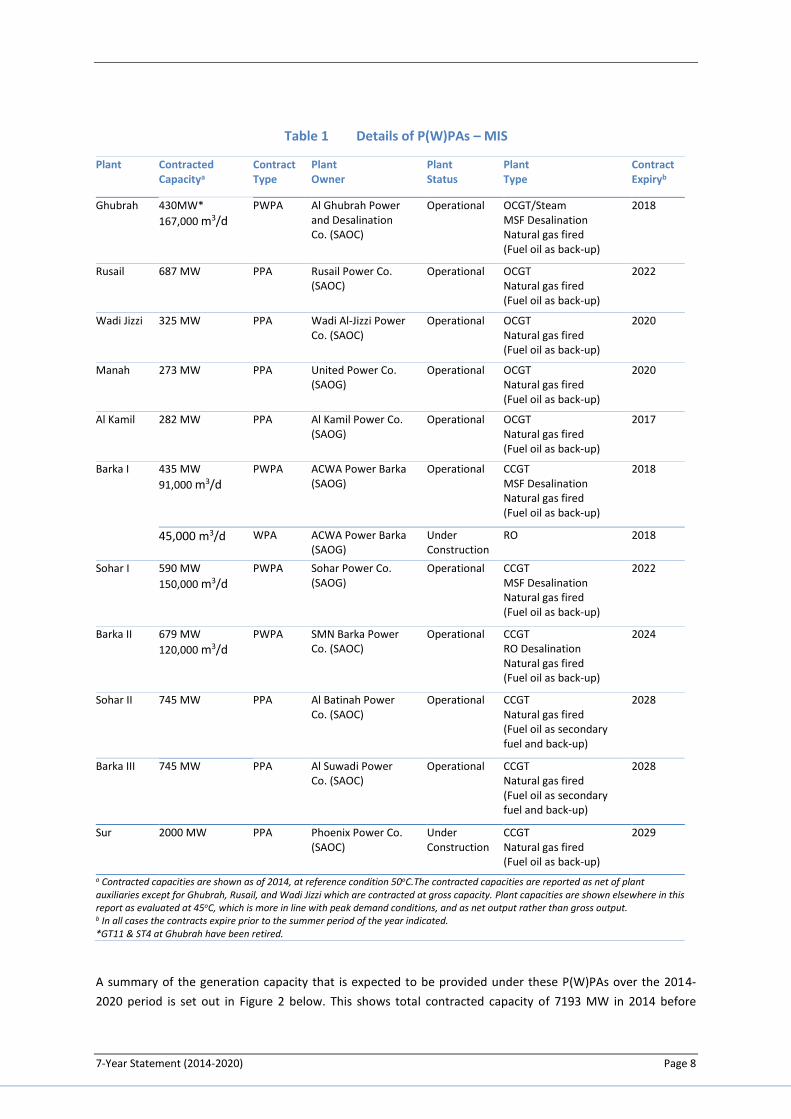
OPWP’s present portfolio of contracted capacity in the MIS comprises eleven P(W)PAs. Ten of these relate to
existing operational power (and desalination) plants, and one relates to a plant that is currently under
construction. Details of these P(W)PAs are shown in Table 1 below.
7-Year Statement (2014-2020) Page 8
Table 1 Details of P(W)PAs – MIS
Plant Contracted Capacitya
Contract Type
Plant Owner
Plant Status
Plant Type
Contract Expiryb
Ghubrah 430MW*
167,000 m3/d
PWPA Al Ghubrah Power and Desalination Co. (SAOC)
Operational OCGT/Steam MSF Desalination Natural gas fired (Fuel oil as back-up)
2018
Rusail 687 MW PPA Rusail Power Co. (SAOC)
Operational OCGT Natural gas fired (Fuel oil as back-up)
2022
Wadi Jizzi 325 MW PPA Wadi Al-Jizzi Power Co. (SAOC)
Operational OCGT Natural gas fired (Fuel oil as back-up)
2020
Manah 273 MW PPA United Power Co. (SAOG)
Operational OCGT Natural gas fired (Fuel oil as back-up)
2020
Al Kamil 282 MW PPA Al Kamil Power Co. (SAOG)
Operational OCGT Natural gas fired (Fuel oil as back-up)
2017
Barka I 435 MW
91,000 m3/d
PWPA ACWA Power Barka (SAOG)
Operational CCGT MSF Desalination Natural gas fired (Fuel oil as back-up)
2018
45,000 m3/d WPA ACWA Power Barka (SAOG)
Under Construction
RO 2018
Sohar I 590 MW
150,000 m3/d
PWPA Sohar Power Co. (SAOG)
Operational CCGT MSF Desalination Natural gas fired (Fuel oil as back-up)
2022
Barka II 679 MW
120,000 m3/d
PWPA SMN Barka Power Co. (SAOC)
Operational CCGT RO Desalination Natural gas fired (Fuel oil as back-up)
2024
Sohar II 745 MW PPA Al Batinah Power Co. (SAOC)
Operational CCGT Natural gas fired (Fuel oil as secondary fuel and back-up)
2028
Barka III 745 MW PPA Al Suwadi Power Co. (SAOC)
Operational CCGT Natural gas fired (Fuel oil as secondary fuel and back-up)
2028
Sur 2000 MW PPA Phoenix Power Co. (SAOC)
Under Construction
CCGT Natural gas fired (Fuel oil as back-up)
2029
a Contracted capacities are shown as of 2014, at reference condition 50oC.The contracted capacities are reported as net of plant auxiliaries except for Ghubrah, Rusail, and Wadi Jizzi which are contracted at gross capacity. Plant capacities are shown elsewhere in this report as evaluated at 45oC, which is more in line with peak demand conditions, and as net output rather than gross output. b In all cases the contracts expire prior to the summer period of the year indicated. *GT11 & ST4 at Ghubrah have been retired.
A summary of the generation capacity that is expected to be provided under these P(W)PAs over the 2014-
2020 period is set out in Figure 2 below. This shows total contracted capacity of 7193 MW in 2014 before
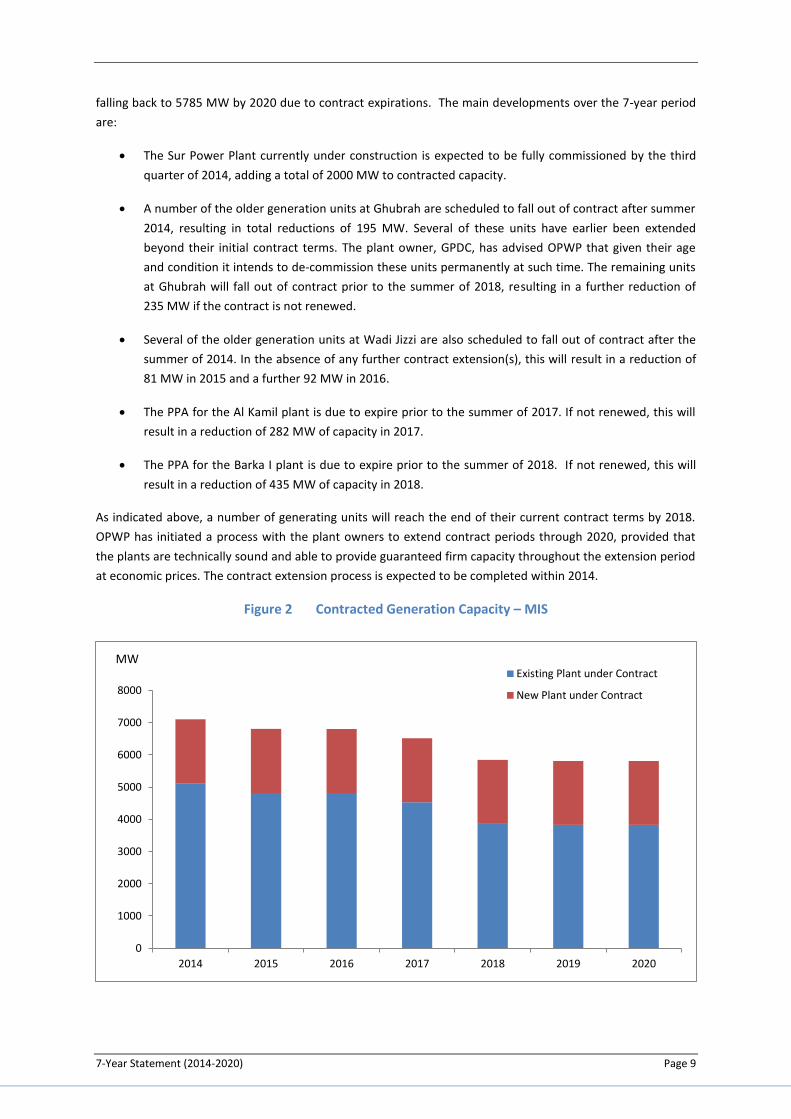
7-Year Statement (2014-2020) Page 9
falling back to 5785 MW by 2020 due to contract expirations. The main developments over the 7-year period
are:
The Sur Power Plant currently under construction is expected to be fully commissioned by the third
quarter of 2014, adding a total of 2000 MW to contracted capacity.
A number of the older generation units at Ghubrah are scheduled to fall out of contract after summer
2014, resulting in total reductions of 195 MW. Several of these units have earlier been extended
beyond their initial contract terms. The plant owner, GPDC, has advised OPWP that given their age
and condition it intends to de-commission these units permanently at such time. The remaining units
at Ghubrah will fall out of contract prior to the summer of 2018, resulting in a further reduction of
235 MW if the contract is not renewed.
Several of the older generation units at Wadi Jizzi are also scheduled to fall out of contract after the
summer of 2014. In the absence of any further contract extension(s), this will result in a reduction of
81 MW in 2015 and a further 92 MW in 2016.
The PPA for the Al Kamil plant is due to expire prior to the summer of 2017. If not renewed, this will
result in a reduction of 282 MW of capacity in 2017.
The PPA for the Barka I plant is due to expire prior to the summer of 2018. If not renewed, this will
result in a reduction of 435 MW of capacity in 2018.
As indicated above, a number of generating units will reach the end of their current contract terms by 2018.
OPWP has initiated a process with the plant owners to extend contract periods through 2020, provided that
the plants are technically sound and able to provide guaranteed firm capacity throughout the extension period
at economic prices. The contract extension process is expected to be completed within 2014.
Figure 2 Contracted Generation Capacity – MIS
0
1000
2000
3000
4000
5000
6000
7000
8000
2014 2015 2016 2017 2018 2019 2020
MWExisting Plant under Contract
New Plant under Contract
7-Year Statement (2014-2020) Page 10
2014 2015 2016 2017 2018 2019 2020
Net MW a
Current Contracted Capacity
Ghubrah 430 235 235 235 - - -
Rusail 687 687 687 687 687 687 687
Wadi Al Jizzi 333 252 160 160 160 129 98
Manah 273 273 273 273 273 273 273
Al Kamil 282 282 282 - - - -
Barka I 435 435 435 435 - - -
Sohar I 590 590 590 590 590 590 590
Barka II 679 678 678 678 678 678 678
Sohar II 742 740 739 738 738 738 738
Barka III 742 740 739 738 738 738 738
Surb 2000 1992 1988 1985 1983 1983 1983
TOTAL 7193 6904 6806 6519 5847 5816 5785 a All capacities are rated on a net basis (i.e. after allowing for auxiliary consumption inside the plants) at 45°C ambient temperature. b Although the Sur IPP is contracted to start at full capacity in April 2014, there is expected to be a delay in the commissioning schedule such that the full capacity of 2000 MW will be available after the start of the summer period.
Non-Firm Resources under Contract
In addition to the contracted capacity described above, OPWP has contracts with a number of other sources of
power for the MIS, although these contracts are not for firm capacity commitments. These include:
the 220 kV interconnect with the Abu Dhabi power system at Mahadha;
the 132 kV interconnect with the PDO power system at Nizwa; and
the surplus generation of industries (and other parties) with captive power generation facilities used
mainly for self-supply.
A 220 kV interconnection between the MIS and the Abu Dhabi power system was commissioned in 2011 and
has been commercially operational since May 2012. This double circuit link currently supports reliable
transfers of up to 200 MW. It is technically capable to carry up to 400 MW in emergencies, and has proven this
latter capacity on numerous occasions. The main purpose of this interconnect as currently envisioned is for
emergency support and reserve sharing, subject to the availability of surplus generation in either system. The
link is being utilized actively to provide emergency reserves support to the benefit of Oman, the UAE, and
other GCCIA member countries. It is expected that this link will be upgraded to 400 kV by Transco Abu Dhabi,
doubling the reliable transfer capability to 400 MW; hence the emergency capability support will also be
doubled up to 800 MW.
The MIS is connected with the power system of PDO at Nizwa via a single 132 kV link with a nominal transfer
capacity of around 60 MW. The main purpose of this interconnect is to support reserve sharing between the
MIS and the PDO system, providing improved reliability in both systems by allowing each system access to
unused reserve in the other system in contingency scenarios. Thus, subject to the availability of surplus
generation in the PDO system at the time required, up to around 60 MW of support can be provided to the
MIS to help manage contingencies.
7-Year Statement (2014-2020) Page 11
In addition to support for reserve-sharing arrangements, both the PDO and the Abu Dhabi interconnections
could potentially support “commercial” imports in the future – based on the relative costs of generation in the
respective systems.
Several industries with captive power plants are connected with the MIS and have surplus power that is
purchased by OPWP. Chief among these is OPWP’s agreement with Sohar Aluminium Co. (LLC), whereby
Sohar Aluminium exports up to 300 MW to the MIS during the summer, and imports a like amount of energy
from OPWP during the winter on an annually determined schedule. The schedule and operations are managed
to assure that energy exports balance with energy imports. This arrangement benefits both parties: Sohar
Aluminium is better able to schedule the maintenance of its generating units and gains reliability of supply,
while OPWP gains an efficient generating resource during the summer and improves the system Load Factor.
Agreements with other industries range from economic purchases of surplus generation as available to
scheduled purchases of surplus peaking capacity (when available). These agreements have generally been for
short terms (one to three years) and are considered renewable so long as the surplus capacity remains
available, and both economic and operational terms are agreeable.
The agreement with Sohar Aluminium (300 MW) was renewed in 2013 for three years. OPWP is negotiating
with Oman Mining Co. (20 MW) and Oman Refineries and Petrochemicals Company (ORPIC) (15 MW) to renew
the contracts on an availability basis. Furthermore, OPWP has economic purchase arrangements with Oman
Cement Co. (SAOG), Oman India Fertilizer Co. (SAOC) and the Ministry of Defense, which are expected to be
available for renewal annually. These latter three agreements are considered as energy purchases (at tariffs
beneficial to the system) with no capacity benefit.
Access to the captive power generation resources is useful in two respects. Firstly, the Sohar Aluminium and
Oman Mining Co. contracts provide a source of contingency reserve for the MIS, over and above the reserve
margin provided by OPWP’s portfolio of contracted capacity. And secondly, they provide an economical
source of energy – by providing low cost energy to the MIS in place of higher cost energy from contracted
generation capacity, the overall cost of energy for the MIS can be reduced. The agreements in place with the
respective parties are specifically designed to allow both of these benefits to be obtained.
Prospective Resources
Toward considering how to meet generation capacity requirements as projected power demand overtakes
contracted capacity, OPWP assesses various prospective resources. These resources include the following:
Contract extensions, such as for generation units that are scheduled to fall out of contract
Planned capacity additions, not yet contracted
Temporary generation
Capacity purchases from interconnected power systems or industrial self-generation
Prospective contract extensions correspond to capacity that is scheduled to fall out of contract, but that may
be offered to OPWP by the plant owner for extension of the contract term (subject to satisfaction of relevant
regulatory requirements and commercial terms being agreed). OPWP considers such extensions alongside
options to contract for new capacity.
7-Year Statement (2014-2020) Page 12
In 2014, OPWP has initiated discussions with the owners of the plants at Ghubrah, Wadi Jizzi, Al Kamil and
Barka I, to extend contracts to 2020. Extensions are to be made only on a guaranteed capacity basis, subject to
independent technical evaluation, and at economic commercial terms.
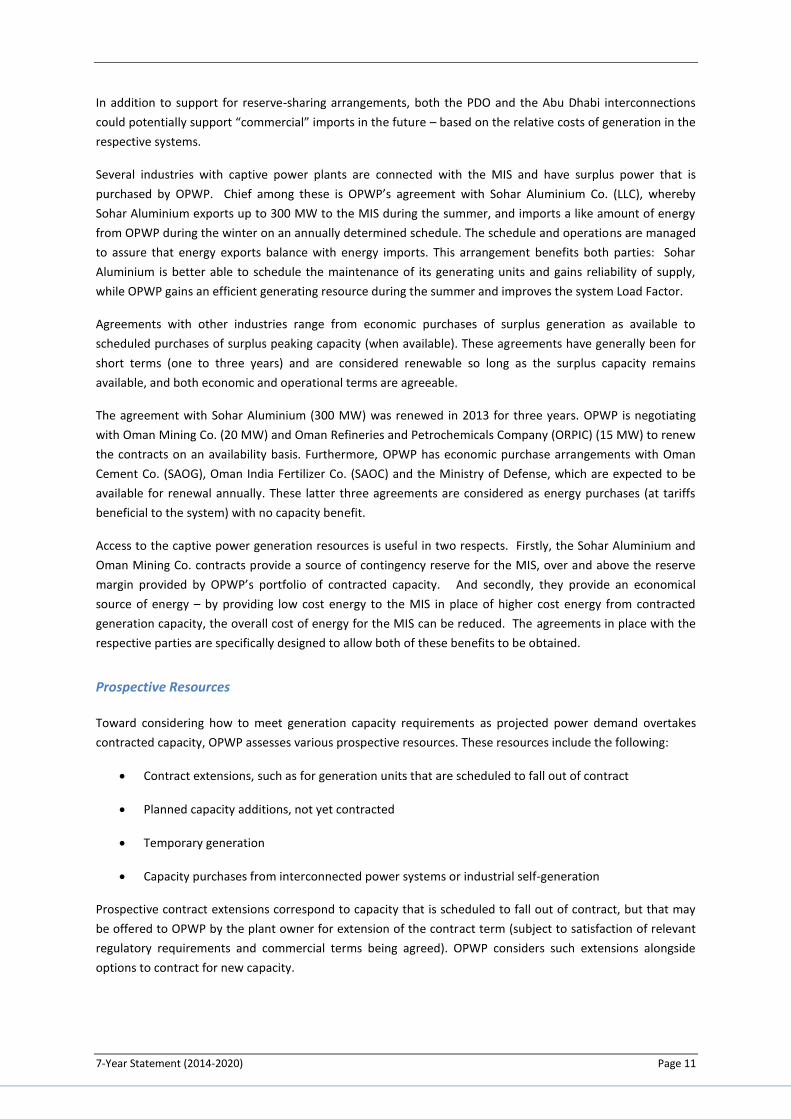
For planning purposes, OPWP has estimated the amount of capacity that is likely to be extended in Table 2
below. Generally, gas turbine plants are expected to have an economic life of about 30 years. In most cases,
the level of investment and refurbishment required to extend plant life beyond that period is not economically
viable. For this reason, Table 2 does not include capacity associated with units that will be more than 30 years
old at the time of contract expiration. However, the plant owners will ultimately make this economic
determination and consequently, the amount of capacity actually extended may be somewhat greater or less
than what is indicated.
Table 2 Prospective Contract Extensions
2014 2015 2016 2017 2018 2019 2020
Net MW a
Ghubrahb - - - - 235 235 235
Wadi Al Jizzic - 81 173 173 173 204 235
Al Kamild - - - 282 282 282 282
Barka I - - - - 435 435 435
TOTAL 0 81 173 455 1125 1156 1187
a All capacities are rated on a net basis (i.e. after allowing for auxiliary consumption inside the plants) at 45°C ambient temperature. b Includes GT 12, GT 13, ST5 and ST6. c Includes GTs 3-13. d A 15 MW increment is available on a year-to-year basis at Al Kamil as a performance enhancement, requiring also an operating regime at base load. This increment is not included in the indicated capacity but may be added on an as-needed basis such as in a year of insufficient total contracted capacity. For example, OPWP has contracted for this uplift in the past to offset the need for temporary generation.
OPWP has initiated the procurement process to contract at least 2600 MW of new capacity: 740 MW to be
operational for summer 2017 and at least an additional 1860 MW for summer 2018. Following an extensive
site assessment study, and consultation with key stakeholders, sites are being considered at Ibri, Sohar, and As
Suwayq. The tender is expected to be issued by June 2014 for contract award early in 2015.
The Sultanate has significant opportunity to develop renewable energy resources, particularly solar and wind
energy. Several small-scale projects are already operational or under development in rural areas, displacing
diesel generation. OPWP expects the Government to define its renewable energy policy in the near future to
include large-scale, grid-connected projects. Subject to the Government providing a final go-ahead, OPWP
expects to procure around 200 MW of solar generation capacity for the MIS, potentially to be in service by
2018. OPWP is currently collecting data from two instrumentation stations to support this endeavor. Whilst
this capacity is expected to be committed to OPWP via a PPA, the inherent intermittency risk associated with
solar generation (unless mitigated with energy storage) may lead to the “effective capacity” of the plants – for
resource adequacy purposes – being somewhat less than the nominal capacity. Until proven as peak capacity,
we show this resource in the category of contingency reserves.
7-Year Statement (2014-2020) Page 13
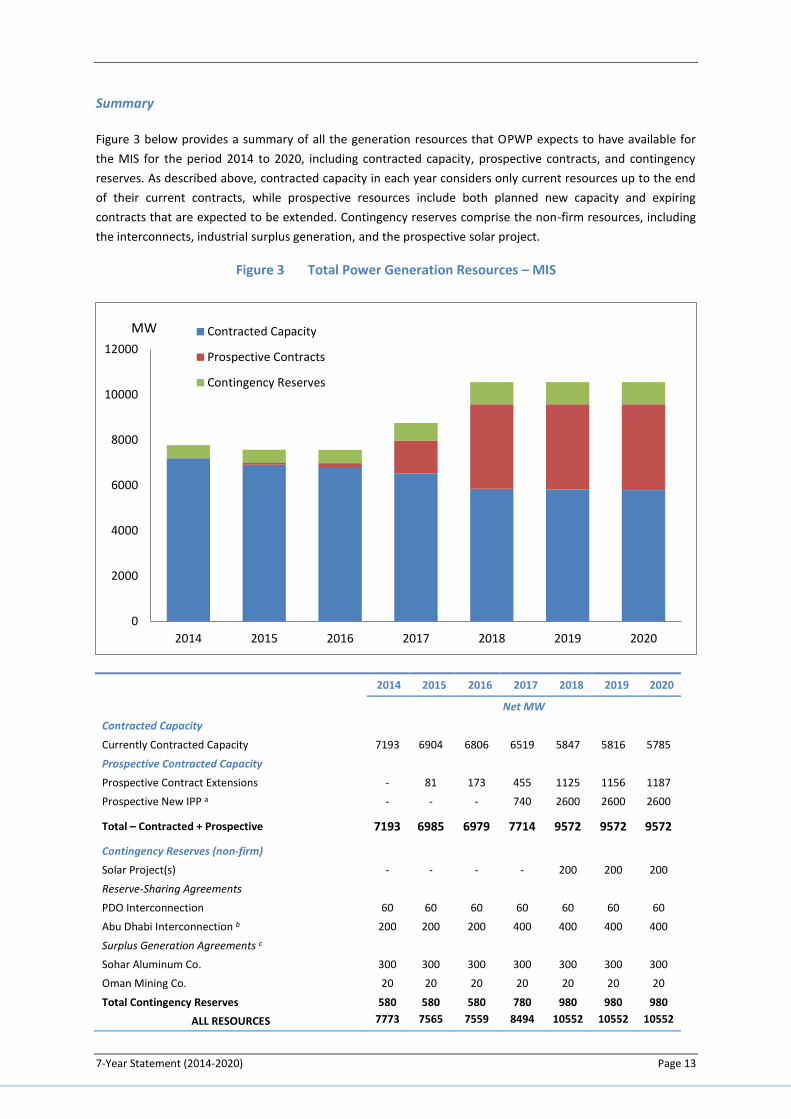
Summary
Figure 3 below provides a summary of all the generation resources that OPWP expects to have available for
the MIS for the period 2014 to 2020, including contracted capacity, prospective contracts, and contingency
reserves. As described above, contracted capacity in each year considers only current resources up to the end
of their current contracts, while prospective resources include both planned new capacity and expiring
contracts that are expected to be extended. Contingency reserves comprise the non-firm resources, including
the interconnects, industrial surplus generation, and the prospective solar project.
Figure 3 Total Power Generation Resources – MIS
2014 2015 2016 2017 2018 2019 2020
Net MW
Contracted Capacity
Currently Contracted Capacity 7193 6904 6806 6519 5847 5816 5785
Prospective Contracted Capacity
Prospective Contract Extensions - 81 173 455 1125 1156 1187
Prospective New IPP a - - - 740 2600 2600 2600
Total – Contracted + Prospective 7193 6985 6979 7714 9572 9572 9572
Contingency Reserves (non-firm)
Solar Project(s) - - - - 200 200 200
Reserve-Sharing Agreements
PDO Interconnection 60 60 60 60 60 60 60
Abu Dhabi Interconnection b 200 200 200 400 400 400 400
Surplus Generation Agreements c
Sohar Aluminum Co. 300 300 300 300 300 300 300
Oman Mining Co. 20 20 20 20 20 20 20
Total Contingency Reserves 580 580 580 780 980 980 980
ALL RESOURCES 7773 7565 7559 8494 10552 10552 10552
0
2000
4000
6000
8000
10000
12000
2014 2015 2016 2017 2018 2019 2020
Contracted Capacity
Prospective Contracts
Contingency Reserves
MW
7-Year Statement (2014-2020) Page 14
a Shown at minimum of prospective range from 2600 MW to 2850 MW. b The capacity upgrade of the Abu Dhabi Interconnection to 400 MW is currently not committed, but is expected to occur around the indicated period. At current capacity, the interconnection will transfer 400 MW but not on a guaranteed basis until the upgrade is complete.
c The existing agreements for surplus generation have been recently renewed and will expire again at the end of 2015. The respective firms have indicated the possibility of further contract extension, although the indicated capacities are illustrative as contract terms may be modified.
1.3 ADDITIONAL POWER GENERATION REQUIREMENTS
Statutory and Regulatory Requirements
OPWP is required by the Sector Law and its license to ensure the adequacy of generation resources to meet
future power demands. The Sector Law establishes OPWP’s general responsibility to secure sufficient
generation resources to meet the aggregated demands of licensed electricity suppliers. Further to this, the
license issued to OPWP by the Authority for Electricity Regulation, Oman (AER) stipulates a specific generation
security standard for the MIS that OPWP must comply with.
The generation security standard stipulated by the AER sets a maximum duration of power outage for the
system, termed Loss-of-Load Hours (“LOLH”). OPWP must enter into agreements for enough contracted
capacity to ensure that expected demand does not exceed available contracted capacity for more than 24
hours in any year. This LOLH measure considers relevant uncertainties such as the reliability of generation
units. On a short-term basis, OPWP must demonstrate to the AER that such agreements are in place. On a
long-term basis, OPWP must demonstrate that it has credible plans to put such agreements in place (via the
procurement of new capacity or otherwise).
It is important to note that for purposes of the 24-hour LOLH standard, only contracted capacity is
considered. Other resources, such as the surplus generation of industries and reserve sharing arrangements
with interconnected systems, provide a degree of reserve margin and will generally contribute to reliability of
supply. However, they are not considered for purposes of meeting the 24-hour LOLH standard and are viewed
instead as providing security against contingencies.
2014 Capacity Requirement
OPWP and the AER determined that contracted capacity in 2014 is sufficient to secure the MIS to the 24-hour
LOLH standard. However, the prospect of a delay in commissioning of the Sur IPP until mid-summer led OPWP
to consider mitigation measures to assure adequate generation capacity, in consultation with the AER. OPWP
is looking into several mitigation options, and expects to have contracts in place by April 2014 to assure
adequate generation capacity for the summer.
Future Capacity Requirements
OPWP has estimated the requirement for contracted capacity in order to comply with the 24-hour LOLH
standard in each year during the 2014-2020 period. Figure 4 below shows the capacity requirement for each of
the three demand projections in comparison to available capacity.
Under the Expected Demand scenario, contracted capacity should exceed the sum of peak demand and the
margin required to meet the 24 LOLH standard (i.e., the capacity requirement). A deficit implies a need to
acquire additional resources. Non-firm contracted resources are not considered in assessing available capacity
to meet Expected Demand.
7-Year Statement (2014-2020) Page 15
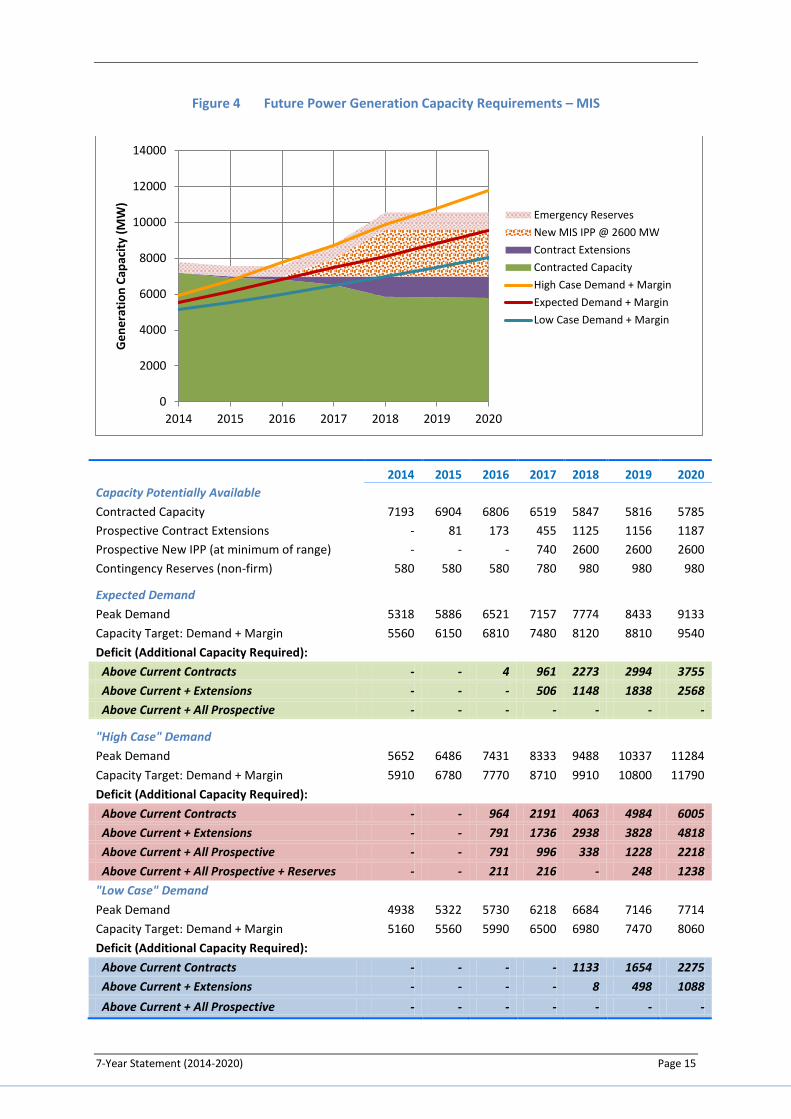
Figure 4 Future Power Generation Capacity Requirements – MIS
2014 2015 2016 2017 2018 2019 2020
Capacity Potentially Available
Contracted Capacity 7193 6904 6806 6519 5847 5816 5785
Prospective Contract Extensions - 81 173 455 1125 1156 1187
Prospective New IPP (at minimum of range) - - - 740 2600 2600 2600
Contingency Reserves (non-firm) 580 580 580 780 980 980 980
Expected Demand
Peak Demand 5318 5886 6521 7157 7774 8433 9133
Capacity Target: Demand + Margin 5560 6150 6810 7480 8120 8810 9540
Deficit (Additional Capacity Required):
Above Current Contracts - - 4 961 2273 2994 3755
Above Current + Extensions - - - 506 1148 1838 2568
Above Current + All Prospective - - - - - - -
"High Case" Demand
Peak Demand 5652 6486 7431 8333 9488 10337 11284
Capacity Target: Demand + Margin 5910 6780 7770 8710 9910 10800 11790
Deficit (Additional Capacity Required):
Above Current Contracts - - 964 2191 4063 4984 6005
Above Current + Extensions - - 791 1736 2938 3828 4818
Above Current + All Prospective - - 791 996 338 1228 2218
Above Current + All Prospective + Reserves - - 211 216 - 248 1238
"Low Case" Demand
Peak Demand 4938 5322 5730 6218 6684 7146 7714
Capacity Target: Demand + Margin 5160 5560 5990 6500 6980 7470 8060
Deficit (Additional Capacity Required):
Above Current Contracts - - - - 1133 1654 2275
Above Current + Extensions - - - - 8 498 1088
Above Current + All Prospective - - - - - - -
0
2000
4000
6000
8000
10000
12000
14000
2014 2015 2016 2017 2018 2019 2020
Ge
ne
rati
on
Cap
acit
y (M
W)
Emergency Reserves
New MIS IPP @ 2600 MW
Contract Extensions
Contracted Capacity
High Case Demand + Margin
Expected Demand + Margin
Low Case Demand + Margin
7-Year Statement (2014-2020) Page 16
It can be seen that the recent capacity additions are expected to meet requirements until at least around
2016. Only a very marginal deficit appears at that time. In 2017, a significant capacity need emerges relative to
current contracts. Even prospective contract extensions leave a deficit of more than 500 MW in 2017, implying
that this is an appropriate time for the next major addition to long-term contracted capacity.
OPWP has determined that a new IPP should be procured with capacity in the range of 2600 MW to 2850 MW.
Figure 4 shows the demand/supply balance under the three demand scenarios considering this plant at the
minimum of this range, for purposes of illustration. The new IPP is shown to be constructed in two phases, in
which the first phase adds 740 MW of firm capacity in 2017, and the second phase adds the remaining capacity
in 2018. Under the Expected Demand scenario, the new IPP provides for sufficient capacity to meet the
capacity target in all years through 2020, as there is no deficit relative to “Current plus All Prospective”
contracted capacity (see above table). The next new capacity addition may then be needed in 2021.
OPWP considers that the generation supply plan must include a viable strategy to meet the High Case demand
scenario. Considering this as a contingency scenario, non-firm resources including the interconnects and the
industrial supply contracts may also be considered to contribute to this strategy. In Figure 4, the potential
supply deficit emerges in 2016, exceeding prospective contract extensions by nearly 800 MW. A new IPP could
not be completed by that time. However, contracted non-firm reserves reduce the deficit to about 211 MW.
OPWP can readily contract for at least 300 MW of temporary generation if necessary. Thus, a combination of
temporary generation and existing contracts for reserves is considered to be a reasonable strategy to address
this demand contingency in 2016.
Considering 2017 under the High Case scenario, the supply deficit is much higher at 1736 MW relative to
current contracts and prospective contract extensions. If the first phase of the new IPP had capacity in the
range of only 500-600 MW, for example, which would meet requirements of the Expected Demand scenario in
2017, then there would not be a viable strategy to meet High Case demand: contracts plus non-firm reserves
plus potential temporary generation would not be sufficient. For this reason, the first phase of the new IPP is
prescribed at a higher capacity level, at a minimum of 740 MW.
Considering the 2018 to 2020 period, if the new IPP has capacity of 2600 MW as shown in Figure 4, then all
resources (contracts plus reserves) are sufficient to meet the High Case scenario in 2018, and a deficit of 248
MW appears in 2019. The strategy for High Case demand would then include temporary generation to meet
this requirement, and to advance the schedule for the next major capacity addition to begin service in 2020
(instead of 2021). This latter procurement action could be started as late as 2016, once the demand trend has
been verified.2
At a somewhat higher capacity level, up to 2850 MW, there is benefit in potentially avoiding the need for
temporary generation in 2019 under the High Case, as well as providing a margin for the somewhat uncertain
level of contract extensions associated with the expiring contracts. OPWP sees limited value in a higher
capacity level for the IPP. Only a much higher capacity would meet High Case capacity needs through 2020, as
much as 3500-3600 MW, which would imply a significant capacity overhang in the other demand scenarios.
Therefore, OPWP plans for the new IPP to have capacity in the range of 2600 MW to 2850 MW.
The Low Case demand scenario is also instructive, confirming that even under the slowest plausible demand
growth scenario, the new IPP is required at the latest by 2019. If less capacity becomes available through
2 The High Case scenario is considered quite unlikely, but should demand trend higher than expected in coming years,
OPWP has options to assure adequate capacity for the contingencies noted after 2018. As indicated, the new capacity could be procured earlier, even for service in 2019 if necessary. Whereas the Abu Dhabi interconnect is currently considered for contingency reserves, firm contracts could be arranged with GCCIA partners, some of which are expected to have excess capacity during the period from 2016 onwards.
7-Year Statement (2014-2020) Page 17
contract extensions than expected, then the new IPP would be required by 2018 under this scenario. The Low
Case demonstrates that there is a possibility of unused capacity under OPWP’s supply plan, but this is balanced
by the value of having sufficient capacity to accommodate more rapid demand growth, which is considered to
be more likely.
1.4 DESALINATED WATER REQUIREMENTS
Demand for Water
In the northern regions of the Sultanate, OPWP provides desalinated water to two “water departments”:
PAEW and MISC. Their respective service areas and requirements for desalinated water are defined as follows:
PAEW – in respect of the demand for potable water in the Governorates of Muscat, Al Buraymi, Al
Batinah North, Al Batinah South, Ad Dakhiliyah, Ad Dhahirah, Ash Sharqiyah North and Ash Sharqiyah
South 3; and
MISC – in respect of the process water demand for industrial use in the Sohar Industrial Port area.
PAEW and MISC provide the water demand projections in respect of the following geographic zones:
The “Interconnected Zone” includes the potable water demands of the Governorates of Muscat,
Al Batinah North, Al Batinah South, Buraymi, Ad Dakhiliyah, and Ad Dhahirah4 which are served
by PAEW, and the process water demand for the Sohar Industrial Port area that is served by
MISC.5 The existing principal sources of desalinated water for this zone are the Ghubrah Power
and Desalination Plant, Barka I and Barka II Power and Desalination Plants, and Sohar I Power and
Desalination Plant.
The “Sur Zone” includes the potable water demands of the Ash Sharqiyah North and Ash
Sharqiyah South Governorates excluding Masirah wilayat. The existing principal source of water
for this zone is the Sur Desalination Plant.
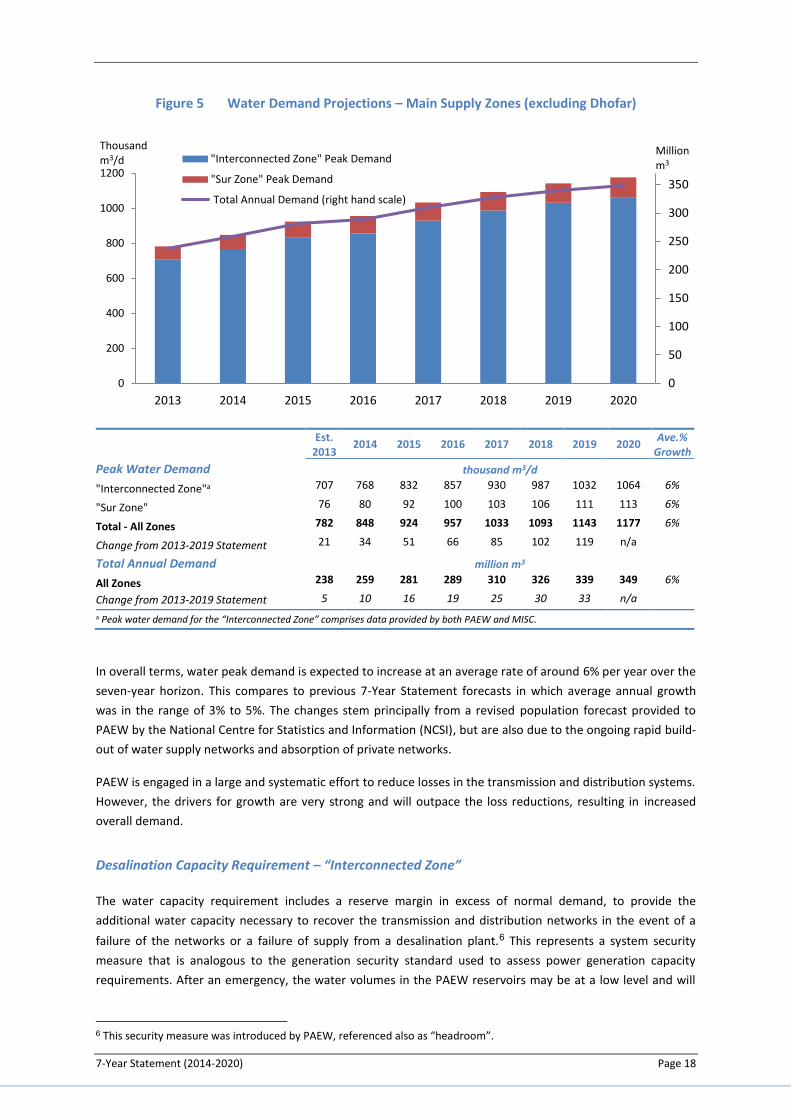
The projected peak water demands for these two zones are shown in Figure 5 below. Peak demand represents
the average daily demand (inclusive of network losses) during the week of highest demand of the year. The
projections also indicate total annual demands for each zone.
3 The projections by PAEW exclude the wilayat of Qurayyat in the Governorate of Muscat (until 2015), and the wilayat of Masirah in the Ash Sharqiyah South Governorate, which are expected to be served by PAEW from local supply sources. However, when the Wadi Dayqah project becomes operational in 2015, the wilayat of Qurayyat will also become connected to the Interconnected Zone. Hence from 2015 onwards, water demand of the wilayat of Qurayyat is included in the demand projections. 4 By 2017 Dhahirah is considered to be supplied from the Interconnected Zone area of supply, while keeping limited
production from the Masarrat well field. The current scenario considers a connection to Dhahirah. 5 MISC has provided OPWP with a demand projection through 2020. MISC has recently completed its own RO desalination plant, commissioned in December 2013; MISC demand from 2014 onwards is its requirement from OPWP net of supply from this plant.
7-Year Statement (2014-2020) Page 18
Figure 5 Water Demand Projections – Main Supply Zones (excluding Dhofar)
Est.
2013 2014 2015 2016 2017 2018 2019 2020
Ave.% Growth
Peak Water Demand thousand m3/d
"Interconnected Zone"a 707 768 832 857 930 987 1032 1064 6%
"Sur Zone" 76 80 92 100 103 106 111 113 6%
Total - All Zones 782 848 924 957 1033 1093 1143 1177 6%
Change from 2013-2019 Statement 21 34 51 66 85 102 119 n/a
Total Annual Demand million m3
All Zones 238 259 281 289 310 326 339 349 6%
Change from 2013-2019 Statement 5 10 16 19 25 30 33 n/a
a Peak water demand for the “Interconnected Zone” comprises data provided by both PAEW and MISC.
In overall terms, water peak demand is expected to increase at an average rate of around 6% per year over the
seven-year horizon. This compares to previous 7-Year Statement forecasts in which average annual growth
was in the range of 3% to 5%. The changes stem principally from a revised population forecast provided to
PAEW by the National Centre for Statistics and Information (NCSI), but are also due to the ongoing rapid build-
out of water supply networks and absorption of private networks.
PAEW is engaged in a large and systematic effort to reduce losses in the transmission and distribution systems.
However, the drivers for growth are very strong and will outpace the loss reductions, resulting in increased
overall demand.
Desalination Capacity Requirement – “Interconnected Zone”
The water capacity requirement includes a reserve margin in excess of normal demand, to provide the
additional water capacity necessary to recover the transmission and distribution networks in the event of a
failure of the networks or a failure of supply from a desalination plant.6 This represents a system security
measure that is analogous to the generation security standard used to assess power generation capacity
requirements. After an emergency, the water volumes in the PAEW reservoirs may be at a low level and will
6 This security measure was introduced by PAEW, referenced also as “headroom”.
0
50
100
150
200
250
300
350
0
200
400
600
800
1000
1200
2013 2014 2015 2016 2017 2018 2019 2020
Millionm3
Thousand m3/d "Interconnected Zone" Peak Demand
"Sur Zone" Peak Demand
Total Annual Demand (right hand scale)
7-Year Statement (2014-2020) Page 19
need to be replenished. Therefore, the capacity available to be drawn from desalination plants must be higher
than normal demand, to allow for reservoir replenishment in the event of an emergency.
The recommended security standard is that the 24-hour peak demand on the system should be available for
supply within a 21-hour period. This means that an average reserve margin of 14.3% over peak demand should
be considered as a capacity requirement for both water supply sources and the water transmission system.7
PAEW has advised that it has several sources of water available in the Interconnected Zone that offset the
water capacity requirement to be provided by OPWP. These include (1) existing wells (after reducing the
drawdown to assure maintenance of aquifer capacity), (2) the Wadi Dayqah project (surface water reservoir),
(3) the existing temporary RO plant at the Ghubrah site, with capacity of 23,000 m3/d (5 MIGD),8 and (4) a
contract for 11,000 m3/d (2.4 MIGD) of potable water capacity from the new MISC RO plant. The capacity
requirement for desalinated water from OPWP is the total water capacity requirement less the peak yield of
these PAEW sources.
OPWP’s contracted sources of desalinated water for the “Interconnected Zone” include the following:
Ghubrah Power and Desalination Plant, owned and operated by GPDC under a PWPA with OPWP.
The Ghubrah Desalination Plant comprises six MSF units with a current capacity of 167,000 m3/d (37
MIGD).
Barka I Power and Desalination Plant, owned by ACWA Power Barka and operated under a PWPA
with OPWP. The Barka I plant was originally contracted with a desalination capacity of 91,200 m3/d
(20 MIGD) using MSF units. OPWP has contracted with ACWA Power Barka for additional capacity of
45,000 m3/d (10 MIGD) using RO technology, which is under construction and is expected to be
operational in early 2014.
Barka II Power and Desalination Plant, owned by SMN Power Barka and operated under a PWPA with
OPWP. The Barka II plant has a capacity of 120,000 m3/d (26 MIGD) using RO technology.
Sohar I Power and Desalination Plant, owned by Sohar Power Company and operated under a PWPA
with OPWP. Sohar I plant has a desalination capacity of 150,000 m3/d (33 MIGD), using MSF units.
Muscat City Desalination Plant, also called the new Ghubrah IWP, which is owned by Muscat City
Desalination Company and currently under construction, and will be operated under a WPA with
OPWP when it completes commissioning in Q4 2014. The plant has contracted desalination capacity
of 191,000 m3/d (42 MIGD) using RO technology.
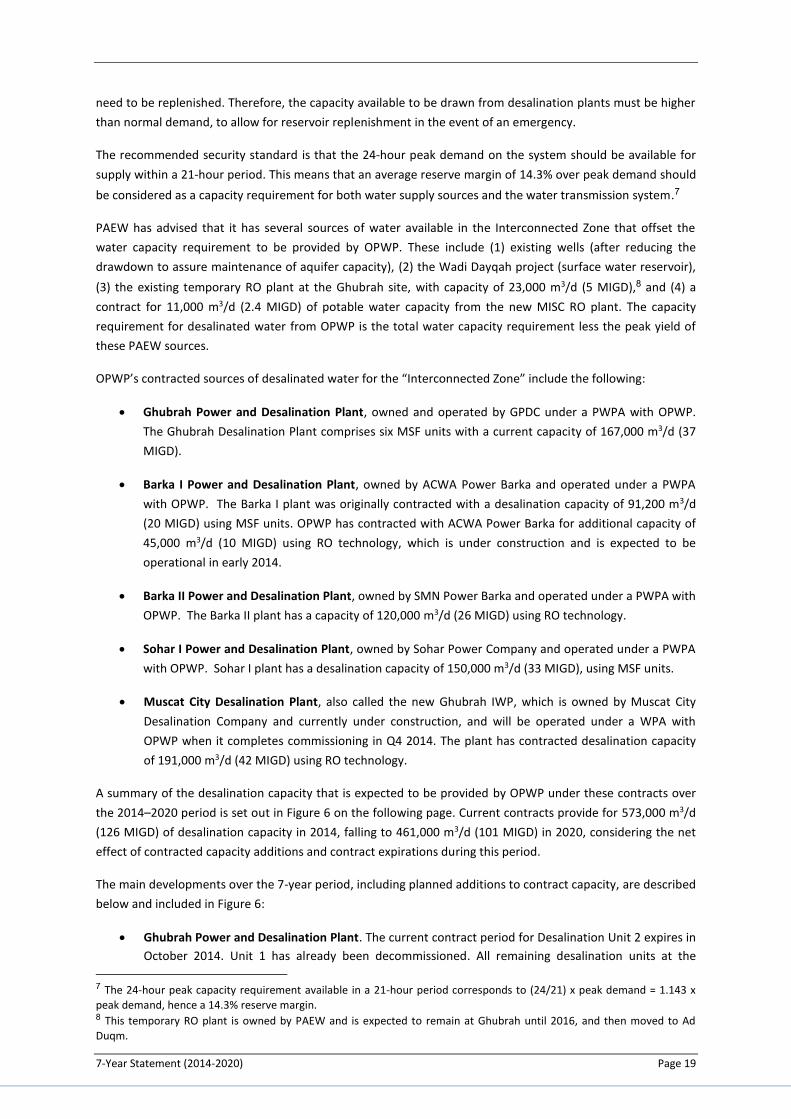
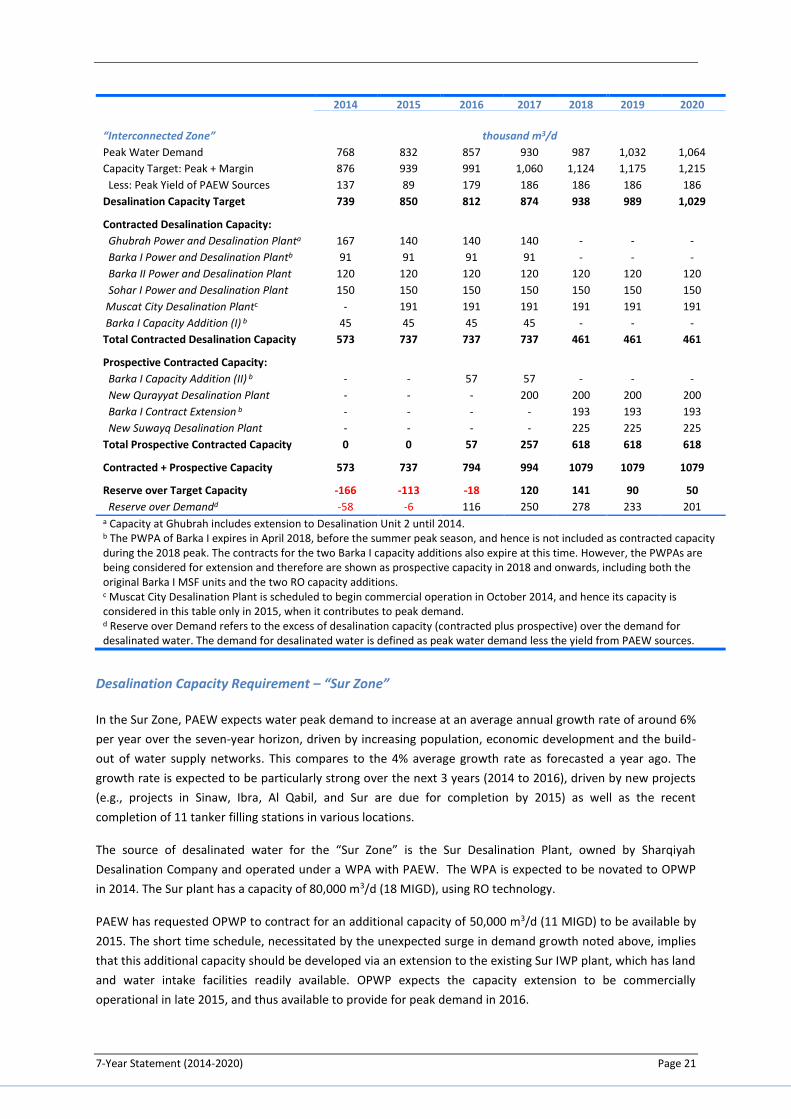
A summary of the desalination capacity that is expected to be provided by OPWP under these contracts over
the 2014–2020 period is set out in Figure 6 on the following page. Current contracts provide for 573,000 m3/d
(126 MIGD) of desalination capacity in 2014, falling to 461,000 m3/d (101 MIGD) in 2020, considering the net
effect of contracted capacity additions and contract expirations during this period.
The main developments over the 7-year period, including planned additions to contract capacity, are described
below and included in Figure 6:
Ghubrah Power and Desalination Plant. The current contract period for Desalination Unit 2 expires in
October 2014. Unit 1 has already been decommissioned. All remaining desalination units at the
7 The 24-hour peak capacity requirement available in a 21-hour period corresponds to (24/21) x peak demand = 1.143 x
peak demand, hence a 14.3% reserve margin. 8 This temporary RO plant is owned by PAEW and is expected to remain at Ghubrah until 2016, and then moved to Ad
Duqm.
7-Year Statement (2014-2020) Page 20
existing Ghubrah plant will fall out of contract by March 2018 and are expected to be
decommissioned at that time.
Barka I Power and Desalination Plant. A second new RO plant is expected to be contracted with
ACWA Power Barka, adding 57,000 m3/d (12.5 MIGD) for operation from October 2015.The PWPA for
Barka I will expire in April 2018, with the result that the entire Barka I desalination capacity will fall
out of contract, including the original MSF plant and both RO plant additions (193,200 m3/d in total,
or 43 MIGD). OPWP is negotiating with the plant owner for extension of the contract in a process
similar to that described in section 1.2 for the expiring PPAs, and expects to finalize extension terms in
2014.
New Desalination Capacity at Qurayyat and As Suwayq. OPWP plans two major additions of
desalination capacity at new locations: Qurayyat and As Suwayq. The Qurayyat plant is considered at
about 200,000 m3/d (44 MIGD) for service in 2017. The Suwayq plant is planned to have capacity of
up to 225,000 m3/d (50 MIGD) and to be in service in 2018. Both plants would utilize RO technology.
Figure 6 below provides a summary of the demand/supply balance in the Interconnected Zone over the 2014-
2020 period. Considering the recent developments in demand, which has increased faster than capacity
additions, capacity shortfalls are expected in 2014 and 2015. The addition of the Muscat City Desalination
Plant at Ghubrah is expected to erase most of the deficit in 2015. The expected capacity deficits will be
addressed by increasing production from groundwells. Although PAEW policy aims to limit the use of
groundwater resources in order to allow strained underground aquifers to recharge, the resource is available
in contingencies such as that which is anticipated in these two years.
In 2016, with the second capacity addition at Barka I, desalination capacity is expected to be sufficient to meet
demand, although still not sufficient to meet the target level for reserve margin. In 2017, with the completion
of the new Qurayyat Desalination Plant, total capacity will exceed the reserve margin target. OPWP expects to
meet the reserve margin target throughout the remaining forecast period through 2020, including the
contribution of the planned As Suwayq plant in 2018.
Figure 6 Desalinated Water Demand / Supply Balance – “Interconnected Zone”
0
100
200
300
400
500
600
700
800
900
1000
1100
1200
2014 2015 2016 2017 2018 2019 2020
Thousandm3/d
Contracted Desalination Capacity
Prospective Contracted Capacity
Demand for Desalinated Water
Desalination Capacity Target
7-Year Statement (2014-2020) Page 21
2014 2015 2016 2017 2018 2019 2020
“Interconnected Zone” thousand m3/d
Peak Water Demand 768 832 857 930 987 1,032 1,064
Capacity Target: Peak + Margin 876 939 991 1,060 1,124 1,175 1,215
Less: Peak Yield of PAEW Sources 137 89 179 186 186 186 186
Desalination Capacity Target 739 850 812 874 938 989 1,029
Contracted Desalination Capacity:
Ghubrah Power and Desalination Planta 167 140 140 140 - - -
Barka I Power and Desalination Plantb 91 91 91 91 - - -
Barka II Power and Desalination Plant 120 120 120 120 120 120 120
Sohar I Power and Desalination Plant 150 150 150 150 150 150 150
Muscat City Desalination Plantc - 191 191 191 191 191 191
Barka I Capacity Addition (I) b 45 45 45 45 - - -
Total Contracted Desalination Capacity 573 737 737 737 461 461 461
Prospective Contracted Capacity:
Barka I Capacity Addition (II) b - - 57 57 - - -
New Qurayyat Desalination Plant - - - 200 200 200 200
Barka I Contract Extension b - - - - 193 193 193
New Suwayq Desalination Plant - - - - 225 225 225
Total Prospective Contracted Capacity 0 0 57 257 618 618 618
Contracted + Prospective Capacity 573 737 794 994 1079 1079 1079
Reserve over Target Capacity -166 -113 -18 120 141 90 50
Reserve over Demandd -58 -6 116 250 278 233 201 a Capacity at Ghubrah includes extension to Desalination Unit 2 until 2014. b The PWPA of Barka I expires in April 2018, before the summer peak season, and hence is not included as contracted capacity during the 2018 peak. The contracts for the two Barka I capacity additions also expire at this time. However, the PWPAs are being considered for extension and therefore are shown as prospective capacity in 2018 and onwards, including both the original Barka I MSF units and the two RO capacity additions. c Muscat City Desalination Plant is scheduled to begin commercial operation in October 2014, and hence its capacity is considered in this table only in 2015, when it contributes to peak demand. d Reserve over Demand refers to the excess of desalination capacity (contracted plus prospective) over the demand for desalinated water. The demand for desalinated water is defined as peak water demand less the yield from PAEW sources.
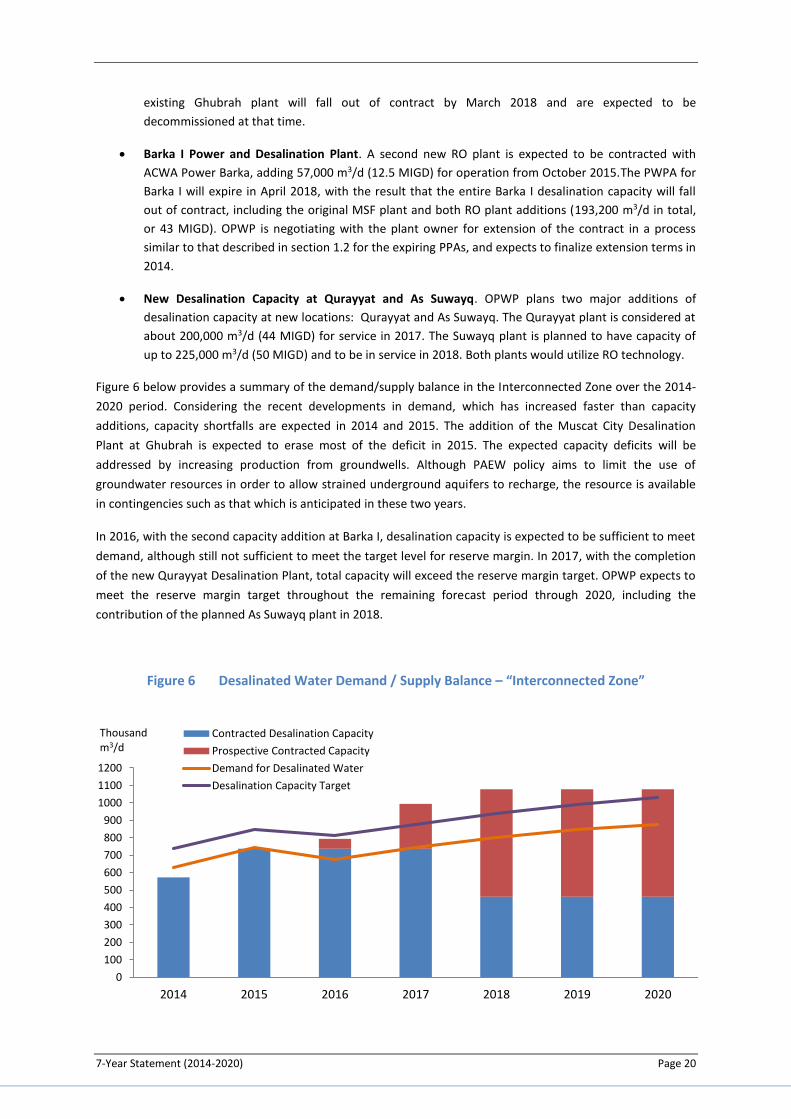
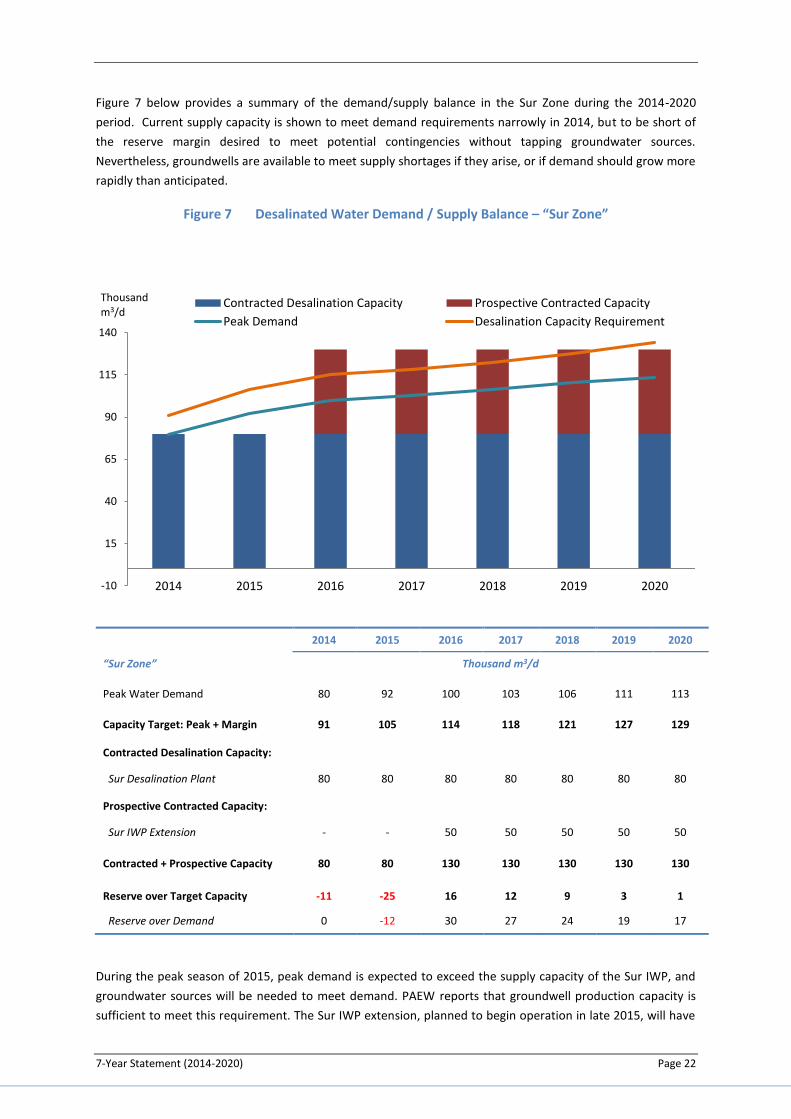
Desalination Capacity Requirement – “Sur Zone”
In the Sur Zone, PAEW expects water peak demand to increase at an average annual growth rate of around 6%
per year over the seven-year horizon, driven by increasing population, economic development and the build-
out of water supply networks. This compares to the 4% average growth rate as forecasted a year ago. The
growth rate is expected to be particularly strong over the next 3 years (2014 to 2016), driven by new projects
(e.g., projects in Sinaw, Ibra, Al Qabil, and Sur are due for completion by 2015) as well as the recent
completion of 11 tanker filling stations in various locations.
The source of desalinated water for the “Sur Zone” is the Sur Desalination Plant, owned by Sharqiyah
Desalination Company and operated under a WPA with PAEW. The WPA is expected to be novated to OPWP
in 2014. The Sur plant has a capacity of 80,000 m3/d (18 MIGD), using RO technology.
PAEW has requested OPWP to contract for an additional capacity of 50,000 m3/d (11 MIGD) to be available by
2015. The short time schedule, necessitated by the unexpected surge in demand growth noted above, implies
that this additional capacity should be developed via an extension to the existing Sur IWP plant, which has land
and water intake facilities readily available. OPWP expects the capacity extension to be commercially
operational in late 2015, and thus available to provide for peak demand in 2016.
7-Year Statement (2014-2020) Page 22
Figure 7 below provides a summary of the demand/supply balance in the Sur Zone during the 2014-2020
period. Current supply capacity is shown to meet demand requirements narrowly in 2014, but to be short of
the reserve margin desired to meet potential contingencies without tapping groundwater sources.
Nevertheless, groundwells are available to meet supply shortages if they arise, or if demand should grow more
rapidly than anticipated.
Figure 7 Desalinated Water Demand / Supply Balance – “Sur Zone”
2014 2015 2016 2017 2018 2019 2020
“Sur Zone” Thousand m3/d
Peak Water Demand 80 92 100 103 106 111 113
Capacity Target: Peak + Margin 91 105 114 118 121 127 129
Contracted Desalination Capacity:
Sur Desalination Plant 80 80 80 80 80 80 80
Prospective Contracted Capacity:
Sur IWP Extension - - 50 50 50 50 50
Contracted + Prospective Capacity 80 80 130 130 130 130 130
Reserve over Target Capacity -11 -25 16 12 9 3 1
Reserve over Demand 0 -12 30 27 24 19 17
During the peak season of 2015, peak demand is expected to exceed the supply capacity of the Sur IWP, and
groundwater sources will be needed to meet demand. PAEW reports that groundwell production capacity is
sufficient to meet this requirement. The Sur IWP extension, planned to begin operation in late 2015, will have
-10
15
40
65
90
115
140
2014 2015 2016 2017 2018 2019 2020
Thousandm3/d
Contracted Desalination Capacity Prospective Contracted Capacity
Peak Demand Desalination Capacity Requirement
7-Year Statement (2014-2020) Page 23
sufficient production capacity to meet both peak demand and reserve margin targets from 2016 through 2020.
Groundwater sources will no longer be needed after the summer peak season of 2015.
1.5 COMBINING POWER GENERATION AND WATER DESALINATION
Introduction
In developing its plans for procuring power generation resources, OPWP is required to consider the
opportunity for combining power generation with water desalination so as to benefit from economies of co-
location and co-procurement. The most recent examples of combined development of power and
desalination capacity are the Salalah IWPP in Dhofar and the Barka II Power and Desalination Plant in the MIS.
In both cases, bidders proposed to use RO rather than MSF technology for water desalination, although the
procurement specifications did not specify the technology to be used. OPWP expects that future plants will
also be proposed to use RO technology due to its economic advantage. .
Potential for Future Combined Power Generation and Desalination
As discussed in Section 1.4 above, two large desalination plants are planned during the 7-year planning period,
at Qurayyat and As Suwayq, with service dates in 2017 and 2018 respectively. Of these two locations, the
Qurayyat site is considered a relatively poor choice for power. It is relatively distant from the gas transmission
network, and the mountainous terrain between the site and such facilities would make the necessary
connection lines quite costly. The As Suwayq site is situated quite near to power and gas transmission lines
between Barka and Sohar. Hence of the two sites, As Suwayq is more amenable to a co-located power and
water facility.
Site and infrastructure considerations have been studied carefully in preparation for procurement of these
projects. An initial study identified potential sites at both Qurayyat and As Suwayq, in consultation with the
Ministry of Housing, Supreme Council for Planning, and others. OPWP conducted a broader study in 2013 to
identify potential sites for power and water desalination throughout the Sultanate, for long-term planning.
This Site Selection and Reservation Study considered land access, infrastructure issues for fuel supply,
electricity and water connection, and a variety of other issues that involved consultation with the Ministry of
Housing, Supreme Council for Planning, Ministry of Environment and Climate Affairs, MOG, OGC, OETC, PAEW,
and other organizations.
OPWP plans to move ahead with the next water desalination plant at Qurayyat for a 2017 start, on a water-
only basis (IWP). OPWP is currently evaluating the feasibility of a co-located power and water plant (IWPP) at
As Suwayq for operation in 2017/2018. However, the area around the As Suwayq site has been found to be
relatively congested, posing challenges to obtain land for the extensive access corridors needed for gas
pipeline, electricity transmission, and water pipeline, in time to meet requirements for the plant to be in
service. For this reason, OPWP is also considering alternative sites that may involve separate development of
water and power. These sites include Ibri and Sohar for power, Sohar and Barka for water, in addition to the As
Suwayq site. The selection of site(s) is expected to be completed early in the second quarter of 2014.
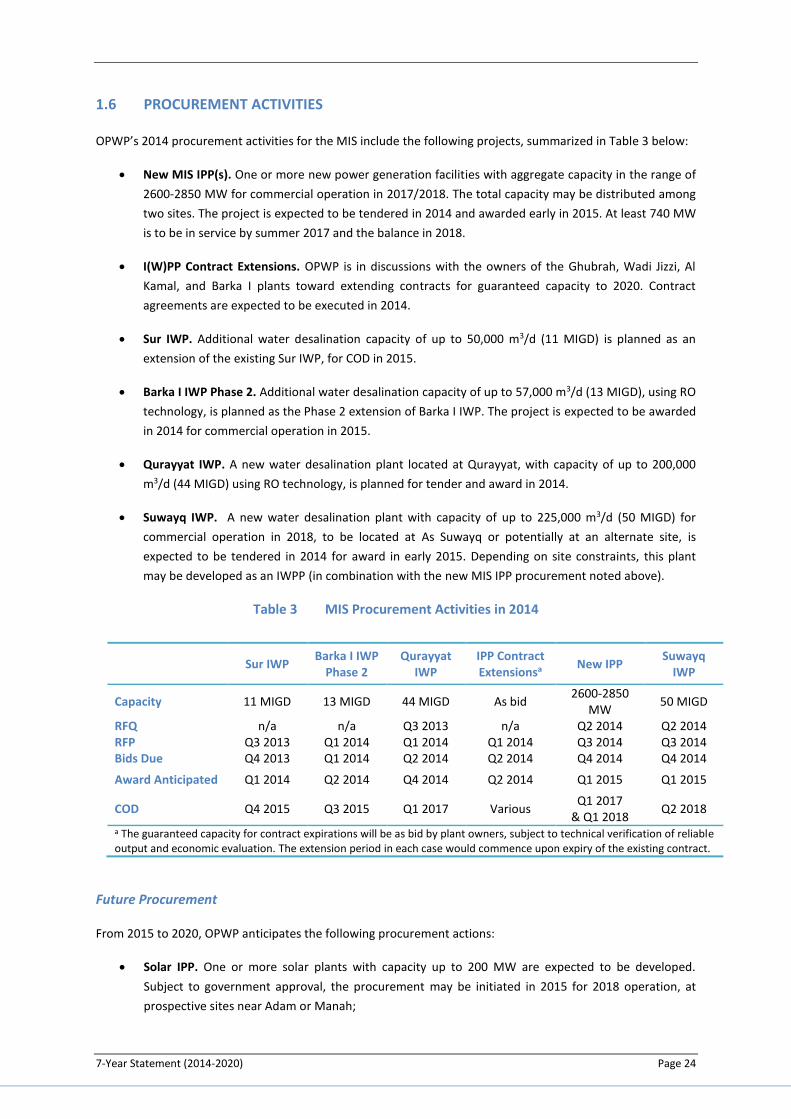
7-Year Statement (2014-2020) Page 24
1.6 PROCUREMENT ACTIVITIES
OPWP’s 2014 procurement activities for the MIS include the following projects, summarized in Table 3 below:
New MIS IPP(s). One or more new power generation facilities with aggregate capacity in the range of
2600-2850 MW for commercial operation in 2017/2018. The total capacity may be distributed among
two sites. The project is expected to be tendered in 2014 and awarded early in 2015. At least 740 MW
is to be in service by summer 2017 and the balance in 2018.
I(W)PP Contract Extensions. OPWP is in discussions with the owners of the Ghubrah, Wadi Jizzi, Al
Kamal, and Barka I plants toward extending contracts for guaranteed capacity to 2020. Contract
agreements are expected to be executed in 2014.
Sur IWP. Additional water desalination capacity of up to 50,000 m3/d (11 MIGD) is planned as an
extension of the existing Sur IWP, for COD in 2015.
Barka I IWP Phase 2. Additional water desalination capacity of up to 57,000 m3/d (13 MIGD), using RO
technology, is planned as the Phase 2 extension of Barka I IWP. The project is expected to be awarded
in 2014 for commercial operation in 2015.
Qurayyat IWP. A new water desalination plant located at Qurayyat, with capacity of up to 200,000
m3/d (44 MIGD) using RO technology, is planned for tender and award in 2014.
Suwayq IWP. A new water desalination plant with capacity of up to 225,000 m3/d (50 MIGD) for
commercial operation in 2018, to be located at As Suwayq or potentially at an alternate site, is
expected to be tendered in 2014 for award in early 2015. Depending on site constraints, this plant
may be developed as an IWPP (in combination with the new MIS IPP procurement noted above).
Table 3 MIS Procurement Activities in 2014
Sur IWP
Barka I IWP Phase 2
Qurayyat IWP
IPP Contract Extensionsa
New IPP Suwayq
IWP
Capacity 11 MIGD 13 MIGD 44 MIGD As bid 2600-2850
MW 50 MIGD
RFQ n/a n/a Q3 2013 n/a Q2 2014 Q2 2014 RFP Q3 2013 Q1 2014 Q1 2014 Q1 2014 Q3 2014 Q3 2014 Bids Due Q4 2013 Q1 2014 Q2 2014 Q2 2014 Q4 2014 Q4 2014
Award Anticipated Q1 2014 Q2 2014 Q4 2014 Q2 2014 Q1 2015 Q1 2015
COD Q4 2015 Q3 2015 Q1 2017 Various Q1 2017
& Q1 2018 Q2 2018
a The guaranteed capacity for contract expirations will be as bid by plant owners, subject to technical verification of reliable output and economic evaluation. The extension period in each case would commence upon expiry of the existing contract.
Future Procurement
From 2015 to 2020, OPWP anticipates the following procurement actions:
Solar IPP. One or more solar plants with capacity up to 200 MW are expected to be developed.
Subject to government approval, the procurement may be initiated in 2015 for 2018 operation, at
prospective sites near Adam or Manah;
7-Year Statement (2014-2020) Page 25
New MIS IPP(s). OPWP expects that by around 2017, procurement activities will begin for another
major power station for commercial operation in about 2021. Existing plants with contract expirations
at the end of 2020 may also offer capacity for contract for 2021 onwards.
New MIS IWPs. Additional desalination capacity may also be required for operation in 2020 or 2021
for both the Interconnected Zone and Sur Zone. The site for new capacity in the Interconnected Zone
is currently expected to be a second phase development at either As Suwayq or Sohar.
These projects will be defined further in time, particularly depending on developments in demand growth and
system requirements, as well as depending on the Government’s evolving renewable energy development
policy.
Long-Term Considerations
OPWP works closely with the Government toward developing a coordinated long-term strategy for electricity
and water supply. A number of studies are in progress in 2014 which will bear on OPWP’s long-term plans.
They include the following, considered below on an issue by issue basis:
Fuel Security and Diversity of Supply: PAEW has launched a strategic study in 2014, the National
Energy Strategy, to consider national fuel policy, in association with other critical government
stakeholders. OPWP is coordinating with other participants in the study, and also coordinates closely
with MOG regarding the availability and requirements of natural gas supply for future power
generation plants;
Energy Efficiency and Demand Side Management: PAEW completed a Master Plan for Energy
Conservation in 2013, and OPWP expects to cooperate with all the sector companies as measures are
selected for implementation over the coming years. Such measures would likely affect forecasts of
long-term demand growth and influence generation expansion planning, and OPWP may have a role
in associated pricing programs; and
Regional Interconnects: OPWP participates in the Planning and Operations Committees of the Gulf
Cooperation Council Interconnection Agency (GCCIA), and will evaluate the potential advantages of
commercial arrangements for energy trade in the coming years. OPWP also coordinates with PDO for
effective utilization of the Nizwa interconnect between the MIS and PDO system.
Transmission System Developments: OPWP coordinates with OETC regarding the operation and
economic dispatch of the power system, and regarding plans for development of new power
generation plants and their demands on the transmission grid. In particular, OETC and OPWP have
coordinated closely during the development of OETC’s Master Plan for Transmission System
Development, which is expected to be completed in 2014, and with respect to the siting options of
the new MIS IPP(s) planned for 2017 and 2018.
The aim of this work will be to establish a basis for the planning and procurement of future power generation
(and associated water), consistent with the Government’s broader economic strategy and policy objectives.
7-Year Statement (2014-2020) Page 26
1.7 FUEL REQUIREMENTS
2013 Fuel Usage
The primary fuel resource for power generation and associated water production in the MIS is currently
natural gas, supplied to power and desalination plants by the Ministry of Oil & Gas (MOG). Total gas
consumption at the main power and desalination plants in 2013 was about 6.7 billion Sm3, equivalent to
18.3 million Sm3/d, which is less than in 2012.9 The peak daily gas consumption during 2013 was 24.2million
Sm3, a decrease of 2% from 2012. These reductions are significant achievements considering rising demand.
A relatively small amount (about 0.13 million litres in total) of diesel fuel was used by temporary generation
facilities connected to the MIS during the summer of 2013. They were used by OETC for local voltage support.
Projected Fuel Requirements
OPWP has prepared indicative projections for the fuel requirements of the MIS over the 2014-2020 period,
under the Expected Demand, Low Case and High Case demand scenarios. These projections are based on a
number of key assumptions, including:
all generation is assumed to be gas-fueled other than the prospective solar plant(s);
solar plant(s) are assumed to provide around 50 MW on average over the daily cycle (representing
about 1-2% of total MIS gas requirements) from 2018 onwards; and
new gas-fueled generation in 2017 and 2018 is assumed to have a similar fuel efficiency to the Sur
plant.
The projections are shown in Figure 8 below.
Overall fuel consumption is expected to increase at an average rate of about 6% per year – lower than the
expected growth rate of electricity demand of about 10% per year. The projected growth rate is consistent
with the last 7-Year Statement. Under the Low Case demand scenario, fuel consumption increases at an
average of 4% per year, whilst in the High Case demand scenario, it grows at an average rate of 9% per year –
in both cases below the rate of growth of electricity demand.
Continuing improvements in the efficiency of power supply have held back the growth rate in fuel
requirements. The full commissioning of the Sohar II and Barka III plants in 2013 and the planned
commissioning of the Sur IPP in 2014 are achieving significant improvement in overall gas utilization efficiency,
based on these plants using newer, more fuel-efficient technology than older plants. Timely addition of new
capacity in the future, and continuing dedication to operational efficiency, will underpin sustained progress in
the management of gas demand by the power system.
9 This total excludes gas consumed by industries and other parties.
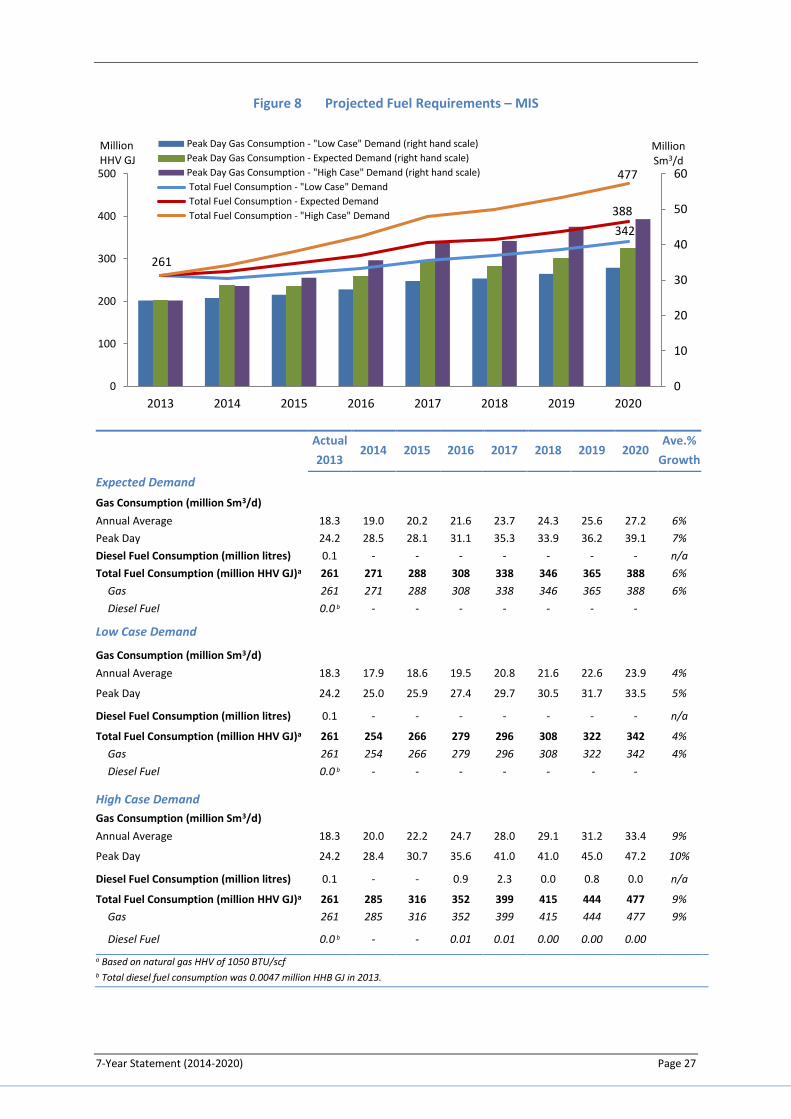
7-Year Statement (2014-2020) Page 27
Figure 8 Projected Fuel Requirements – MIS
Actual
2013 2014 2015 2016 2017 2018 2019 2020
Ave.%
Growth
Expected Demand
Gas Consumption (million Sm3/d)
Annual Average 18.3 19.0 20.2 21.6 23.7 24.3 25.6 27.2 6%
Peak Day 24.2 28.5 28.1 31.1 35.3 33.9 36.2 39.1 7%
Diesel Fuel Consumption (million litres) 0.1 - - - - - - - n/a
Total Fuel Consumption (million HHV GJ)a 261 271 288 308 338 346 365 388 6%
Gas 261 271 288 308 338 346 365 388 6%
Diesel Fuel 0.0 b - - - - - - -
Low Case Demand
Gas Consumption (million Sm3/d)
Annual Average 18.3 17.9 18.6 19.5 20.8 21.6 22.6 23.9 4%
Peak Day 24.2 25.0 25.9 27.4 29.7 30.5 31.7 33.5 5%
Diesel Fuel Consumption (million litres) 0.1 - - - - - - - n/a
Total Fuel Consumption (million HHV GJ)a 261 254 266 279 296 308 322 342 4%
Gas 261 254 266 279 296 308 322 342 4%
Diesel Fuel 0.0 b - - - - - - -
High Case Demand
Gas Consumption (million Sm3/d)
Annual Average 18.3 20.0 22.2 24.7 28.0 29.1 31.2 33.4 9%
Peak Day 24.2 28.4 30.7 35.6 41.0 41.0 45.0 47.2 10%
Diesel Fuel Consumption (million litres) 0.1 - - 0.9 2.3 0.0 0.8 0.0 n/a
Total Fuel Consumption (million HHV GJ)a 261 285 316 352 399 415 444 477 9%
Gas 261 285 316 352 399 415 444 477 9%
Diesel Fuel 0.0 b - - 0.01 0.01 0.00 0.00 0.00
a Based on natural gas HHV of 1050 BTU/scf b Total diesel fuel consumption was 0.0047 million HHB GJ in 2013.
342
388
261
477
0
10
20
30
40
50
60
0
100
200
300
400
500
2013 2014 2015 2016 2017 2018 2019 2020
MillionSm3/d
MillionHHV GJ
Peak Day Gas Consumption - "Low Case" Demand (right hand scale)
Peak Day Gas Consumption - Expected Demand (right hand scale)
Peak Day Gas Consumption - "High Case" Demand (right hand scale)
Total Fuel Consumption - "Low Case" Demand
Total Fuel Consumption - Expected Demand
Total Fuel Consumption - "High Case" Demand
7-Year Statement (2014-2020) Page 28
Gas Availability
OPWP consults with MOG on a regular basis, in order to confirm the future availability of gas for power
generation (and associated water production) and to co-ordinate planning.
MOG has indicated that future gas supply is constrained, but with assurances that the power sector has a
priority for future gas allocations. While MOG has committed to gas supply for the planned capacity addition in
Salalah for 2018, and is expected soon to commit similarly to the planned MIS plants for 2017 and 2018, gas
availability for later plants is not assured.
Should further required gas allocations not be available to the power and water sector, then (in addition to
pursuing fuel-efficiency improvement options) OPWP would likely need to:
bring forward plans to procure new generation capacity based on a fuel other than gas;
discuss with the Government the feasibility of importing gas specifically for use in power generation
(and associated water production); and/or
make use of optional arrangements included in the Barka III and Sohar II PPAs for dispatch on liquid
fuel instead of gas.
OPWP will continue to consult closely with MOG with regard to all of these matters.
7-Year Statement (2014-2020) Page 29
SECTION 2 SALALAH SYSTEM
The Salalah System covers the city of Salalah and surrounding areas in the Governorate of Dhofar, serving
around 77,000 electricity customers.
Until recently, the generation, transmission and distribution system were owned and operated by Dhofar
Power Co. (DPC) pursuant to a Concession Agreement signed with the Government in 2001. Effective from
January 1, 2014, the Concession Agreement has been terminated and DPC has been restructured: the
generation activities and assets have been transferred to Dhofar Generating Company (DGC), the
transmission activities and assets have been transferred to Oman Electricity Transmission Company (OETC),
and the distribution and supply activities and assets have remained with DPC. DPC acts as the sole
electricity supplier within the service area covered by the system, supplying existing and new electricity
customers. In addition to the generation assets owned and operated by DGC, there is an independent power
generation and water desalination facility (the Salalah IWPP) in the Salalah system, operating under a
PWPA with OPWP.
The Salalah System is interconnected with the power system of Petroleum Development Oman (PDO) via a
132 kV link between Thumrait and Harweel, with transfer capacity up to 150 MW. This interconnection
provides important reliability benefits through the sharing of generation reserves.
The Directorate General of Water (DGW) is the principal entity responsible for potable water supply and
distribution in the Governorate of Dhofar, apart from small, private networks. The Salalah IWPP supplies
desalinated water to the DGW transmission system, and is currently its principal source of water supply.
OPWP’s role in the Salalah System is similar to its role in the MIS, which is to procure economically the
power and desalinated water required by DPC and DGW, respectively, in bulk from generation/production
facilities connected to the Salalah System. OPWP is required to ensure that sufficient power generation
resources are available to meet DPC electricity demands. OPWP is also required to procure bulk water
supply at the request of water departments including DGW, and, wherever beneficial, to co-procure
desalinated water with power generation in joint facilities.
7-Year Statement (2014-2020) Page 30
2.1 DEMAND FOR ELECTRICITY
Historical Demand
Electricity demand growth in 2013 tracked closely to the forecast of the last 7-Year Statement. Average
demand increased by 9% to 282 MW (corresponding to 2.47 TWh). The peak demand was 420 MW,10 an
increase of 8% over the 2012 peak demand.
The average annual growth rate in peak demand over the past 5-7 years has been between 9% and 10%, while
single-year growth has reached as high as 15%. The ten-year average growth rate is also about 9%. This rapid
development rate has been common among all principal consumer sectors.
Demand Projections
OPWP’s 7-year electricity demand projections for the Salalah System have been developed after consultation
with DPC and representatives of the industrial sector. The projections have been developed in a similar
manner as for the MIS: (1) the projected demands represent the “net system demand”, in that they are
inclusive of assumed transmission and distribution system losses but exclude the internal auxiliary
consumption of power and desalination plants; (2) the Expected Demand scenario is based on an assumption
of “normal” weather, whereas the Low Case and High Case scenarios include the effects of weather extremes;
(3) they are built up from separate analyses of underlying demand, and certain bulk loads, comprising mainly
industrial demands, that are assessed on a specific load-wise basis11; and (4) they are presented as a range
with a Low Case, High Case and central, Expected Demand forecast.
The projections are summarized in Figure 9 below.
Under the Expected forecast, average demand is projected to grow from 282 MW (corresponding to 2.47 TWh)
in 2013 to 553 MW (4.86 TWh) in 2020, an average increase of around 10% per year. Peak demand is
expected to grow at about 10% per year, from 420 MW in 2013 to 800 MW in 2020.
The demand drivers in the Salalah system include population-driven residential growth, construction of
commercial and government buildings, infrastructure development, new tourism projects, and industrial
growth in designated economic zones. All sectors are expected to grow rapidly. Underlying Demand – primarily
non-industrial sectors – is expected to account for the majority of growth in peak demand and about the same
share of energy growth as large industrial loads.
The growth rate of underlying demand is unchanged from OPWP’s last 7-Year Statement under the Expected
Demand scenario. The overall forecast has reduced, however, due to a reassessment of development
prospects for a single, large industrial customer that accounted for a significant share of demand in both the
Expected Demand and High Case scenarios. Apart from this, the assessment of other demands has changed
little. The Expected Demand forecast is grounded in historical trends and projects assessed as committed in
the short term. It takes the average growth of Underlying Demand over the past five years, which is about the
middle of the range of growth rates considering the past 5-10 years. Growth in Bulk Loads – primarily industrial
projects – is limited to committed projects in the near term, and in the medium term a conservative
assessment of the likely realization of identified, prospective projects.
10 DPC reported the net peak demand for the Salalah System as 420 MW at 00:34 pm on Tuesday, May 28th, 2013. 11 For the Salalah System, individual loads connected (or expected to be connected) to the transmission and distribution system at 33 kV or above are regarded as bulk loads for purposes of the projections.
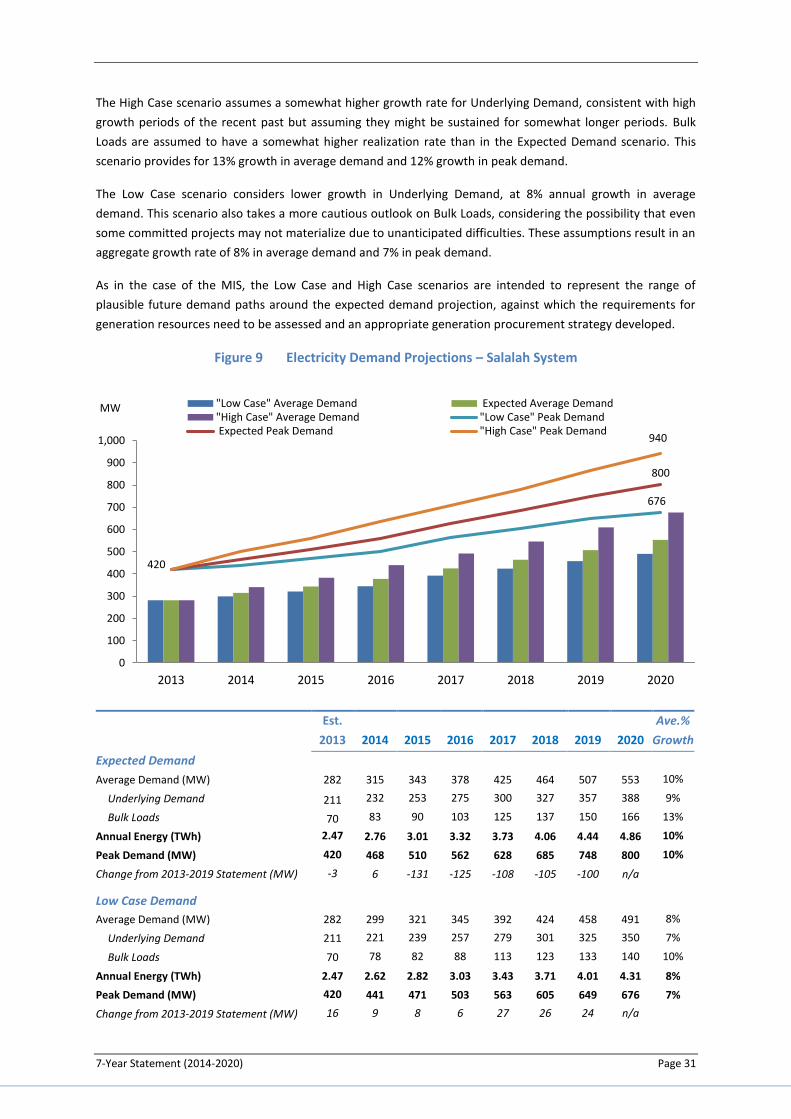
7-Year Statement (2014-2020) Page 31
The High Case scenario assumes a somewhat higher growth rate for Underlying Demand, consistent with high
growth periods of the recent past but assuming they might be sustained for somewhat longer periods. Bulk
Loads are assumed to have a somewhat higher realization rate than in the Expected Demand scenario. This
scenario provides for 13% growth in average demand and 12% growth in peak demand.
The Low Case scenario considers lower growth in Underlying Demand, at 8% annual growth in average
demand. This scenario also takes a more cautious outlook on Bulk Loads, considering the possibility that even
some committed projects may not materialize due to unanticipated difficulties. These assumptions result in an
aggregate growth rate of 8% in average demand and 7% in peak demand.
As in the case of the MIS, the Low Case and High Case scenarios are intended to represent the range of
plausible future demand paths around the expected demand projection, against which the requirements for
generation resources need to be assessed and an appropriate generation procurement strategy developed.
Figure 9 Electricity Demand Projections – Salalah System
Est.
2013 2014 2015 2016 2017 2018 2019 2020
Ave.%
Growth
Expected Demand
Average Demand (MW) 282 315 343 378 425 464 507 553 10%
Underlying Demand 211 232 253 275 300 327 357 388 9%
Bulk Loads 70 83 90 103 125 137 150 166 13%
Annual Energy (TWh) 2.47 2.76 3.01 3.32 3.73 4.06 4.44 4.86 10%
Peak Demand (MW) 420
468 510 562 628 685 748 800 10%
Change from 2013-2019 Statement (MW) -3
6 -131 -125 -108 -105 -100 n/a
Low Case Demand
Average Demand (MW) 282 299 321 345 392 424 458 491 8%
Underlying Demand 211 221 239 257 279 301 325 350 7%
Bulk Loads 70 78 82 88 113 123 133 140 10%
Annual Energy (TWh) 2.47 2.62 2.82 3.03 3.43 3.71 4.01 4.31 8%
Peak Demand (MW) 420
441 471 503 563 605 649 676 7%
Change from 2013-2019 Statement (MW) 16
9 8 6 27 26 24 n/a
420
676
800
940
0
100
200
300
400
500
600
700
800
900
1,000
2013 2014 2015 2016 2017 2018 2019 2020
MW "Low Case" Average Demand Expected Average Demand"High Case" Average Demand "Low Case" Peak Demand Expected Peak Demand "High Case" Peak Demand
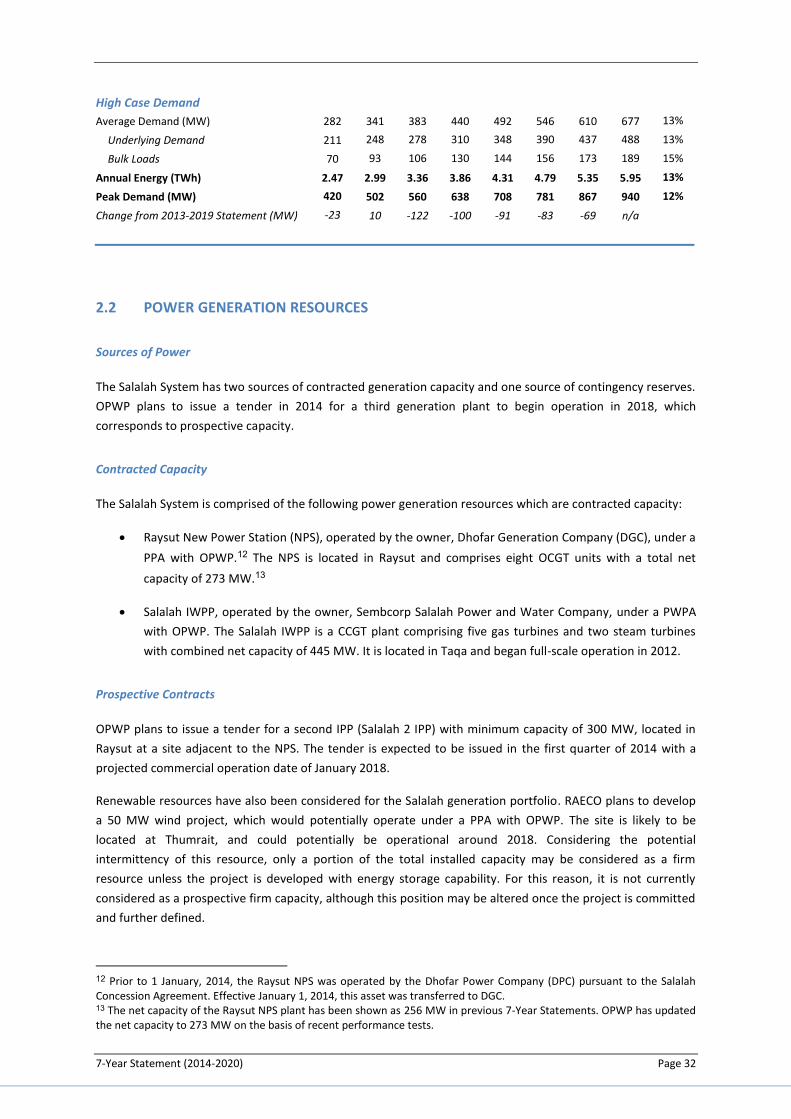
7-Year Statement (2014-2020) Page 32
High Case Demand
Average Demand (MW) 282 341 383 440 492 546 610 677 13%
Underlying Demand 211 248 278 310 348 390 437 488 13%
Bulk Loads 70 93 106 130 144 156 173 189 15%
Annual Energy (TWh) 2.47 2.99 3.36 3.86 4.31 4.79 5.35 5.95 13%
Peak Demand (MW) 420
502 560 638 708 781 867 940 12%
Change from 2013-2019 Statement (MW) -23
10 -122 -100 -91 -83 -69 n/a
2.2 POWER GENERATION RESOURCES
Sources of Power
The Salalah System has two sources of contracted generation capacity and one source of contingency reserves.
OPWP plans to issue a tender in 2014 for a third generation plant to begin operation in 2018, which
corresponds to prospective capacity.
Contracted Capacity
The Salalah System is comprised of the following power generation resources which are contracted capacity:
Raysut New Power Station (NPS), operated by the owner, Dhofar Generation Company (DGC), under a
PPA with OPWP.12 The NPS is located in Raysut and comprises eight OCGT units with a total net
capacity of 273 MW.13
Salalah IWPP, operated by the owner, Sembcorp Salalah Power and Water Company, under a PWPA
with OPWP. The Salalah IWPP is a CCGT plant comprising five gas turbines and two steam turbines
with combined net capacity of 445 MW. It is located in Taqa and began full-scale operation in 2012.
Prospective Contracts
OPWP plans to issue a tender for a second IPP (Salalah 2 IPP) with minimum capacity of 300 MW, located in
Raysut at a site adjacent to the NPS. The tender is expected to be issued in the first quarter of 2014 with a
projected commercial operation date of January 2018.
Renewable resources have also been considered for the Salalah generation portfolio. RAECO plans to develop
a 50 MW wind project, which would potentially operate under a PPA with OPWP. The site is likely to be
located at Thumrait, and could potentially be operational around 2018. Considering the potential
intermittency of this resource, only a portion of the total installed capacity may be considered as a firm
resource unless the project is developed with energy storage capability. For this reason, it is not currently
considered as a prospective firm capacity, although this position may be altered once the project is committed
and further defined.
12 Prior to 1 January, 2014, the Raysut NPS was operated by the Dhofar Power Company (DPC) pursuant to the Salalah Concession Agreement. Effective January 1, 2014, this asset was transferred to DGC. 13 The net capacity of the Raysut NPS plant has been shown as 256 MW in previous 7-Year Statements. OPWP has updated the net capacity to 273 MW on the basis of recent performance tests.
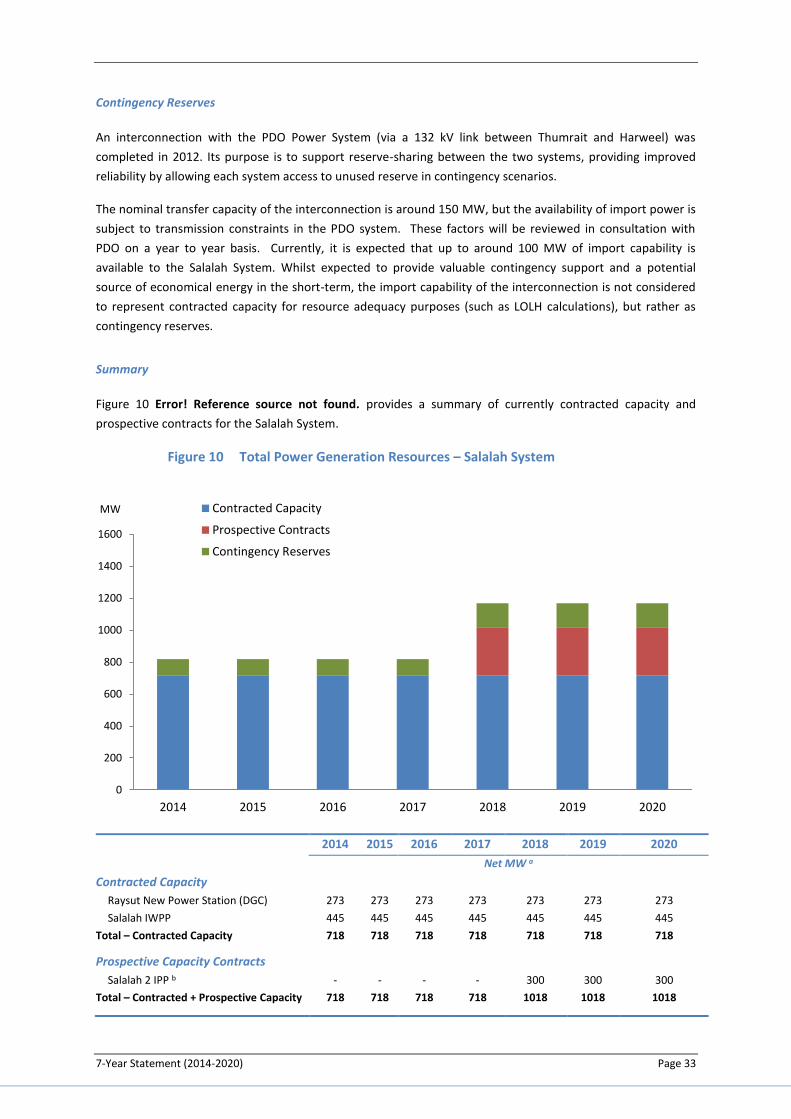
7-Year Statement (2014-2020) Page 33
Contingency Reserves
An interconnection with the PDO Power System (via a 132 kV link between Thumrait and Harweel) was
completed in 2012. Its purpose is to support reserve-sharing between the two systems, providing improved
reliability by allowing each system access to unused reserve in contingency scenarios.
The nominal transfer capacity of the interconnection is around 150 MW, but the availability of import power is
subject to transmission constraints in the PDO system. These factors will be reviewed in consultation with
PDO on a year to year basis. Currently, it is expected that up to around 100 MW of import capability is
available to the Salalah System. Whilst expected to provide valuable contingency support and a potential
source of economical energy in the short-term, the import capability of the interconnection is not considered
to represent contracted capacity for resource adequacy purposes (such as LOLH calculations), but rather as
contingency reserves.
Summary
Figure 10 Error! Reference source not found. provides a summary of currently contracted capacity and
prospective contracts for the Salalah System.
Figure 10 Total Power Generation Resources – Salalah System
2014 2015 2016 2017 2018 2019 2020
Net MW a
Contracted Capacity
Raysut New Power Station (DGC) 273 273 273 273 273 273 273
Salalah IWPP 445 445 445 445 445 445 445
Total – Contracted Capacity 718 718 718 718 718 718 718
Prospective Capacity Contracts
Salalah 2 IPP b - - - - 300 300 300
Total – Contracted + Prospective Capacity 718 718 718 718 1018 1018 1018
0
200
400
600
800
1000
1200
1400
1600
2014 2015 2016 2017 2018 2019 2020
MW Contracted Capacity
Prospective Contracts
Contingency Reserves
7-Year Statement (2014-2020) Page 34
Contingency Reserves
Wind project - - - - 50 50 50
PDO Interconnectc 100 100 100 100 100 100 100
Total –Contingency Reserves 100 100 100 100 150 150 150
TOTAL ALL RESOURCES 818 818 818 818 1168 1168 1168 a All capacities are rated on a net basis (i.e. after allowing for auxiliary consumption inside the plants) at 35°C ambient temperature. b The Salalah 2 IPP is shown at its minimum capacity level of 300 MW, although the project may be contracted in the range of 300 - 400 MW. c Provisional import capability
2.3 ADDITIONAL POWER GENERATION REQUIREMENTS
Statutory and Regulatory Requirements
Similarly to its role in the MIS, OPWP is required by the Sector Law and its license to ensure the adequacy of
generation resources in the Salalah System to meet future power demands. The Sector Law establishes
OPWP’s general responsibility to secure sufficient generation resources to meet demand. Although the OPWP
license does not stipulate a specific generation security standard for the Salalah System, as it does for the MIS,
it requires OPWP to ensure that electricity customers in the Salalah System receive a service generally of
equivalent quality to that received by customers in the MIS.
This latter requirement implies compliance with the MIS standard of 24 hours LOLH, as a minimum. However,
given the more limited level of contingency support available to the Salalah System relative to the MIS, OPWP
has in practice applied a more stringent standard, to ensure the required service quality.
Future Capacity Requirements
OPWP has determined the contracted capacity needed to comply with the security standard in each year
during the 2014-2020 period, for each of the three demand scenarios. They are shown in Figure 11.
In both the Expected Demand and High Case scenario, additional capacity is required in 2018. The supply
deficit is 49 MW under Expected Demand and 157 under the High Case. OPWP plans to add new capacity, the
Salalah 2 IPP, in the range of 300 MW to 400 MW to address the projected supply deficits from 2018 to 2020.
A plant with capacity in this range is assessed to be the most economical given the Salalah System’s annual
load profile and demand uncertainty. The capacity range also enhances competition in procurement, because
it allows bidders to consider a range of plant configurations in which multiple major equipment suppliers may
effectively participate.
The Salalah 2 IPP is expected to provide sufficient capacity to meet demands for the remainder of the forecast
period. The next plant addition would likely be required in 2021 or 2022, depending upon demand growth.
The High Case scenario also indicates a need for additional capacity in 2017, about 75 MW, but this may be
addressed adequately by reserves, or if necessary, supplemented by a modest level of temporary generation.
The Low Case suggests a scenario where current contracts may be sufficient until 2019 or 2020, and that the
Salalah 2 IPP would be underutilized before then. However, OPWP considers that a deferral of the Salalah 2 IPP
would pose a risk of insufficient capacity in the event of a surge in load growth, which can occur even for brief
periods with the emergence of large industrial projects.
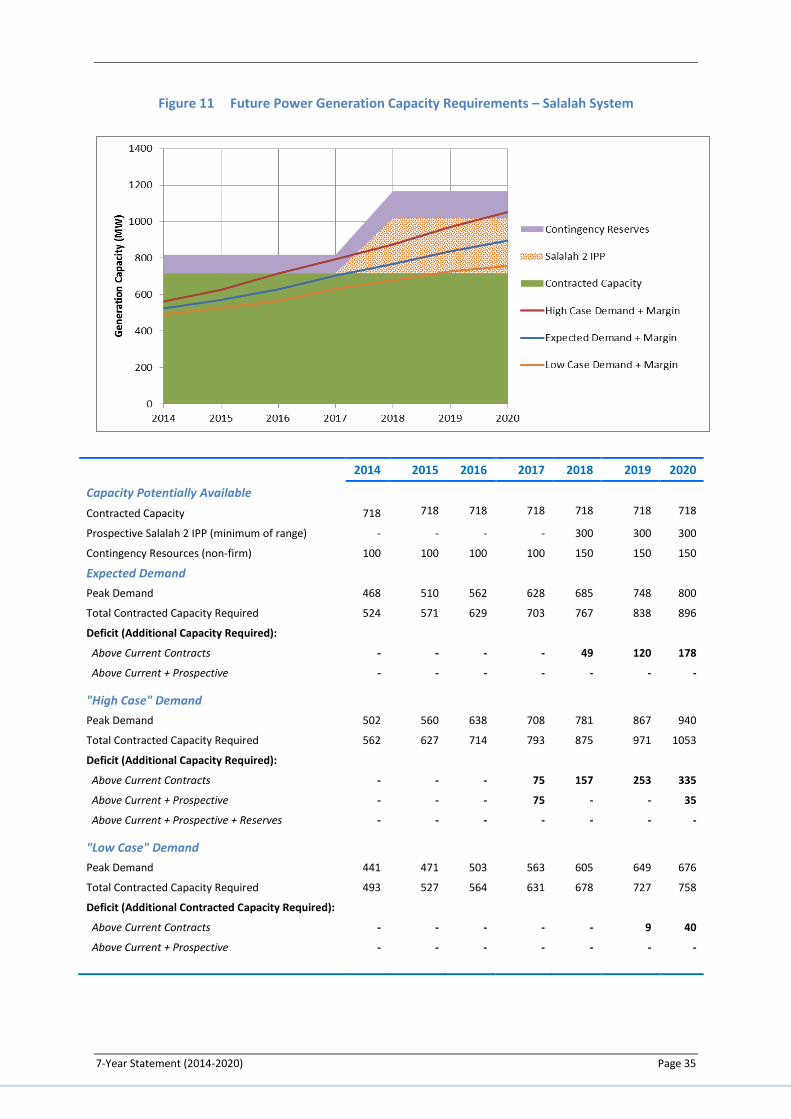
7-Year Statement (2014-2020) Page 35
Figure 11 Future Power Generation Capacity Requirements – Salalah System
2014 2015 2016 2017 2018 2019 2020
Capacity Potentially Available
Contracted Capacity 718 718 718 718 718 718 718
Prospective Salalah 2 IPP (minimum of range) - - - - 300 300 300
Contingency Resources (non-firm) 100 100 100 100 150 150 150
Expected Demand
Peak Demand 468 510 562 628 685 748 800
Total Contracted Capacity Required 524 571 629 703 767 838 896
Deficit (Additional Capacity Required):
Above Current Contracts - - - - 49 120 178
Above Current + Prospective - - - - - - -
"High Case" Demand
Peak Demand 502 560 638 708 781 867 940
Total Contracted Capacity Required 562 627 714 793 875 971 1053
Deficit (Additional Capacity Required):
Above Current Contracts - - - 75 157 253 335
Above Current + Prospective - - - 75 - - 35
Above Current + Prospective + Reserves - - - - - - -
"Low Case" Demand
Peak Demand 441 471 503 563 605 649 676
Total Contracted Capacity Required 493 527 564 631 678 727 758
Deficit (Additional Contracted Capacity Required):
Above Current Contracts - - - - - 9 40
Above Current + Prospective - - - - - - -
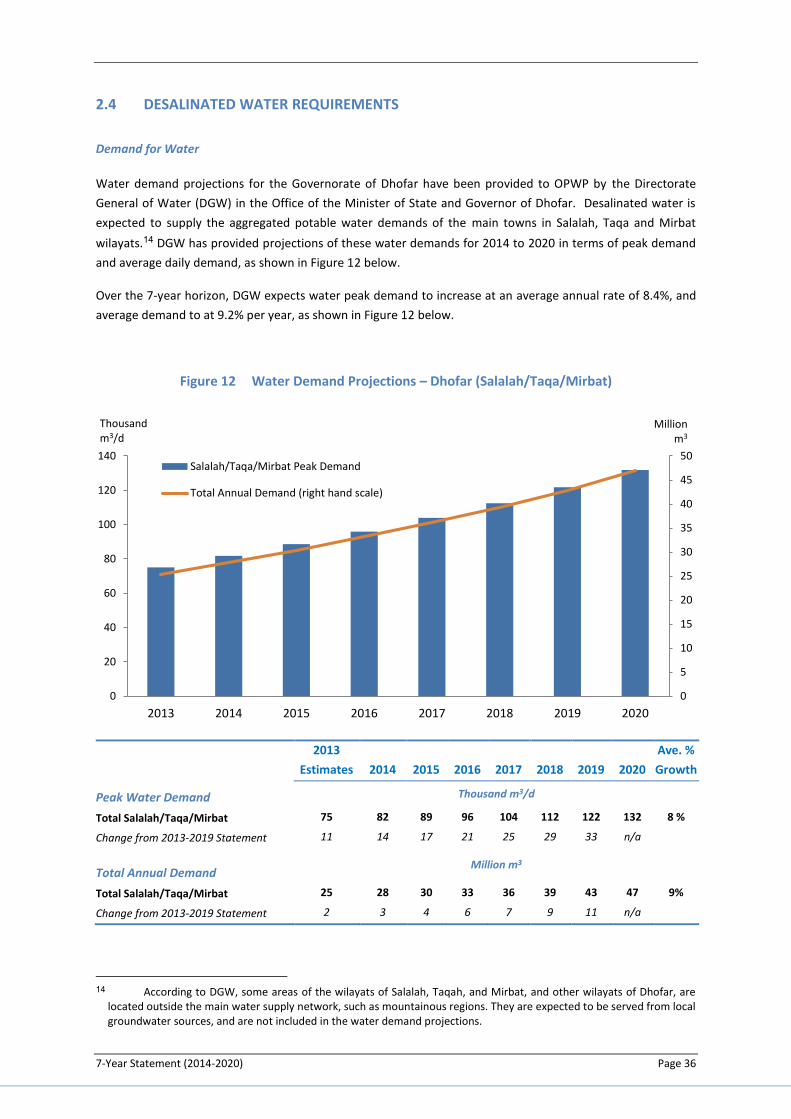
7-Year Statement (2014-2020) Page 36
2.4 DESALINATED WATER REQUIREMENTS
Demand for Water
Water demand projections for the Governorate of Dhofar have been provided to OPWP by the Directorate
General of Water (DGW) in the Office of the Minister of State and Governor of Dhofar. Desalinated water is
expected to supply the aggregated potable water demands of the main towns in Salalah, Taqa and Mirbat
wilayats.14 DGW has provided projections of these water demands for 2014 to 2020 in terms of peak demand
and average daily demand, as shown in Figure 12 below.
Over the 7-year horizon, DGW expects water peak demand to increase at an average annual rate of 8.4%, and
average demand to at 9.2% per year, as shown in Figure 12 below.
Figure 12 Water Demand Projections – Dhofar (Salalah/Taqa/Mirbat)
2013
Estimates 2014 2015 2016 2017 2018 2019 2020
Ave. %
Growth
Peak Water Demand Thousand m3/d
Total Salalah/Taqa/Mirbat 75 82 89 96 104 112 122 132 8 %
Change from 2013-2019 Statement 11 14 17 21 25 29 33 n/a
Total Annual Demand Million m3
Total Salalah/Taqa/Mirbat 25 28 30 33 36 39 43 47 9%
Change from 2013-2019 Statement 2 3 4 6 7 9 11 n/a
14 According to DGW, some areas of the wilayats of Salalah, Taqah, and Mirbat, and other wilayats of Dhofar, are
located outside the main water supply network, such as mountainous regions. They are expected to be served from local groundwater sources, and are not included in the water demand projections.
0
5
10
15
20
25
30
35
40
45
50
0
20
40
60
80
100
120
140
2013 2014 2015 2016 2017 2018 2019 2020
Millionm3
Thousand m3/d
Salalah/Taqa/Mirbat Peak Demand
Total Annual Demand (right hand scale)
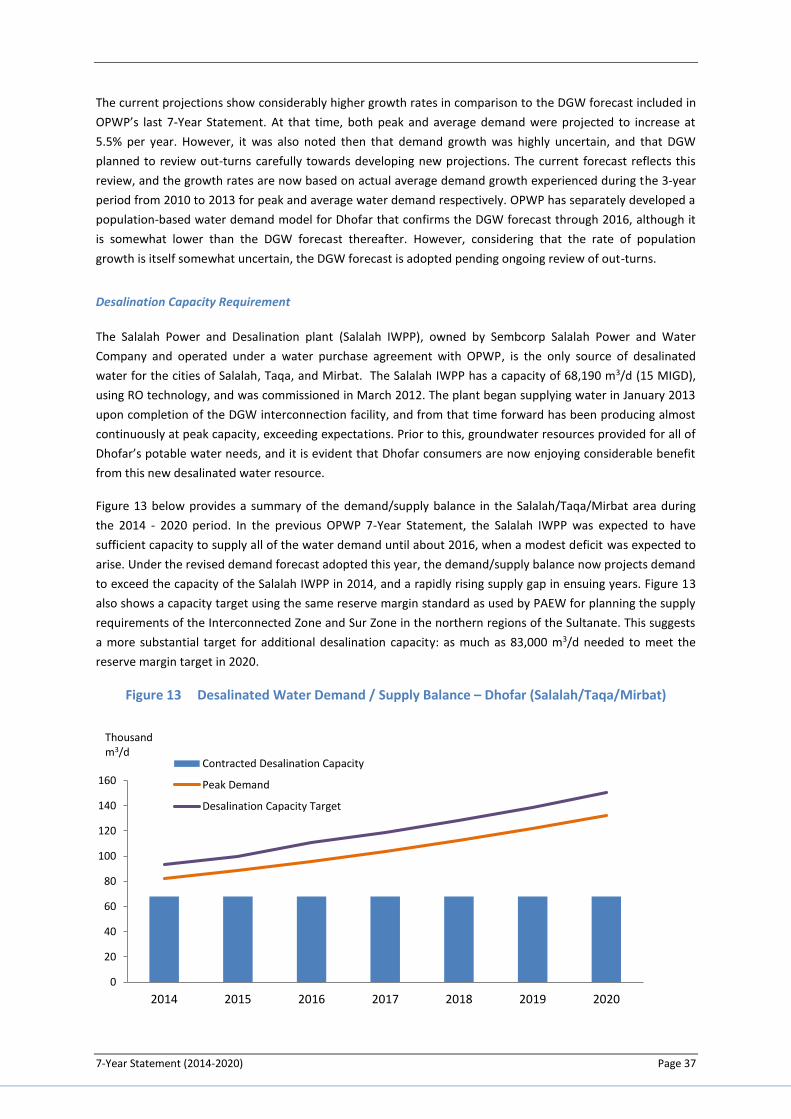
7-Year Statement (2014-2020) Page 37
The current projections show considerably higher growth rates in comparison to the DGW forecast included in
OPWP’s last 7-Year Statement. At that time, both peak and average demand were projected to increase at
5.5% per year. However, it was also noted then that demand growth was highly uncertain, and that DGW
planned to review out-turns carefully towards developing new projections. The current forecast reflects this
review, and the growth rates are now based on actual average demand growth experienced during the 3-year
period from 2010 to 2013 for peak and average water demand respectively. OPWP has separately developed a
population-based water demand model for Dhofar that confirms the DGW forecast through 2016, although it
is somewhat lower than the DGW forecast thereafter. However, considering that the rate of population
growth is itself somewhat uncertain, the DGW forecast is adopted pending ongoing review of out-turns.
Desalination Capacity Requirement
The Salalah Power and Desalination plant (Salalah IWPP), owned by Sembcorp Salalah Power and Water
Company and operated under a water purchase agreement with OPWP, is the only source of desalinated
water for the cities of Salalah, Taqa, and Mirbat. The Salalah IWPP has a capacity of 68,190 m3/d (15 MIGD),
using RO technology, and was commissioned in March 2012. The plant began supplying water in January 2013
upon completion of the DGW interconnection facility, and from that time forward has been producing almost
continuously at peak capacity, exceeding expectations. Prior to this, groundwater resources provided for all of
Dhofar’s potable water needs, and it is evident that Dhofar consumers are now enjoying considerable benefit
from this new desalinated water resource.
Figure 13 below provides a summary of the demand/supply balance in the Salalah/Taqa/Mirbat area during
the 2014 - 2020 period. In the previous OPWP 7-Year Statement, the Salalah IWPP was expected to have
sufficient capacity to supply all of the water demand until about 2016, when a modest deficit was expected to
arise. Under the revised demand forecast adopted this year, the demand/supply balance now projects demand
to exceed the capacity of the Salalah IWPP in 2014, and a rapidly rising supply gap in ensuing years. Figure 13
also shows a capacity target using the same reserve margin standard as used by PAEW for planning the supply
requirements of the Interconnected Zone and Sur Zone in the northern regions of the Sultanate. This suggests
a more substantial target for additional desalination capacity: as much as 83,000 m3/d needed to meet the
reserve margin target in 2020.
Figure 13 Desalinated Water Demand / Supply Balance – Dhofar (Salalah/Taqa/Mirbat)
0
20
40
60
80
100
120
140
160
2014 2015 2016 2017 2018 2019 2020
Thousandm3/d
Contracted Desalination Capacity
Peak Demand
Desalination Capacity Target
7-Year Statement (2014-2020) Page 38
2014 2015 2016 2017 2018 2019 2020
Thousand m3/d
Peak Water Demand 82 89 96 104 112 122 132
Capacity Target: Peak + Margin 93 100 111 118 128 139 151
Contracted Desalination Capacity
Salalah IWPP 68 68 68 68 68 68 68
Reserve over Target Capacity -26 -34 -42 -51 -60 -71 -83
Reserve over Demand -14 -21 -28 -36 -44 -54 -64
DGW has access to substantial groundwater resources to meet this supply gap until additional desalination
capacity can be constructed. DGW has advised OPWP that its medium-term objective is to minimize the use of
groundwater except for contingency purposes. Groundwells were sufficient to meet the 2012 peak water
demand of about 61,000 m3/d, although it is evident that consumers prefer the quality of desalinated water.
Thus the groundwater resource may be sufficient to meet planning contingencies through 2018 if required, or
possibly longer. OPWP plans to work closely with DGW to plan the best approach for adding new desalinated
water capacity. A new plant with capacity of about 80,000 m3/d (18 MIGD) would need about 4 years to
develop and could potentially be available late in 2018 if procurement activities begin in 2014.
2.5 COMBINING POWER GENERATION AND WATER DESALINATION
As in the MIS, OPWP is required to consider the opportunity for combining power generation with water
desalination in the Salalah System, so as to benefit from economies of co-location and co-procurement. An
assessment of these potential benefits led to the decision by OPWP to proceed with the Salalah IWPP – the
first combined power and desalination plant to be developed in the Salalah System.
OPWP considered the Salalah 2 IPP tender as a potential opportunity for combining power generation and
water desalination at one site. However, DGW advised in 2013 that it was too soon to commit to additional
desalination capacity, and therefore OPWP has proceeded with the project on a power-only basis.
As needs for additional water desalination and power generation capacity are confirmed, OPWP will continue
to assess the potential for economic benefit that may result from co-location and co-procurement.
2.6 PROCUREMENT ACTIVITIES
Current Projects
OPWP plans to issue a tender in the first quarter of 2014 for the Salalah 2 IPP at Raysut, with minimum
capacity of 300 MW and maximum capacity of about 400 MW. This tender for new capacity will also include
the sale of the existing NPS (273 MW), such that respondents will submit a combined bid for ownership of
both plants. It is expected that, upon award in 2014, the successful bidder will take over ownership of the NPS
(from DGW) under a PPA with OPWP, taking over the plant’s operation, whilst also commencing construction
of the new plant. The COD of the Salalah 2 IPP is projected as January 2018, at which time the combined
capacity of the two plants is expected to be in the range of 573 MW to 673 MW.
7-Year Statement (2014-2020) Page 39
Future Procurement
Three potential procurement activities may be anticipated over the subsequent period from 2015 to 2020:
Additional Desalination Capacity. As described in section 2.4, Salalah needs new water desalination
capacity soon, and a water-only IWP may be procured with capacity up to about 80,000 m3/d (18
MIGD).
Power Generation Capacity. The Salalah 2 IPP is expected to provide sufficient capacity to meet the
generation security standard until around 2021, depending upon demand growth. Procurement
activities to meet the next plant, nominally the Salalah 3 IPP (or potentially IWPP), may be expected
to begin around 2017.
Temporary Generation. There is a possibility that temporary generation may be required in 2017,
before the Salalah 2 IPP is operational, in the event that demand were to follow the High Case
scenario. This will be reassessed in the coming years.
2.7 FUEL REQUIREMENTS
2013 Fuel Usage
Both power generation plants in the Salalah System use natural gas. Total gas consumption in 2013 was about
0.72 billion Sm3 (equivalent to 2 million Sm3/d), about the same as in 2012 despite 9% growth in electricity
production. The peak daily gas consumption was 2.4 million Sm3 in 2013, also similar to 2012.
Projected Fuel Requirements
OPWP has prepared indicative projections for the fuel requirements of the Salalah System over the 2014-2020
period, under the Expected Demand, Low Case and High Case demand scenarios. These projections are based
on a number of key assumptions, including:
new gas-fueled generation, the Salalah 2 IPP, is assumed to be added in 2018, with a similar fuel
efficiency to the Salalah IWPP;
any generation shortfalls, such as if the demand followed the High Case scenario, would be met by
diesel-fueled temporary generation; and
no “commercial” imports or exports over the PDO interconnection are assumed to occur.
The projections are shown in Figure 14.

7-Year Statement (2014-2020) Page 40
Figure 14 Projected Fuel Requirements – Salalah System
Actual
2013 2014 2015 2016 2017 2018 2019 2020
Ave.%
Growth
Expected Demand
Gas Consumption (million Sm3/d)
Annual Average 2.0 2.2 2.3 2.5 2.7 2.9 3.1 3.3 8%
Peak Day 2.4 2.7 2.9 3.2 3.5 3.7 3.9 4.1 8%
Diesel Fuel Consumption (million litres) - - - - - - - - n/a
Total Fuel Consumption (million HHV GJ)a 28 31 33 36 39 41 44 48 8%
Gas 28 31 33 36 39 41 44 48 8%
Diesel Fuel - - - - - - - -
Low Case Demand
Gas Consumption (million Sm3/d)
Annual Average 2.0 2.1 2.2 2.3 2.6 2.7 2.9 3.0 6%
Peak Day 2.4 2.5 2.7 2.9 3.2 3.3 3.5 3.7 6%
Diesel Fuel Consumption (million litres) - - - - - - - - n/a
Total Fuel Consumption (million HHV GJ)a 28 30 32 33 36 39 41 43 6%
Gas 28 30 32 33 36 39 41 43 6%
Diesel Fuel - - - - - - - -
High Case Demand
Gas Consumption (million Sm3/d)
Annual Average 2.0 2.3 2.5 2.8 3.1 3.3 3.6 3.9 10%
Peak Day 2.4 2.8 3.2 3.6 4.0 4.1 4.5 4.9 11%
Diesel Fuel Consumption (million litres) - - - 0.1 0.1 - - - n/a
Total Fuel Consumption (million HHV GJ)a 28 33 36 40 44 47 52 56 10%
Gas 28 33 36 40 44 47 52 56 10%
Diesel Fuel - - - 0.0 0.0 - - - a Based on natural gas HHV of 1050 BTU/scf
43
48
28
56
0
1
2
3
4
5
6
7
8
9
10
0
5
10
15
20
25
30
35
40
45
50
55
60
2013 2014 2015 2016 2017 2018 2019 2020
MillionSm3/d
MillionHHV GJ Peak Day Gas Consumption - "Low Case" Demand (right hand scale)
Peak Day Gas Consumption - Expected Demand (right hand scale)
Peak Day Gas Consumption - "High Case" Demand (right hand scale)
Total Fuel Consumption - "Low Case" Demand
Total Fuel Consumption - Expected Demand
Total Fuel Consumption - "High Case" Demand
7-Year Statement (2014-2020) Page 41
Under the current projections, overall fuel consumption is expected to increase at an average rate of about 8%
per year – substantially lower than the expected growth rate of electricity demand of about 10% per year.
Under the Low Case demand scenario, fuel consumption increases at an average of 6% per year, whilst in the
High Case demand scenario, it grows at an average rate of 10% per year – in both cases below the growth rate
of electricity demand.
The lower growth rates in fuel consumption relative to electricity demand are mainly attributable to the
addition of CCGT plants in the Salalah System. The impact of the addition of the Salalah 2 IPP in 2018 is
particularly evident in the Expected Demand and High Case scenarios.
Gas Availability
OPWP consults with MOG on a regular basis, in order to confirm the future availability of gas for power
generation (and associated water production) and to co-ordinate planning. In respect of the rapid growth rate
in Salalah, and projected needs for the Salalah 2 IPP and later plants, it is particularly vital to secure future gas
supply or identify a need for other fuel options. MOG has recently committed a sufficient gas allocation to the
Salalah 2 IPP to allow the procurement to proceed.
7-Year Statement (2014-2020) Page 42
SECTION 3 AD DUQM & MUSANDAM
Ad Duqm:
Ad Duqm is located on the eastern coastline of the Al Wusta region, approximately halfway between the
Main Interconnected System (MIS) and the Salalah System. Current population is estimated at 8,14415, and
is expected to grow rapidly due to the development of a new economic and industrial city at Ad Duqm and
surrounding areas.
The Ad Duqm region currently has a relatively small integrated generation and distribution system, owned
and operated by Rural Areas Electricity Company (RAECO). RAECO has recently commissioned a 67 MW
diesel-fuel fired power plant in order to meet electrical energy requirements, and plans to add another 80
MW in 2017. RAECO is the sole licensed electricity supplier within the service area covered by the system,
supplying existing and new electricity customers.
OPWP’s current role in Ad Duqm came under governmental request to review potential options for
development of a natural gas fired Independent Power Project (IPP) or Independent Water and Power
Project (IWPP) to accommodate the expected rapid increase in electricity and water demands in the area.
The Government is also studying options for the construction of a natural gas pipeline to Ad Duqm, which
would be able to supply fuel for a new power generation plant with a size in the range of 500 to 1000 MW.
Musandam:
The Musandam Governorate is located in the northern-most region of the Sultanate of Oman, and extends
into the Strait of Hormuz. The Musandam Governorate is an exclave of Oman, separated from the rest of
the country by the United Arab Emirates. Current population is estimated at around 34,000, which is
expected to grow steadily over the coming years.
The relatively small integrated generation and distribution system currently in place in the Musandam
Governorate is owned and operated by RAECO. Generation requirements are met by a number of small
diesel generators located near load centers. OPWP has been requested by RAECO to assist with
procurement of a new 100 MW power generation plant, and requested by PAEW to procure a new 3 MIGD
water desalination plant.
15 National Center for Statistics & Information – Statistical Year Book 2013
7-Year Statement (2014-2020) Page 43
3.1 DEMAND FOR ELECTRICITY
Historical Demand
Since 2005, all requirements to meet electricity demands in Ad Duqm and its surrounding areas, and in
Musandam, have been within the jurisdiction of RAECO, the sole licensed electricity supplier responsible for
electricity generation, transmission and distribution in those areas. Considering the relatively small energy
requirements of these areas, they have been met most economically by utilizing diesel-fired generators locally,
located close to the areas of consumption.
Recently, RAECO successfully commissioned a 67 MW diesel-fuel fired power plant to meet the rapidly growing
demands of the Ad Duqm area. RAECO is also finalizing the expansion of Khasab Power Station to include an
additional 8 MW of diesel-fueled generators for Musandam.
Demand Projections
Ad Duqm
The development of the Industrial Economic Zone (IEZ) would see substantial economic growth in Ad-Duqm as
well as population growth over and above the average for the area. As a result, the demand for electricity in
Ad-Duqm is likely to grow significantly over the coming years. However, the pace of growth is highly uncertain
and depends on many factors related to global markets, investment levels, and government incentives.
Several entities have prepared development forecasts for Ad Duqm, with widely divergent results. For the
purposes of electricity demand projections, OPWP has relied on projections by RAECO, the Port of Duqm
Company (PDC), and the Ad Duqm Special Economic Zone Authority (SEZAD). As for the MIS and Salalah
System, OPWP presents the forecast in three scenarios, displayed in Figure 14 below.
Under the Expected Demand scenario, peak demand is expected to grow at an average of 39% per year, from
19 MW in 2013 to 195 MW in 2020. Energy demand is projected to increase at 47% per year from 61 GWh in
2013 to 908 GWh (0.9 TWh). The Expected Demand scenario is developed from a combination of sources, as
follows:
RAECO projections, considering the demands of the core infrastructure projects associated with the
Special Economic Zone and the general residential and commercial demand generated by population
growth and development in the area; and
A provision for major industrial projects, based on estimates provided by the PDC.
The Low Case, Expected Demand, and High Case scenarios are significantly different, primarily due to differing
assumptions about industrial development. In OPWP’s experience, a high level of uncertainty exists with the
materialization of the industries against development plans, and as such, this uncertainty is reflected in the
three demand scenarios.
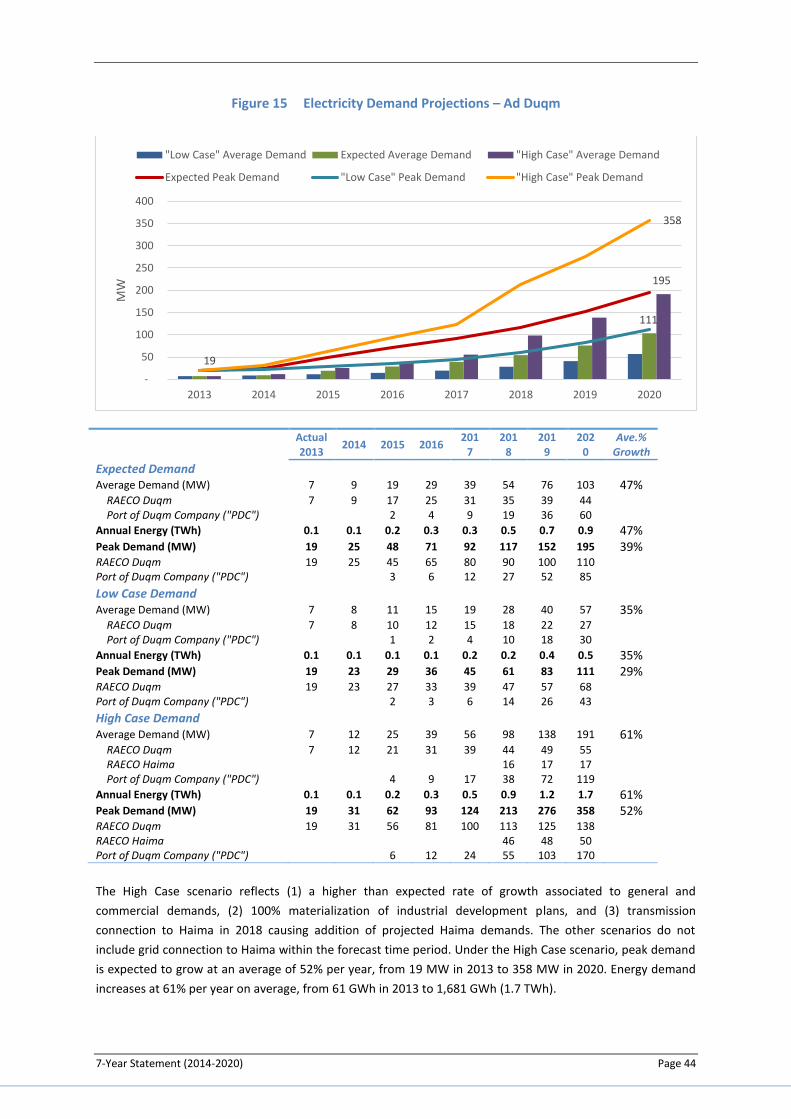
7-Year Statement (2014-2020) Page 44
Figure 15 Electricity Demand Projections – Ad Duqm
Actual 2013
2014 2015 2016 201
7 201
8 201
9 202
0 Ave.%
Growth
Expected Demand
Average Demand (MW) 7 9 19 29 39 54 76 103 47% RAECO Duqm 7 9 17 25 31 35 39 44
Port of Duqm Company ("PDC")
2 4 9 19 36 60
Annual Energy (TWh) 0.1 0.1 0.2 0.3 0.3 0.5 0.7 0.9 47% Peak Demand (MW) 19 25 48 71 92 117 152 195 39% RAECO Duqm 19 25 45 65 80 90 100 110
Port of Duqm Company ("PDC")
3 6 12 27 52 85
Low Case Demand
Average Demand (MW) 7 8 11 15 19 28 40 57 35% RAECO Duqm 7 8 10 12 15 18 22 27
Port of Duqm Company ("PDC")
1 2 4 10 18 30
Annual Energy (TWh) 0.1 0.1 0.1 0.1 0.2 0.2 0.4 0.5 35% Peak Demand (MW) 19 23 29 36 45 61 83 111 29% RAECO Duqm 19 23 27 33 39 47 57 68
Port of Duqm Company ("PDC")
2 3 6 14 26 43
High Case Demand
Average Demand (MW) 7 12 25 39 56 98 138 191 61% RAECO Duqm 7 12 21 31 39 44 49 55
RAECO Haima
16 17 17
Port of Duqm Company ("PDC")
4 9 17 38 72 119
Annual Energy (TWh) 0.1 0.1 0.2 0.3 0.5 0.9 1.2 1.7 61% Peak Demand (MW) 19 31 62 93 124 213 276 358 52% RAECO Duqm 19 31 56 81 100 113 125 138
RAECO Haima
46 48 50
Port of Duqm Company ("PDC")
6 12 24 55 103 170
The High Case scenario reflects (1) a higher than expected rate of growth associated to general and
commercial demands, (2) 100% materialization of industrial development plans, and (3) transmission
connection to Haima in 2018 causing addition of projected Haima demands. The other scenarios do not
include grid connection to Haima within the forecast time period. Under the High Case scenario, peak demand
is expected to grow at an average of 52% per year, from 19 MW in 2013 to 358 MW in 2020. Energy demand
increases at 61% per year on average, from 61 GWh in 2013 to 1,681 GWh (1.7 TWh).
195
111
19
358
-
50
100
150
200
250
300
350
400
2013 2014 2015 2016 2017 2018 2019 2020
MW
"Low Case" Average Demand Expected Average Demand "High Case" Average Demand
Expected Peak Demand "Low Case" Peak Demand "High Case" Peak Demand
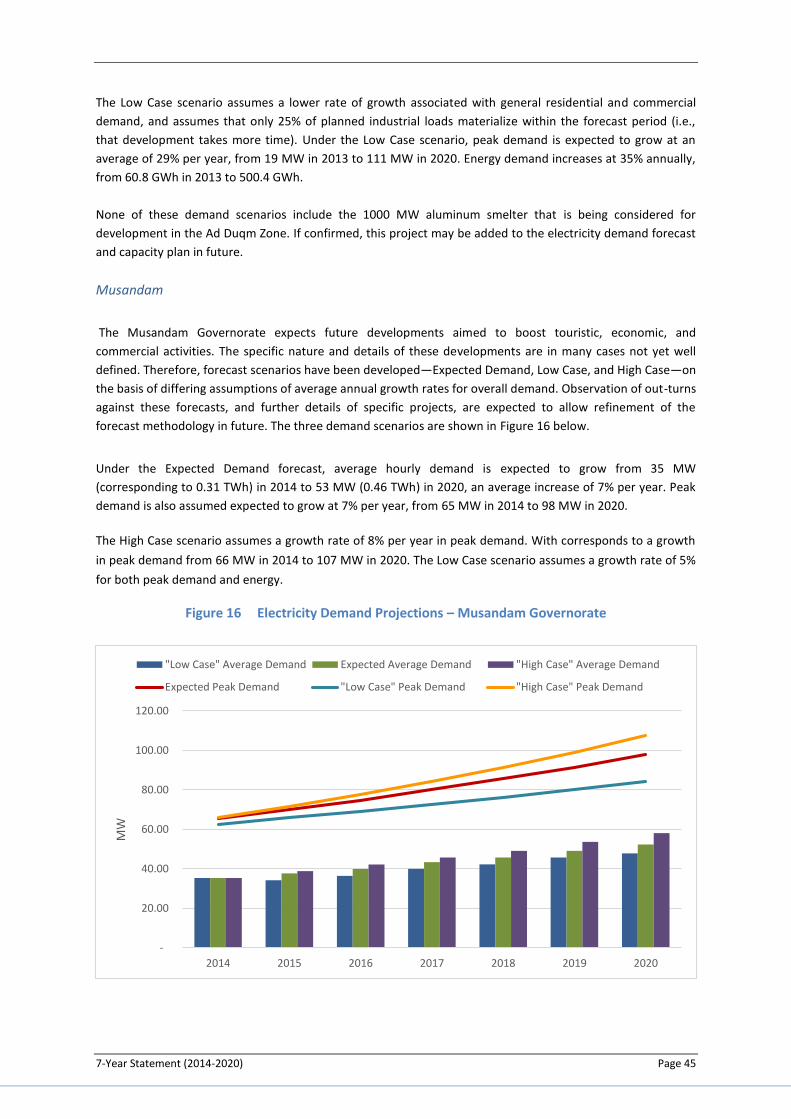
7-Year Statement (2014-2020) Page 45
The Low Case scenario assumes a lower rate of growth associated with general residential and commercial
demand, and assumes that only 25% of planned industrial loads materialize within the forecast period (i.e.,
that development takes more time). Under the Low Case scenario, peak demand is expected to grow at an
average of 29% per year, from 19 MW in 2013 to 111 MW in 2020. Energy demand increases at 35% annually,
from 60.8 GWh in 2013 to 500.4 GWh.
None of these demand scenarios include the 1000 MW aluminum smelter that is being considered for
development in the Ad Duqm Zone. If confirmed, this project may be added to the electricity demand forecast
and capacity plan in future.
Musandam
The Musandam Governorate expects future developments aimed to boost touristic, economic, and
commercial activities. The specific nature and details of these developments are in many cases not yet well
defined. Therefore, forecast scenarios have been developed—Expected Demand, Low Case, and High Case—on
the basis of differing assumptions of average annual growth rates for overall demand. Observation of out-turns
against these forecasts, and further details of specific projects, are expected to allow refinement of the
forecast methodology in future. The three demand scenarios are shown in Figure 16 below.
Under the Expected Demand forecast, average hourly demand is expected to grow from 35 MW
(corresponding to 0.31 TWh) in 2014 to 53 MW (0.46 TWh) in 2020, an average increase of 7% per year. Peak
demand is also assumed expected to grow at 7% per year, from 65 MW in 2014 to 98 MW in 2020.
The High Case scenario assumes a growth rate of 8% per year in peak demand. With corresponds to a growth
in peak demand from 66 MW in 2014 to 107 MW in 2020. The Low Case scenario assumes a growth rate of 5%
for both peak demand and energy.
Figure 16 Electricity Demand Projections – Musandam Governorate
-
20.00
40.00
60.00
80.00
100.00
120.00
2014 2015 2016 2017 2018 2019 2020
MW
"Low Case" Average Demand Expected Average Demand "High Case" Average Demand
Expected Peak Demand "Low Case" Peak Demand "High Case" Peak Demand
7-Year Statement (2014-2020) Page 46
2014 2015 2016 2017 2018 2019 2020 Ave.%
Growth
Expected Demand
Average Demand (MW) 35 38 40 43 46 49 52 7%
Annual Energy (TWh) 0.3 0.3 0.4 0.4 0.4 0.4 0.5 7%
Peak Demand (MW) 65 70 75 80 86 92 98 7%
Khasab Demand 47 50 54 58 62 66 71 7%
Dibba Demand 18 19 21 22 24 26 27 7%
Low Case Demand
Average Demand (MW) 35 37 40 42 46 49 54 5%
Annual Energy (TWh) 0.3 0.3 0.4 0.4 0.4 0.4 0.5 5%
Peak Demand (MW) 63 66 69 73 76 80 84 5%
Khasab Demand 45 47 50 52 55 58 61 5%
Dibba Demand 17 18 19 20 21 22 23 5%
High Case Demand
Average Demand (MW) 35 39 42 46 49 54 58 8%
Annual Energy (TWh) 0.3 0.3 0.4 0.4 0.4 0.5 0.5 8%
Peak Demand (MW) 66 72 78 84 91 99 107 8%
Khasab Demand 48 52 56 61 66 71 77 8%
Dibba Demand 18 20 22 23 25 28 30 8%
3.2 POWER GENERATION RESOURCES
Sources of Power
Ad Duqm Zone
The RAECO system serving Ad Duqm and its surrounding areas are currently supplied by the Ad Duqm power
station, a 67 MW diesel-fired power plant which is also owned and operated by RAECO.
Musandam
RAECO owns and operates six power stations distributed near to load centers in the Musandam Governorate.
They are all diesel-fired generators, with combined installed capacity of about 88 MW. The largest plant is
located at Khasab City, and has installed capacity of about 58 MW. RAECO is currently finalizing the expansion
of Khasab Power Station to include an additional 8 MW of diesel-fuelled generators.
7-Year Statement (2014-2020) Page 47
Prospective Contracts and Additional Requirements
Ad Duqm Zone
In addition to the 67 MW diesel-fired plant owned and operated by RAECO at Ad Duqm, RAECO plans to add
around 80 MW of additional capacity by 2017. The combined capacity, 147 MW, would be sufficient to meet
Ad Duqm demand until 2019 under the Expected Demand scenario. Under the Low Case scenario, this capacity
would be sufficient to meet demand requirements through 2020, but under the High Case scenario, demand
would exceed supply as soon as 2018.
OPWP is currently evaluating the merits of tendering for a gas-fired IPP to meet growing demand in the
medium-term. The study is evaluating strategic options that may include a transmission interconnection with
the PDO network or with the MIS, and the level of generation capacity that may make such interconnection
economically feasible. The study also investigates the feasibility of incorporating outlying localities, such as
towns along the eastern coast from Shiwaimia to Mahoot and Haima, into the network to be supplied by the
Ad Duqm power generation plant.
OPWP has studied extensively the prospective sites for both power and water supply to Ad Duqm, as well as
whether water and power should be developed at the same location (i.e., as an IWPP). The conclusion of this
work is to de-couple power and desalination capacity in this instance. This strategy provides a number of
benefits, such as (1) greater flexibility in the timing and phasing of power and desalination capacity additions,
in the context of highly uncertain demand growth; (2) attracting more competitive proposals for each of power
and water, from a wider range of qualified bidders; and (3) simpler commercial arrangements. PAEW has
endorsed the separate-plant approach for Ad Duqm.
OPWP expects to complete the Ad Duqm study in 2014, in order to support an expected procurement action
that would lead to an Ad Duqm IPP to begin operation around 2018. At this stage, OPWP expects that this
plant would have capacity in the range of 300 MW to 400 MW, and without a transmission interconnection
with the MIS, though that could occur in the future depending upon demand development. This scale of plant
capacity, in combination with the planned RAECO plants, would meet requirements under all three demand
scenarios through 2020, and provide time to observe the pace of demand development toward planning
further capacity additions.
Musandam
OPWP is currently finalizing the procurement for a new IPP in Musandam utilizing dual-fuel fired reciprocating
engines and/or dual-fuel gas turbine generators. The project will be fueled by natural gas from a processing
plant being developed by Oman Oil Company (OOC), and the IPP will be owned by a consortium led by OOC.
OPWP is assisting with procurement of the EPC contractor, and the project will operate under a PPA with
OPWP, for supply to RAECO. The IPP will provide a minimum net firm capacity of 100 MW, with expected COD
during the fourth quarter of 2016.
3.3 DESALINATED WATER REQUIREMENTS
Demand for Water – Ad Duqm Zone
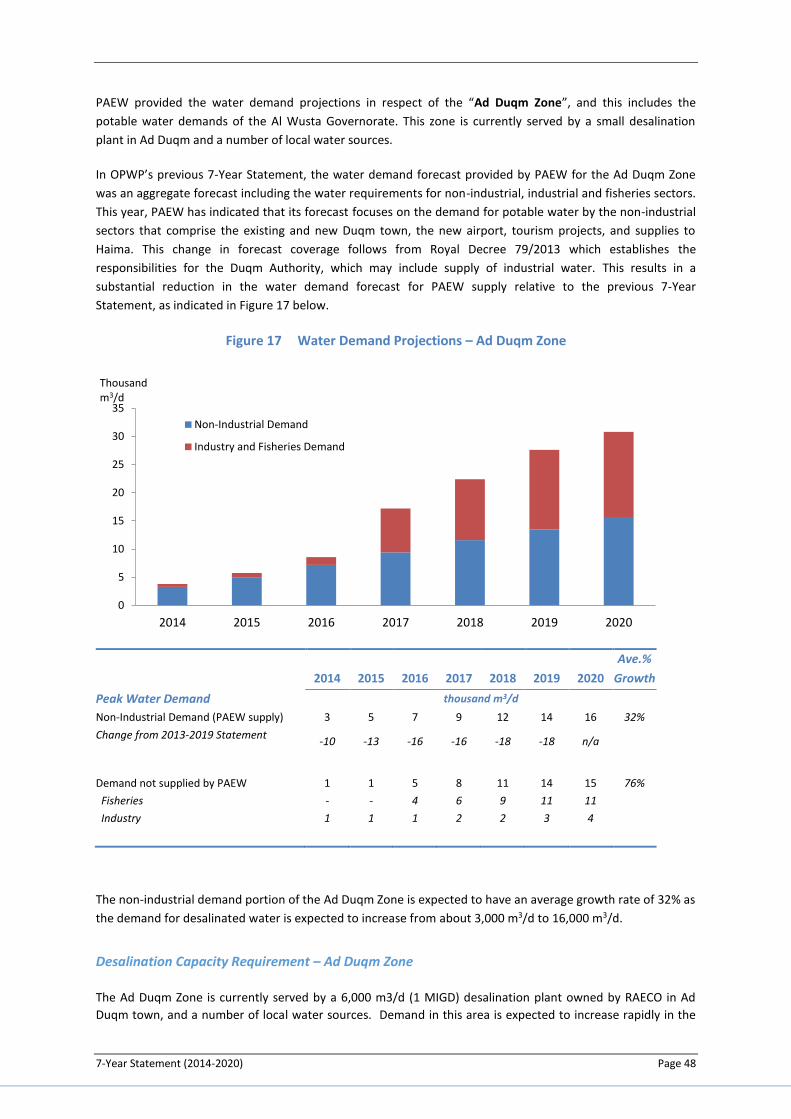
7-Year Statement (2014-2020) Page 48
PAEW provided the water demand projections in respect of the “Ad Duqm Zone”, and this includes the
potable water demands of the Al Wusta Governorate. This zone is currently served by a small desalination
plant in Ad Duqm and a number of local water sources.
In OPWP’s previous 7-Year Statement, the water demand forecast provided by PAEW for the Ad Duqm Zone
was an aggregate forecast including the water requirements for non-industrial, industrial and fisheries sectors.
This year, PAEW has indicated that its forecast focuses on the demand for potable water by the non-industrial
sectors that comprise the existing and new Duqm town, the new airport, tourism projects, and supplies to
Haima. This change in forecast coverage follows from Royal Decree 79/2013 which establishes the
responsibilities for the Duqm Authority, which may include supply of industrial water. This results in a
substantial reduction in the water demand forecast for PAEW supply relative to the previous 7-Year
Statement, as indicated in Figure 17 below.
Figure 17 Water Demand Projections – Ad Duqm Zone
2014 2015 2016 2017 2018 2019 2020
Ave.%
Growth
Peak Water Demand thousand m3/d
Non-Industrial Demand (PAEW supply) 3 5 7 9 12 14 16 32%
Change from 2013-2019 Statement -10 -13 -16 -16 -18 -18 n/a
Demand not supplied by PAEW 1 1 5 8 11 14 15 76%
Fisheries - - 4 6 9 11 11
Industry 1 1 1 2 2 3 4
The non-industrial demand portion of the Ad Duqm Zone is expected to have an average growth rate of 32% as
the demand for desalinated water is expected to increase from about 3,000 m3/d to 16,000 m3/d.
Desalination Capacity Requirement – Ad Duqm Zone
The Ad Duqm Zone is currently served by a 6,000 m3/d (1 MIGD) desalination plant owned by RAECO in Ad
Duqm town, and a number of local water sources. Demand in this area is expected to increase rapidly in the
0
5
10
15
20
25
30
35
2014 2015 2016 2017 2018 2019 2020
Thousand m3/d
Non-Industrial Demand
Industry and Fisheries Demand
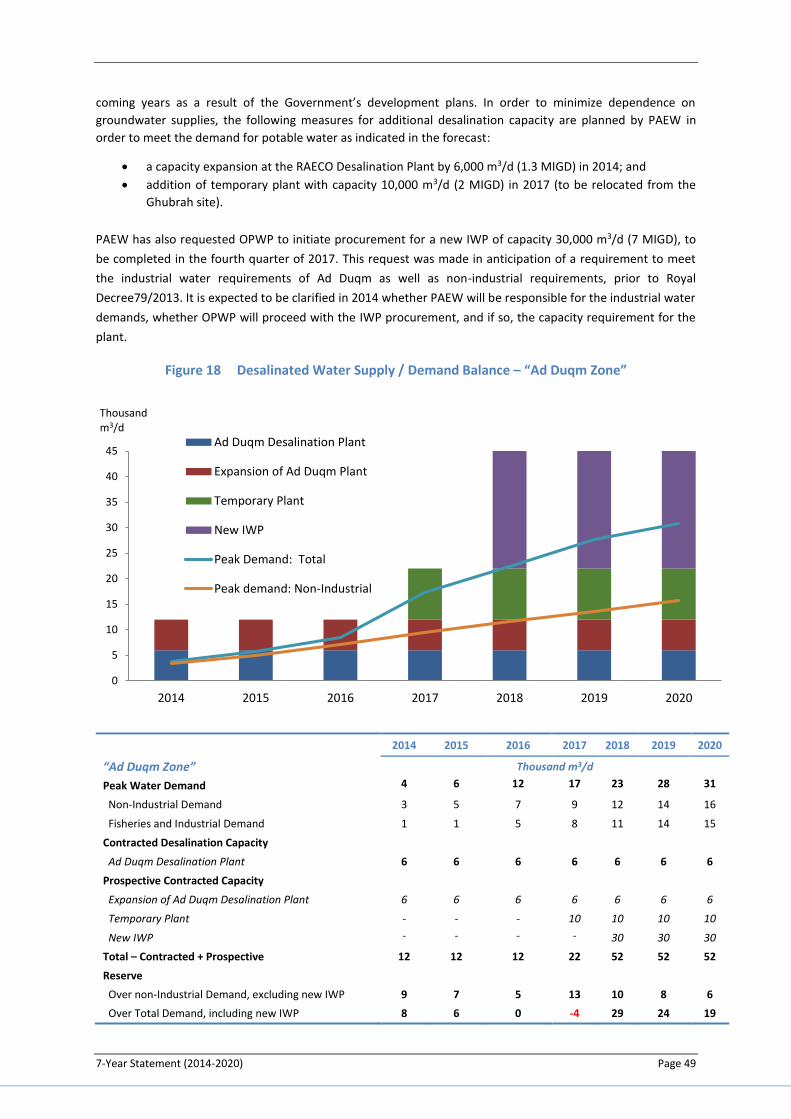
7-Year Statement (2014-2020) Page 49
coming years as a result of the Government’s development plans. In order to minimize dependence on
groundwater supplies, the following measures for additional desalination capacity are planned by PAEW in
order to meet the demand for potable water as indicated in the forecast:
a capacity expansion at the RAECO Desalination Plant by 6,000 m3/d (1.3 MIGD) in 2014; and
addition of temporary plant with capacity 10,000 m3/d (2 MIGD) in 2017 (to be relocated from the
Ghubrah site).
PAEW has also requested OPWP to initiate procurement for a new IWP of capacity 30,000 m3/d (7 MIGD), to
be completed in the fourth quarter of 2017. This request was made in anticipation of a requirement to meet
the industrial water requirements of Ad Duqm as well as non-industrial requirements, prior to Royal
Decree79/2013. It is expected to be clarified in 2014 whether PAEW will be responsible for the industrial water
demands, whether OPWP will proceed with the IWP procurement, and if so, the capacity requirement for the
plant.
Figure 18 Desalinated Water Supply / Demand Balance – “Ad Duqm Zone”
2014 2015 2016 2017 2018 2019 2020
“Ad Duqm Zone” Thousand m3/d
Peak Water Demand 4 6 12 17 23 28 31
Non-Industrial Demand 3 5 7 9 12 14 16
Fisheries and Industrial Demand 1 1 5 8 11 14 15
Contracted Desalination Capacity
Ad Duqm Desalination Plant 6 6 6 6 6 6 6
Prospective Contracted Capacity
Expansion of Ad Duqm Desalination Plant 6 6 6 6 6 6 6
Temporary Plant - - - 10 10 10 10
New IWP - - - - 30 30 30
Total – Contracted + Prospective 12 12 12 22 52 52 52
Reserve
Over non-Industrial Demand, excluding new IWP 9 7 5 13 10 8 6
Over Total Demand, including new IWP 8 6 0 -4 29 24 19
0
5
10
15
20
25
30
35
40
45
2014 2015 2016 2017 2018 2019 2020
Thousandm3/d
Ad Duqm Desalination Plant
Expansion of Ad Duqm Plant
Temporary Plant
New IWP
Peak Demand: Total
Peak demand: Non-Industrial
7-Year Statement (2014-2020) Page 50
Desalination Capacity Requirement – Musandam
OPWP has not been provided water demand projections for the Musandam Governorate, but has been
requested by PAEW to procure an IWP with capacity of about 13,000 m3/d (3 MIGD) to provide water to
Khasab City.
3.4 PROCUREMENT ACTIVITIES
OPWP expects to procure both power generation and desalinated water facilities for operation in Ad Duqm
and the Musandam Governorate in the near future. These projects include the following:
Musandam IPP, with net firm capacity of 100 MW utilizing dual fuel engines. The IPP will be owned by
a consortium led by Oman Oil Company, and operated under a PPA with OPWP for supply to RAECO.
The EPC tender is expected to be issued in the first quarter of 2014, with anticipated COD in the
fourth quarter of 2016.
Khasab IWP, with capacity in the range of 13,000 m3/d (3 MIGD) using RO technology, for supply to
PAEW. The tender is expected to be issued in the third quarter of 2014, with anticipated COD in the
fourth quarter of 2015.
Duqm IWP, with capacity in the range of 30,000 m3/d (6 MIGD) using RO technology, for supply to
PAEW. The tender is expected to be issued in the fourth quarter of 2014, with anticipated COD in the
fourth quarter of 2017.
In addition to these procurement actions, OPWP expects to finalize plans for a potential Duqm IPP during
2014, for COD in about 2018. The installed capacity is expected to be in the range of 300 MW to 400 MW, but
this specification is pending the outcome of OPWP’s ongoing Ad Duqm study.


![PETROLEUM DEVELOPMENT OMAN (PDO) [Elmech] Development Oman - PDO [Elmec… · Petroleum Development Oman L.L.C. ... Postal Address : P.O.BOX 505- PC 114- SULTANATE OF OMAN Is registered](https://img.pdfslide.net/doc/110x75/5ac633c57f8b9a5c558dcb76/petroleum-development-oman-pdo-elmech-development-oman-pdo-elmecpetroleum.jpg)