Embed Size (px)
Citation preview
21 - 26 April 2018 Dubai International Convention
& Exhibition Centre, UAE
ITA - AITES WORLDTUNNEL CONGRESS
ORAL PAPERPROCEEDINGS
2
Failure modes of the steel lining of underground reservoirs for compressed air energy storage (CAES)Paolo Perazzelli1 and Georgios Anagnostou21 Pini Swiss Engineers, [email protected] ETH Zurich, [email protected]
ABSTRACT
Compressed air energy storage (CAES) in caverns, shafts or tunnels makes use of the high resistance of the surrounding rock mass to the gas pressure. A lined rock cavern (LRC) is the most attractive concept. The gas pressure is borne by the rock, while the tightness of the system is guaranteed by a composite lining consisting of an inner thin steel shell and an outer reinforced concrete shell. We investigate the following failure modes of the steel shell: tensile failure at the maximum op-erating air pressure, buckling at the minimum operating air pressure and fatigue during cyclic loading. Rock-lining interaction is analysed assuming the rock as a no-tension material obeying the Mohr-Coulomb failure criterion. The computational results show that in tunnels and shafts of 4 m diameter, safety against fatigue or buckling limits the operational air pressures to a maximum of 10 MPa, if the rock is softer than 5 GPa. The results also illustrate some limitations of the widely used constitutive models, which may be very important for studying the rock-lining inter-action during cyclical loading.
Key Words: Compressed air energy storage (CAES), tunnel, shaft, lining, feasibility.
1. INTRODUCTION
Very large amounts of energy can be stored either with pumped hydroelectric stor-age reservoirs (PHS) or with compressed air energy storage (CAES) systems. PHS technology is familiar and there are several examples in operation, while for CAES only two commercial projects have been undertaken in salt rock (Crotogino et al. 2001, Gardner and Haynes 2007), as well as one demonstration project (Mansson and Marion 2003) and one verification project in granite (Stille et al. 1994).
CAES systems have the peculiarity that gas must be stored under a relatively high pressure (p = 10 - 30 MPa) in order to achieve greater efficiencies during energy recovery (withdrawal stage). Lined and unlined tunnels, shafts and caverns can all be used within this range. The rock mass surrounding the opening resists the internal pressure while the lining or the natural hydraulic and geological conditions ensure gas tightness (Kovári 1993).
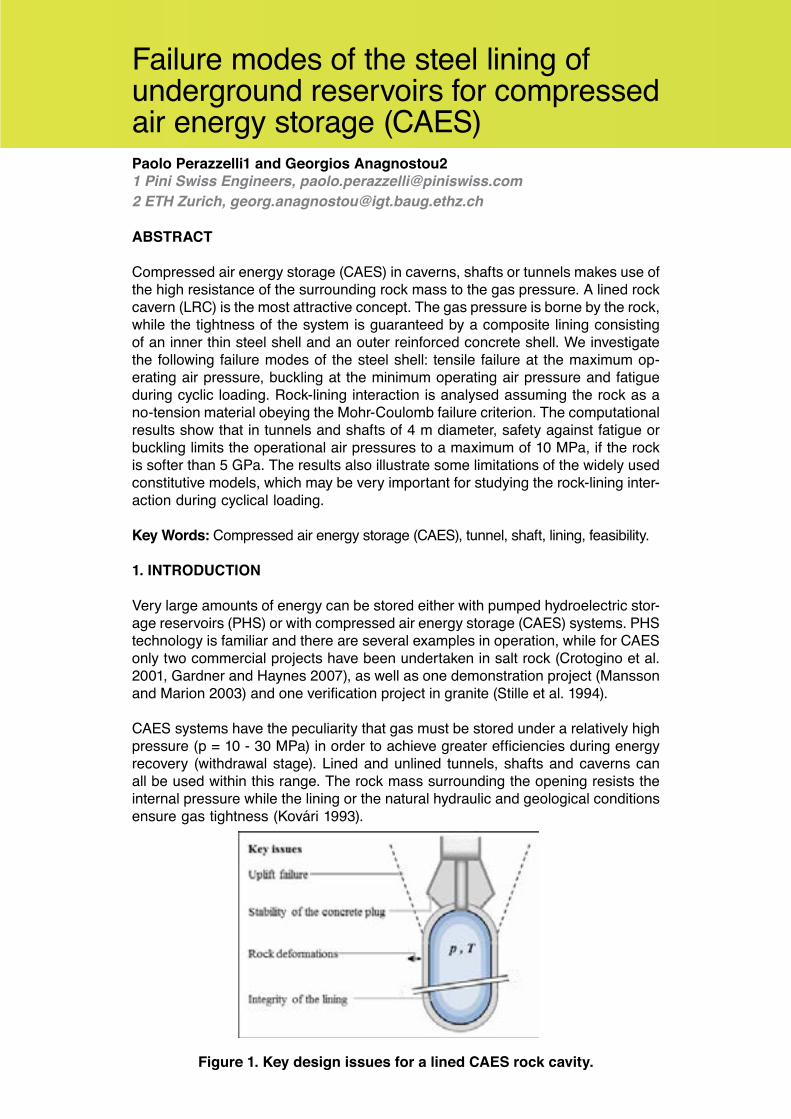
Figure 1. Key design issues for a lined CAES rock cavity.
3
A lined rock cavern (LRC) is the most attractive option and the one most investigat-ed over the past 20 years due to its wider application field; there is no requirement for particular hydrogeological conditions or great depths of cover (Kovári 1993).
From a geotechnical and structural point of view, the key factors to be considered in a feasibility assessment of CAES in lined cavities are: uplift failure of the overly-ing rock up to the surface; failure and loss of tightness of the sealing membrane; shearing of the plug closing the cavern (Fig. 1). The loss of tightness of the cavity not only decreases the efficiency of the system, but may also impair stability (high air pressures within the overlying rock mass increase uplift risk).
The lining concept most investigated for underground CAES is a composite struc-ture consisting of an inner thin steel shell and an outer reinforced concrete shell (see Fig. 1). The present paper shows how the stress and strain in the steel shell vary during pressurization and depressurization of the cavity and clarify why ten-sile, buckling and fatigue failures may occur (Section 2). Verifications for these failure modes are presented in Sections 3, 4 and 5. We remark that the rock-lining interaction is analysed assuming the rock as a no-tension material obeying the Mohr-Coulomb failure criterion. The results presented in the paper (Section 2.2) illustrate also some limitations of this widely used constitutive model that may be very important for studying the rock-lining interaction during cyclical loading.
2. ROCK MASS – LINING INTERACTION
2.1. Computational model
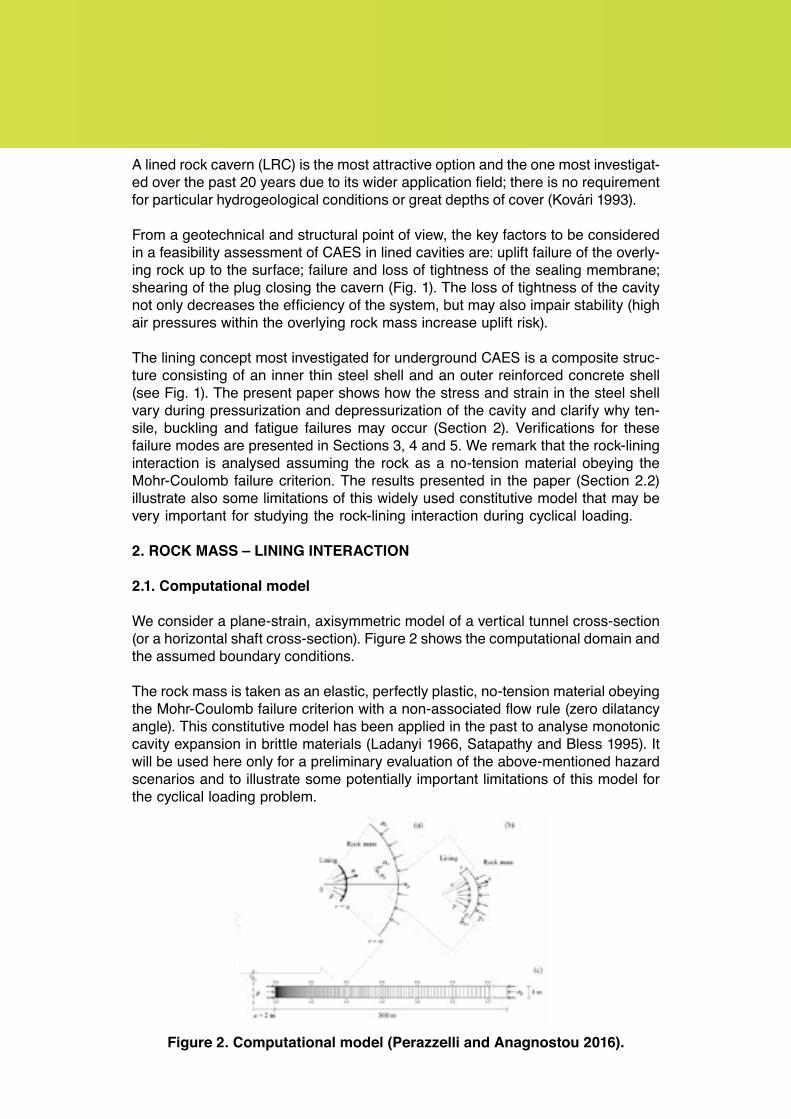
We consider a plane-strain, axisymmetric model of a vertical tunnel cross-section (or a horizontal shaft cross-section). Figure 2 shows the computational domain and the assumed boundary conditions.
The rock mass is taken as an elastic, perfectly plastic, no-tension material obeying the Mohr-Coulomb failure criterion with a non-associated flow rule (zero dilatancy angle). This constitutive model has been applied in the past to analyse monotonic cavity expansion in brittle materials (Ladanyi 1966, Satapathy and Bless 1995). It will be used here only for a preliminary evaluation of the above-mentioned hazard scenarios and to illustrate some potentially important limitations of this model for the cyclical loading problem.
Figure 2. Computational model (Perazzelli and Anagnostou 2016).
4
For simplicity, we neglect the presence of tunnel support (e.g., a reinforced shot-crete layer between the steel lining and the rock) and consider the steel lining as being in direct contact with the rock mass. The steel lining is modelled as an elas-tic, perfectly plastic material with a tensile strength equal to the yield strength of the steel. Yielding in compression is neglected because it is not expected to occur under pre-buckling loading.
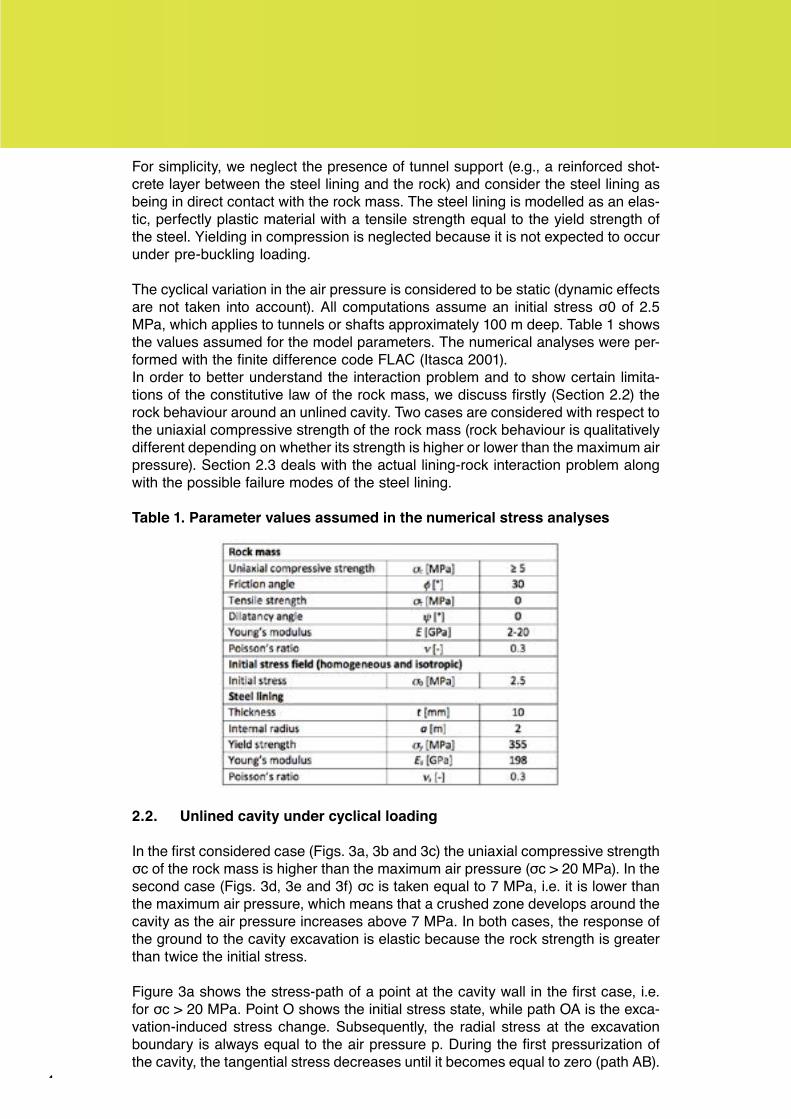
The cyclical variation in the air pressure is considered to be static (dynamic effects are not taken into account). All computations assume an initial stress σ0 of 2.5 MPa, which applies to tunnels or shafts approximately 100 m deep. Table 1 shows the values assumed for the model parameters. The numerical analyses were per-formed with the finite difference code FLAC (Itasca 2001).In order to better understand the interaction problem and to show certain limita-tions of the constitutive law of the rock mass, we discuss firstly (Section 2.2) the rock behaviour around an unlined cavity. Two cases are considered with respect to the uniaxial compressive strength of the rock mass (rock behaviour is qualitatively different depending on whether its strength is higher or lower than the maximum air pressure). Section 2.3 deals with the actual lining-rock interaction problem along with the possible failure modes of the steel lining.
Table 1. Parameter values assumed in the numerical stress analyses
2.2. Unlined cavity under cyclical loading
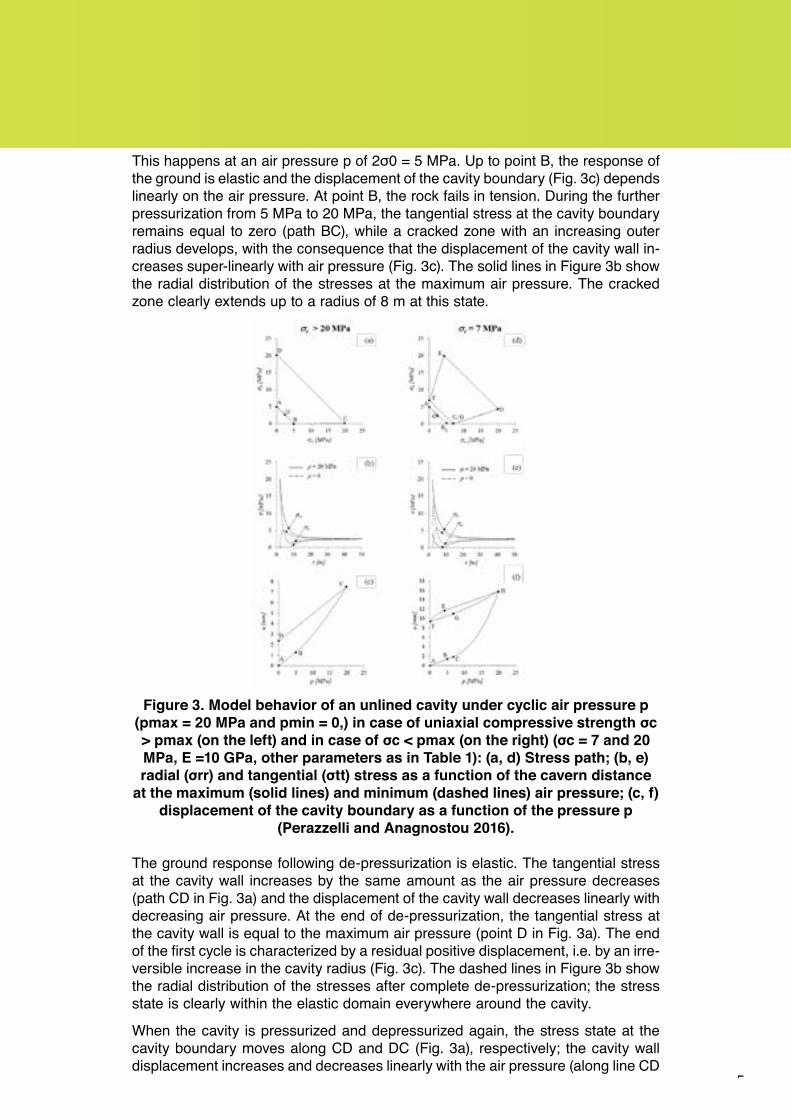
In the first considered case (Figs. 3a, 3b and 3c) the uniaxial compressive strength σc of the rock mass is higher than the maximum air pressure (σc > 20 MPa). In the second case (Figs. 3d, 3e and 3f) σc is taken equal to 7 MPa, i.e. it is lower than the maximum air pressure, which means that a crushed zone develops around the cavity as the air pressure increases above 7 MPa. In both cases, the response of the ground to the cavity excavation is elastic because the rock strength is greater than twice the initial stress.
Figure 3a shows the stress-path of a point at the cavity wall in the first case, i.e. for σc > 20 MPa. Point O shows the initial stress state, while path OA is the exca-vation-induced stress change. Subsequently, the radial stress at the excavation boundary is always equal to the air pressure p. During the first pressurization of the cavity, the tangential stress decreases until it becomes equal to zero (path AB).
5
This happens at an air pressure p of 2σ0 = 5 MPa. Up to point B, the response of the ground is elastic and the displacement of the cavity boundary (Fig. 3c) depends linearly on the air pressure. At point B, the rock fails in tension. During the further pressurization from 5 MPa to 20 MPa, the tangential stress at the cavity boundary remains equal to zero (path BC), while a cracked zone with an increasing outer radius develops, with the consequence that the displacement of the cavity wall in-creases super-linearly with air pressure (Fig. 3c). The solid lines in Figure 3b show the radial distribution of the stresses at the maximum air pressure. The cracked zone clearly extends up to a radius of 8 m at this state.
Figure 3. Model behavior of an unlined cavity under cyclic air pressure p
(pmax = 20 MPa and pmin = 0,) in case of uniaxial compressive strength σc > pmax (on the left) and in case of σc < pmax (on the right) (σc = 7 and 20 MPa, E =10 GPa, other parameters as in Table 1): (a, d) Stress path; (b, e) radial (σrr) and tangential (σtt) stress as a function of the cavern distance
at the maximum (solid lines) and minimum (dashed lines) air pressure; (c, f) displacement of the cavity boundary as a function of the pressure p
(Perazzelli and Anagnostou 2016).
The ground response following de-pressurization is elastic. The tangential stress at the cavity wall increases by the same amount as the air pressure decreases (path CD in Fig. 3a) and the displacement of the cavity wall decreases linearly with decreasing air pressure. At the end of de-pressurization, the tangential stress at the cavity wall is equal to the maximum air pressure (point D in Fig. 3a). The end of the first cycle is characterized by a residual positive displacement, i.e. by an irre-versible increase in the cavity radius (Fig. 3c). The dashed lines in Figure 3b show the radial distribution of the stresses after complete de-pressurization; the stress state is clearly within the elastic domain everywhere around the cavity.
When the cavity is pressurized and depressurized again, the stress state at the cavity boundary moves along CD and DC (Fig. 3a), respectively; the cavity wall displacement increases and decreases linearly with the air pressure (along line CD
6
in Fig. 3c); and the radial distribution of the stresses around the cavity fluctuate be-tween the dashed and solid lines of Figure 3b. Note that the extent of the cracked zone at maximum air pressure does not increase with the number of cycles.
According to the computational results, the cracks, that develop during the first pressurization, close during the first de-pressurization and remain closed during the following cycles. The reason for this behavior is that the constitutive model does not account for stress-free closing of the open cracks. This can be seen clearly from Figure 3a (the tangential stress increases right from the start of de-pressurization). In reality, the stress acting perpendicularly to a crack can increase only after crack closure. Another aspect of the model behavior is that the displace-ment u of the cavity wall at the maximum and minimum pressures does not vary with the number of cycles. This disagrees with actual rock behavior; in situ tests in CAES and gas storage pilot plants show that the cavern diameter increases with the number of cycles (Okuno et al. 2009, Stille et al. 1994).
We will next discuss the computational results for the case of a rock mass with lower uniaxial compressive strength (7 MPa). Up to an air pressure of 7 MPa, the response of the model is exactly the same as before (OABC, Fig. 3d). During pres-surization from 5 to 7 MPa (BC), a cracked region develops, inside which the stress state is uniaxial. When the air pressure reaches the uniaxial compressive strength σc, the rock fails in shear (“passive” shear failure). During further pressurization, the tangential stress increases, so that the stress state moves along the failure surface (path CD). Next to the cavity a crushed zone develops, which is bounded by an outer cracked zone. The displacement of the cavity wall increases super-linearly with the air pressure (Fig. 3f). As can be seen from the radial distributions of the stresses (Fig. 3e), at the maximum air pressure of the first cycle, the crushed zone extends up to a radius of 6.8 m, while the cracked zone extends up to a radius 9.5 m.
During the first de-pressurization of the cavity, the response is initially elastic (path DE); the tangential stress increases by the same amount as the radial stress de-creases and becomes the maximum principal stress when the air pressure drops below 10 MPa. At a certain air pressure p* (point E, 3.3 MPa in the present exam-ple), the stress state reaches the failure surface (“active” shear failure). Afterwards, the stress state moves along the failure surface (path EF) and a crushed zone with a gradually increasing radius develops around the cavity. The displacement of the cavity wall depends initially linearly (DE, Fig. 3f) and afterwards non-linearly (EF, Fig. 3f) on the air pressure. At the end of the cycle, the tangential stress is equal to the uniaxial compressive strength of the rock (point F in Fig. 3d). The dashed lines in Figure 3e show the radial distributions of the stresses after complete de-pressurization; the peak of tangential stress (at r = 2.8 m) marks the boundary of the crushed zone. Again, a residual positive displacement can be observed at the end of the first cycle (point F in Fig. 3f).
During the next pressurization, the response is initially elastic (path FG, Fig. 3d). When the air pressure increases above the uniaxial compressive strength of the rock, the stress state moves on the failure surface (path GD). The stress path dur-ing the second depressurization is the same as in the first cycle (path DEF). In all following cycles, the stress state moves along FGDEF. The stress distributions of Figure 3e remain the same for all cycles. The outer radii of the cracked zone and of the passive shear zone at the maximum air pressure as well as the radius of the active shear zone after every complete depressurization remain constant over the cycles. The same is also true with respect to the displacement of the cavity wall. It
7
increases along FGD during every pressurization and decreases along DEF during every depressurization (Fig. 3f).
Contrary to in situ observations, the displacements at the maximum and minimum air pressures (points D and F in Fig. 3f) do not change with the number of cycles, although the rock experiences failure repeatedly during the cyclical loading. Com-parative computations showed that this behavior is also related to the assumption of a zero dilatancy angle. In the case of dilatant plastic behavior the displacements at the maximum and minimum air pressures decrease over the cycles. The effect of dilatancy deserves further investigation. Another limitation of the constitutive model is that it does not account for softening (the failure surfaces do not change with the cycles). In view of the stress path, softening is probably an important factor. 2.3. Lined cavity under cyclical loading
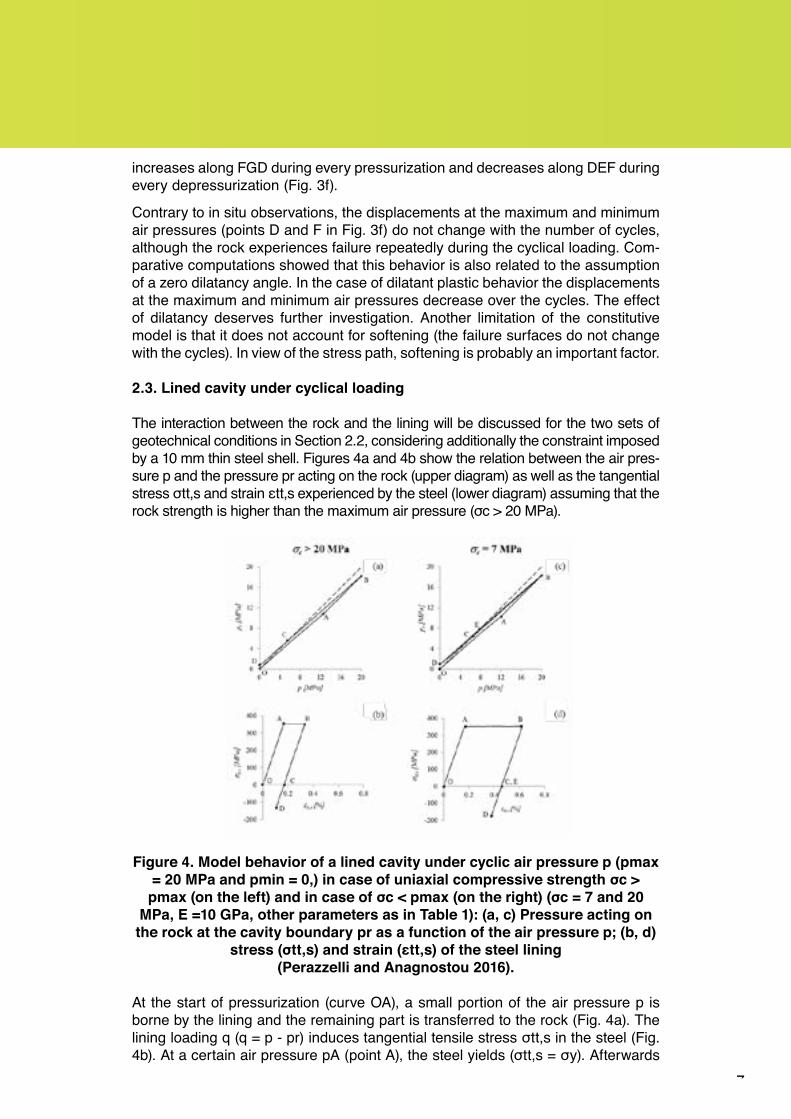
The interaction between the rock and the lining will be discussed for the two sets of geotechnical conditions in Section 2.2, considering additionally the constraint imposed by a 10 mm thin steel shell. Figures 4a and 4b show the relation between the air pres-sure p and the pressure pr acting on the rock (upper diagram) as well as the tangential stress σtt,s and strain εtt,s experienced by the steel (lower diagram) assuming that the rock strength is higher than the maximum air pressure (σc > 20 MPa).
Figure 4. Model behavior of a lined cavity under cyclic air pressure p (pmax = 20 MPa and pmin = 0,) in case of uniaxial compressive strength σc >
pmax (on the left) and in case of σc < pmax (on the right) (σc = 7 and 20 MPa, E =10 GPa, other parameters as in Table 1): (a, c) Pressure acting on the rock at the cavity boundary pr as a function of the air pressure p; (b, d)
stress (σtt,s) and strain (εtt,s) of the steel lining (Perazzelli and Anagnostou 2016).
At the start of pressurization (curve OA), a small portion of the air pressure p is borne by the lining and the remaining part is transferred to the rock (Fig. 4a). The lining loading q (q = p - pr) induces tangential tensile stress σtt,s in the steel (Fig. 4b). At a certain air pressure pA (point A), the steel yields (σtt,s = σy). Afterwards
8
(line AB), the air pressure exceeding pA is transferred to the rock. If the maximum air pressure pB (point B) is too great, then the steel lining fails due to excessive deformation (εtt,s = εtt,s lim). This hazard scenario is investigated in Section 3.During depressurization (line BCD), both the rock pressure pr and the lining loading q decrease. At a certain air pressure, the lining loading q and the tangential stress in the steel become zero (point C). Further depressurization (line CD) causes com-pression of the lining. If the compression load q is too great, then the steel lining fails by buckling. The compression load q and the subsequent risk of buckling are highest after complete depressurization (point D) and increase with increasing maximum air pressure. Buckling is analysed in Section 4.
During the first depressurization and during the next cycles the relationship be-tween the air pressure p and the pressure pr acting on the rock is linear and it does not vary under loading and reloading (line DCB of Figure 4a). The variation in the tangential stress σtt,s and strain εtt,s during the cycles is also linear and given by the line DCB in Figure 4b. The maximum compression load (q = 0.68 MPa for p = 0) and the stress range experienced by the steel in a single cycle Δσtt,s (Δσtt,s = 504 MPa) do not increase with the number of cycles. These aspects of the rock – lining interaction are due to the behaviour of the rock, which was discussed in Section 2.2; the stress and strain in a rock mass having σc > 20 MPa varies elastically dur-ing the first depressurization and during the next cycles (Fig. 2).
The repeated loading and unloading of the lining induces the risk of fatigue failure of the steel. Decisive factors in this respect are the number of cycles and the stress range in a single cycle Δσtt,s. The latter increases with the maximum air pressure and with decreasing minimum air pressure. It should be noted that the minimum air pressure will be atmospheric only for carrying-out maintenance works. During normal CAES operation, the minimum air pressure amounts to 2-4 MPa (Johans-son 2003). This will be taken into account in the fatigue assessment (Section 5).The second example (Figs. 4c and 4d) assumes that the rock strength is lower than the maximum air pressure (σc = 7 MPa). Figures 4b and 4d clearly show that the steel experiences a higher tangential strain in this case. This is due to the pas-sive shear failure of the rock, which reduces the stiffness of the rock and occurs when the pressure pr at the rock – lining interface exceeds the uniaxial compres-sive strength. The relationship between the air pressure p and the pressure pr is also slightly non-linear during the first depressurization (BCD, Fig. 4a). This is due to active shear failure (see the previous Section and Figs. 3d, 3e and 3f). The failure-induced decrease in rock stiffness also leads to a higher compression load at the end of the first depressurization (q = 0.89 MPa versus 0.68 MPa for p = 0). Due to the repeated rock shear failures occurring in loading and unloading (Figs. 3d, 3e and 3f), the relationships between the air pressure p and the pressure pr acting on the rock (DEB and BCD during loading and reloading, respectively) are also slightly nonlinear in the second and subsequent cycles. The tangential stress σtt,s and strain εtt,s in the steel vary elastically during cyclical loading (line DB in Figure 4d); the minimum and maximum strains εtt,s and the stress range Δσtt,s remain constant over the cycles. It should be noted that comparative analyses, which are not presented here, showed that if the rock behaviour rock was dilatant, then the compression load q increases and minimum and maximum deformations εtt,s decreases over the cycles. As mentioned in last Section, the effect of plastic dilatancy of the rock is not yet understood and deserves further investigation.
9
3. TENSILE FAILURE
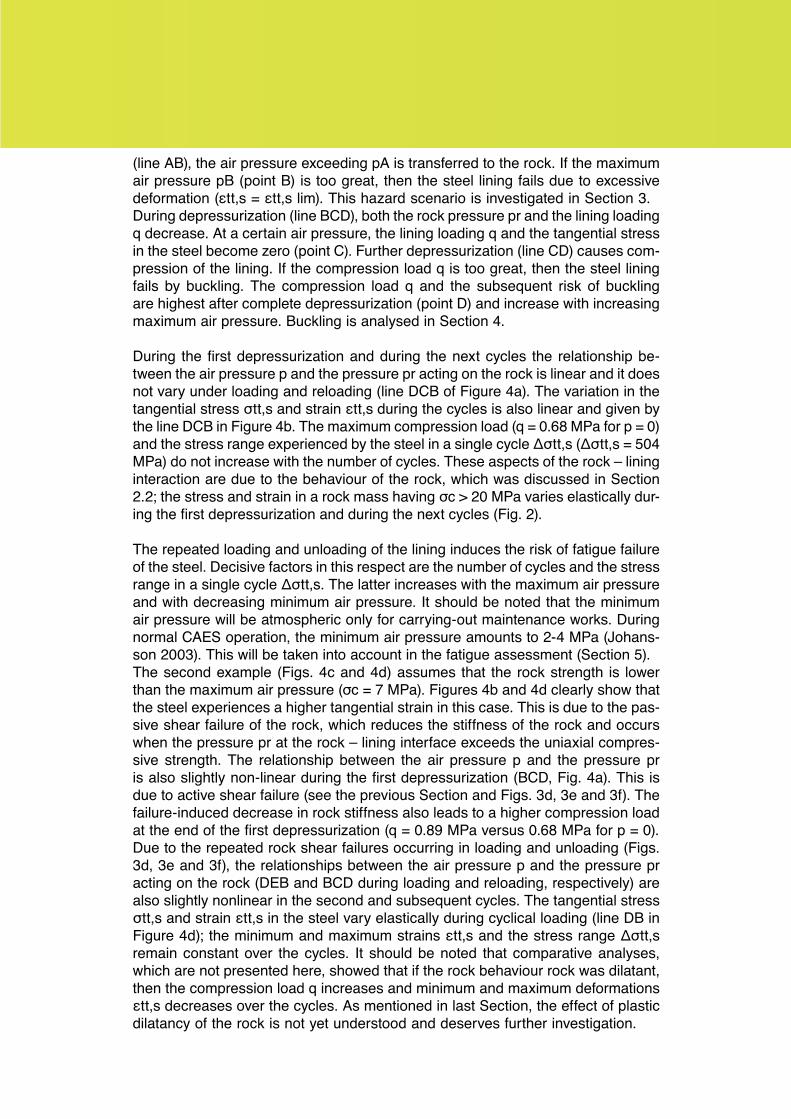
The solid lines of Figure 5 show the strain of the steel lining εtt,s at the maxi-mum air pressure (pmax =20 MPa) as a function of the Young’s modulus of the rock mass E for different uniaxial compressive strengths σc of the rock mass. The dashed line of Figure 5 shows the assumed limit tangential strain of the steel lining.Figure 5 can be used for the assessment of safety against tensile failure of the steel lining, by comparing the limit tangential strain εtt,s lims with the actual strain εtt,s. The latter takes its maximum value at the end of every pressurization stage and increases with a decreasing strength σc and Young’s modulus E of the rock mass. According to Figure 5, the actual strain of the steel lining exceeds the limit value, if the Young’s modulus of the rock is lower than 4 GPa and the uniaxial com-pressive strength is lower than 7 MPa.
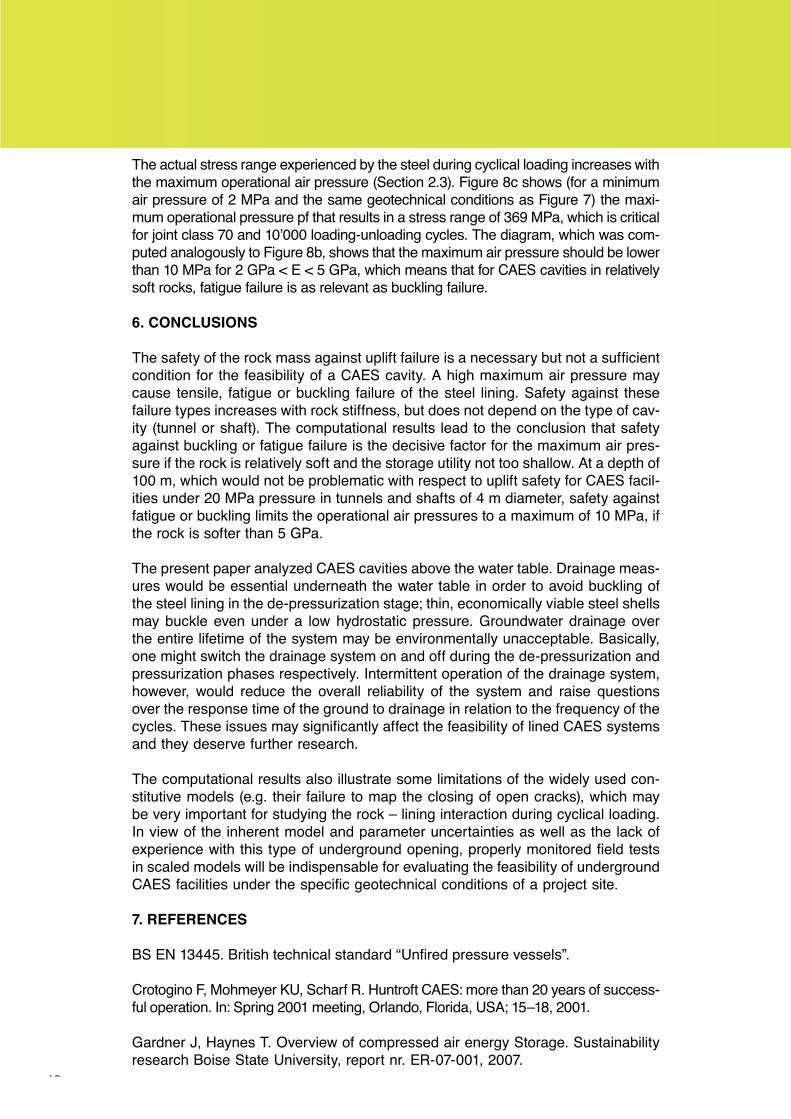
As explained in Section 2.3, the maximum tangential strain of the steel lining in-creases with the maximum operational air pressure. Figure 8a shows (for the same geotechnical conditions as Figure 5) the maximum operational pressure pt that results in a tangential strain of the steel lining actual equal the limit strain εtt,s lims. The results of Figure 8a can be used to assess safety against tensile failure for a given maximum air pressure (or to determine a safe maximum operational pres-sure). In soft rock masses (2 GPa < E < 5 GPa), in order to avoid tensile failure of the steel lining the maximum air pressure should not exceed 18MPa
Figure 5. Strain of the steel lining εtt,s at the maximum air pressure as a function of the Young’s modulus of the rock mass E
(pmax = 20 MPa, other parameters as in Table 1).
4. BUCKLING FAILURE
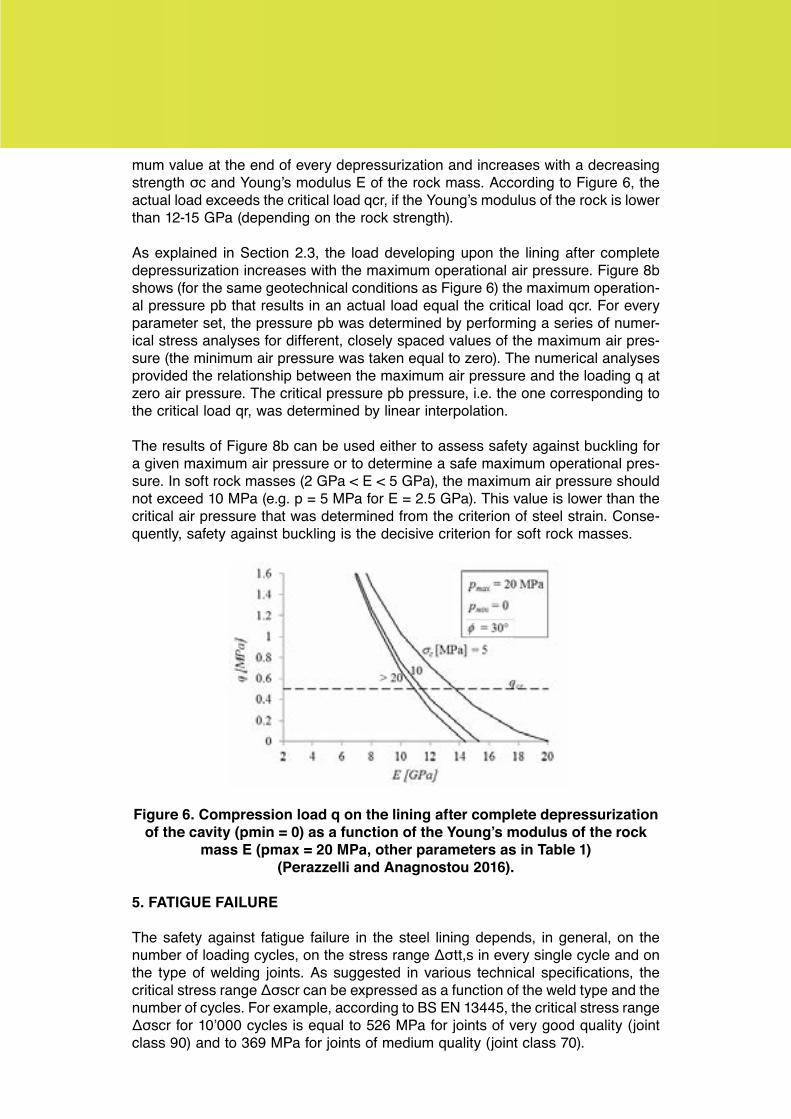
The solid lines of Figure 6 shows the load q acting on the lining after complete depres-surization of the cavity (pmin = 0) as a function of the Young’s modulus E for different uniaxial compressive strength σc of the rock mass. The dashed line of Figure 6 shows the limit buckling load qcr of the considered steel lining (Trombetta 2015).
Figure 6 can be used for the assessment of safety against buckling, i.e., by com-paring the limit buckling load qcr with the actual load q. The latter takes its maxi-
10
mum value at the end of every depressurization and increases with a decreasing strength σc and Young’s modulus E of the rock mass. According to Figure 6, the actual load exceeds the critical load qcr, if the Young’s modulus of the rock is lower than 12-15 GPa (depending on the rock strength).
As explained in Section 2.3, the load developing upon the lining after complete depressurization increases with the maximum operational air pressure. Figure 8b shows (for the same geotechnical conditions as Figure 6) the maximum operation-al pressure pb that results in an actual load equal the critical load qcr. For every parameter set, the pressure pb was determined by performing a series of numer-ical stress analyses for different, closely spaced values of the maximum air pres-sure (the minimum air pressure was taken equal to zero). The numerical analyses provided the relationship between the maximum air pressure and the loading q at zero air pressure. The critical pressure pb pressure, i.e. the one corresponding to the critical load qr, was determined by linear interpolation.
The results of Figure 8b can be used either to assess safety against buckling for a given maximum air pressure or to determine a safe maximum operational pres-sure. In soft rock masses (2 GPa < E < 5 GPa), the maximum air pressure should not exceed 10 MPa (e.g. p = 5 MPa for E = 2.5 GPa). This value is lower than the critical air pressure that was determined from the criterion of steel strain. Conse-quently, safety against buckling is the decisive criterion for soft rock masses.
Figure 6. Compression load q on the lining after complete depressurization of the cavity (pmin = 0) as a function of the Young’s modulus of the rock
mass E (pmax = 20 MPa, other parameters as in Table 1) (Perazzelli and Anagnostou 2016).
5. FATIGUE FAILURE
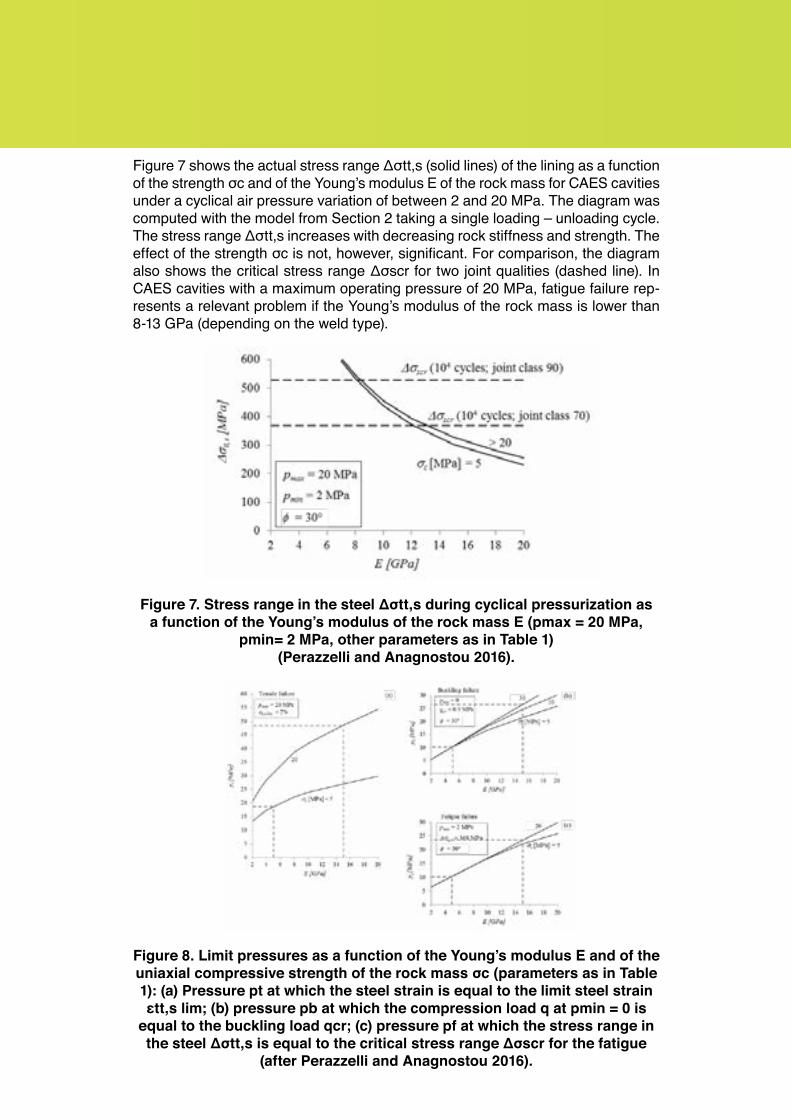
The safety against fatigue failure in the steel lining depends, in general, on the number of loading cycles, on the stress range Δσtt,s in every single cycle and on the type of welding joints. As suggested in various technical specifications, the critical stress range Δσscr can be expressed as a function of the weld type and the number of cycles. For example, according to BS EN 13445, the critical stress range Δσscr for 10’000 cycles is equal to 526 MPa for joints of very good quality (joint class 90) and to 369 MPa for joints of medium quality (joint class 70).
11
Figure 7 shows the actual stress range Δσtt,s (solid lines) of the lining as a function of the strength σc and of the Young’s modulus E of the rock mass for CAES cavities under a cyclical air pressure variation of between 2 and 20 MPa. The diagram was computed with the model from Section 2 taking a single loading – unloading cycle. The stress range Δσtt,s increases with decreasing rock stiffness and strength. The effect of the strength σc is not, however, significant. For comparison, the diagram also shows the critical stress range Δσscr for two joint qualities (dashed line). In CAES cavities with a maximum operating pressure of 20 MPa, fatigue failure rep-resents a relevant problem if the Young’s modulus of the rock mass is lower than 8-13 GPa (depending on the weld type).
Figure 7. Stress range in the steel Δσtt,s during cyclical pressurization as a function of the Young’s modulus of the rock mass E (pmax = 20 MPa,
pmin= 2 MPa, other parameters as in Table 1) (Perazzelli and Anagnostou 2016).
Figure 8. Limit pressures as a function of the Young’s modulus E and of the uniaxial compressive strength of the rock mass σc (parameters as in Table 1): (a) Pressure pt at which the steel strain is equal to the limit steel strain εtt,s lim; (b) pressure pb at which the compression load q at pmin = 0 is
equal to the buckling load qcr; (c) pressure pf at which the stress range in the steel Δσtt,s is equal to the critical stress range Δσscr for the fatigue
(after Perazzelli and Anagnostou 2016).
12
The actual stress range experienced by the steel during cyclical loading increases with the maximum operational air pressure (Section 2.3). Figure 8c shows (for a minimum air pressure of 2 MPa and the same geotechnical conditions as Figure 7) the maxi-mum operational pressure pf that results in a stress range of 369 MPa, which is critical for joint class 70 and 10’000 loading-unloading cycles. The diagram, which was com-puted analogously to Figure 8b, shows that the maximum air pressure should be lower than 10 MPa for 2 GPa < E < 5 GPa, which means that for CAES cavities in relatively soft rocks, fatigue failure is as relevant as buckling failure.
6. CONCLUSIONS
The safety of the rock mass against uplift failure is a necessary but not a sufficient condition for the feasibility of a CAES cavity. A high maximum air pressure may cause tensile, fatigue or buckling failure of the steel lining. Safety against these failure types increases with rock stiffness, but does not depend on the type of cav-ity (tunnel or shaft). The computational results lead to the conclusion that safety against buckling or fatigue failure is the decisive factor for the maximum air pres-sure if the rock is relatively soft and the storage utility not too shallow. At a depth of 100 m, which would not be problematic with respect to uplift safety for CAES facil-ities under 20 MPa pressure in tunnels and shafts of 4 m diameter, safety against fatigue or buckling limits the operational air pressures to a maximum of 10 MPa, if the rock is softer than 5 GPa.
The present paper analyzed CAES cavities above the water table. Drainage meas-ures would be essential underneath the water table in order to avoid buckling of the steel lining in the de-pressurization stage; thin, economically viable steel shells may buckle even under a low hydrostatic pressure. Groundwater drainage over the entire lifetime of the system may be environmentally unacceptable. Basically, one might switch the drainage system on and off during the de-pressurization and pressurization phases respectively. Intermittent operation of the drainage system, however, would reduce the overall reliability of the system and raise questions over the response time of the ground to drainage in relation to the frequency of the cycles. These issues may significantly affect the feasibility of lined CAES systems and they deserve further research.
The computational results also illustrate some limitations of the widely used con-stitutive models (e.g. their failure to map the closing of open cracks), which may be very important for studying the rock – lining interaction during cyclical loading. In view of the inherent model and parameter uncertainties as well as the lack of experience with this type of underground opening, properly monitored field tests in scaled models will be indispensable for evaluating the feasibility of underground CAES facilities under the specific geotechnical conditions of a project site.
7. REFERENCES
BS EN 13445. British technical standard “Unfired pressure vessels”.
Crotogino F, Mohmeyer KU, Scharf R. Huntroft CAES: more than 20 years of success-ful operation. In: Spring 2001 meeting, Orlando, Florida, USA; 15–18, 2001.
Gardner J, Haynes T. Overview of compressed air energy Storage. Sustainability research Boise State University, report nr. ER-07-001, 2007.
13
Itasca Consulting Group, FLAC, ver. 4.0, User’s Manual, Minneapolis, Minneso-ta-USA, 2001.
Johansson J. High pressure storage of gas in lined rock caverns – Cavern wall de-sign principles. Licentiate Thesis, Royal Institute of Technology, Stockholm, 2003.
Kovári K. Basic consideration on storage of compressed natural gas in rock cham-bers. Rock Mech. and Rock Engng. January–March 1993, Volume 26, Issue 1, pp 1-27, 1993.
Ladanyi B. Expansion of cavities in brittle media. Int. J. Tock Mech. Min. Sci. Vol. 4, pp. 301-328, 1996.
Mansson L, Marion P. The LRC concept and the demonstration plant in Sweden – A new approach to commercial gas storage. Proc. Of the IGU World Gas Confer-ence 2003, Tokyo, 2003.
Okuno T, Wakabayashi N, Niimi K, Kurihara Y, Iwano M. Advanced natural gas storage system and verification tests of lined rock cavern. Japanese Committee for Rock mechanics, Vol. 5, Nr. 2, 95-102, 2009.
Perazzelli, P., Anagnostou, G. 2016. Design issues for compressed air energy stor-age in sealed underground cavities. Journal of Rock Mechanics and Geotechnical Engineering, 8 (3): 314-328, Amsterdam: Elsevier, 2016.
Satapathy S, Bless S. Cavity Expansion Analysis of brittle materials. Technical Report July, 1995.
Stille H, Johansson J, Sturk R. High pressure storage of gas in lined shallow rock caverns –Results from field tests. Petroleum Engineering Conference, Delft Neth-erlands, 29-31 August 1994.
Trombetta L. Geomechanical and structural aspects in the design of tunnels for C.A.E.S. (Compressed Air Energy Storage). Master thesis ETH Zurich - Università degli Studi “Roma Tre”, 2015.

FOR VISITINGTHANK YOU
ITAAITES