Embed Size (px)
Citation preview

OregonPresented by: Office of Economic Analysis
Date: September 22, 2009
Corrections Population Forecasting Advisory Committee
2
Overview
Introductions, Business Meetings next year – see handout Feb. 16, 2010 and March 16, 2010 prior to April forecast Aug. 24, 2010 and Sept. 14, 2010 prior to October forecast All at 1:30 to 3:30 in this building
Topics Crime rate report Population summary Forecast tracking M57 implementation/phase-in Forecast direction for October release Forecast Risks/Issues
3
Recent Crime Report
FBI UCR stats for 2008 Violent crime down 9% Property crime down 6% Simple assumption: DOC intakes follow crime
Crimes arrests charges prison admissions Is this true?
Roughly 6 month lag from crime to prison intake
Inmate intakes not (yet?) following similar pattern
4
Violent Crime DOC Inmate Admits
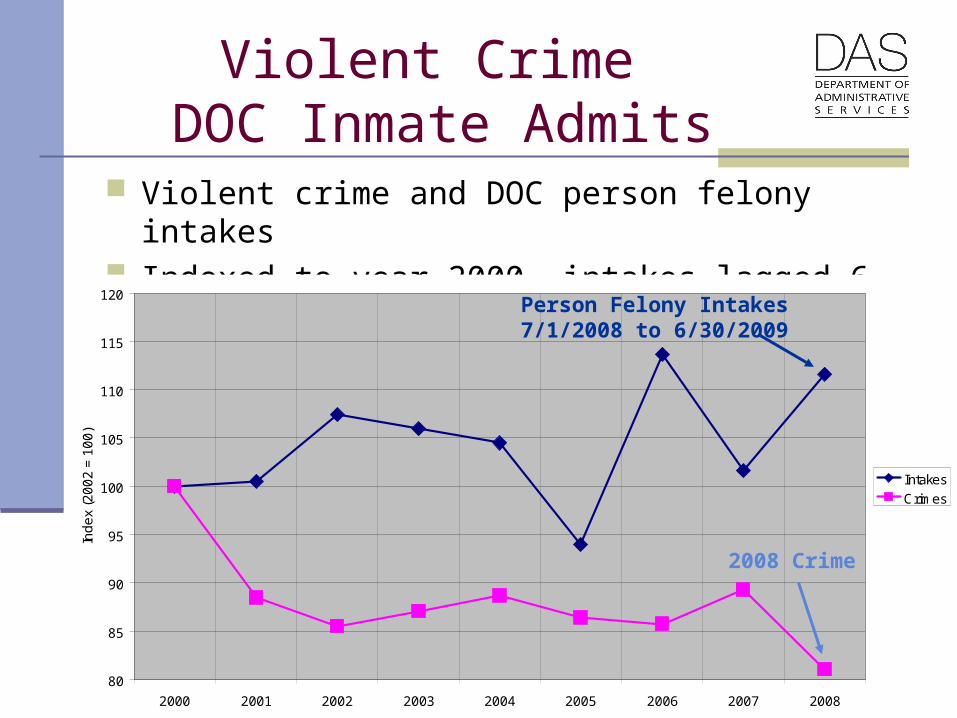
Violent crime and DOC person felony intakes Indexed to year 2000, intakes lagged 6 months
80
85
90
95
100
105
110
115
120
2000 2001 2002 2003 2004 2005 2006 2007 2008
Ind
ex
(20
02
= 1
00
)
Intakes
Crimes
2008 Crime
Person Felony Intakes7/1/2008 to 6/30/2009
5
Inmate Population
Inmate count, months to serve M11 – still dominating Months to serve (projected months) Gender Crime type
6
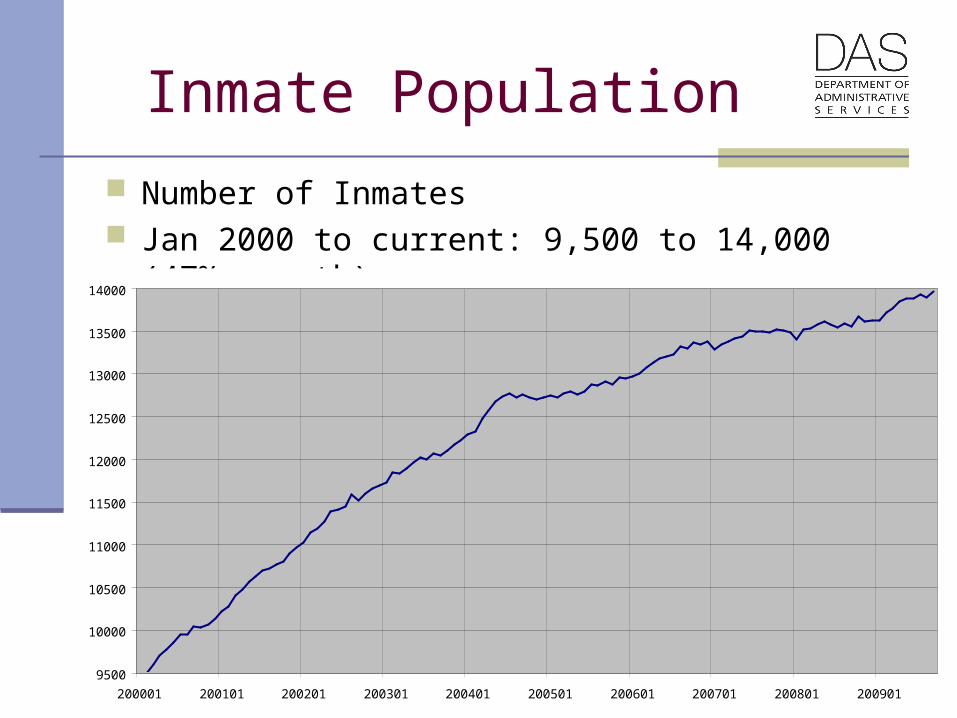
Inmate Population
Number of Inmates Jan 2000 to current: 9,500 to 14,000 (47% growth)
9500
10000
10500
11000
11500
12000
12500
13000
13500
14000
200001 200101 200201 200301 200401 200501 200601 200701 200801 200901
7
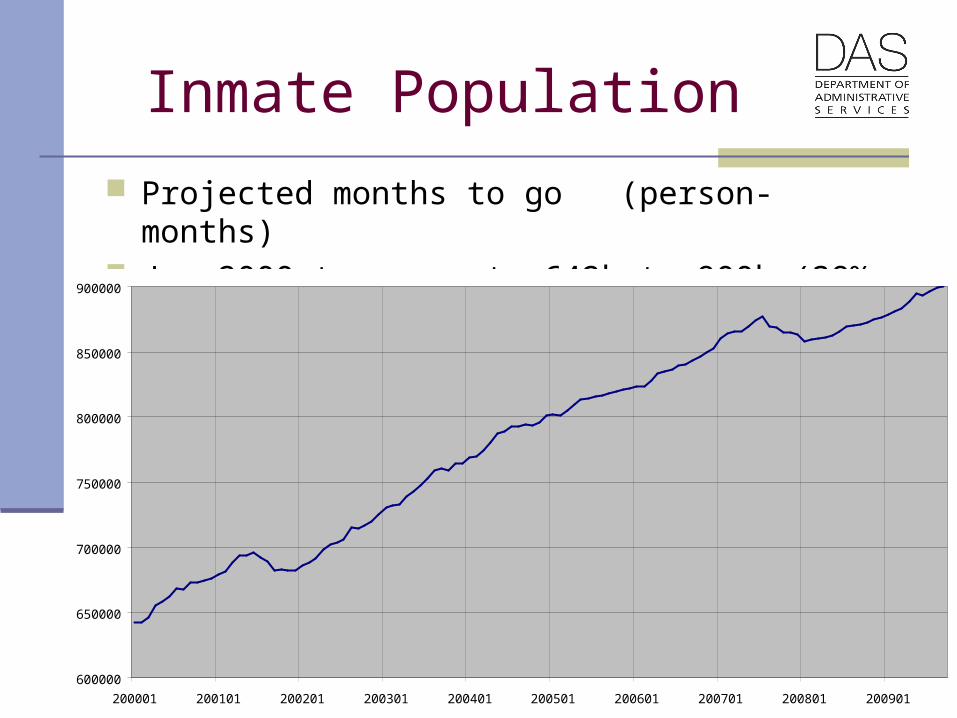
Inmate Population
Projected months to go (person-months) Jan 2000 to current: 642k to 900k (38% growth)
600000
650000
700000
750000
800000
850000
900000
200001 200101 200201 200301 200401 200501 200601 200701 200801 200901
8
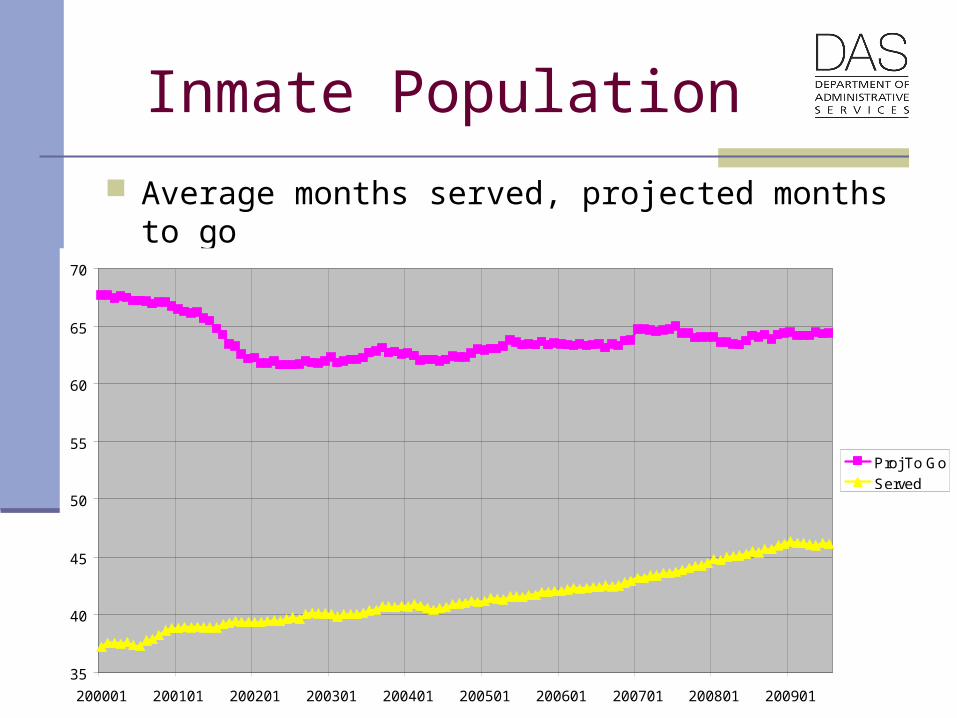
Inmate Population
Average months served, projected months to go
35
40
45
50
55
60
65
70
200001 200101 200201 200301 200401 200501 200601 200701 200801 200901
Proj To Go
Served
9
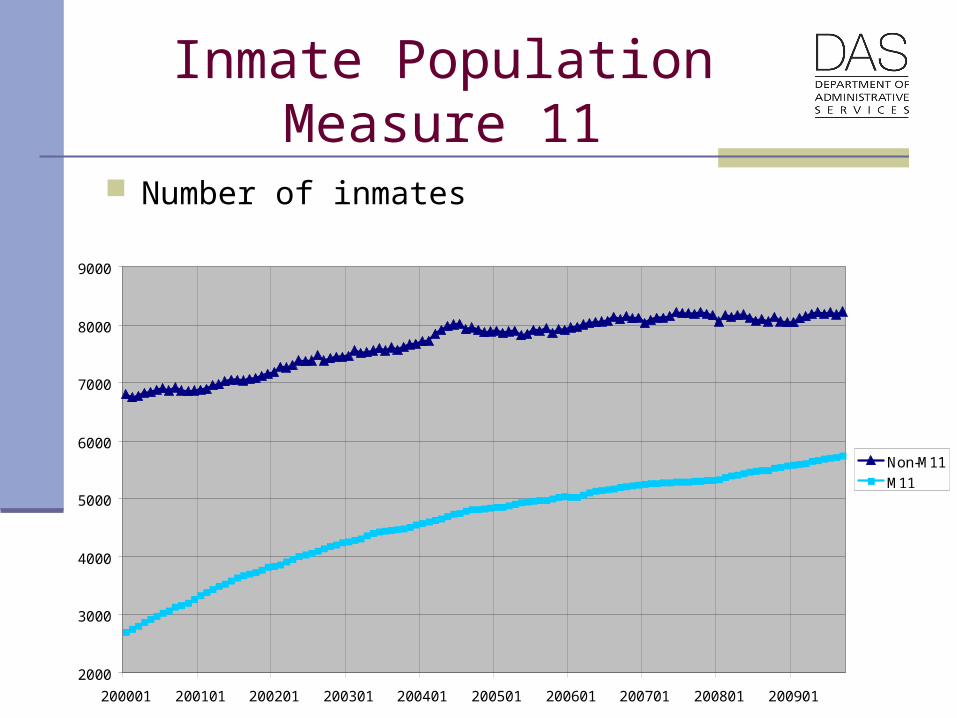
Inmate PopulationMeasure 11
Number of inmates
2000
3000
4000
5000
6000
7000
8000
9000
200001 200101 200201 200301 200401 200501 200601 200701 200801 200901
Non-M11
M11
10
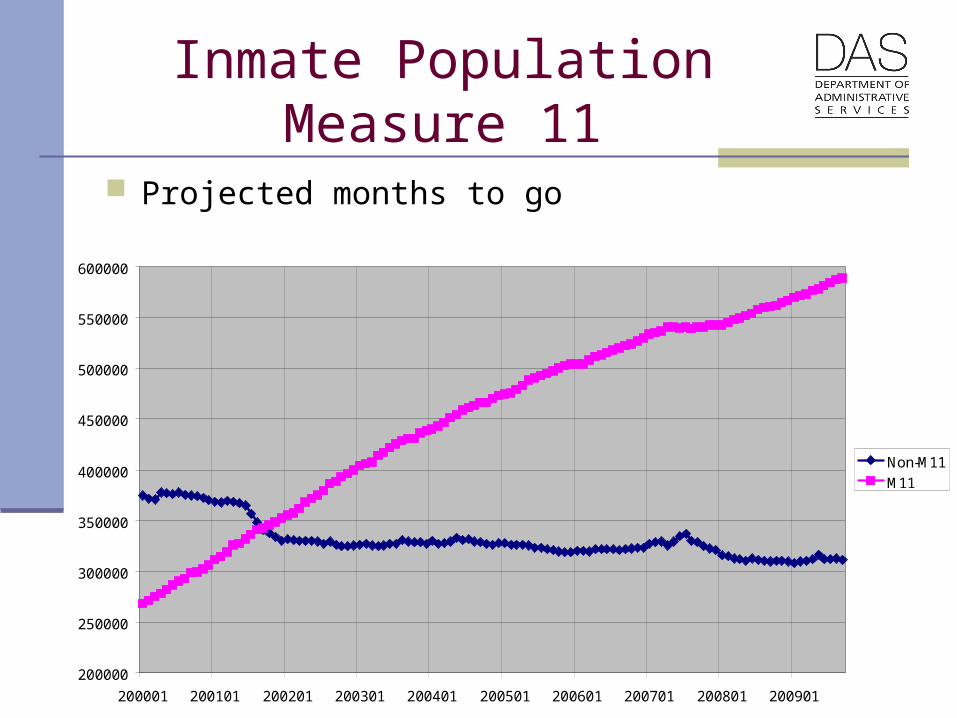
Inmate PopulationMeasure 11
Projected months to go
200000
250000
300000
350000
400000
450000
500000
550000
600000
200001 200101 200201 200301 200401 200501 200601 200701 200801 200901
Non-M11
M11
11
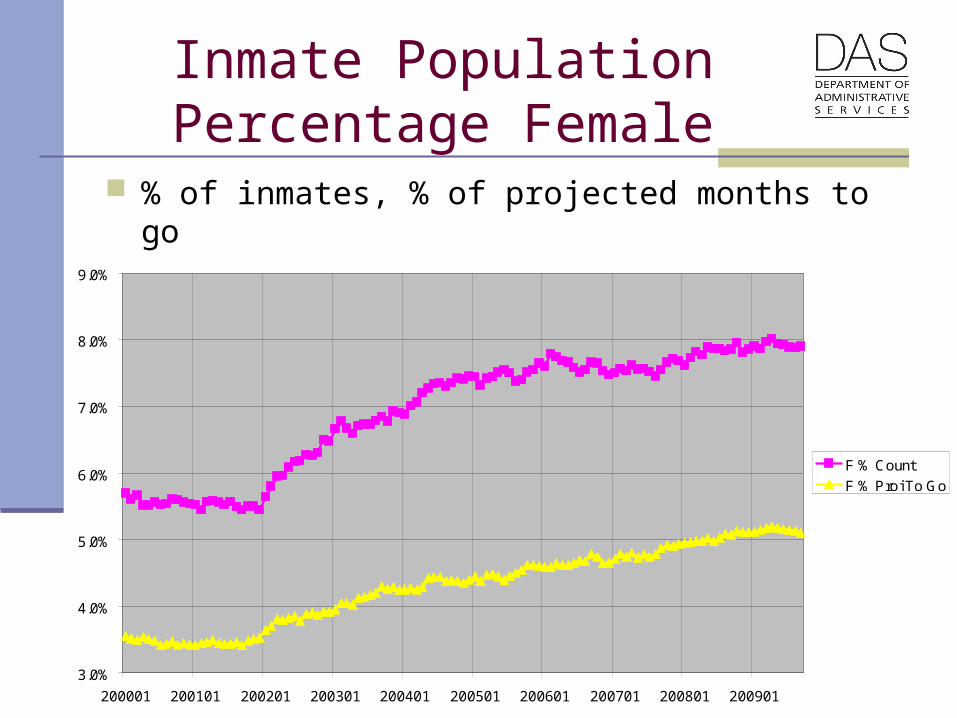
Inmate Population Percentage Female
% of inmates, % of projected months to go
3.0%
4.0%
5.0%
6.0%
7.0%
8.0%
9.0%
200001 200101 200201 200301 200401 200501 200601 200701 200801 200901
F % Count
F % Proj To Go
12
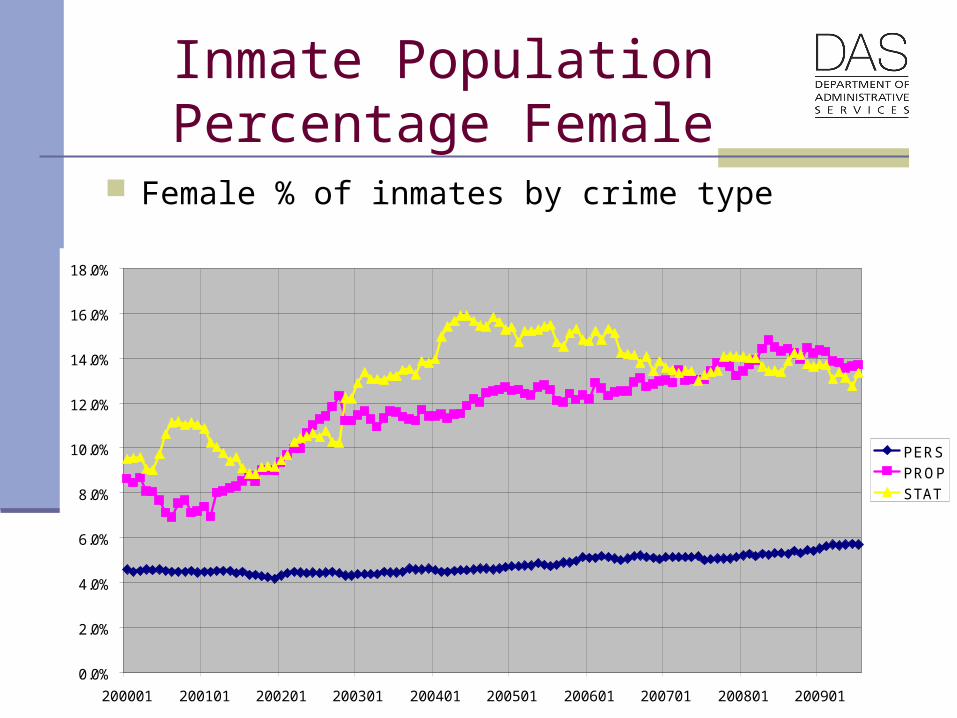
Inmate Population Percentage Female
Female % of inmates by crime type
0.0%
2.0%
4.0%
6.0%
8.0%
10.0%
12.0%
14.0%
16.0%
18.0%
200001 200101 200201 200301 200401 200501 200601 200701 200801 200901
PERS
PROP
STAT
13
Inmate Forecast Tracking
Tracking below forecast Baseline forecast too high Intakes Releases higher than expected M57 impact slower than expected Slower flow through courts to intake
14
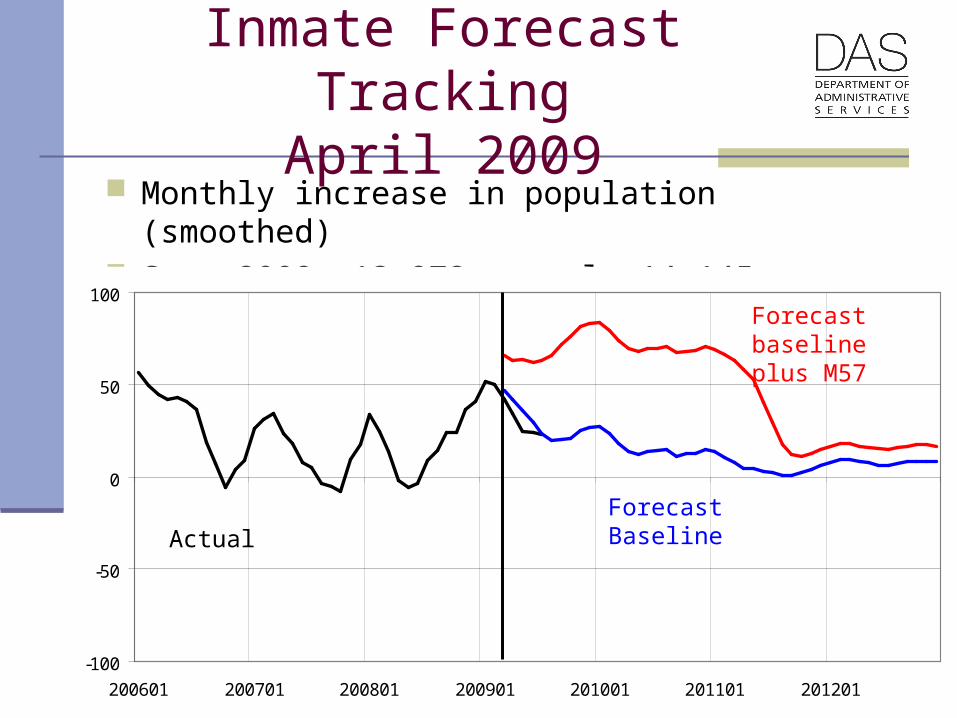
Inmate Forecast TrackingApril 2009
Monthly increase in population (smoothed) Sept 2009: 13,972 actual, 14,145 forecast (1.2%)
-100
-50
0
50
100
200601 200701 200801 200901 201001 201101 201201
ActualForecast Baseline
Forecast baselineplus M57
15
M57 Update
Approximately 309 so far (DOC “flag”) 290
Known issues with flag in DOC data Deschutes example (2, 4, 7, 13 ) Significant indirect influences
Revised estimates for Oct. forecast M57 phases in more slowly HB 3508 impact
Phase out (Feb. 15, 2009), Phase in (Jan. 2012)
Individual county DA policies Possible plea to old RPO sentencing? Discuss as risk but not included explicitly in forecast
16
Inmate Forecast TrackingLong Term Forecast Error
Performance of past inmate forecasts Past 10 years of forecasting
Several graphs Track of every prior forecast Errors at +2 and +4 years from forecast date
Forecast range possibilities Forecast error 4 years out
17
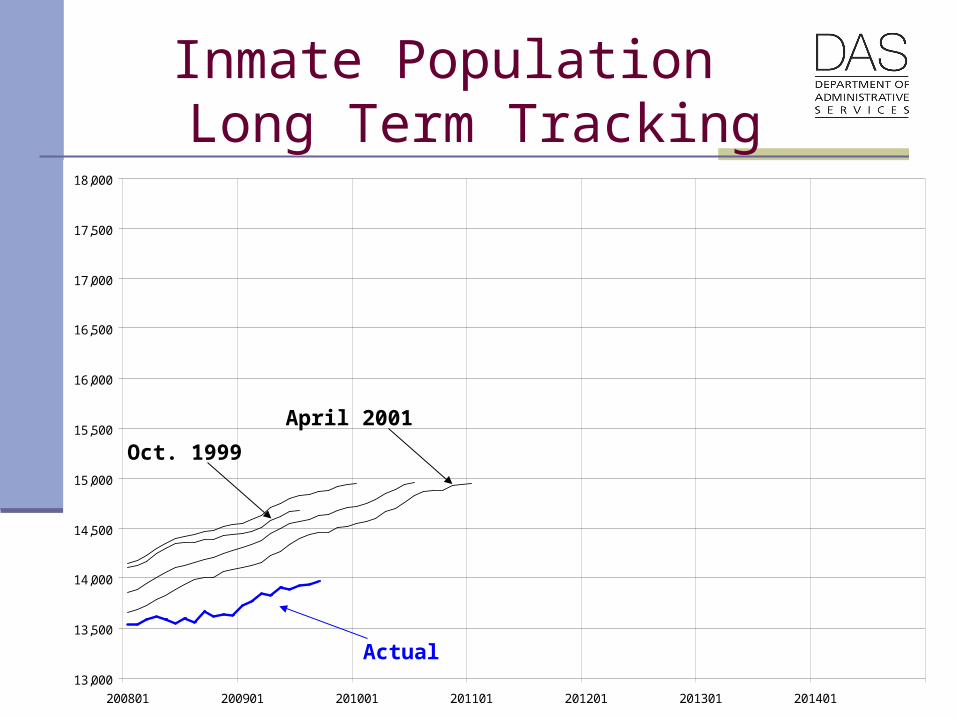
Inmate Population Long Term Tracking
13,000
13,500
14,000
14,500
15,000
15,500
16,000
16,500
17,000
17,500
18,000
200801 200901 201001 201101 201201 201301 201401
Oct. 1999
April 2001
Actual
18
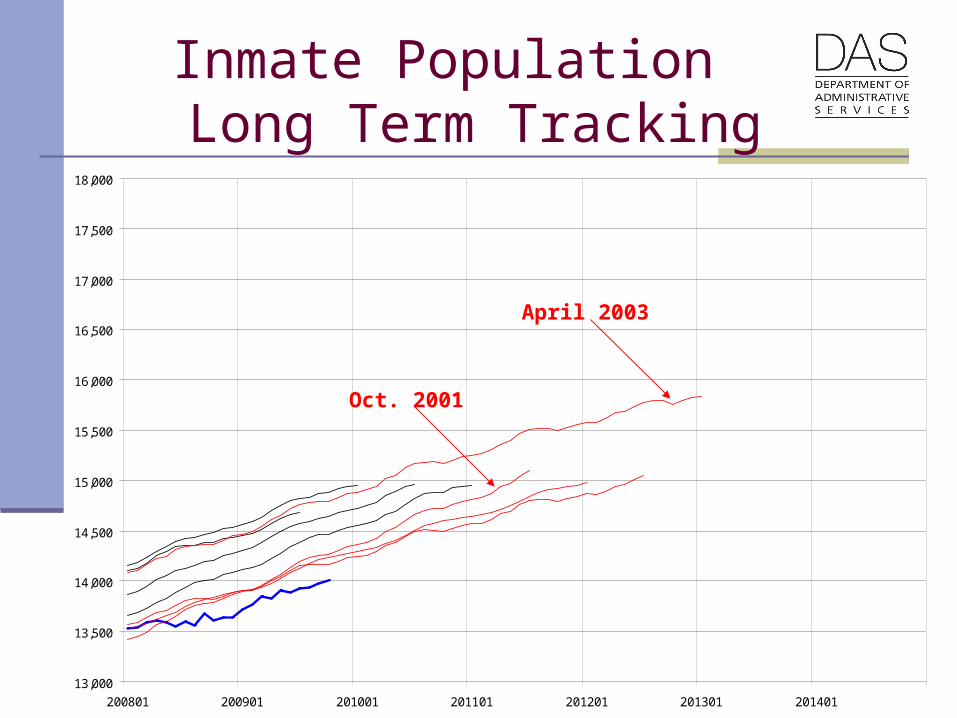
Inmate Population Long Term Tracking
13,000
13,500
14,000
14,500
15,000
15,500
16,000
16,500
17,000
17,500
18,000
200801 200901 201001 201101 201201 201301 201401
Oct. 2001
April 2003
19
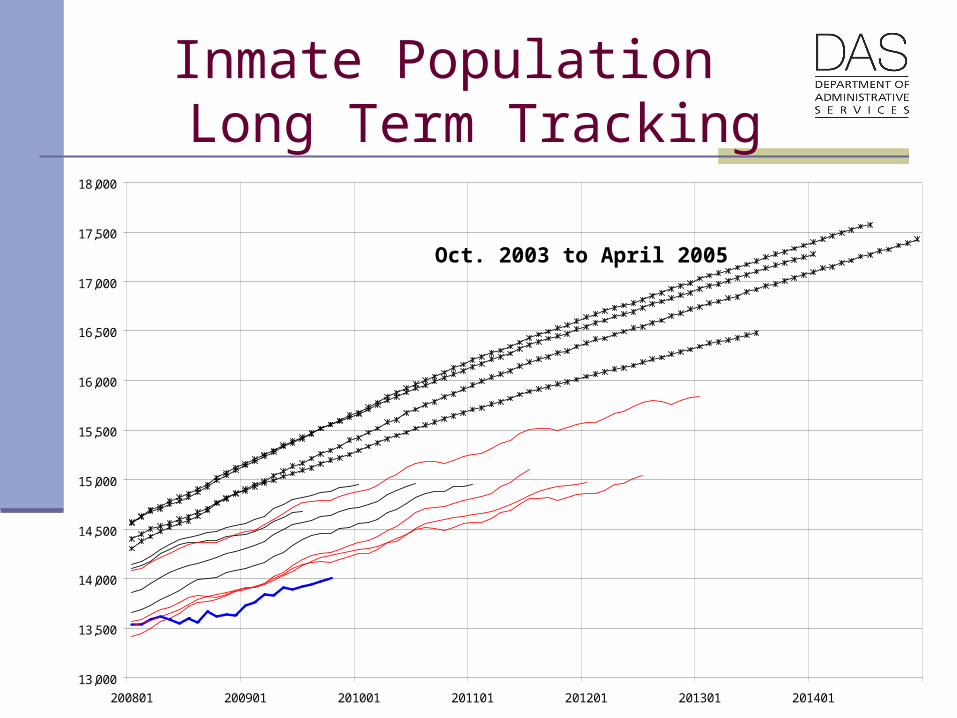
Inmate Population Long Term Tracking
13,000
13,500
14,000
14,500
15,000
15,500
16,000
16,500
17,000
17,500
18,000
200801 200901 201001 201101 201201 201301 201401
Oct. 2003 to April 2005

20
Inmate Population Long Term Tracking
13,000
13,500
14,000
14,500
15,000
15,500
16,000
16,500
17,000
17,500
18,000
200801 200901 201001 201101 201201 201301 201401
Oct. 2005 to April 2007
21
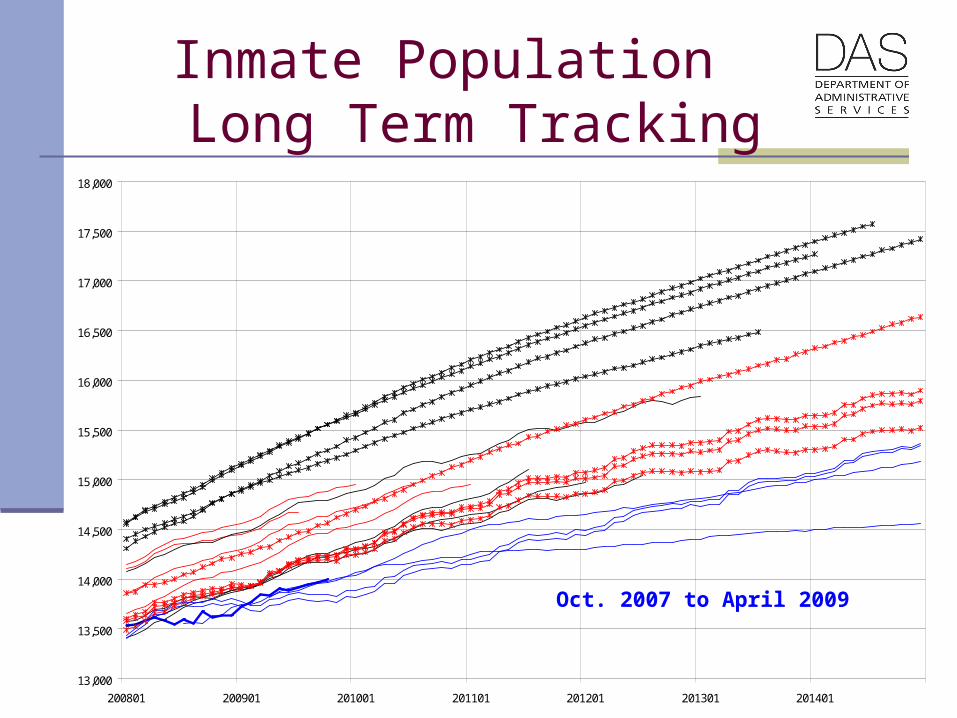
Inmate Population Long Term Tracking
13,000
13,500
14,000
14,500
15,000
15,500
16,000
16,500
17,000
17,500
18,000
200801 200901 201001 201101 201201 201301 201401
Oct. 2007 to April 2009
22
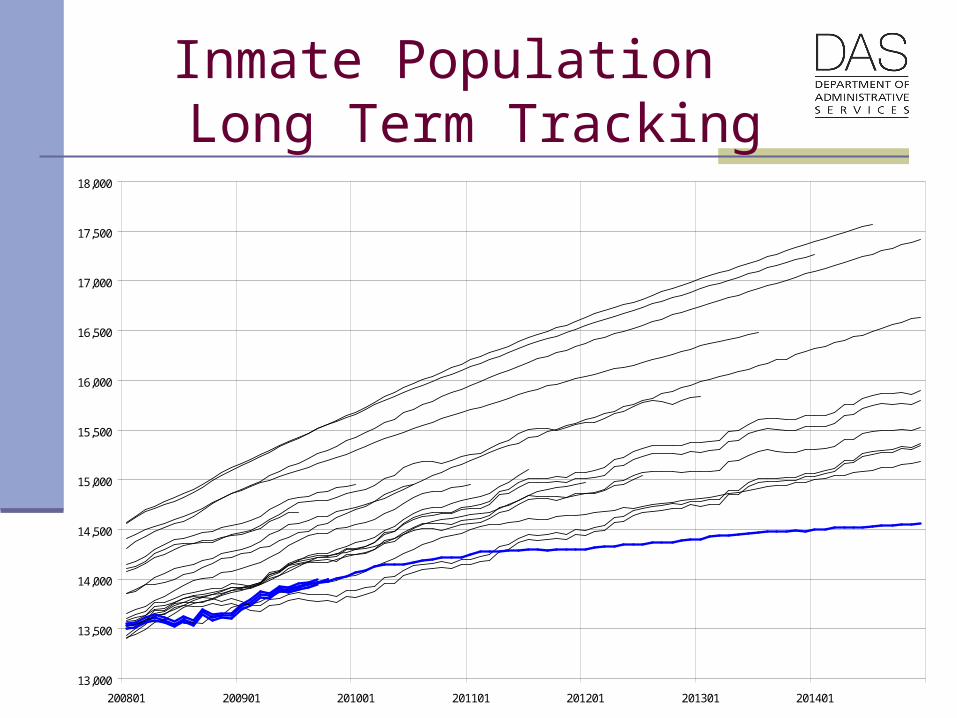
Inmate Population Long Term Tracking
13,000
13,500
14,000
14,500
15,000
15,500
16,000
16,500
17,000
17,500
18,000
200801 200901 201001 201101 201201 201301 201401
23
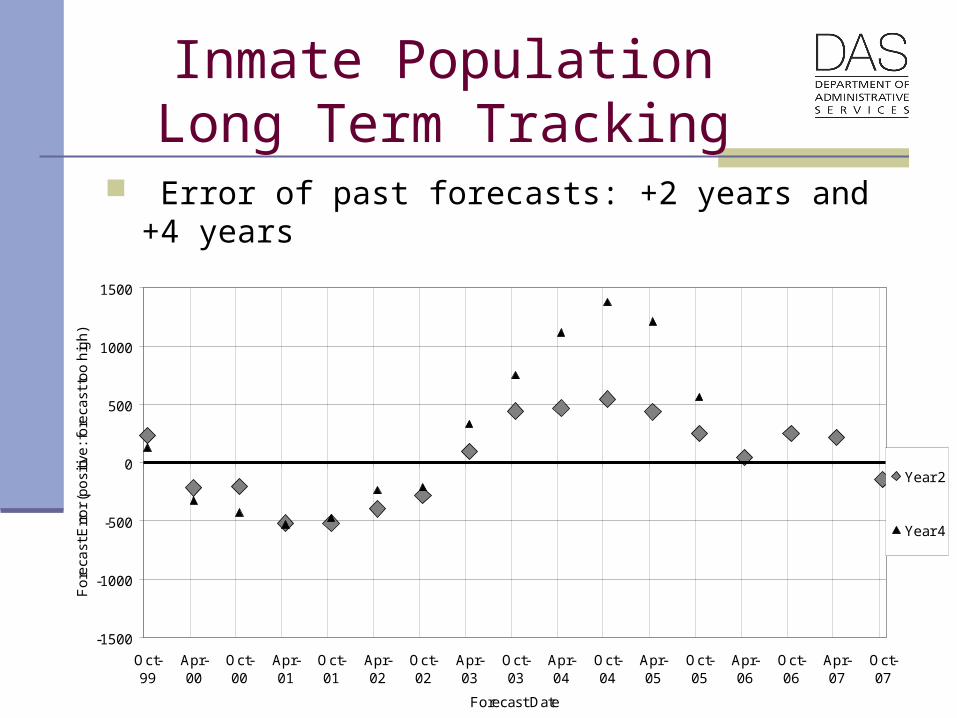
Inmate PopulationLong Term Tracking
Error of past forecasts: +2 years and +4 years
-1500
-1000
-500
0
500
1000
1500
Oct-99
Apr-00
Oct-00
Apr-01
Oct-01
Apr-02
Oct-02
Apr-03
Oct-03
Apr-04
Oct-04
Apr-05
Oct-05
Apr-06
Oct-06
Apr-07
Oct-07
Forecast Date
Fo
reca
st E
rro
r (p
osi
tive
: fo
reca
st to
o h
igh
)
Year 2
Year 4
24
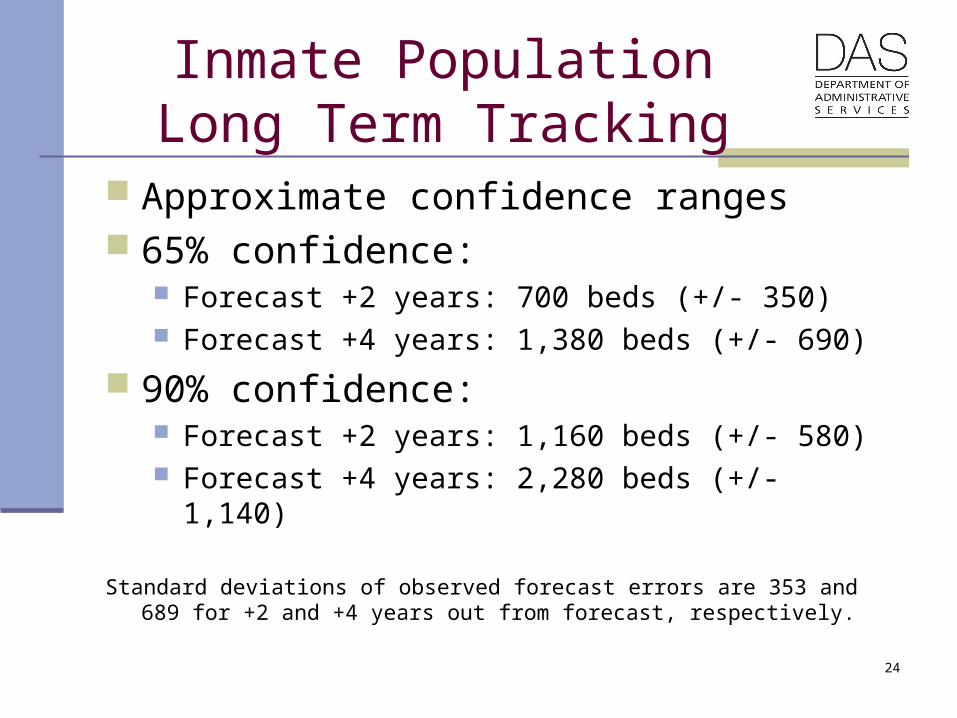
Inmate PopulationLong Term Tracking
Approximate confidence ranges 65% confidence:
Forecast +2 years: 700 beds (+/- 350) Forecast +4 years: 1,380 beds (+/- 690)
90% confidence: Forecast +2 years: 1,160 beds (+/- 580) Forecast +4 years: 2,280 beds (+/- 1,140)
Standard deviations of observed forecast errors are 353 and 689 for +2 and +4 years out from forecast, respectively.
25
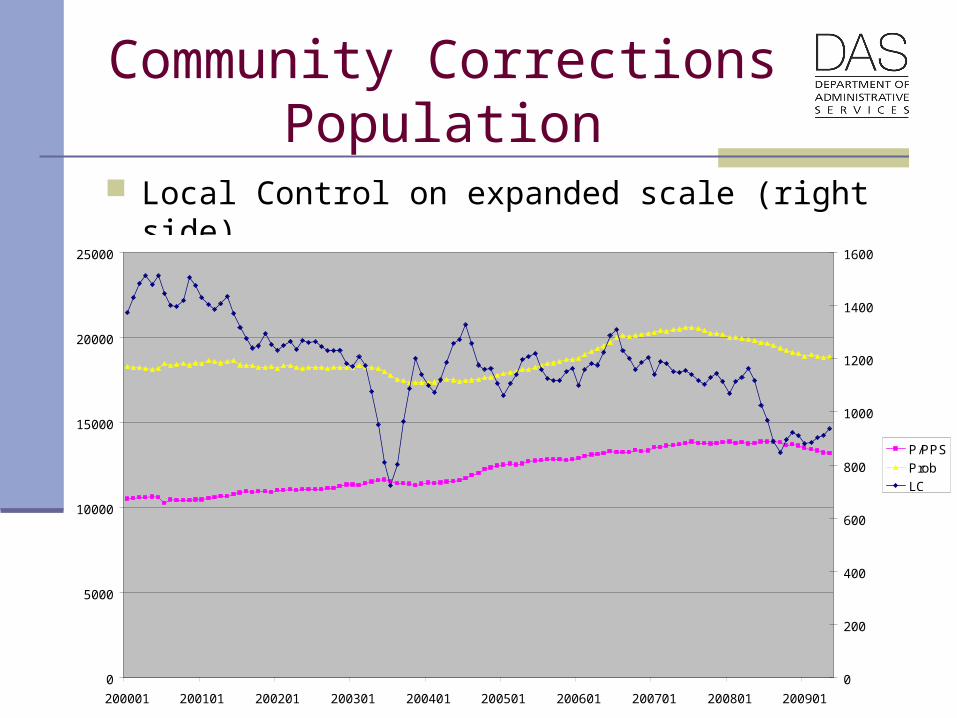
Community Corrections Population
Local control – sentence 12 months or less Probation
New inactive status Parole/PPS Level III sanctions
Number has significantly decreased since 2000
26
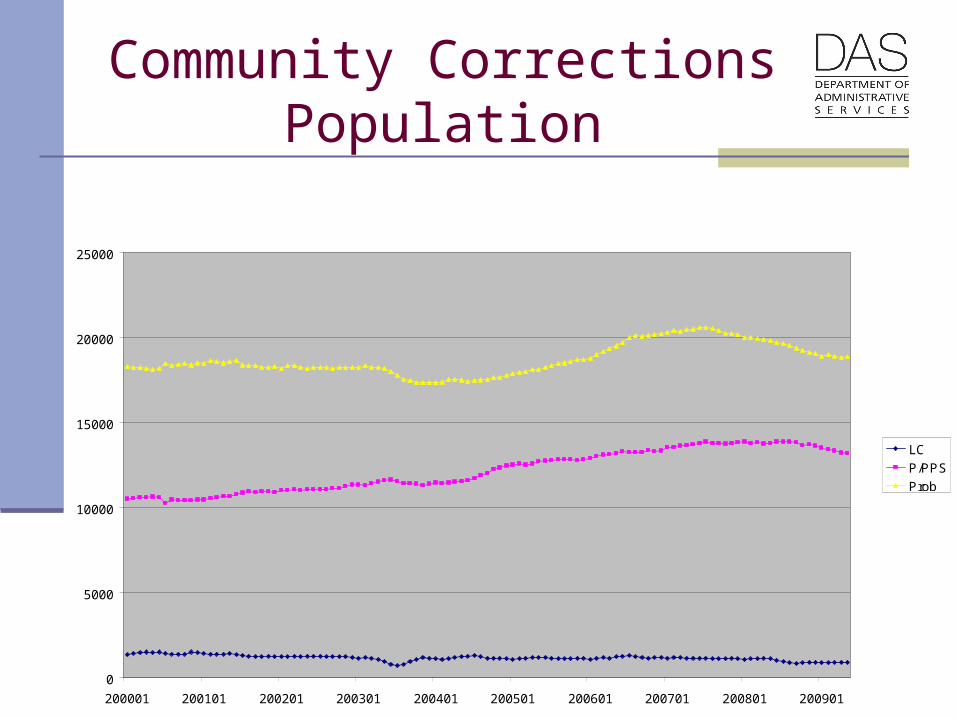
Community CorrectionsPopulation
0
5000
10000
15000
20000
25000
200001 200101 200201 200301 200401 200501 200601 200701 200801 200901
LC
P/PPS
Prob
27
Community CorrectionsPopulation
Local Control on expanded scale (right side)
0
5000
10000
15000
20000
25000
200001 200101 200201 200301 200401 200501 200601 200701 200801 200901
LC
P/PPS
Prob
0
5000
10000
15000
20000
25000
200001 200101 200201 200301 200401 200501 200601 200701 200801 200901
0
200
400
600
800
1000
1200
1400
1600
P/PPS
Prob
LC
28
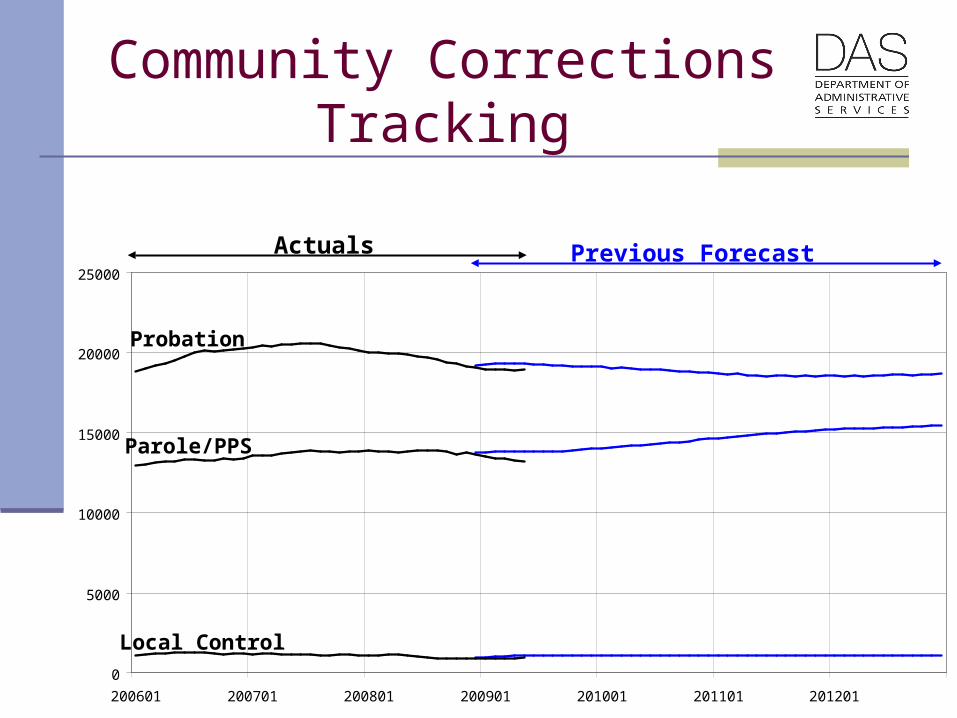
Community CorrectionsTracking
Previous forecast had substantial decrease Short story: Populations tracked below
forecast – December 2008 through May 2009 Local control: 11% below forecast Parole/PPS: 3% below forecast Probation: 2% below forecast
29
Community CorrectionsTracking
0
5000
10000
15000
20000
25000
200601 200701 200801 200901 201001 201101 201201
Probation
Parole/PPS
Local Control
Previous ForecastActuals
30
October 2009 Forecast
Community corrections: small adjustments Plan active/inactive breakdown later if needed Inmate population:
Baseline: near-term downward revision, little change to long term trend (slight increase?)
M57, HB1085, AIP adjustments: M57 revised estimates built into HB1085. Small increase for 20% max on AIP.
31
Forecast Risks
M57 and HB3508 (short and long term) Plea practices 30% ET, AIP, ICE Unvalidated assumptions Continued risk – inability to separate effects
Law changes (short and long term) Changes in trends – sociological (long term) Forecast model
32
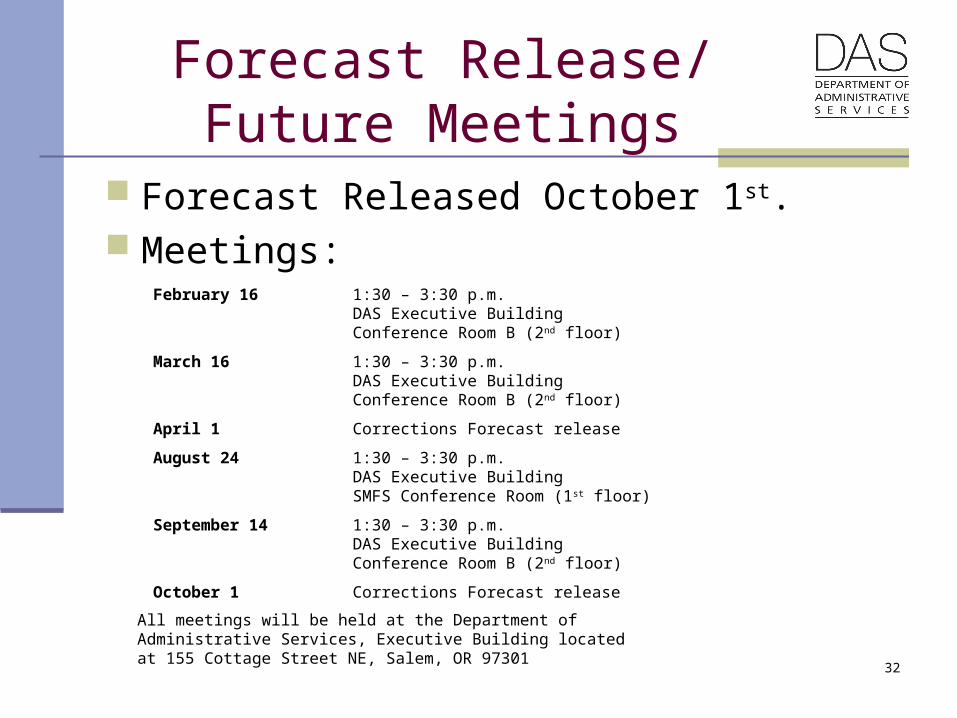
Forecast Release/Future Meetings
Forecast Released October 1st. Meetings:
February 16 1:30 – 3:30 p.m.DAS Executive BuildingConference Room B (2nd floor)
March 16 1:30 – 3:30 p.m.DAS Executive BuildingConference Room B (2nd floor)
April 1 Corrections Forecast release
August 24 1:30 – 3:30 p.m.DAS Executive BuildingSMFS Conference Room (1st floor)
September 14 1:30 – 3:30 p.m.DAS Executive BuildingConference Room B (2nd floor)
October 1 Corrections Forecast release
All meetings will be held at the Department of Administrative Services, Executive Building located at 155 Cottage Street NE, Salem, OR 97301

33
Office of Economic Analysis155 Cottage Street NE, U20Salem, OR 97301-3966
(503) 378-3405
email: [email protected]://oregon.gov/DAS/OEA/
For more information…
Office of Economic Analysis