Embed Size (px)
Citation preview

S1
Organelle-specific analysis of labile Fe(II) during ferroptosis by using a cocktail of various colour organelle-targeted fluorescent probes
Tasuku Hirayama*, Ayaji Miki, Hideko Nagasawa
Laboratory of Pharmaceutical and Medicinal Chemistry, Gifu Pharmaceutical University
Contents
Supporting information and figures Fig. S1 Metal selectivity and stability tests of the probes ............................................................ S2 Fig. S2 Fluorescence microscopic analysis of the cells singly-stained with each probe ............... S3 Fig. S3 Cell viability assay of HT1080 cells............................................................................... S3 Fig. S4 Fluorescence imaging of accumulation of the fluorescent dyes ....................................... S4 Fig. S5 Fluorescence imaging of lipid peroxidation using C11-BODIPY .................................... S5 Fig. S6 Quantification of total iron contents ............................................................................... S5 Fig. S7 Cell viability assay of MCF-7 cells ................................................................................ S5 Fig. S8 Multi-colour fluorescence microscopic analysis of MCF-7 cells treated with erastin ...... S6
Electronic Supplementary Material (ESI) for Metallomics.This journal is © The Royal Society of Chemistry 2018

S2
Supporting figures
Fig. S1 Metal selectivity tests (a,c,e) and stability tests against biologically relevant reactive oxygen species, reactive sulphur species, and reactive nitrogen species (b,d,f). The probe concentrations are 2 µM. (a,b) MtFluNox, (c,d) Lyso-RhoNox, and (e,f) ER-SiRhoNox. Relative fluorescence intensities at 535 nm (MtFluNox), 575 nm (Lyso-RhoNox), and 660 nm (ER-SiRhoNox) after incubation in HEPES buffer (50 mM, pH 7.4) for 1 h were plotted. These graphs were reproduced by using the data acquired and reported previously: (a,b) Metallomics 2018, 10, 794; (c,d) Org. Biomol. Chem. 2013, 12, 6590; (e,f) Chem. Sci. 2017, 8, 4858.
051015202530
0
10
20
30
40
50
0
10
20
30
40
50
0
10
20
30
40
50
noneNa 2S
2O3
AscorbateCysGSH
NaNO 2
H 2O2
•OH
OCl– NOFe2
+ +Bpy
Fe2+
supero
xide
noneFe2
+Mn2
+Fe3
+Co2
+Ni2+ Cu2
+Zn2
+Na+
Mg2+
K+ Ca2+
Rel
ativ
e in
tens
ityat
535
nm
0
5
10
15
20
25
20 µM 1 mM
noneNa 2S
2O3
AscorbateCysGSH
NaNO 2
H 2O2
•OH
OCl– NOFe2
+ +Bpy
Fe2+
supero
xide
noneFe2
+Mn2
+Fe3
+Co2
+Ni2+ Cu2
+Zn2
+Na+
Mg2+
K+ Ca2+
20 µM 1 mM
0102030405060
Cu+noneFe2
+Mn2
+Fe3
+Co2
+Ni2+ Cu2
+Zn2
+Na+
Mg2+
K+ Ca2+
20 µM 1 mM
noneNa 2S
2O3
AscorbateCysGSH
NaNO 2
H 2O2
•OH
OCl– NOFe2
+ +Bpy
Fe2+
supero
xide
Rel
ativ
e in
tens
ityat
575
nm
Rel
ativ
e in
tens
ityat
660
nm
Rel
ativ
e in
tens
ityat
535
nm
Rel
ativ
e in
tens
ityat
575
nm
Rel
ativ
e in
tens
ityat
660
nm
(a) (b)
(c) (d)
(e) (f)

S3
Fig. S2 Fluorescence microscopic analysis for detection of Fe(II) in the cells stained with each probe. Representative images of HT1080 cells stained with (a) Ac-MtFluNox, (b) Lyso-RhoNox, or (c) ER-SiRhoNox in HBSS for 30 min followed by Fe(II) treatment in MEM for 30 min. Left to right: images of the same field of views acquired by using the filter sets for DIC, mitochondria (green), lysosome (yellow), and ER (magenta). All the images were acquired by the same microscope settings.
Fig. S3 (a) Cell viability assay of HT1080 cells upon treatment with erastin (10 µM) using MTT assay. (b) Cell viability assay of HT1080 cells upon treatment with erastin (10 µM) in the presence of deferoxamine (DFO, 100 µM) for 12 h. Error bars indicate ± S.E.M. Statistical analysis was performed by the Studentʹs t-test. **P < 0.01 (n = 5).
Viab
ility
(%co
ntro
l)
0
20
40
60
80
100
120
ErastinDFO
+–
++
**(a) (b)
020
40
6080
100
2 5 6 8 10 12Time (h)
Viab
ility
(%co
ntro
l)
**
** ** **

S4
Fig. S4 Multi-colour fluorescence microscopic analyses of the effect of erastin treatment on the accumulation levels of the dye, Ac-MtRhodol (green), Lyso-Rhodamine (yellow), and ER-SiRhodamine (magenta) in HT1080 cells. The cells were treated with erastin (10 µM) then stained by the cocktail of the dyes for 1 h. (a) Representative images of the control cells (upper) and the cells treated with erastin (lower). (b–d) Quantification of the images of each channel acquired in each condition. Error bars indicate ± S.E.M. Statistical analysis was performed by the Studentʹs t-test. **P < 0.05, n.s. = not significant. (n = 5). Scale bars indicate 100 µm.
S5
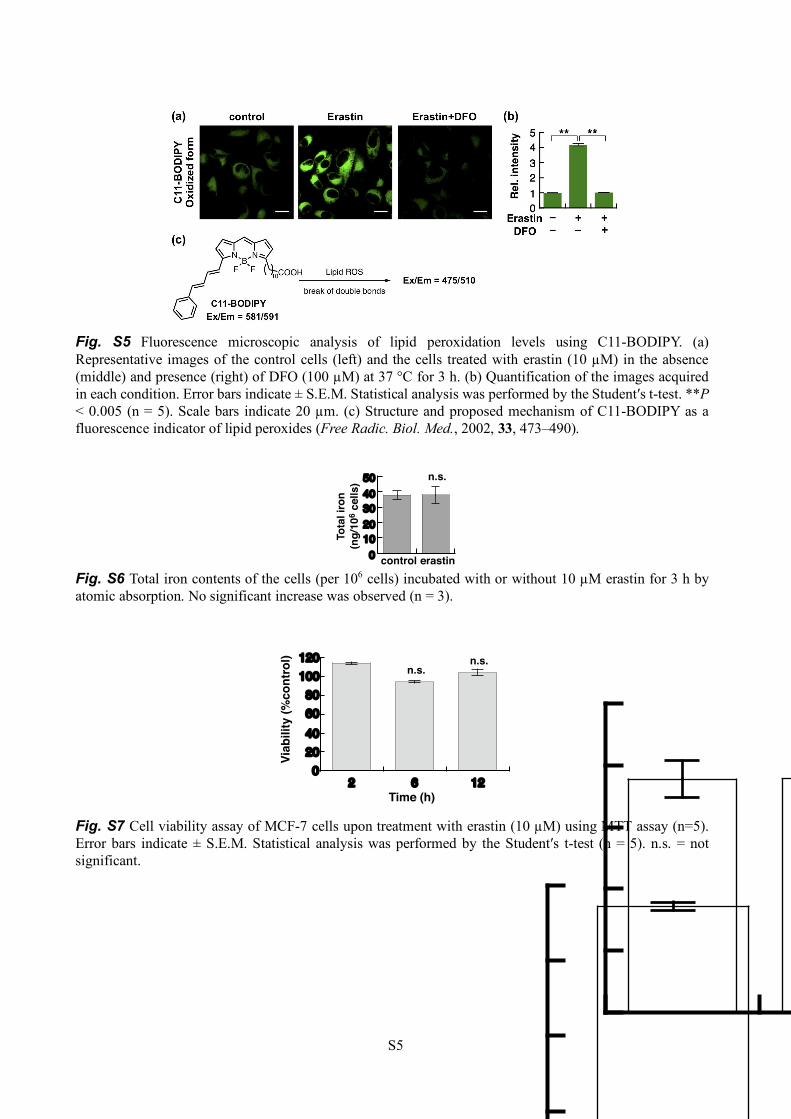
Fig. S5 Fluorescence microscopic analysis of lipid peroxidation levels using C11-BODIPY. (a) Representative images of the control cells (left) and the cells treated with erastin (10 µM) in the absence (middle) and presence (right) of DFO (100 µM) at 37 °C for 3 h. (b) Quantification of the images acquired in each condition. Error bars indicate ± S.E.M. Statistical analysis was performed by the Studentʹs t-test. **P < 0.005 (n = 5). Scale bars indicate 20 µm. (c) Structure and proposed mechanism of C11-BODIPY as a fluorescence indicator of lipid peroxides (Free Radic. Biol. Med., 2002, 33, 473–490).
Fig. S6 Total iron contents of the cells (per 106 cells) incubated with or without 10 µM erastin for 3 h by atomic absorption. No significant increase was observed (n = 3).
Fig. S7 Cell viability assay of MCF-7 cells upon treatment with erastin (10 µM) using MTT assay (n=5). Error bars indicate ± S.E.M. Statistical analysis was performed by the Studentʹs t-test (n = 5). n.s. = not significant.
01020304050
control erastin
Tota
l iro
n (n
g/10
6 cel
ls) n.s.
020406080100120
2 6 12Time (h)
Viab
ility
(%co
ntro
l)
n.s.n.s.

S6
Fig. S8 Multi-colour fluorescence microscopic analyses of labile Fe(II) in mitochondria (green), lysosomes (yellow), and ER (magenta) in MCF-7 cells. (a) Representative images of the control cells (upper) and the cells treated with erastin (10 µM) in the absence (middle) and the presence (bottom) of DFO (100 µM) at 37 °C for (a) 2 h, (c) 3 h, and (e) 5 h. Left to right: images acquired by differential interference contrast (DIC) and by using filter sets to detect Fe(II) in mitochondria (green), lysosome (yellow), and ER (magenta). (b–f) Quantification of images of each channel in (a), (c), and (e). Light grey: Control. Grey: Erastin-treated cells, Dark grey: Erastin-treated cells in the presence of DFO. Error bars indicate ± S.E.M. Statistical analysis was performed by the Studentʹs t-test. *P < 0.05, **P < 0.01 (n = 3). Scale bars indicate 25 µm.