Embed Size (px)
Citation preview
Research Institute of Organic Agriculture [email protected], www.fibl.org
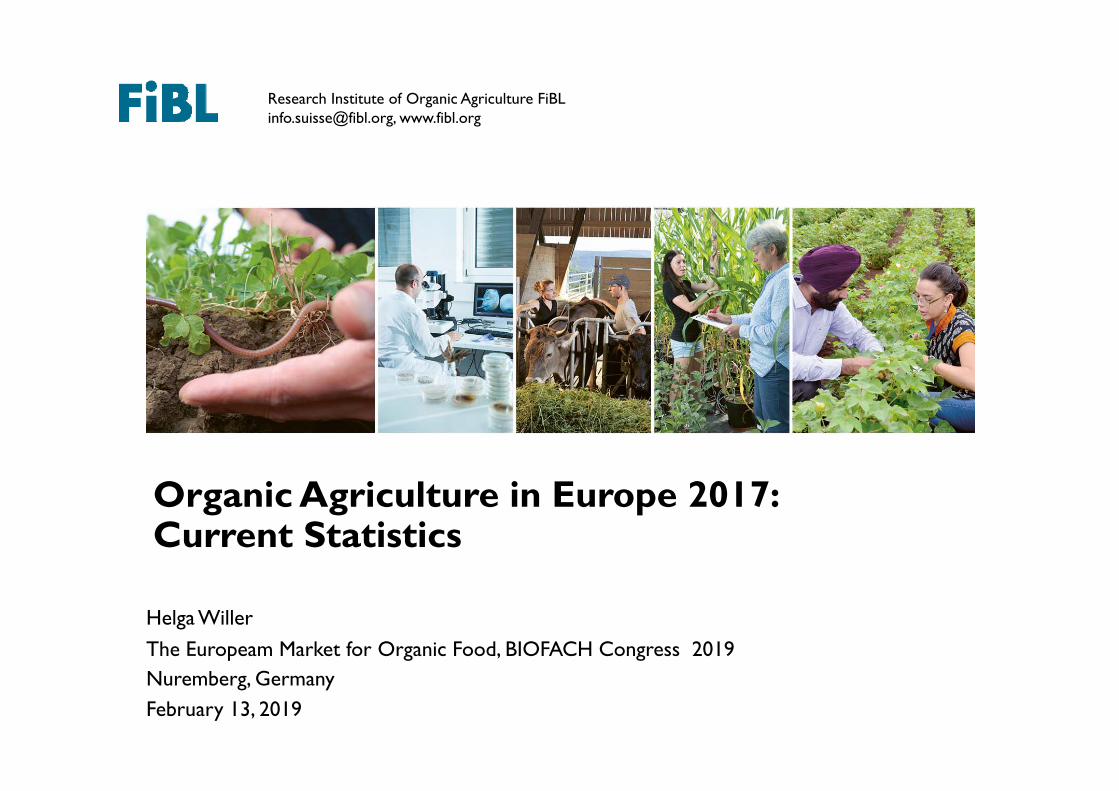
Organic Agriculture in Europe 2017: Current Statistics
February 13, 2019Nuremberg, GermanyThe Europeam Market for Organic Food, BIOFACH Congress 2019Helga Willer
www.fibl.org
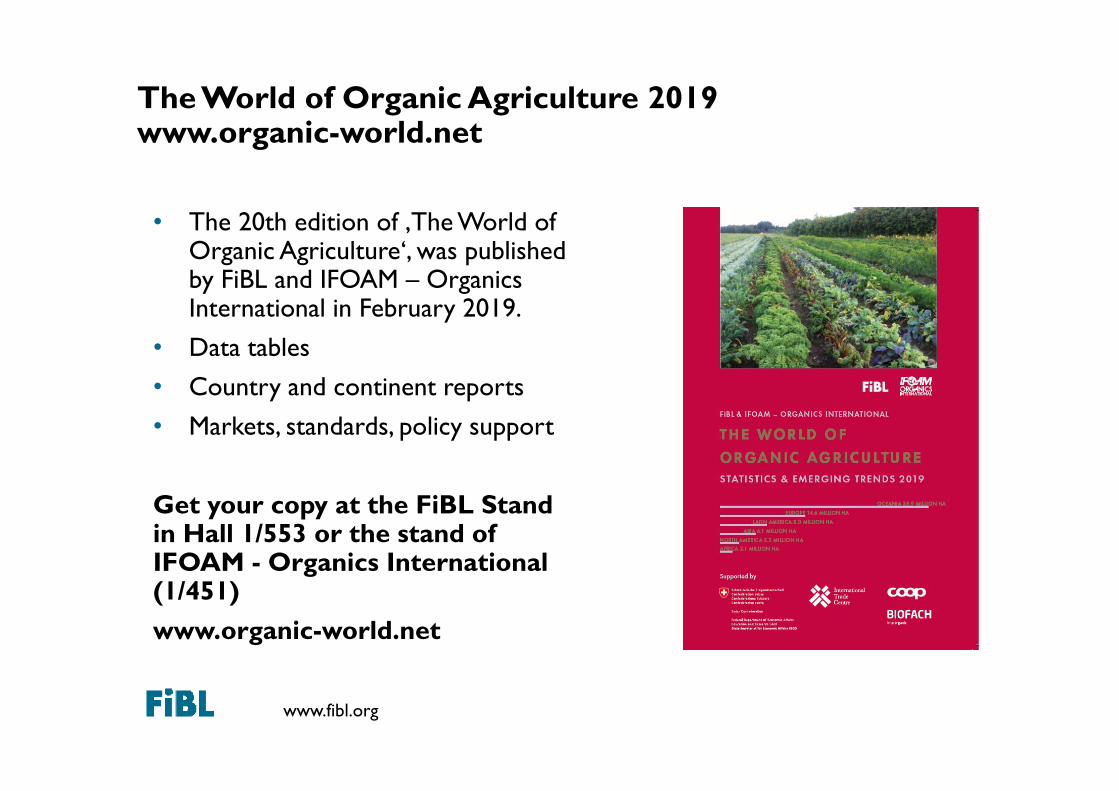
The World of Organic Agriculture 2019www.organic-world.net
• The 20th edition of ‚The World of Organic Agriculture‘, was published by FiBL and IFOAM – Organics International in February 2019.
• Data tables• Country and continent reports• Markets, standards, policy support
Get your copy at the FiBL Stand in Hall 1/553 or the stand of IFOAM - Organics International (1/451)www.organic-world.net
www.fibl.org
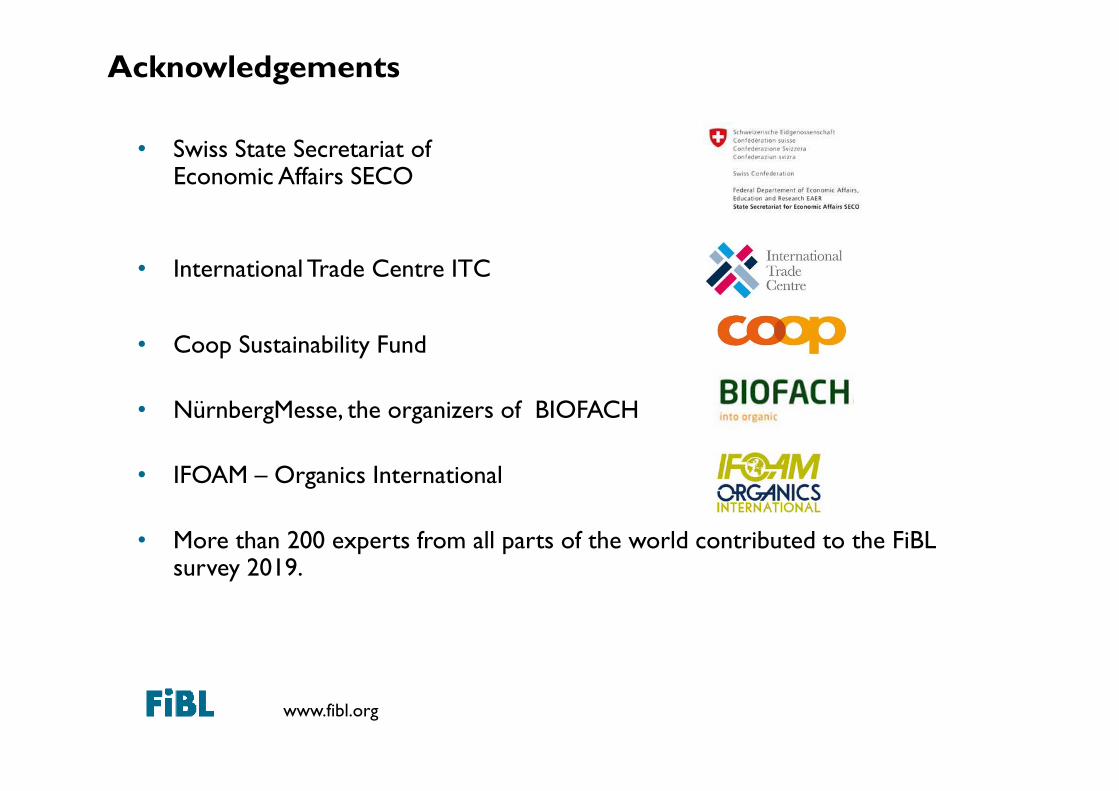
Acknowledgements
• Swiss State Secretariat of Economic Affairs SECO
• International Trade Centre ITC
• Coop Sustainability Fund
• NürnbergMesse, the organizers of BIOFACH
• IFOAM – Organics International
• More than 200 experts from all parts of the world contributed to the FiBL survey 2019.
www.fibl.org
Another record year for organic in Europe and worldide -highlights 2017
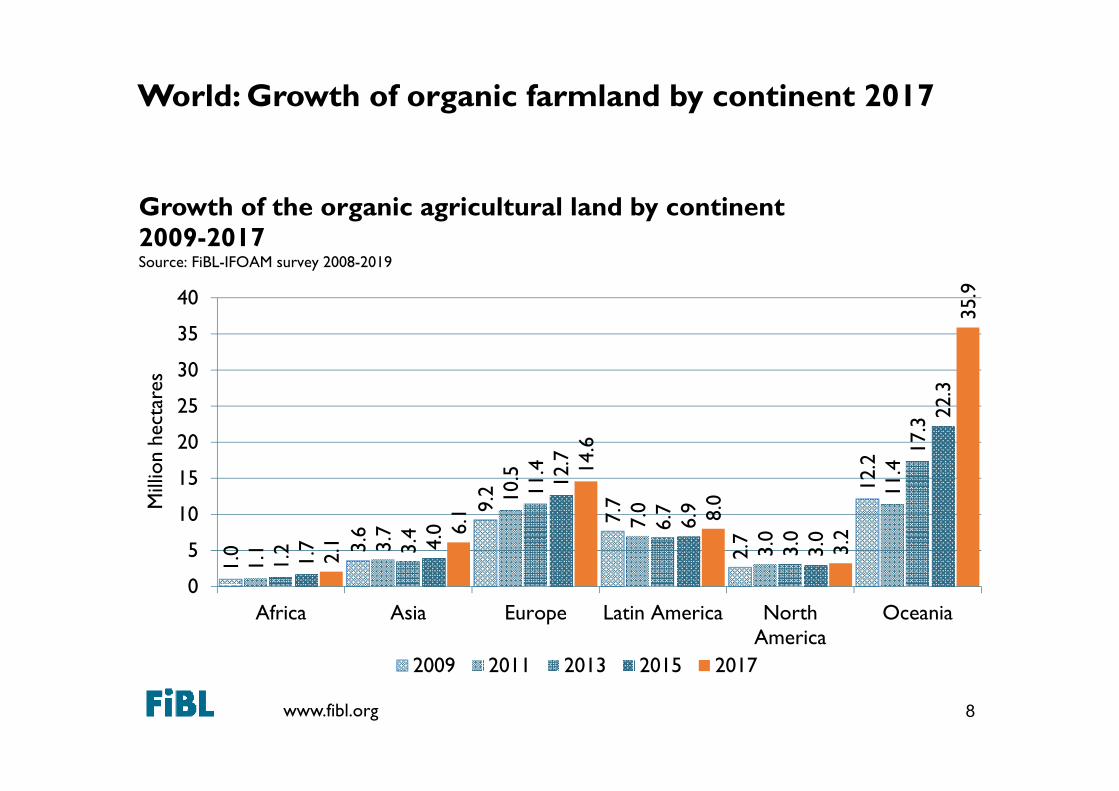
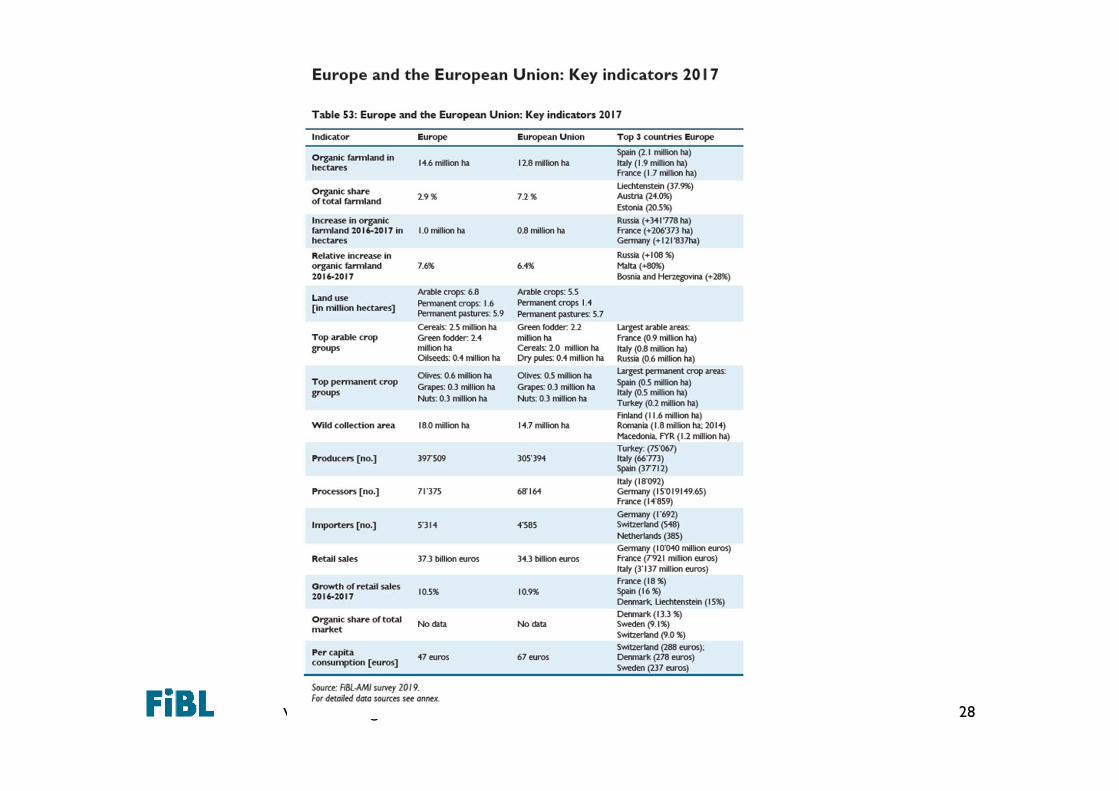
› Organic agricultural land reached an all time high with 14.6 million hectares
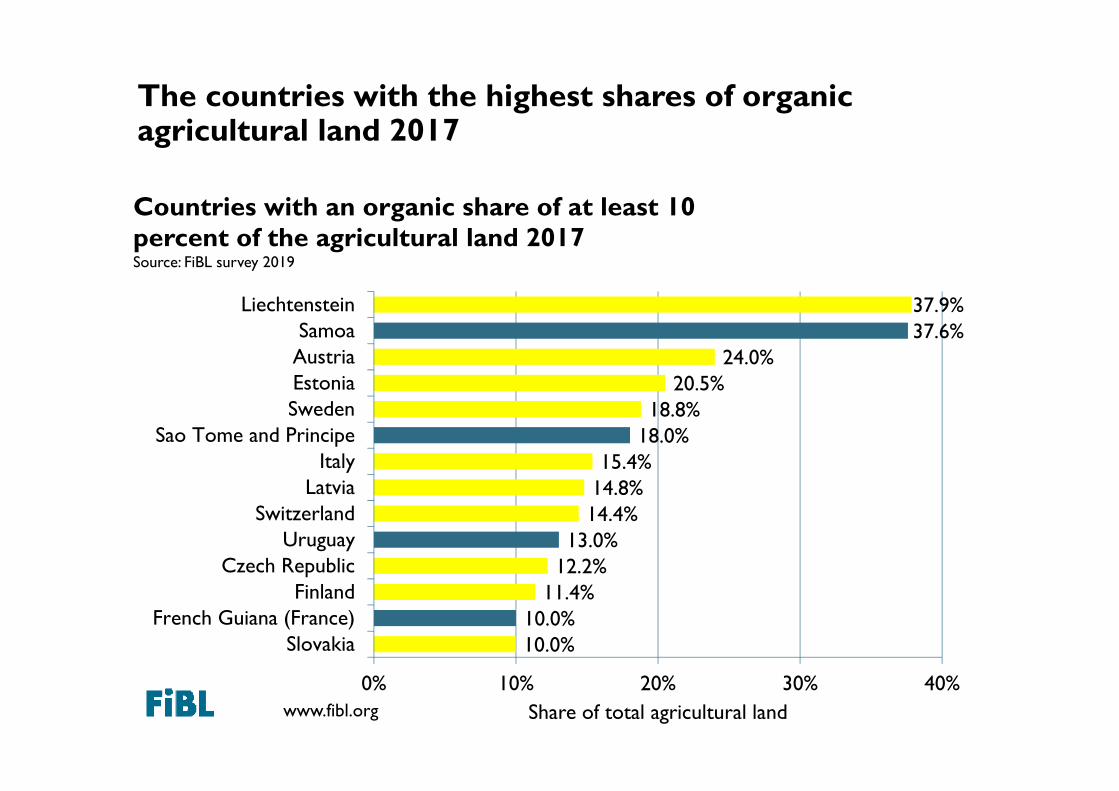
› 2.9 percent of the agricultural land is organic› In 10 countries 10 percent or more of the farmland is organic › 0.4 million producers were reported – another all time high› The market exceeded 37.3 billion Euros› The following slides show, where Europe stands in a global context
(marked yellow)
www.fibl.org
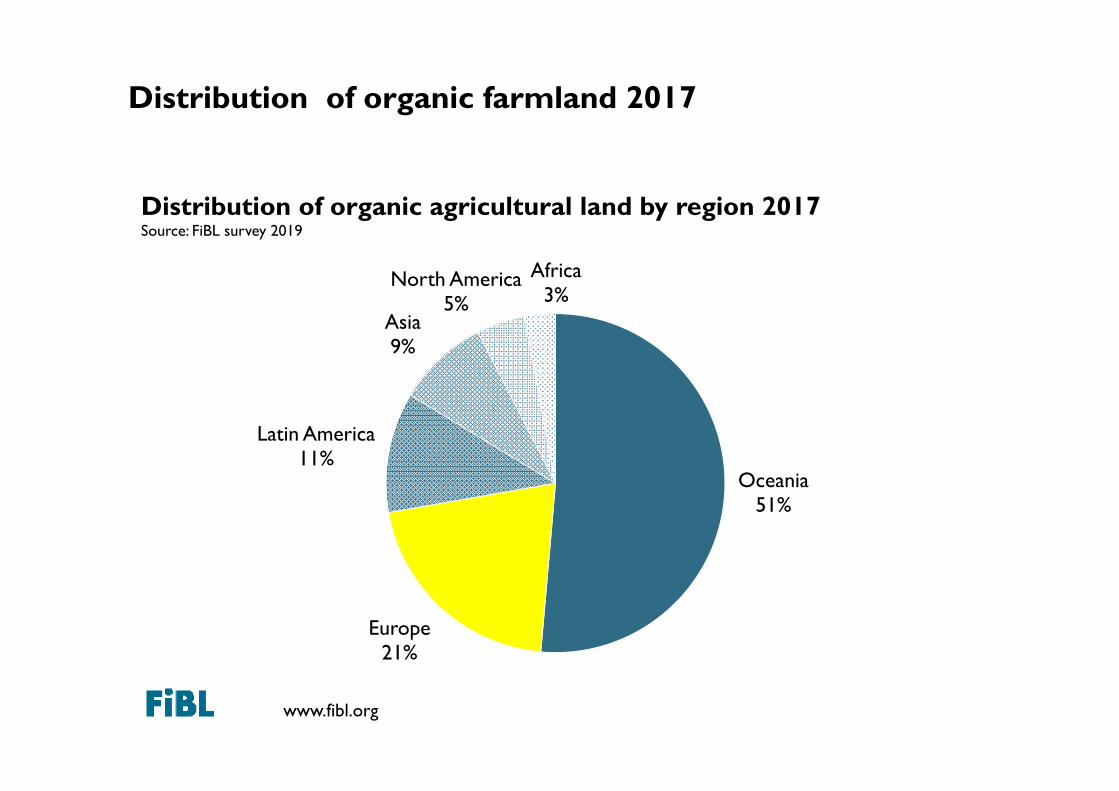
Distribution of organic farmland 2017
Oceania51%
Europe21%
Latin America11%
Asia9%
North America5%
Africa3%
Distribution of organic agricultural land by region 2017Source: FiBL survey 2019
www.fibl.org
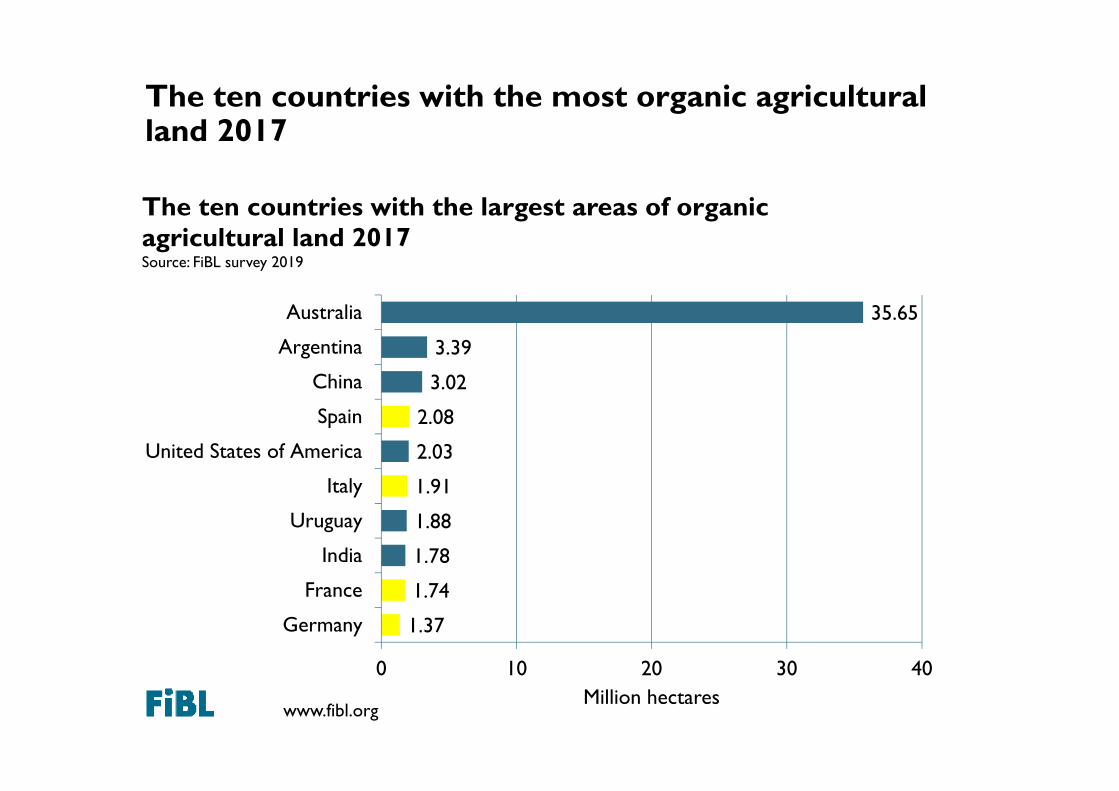
The ten countries with the most organic agricultural land 2017
1.37
1.74
1.78
1.88
1.91
2.03
2.08
3.02
3.39
35.65
0 10 20 30 40
Germany
France
India
Uruguay
Italy
United States of America
Spain
China
Argentina
Australia
Million hectares
The ten countries with the largest areas of organic agricultural land 2017Source: FiBL survey 2019
www.fibl.org
The countries with the highest shares of organic agricultural land 2017
10.0%10.0%
11.4%12.2%13.0%
14.4%14.8%15.4%
18.0%18.8%
20.5%24.0%
37.6%37.9%
0% 10% 20% 30% 40%
SlovakiaFrench Guiana (France)
FinlandCzech Republic
UruguaySwitzerland
LatviaItaly
Sao Tome and PrincipeSwedenEstoniaAustriaSamoa
Liechtenstein
Share of total agricultural land
Countries with an organic share of at least 10 percent of the agricultural land 2017Source: FiBL survey 2019
www.fibl.org
World: Growth of organic farmland by continent 2017
8
1.0 3.
6
9.2
7.7
2.7
12.2
1.1 3.
7
10.5
7.0
3.0
11.4
1.2 3.
4
11.4
6.7
3.0
17.3
1.7 4.
0
12.7
6.9
3.0
22.3
2.1
6.1
14.6
8.0
3.2
35.9
0
5
10
15
20
25
30
35
40
Africa Asia Europe Latin America NorthAmerica
Oceania
Mill
ion
hect
ares
Growth of the organic agricultural land by continent 2009-2017Source: FiBL-IFOAM survey 2008-2019
2009 2011 2013 2015 2017
www.fibl.org
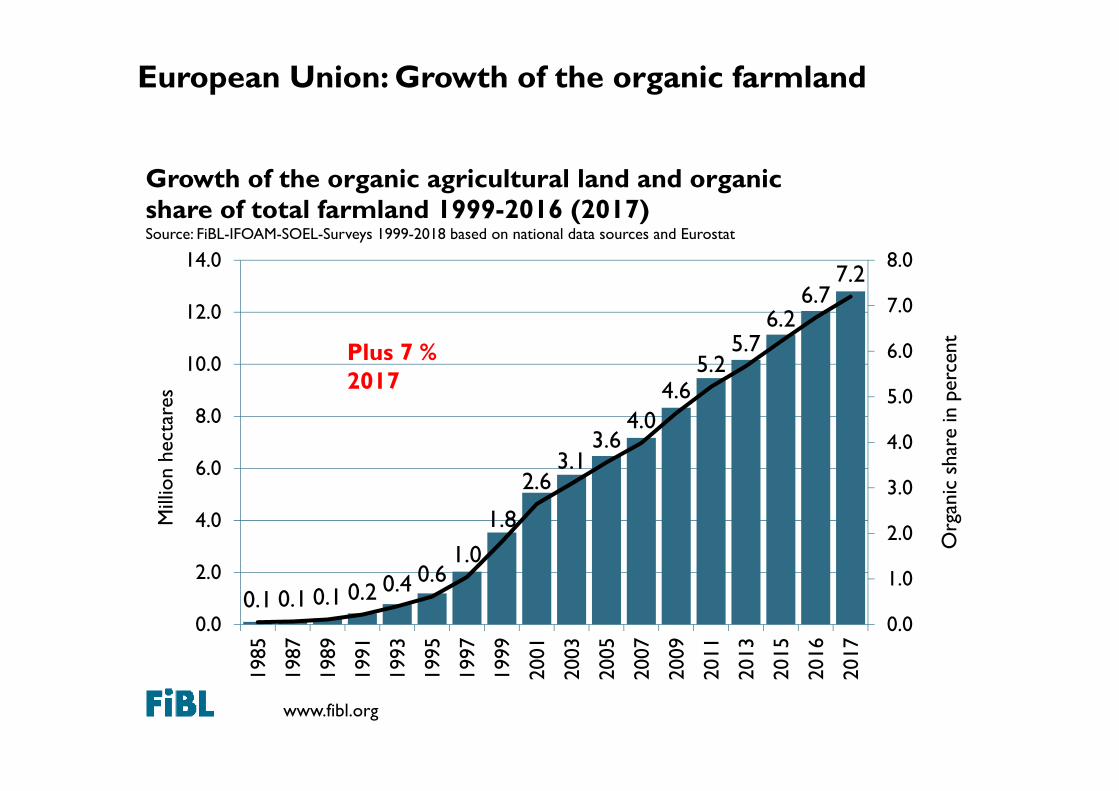
European Union: Growth of the organic farmland
0.1 0.1 0.1 0.2 0.4 0.61.0
1.8
2.63.1
3.64.0
4.65.2
5.76.2
6.77.2
0.0
1.0
2.0
3.0
4.0
5.0
6.0
7.0
8.0
0.0
2.0
4.0
6.0
8.0
10.0
12.0
14.019
85
1987
1989
1991
1993
1995
1997
1999
2001
2003
2005
2007
2009
2011
2013
2015
2016
2017
Org
anic
sha
re in
per
cent
Mill
ion
hect
ares
Growth of the organic agricultural land and organic share of total farmland 1999-2016 (2017)Source: FiBL-IFOAM-SOEL-Surveys 1999-2018 based on national data sources and Eurostat
Plus 7 % 2017
www.fibl.org
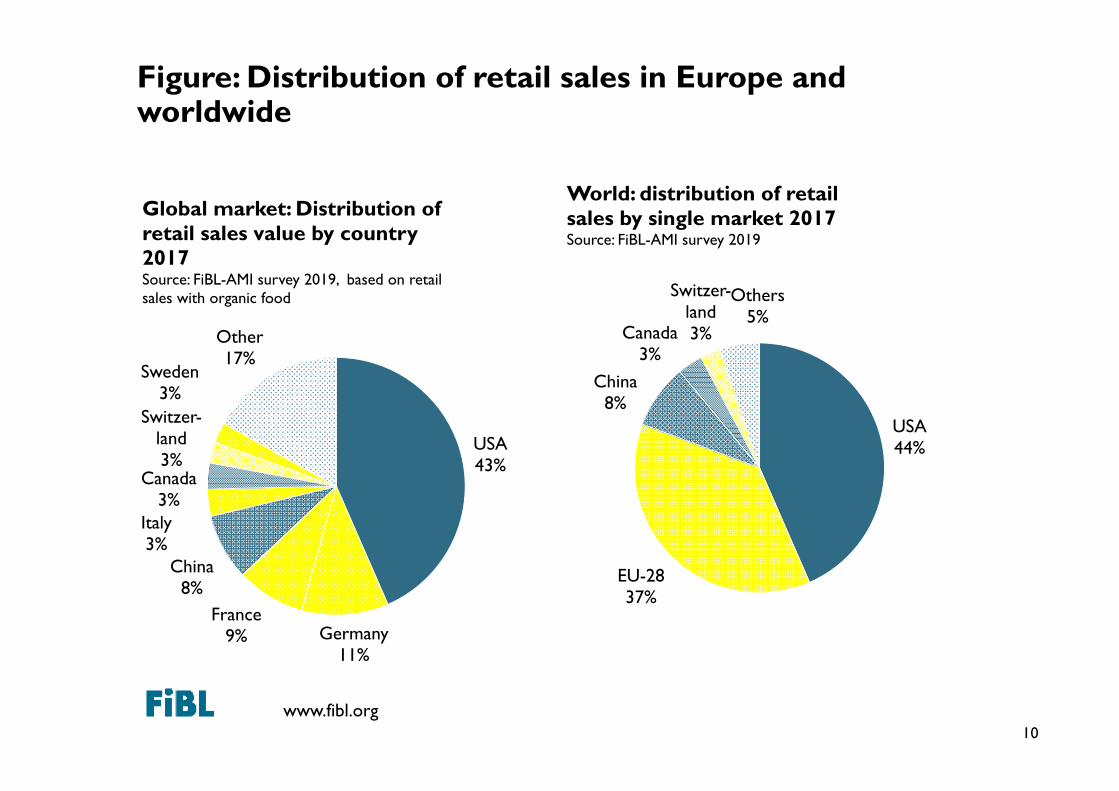
Figure: Distribution of retail sales in Europe and worldwide
10
USA44%
EU-2837%
China8%
Canada3%
Switzer-land3%
Others5%
World: distribution of retail sales by single market 2017Source: FiBL-AMI survey 2019
USA43%
Germany11%
France9%
China8%
Italy3%
Canada3%
Switzer-land3%
Sweden3%
Other17%
Global market: Distribution of retail sales value by country 2017Source: FiBL-AMI survey 2019, based on retail sales with organic food
www.fibl.org
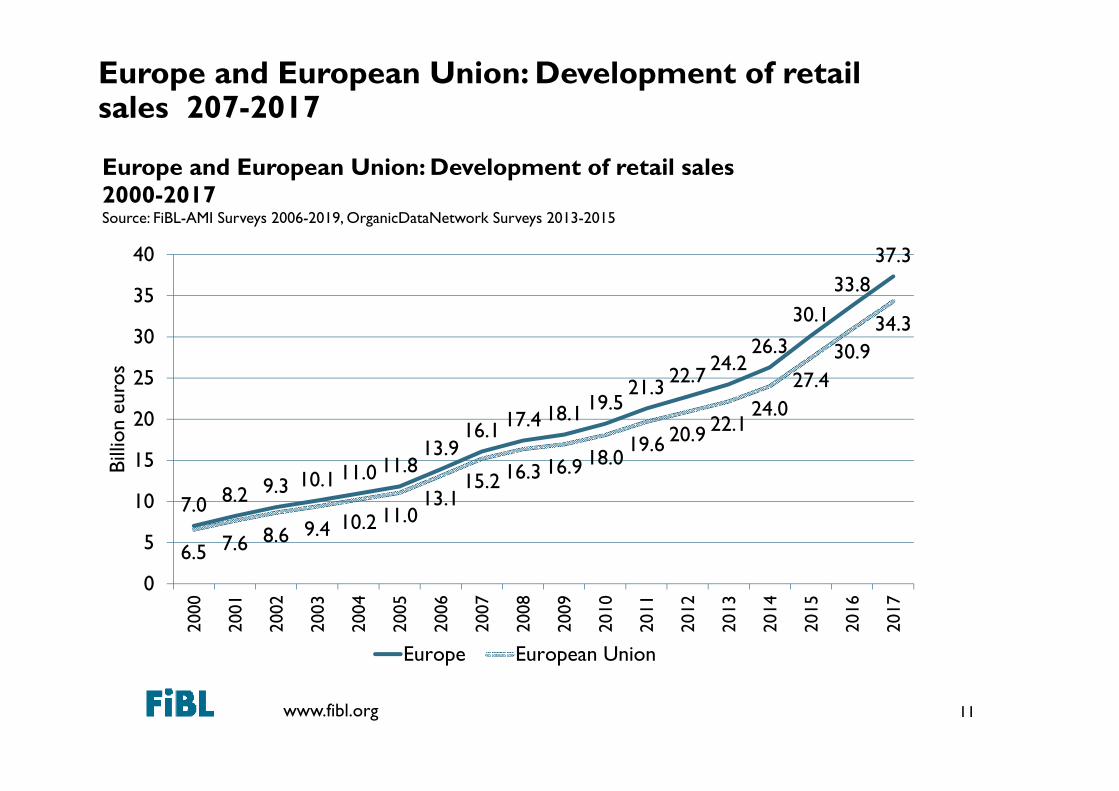
7.0 8.2 9.3 10.1 11.0 11.813.9
16.1 17.4 18.1 19.521.3 22.7 24.2
26.330.1
33.837.3
6.5 7.6 8.6 9.4 10.2 11.013.1
15.2 16.3 16.9 18.019.6 20.9 22.1
24.027.4
30.934.3
0
5
10
15
20
25
30
35
40
2000
2001
2002
2003
2004
2005
2006
2007
2008
2009
2010
2011
2012
2013
2014
2015
2016
2017
Billi
on e
uros
Europe and European Union: Development of retail sales 2000-2017Source: FiBL-AMI Surveys 2006-2019, OrganicDataNetwork Surveys 2013-2015
Europe European Union
Europe and European Union: Development of retail sales 207-2017
11
www.fibl.org
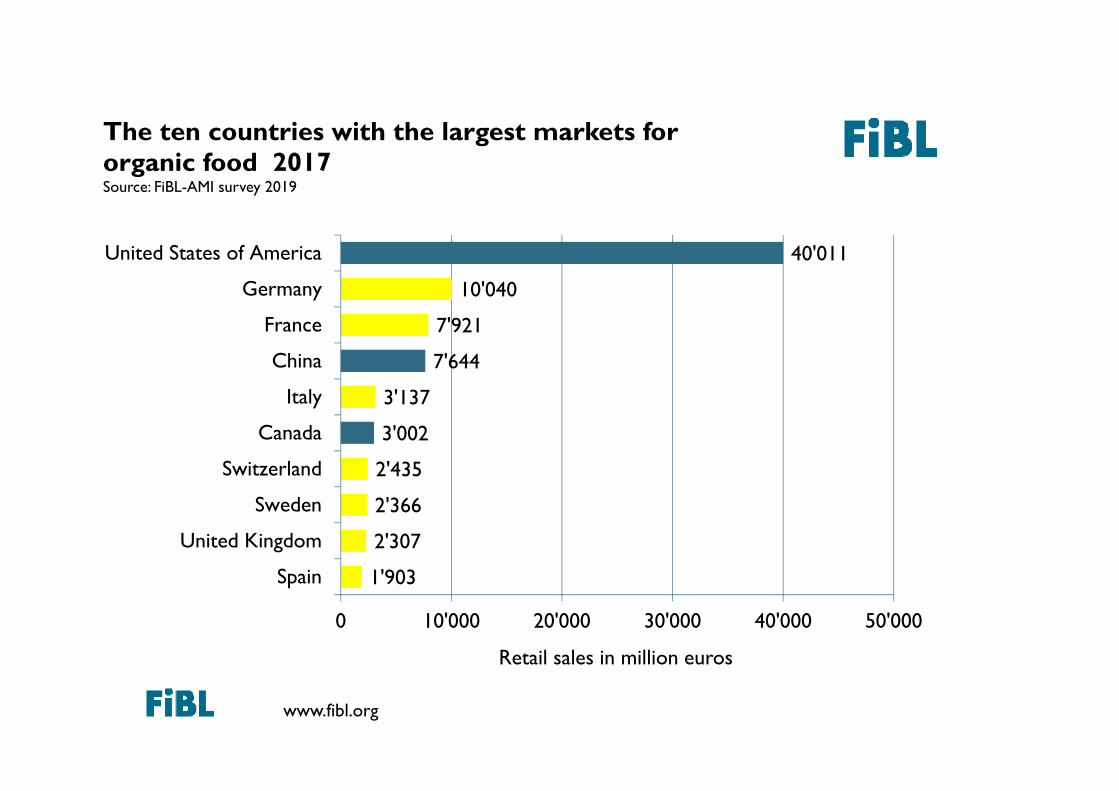
1'903
2'307
2'366
2'435
3'002
3'137
7'644
7'921
10'040
40'011
0 10'000 20'000 30'000 40'000 50'000
Spain
United Kingdom
Sweden
Switzerland
Canada
Italy
China
France
Germany
United States of America
Retail sales in million euros
The ten countries with the largest markets for organic food 2017Source: FiBL-AMI survey 2019
www.fibl.org
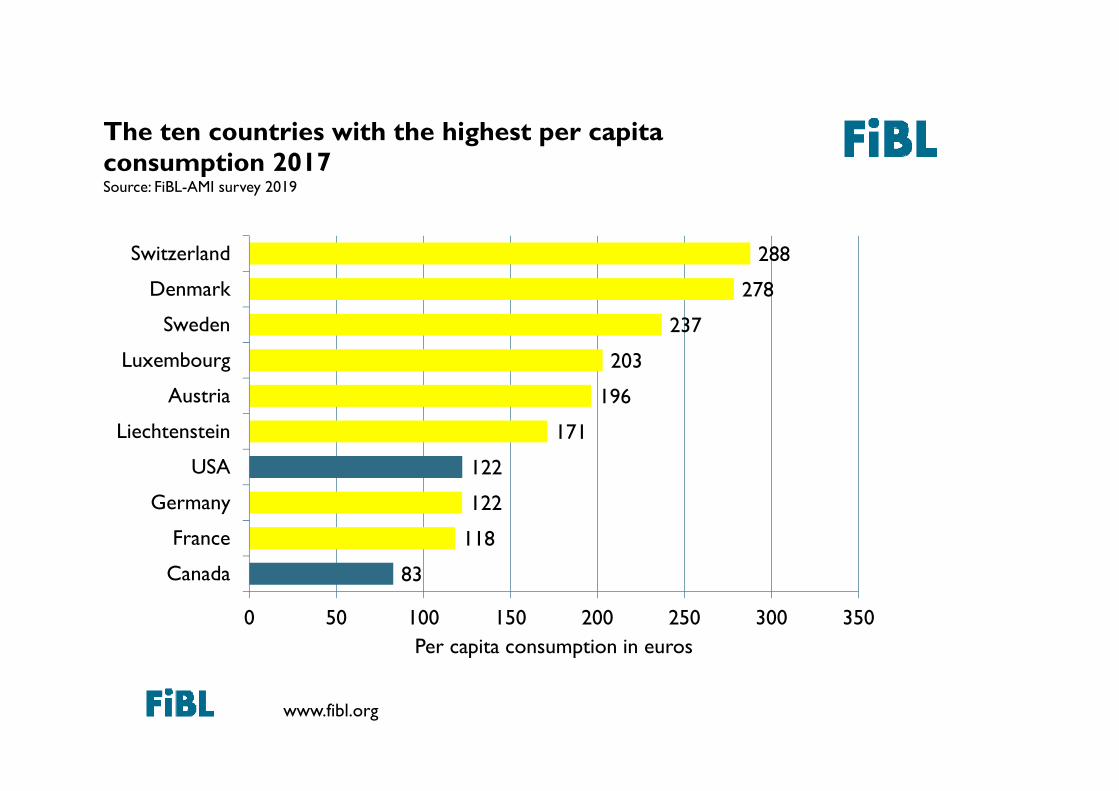
83
118
122
122
171
196
203
237
278
288
0 50 100 150 200 250 300 350
Canada
France
Germany
USA
Liechtenstein
Austria
Luxembourg
Sweden
Denmark
Switzerland
Per capita consumption in euros
The ten countries with the highest per capita consumption 2017Source: FiBL-AMI survey 2019
The ten countries with the largest per capita consumption for 2013
www.fibl.org
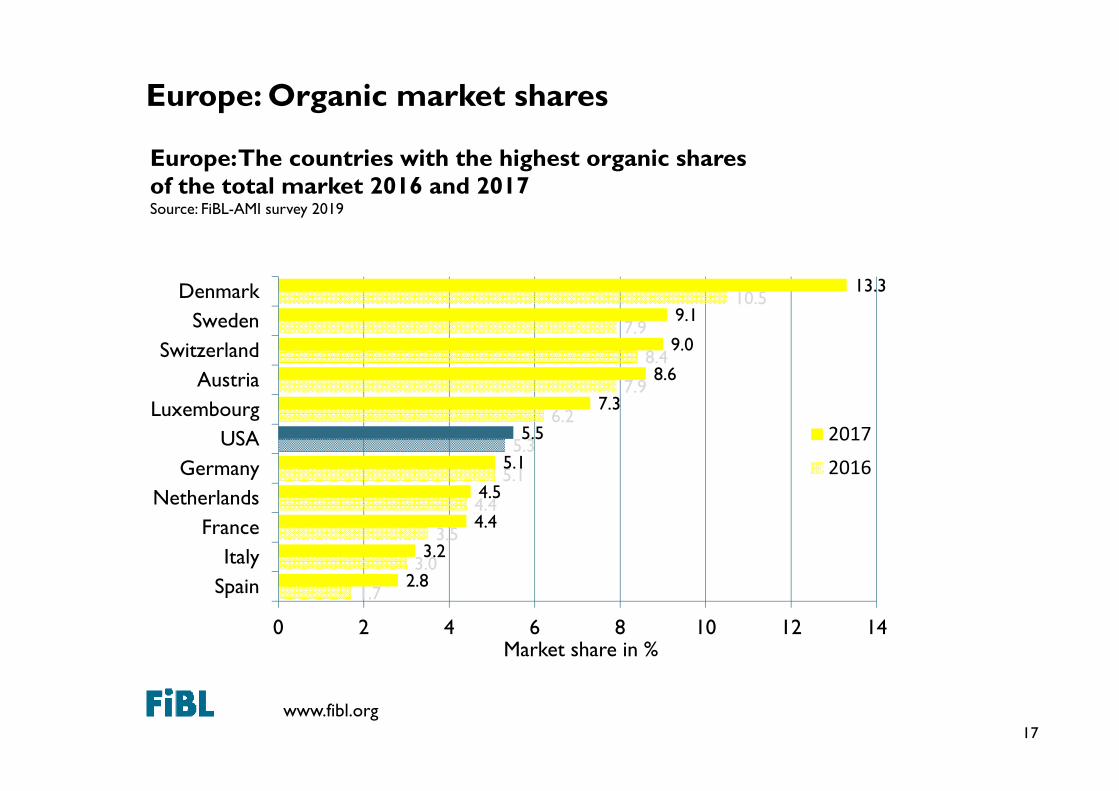
Europe: Organic market shares
17
1.7
3.0
3.5
4.4
5.1
5.3
6.2
7.9
8.4
7.9
10.5
2.8
3.2
4.4
4.5
5.1
5.5
7.3
8.6
9.0
9.1
13.3
0 2 4 6 8 10 12 14
SpainItaly
FranceNetherlands
GermanyUSA
LuxembourgAustria
SwitzerlandSweden
Denmark
Market share in %
Europe: The countries with the highest organic shares of the total market 2016 and 2017Source: FiBL-AMI survey 2019
2017
2016
www.fibl.org
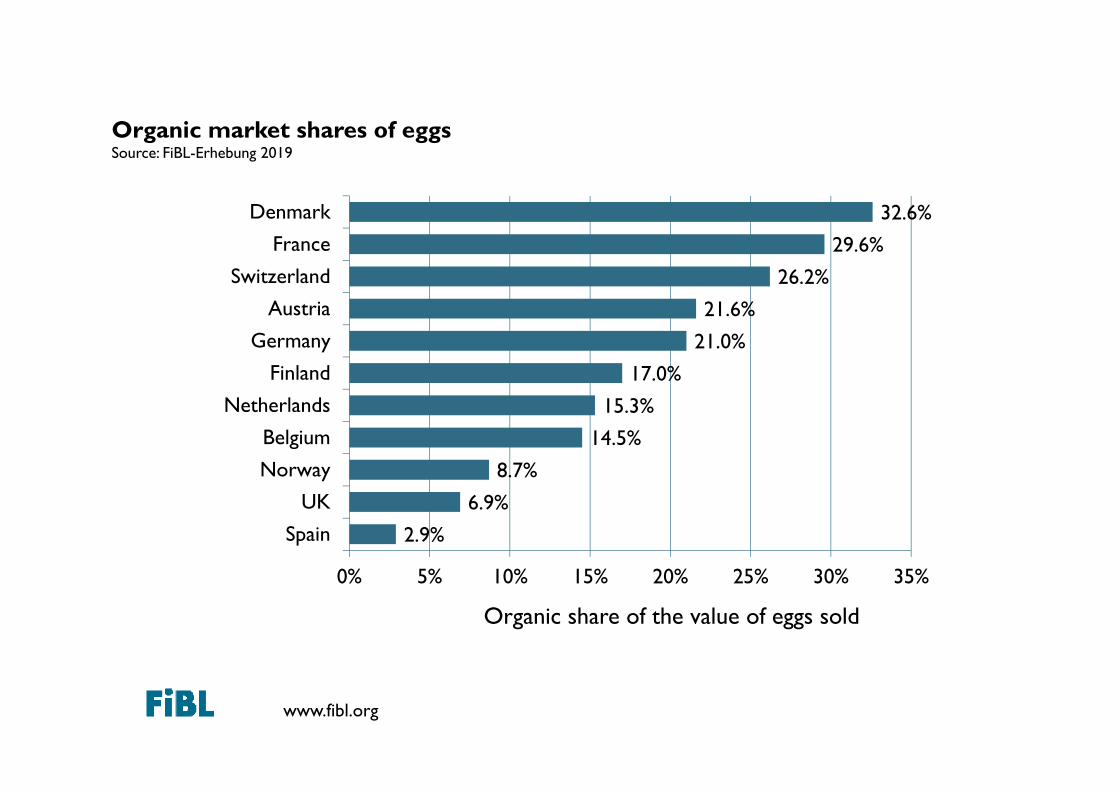
2.9%
6.9%
8.7%
14.5%
15.3%
17.0%
21.0%
21.6%
26.2%
29.6%
32.6%
0% 5% 10% 15% 20% 25% 30% 35%
Spain
UK
Norway
Belgium
Netherlands
Finland
Germany
Austria
Switzerland
France
Denmark
Organic share of the value of eggs sold
Organic market shares of eggsSource: FiBL-Erhebung 2019
www.fibl.org
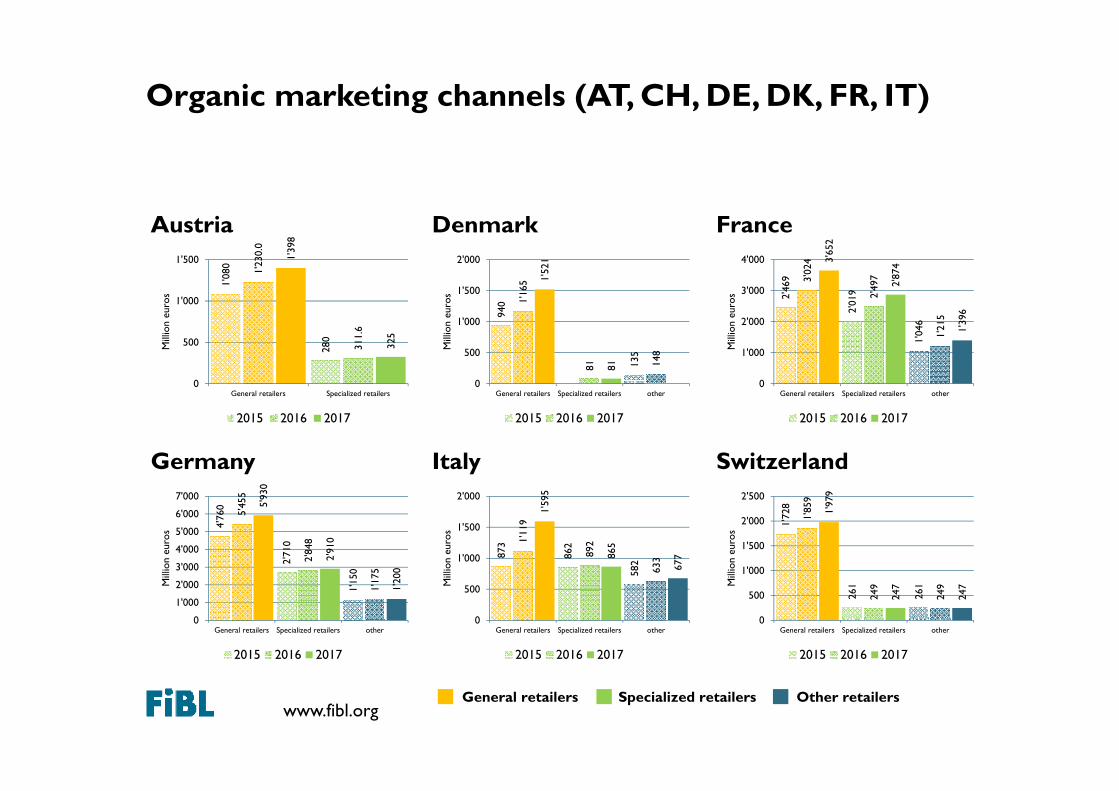
Organic marketing channels (AT, CH, DE, DK, FR, IT)
1'08
0
280
1'23
0.0
311.
6
1'39
8
325
0
500
1'000
1'500
General retailers Specialized retailers
Mill
ion
euro
s
Austria
2015 2016 2017
940
135
1'16
5
81 148
1'52
1
81
0
500
1'000
1'500
2'000
General retailers Specialized retailers other
Mill
ion
euro
s
Denmark
2015 2016 2017
2'46
9
2'01
9
1'04
6
3'02
4
2'49
7
1'21
5
3'65
2
2'87
4
1'39
6
0
1'000
2'000
3'000
4'000
General retailers Specialized retailers other
Mill
ion
euro
s
France
2015 2016 2017
4'76
0
2'71
0
1'15
0
5'45
5
2'84
8
1'17
5
5'93
0
2'91
0
1'20
0
0
1'000
2'000
3'000
4'000
5'000
6'000
7'000
General retailers Specialized retailers other
Mill
ion
euro
s
Germany
2015 2016 2017
873
862
582
1'11
9
892
633
1'59
5
865
677
0
500
1'000
1'500
2'000
General retailers Specialized retailers other
Mill
ion
euro
s
Italy
2015 2016 2017
1'72
8
261
261
1'85
9
249
249
1'97
9
247
247
0
500
1'000
1'500
2'000
2'500
General retailers Specialized retailers other
Mill
ion
euro
s
Switzerland
2015 2016 2017
General retailers Specialized retailers Other retailers
www.fibl.org
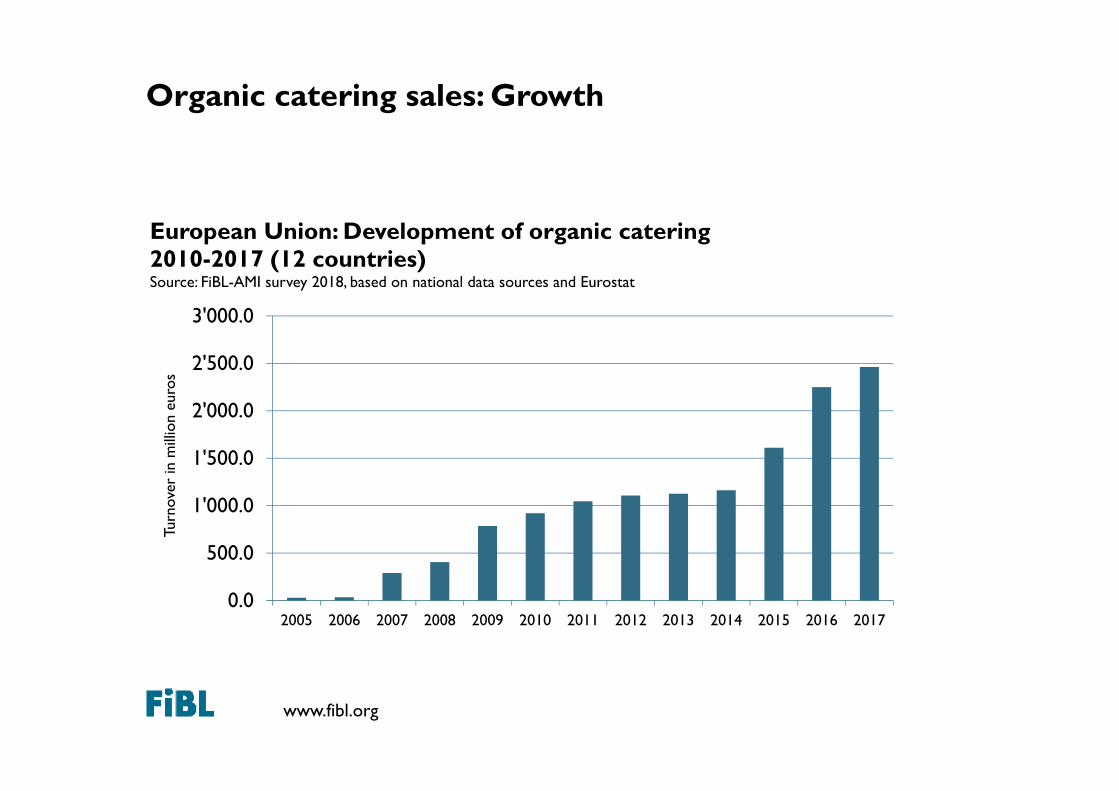
Organic catering sales: Growth
0.0
500.0
1'000.0
1'500.0
2'000.0
2'500.0
3'000.0
2005 2006 2007 2008 2009 2010 2011 2012 2013 2014 2015 2016 2017
Turn
over
in m
illio
neu
ros
European Union: Development of organic catering 2010-2017 (12 countries)Source: FiBL-AMI survey 2018, based on national data sources and Eurostat
www.fibl.org 21
www.fibl.org
Resources
• «The World of Organic Agriculture» at www.organic-world.net
• Slides and infographics at www.organic-world.net• Twitter.com/fiblstatistics• Interactive maps at www.organic-world.net• Interactive data tables at statistics.fibl.org• Interactive map at www.ifoam-eu.org
22
www.fibl.org
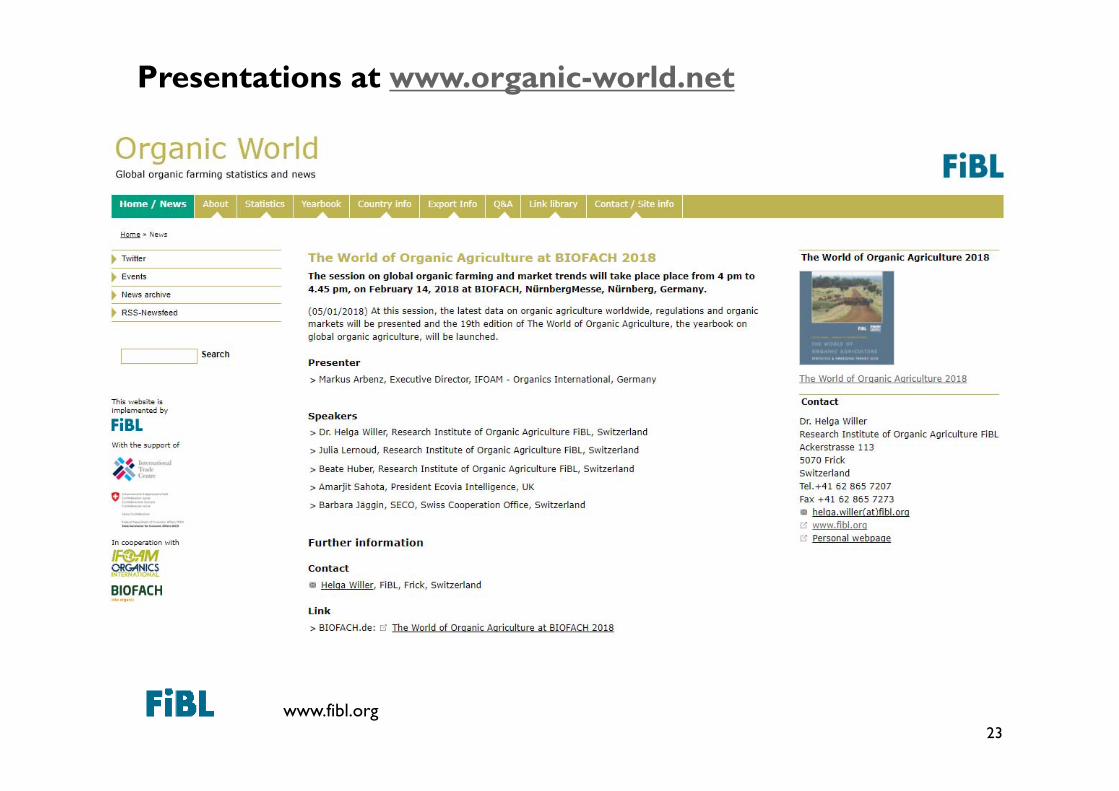
Presentations at www.organic-world.net
23
www.fibl.org
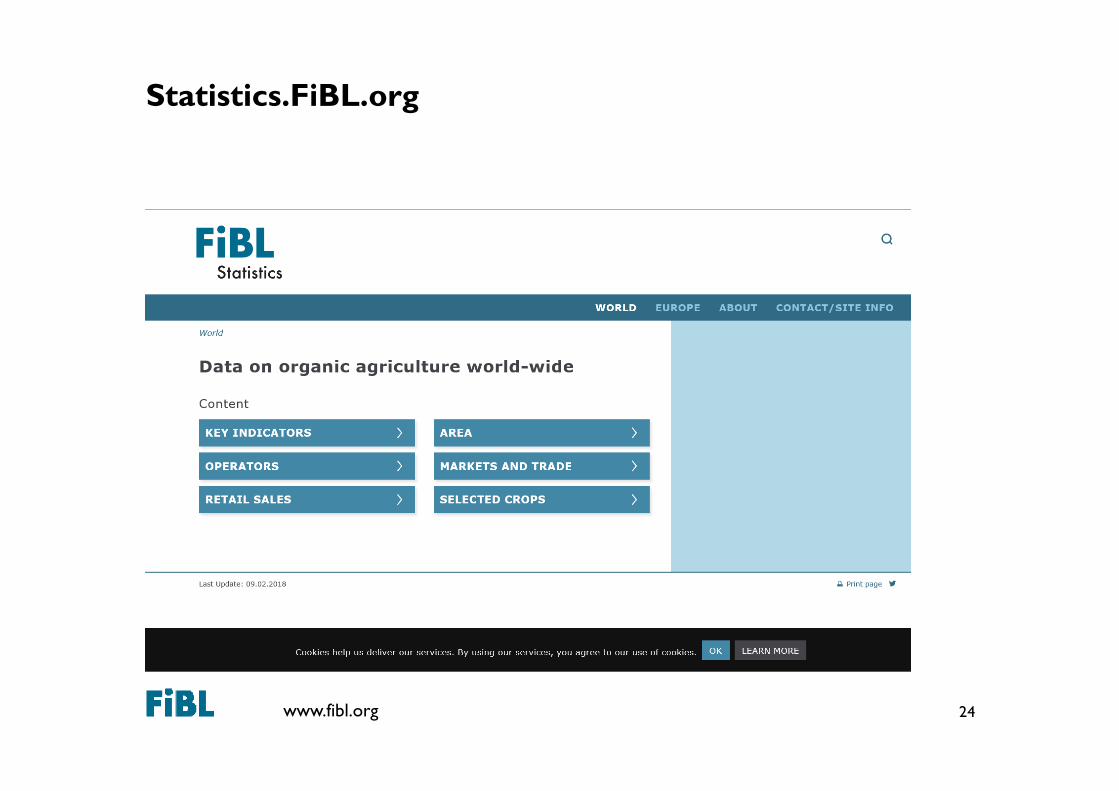
Statistics.FiBL.org
24
www.fibl.org
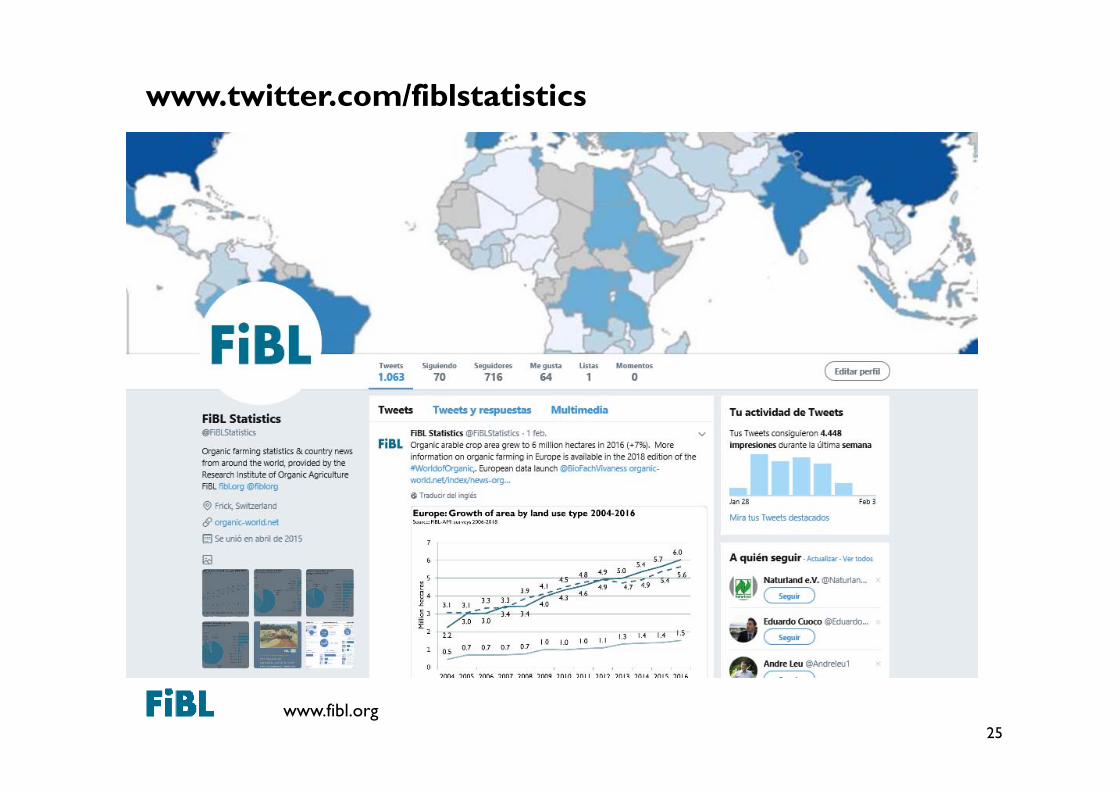
www.twitter.com/fiblstatistics
25
www.fibl.org
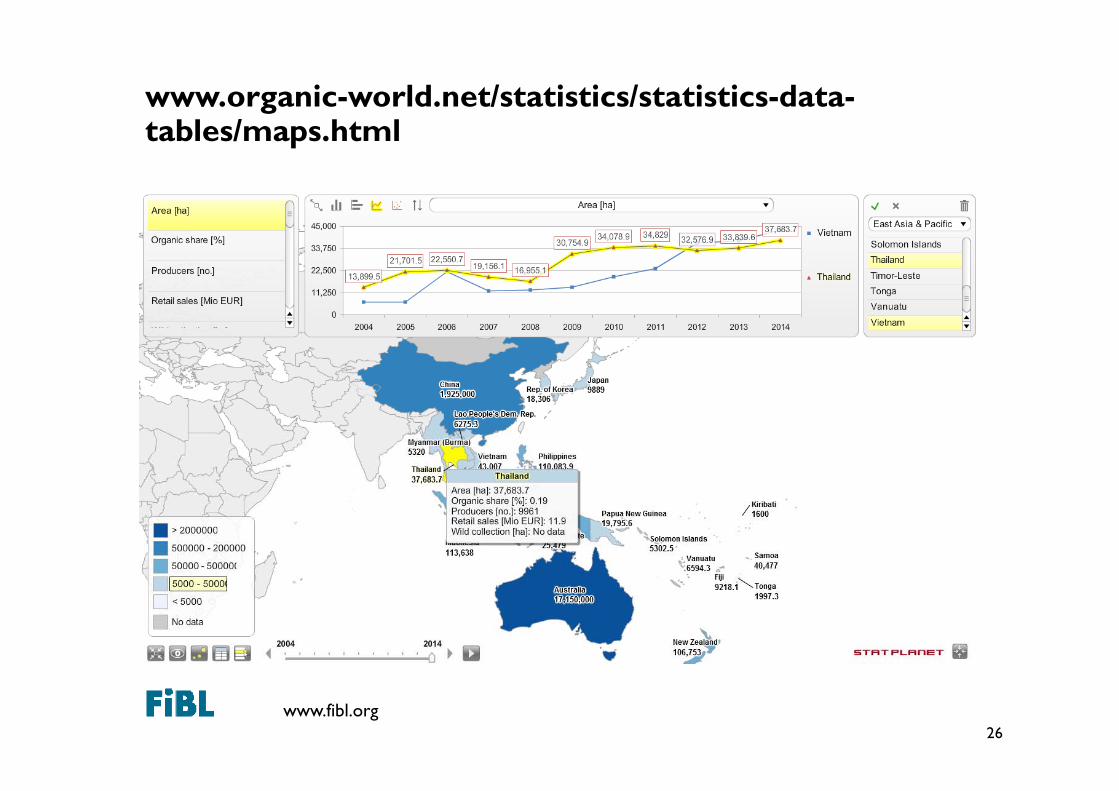
www.organic-world.net/statistics/statistics-data-tables/maps.html
26
www.fibl.org 28