Embed Size (px)
Citation preview

Research Institute of Organic AgricultureForschungsinstitut für biologischen LandbauInstitut de recherche de l‘agriculture biologique
Organic Agriculture Worldwide: Key results from the FiBL survey on organic agriculture worldwide 2017Part 3: Organic agriculture in the regions 2015
Julia Lernoud and Helga WillerResearch Institute of Organic Agriculture (FIBL), Frick, Switzerland© FiBL 2017

www.fibl.org
Organic Agriculture Worldwide: Key results from the FiBL-IFOAM survey on organic agriculture worldwide 2017: Part 3: Organic agriculture in the regions 2015
2
› Data compiled by the Research Institute of Organic Agriculture FiBL, Frick, Switzerland, based on national data sources and data from certifiers.
› Data as published February 2017 in FiBL & IFOAM – Organics International (2017) The World of Organic Agriculture. Statistics and Emerging Trends 2017. Frick and Bonn
› For updates check www.organic-world.net› This presentation is available online at: http://www.organic-
world.net/yearbook/yearbook2017/slide-presentations.html› Texts and graphs: Helga Willer and Julia Lernoud; Research Institute of
Organic Agriculture FiBL, Frick, Switzerland › Contact: Helga Willer, [email protected], and Julia Lernoud,
[email protected], Research Institute of Organic Agriculture, FiBL, Frick, Switzerland.
› © Research Institute of Organic Agriculture (FiBL), Frick, Switzerland, February, 2017

www.fibl.org
Acknowledgements*› The Swiss State Secretariat of
Economic Affairs SECO, Berne
› International Trade Centre ITC
› Nürnberg Messe, the organizers of the BIOFACH World Organic Trade Fair
› 200 experts from all parts of the world contributed to the FiBL survey 2017.
* See also disclaimer on last page of this slide show
3

www.fibl.org
The World of Organic Agriculture 2017
4
› The 17th edition of ‚The World of Organic Agriculture‘, was published by FiBL and IFOAM in February 2017.*
› Contents:
› Results of the survey on organic agriculture worldwide;
› Organic agriculture in the regions and country reports; Australia, Canada, Kenya, the Pacific Islands, and The United States of America.
› Chapters on the global market, standards & legislations, voluntary standards, PGS, policy support, European market.
› Numerous tables and graphs.
› New additions: › Metadata on the FiBL survey› Chapter on organic cotton production by Textile
Exchange› Overview of the organic and Fairtrade markets
› The book can be ordered via IFOAM.bio and shop.FiBL.org.
› *Willer, H, Lernoud, J, (2017) The World of Organic Agriculture. Statistics and Emerging Trends 2017. FiBL, Frick, and, IFOAM – Organics International, Bonn

www.fibl.org
Website www.organic-world.net
› Detailed statistics in excel format
› Graphs & maps› Data revisions› News and
backgroundinformation
5

www.fibl.org
About this presentation
› There are 3 presentations summarizing the key results of the FiBL survey on organic agriculture worldwide 2017 (data 2015). Apart from the global data, key results on crop and on regional data are presented.
› More information is available at www.organic-world.net
› The following three presentations are available at http://www.organic-world.net/yearbook/yearbook2017/slide-presentations.html :› Part 1: Global data 2015 and survey background
› Part 2: Land use and key crops in organic agriculture 2015
› Part 3: Organic agriculture in the regions 2015
6

www.fibl.org
The 18th Survey on organic agriculture world-wide
7
› The 18th survey on organic agriculture worldwide was carried out by the Research Institute of Organic Agriculture FiBL in cooperation with partners from all around the world. The results were published jointly by FiBL and IFOAM – Organics International.
› The survey was carried out between July 2016 and February 2017.
› Data were received from 179 countries.
› New countries included: Brunei Darussalam, Cape Verde, Hong Kong, Kuwait, Monaco, Sierra Leone, and Somalia.
› Updated data on area and producers were available for 161 countries.
› Data was provided by almost 200 country experts (representatives from NGOs, certification bodies, governments, researchers).
› The following data was collected: area data (including land use and crop details); producers, other operator types; domestic market values; export and import data; and livestock data (animal heads and production in metric tons);
› The results are published in the yearbook “The World of Organic Agriculture 2017” and at www.organic-world.net.

www.fibl.org
Africa: Organic agricultural land by country 2015
8Source: FiBL survey 2017, based on national sources and data from certifiers.

www.fibl.org
Africa: Organic agriculture in Africa 2015
› In Africa, there were 1.7 million hectares of certified organic agricultural land (data 2015).
› This constitutes about three percent of the world’s organic agricultural landand 0.1 percent of the total agricultural area in the region.
› 719’000 producers were reported.
› The countries with the most organic land are Tanzania (268’729 hectares), Uganda (241’150 hectares), and Ethiopia (186’155 hectares).
› The highest shares of organic land are in Sao Tome and Prince (13.8 percent), Egypt (2.3 percent), and Uganda (1.7 percent).
› The majority of certified organic produce in Africa is destined for export markets.
› The European Union, as the major recipient of these exports, is Africa’s largest market for agricultural produce.
9Source: FiBL survey 2017

www.fibl.org
Africa: Development of organic agricultural land 2000-2015
10
0.050.23
0.32 0.360.51 0.49
0.680.86 0.89
1.00 1.08 1.071.15 1.21
1.26
1.69
0.00.20.40.60.81.01.21.41.61.8
2000
2001
2002
2003
2004
2005
2006
2007
2008
2009
2010
2011
2012
2013
2014
2015
Million he
ctares
Africa: Development of organic agricultural land 2000 to 2015Source: FiBL‐IFOAM‐SOEL 2001‐2017

www.fibl.org
Africa: The ten countries with the most organic agricultural land 2015
11
40'07885'00094'386
120'929130'000
145'629150'479
186'155241'150
268'729
0 100'000 200'000 300'000
Côte d'IvoireEgypt
Congo DRMadagascarSudan (2014)
TunisiaKenya
EthiopiaUgandaTanzania
Hectares
Africa: The ten countries with the largest organic area 2015Source: FiBL survey 2017

www.fibl.org
Africa: Distribution of organically managed agricultural land by country 2015
268'72916%
241'15014%
186'15511%
989'93459%
Africa: Distribution of organically managed agricultural land by country 2015 Source: FiBL survey 2017
TanzaniaUgandaEthiopiaRest
12

www.fibl.org
Africa: The ten countries with the highest organic share of total agricultural land 2015
13
0.5%0.5%0.6%0.7%1.2%1.4%1.5%1.7%2.3%
13.8%
0% 5% 10% 15%
EthiopiaKenya
Cape VerdeTanzaniaComorosTunisia
Réunion (France)UgandaEgypt
Sao Tome and Principe (2014)
Share of total agricultural land
Africa: The countries with the highest organic share of total agricultural land 2015Source: FiBL survey 2017

www.fibl.org
Africa: Use of organic agricultural land 2015
14
Permanent crops56%
Arable land crops24%
Perm. grassland
2%
Other/No details18%
Africa: Use of organic agricultural land 2015Source: FiBL survey 2017; based on information from the private sector, certifiers, and governments.
Land use types 2015
916
72127
156
0 100 200
Medicinal plantsDry pulses
CerealsTextile crops
Oilseeds
Thousand hectares
Key arable crops
110118128154
305
0 200 400
CocoaNuts
OlivesFruit, tropical/subtrop.
Coffee
Thousand hectares
Key permanent crops

www.fibl.org
Africa: The ten countries with the largest number of organic producers 2015
15
9'93310'05712'61918'39522'85033'15536'571
148'610190'670
203'602
0 50'000 100'000 150'000 200'000 250'000
Togo (2014)Zambia
Mali (2014)Senegal (2014)
MadagascarKenya
Congo DRTanzania (2014)
UgandaEthiopia
Producers
Africa: The ten countries with the largest number of organic producers 2015Source: FiBL survey 2017

www.fibl.org
Articles about Africa in the 2017 edition of "The World of Organic Agriculture"
› Latest Developments in Organic Agriculture in Africa,Jordan Gama
› Organic Farming in Kenya: Promising Growth and a Bright FutureRichard Ngunjiri
16

www.fibl.org
Asia: Organic agricultural land by country 2015
17Source: FiBL survey 2017, based on national sources and data from certifiers.

www.fibl.org
Asia: Organic Agriculture in Asia – Key Figures 2015
› The total organic agricultural area in Asia was 4 million hectares in 2015.
› This constitutes eight percent of the world’s organic agricultural land, and 0.2 percent of the total agricultural area in the region.
› There were more than 0.85 million producers reported. › The leading countries by organic agricultural land are
China (1.6 million hectares) and India (1.2 million hectares).
› Timor-Leste has the most organic agricultural area as a proportion of total agricultural land (almost seven percent).
18Source: FiBL survey 2017

www.fibl.org
Asia: Development of organic agricultural land 2000-2015
19
0.060.42 0.43 0.49
3.78
2.683.00 2.90
3.363.58
2.46
3.693.22 3.41
3.573.97
0.0
0.5
1.0
1.5
2.0
2.5
3.0
3.5
4.0
4.52000
2001
2002
2003
2004
2005
2006
2007
2008
2009
2010
2011
2012
2013
2014
2015
Million he
ctares
Asia: Development of organic agricultural land 2000 to 2015Source: FiBL‐IFOAM‐SOEL 2002‐2017

www.fibl.org
Asia: Distribution of organic agricultural land by country 2015 (total 4 million hectares)
1'609'928, 40%
1'180'000, 30%
303'381,8%
871'980, 22%
Africa: Distribution of organically managed agricultural land by country 2015 Source: FiBL survey 2017
China
India
Kazakhstan
Rest
20FiBL survey 2017

www.fibl.org
Asia: The ten countries with the most organic agricultural land 2015
21
36'48737'63045'58776'66696'318130'384
234'642303'381
1'180'0001'609'928
0 500'000 1'000'000 1'500'000 2'000'000
Saudi ArabiaAzerbaijanThailandViet NamSri LankaIndonesiaPhilippinesKazakhstan
IndiaChina
Hectares
Asia: The ten countries with the largest organic area 2015Source: FiBL survey 2017

www.fibl.org
Asia: The ten countries/territories with the highest shares of organic agricultural land 2015
22
0.8%0.8%1.0%1.1%1.1%1.3%
1.9%2.0%
3.5%6.6%
0% 1% 2% 3% 4% 5% 6% 7%
AzerbaijanTaiwan
Republic of KoreaIsrael
UAE (2014)Bhutan
PhilippinesPalestine, State of
Sri LankaTimor‐Leste
Share of total agricultural land
Asia: The countries with the highest organic share of total agricultural land 2015Source: FiBL survey 2017

www.fibl.org
Asia: Use of organic agricultural land 2015(total: 4 million hectares)
Arable land crops56%
Permanent crops19%
Permanent grassland
1%
Other/No details24%
Asia: Use of agricultural organic land 2015Source: FiBL survey 2017; based on information from the private sector, certifiers, and governments.
Land use types 2015
54155
298638
900
0 500 1'000
VegetablesGreen foddersTextile crops
OilseedsCereals
Thousand hectares
Key arable crops
6775110121
243
0 200 400
NutsTea
CoffeeTemperate fruit
Coconut
Thousand hectares
Key permanent crops
23

www.fibl.org
Articles about Asia in the 2017 Edition of "The World of Organic Agriculture"
› Development of the Organic Sector in Asia in 2016IFOAM Asia
24

www.fibl.org
Europe: Organic agricultural land by country 2015
25Source: FiBL survey 2017, based on national sources and Eurostat.

www.fibl.org
Organic agriculture in Europe: Key data/indicators 2015
› 12.7 million hectares of agricultural land are organic (including in conversion areas).
› This constitutes 2.5 percent of the agricultural land in Europe.
› The organic agricultural land increased by 0.96 million hectares or 8.2 percent in 2015.
› Almost 350’000 producers were reported.
26Source: FiBL survey 2017, based on national sources and Eurostat.

www.fibl.org
Organic agriculture in the European Union: Key data/indicators 2015
› 11.2 million hectares of agricultural land are organic (including in conversion areas).
› This constitutes 6.2 percent of the agricultural land in the European Union.
› The organic agricultural land increased by 0.8 million hectares or 7.8 percent in 2015.
› Almost 270’000 producers were reported.
27Source: FiBL survey 2017, based on national sources and Eurostat.

www.fibl.org
Organic market in Europe: Key data/indicators 2015
› The European market was 29.8 billion euros; 13 percent more than in 2014.
› The largest market for organic products in 2015 was Germany with a turnover of 8.6 billion euros, followed by France (5.5 billion euros) and the UK (2.6 billion euros).
› As a portion of the total market share, the highest levels have been reached in Denmark, Switzerland and Luxembourg, with six percent or more for organic products. The highest per capita spending is also in these countries.
28Source: FiBL survey 2017, based on national sources and Eurostat.

www.fibl.org
EUROPE: ORGANIC FARMLAND 2015
Spain
Italy
France
Germany
Others
0.0 0.5 1.0 1.5 2.0
1
2
3
4
5
Million hectares0% 20% 40%
0
2
4
6
8
10
12
14
1985 1995 2005 2015
Million he
ctares
2.4% of Europe s farmland is
organic (EU 6.2%)
Europe12.7
Million ha
Spain 1.97
Million ha
Half of Europe´s organic farmland is in 4 countries.
The country with the largest area of organic farmland is in Spain, followed by Italy and France.
Nine countries have 10% or more of their agricultural land under organic management.
In 2015, almost 1 million hectares morewere reported compared with 2014.
Source: FiBL survey 2017 www.organic‐world.net
Distribution of organic agricultural land by country 2015
Top 5 countries with the largest areas of organic agricultural land 2015
Top 5 countries , where more than10 percent of the farmland is organic 2015
Growth of the organic agricultural land 1985–2015
Italy
France
Germany
Poland
Spain Liechtenstein
Switzerland
Estonia
Sweden
Austria
Percentage
+74% in the decade 2006 to
2015
www.fibl.org
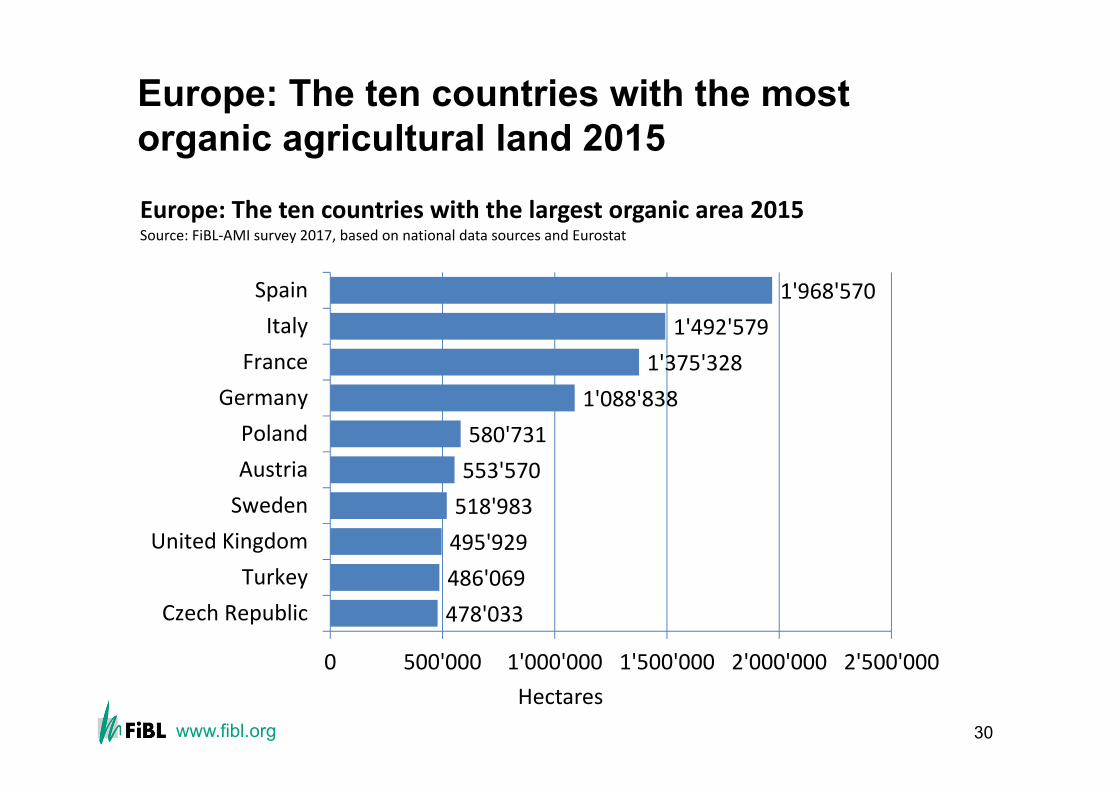
Europe: The ten countries with the most organic agricultural land 2015
30
478'033486'069495'929518'983553'570580'731
1'088'8381'375'328
1'492'5791'968'570
0 500'000 1'000'000 1'500'000 2'000'000 2'500'000
Czech RepublicTurkey
United KingdomSwedenAustriaPoland
GermanyFranceItalySpain
Hectares
Europe: The ten countries with the largest organic area 2015Source: FiBL‐AMI survey 2017, based on national data sources and Eurostat

www.fibl.org
Europe: Distribution of organically managed agricultural land by country 2015
15%
12%
11%
9%
53%
Europe: Distribution of organically managed agricultural land by country 2015 (Total: 12.7 million hectares)Source: FiBL‐AMI survey 2017, based on national data sources and Eurostat
SpainItalyFranceGermanyRest
31

www.fibl.org
Europe: Distribution of shares of organic land 2015
32
8 countries
9 countries17 countries
11 countries
Europe: Distribution of organic farmland shares 2015Source: FiBL‐AMI survey 2017
More than 10 percent organic land 5 to 10 percent organic land
1 to 5 percent organic land Less than 1 percent organic land

www.fibl.org
Europe: The ten countries with the highest shares of organic agricultural land 2015
33
9.60%10.00%11.30%11.70%12.8%13.1%
16.3%16.9%
21.3%30.2%
0% 10% 20% 30% 40%
SlovakiaFinland
Czech RepublicItaly
LatviaSwitzerland
EstoniaSwedenAustria
Liechtenstein
Share of total area
Europe: Shares of organic agricultural land by country 2015Source: FiBL‐AMI Survey 2017

www.fibl.org
Development of the organic agricultural land in Europe 1999-2015
34
0.1
0.1
0.1
0.2
0.2
0.3
0.4 0.6 0.8 1.0 1.3 1.6 2.1 2.6 3.
7 4.6 5.5 5.9 6.2 6.6 7.0 7.3 7.8 8.3 9.2 10
.0 10.5 11.2
11.4
11.8 12.7
0.0
2.5
5.0
7.5
10.0
12.5
15.0
1985
1986
1987
1988
1989
1990
1991
1992
1993
1994
1995
1996
1997
1998
1999
2000
2001
2002
2003
2004
2005
2006
2007
2008
2009
2010
2011
2012
2013
2014
2015
Million he
ctares
Europe: Development of organic agricultural land 1985‐2015Source: Lampkin, Nic, FiBL‐AMI surveys 2006‐2017, and OrganicDataNetwork surveys 2013‐2015, based on national data sources and Eurostat

www.fibl.org
European Union and Europe: Development of organic farmland 1985 to 2015
35
0.1 1.
0
7.0
12.7
6.5
11.2
0.0
2.5
5.0
7.5
10.0
12.5
15.0
1985198719891991199319951997199920012003200520072009201120132015
Million he
ctares
Europe and European Union: Development of organic agricultural land 1985‐2015Source: FiBL‐AMI Survey 2017, based on national data sources and Eurostat
Europe European Union

www.fibl.org
Europe: Growth of organic agricultural land by country group 2000-2015
36
0.0
2.0
4.0
6.0
8.0
10.0
12.0
14.0
2000200120022003200420052006200720082009201020112012201320142015
Million he
ctares
Europe: Growth of organic farmland by country group 2000‐2015Source: Lampkin, Nic, FiBL‐AMI surveys 2006‐2017, and OrganicDataNetwork surveys 2013‐2015, based on national data sources and Eurostat
EU‐15 EU‐13 CPC EFTA Other Europe

www.fibl.org
Europe: The 10 countries with the highest growth of organic agricultural land in 2015
+28'165+29'029+41'205+44'201+44'243+49'189
+104'666+139'294
+256'483+258'095
0 200'000 400'000
LatviaPortugalGermanyBulgariaGreece
LithuaniaItaly
Russian FederationFranceSpain
Hectares
Europe: The 10 countries with the highest growth of organic agricultural land in 2015 (hectares)Source: FiBL‐AMI survey 2017 based on Eurostat and national data sources

www.fibl.org
Europe: Use of organic agricultural land 2015 (total: 12.7 million hectares)
38
Arable crops45%
Permanent grassland
42%
Permanent crops11%
Other agri. Land/No details2%
Europe: Use of agricultural organic land 2015Source: FiBL‐AMI survey 2017
Land use types 2015
158299329
2'0662'233
0 1'000 2'000 3'000
VegetablesOilseeds
Dry pulsesGreen fodders
Cereals
Thousand hectares
Key arable crops
43142
219293
532
0 200 400 600
Citrus fruitFruit, temperate
NutsGrapesOlives
Thousand hectares
Key permanent crops

www.fibl.org
Figure: Distribution of organic producers and processors in Europe 2015
Turkey20%
Italy15%
Spain10%France
8%
Germany7%
Poland6%
Austria6%
Greece6%
Romania4%
Others18%
Europe: Distribution of organic producers 2015Source: FiBL‐AMI survey 2017
39
Italy24%
Germany24%
France20%
Spain6%
United Kingdom
4%
Others22%
Europe: Distribution of organic processors 2015Source: FiBL‐AMI survey 2017

www.fibl.org
Europe: Development of organic producers 2000 to 2015
40
156188
277
349
136164
220
269
0
50
100
150
200
250
300
350
400
2000 2005 2010 2015
In th
ousand
sof p
rodu
cers
Europe and European Union: Development of organic producers 2000‐2015Source: FiBL‐AMI Surveys 2006‐2017 based on national data sources and Eurostat
Europe European Union

www.fibl.org
EUROPE: ORGANIC RETAIL SALES 2015
USA
GermanyFrance
China
CanadaUKItaly
Switzer‐land
Other
Europe29.8 billion €
Germany8.6 billion €
262 €are spent per
person in Switzerland
0 5'000 10'000
1
2
3
4
5
Retail sales in million Euros0 100 200 300
1
2
3
4
5
Per capita consumption in euros
0 5 10
1
2
3
4
5
Market share in %
The European Union (27.1 billion €) is the second largest single market after the US (36 billion) and China. By region, North America has the lead (38.5 billion €), followed by Europe (29.8 billion €) and Asia.
The European countries with the largest markets for organic food are Germany (8.6 billion €), France (5.5 billion €), the UK (2.6 billion €), and Italy (2.3 billion €).
Switzerland has the highest per capita consumption of organic food worldwide, followed by Denmark and Sweden.
The highest organic share of the total market is in Denmark, followed by Switzerland, Luxembourg, Sweden, and Austria.
Distribution of retail sales value worldwide by country 2015
The countries with the largest markets for organic food 2015
The countries with the highest per capita consumption of organic food 2015
The countries with the highest organic shares of the total market 2015
Source: FiBL survey 2017 www.organic‐world.net
Switzerland
Italy
UK
France
Germany
Liechtenstein
Luxembourg
Sweden
Denmark
Switzerland Denmark
Switzerland
Luxembourg
Sweden
Austria (2011)
8.4 % of the
food market in Denmark is organic

www.fibl.org
Europe and European Union: Growth of the Organic Market 2004-2015
42
7.0 8.2 9.3 10.1 10.9 11.813.9
15.417.0 18.1 19.5
21.4 22.624.3
26.429.8
6.5 7.6 8.6 9.4 10.2 11.013.1
14.5 15.9 16.9 18.119.8 20.8
22.224.1
27.1
0
5
10
15
20
25
30
35
2000
2001
2002
2003
2004
2005
2006
2007
2008
2009
2010
2011
2012
2013
2014
2015
Billion
euros
Europe and European Union: Market development 2000‐2015Source: FiBL‐AMI Surveys 2006‐2017, OrganicDataNetwork Surveys 2013‐2015
Europe European Union

www.fibl.org
Europe and European Union: Growth of per consumption of organic products 2005-2015
43
14.8 17.4 19.3 21.1 22.5 24.2 26.4 27.9 29.8 32.336.4
22.326.3
29.131.8 33.8 36.1
39.3 41.244.0
47.753.7
0
10
20
30
40
50
60
2005 2006 2007 2008 2009 2010 2011 2012 2013 2014 2015
Euros
Europe and European Union: Growth of the per capita consumption 2005‐2015Source: FiBL‐AMI surveys 2006‐2017, OrganicDataNetwork Surveys 2013‐2015
Europe EU-28

www.fibl.org
European Union: Development of the organic market in selected European countries 2004-2015
44
0.3 0.4 0.4 0.6 0.7 0.8 0.8 0.9 0.9 0.9 0.9 1.1
1.8 1.6 1.7 2.12.6
3.1 3.4 3.8 4.0 4.44.8
5.5
3.5 3.94.6
5.35.8 5.8 6.0
6.6 7.07.4 7.8
8.6
1.11.2 1.4 1.6 1.7 1.9 2.0 2.1 2.3
012345678910
2004 2005 2006 2007 2008 2009 2010 2011 2012 2013 2014 2015
Billion
euros
European Union: Market development in selected countries 2004‐2015Source: AMI, Germany; Agence Bio France, AssoBio, Italy; LF Denmark
Denmark France Germany Italy

www.fibl.org
Germany
45
1.5 1.5 1.52.1
2.7 3.0 3.13.5
3.94.6
5.35.8 5.8 6.0
6.6 7.07.4 7.8
8.69.5
012345678910
Billion
euros
Germany: Market development in selected countries 2004‐2015Source: ZMP, AMI, Arbeitskreis Biomarkt
www.fibl.org
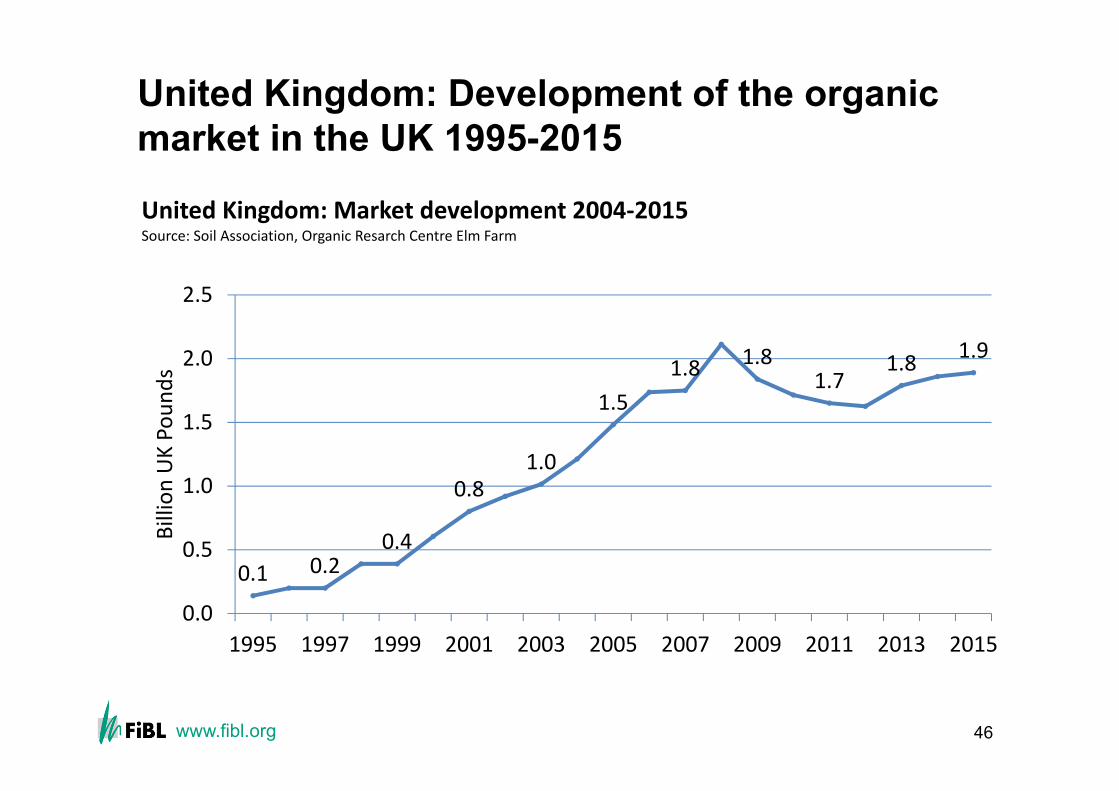
United Kingdom: Development of the organic market in the UK 1995-2015
46
0.1 0.20.4
0.81.0
1.51.8 1.8
1.71.8 1.9
0.0
0.5
1.0
1.5
2.0
2.5
1995 1997 1999 2001 2003 2005 2007 2009 2011 2013 2015
Billion
UK Po
unds
United Kingdom: Market development 2004‐2015Source: Soil Association, Organic Resarch Centre Elm Farm

www.fibl.org
Europe: Distribution of sales of organic food and drink by country 2015 (total: 29.8 billion euros)
47
Germany29%
France18%United Kingdom
9%
Italy8%
Switzerland7%
Sweden6%
Spain5%
Denmark4%
Netherlands4%
Others10%
Europe: Distribution of retail sales by country 2015Source: FiBL‐AMI survey 2017

www.fibl.org
Figure: Distribution of retail sales in Europe and worldwide
Germany29%
France18%United
Kingdom9%
Italy8%
Switzerland7%
Sweden6%
Spain5%
Denmark4%
Nether‐lands4%
Others10%
Europe: Distribution of retail sales by country 2015Source: FiBL‐AMI survey 2017
48
USA47%
EU‐2836%
China6%
Canada4%
Switzer‐land3%
Other4%
World: distribution of retail sales by single market 2015Source: FiBL‐AMI survey 2017

www.fibl.org
The European market for organic food and drink: The countries with the highest sales 2015
49
1'0651'0721'0791'4981'726
2'1752'3172'604
5'5348'620
0 2'000 4'000 6'000 8'000 10'000
Austria (2011)Netherlands
DenmarkSpain
SwedenSwitzerland
ItalyUnited Kingdom
FranceGermany
Million euros
Europe: Organic retail sales value by country 2015Source: FiBL‐AMI survey 2017

www.fibl.org
Europe: The countries with the highest per-capita consumption 2015
50
63.468.1
83.3105.9
127.0142.4
170.0177.1
190.7262.2
0 50 100 150 200 250 300
NetherlandsNorwayFrance
GermanyAustria (2011)LiechtensteinLuxembourg
SwedenDenmark
Switzerland
Per capita consumption in euros
Europe: The countries with the highest per capita consumption 2015Source: FiBL‐AMI Survey 2017

www.fibl.org
Europe: Growth of per capita consumption2005-2015
51
8.9 10.4 11.7 12.7 13.8 14.817.4 19.3 21.1 22.5 24.2 26.4 27.9 29.8
32.336.4
13.4 15.6 17.6 19.1 20.7 22.326.3
29.131.8 33.8 36.1
39.3 41.244.0
47.753.7
0
10
20
30
40
50
60
2000 2001 2002 2003 2004 2005 2006 2007 2008 2009 2010 2011 2012 2013 2014 2015
Euros
Europe and European Union: Growth of the per capita consumption 2000‐2015Source: FiBL‐AMI Surveys 2002‐2017,
Europe EU‐28 EU‐29

www.fibl.org
Europe: The ten countries with the highest organic shares of the total market 2015
52
2.5%2.7%2.9%
4.3%4.8%
6.5%7.3%7.5%7.7%
8.4%
0% 2% 4% 6% 8% 10%
ItalyBelgiumFrance
NetherlandsGermany
Austria (2011)Sweden
LuxembourgSwitzerland
Denmark
Organic market share
Europe: The countries with the highest organic shares of the total market 2015Source: FiBL‐AMI Survey 2017

www.fibl.org
Articles about Europe in the 2017 Edition of "The World of Organic Agriculture"
› Organic Farming in EuropeHelga Willer, Stephen Meredith, Yulia Barabanova, Bram Moeskops, and Matthias Stolze
› Organic Farming and Market Development in Europe and the European UnionHelga Willer, Diana Schaack and Julia Lernoud
53

www.fibl.org
Latin America/Caribbean: Organic agricultural land by country 2015
54Source: FiBL survey 2017, based on national sources and data from certifiers.

www.fibl.org
Latin America: Key figures 2015
› In Latin America, more than 450’000 producers managed 6.7 million hectares of agricultural land organically in 2015.
› This constitutes 13 percent of the world’s organic land and 0.9 percent of the regions agricultural land.
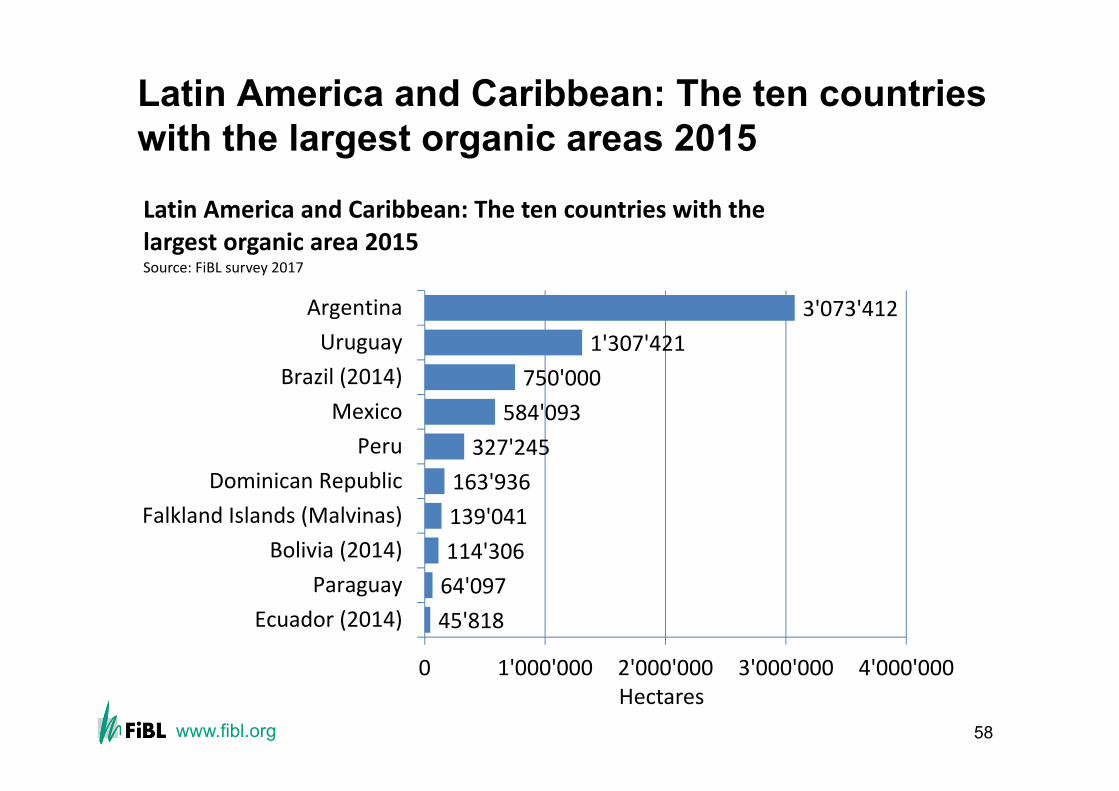
› The leading countries are Argentina (3.1 million hectares), Uruguay (1.3 million hectares), and Brazil (0.75 million hectares).
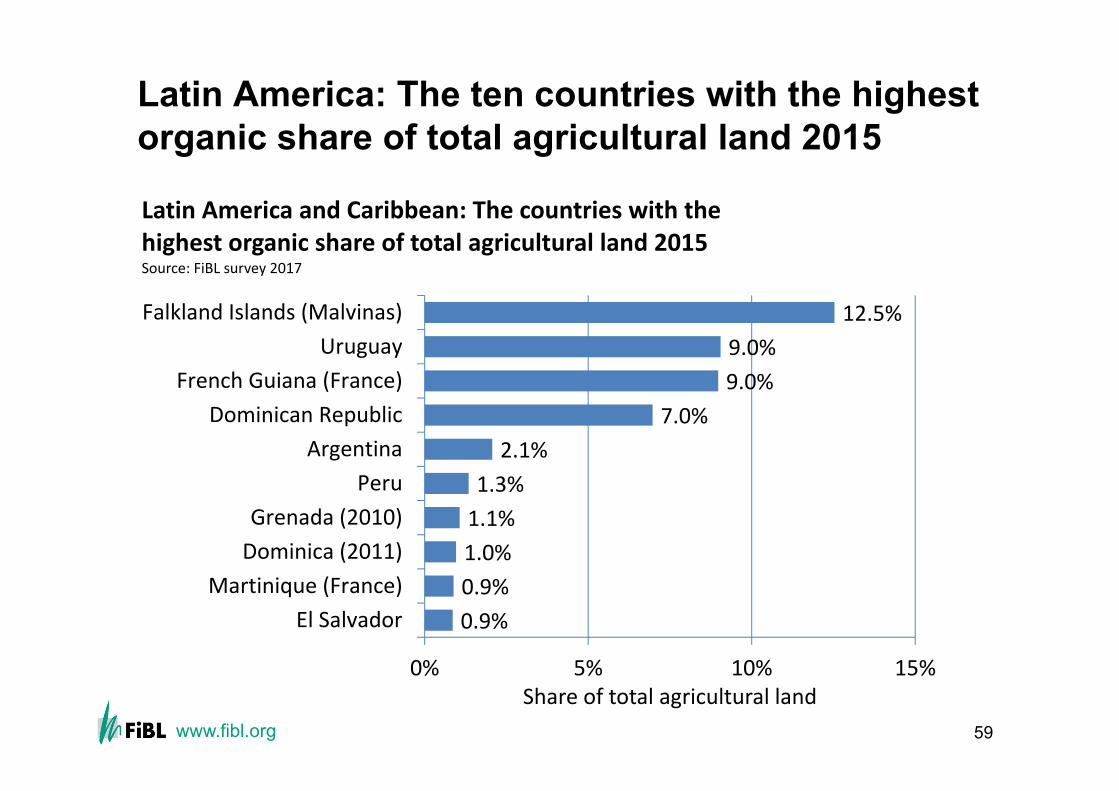
› The highest shares of organic agricultural land are in the Falkland Islands/Malvinas (12.5 percent), Uruguay (9 percent), and French Guiana (9 percent).
55Source: FiBL survey 2017

www.fibl.org
Latin America: Key figures 2015
› Most organic products from Latin American countries are sold on the European, North American or Japanese markets. Popular goods are especially those that cannot be produced in those regions, as well as off-season products.
› Many Latin American countries remain important exporters of organic products such as bananas, cocoa and coffee; in countries such as Argentina and Uruguay, temperate fruit and meat are key export commodities. At the same time, domestic markets are trending positively in the region.
› Important crops are tropical fruits, grains and cereals, coffee, cocoa, sugar, and meats. Most organic food sales in the domestic markets of the countries occur in major cities.
56

www.fibl.org
Latin America/Caribbean: Distribution of organic agricultural land by country 2015
3'073'412, 46%
1'307'421, 19%
705'233, 11%
584'093, 9%
1'029'797, 15%
Latin America/Caribbean: Distribution of organic agricultural land by country 2015 (total: 6.7 million hectares)Source: FiBL survey 2017
ArgentinaUruguayBrazilMexicoRest
57
www.fibl.org
Latin America and Caribbean: The ten countries with the largest organic areas 2015
58
45'81864'097114'306139'041163'936327'245
584'093750'000
1'307'4213'073'412
0 1'000'000 2'000'000 3'000'000 4'000'000
Ecuador (2014)Paraguay
Bolivia (2014)Falkland Islands (Malvinas)
Dominican RepublicPeru
MexicoBrazil (2014)
UruguayArgentina
Hectares
Latin America and Caribbean: The ten countries with the largest organic area 2015Source: FiBL survey 2017
www.fibl.org
Latin America: The ten countries with the highest organic share of total agricultural land 2015
59
0.9%0.9%1.0%1.1%1.3%2.1%
7.0%9.0%9.0%
12.5%
0% 5% 10% 15%
El SalvadorMartinique (France)
Dominica (2011)Grenada (2010)
PeruArgentina
Dominican RepublicFrench Guiana (France)
UruguayFalkland Islands (Malvinas)
Share of total agricultural land
Latin America and Caribbean: The countries with the highest organic share of total agricultural land 2015Source: FiBL survey 2017

www.fibl.org
Latin America: Development of organically managed agricultural land 2000-2015
60
3.91 4.54
5.75 5.96
5.22
5.06
4.95 5.59
7.24 7.66
7.54
6.97
6.95
6.81
6.83
6.74
0.0
2.5
5.0
7.5
10.0
2000
2001
2002
2003
2004
2005
2006
2007
2008
2009
2010
2011
2012
2013
2014
2015
Million he
ctares
Latin America and Caribbean: Development of organic agricultural land 2000 to 2015Source: FiBL‐IFOAM‐SOEL 2002‐2017

www.fibl.org
Latin America: Use of organic agricultural land 2015 (total: 6.7 million hectares)
61
Permanent grassland
65%Permanent
crops12%
Arable land crops5%
No details/other
18%
Latin America and Caribbean: Use of agricultural organic land 2015Source: FiBL survey 2017; based on information from the private sector, certifiers, and governments.
Land use types 2015
6.718.0
42.369.9
124.8
0 100 200
Dry pulsesVegetables
OilseedsSugarcane
Cereals
Thousand hectares
Key arable crops
7.210.4
119.8187.2
476.9
0 200 400 600
GrapesCitrus fruit
Fruit, tropical/subtrop.CocoaCoffee
Thousand hectares
Key permanent crops

www.fibl.org
Articles about Latin America and the Caribbean in the 2017 edition of "The World of Organic Agriculture"
› Latin America and the CaribbeanPatricia Flores Escudero
62

www.fibl.org
North America: Organic agricultural land by country 2015
63Source: USDA and COTA 2017

www.fibl.org
Organic Agriculture in North America: Key figures 2015
› In North America, 3 million hectares are managed organically, of these are two million in the United States and more than 0.9 million in Canada.
› This represents 0.7 percent of the total agricultural area in the region and 6 percent of the world’s organic agricultural land.
› In 2015, the organic market continued to grow in North America, reaching 39 billion euros. In Canada, the organic market grew by over 9 percent in 2015, and in the United States the organic market grew by 11 percent. The United States is the largest single organic market in the world, and North America continues to be the continent with the largest organic market.
64Source: USDA and COTA 2017

www.fibl.org
North America: Organic agricultural land 2015
65
944'558
2'029'327
0 500'000 1'000'000 1'500'000 2'000'000 2'500'000
Canada
United States ofAmerica
Hectares
North America: Organic agriculture area 2015Source: COTA and USDA, 2016

www.fibl.org
North America: Distribution of organic agricultural land by country 2015
68%
32%
North America: Distribution of organic agricultural land by country 2015 (Total: 3 million hectares)Source: COTA and USDA
United States ofAmerica
Canada
66

www.fibl.org
North America: Shares of organic agricultural land 2015
67
0.6%
1.4%
0.0% 0.5% 1.0% 1.5% 2.0%
United States of America
Canada
Share of total agricultural land
North America: Organic share of total agricultural land 2015Source: COTA and USDA, 2016

www.fibl.org
North America: Development of organic agricultural land 2000-2015
68
1.06 1.28
1.26 1.41 1.
72
2.22
1.79
2.29 2.
58 2.65
2.47
3.02
3.01 3.05
2.46
2.97
0.0
0.5
1.0
1.5
2.0
2.5
3.0
3.5
2000
2001
2002
2003
2004
2005
2006
2007
2008
2009
2010
2011
2012
2013
2014
2015
Million he
ctares
North America: Development of organic agricultural land 2000‐2015Source: COG‐COTA and USDA, 2001‐2016

www.fibl.org
North America: Use of organic agricultural land 2015 (total: 3 million hectares)
69
Arable land crops46%
Permanent grassland
45%
Other agri. land6%
Permanent crops2%
No details1%
North America: Land use in organic agriculture 2015Source: COTA and USDA, 2016
Land use types 2015
38101116
286559
0 500 1'000
Dry pulsesOilseeds
VegetablesGreen fodders
Cereals
Thousand hectares
Key arable crops
49
1313
19
0 10 20 30
Citrus fruitNuts
GrapesBerries
Temperate fruit
Thousand hectares
Key permanent crops

www.fibl.org
Articles about North America in the 2017 Edition of "The World of Organic Agriculture"
› Organic Continues to Set Records in the United StatesBarbara Fitch Haumann
› CanadaMarie-Eve Levert and Jill Guerra
70

www.fibl.org
Oceania: Organic agricultural land by country 2015
71FiBL survey 2017, based on national sources and data from certifiers.

www.fibl.org
Organic agriculture in Oceania: Key figures 2015
› This region includes Australia, New Zealand, and the Pacific Islands.
› Altogether, there are over 22‘000 producers, managing 22.8 million hectares.
› This constitutes 5.6 percent of the agricultural land in the area and almost 45 percent of the world’s organic land.
› Ninety-nine percent of the organic land in the region is in Australia (22.7 million hectares, 97 percent of which is estimated to be extensive grazing land), followed by New Zealand (74’134 hectares), and Samoa (27’656 hectares).
› The highest shares of all agricultural land are in Samoa (9.8 percent), followed by Tonga (8 percent), Australia (5.6 percent), and Solomon Islands (5.2 percent).
72FiBL survey 2017

www.fibl.org
Oceania: Organic agricultural land 2015
73
10521674111'6002'6295'6129'47410'93915'82927'65674'134
22'690'000
0 5'000'000 10'000'000 15'000'000 20'000'000 25'000'000
Cook IslandsNiue
French PolynesiaNew Caledonia
KiribatiTonga
Solomon IslandsVanuatu
FijiPapua New Guinea
SamoaNew Zealand
Australia
Hectares
Oceania: Organic agricultural land by country 2015Source: FiBL survey 2017

www.fibl.org
Oceania: Development of organic agricultural land 2000-2015
74
5.31
5.34 6.25
11.30
12.18
11.81
12.43
12.07
12.11
12.15
12.15
12.19
12.16
17.32
18.53 22
.84
0
5
10
15
20
25
2000
2001
2002
2003
2004
2005
2006
2007
2008
2009
2010
2011
2012
2013
2014
2015
Million he
ctares
Oceania: Development of organic agricultural land 2000‐2015Source: FiBL‐IFOAM‐SOEL 2002‐2017

www.fibl.org
Oceania: Shares of organic agricultural land 2015
75
0.2%0.2%0.3%0.9%1.7%2.2%
3.3%3.5%4.2%4.7%
6.3%6.4%
14.3%
0% 5% 10% 15% 20%
French PolynesiaNew Caledonia
Cook IslandsNew Zealand (2012)Papua New Guinea
FijiNiue
VanuatuAustralia (2013)
KiribatiSolomon Islands
TongaSamoa
Share of total agricultural land
Oceania: Organic share of organic agricultural land 2015Source: FiBL survey 2017

www.fibl.org
Oceania: Use of organic agricultural land 2015 (total: 22.8 million hectares)
Permanent grassland
97%
Other/No details3%
Oceania: Use of organic agricultural land 2015Source: FiBL survey 2017
76

www.fibl.org
Articles about Oceania in the 2017 Edition of "The World of Organic Agriculture"
› AustraliaAndrew Lawson, Andrew Monk and Amy Cosby
› The Pacific IslandsKaren Mapusua
77

www.fibl.org
References and data sources
› FiBL* and IFOAM** (2017): Data on organic agriculture world-wide. In: FiBL& IFOAM (2017): The World of Organic Agriculture. Statistics and Emerging Trends. Frick and Bonn
› FiBL*, AMI*** and IFOAM**: Organic market data. In: FiBL& IFOAM (2017): The World of Organic Agriculture. Statistics and Emerging Trends. Frick and Bonn
› Willer, Helga and Julia Lernoud (2017): Current Statistics on Organic Agriculture Worldwide: Organic Area, Producers, Markets and Selected Crops. In: FiBL& IFOAM (2017): The World of Organic Agriculture. Statistics and Emerging Trends 2017. Frick and Bonn.
› For detailed data sources by country please check http://www.organic-world.net/statistics/statistics-data-sources.html?L=2
› *FiBL= Research Institute of Organic Agriculture, Switzerland; **IFOAM = International Federation of Organic Agriculture Movements, Germany; ***AMI = Agricultural Information Company, Germany
› More information at http://www.organic-world.net/yearbook/yearbook-2017.html
78

www.fibl.org
More information
› More information (PDF, data sources, graphs) at http://www.organic-world.net/yearbook/yearbook-2017.html
› ContactHelga Willer and Julia LernoudResearch Institute of Organic Agriculture (FiBL)5070 [email protected] and [email protected]
79

www.fibl.org
Disclaimer
› All of the results contained in this slide show have been compiled by the Research Institute of Organic Agriculture (FiBL). However, the possibility of mistakes cannot be ruled out entirely. Therefore, FIBL is not subject to any obligation and makes no guarantees whatsoever regarding any of the statements or results in this work; neither FiBL accepts responsibility or liability for any possible mistakes, nor for any consequences of actions taken by readers based on statements or advice contained therein.
› This document has been produced with the support of the Swiss State Secretariat for Economic Affairs (SECO), the International Trade Centre (ITC) and NürnbergMesse. The views expressed herein can in no way be taken to reflect the official opinions of SECO, ITC or NürnbergMesse.
80