Embed Size (px)
Citation preview
Erratum
Doron NN, LeDoux JE. 1999. Organization of Projections to the lateral amygdalafrom auditory and visual areas of the thalamus in the rat. J Comp Neurol 412:383–409.
In Figures 2 and 4 of the above article, the original printing did not portray theintended meaning of the figures. Below are explanations of both figures as well astheir new revised versions.
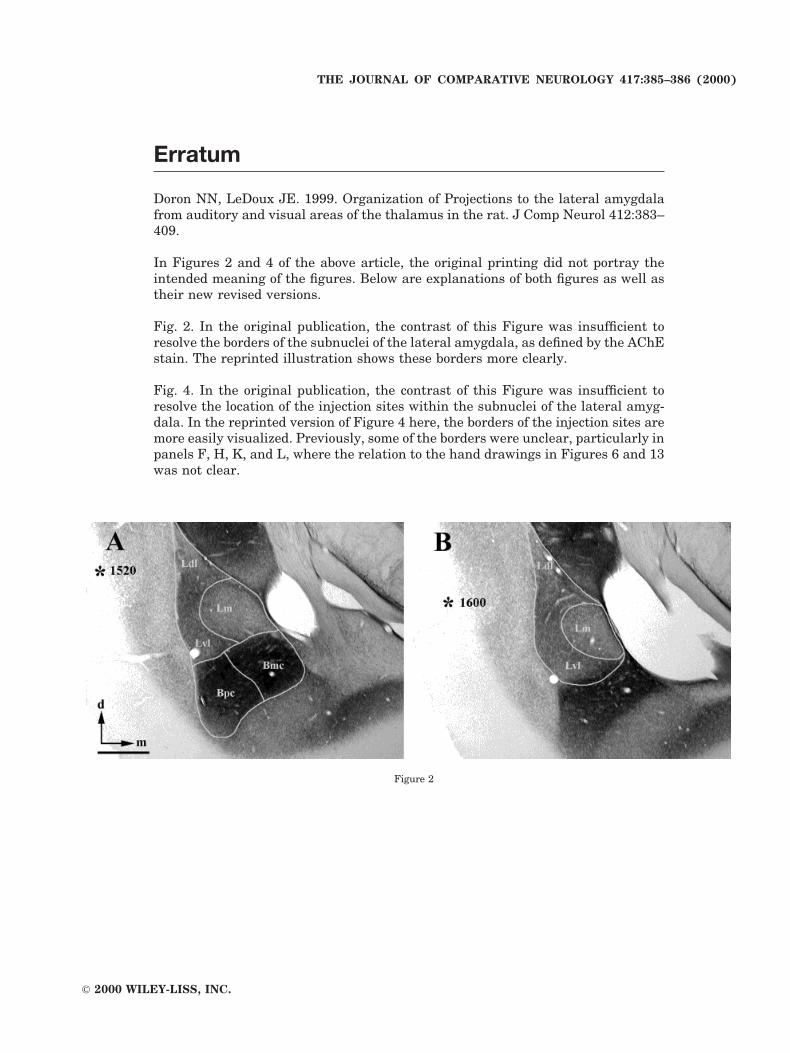
Fig. 2. In the original publication, the contrast of this Figure was insufficient toresolve the borders of the subnuclei of the lateral amygdala, as defined by the AChEstain. The reprinted illustration shows these borders more clearly.
Fig. 4. In the original publication, the contrast of this Figure was insufficient toresolve the location of the injection sites within the subnuclei of the lateral amyg-dala. In the reprinted version of Figure 4 here, the borders of the injection sites aremore easily visualized. Previously, some of the borders were unclear, particularly inpanels F, H, K, and L, where the relation to the hand drawings in Figures 6 and 13was not clear.
Figure 2
THE JOURNAL OF COMPARATIVE NEUROLOGY 417:385–386 (2000)
© 2000 WILEY-LISS, INC.
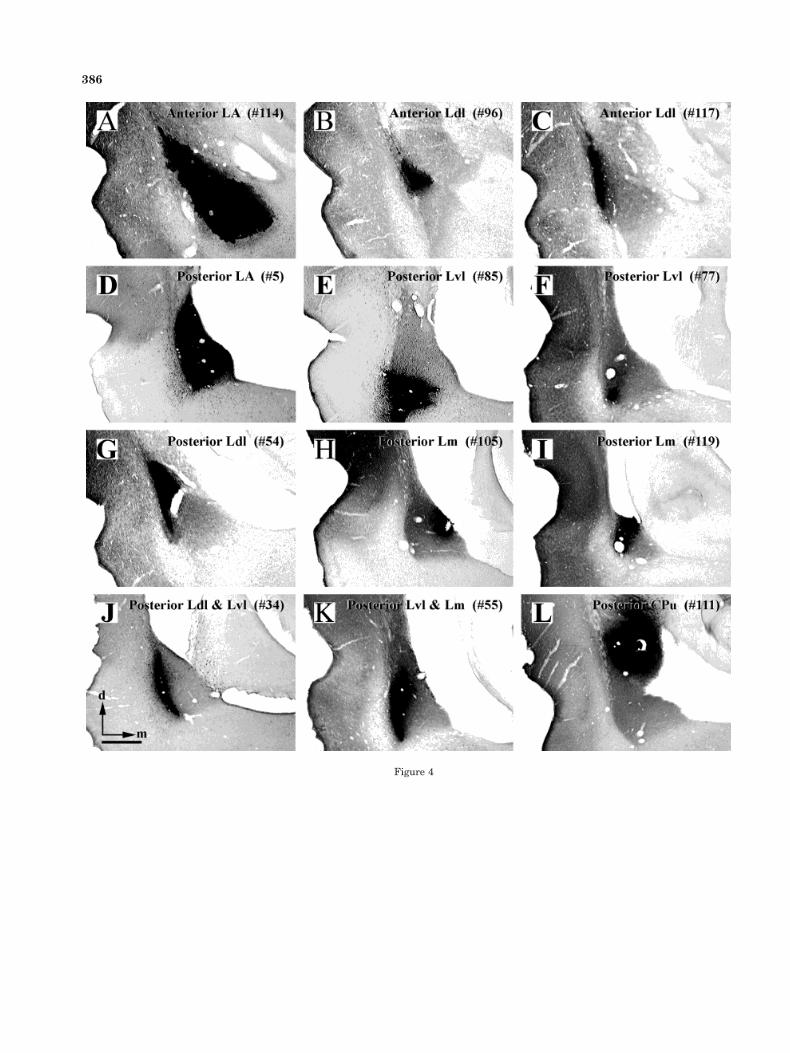
Figure 4
386