Embed Size (px)
Citation preview

ARTICLESPUBLISHED ONLINE: 1 DECEMBER 2014 | DOI: 10.1038/NMAT4137
Origin of voltage decay in high-capacity layeredoxide electrodesM. Sathiya1,2,3, A. M. Abakumov4, D. Foix3,5,6, G. Rousse1,6,7, K. Ramesha8, M. Saubanère3,6,9,M. L. Doublet3,6,9, H. Vezin10, C. P. Laisa8, A. S. Prakash1,8, D. Gonbeau3,5,6, G. VanTendeloo4
and J-M. Tarascon1,3,6*
Although Li-rich layered oxides (Li1+xNiyCozMn1−x−y−zO2 > 250mAhg−1) are attractive electrode materials providing energydensities more than 15% higher than today’s commercial Li-ion cells, they su�er from voltage decay on cycling. To elucidatethe origin of this phenomenon, we employ chemical substitution in structurally related Li2RuO3 compounds. Li-rich layeredLi2Ru1−yTiyO3 phases with capacities of ∼240mAhg−1 exhibit the characteristic voltage decay on cycling. A combination oftransmission electron microscopy and X-ray photoelectron spectroscopy studies reveals that the migration of cations betweenmetal layers and Li layers is an intrinsic feature of the charge–discharge process that increases the trapping of metal ions ininterstitial tetrahedral sites. A correlation between these trapped ions and the voltage decay is established by expanding thestudy to both Li2Ru1−ySnyO3 and Li2RuO3; the slowest decay occurs for the cations with the largest ionic radii. This e�ect isrobust, and the finding provides insights into new chemistry to be explored for developing high-capacity layered electrodesthat evade voltage decay.
L ithium-ion battery technology, having the highest gravimetricand volumetric energy densities of commercialized batteries,has conquered the portable electronics market1,2. Moreover, it
is the battery of choice for powering electric vehicles and has greatpotential for grid energy storage3. Success in these fields will dependon our ability to further increase their energy density4 to ensurelonger cruising autonomy for electric vehicle and lower cost (perkilowatt-hour) to compete with pumped hydroelectric storage forgrid applications. To reach such targets, current research mainlyfocuses on the synthesis of new Fe-based polyanionic compounds5,6and improving the existing layered oxides7, the latter being the topicof this paper.
Layered oxides of general formula LiNi1/3Co1/3Mn1/3O2 (NMC)exhibit the highest capacity (≈200mAh g−1) of any positive-electrode materials used at present8. The crystal structure of thesematerials can be considered as an ordered rock-salt derivative,where octahedrally coordinated Li and transition-metal cations ide-ally formalternating layers confined to the (111) planes of cubic oxy-gen close packing9. Bymodifying the chemical composition throughsubstituting Li for M in the metal layers, researchers have fabri-cated materials, termed as Li-rich layered oxides or Li-rich NMC(Li1+xNiyCozMn1−x−y−zO2), exhibiting reversible capacities exceed-ing 250mAh g−1 (refs 10,11).The extra capacity was recently shownby complementary X-ray photoelectron spectroscopy (XPS) andelectron paramagnetic resonance (EPR) experiments to be nested inthe contribution of reversible anionic (O2−
→O2n− where 3>n>1)
redox processes to the overall material capacity12,13. Nevertheless, itremains that these materials have poor electrode kinetics and un-dergo large voltage decays (that is, reduction in average cell voltage)
on cycling, both of which are plaguing their implementation in prac-tical cells14–16. Present scenarios, although not fully conclusive, tendto relate this voltage decay to structural effects andmore specificallyto the formation of spinel-like domains17–23. We recently found thatthe replacement of Mn4+ in Li2Ru1−yMnyO3 by the larger and lesselectropositive cation Sn4+ reduces voltage fading12,24. To assess theimportance of substituent’s chemical–physical characteristics on thevoltage fade on cycling, we herein extend our work to the study ofLi2Ru1−yTiyO3. The Ti4+ (d0) substitution was selected owing to itszero crystal field splitting, similar to d10 Sn4+, its smaller size (0.60Å)and its presumed ability to show accelerated cationmigration25,26 fordirect visualization of migration paths.
Members of the Li2Ru1−yTiyO3 series were prepared by thor-oughly mixing stoichiometric amounts of RuO2, TiO2 and Li2CO3and annealing at 800 ◦C for 24 h. The resulting single-phase samplesform a complete solid solution, demonstrated by the continuousvariation of lattice parameters as a function of Ti content (Supple-mentary Fig. 1). The crystal structure is monoclinic with an atomicdistribution corresponding to the Li2RuO3 model with some Ru4+
(ionic size 0.62Å) being replaced by Ti4+ (ionic size 0.60Å).For concision, our study focuses mainly on Li2Ru0.75Ti0.25O3. A
combination of Rietveld refinement from powder X-ray diffraction(XRD) data (Fig. 1a), electron diffraction (Supplementary Fig. 2)and high-angle annular dark-field scanning transmission electronmicroscopy (HAADF-STEM) imaging (Supplementary Fig. 3)reveals that its structure can be viewed (Fig. 1a, inset) as stackingof Li3 layers and LiM2 layers (M=Ru, Ti) along the c axis.In Li2Ru0.75Ti0.25O3, the Li and (Ru, Ti) cations demonstrateperfect honeycomb-like ordering within the LiM2 layers; no cation
1FRE 3677 ‘Chimie du Solide et de l’Energie’, Collège de France, 11, Place Marcelin Berthelot, 75231 Paris, France. 2LRCS, CNRS UMR 7314, Université dePicardie Jules Verne, 80039 Amiens, France. 3ALISTORE-European Research Institute, 80039 Amiens, France. 4EMAT, University of Antwerp,Groenenborgerlaan 171, B-2020 Antwerp, Belgium. 5IPREM/ECP (UMR 5254), University of Pau, 2 av. Pierre Angot, 64053 Pau Cedex 9, France. 6Réseausur le Stockage Electrochimique de l’Energie (RS2E), FR CNRS 3459, France. 7Sorbonne Universités UPMC Univ Paris 06, 4 place Jussieu, 75252 ParisCedex 05, France. 8CSIR- CECRI- Chennai Centre, CSIR Campus, Taramani, Chennai-600 113, India. 9Institut Charles Gerhardt, CNRS UMR5253, UniversitéMontpellier 2, 34 095 Montpellier, France. 10Univ. Lille Nord de France, CNRS, UMR 8516 – LASIR, Univ. Lille 1, F-59655 Villeneuve d’Ascq, France.*e-mail: [email protected]
230 NATURE MATERIALS | VOL 14 | FEBRUARY 2015 | www.nature.com/naturematerials
© 2015 Macmillan Publishers Limited. All rights reserved

NATUREMATERIALS DOI: 10.1038/NMAT4137 ARTICLES
Superstructure peaks
Li2Ru0.75Ti0.25O3
Li2Ru0.75Sn0.25O3
Li2RuO3
Li2Ru0.75Ti0.25O3
LiM2
LiM2
1−100 cycles
Inte
nsity
(a.u
.)
Vol
tage
(V v
ersu
s Li
+ /Li
0 )V
olta
ge (V
ver
sus
Li+ /
Li0 )
V versus Li+/Li0
Diffraction angle (2 Cu Kα ) x in LixRu0.75Ti0.25O3
Li3
Cycle 1
Cycle 20
Cycle 100
Cycle 50
20 0.0 0.5 1.0 1.5 2.0
Capacity (normalized)
30 40 50 60 70
100
80
Capa
city
(mA
h g−1
)
0 50Cycle number
100
60
40
Perc
enta
ge c
apac
ity
20
00 20 40
Cycle number
60 80 100
2.0
2.5
3.0
3.5
4.0
4.5a b
c d
0.0 0.2 0.4 0.6 0.8 1.0
4.5
4.0
3.5
dx/d
V
2 3 4
3.0
2.5
2.0
θ
0.0
−0.4
−0.8
−1.2
300
200
100
0
ab
c
Figure 1 | Structural and electrochemical aspects of Li2Ru0.75Ti0.25O3. a, Powder XRD pattern (black points) and the Rietveld fit (red lines) forLi2Ru0.75Ti0.25O3; refinement was carried out using the monoclinic C2/m space group (lattice parameters: a=5.037(7) Å, b=8.717(1) Å, c=5.126(6) Åand β= 109.137(3)◦). Bragg positions are indicated as green vertical tick marks, and the blue line is the di�erence between the observed and calculatedpatterns. RBragg= 7.88%. The peaks marked by stars are the reflections originating from the di�erence in scattering density between octahedral positionsin the Li3 and LiM2 layers (interlayer ordering) and can serve as a means to estimate the interlayer mixing, that is, the amount of transition-metal atoms(Ru/Ti) moving from the octahedral sites of the LiM2 layers (denoted OcM) to the octahedral sites of the Li3 layers (denoted OcLi). The inset shows thestructure of Li2Ru0.75Ti0.25O3 with stacking of LiM2 (M=Ru, Ti) and Li3 layers; Li is yellow, Ru/Ti is blue, possible tetrahedral sites for the occupation ofmetal ions are shown by green (in the Li3 and LiM2 layer) tetrahedra. b, Voltage versus composition profile for Li2Ru0.75Ti0.25O3 versus lithium as deducedfrom galvanostatic cycling at a 0.2 C rate. c, Percentage capacity retention plot of Li2Ru0.75Ti0.25O3 in comparison with that of Li2RuO3 andLi2Ru0.75Sn0.25O3; the as-measured capacities are presented in the inset. d, From cycle 1 to 100, the galvanostatic discharge profile of Li2Ru0.75Ti0.25O3versus Li in the 2–4.6 V potential region; every tenth cycle is shown and the capacity values were normalized such that the maximum capacity in each cycleis taken as unity (240 and 151 mAh g−1 is taken as unity for the first and hundredth cycles, respectively). The inset shows the derivative plot of the same,and the evolution of the new redox process at less than 3 V is marked by blue arrow.
intermixing between the Li3 and LiM2 layers was observed. Thus,two types of cation ordering coexist in the material. The interlayerordering between the Li3 and LiM2 layer drives the structure fromthe cubic rock salt Fm3̄m aristotype towards an R3̄m sublattice,whereas the honeycomb intralayer ordering decreases the symmetryeven further to monoclinic C2/m. Stacking faults are thereforeabundant (Supplementary Fig. 3) because of lateral shifts and/or 60◦rotations of the LiM2 layers.
The voltage–composition trace for a Li2Ru1−yTiyO3 electrode(y=0.25) shows the feasibility to remove 1.8 Li via two plateaux, ofwhich 1.5 Li can be reinserted bymeans of an S-type discharge curve(Fig. 1b). This leads to a reversible capacity of nearly 240mAh g−1that decreases with increasing y and reaches 110mAh g−1 fory=0.75 (Supplementary Fig. 4).
A common feature of all members of the Li2Ru1−yTiyO3 solidsolution series is the large first-cycle irreversibility that increasesby increasing the cutoff potential (Supplementary Fig. 5). Suchirreversibility may occur partly owing to electrolyte oxidation but ismainly caused by irreversible loss of oxygen from the material24,27,28as confirmed by in situ gas and pressure analysis, with the onsetof an O2 loss at 4.1 V that then increases continuously as the
charging voltage proceeds to 4.5V (not shown here). Last, similarto all Li-rich NMC or Li2Ru1−yMyO3 (M=Mn, Sn) phases, the firstcharge voltage trace differs from the first discharge trace, suggestingthe contribution of a reversible anionic (O2−
→O2n−) redox process
to the overall capacity of Li2Ru1−yTiyO3 samples. However, a minordifference from the Mn- and Sn-based layered electrodes12,24 is theamplitude of the first-charge 3.6V plateau for Li2Ru1−yTiyO3, whichno longer equals the initial amount of Ru. This suggests anotherredox process in competition with the Ru4+
→Ru5+ process, as isdiscussed later.
Long cycling tests performed on Li/Li2Ru0.75Ti0.25O3 cells (Fig. 1c)were compared to those of Li/Li2Ru0.75Sn0.25O3 and un-substitutedLi2RuO3 cells cycled under various cycling rates between 2V and4.6V. All samples exhibit initial capacities exceeding 200mAh g−1(inset of Fig. 1c) with the Sn- and Ti-based samples showing thehighest and lowest capacity retention, respectively (85% versus 62%after 100 cycles). This trend is preserved irrespective of the cyclingrate (data not shown here).
In addition, the normalized discharge voltage traces for aLi/Li2Ru0.75Ti0.25O3 cell show that the voltage decays by nearly500mVbetween the first and hundredth cycle (Fig. 1d). This voltage
NATURE MATERIALS | VOL 14 | FEBRUARY 2015 | www.nature.com/naturematerials 231
© 2015 Macmillan Publishers Limited. All rights reserved

ARTICLES NATUREMATERIALS DOI: 10.1038/NMAT4137
Voltage drop from 1 to 100 cycles
1−100 cycles1−100 cycles
Cycle 1
Cycle 20
Cycle 100
Cycle 50
Cycle 1
Cycle 20
Cycle 100
Cycle 50
1−100 cycles
Li2Ru0.75Sn0.25O3 Li2Ru0.25Sn0.75O3
Li2Ru0.5Sn0.5O3
Li2Ru0.5Sn0.5O3
Li2Ru0.25Sn0.75O3
Li2RuO3
Vol
tage
(V v
ersu
s Li
+ /Li
0 )
a
b
c
0.0 0.2 0.4 0.6Capacity (normalized)
1.00.8
0.0 0.2 0.4 0.6Capacity (normalized)
1.00.8Capacity (normalized)
4.5
4.0
3.5
3.0
2.5
2.0
Vol
tage
(V v
ersu
s Li
+ /Li
0 )
Vol
tage
(V v
ersu
s Li
+ /Li
0 )
4.5
4.0
3.5
3.0
2.5
2.0
4.5
4.0
3.5
3.0
2.5
2.0
Vol
tage
(V v
ersu
s Li
+ /Li
0 )
4.5
4.0
3.5
3.0
2.5
2.0
0.0 0.2 0.4 0.6 1.00.8
00
50
100
150
20 40 60Cycle number
80 100
Capa
city
(mA
h g−1
)
Figure 2 | Cycling behaviour of Li2Ru1−yMyO3 (M=Ru/Sn/Ti) in the view towards voltage decay. a–c, Normalized capacity discharge profiles forLi2RuO3 (a), Li2Ru0.75Sn0.25O3 (b), Li2Ru0.5Sn0.5O3 and Li2Ru0.25Sn0.75O3 (c) from 1 to 100 cycles; the data are reported only for every 10 cycles. Thecapacity retention for Li2Ru0.5Sn0.5O3 and Li2Ru0.25Sn0.75O3 samples is shown in the inset in c. The capacity normalization was performed by taking themaximum discharge capacity in the corresponding cycle as unity.
decay occurs mainly over the low potential region as confirmed byderivative curves (Fig. 1d inset), which show a progressive dumpingof high to low voltage peak.When comparing the different M-based(M=Ti, Sn, Ru) samples, the voltage decay on cycling to someextent mirrors the capacity decay and is the smallest (∼150mVafter 100 cycles) for Li2Ru0.75Sn0.25O3 (Fig. 2b). Such a trend persistswhatever the amount of substituent (y; Supplementary Fig. 6). Notethat the voltage decay is gradually reduced with increasing amountsof Sn in Li2Ru1−ySnyO3 (Fig. 2a–c) with almost no voltage fadingobserved after 100 cycles and nearly 100% capacity retention fory=0.75 (Fig. 2c inset). This clearly confirms the positive role playedby larger Sn4+ (0.69 Å) ions in reducing the voltage decay overmany cycles.
Cycling tests were also done as a function of charge cutoff voltage(Supplementary Figs 7 and 8). When cycling is limited to theRu4+/Ru5+ redox couple (<4V) 100% capacity retention is observedfor all systems, whereas the associated voltage decays vary fromnearly zero for Sn to 80mV for Ti. This suggests that capacity andvoltage decay are not systematically related. However, by raising thecharge cutoff voltage to 4.2V or 4.6Vwe note that both capacity andvoltage decay decrease in a similar manner on cycling.
In situ XRD patterns were collected at different states ofcharge/discharge for the Li/Li2Ru0.75Ti0.25O3 cell cycled at C/20 rate(Fig. 3a). As the cell is being charged to 4V, an anisotropic variationof the lattice parameters is observed with c/a ratio decreasing from
4.99 to 4.92 suggesting a gradual suppression of Li3–LiM2 interlayerordering.When further charging the cell to 4.6 V, many Bragg peaksbroaden and experience changes in relative intensities, indicative ofa possiblemigration of Ru/Ti fromLiM2 to Li3 layers.On subsequentdischarge, the structure nearly converts back to the pristine layeredordered structure with however an increasing cation disorder withinthe LiM2 layers as deduced from the reduction in intensity ofsuperstructure peaks arising from the honeycomb LiM2 pattern.
To assess structural changes on prolonged cycling, high-resolution synchrotron powder diffraction patterns were collectedfor the pristine Li2Ru0.75Ti0.25O3 and for electrodes recovered in thedischarged state after 1 and 50 cycles, respectively (Fig. 3b). After 50cycles, the XRD pattern significantly differs from that of the first cy-cle by an intense peak broadening and a progressive disappearanceof the superstructure peaks. Owing to such broadening, the patternswere refined in theR3̄m subcell using anX ∗ tanθ peak width depen-dence accounting for strain effects; we observed a sharp increase ofthe strain broadening parameter X with increasing cycle numbers(Fig. 3c). Interestingly, the XRD pattern of the Li2Ru0.75Sn0.25O3electrode cycled in similar conditions (C/10 rate, cycle numbers 1,25, 50 and 100) shows a constant X parameter (Fig. 3d), suggestinga correlation between the voltage decay and micro-strains inducedby local disorder (cation migration and/or stacking fault).
XPS analyses were carried out on pristine Li2Ru0.75Ti0.25O3(Fig. 4a) and on similar electrodes charged to ∼3.9V (Fig. 4b)
232 NATURE MATERIALS | VOL 14 | FEBRUARY 2015 | www.nature.com/naturematerials
© 2015 Macmillan Publishers Limited. All rights reserved
NATUREMATERIALS DOI: 10.1038/NMAT4137 ARTICLES
Pristine (before cycling)
Pristine
1 cycle
25 cycles
50 cycles
100 cycles
Reflections from Li and Mordering within the LiM2 layer
50 cycles
1 cycle
Pristine
Discharged—2 V
Charged—4.6 V
Charged—4 V
Pristine
20
a b
c d
30 40 50
Inte
nsity
(a.u
.)
Inte
nsity
(a.u
.)In
tens
ity (a
.u.)
X st
rain
bro
aden
ing
para
met
er
Al Al
Be
(003
) R
(101
) R
(102
) R(1
04) R
(006
) R
Be
Diffraction angle (2 , = 0.4138 Å)4 6 8 10 12 14 16 18 20
λ
Diffraction angle (2 , = 0.4138 Å)λ
Li2Ru0.75Ti0.25O3
Li2Ru0.75Sn0.25O3
1.6
1.2
0.2
0.4
0.6
0.8
1.0
1.4
0 25 50Cycle number
75 100 4 6 8 10 12 14 16 18 20
Diffraction angle (2 Cu Kα )θ θ
θ
Figure 3 | Li-driven structural changes of Li2Ru0.75M0.25O3 (M= Sn/Ti). a, In situ XRD pattern of Li2Ru0.75Ti0.25O3 versus Li cells; the patterns collectedon pristine electrode, during charge at 4 V, 4.6 V and then on completely discharged sample (2 V). On charging the Li/Li2−xRu0.75Ti0.25O3 cell to 4 V, thereis a shift in the (003)R peak towards higher 2θ and merging of (006)R and (102)R Bragg peaks (indexed in R3̄m) indicating an anisotropic variation oflattice parameters with the removal of lithium. On discharge, most of the peaks regained their intensity and reappearance of (006)R and (102)R peaksplitting shows that the structure converts back to the pristine layered ordered structure. b, Synchrotron powder XRD pattern of pristine Li2Ru0.75Ti0.25O3and samples collected at the discharged state (2 V) after 1 and 50 cycles. c, Variation of the Lorentzian broadening parameter X∗ tanθ with cycling derivedfrom refinement of the synchrotron XRD patterns. Vertical bars indicate the estimated standard deviation. d, Synchrotron powder XRD pattern of pristineLi2Ru0.75Sn0.25O3 and samples cycled several times (1, 25, 50 and 100 cycles) between 4.6 and 2 V and collected at 2 V. The green rectangle in b and cshows the reflections from honeycomb Li–M ordering within the LiM2 layers.
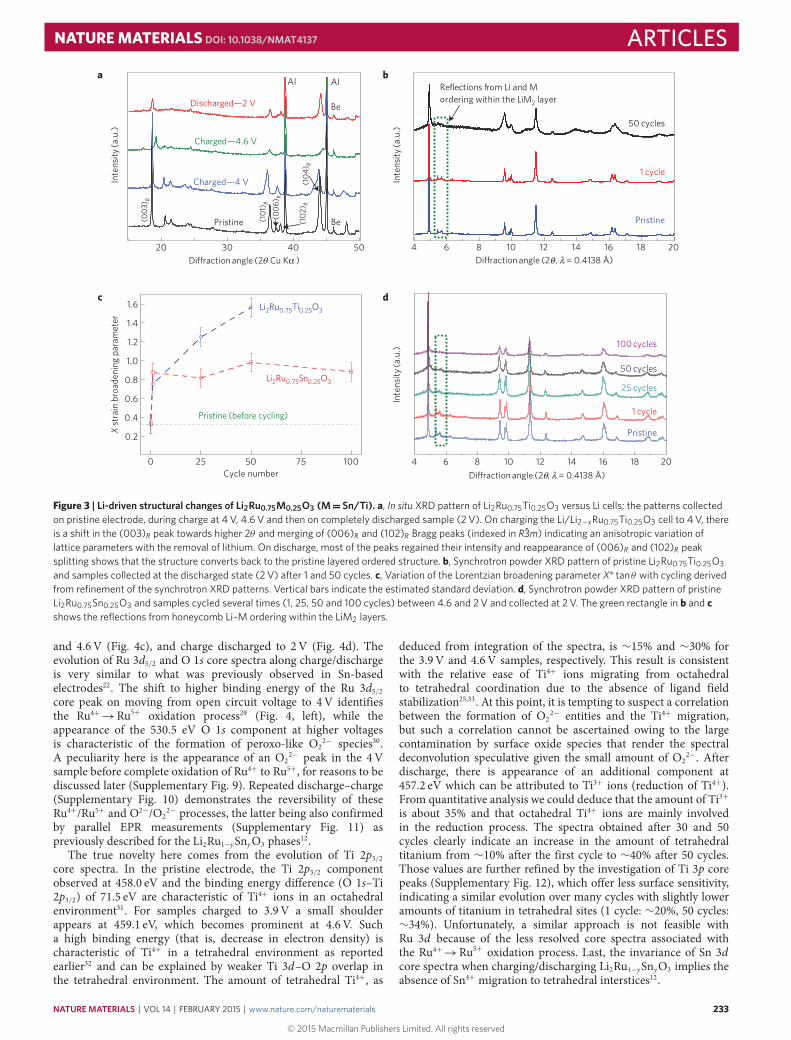
and 4.6V (Fig. 4c), and charge discharged to 2V (Fig. 4d). Theevolution of Ru 3d5/2 and O 1s core spectra along charge/dischargeis very similar to what was previously observed in Sn-basedelectrodes22. The shift to higher binding energy of the Ru 3d5/2core peak on moving from open circuit voltage to 4V identifiesthe Ru4+
→Ru5+ oxidation process29 (Fig. 4, left), while theappearance of the 530.5 eV O 1s component at higher voltagesis characteristic of the formation of peroxo-like O2
2− species30.A peculiarity here is the appearance of an O2
2− peak in the 4Vsample before complete oxidation of Ru4+ to Ru5+, for reasons to bediscussed later (Supplementary Fig. 9). Repeated discharge–charge(Supplementary Fig. 10) demonstrates the reversibility of theseRu4+/Ru5+ and O2−/O2
2− processes, the latter being also confirmedby parallel EPR measurements (Supplementary Fig. 11) aspreviously described for the Li2Ru1−ySnyO3 phases12.
The true novelty here comes from the evolution of Ti 2p3/2core spectra. In the pristine electrode, the Ti 2p3/2 componentobserved at 458.0 eV and the binding energy difference (O 1s–Ti2p3/2) of 71.5 eV are characteristic of Ti4+ ions in an octahedralenvironment31. For samples charged to 3.9V a small shoulderappears at 459.1 eV, which becomes prominent at 4.6 V. Sucha high binding energy (that is, decrease in electron density) ischaracteristic of Ti4+ in a tetrahedral environment as reportedearlier32 and can be explained by weaker Ti 3d–O 2p overlap inthe tetrahedral environment. The amount of tetrahedral Ti4+, as
deduced from integration of the spectra, is ∼15% and ∼30% forthe 3.9V and 4.6V samples, respectively. This result is consistentwith the relative ease of Ti4+ ions migrating from octahedralto tetrahedral coordination due to the absence of ligand fieldstabilization25,33. At this point, it is tempting to suspect a correlationbetween the formation of O2
2− entities and the Ti4+ migration,but such a correlation cannot be ascertained owing to the largecontamination by surface oxide species that render the spectraldeconvolution speculative given the small amount of O2
2−. Afterdischarge, there is appearance of an additional component at457.2 eV which can be attributed to Ti3+ ions (reduction of Ti4+).From quantitative analysis we could deduce that the amount of Ti3+is about 35% and that octahedral Ti4+ ions are mainly involvedin the reduction process. The spectra obtained after 30 and 50cycles clearly indicate an increase in the amount of tetrahedraltitanium from ∼10% after the first cycle to ∼40% after 50 cycles.Those values are further refined by the investigation of Ti 3p corepeaks (Supplementary Fig. 12), which offer less surface sensitivity,indicating a similar evolution over many cycles with slightly loweramounts of titanium in tetrahedral sites (1 cycle: ∼20%, 50 cycles:∼34%). Unfortunately, a similar approach is not feasible withRu 3d because of the less resolved core spectra associated withthe Ru4+
→Ru5+ oxidation process. Last, the invariance of Sn 3dcore spectra when charging/discharging Li2Ru1−ySnyO3 implies theabsence of Sn4+ migration to tetrahedral interstices12.
NATURE MATERIALS | VOL 14 | FEBRUARY 2015 | www.nature.com/naturematerials 233
© 2015 Macmillan Publishers Limited. All rights reserved

ARTICLES NATUREMATERIALS DOI: 10.1038/NMAT4137
Ru 3d5/2Ti4+ in
octahedral site
LatticeOxygen(O2
2−)
Ti4+ in tetrahedral site
Ti4+ in tetrahedral site
Ti3+Ti3+
C 1s–Ru 3d a
b
a
b
a
b
O 1s Ti 2p3/2 Ti 2p3/2
Lattice oxygen (O2−)
Oxygenated deposited
species
Electrolyte oxidation
Pristine
Cycle 1
30 cycles
50 cycles
11%
41%
33%
45%
18%
34%30%
15%
11%
284 283 282 281 537 534 531 528 460 458 456 460 458 456Binding energy (eV) Binding energy (eV) Binding energy (eV) Binding energy (eV)
c c c
d d d
Figure 4 | XPS of Li2Ru0.75Ti0.25O3. a–d, XPS spectra of the pristine Li2Ru0.75Ti0.25O3 sample (a), and of similar electrodes independently charged to3.9 V (b), 4.6 V (c), and charged–discharged to 2 V (d). C 1s–Ru 3d spectra showing the Ru 3d5/2 peak (blue region) together with a satellite peak (dashedblue region). The red and green arrows and lines are guides to the eye to show the shifting of the Ru 3d5/2 peak with charging and discharging. The O 1score spectrum consists of two peaks corresponding to crystalline O2− (529.5 eV) and surface oxidized species (531.6 eV). The new component appearingat 530.5 eV for the sample charged to 4.6 V is due to peroxo-like species associated with anion contribution for the redox process. Ti 2p3/2 spectra, as afunction of the cell voltage, are shown in the second panel from the right to highlight the partial migration of Ti4+ from the octahedral site together with itspartial reduction on discharge. The right panel shows the evolution of the Ti 2p3/2 spectra with increasing number of cycles (1, 30 and 50 cycles).
Overall, XPS results show: that the Li-uptake/removal processin Li2Ru1−yTiyO3 involves cumulative contributions of cationic(Ti4+⇀↽ Ti3+/Ru5+⇀↽ Ru4+) and anionic (O2
n−⇀↽O2−) reversibleredox processes; and a significant amount of Ti4+ migration fromoctahedral to tetrahedral interstices that increases on cycling (Fig. 4,right). To address the preferentially reduced Ti4+ sites, EPR wasperformed on the Li2Ru0.75Sn0.25O3 electrode, discharged to 2V. The4.2 K EPR spectrum (Supplementary Fig. 11) shows a set of twosignals, with a weak g anisotropy (g = 1.92 and 1.89) for the firstone and a lower g factor (1.79) for the second, which we ascribeto octahedral and tetrahedral Ti3+ centres, respectively34,35. Thisresult confirms theTi4+/Ti3+ reduction process detected byXPS, andprovides evidence for the feasibility to partially reduce Ti4+ in bothtetrahedral and octahedral sites, although quantification could notbe done.
Another feature that cannot be deduced by XPS is the degree ofcation migration between octahedral sites within the LiM2 layersand the Li3 layers, hereafter denoted as OcM and OcLi, respectively,owing to nearly identical binding energies of both environments.The most natural technique to visualize cation migration at thelocal scale is HAADF-STEM. Thus, HAADF-STEM images werecollected for the Li2Ru0.75M0.25O3 (M=Ti, Sn, Ru) electrodes cycledin similar conditions for various states of charge and discharge.Details on interpretation of the HAADF-STEM images are providedin Supplementary Figs 13 and 14.
We first studied the pristine Li2Ru0.75M0.25O3 material forwhichHAADF-STEM images revealed a two-dimensionally orderedstructure with perfect Li and (Ru, Ti) ordering within the LiM2layers and no antisite defects between the Li3 and LiM2 layers(Supplementary Fig. 3). This contrasts with the overview [100]HAADF-STEM image (Fig. 5a) collected for a fully charged samplethat shows the removal of Li to cause massive micro-structuralchanges, specifically: substantial disorder of the Li and (Ru, Ti)cations within the LiM2 layers; migration of significant fractions
of (Ru, Ti) cations from the octahedral OcM positions in the LiM2layers to the octahedral positions OcLi in the Li3 layers; and thepresence of local areas with partial occupation of the tetrahedralinterstices between the LiM2 and Li3 layers by the (Ru, Ti) cations.These structural changes are not homogeneous throughout thesample, as highlighted by the three typical HAADF-STEM imagesin Fig. 5b–d. In the portion of the sample probed in Fig. 5b, Li and(Ru, Ti) ordering within the LiM2 layers is mainly preserved, buta fraction of (Ru, Ti) cations migrate to the tetrahedral intersticesand a marginal amount of cations move to the OcLi positions.In the area shown in Fig. 5c, the occupation of OcLi positionsis greater, with nevertheless some (Ru, Ti) cations remaining attetrahedral interstices. Last, the image in Fig. 5d shows a partof the sample in which a large fraction of (Ru, Ti) cations havemoved to the OcLi site and virtually no M cations remain in thetetrahedral sites.
Turning to the discharged Li2Ru0.75Ti0.25O3 sample (Supplemen-tary Fig. 15), the HAADF-STEM pattern nearly converges back tothat of a pristine sample, implying that most of the cations migrateback to their initial positions. Nevertheless, some remaining tracesof cations in tetrahedral interstices are observable at the edge of thecrystallite, and also at the distances of 15–25 nm towards the crystal-lite core, where the image resolution is not yet deterioratedmarkedlyby increasing the crystal thickness (Supplementary Fig. 16).
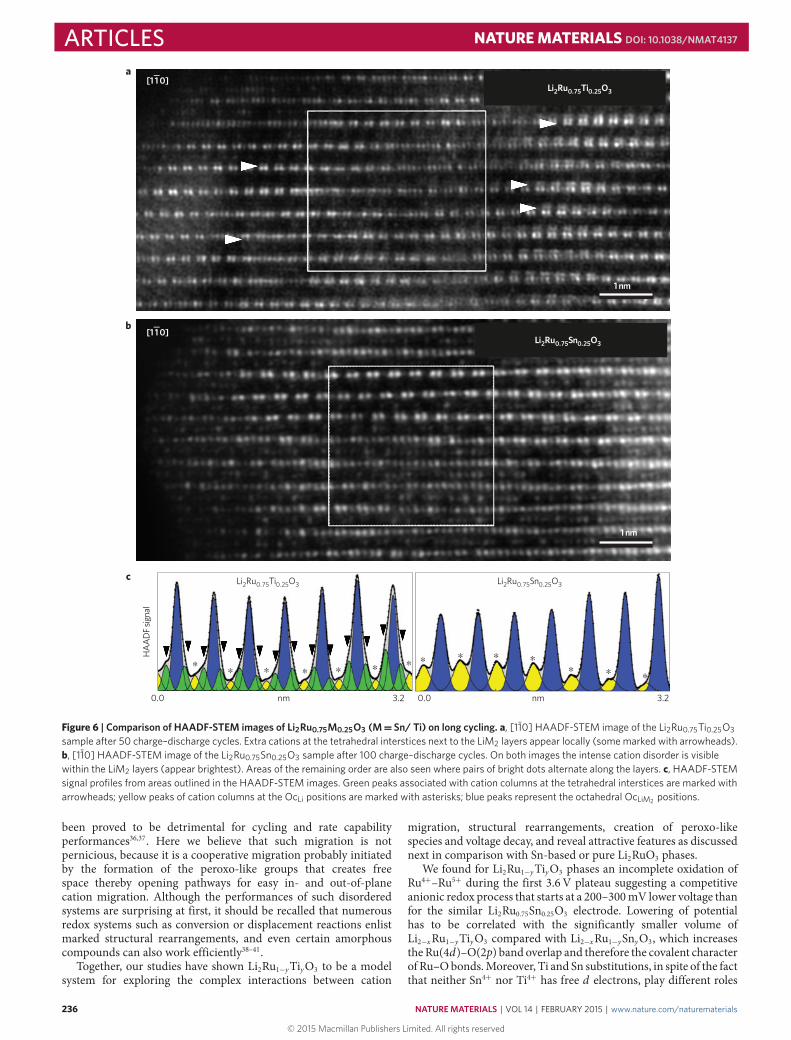
Next, we collected HAADF-STEM images of a Li2Ru0.75Ti0.25O3electrode cycled 50 times. The images significantly differ from thosecollected after one cycle, showing an intense disorder of Li and(Ru, Ti) cations within the LiM2 layers and migration of (Ru/Ti)cations away from the LiM2 planes towards neighbouring interstitialpositions (Fig. 6a,c, left). Fitting of the HAADF-STEM signal profilereveals a dominance of peaks corresponding to the migration of(Ru/Ti) cations towards tetrahedral sites, with peaks reminiscent ofOcLi site occupancy being barely visible. Overall it clearly indicates,in agreement with XPS results, that the occupancy of interstitial
234 NATURE MATERIALS | VOL 14 | FEBRUARY 2015 | www.nature.com/naturematerials
© 2015 Macmillan Publishers Limited. All rights reserved

NATUREMATERIALS DOI: 10.1038/NMAT4137 ARTICLES
Pristine
0.0 0.8 1.6
001
060
nm
HA
AD
F si
gnal
HA
AD
F si
gnal
HA
AD
F si
gnal
HA
AD
F si
gnal
HA
AD
F si
gnal
a
2.80.0 nm
2.70.0 nm
2.60.0 nm
∗
∗ ∗
∗ ∗
∗ ∗∗
∗
∗ ∗ ∗∗
∗∗
Pristine
0.14 nm
Charged to 4.6 V
0.0 0.8 1.6
[100]
2 nm
b
c
d
Figure 5 | HAADF-STEM images of Li2Ru0.75Ti0.25O3 electrodes. a, [100] overview HAADF-STEM image of the Li2Ru0.75Ti0.25O3 sample charged to4.6 V. The insets show (from top to bottom): HAADF-STEM image of the atomic columns in the LiM2 layer of the pristine Li2Ru0.75Ti0.25O3 sample alongwith the corresponding intensity profile demonstrating pair of dots separated by∼0.14 nm (this corresponds to perfect honeycomb ordering of the Li andM cations within the LiM2 layers); HAADF-STEM image of the atomic columns in the LiM2 layer of the charged Li2Ru0.75Ti0.25O3 sample along with thecorresponding intensity profile demonstrating significant disorder of the M cations within the LiM2 layers; selected-area electron di�raction pattern of thecharged Li2Ru0.75Ti0.25O3 sample showing lines of di�use modulated intensity at the k 6=3n positions due to local remaining order of the M cations in theLiM2 layers. b–d, Images and corresponding HAADF-STEM signal profiles illustrating the di�erent stages of the cation migration. b, The pristine structureis mostly preserved, most of the (Ru, Ti) cations are in the octahedral OcM positions (blue peaks on the profiles), but a fraction of the (Ru, Ti) cations aremoved to the tetrahedral interstices (green peaks on the profile marked with arrowheads). Occupation of the octahedral positions in the Li3 layer remainsmarginal (yellow peaks on the profile marked with asterisks). c, Occupation of the octahedral positions in the Li3 layer increases, some (Ru, Ti) cationsremain at tetrahedral interstices. d, A large fraction of the (Ru, Ti) cations are moved to the octahedral position in the Li3 layer. For simplification, in theaforementioned description, the Li3 and LiM2 layers of the pristine structure are termed as Li3 and LiM2 although the cation composition of these layers ischanged substantially owing to cation migration.
tetrahedral sites increases with the number of cycles. A simpleexplanation is that the cations are progressively trapped within thetetrahedral sites as they migrate back and forth between OcM andOcLi sites, suggesting a possible correlation between the voltagedecay and the trapping degree on cycling.
To test such a possible correlation we explored Li2Ru0.75Sn0.25O3(Fig. 6) electrodes that had been cycled 100 times and showedthe lowest voltage decay. HAADF-STEM images provide directevidence for cation migration towards OcLi sites in this systemas well (Fig. 6b,c, right). More important is the quasi absence ofcations in tetrahedral sites for this sample, further supporting ourtentative correlation.
Finally, to clarify the outcome of Ru ions on cycling, we also stud-ied Li2RuO3 electrodes cycled once, and after 100 cycles (Supple-mentary Figs 17 and 18). Comparing the HAADF-STEM image of
Li2RuO3 and Li2Ru0.75Ti0.25O3 electrodes after one charge–dischargecycle (Supplementary Figs 16 and 17) reveals virtually no populationof tetrahedral sites in the pure Ru sample. This contrasts with theHAADF-STEM images collected after 100 cycles, which indicatethe presence of Ru in tetrahedral sites. However, a comparison ofthe HAADF-STEM signal profiles of Li2Ru0.75Ti0.25O3 and Li2RuO3samples cycled 50 and 100 times, respectively (Fig. 6c and Supple-mentary Fig. 18), demonstrates that even after twice as many cyclesthe population of tetrahedral interstices in Li2RuO3 does not reachthe level of Li2Ru0.75Ti0.25O3. Taking into account the lower rate ofvoltage decay for Li2RuO3 compared with Ti-doped samples, thisfurther supports the relationship between cation trapping at thetetrahedral interstices and voltage decay.
With respect to practical application, the migration of cationswithin the van der Waals gap (namely M in the Li3 layer) has
NATURE MATERIALS | VOL 14 | FEBRUARY 2015 | www.nature.com/naturematerials 235
© 2015 Macmillan Publishers Limited. All rights reserved
ARTICLES NATUREMATERIALS DOI: 10.1038/NMAT4137
Li2Ru0.75Ti0.25O3
HA
AD
F sig
nal
a
b
c Li2Ru0.75Ti0.25O3 Li2Ru0.75Sn0.25O3
Li2Ru0.75Sn0.25O3
1 nm
1 nm
[1 1 0]
[1 1 0]
∗ ∗ ∗ ∗ ∗ ∗ ∗ ∗ ∗ ∗ ∗∗ ∗ ∗
0.0 nm 3.20.0 nm 3.2
Figure 6 | Comparison of HAADF-STEM images of Li2Ru0.75M0.25O3 (M= Sn/ Ti) on long cycling. a, [11̄0] HAADF-STEM image of the Li2Ru0.75Ti0.25O3sample after 50 charge–discharge cycles. Extra cations at the tetrahedral interstices next to the LiM2 layers appear locally (some marked with arrowheads).b, [11̄0] HAADF-STEM image of the Li2Ru0.75Sn0.25O3 sample after 100 charge–discharge cycles. On both images the intense cation disorder is visiblewithin the LiM2 layers (appear brightest). Areas of the remaining order are also seen where pairs of bright dots alternate along the layers. c, HAADF-STEMsignal profiles from areas outlined in the HAADF-STEM images. Green peaks associated with cation columns at the tetrahedral interstices are marked witharrowheads; yellow peaks of cation columns at the OcLi positions are marked with asterisks; blue peaks represent the octahedral OcLiM2 positions.
been proved to be detrimental for cycling and rate capabilityperformances36,37. Here we believe that such migration is notpernicious, because it is a cooperative migration probably initiatedby the formation of the peroxo-like groups that creates freespace thereby opening pathways for easy in- and out-of-planecation migration. Although the performances of such disorderedsystems are surprising at first, it should be recalled that numerousredox systems such as conversion or displacement reactions enlistmarked structural rearrangements, and even certain amorphouscompounds can also work efficiently38–41.
Together, our studies have shown Li2Ru1−yTiyO3 to be a modelsystem for exploring the complex interactions between cation
migration, structural rearrangements, creation of peroxo-likespecies and voltage decay, and reveal attractive features as discussednext in comparison with Sn-based or pure Li2RuO3 phases.
We found for Li2Ru1−yTiyO3 phases an incomplete oxidation ofRu4+–Ru5+ during the first 3.6 V plateau suggesting a competitiveanionic redox process that starts at a 200–300mV lower voltage thanfor the similar Li2Ru0.75Sn0.25O3 electrode. Lowering of potentialhas to be correlated with the significantly smaller volume ofLi2−xRu1−yTiyO3 compared with Li2−xRu1−ySnyO3, which increasesthe Ru(4d)–O(2p) band overlap and therefore the covalent characterof Ru–Obonds.Moreover, Ti and Sn substitutions, in spite of the factthat neither Sn4+ nor Ti4+ has free d electrons, play different roles
236 NATURE MATERIALS | VOL 14 | FEBRUARY 2015 | www.nature.com/naturematerials
© 2015 Macmillan Publishers Limited. All rights reserved
NATUREMATERIALS DOI: 10.1038/NMAT4137 ARTICLESon the Li2−xRuyM1−yO3 (M=Ti/Sn) band structures. Whereas theSn(5s, 5p, 5d) bands are too high in energy to overlap with theO(2p)bands, the low-lying empty Ti(3d) bands allow this overlap thatraises the O–O anti-bonding band (Supplementary Fig. 19). Thesestructural and electronic features not only enable the oxidationof oxo-ligands to peroxo-like species at lower potential for theTi-substituted samples but also limit the flexibility of the oxygenlattice, which is therefore more prone to O2 release than for theSn-substituted samples, as confirmed by differential electrochemicalmass spectroscopy experiments (data not shown).
Collectively, these data establish a robust correlation betweenthe voltage decay shown by Li-rich Li2Ru1−yMyO3 phases and theamount of cations that remain locked in tetrahedral sites. Thelargest decay was observed for Ti4+, which owing to its smallersize compared with Sn4+, is more prone to migrate through anintermediary tetrahedral site and hence to be trapped. Cationmigration in layered oxides has been the subject of theoreticalstudies that have predicted several migration paths enlisting themigration of cations from OcM to OcLi sites either directly or byintermediary tetrahedral sites with the latter one being energeticallyfavourable25,42. However, previous calculations were done withoutconsidering the reversible formation of peroxo-like groups becauseat the time such an effect was not known in these Li-richcompounds.
Density functional theory (DFT) calculations performed onthe present Li1Ru1/2M1/2O3 (M= Ru, Ti, Sn) compounds (seeTable in Supplementary Fig. 20) confirm that Ti4+ is the onlycation stable in a tetrahedral coordination at this Li composition.More interestingly, the LiRu0.5Ti0.5O3 relaxed structure shows aspontaneousmigration of Ti4+ cations fromOcM to TdM (tetrahedralposition next to the LiM2 layers), concomitantly with the formationof peroxo-like groups (Supplementary Fig. 20b) whereas the Sn4+
ions in LiRu0.5Sn0.5O3 remain in their OcM sites in accordancewith our experimental findings. In contrast, for pure LiRuO3 theRu5+ spontaneously migrates from TdLi (tetrahedral position nextto the Li3 layers) or TdM to OcLi, the latter showing equivalentthermodynamic stability to OcM (to 23meV). This suggests a lowkinetic barrier for the OcM→OcM→OcM path in this system,perfectly consistent with the enlarged migration pathway resultingfrom the formation of peroxo-like species (Supplementary Fig. 20c).For the fully charged material RuO3, we note that the tetrahedralsites become more favourable than the OcLi and as favourableas the OcM, in perfect agreement with our microscopy resultsshowing some Ru in tetrahedral sites after long cycling (see Tablein Supplementary Figs 20 and 21).
In summary, we show that cation migration is an intrinsicand inseparable part of the charge–discharge process in the Li-rich phases and also that the continuous reduction in the averagecell voltage is related to the trapping of metal ions in tetrahedralsites that seem to favour the stability of delithiated structures.Although no straightforward solution yet exists, this study suggestsresearch directions that may help obviate the voltage decay issue.One route is to increase the amount of large spectator ions,such as tin, to slow down or prevent the Td trapping. Tin’sbeneficial effect is demonstrated by a 50% decrease in voltagefading when increasing the amount of Sn from 25% to 50%(Fig. 2b,c), but this is at the expense of an energy density penaltyrendering this approach poorly attractive. An alternative is theuse of electro-active cations larger than Ru while ensuring strongd–sp hybridization to take advantage of the additional O2−
→O2n−
redox capacity. This can be realized by moving to 4d metalssuch as Mo or Nb. Recent work on new cation-disordered rock-salt phases Li1.3Nb1−xMxO2 (ref. 43) having capacities approaching300mAh g−1 validates our reasoning although the long-term cyclingof such phases is not yet reported.Wehope this better understandingof the voltage decay phenomenon will provide clues to chemists
for identifying formulations to harvest all advantages of this newclass of high-capacity electrodes based on dual cationic and anionicredox mechanisms.
MethodsSynthesis of Li2Ru1−yTiyO3 (0≤ y ≤ 1). Stoichiometric amounts of RuO2
(Sigma-Aldrich 99.9%) and TiO2 (Sigma-Aldrich 98%) were homogenized, usinga mortar and pestle for 20min and then ball milled for 40min with a 10wt%excess of Li2CO3 (Sigma-Aldrich, purity 99.0%) to compensate its volatilization athigh temperature. The resultant mixture was heated at 800 ◦C for 24 h withintermediate grinding. Furnace heating and cooling rate was maintained at2 ◦Cmin−1.
XRD. XRD patterns were recorded using a Bruker D8 diffractometer equippedwith a Cu Kα radiation source (λ1=1.54056Å, λ2=1.54439Å) and a LynxEyedetector operated at 40 kV and 40mA. The powder XRD patterns were refinedusing the Rietveld method44 as implemented in the FullProf program45. In situXRD analysis was carried out in a specially made Swagelok-type stainless-steelcell with an X-ray-transparent Be window. An aluminium foil was used betweenthe Be window and the active material to prevent the oxidation of Be at higheroperating voltages. High-resolution synchrotron powder diffraction patterns werecollected on powders sealed under argon in glass capillaries of 0.8mm diameter.The data were collected at the 11-BM beamline through the mail-in program atthe Advanced Photon Source, ANL using a beam of wavelength 0.4138Å.
Electrochemical insertion/extraction of Li+. Electrochemical tests versus Liwere done in Swagelok-type cells. The cells were assembled in an argon-filledglove box, using a ball-milled mixture of pristine material (Li2Ru1−yMyO3,M=Ti/Sn/Ru) with 10% of SP carbon as the positive electrode and a Li metaldisc as the negative electrode. A Whatman GF/D borosilicate glass fibre sheetseparator saturated with 1M LiPF6 solution in a mixture of ethylene carbonate,propylene carbonate and dimethyl carbonate in a 1:1:3 ratio by weight (LP100)was employed. The mechanical mixing was performed under an argonatmosphere using a Spex-800 mixer-mill. Galvanostatic charge–discharge testswere conducted at 20 ◦C using a Mac-Pile or a VMP system (Biologic S.A.)operating in galvanostatic mode. Unless otherwise specified, the cells weretypically cycled between 4.6 and 2V versus Li+/Li0 at 1 Li+ exchanged per 5 h(C/5). All of the results reported herein have been reproduced at least twice.
XPS data collection and analysis. XPS measurements were carried out using aKratos Axis Ultra spectrometer connected through a transfer chamber to anargon-filled dry box. The samples were carefully transferred to the XPSspectrometer without any exposure to air/moisture and were analysed usingmonochromatized Al Kα radiation (1,486.6 eV). The pressure in the analysischamber was maintained at around 5×10⁻⁹ mbar. Short acquisition time spectrawere recorded before each experiment to analyse the stability of the sample underirradiation and then the normal spectra were collected with a constant passenergy of 20 eV. The binding energy scale was calibrated using the C 1s peak at285.0 eV and the peak positions and areas were optimized by a weightedleast-squares fitting method using 70% Gaussian, 30% Lorentzian line shapes.Quantification was performed on the basis of Scofield’s relative sensitivity factors.
EPR spectra. EPR spectra were recorded using a Bruker ELEXSYS E580spectrometer at 5mW microwave power and 5G modulation amplitude. Themeasurements were carried out at room temperature and at 4 K.
Transmission electron microscopy. The samples were handled in an Ar-filledglove box. TEM specimens were prepared in the glove box by crushing thecrystals in a mortar in anhydrous hexane and depositing drops of suspensiononto holey carbon grids. The specimens were transported to the microscopecolumn completely excluding contact with air. Electron diffraction patterns wereobtained with a Tecnai G2 electron microscope operated at 200 kV.HAADF-STEM images were obtained with aberration-corrected Titan G3
electron microscopes operated at 200 kV using a convergence semi-angle of21.6mrad. The HAADF inner collection semi-angle was 70mrad.
DFT+U calculations. Spin-polarized DFT + U (Ueff=4 eV for Ru) calculationswere performed using the VASP code46,47 and the GGA-PBE functional48. Theplane-wave energy cutoff was set to 600 eV and the Brillouin zone integration wasdone in a k-point grid distributed as uniformly as possible. All atom coordinatesand lattice parameters were fully relaxed using conjugate gradient energyminimization until the forces acting on each atom were less than 5×10⁻³ eVÅ−2.
Received 7 January 2014; accepted 6 October 2014;published online 1 December 2014
NATURE MATERIALS | VOL 14 | FEBRUARY 2015 | www.nature.com/naturematerials 237
© 2015 Macmillan Publishers Limited. All rights reserved

ARTICLES NATUREMATERIALS DOI: 10.1038/NMAT4137
References1. Whittingham, M. S. Materials challenges facing electrical energy storage.
MRS Bull. 33, 411–419 (2008).2. Armand, M. & Tarascon, J-M. Building better batteries. Nature 451,
652–657 (2008).3. Palacin, M. R. Recent advances in rechargeable battery materials: A chemist’s
perspective. Chem. Soc. Rev. 38, 2565–2575 (2009).4. Armand, M. & Tarascon, J-M. Issues and challenges facing rechargeable
lithium batteries. Nature 414, 359–367 (2001).5. Prosini, P. P. Iron Phosphate Materials as Cathodes for Lithium Batteries
(Springer, 2011).6. Rousse, G. & Tarascon, J-M. Sulfate-based polyanionic compounds for Li-ion
batteries: Synthesis, crystal chemistry, and electrochemistry aspects.Chem. Mater. 26, 294–406 (2014).
7. He, P., Yu, H., Li, D. & Zhou, H. Layered lithium transition metal oxidecathodes towards high energy lithium-ion batteries. J. Mater. Chem. 22,3680–3695 (2012).
8. Ohzuku, T. & Makimura, Y. Layered lithium insertion material ofLiCo1/3Ni1/3Mn1/3O2 for lithium-ion batteries. Chem. Lett. 30,642–643 (2001).
9. Koyama, Y., Tanaka, I., Adachi, H., Makimura, Y. & Ohzuku, T. Crystal andelectronic structures of superstructural Li1−x [Co1/3Ni1/3Mn1/3]O2 (0 ≤ x ≤ 1).J. Power Sources 119–121, 644–648 (2003).
10. Thackeray, M. M. et al. Li2MnO3-stabilized LiMO2 (M=Mn, Ni, Co)electrodes for lithium-ion batteries. J. Mater. Chem. 17, 3112–3125 (2007).
11. Zhou, F., Zhao, X., van Bommel, A., Xia, X. & Dahn, J. R. Comparison ofLi[Li1/9Ni1/3Mn5/9]O2, Li[Li1/5Ni1/5Mn3/5]O2, LiNi0.5Mn1.5O4, andLiNi2/3Mn1/3O2 as high voltage positive electrode materials. J. Electrochem. Soc.158, A187–A191 (2011).
12. Sathiya, M. et al. Reversible anionic redox chemistry in high-capacitylayered-oxide electrodes. Nature Mater. 12, 827–835 (2013).
13. Koga, H. et al. Reversible oxygen participation to the redox processesrevealed for Li1.20Mn0.54Co0.13Ni0.13O2. J. Electrochem. Soc. 160,A786–A792 (2013).
14. Bettge, M. et al. Voltage fade of layered oxides: Its measurement and impact onenergy density. J. Electrochem. Soc. 160, A2046–A2055 (2013).
15. Gallagher, K. G. et al. Correlating hysteresis and voltage fade in lithium- andmanganese-rich layered transition-metal oxide electrodes. Electrochem.Commun. 33, 96–98 (2013).
16. Croy, J. R. et al. Examining hysteresis in composite xLi2MnO3 ·(1−x)LiMO2
cathode structures. J. Phys. Chem. C 117, 6525–6536 (2013).17. Gu, M. et al. Formation of the spinel phase in the layered composite cathode
used in Li-ion batteries. ACS Nano 7, 760–767 (2012).18. Mohanty, D. et al. Investigating phase transformation in the
Li1.2Co0.1Mn0.55Ni0.15O2 lithium-ion battery cathode during high-voltage hold(4.5 V) via magnetic, X-ray diffraction and electron microscopy studies.J. Mater. Chem. A 1, 6249–6261 (2013).
19. Ito, A. et al. Direct observation of the partial formation of a frameworkstructure for Li-rich layered cathode material Li[Ni0.17Li0.2Co0.07Mn0.56]O2
upon the first charge and discharge. J. Power Sources 196,4785–4790 (2011).
20. Zheng, J. et al. Corrosion/fragmentation of layered composite cathode andrelated capacity/voltage fading during cycling process. Nano Lett. 13,3824–3830 (2013).
21. Croy, J. R. et al. Countering the voltage decay in high capacityxLi2MnO3 ·(1−x)LiMO2 electrodes (M=Mn, Ni, Co) for Li+-ion batteries.J. Electrochem. Soc. 159, A781–A790 (2012).
22. Hong, J. et al. Structural evolution of layered Li1.2Ni0.2Mn0.6O2 uponelectrochemical cycling in a rechargeable battery. J. Mater. Chem. 20,10179–10186 (2010).
23. Xu, B., Fell, C-R., Chi, M. & Meng, Y-S. Identifying surface structural changesin layered Li-excess nickel manganese oxides in high voltage lithium ionbatteries: A joint experimental and theoretical study. Energy Environ. Sci. 4,2223–2233 (2011).
24. Sathiya, M. et al.High performance Li2Ru1−yMnyO3 (0.2 ≤ y ≤ 0.8) cathodematerials for rechargeable lithium-ion batteries: Their understanding.Chem. Mater. 25, 1121–1131 (2013).
25. Reed, J. & Ceder, G. Role of electronic structure in the susceptibility ofmetastable transition-metal oxide structures to transformation. Chem. Rev.104, 4513–4534 (2004).
26. Kang, K. & Ceder, G. Factors that affect Li mobility in layered lithiumtransition metal oxides. Phys. Rev. B 74, 094105 (2006).
27. Yu, H. & Zhou, H. High-energy cathode materials (Li2MnO3–LiMO2) forlithium-ion batteries. J. Phys. Chem. Lett. 4, 1268–1280 (2013).
28. Kang, S. H. et al. Interpreting the structural and electrochemicalcomplexity of 0.5Li2MnO3.0.5LiMO2 electrodes for lithium batteries(M=Mn0.5−xNi0.5−xCo2x , 0 ≤ x ≤0.5). J. Mater. Chem. 17, 2069–2077 (2007).
29. Manju, U., Awana, V. P. S., Kishan, H. & Sarma, D. D. X-ray photoelectronspectroscopy of superconducting RuSr2Eu1.5Ce0.5Cu2O10 andnonsuperconducting RuSr2EuCeCu2O10. Phys. Rev. B 74, 245106 (2006).
30. Dupin, J-C., Gonbeau, D., Vinatier, P. & Levasseur, A. Systematic XPS studies ofmetal oxides, hydroxides and peroxides. Phys. Chem. Chem. Phys. 2,1319–1324 (2000).
31. Atuchin, V. V., Kesler, V. G., Pervukhina, N. V. & Zhang, Z. Ti 2p and O 1s corelevels and chemical bonding in titanium-bearing oxides. J. Electron Spectrosc.Relat. Phenom. 152, 18–24 (2006).
32. Arillo, M. A. et al. Surface characterisation of spinels with Ti(IV) distributed intetrahedral and octahedral sites. J. Alloys Compd. 317–318, 160–163 (2001).
33. Kang, K. et al. Synthesis and electrochemical properties of layeredLi0.9Ni0.45Ti0.55O2. Chem. Mater. 15, 4503–4507 (2003).
34. Morra, E., Giamello, E. & Chiesa, M. Probing the redox chemistry of titaniumsilicate-1: Formation of tetrahedral Ti3+ centers by reaction with triethylaluminium. Chemistry 20, 7381–7388 (2014).
35. Lopez, M. C. et al. Tunable Ti4+/Ti3+ redox potential in the presence of ironand calcium in NASICON-type related phosphates as electrodes for lithiumbatteries. Chem. Mater. 25, 4025–4035 (2013).
36. Lu, Z. & Dahn, J. R. In situ and ex situ XRD investigation ofLi[CrxLi1/3−x/3Mn2/3−2x/3]O2 (x=1/3) cathode material. J. Electrochem. Soc.150, A1044–A1051 (2003).
37. Bak, S-M. et al. Correlating structural changes and gas evolution during thethermal decomposition of charged LixNi0.8Co0.15Al0.05O2 cathode materials.Chem. Mater. 25, 337–351 (2013).
38. Morcrette, M. et al. A reversible copper extrusion-insertion electrode forrechargeable Li batteries. Nature Mater. 2, 755–761 (2003).
39. Qian, J., Qiao, D., Ai, X., Cao, Y. & Yang, H. Reversible 3-Li storage reactions ofamorphous phosphorus as high capacity and cycling-stable anodes for Li-ionbatteries. Chem. Commun. 48, 8931–8933 (2012).
40. Poizot, P. et al. Evidence of an electrochemically assisted ion exchange reactionin Cu2.33V4O11 electrode material vs. Li. Electrochem. Solid-State Lett. 8,A184–A187 (2005).
41. Lee, J. et al. Unlocking the potential of cation-disordered oxides forrechargeable lithium batteries. Science 343, 519–522 (2014).
42. Reed, J., Ceder, G. & Van Der Ven, A. Layered-to-spinel phase transition inLixMnO2. Electrochem. Solid-State Lett. 4, A78–A81 (2001).
43. Yabuuchi, N. et al. 224th ECS Meeting (The Electrochemical Society, 2013).44. Rietveld, H. M. A profile refinement method for nuclear and magnetic
structures. J. Appl. Crystallogr. 2, 65–71 (1969).45. Rodriguez-Carvajal, J. Recent advances in magnetic-structure determination
by neutron powder diffraction. Physica B 192, 55–69 (1993).46. Kresse, G. & Furthmüller, J. Efficiency of ab-initio total energy calculations for
metals and semiconductors using a plane-wave basis set. Comput. Mater. Sci. 6,15–50 (1996).
47. Kresse, G. & Hafner, J. Ab initiomolecular dynamics for liquid metals.Phys. Rev. B 47, 558–561 (1993).
48. Perdew, J. P., Burke, K. & Ernzerhof, M. Generalized gradient approximationmade simple. Phys. Rev. Lett. 77, 3865–3868 (1996).
AcknowledgementsThe authors acknowledge both ALISTORE-ERI and RS2E institutions for fullysupporting this work. G.V.T. acknowledges the European Research Council, ERC grantNo. 246791–COUNTATOMS. The research leading to these results has received fundingfrom the European Union Seventh Framework Programme under Grant Agreement312483-ESTEEM2 (Integrated Infrastructure Initiative–I3). C.P.L. thanks the CSIR, NewDelhi for granting a Senior Research Fellowship. Use of the APS (Advanced PhotonSource) at Argonne National Laboratory (ANL) supported by the US Department ofEnergy under Contract No. DE-AC02-06CH11357 is greatly acknowledged. J. Kurzmanis acknowledged for support in editing the manuscript.
Author contributionsM.Sathiya, K.R., C.P.L. and A.S.P. carried out the synthesis, M.Sathiya, and J-M.T.conducted the electrochemical work and J-M.T. designed the research approach; G.R.analysed the crystal structures and diffraction patterns; A.M.A. and G.V.T. carried out,analysed and exploited the electron diffraction and HAADF-STEM studies; D.F. and D.G.collected and analysed the XPS spectra; M.Saubanère and M.L.D. conducted the DFTcalculations and developed the theoretical framework; M.Sathiya, A.M.A. and J-M.T.wrote the manuscript and all authors discussed the experiments and final manuscript.
Additional informationSupplementary information is available in the online version of the paper. Reprints andpermissions information is available online at www.nature.com/reprints.Correspondence and requests for materials should be addressed to J-M.T.
Competing financial interestsThe authors declare no competing financial interests.
238 NATURE MATERIALS | VOL 14 | FEBRUARY 2015 | www.nature.com/naturematerials
© 2015 Macmillan Publishers Limited. All rights reserved