Embed Size (px)
Citation preview
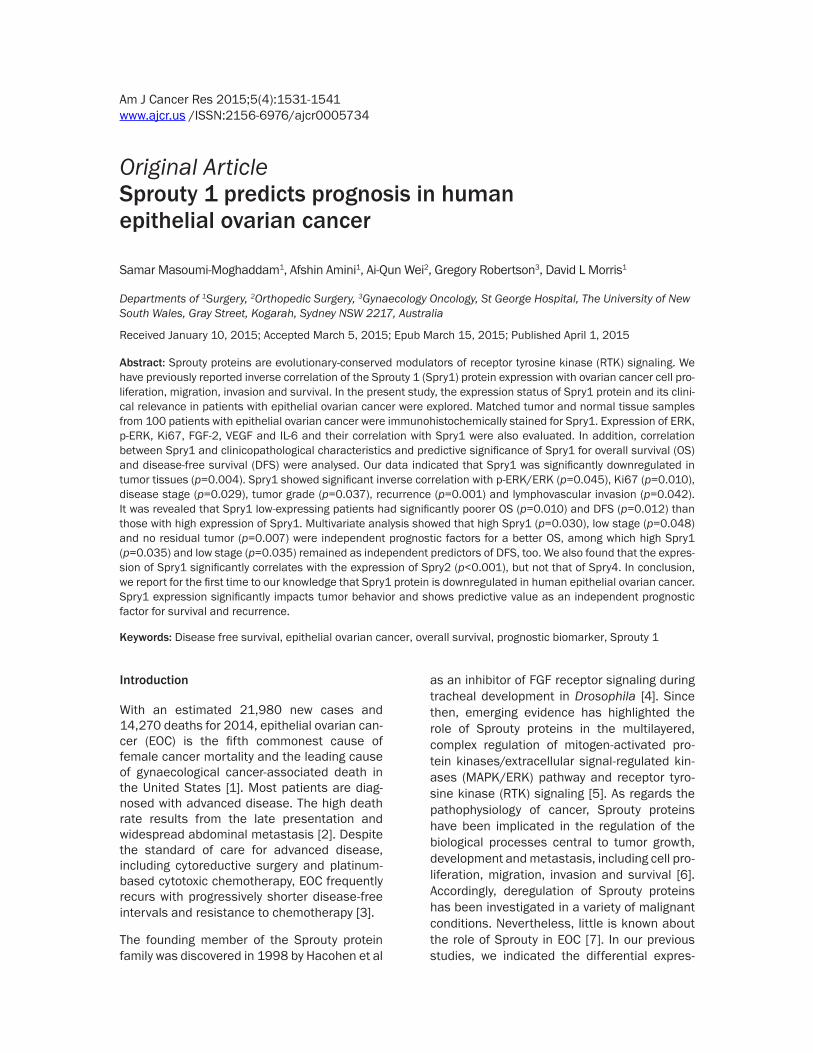
Am J Cancer Res 2015;5(4):1531-1541www.ajcr.us /ISSN:2156-6976/ajcr0005734
Original ArticleSprouty 1 predicts prognosis in human epithelial ovarian cancer
Samar Masoumi-Moghaddam1, Afshin Amini1, Ai-Qun Wei2, Gregory Robertson3, David L Morris1
Departments of 1Surgery, 2Orthopedic Surgery, 3Gynaecology Oncology, St George Hospital, The University of New South Wales, Gray Street, Kogarah, Sydney NSW 2217, Australia
Received January 10, 2015; Accepted March 5, 2015; Epub March 15, 2015; Published April 1, 2015
Abstract: Sprouty proteins are evolutionary-conserved modulators of receptor tyrosine kinase (RTK) signaling. We have previously reported inverse correlation of the Sprouty 1 (Spry1) protein expression with ovarian cancer cell pro-liferation, migration, invasion and survival. In the present study, the expression status of Spry1 protein and its clini-cal relevance in patients with epithelial ovarian cancer were explored. Matched tumor and normal tissue samples from 100 patients with epithelial ovarian cancer were immunohistochemically stained for Spry1. Expression of ERK, p-ERK, Ki67, FGF-2, VEGF and IL-6 and their correlation with Spry1 were also evaluated. In addition, correlation between Spry1 and clinicopathological characteristics and predictive significance of Spry1 for overall survival (OS) and disease-free survival (DFS) were analysed. Our data indicated that Spry1 was significantly downregulated in tumor tissues (p=0.004). Spry1 showed significant inverse correlation with p-ERK/ERK (p=0.045), Ki67 (p=0.010), disease stage (p=0.029), tumor grade (p=0.037), recurrence (p=0.001) and lymphovascular invasion (p=0.042). It was revealed that Spry1 low-expressing patients had significantly poorer OS (p=0.010) and DFS (p=0.012) than those with high expression of Spry1. Multivariate analysis showed that high Spry1 (p=0.030), low stage (p=0.048) and no residual tumor (p=0.007) were independent prognostic factors for a better OS, among which high Spry1 (p=0.035) and low stage (p=0.035) remained as independent predictors of DFS, too. We also found that the expres-sion of Spry1 significantly correlates with the expression of Spry2 (p<0.001), but not that of Spry4. In conclusion, we report for the first time to our knowledge that Spry1 protein is downregulated in human epithelial ovarian cancer. Spry1 expression significantly impacts tumor behavior and shows predictive value as an independent prognostic factor for survival and recurrence.
Keywords: Disease free survival, epithelial ovarian cancer, overall survival, prognostic biomarker, Sprouty 1
Introduction
With an estimated 21,980 new cases and 14,270 deaths for 2014, epithelial ovarian can-cer (EOC) is the fifth commonest cause of female cancer mortality and the leading cause of gynaecological cancer-associated death in the United States [1]. Most patients are diag-nosed with advanced disease. The high death rate results from the late presentation and widespread abdominal metastasis [2]. Despite the standard of care for advanced disease, including cytoreductive surgery and platinum-based cytotoxic chemotherapy, EOC frequently recurs with progressively shorter disease-free intervals and resistance to chemotherapy [3].
The founding member of the Sprouty protein family was discovered in 1998 by Hacohen et al
as an inhibitor of FGF receptor signaling during tracheal development in Drosophila [4]. Since then, emerging evidence has highlighted the role of Sprouty proteins in the multilayered, complex regulation of mitogen-activated pro-tein kinases/extracellular signal-regulated kin- ases (MAPK/ERK) pathway and receptor tyro-sine kinase (RTK) signaling [5]. As regards the pathophysiology of cancer, Sprouty proteins have been implicated in the regulation of the biological processes central to tumor growth, development and metastasis, including cell pro- liferation, migration, invasion and survival [6]. Accordingly, deregulation of Sprouty proteins has been investigated in a variety of malignant conditions. Nevertheless, little is known about the role of Sprouty in EOC [7]. In our previous studies, we indicated the differential expres-
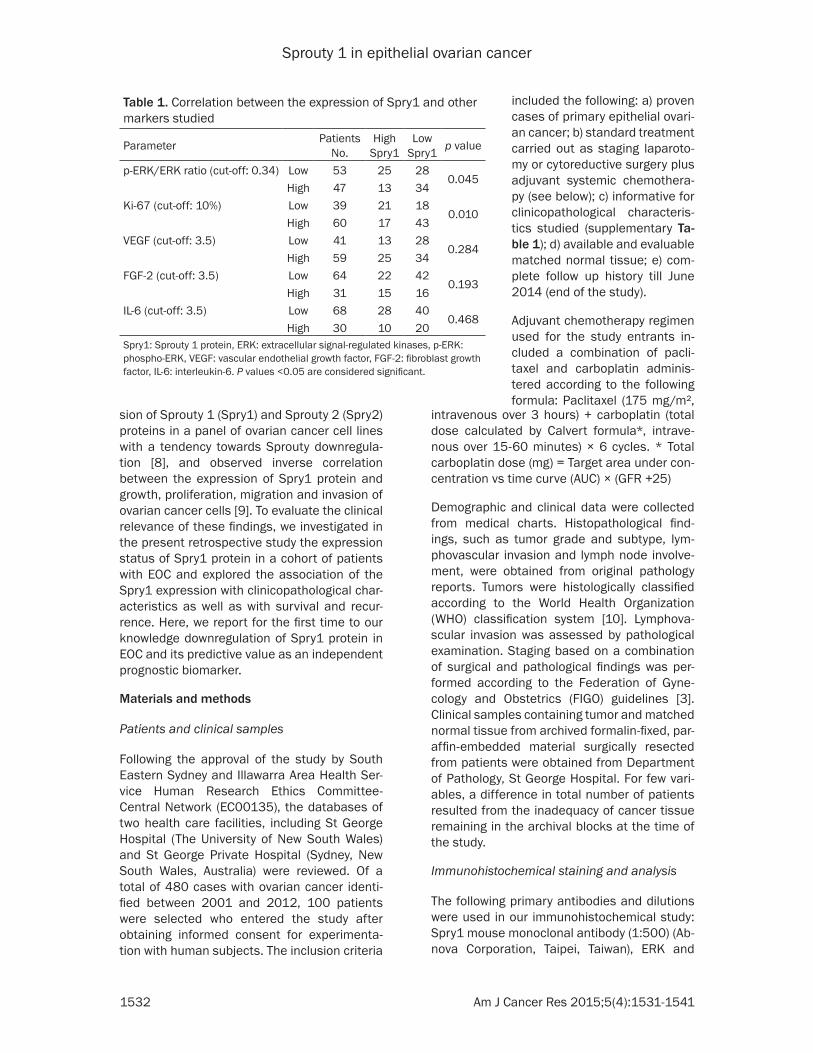
Sprouty 1 in epithelial ovarian cancer
1532 Am J Cancer Res 2015;5(4):1531-1541
sion of Sprouty 1 (Spry1) and Sprouty 2 (Spry2) proteins in a panel of ovarian cancer cell lines with a tendency towards Sprouty downregula-tion [8], and observed inverse correlation between the expression of Spry1 protein and growth, proliferation, migration and invasion of ovarian cancer cells [9]. To evaluate the clinical relevance of these findings, we investigated in the present retrospective study the expression status of Spry1 protein in a cohort of patients with EOC and explored the association of the Spry1 expression with clinicopathological char-acteristics as well as with survival and recur-rence. Here, we report for the first time to our knowledge downregulation of Spry1 protein in EOC and its predictive value as an independent prognostic biomarker.
Materials and methods
Patients and clinical samples
Following the approval of the study by South Eastern Sydney and Illawarra Area Health Ser- vice Human Research Ethics Committee-Central Network (EC00135), the databases of two health care facilities, including St George Hospital (The University of New South Wales) and St George Private Hospital (Sydney, New South Wales, Australia) were reviewed. Of a total of 480 cases with ovarian cancer identi-fied between 2001 and 2012, 100 patients were selected who entered the study after obtaining informed consent for experimenta-tion with human subjects. The inclusion criteria
intravenous over 3 hours) + carboplatin (total dose calculated by Calvert formula*, intrave-nous over 15-60 minutes) × 6 cycles. * Total carboplatin dose (mg) = Target area under con-centration vs time curve (AUC) × (GFR +25)
Demographic and clinical data were collected from medical charts. Histopathological find-ings, such as tumor grade and subtype, lym-phovascular invasion and lymph node involve-ment, were obtained from original pathology reports. Tumors were histologically classified according to the World Health Organization (WHO) classification system [10]. Lymphova- scular invasion was assessed by pathological examination. Staging based on a combination of surgical and pathological findings was per-formed according to the Federation of Gyne- cology and Obstetrics (FIGO) guidelines [3]. Clinical samples containing tumor and matched normal tissue from archived formalin-fixed, par-affin-embedded material surgically resected from patients were obtained from Department of Pathology, St George Hospital. For few vari-ables, a difference in total number of patients resulted from the inadequacy of cancer tissue remaining in the archival blocks at the time of the study.
Immunohistochemical staining and analysis
The following primary antibodies and dilutions were used in our immunohistochemical study: Spry1 mouse monoclonal antibody (1:500) (Ab- nova Corporation, Taipei, Taiwan), ERK and
Table 1. Correlation between the expression of Spry1 and other markers studied
Parameter Patients No.
High Spry1
Low Spry1 p value
p-ERK/ERK ratio (cut-off: 0.34) Low 53 25 280.045
High 47 13 34Ki-67 (cut-off: 10%) Low 39 21 18
0.010High 60 17 43
VEGF (cut-off: 3.5) Low 41 13 280.284
High 59 25 34FGF-2 (cut-off: 3.5) Low 64 22 42
0.193High 31 15 16
IL-6 (cut-off: 3.5) Low 68 28 400.468
High 30 10 20Spry1: Sprouty 1 protein, ERK: extracellular signal-regulated kinases, p-ERK: phospho-ERK, VEGF: vascular endothelial growth factor, FGF-2: fibroblast growth factor, IL-6: interleukin-6. P values <0.05 are considered significant.
included the following: a) proven cases of primary epithelial ovari-an cancer; b) standard treatment carried out as staging laparoto-my or cytoreductive surgery plus adjuvant systemic chemothera-py (see below); c) informative for clinicopathological characteris-tics studied (supplementary Ta- ble 1); d) available and evaluable matched normal tissue; e) com-plete follow up history till June 2014 (end of the study).
Adjuvant chemotherapy regimen used for the study entrants in- cluded a combination of pacli-taxel and carboplatin adminis-tered according to the following formula: Paclitaxel (175 mg/m²,
Sprouty 1 in epithelial ovarian cancer
1533 Am J Cancer Res 2015;5(4):1531-1541
p-ERK rabbit monoclonal antibodies (1:200 and 1:100, respectively) (Cell Signaling Inc., Beverly, MA), Ki67 mouse monoclonal antibody (1:100), FGF-2 rabbit polyclonal antibody (1:200), VEGF and IL-6 mouse monoclonal anti-bodies (1:300 and 1:250, respectively) (Santa Cruz Biotechnology Inc., Santa Cruz, CA). The following tissues were used as positive control: Kidney for Spry1, breast/kidney/fallopian tube for ERK, fallopian tube/prostate cancer for p-ERK, tonsil for Ki67 and IL-6, tonsil/testis for FGF-2, and prostate cancer/breast cancer for VEGF.
Formalin-fixed, paraffin-embedded tissue sec-tions (5 µm-thick) were deparaffinized with xyl- ene and rehydrated. For antigen retrieval, sec-tions were placed in either 10 mM Tris base, 1 mM EDTA solution at pH 9.0 for Ki-67 and inter-leukin-6 (IL-6) or 10 mM sodium citrate buffer at pH 6.0 for the rest and exposed to repeated (twice) microwave heating of 10 min (or twice heating of 5 min for vascular endothelial growth factor (VEGF)) at 750W. After 10 min incubation with 3% hydrogen peroxide for inactivation of endogenous peroxidase activity, sections were blocked with DAKO blocking buffer followed by incubation with primary antibody at 4°C over-night. Specimens were then incubated with ap- propriate secondary antibody using EnVision Plus kit (DAKO) for 30 min and then with diami-nobenzidine chromogen for 5 min. All slides were counterstained with hematoxylin to visual-ize the nuclei. For negative controls, the same specimens as our positive controls for each antibody were used but the primary antibodies were replaced with the primary antibody dilu-ents. Under light microscope (Leica DMLB, Lei- ca Microsystems, Wetzlar, Germany), staining of the epithelial cells was evaluated and scored by two observers. Representative slides were photographed using Leica DC200 digital imag-ing system (Leica Microsystems, Wetzlar, Ger- many). Semi-quantitative scoring was perfor- med based on the average signal intensity and the percentage of immunoreactive cells. A four-value intensity score (0, no immunoreactivity; 1, weak intensity; 2, moderate intensity and 3, strong intensity) was used as well as a four-val-ue quantity score defined as follows: Spry1 (0, none; 1, 1-33%; 2, 34-66%; and 3, 67-100% ) [11], ERK and phospho-ERK (p-ERK) (0, none; 1, less than 10%; 2, 10-50%; and 3, greater than 50%) [12], fibroblast growth factor-2 (FGF-
2), IL-6 and VEGF (0, none; 1, 1-25%; 2, 26-50%; and 3, greater than 50%) [13, 14].
The average intensity and quantity scores for the three cores were then multiplied yielding a 10-point immunohistochemical score ranging from 0 (no staining) to 9 (extensive, strong staining) for each case. For Ki-67, the percent-age of the positively stained cells among the total number of the tumor cells in the area was scored [15]. For p-ERK and Ki-67, the propor-tion of cells showing a positive nuclear stain was considered as positive staining.
Statistical analysis
All statistical analyses were performed using the statistical package SPSS, version 22 (SPSS Inc., Chicago, IL). The data were summarized using standard descriptive statistics and fre-quency tabulations. Wilcoxon matched-pairs signed rank test was used for comparison of the Spry1 expression between normal and can-cer tissue. Associations between the clinico-pathological parameters and the Spry1 expres-sion were evaluated using Spearman correla-tion coefficient testing. The same test was used to assess the correlation between the expres-sion of Spry1 and other markers studied. Overall survival (OS) and disease-free survival (DFS) analyses were carried out for the expres-sion of Spry1. OS was defined as the time from surgery to death or to the end of the study and DFS was calculated from the date of surgery to recurrence or to the end of the study. The pre-dictive value of Spry1 for OS and DFS was eval-uated using the Kaplan-Meier method. Kaplan-Meier survival curves were constructed for patients with low and high levels of the Spry1 expression. The statistical significance between survival curves was assessed by the log-rank test. The binary cut-off points of the markers studied were identified using the Classification and Regression Tree (CART) algorithm which were near the median values. The Cox univari-ate and multivariate proportional hazard mod-els with 95% confidence interval (CI) were con-structed to assess the independent predictive value of Spry1 in the presence of other clinico-pathological variables. Receiver operating characteristic (ROC) curve analysis was also performed to determine the validity of cut-off points and also the sensitivity and specificity of the markers with significant predictive values. A P-value of <0.05 was considered statistically significant for all analyses.
Sprouty 1 in epithelial ovarian cancer
1534 Am J Cancer Res 2015;5(4):1531-1541
Results
Spry1 protein is downregulated in EOC
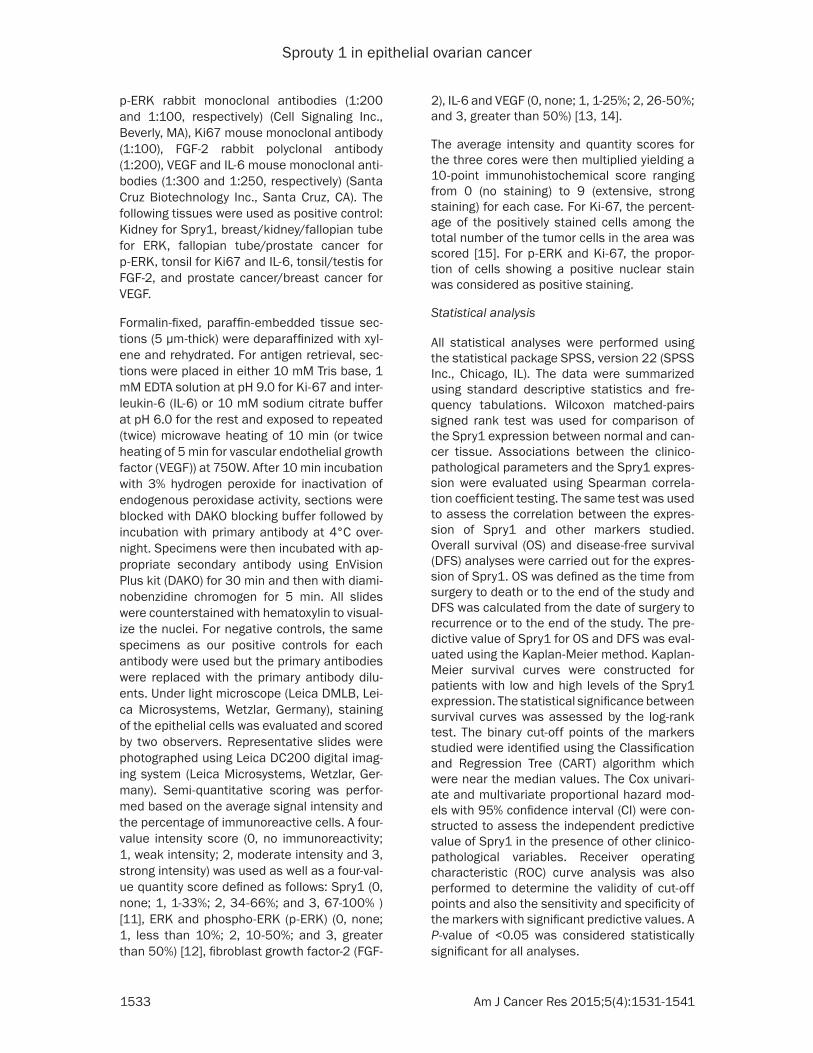
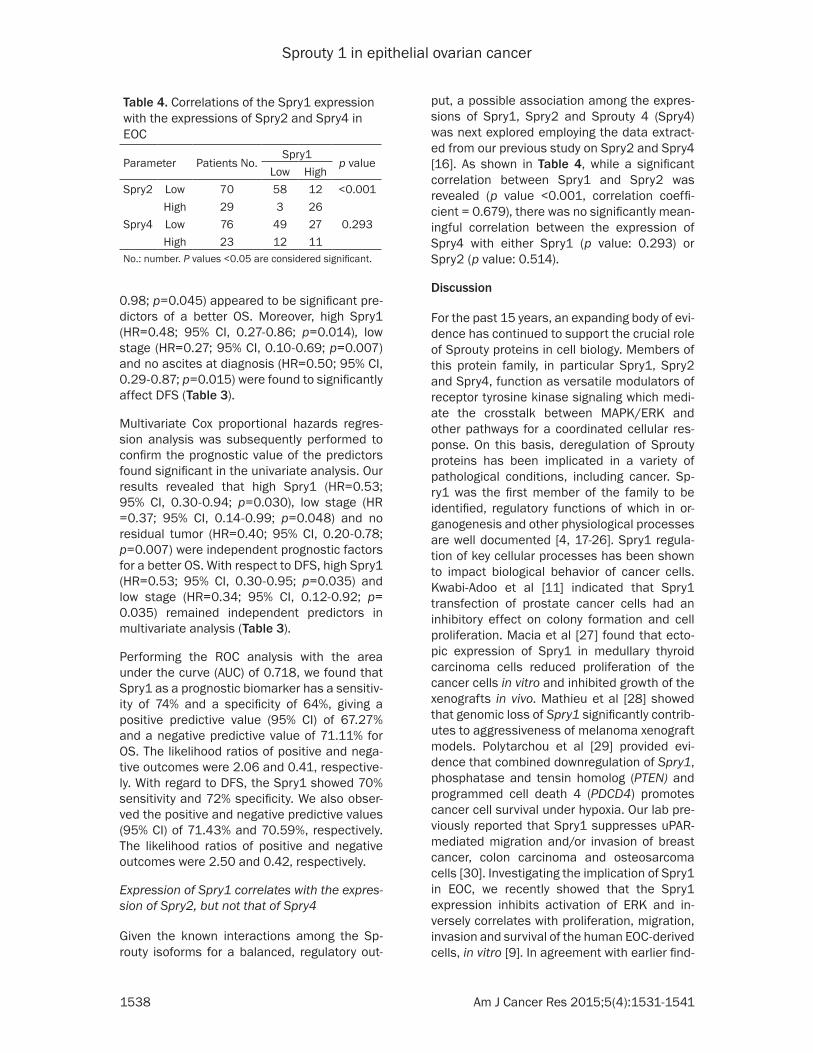
After being immunohistochemically scored, our data showed variable expression of Spry1 pro-tein in both normal and cancerous tissues. Although some normal tissues had minimum (score 0: 7%) or maximum (score 9: 5%) stain-ing, the vast majority of cases showed mild (53%) to moderate (35%) staining in their nor-mal epithelium with immunohistochemistry sc- ore of 1-3 and 4-6, respectively. Ovarian cancer epithelium also exhibited variable expression of the protein, from minimal (score 0: 14%) to mild (48%) to moderate (38%). However, there was no cancerous tissue with maximum stain-ing. When the protein expression in tumor tis-sue was compared to that in normal tissue, sig-nificant downregulation of Spry1 (p value: 0.004) in tumor tissue was revealed (Figure 1).
Due to the variability of the protein expression in different samples, we also compared the staining scores of Spry1 in cancer tissue and those in matched normal tissue from the same patient for a more meaningful deduction. Our results showed that Spry1 was downregulated in 42% of patients. However, equal and higher Spry1 expression scores were detected in 34% and 24% of patients, respectively. When the total of 100 tumor samples were stratified by the cut-off point into high- (>3.5) and low- (≤3.5) expressing groups, 62 cases were identified as patients with Spry1 low-expressing tumors.
Spry1 expression inversely correlates with the expression of p-ERK/ERK and Ki67 in EOC
Given aberrant activation of MAPK/ERK in can-cer and the role of Sprouty proteins in regula-tion of the pathway, immunohistochemical analysis and scoring of tissue samples for the expression of ERK and p-ERK was then per-
Figure 1. Immunohistochemical analysis of the Spry1 expression in EOC. A. Representative photographs indicating high (left) and low (right) levels of the Spry1 immunohistochemical expression in the EOC tissue (magnification = 40x). B. Downregulation of Spry1 protein in EOC as compared with matched normal tissue. Data are represented as mean expression score ± SE (left) and maximum and minimum expression score (right). Significant values (<0.05) are marked by asterisks.
Sprouty 1 in epithelial ovarian cancer
1535 Am J Cancer Res 2015;5(4):1531-1541
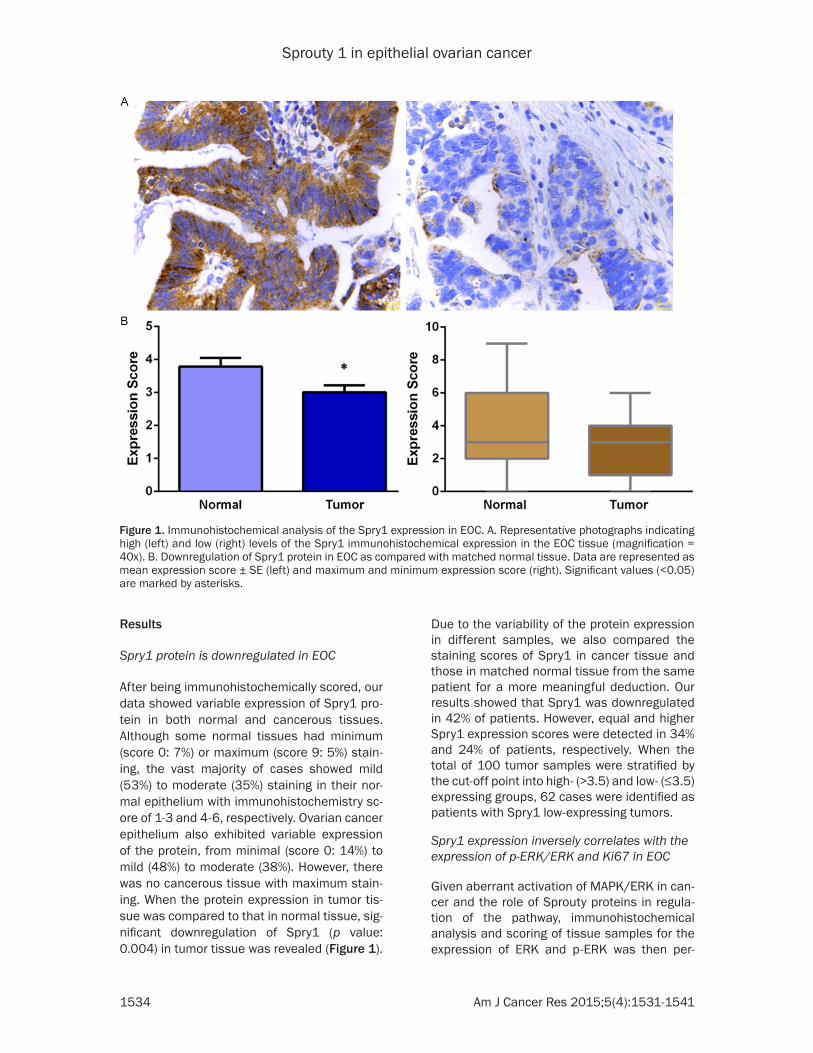
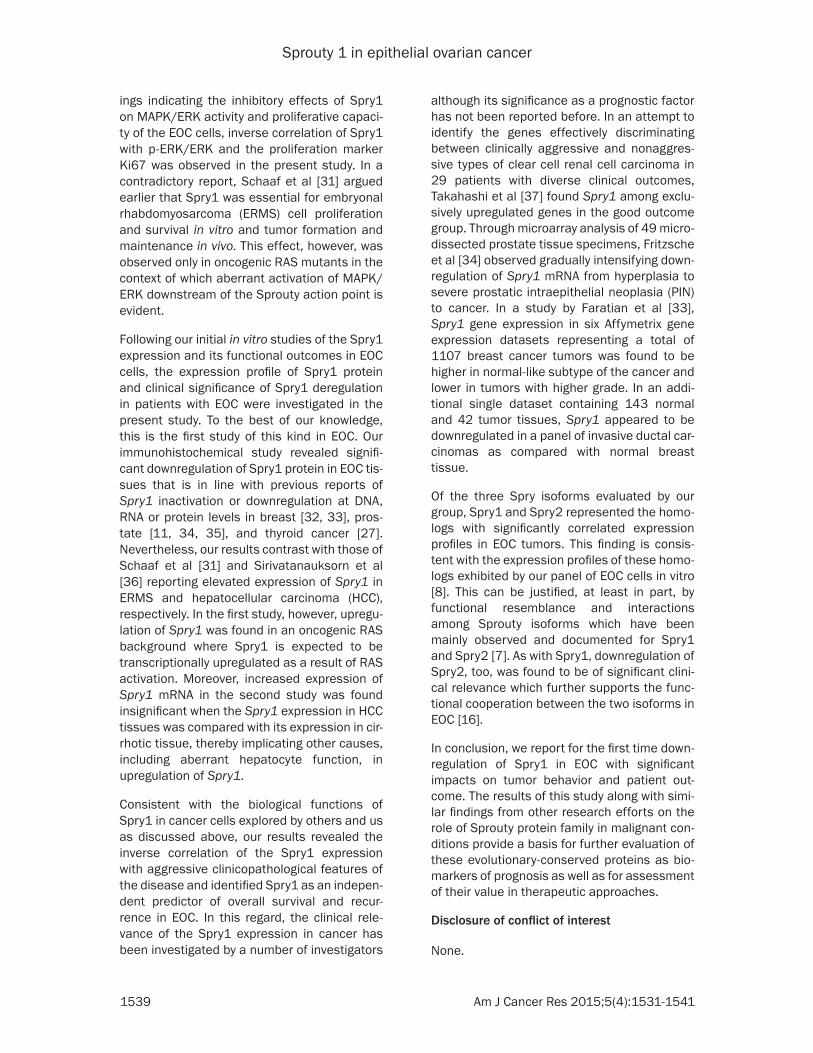
formed. Phosphorylation of ERK is the final step in the activation of MAPK/ERK pathway. Our data demonstrated significant upregula-
tion of p-ERK in tumor tissue (p<0.0001) despite insignificant difference between the expressions of ERK in tumor and matched nor-
Figure 2. Expression of ERK, p-ERK and Ki67 in EOC. A. Representative photographs demonstrating high (left) and low (right) immunohistochemical expression levels of ERK (top), p-ERK (middle) and Ki67 (bottom) in EOC tis-sues (magnification= 40x). B. Expression of ERK (left), p-ERK (middle) and p-ERK/ERK (right) in EOC as compared with matched normal tissue. Data are represented as mean expression score ± SE. Significant values (<0.05) are marked by asterisks.

Sprouty 1 in epithelial ovarian cancer
1536 Am J Cancer Res 2015;5(4):1531-1541
mal tissue samples. As a result, p-ERK/ERK expression ratio as an indicator of ERK activa-tion was significantly higher (p<0.0001) in
gated. Firstly, survival probabilities were esti-mated by the Kaplan-Meier method and differ-ences were compared by the log-rank test. It
Table 2. Correlation of the Spry1 expression with clini-copathological characteristics
Parameter Patients No.
High Spry1
Low Spry1 p value
Age (yr) ≤50 16 2 14 0.022 >50 84 36 48Menopause Yes 92 37 55 0.124 No 8 1 7Disease stage Early (I-II) 14 9 5 0.029 Advanced (III-IV) 86 29 57Tumor grade I-II 23 13 10 0.037 III 77 25 52Tumor subtype Serous 81 32 49 0.516 Mucinous 2 0 2 Endometrioid 4 2 2 Clear cell 5 2 3 Others 8 2 6Lymphovascular invasion Yes 35 8 27 0.042 No 25 12 13Lymph node involvement Yes 38 15 23 0.511 No 25 12 13Response to chemotherapy No 21 6 15 0.321 Yes Recurrent 58 17 41 0.001
Non-recurrent 21 15 6Ascites at diagnosis Yes 54 18 36 0.302 No 46 20 26Post-treatment ascites Yes 42 12 30 0.100 No 58 26 32Residual tumor No 48 17 31 N/A <1 cm 35 15 20 1-2 cm 0 0 0 >2 cm 17 6 11yr: year, Spry1: Sprouty 1 protein, N/A: not applicable. P values <0.05 are considered significant.
tumor tissues (Figure 2). Moreover, the expression of Ki67, known as a tumor pro-liferation marker, was also immunohisto-chemically analyzed and scored. Finally, possible correlation between the expres-sion of Spry1 and these variables was analyzed whereby significant negative co- rrelations of Spry1 with p-ERK/ERK (p= 0.045, correlation coefficient= -0.201) and Ki67 (p=0.010, correlation coeffi-cient= -0.256) were revealed (Table 1).
Spry1 expression has no significant cor-relation with that of fibroblast growth factor, vascular endothelial growth factor and interleukin-6 in EOC
FGF-2, VEGF and IL-6 are among the known activators of MAPK/ERK, the ex- pression of which in tumor tissue sam-ples and their individual association with Spry1 were evaluated next. As seen in Table 1, no statistically significant corre-lation was found between the expres-sions of Spry1 and that of FGF-2, VEGF and IL-6.
Correlation of Spry1 expression with clinicopathological characteristics of EOC patients
Next, we investigated clinical relevance of the Spry1 expression in EOC. Firstly, we evaluated the correlation between the expression of Spry1 and clinicopathologi-cal characteristics of the EOC patients in our cohort (Table 2). Data analysis sho- wed that expression of Spry1 was inverse-ly correlated with aggressive clinicopath-ological features, including the disease stage (p=0.029, correlation coefficient = -0.218), tumor grade (p=0.037, correla-tion coefficient = -0.209), recurrence (p =0.001, correlation coefficient = -0.379) and lymphovascular invasion (p=0.042, correlation coefficient = -0.263).
Expression of Spry1 is associated with survival in patients with EOC
Subsequently, the influence of the Spry1 expression on overall survival (OS) and disease-free survival (DFS) was investi-
Sprouty 1 in epithelial ovarian cancer
1537 Am J Cancer Res 2015;5(4):1531-1541
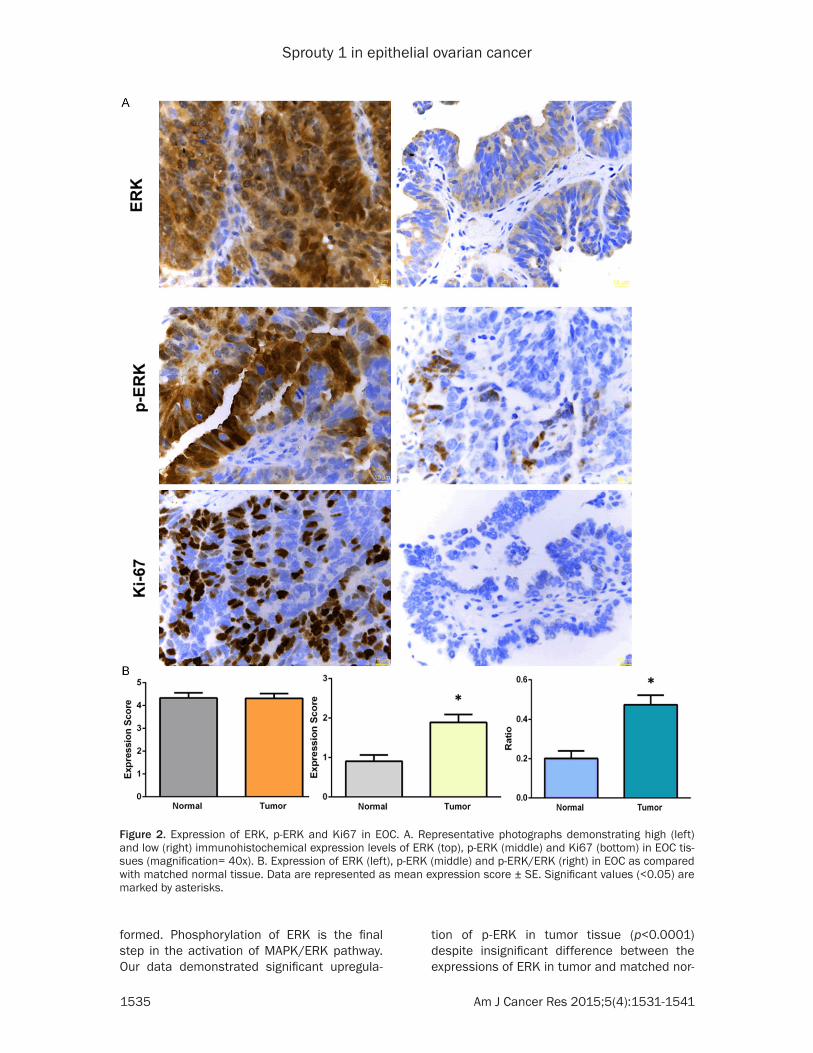
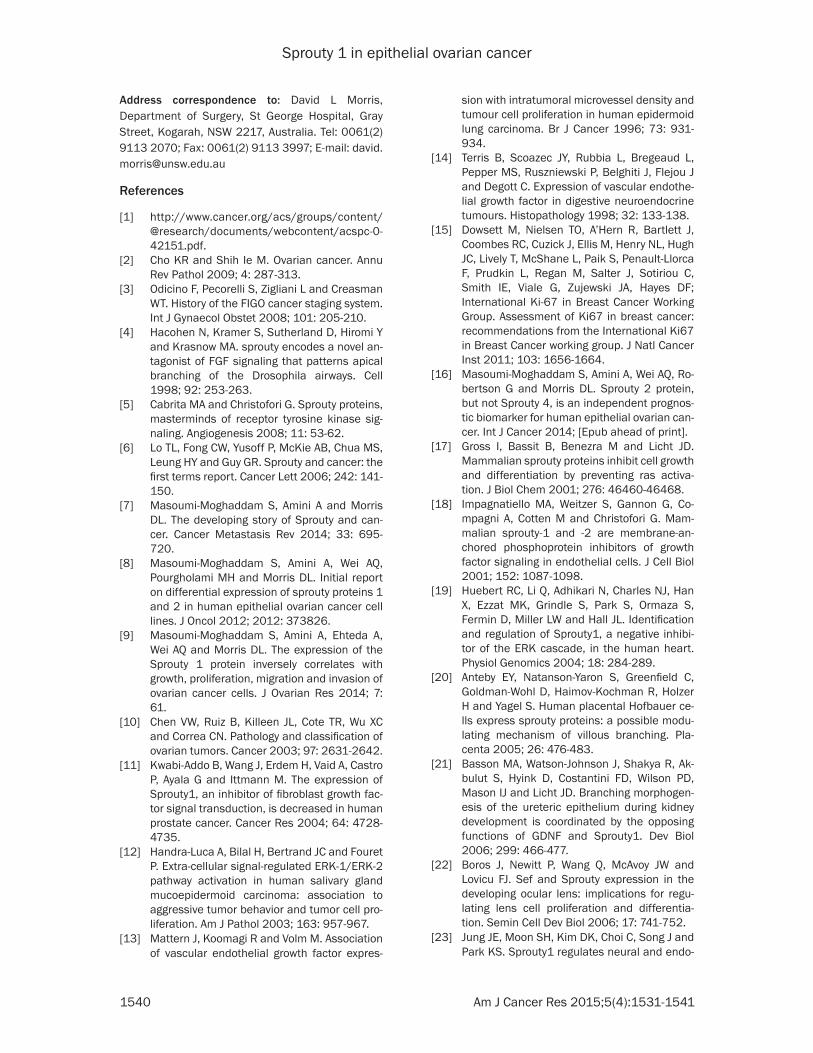
was found that Spry1 low-expressing patients had significantly poorer OS (p=0.010) and DFS (p=0.012) than those with high expression of Spry1. The median OS for low-expressing and high-expressing groups was 2.7 and 6.8 years, respectively. The median DFS in Spry1 low-expressing patients was 14.9 months versus 30 months in the high-expressing group (Figure 3).
To identify factors associated with survival, Spry1 as well as clinicopathological parame-ters investigated were then assessed in uni-variate and multivariate analyses. In univariate analysis, high Spry1 (HR=0.49; 95% CI, 0.28-0.85; p=0.012), low stage (HR=0.28; 95% CI, 0.11-0.71; p=0.008), no residual tumor (HR=0.44; 95% CI, 0.23-0.84; p=0.013) and no ascites at diagnosis (HR=0.59; 95% CI, 0.36-
Figure 3. Kaplan-Meier curves of overall survival and disease-free survival probabilities. A. Overall survival probabil-ity in EOC patients with high levels of Spry1 expression (green) as compared to those with low Spry1 expression lev-els (blue). B. Disease-free survival probability in patients with high levels of Spry1 expression (green) as compared to those with low Spry1 expression levels (blue). p values <0.05 are considered significant.
Table 3. Univariate and multivariate analyses of potential predictors of survival and recurrence in EPC
VariablesOverall survival Disease-free survival
HR (95% CI) p value HR (95% CI) p valueUnivariate
Age (yr) (≤50 vs. >50) 0.503 (0.239-1.057) 0.070 0.855 (0.431-1.694) 0.653
Menopause (no vs. yes) 0.395 (0.123-1.267) 0.118 0.861 (0.309-2.398) 0.774
Stage (early vs. late) 0.286 (0.114-0.718) 0.008 0.271 (0.105-0.696) 0.007
Tumor grade (I-II vs. III) 0.623 (0.338-1.148) 0.129 0.529 (0.272-1.026) 0.060
Tumor subtype (serous vs. mucinous vs. endometrioid vs. clear cell vs. others) 0.857 (0.386-1.903) 0.705 1.431 (0.445-4.605) 0.548
Lymphovascular invasion (no vs. yes) 0.625 (0.317-1.230) 0.173 0.629 (0.312-1.272) 0.197
Lymph node involvement (no vs. yes) 0.797 (0.411-1.546) 0.503 0.579 (0.280-1.197) 0.140
Ascites at diagnosis (no vs. yes) 0.599 (0.364-0.988) 0.045 0.509 (0.295-0.878) 0.015
Residual tumor (no vs. <1 cm vs. 1-2 cm vs. >2 cm) 0.440 (0.230-0.844) 0.013 0.611 (0.277-1.350) 0.224
Ki67 (≤10% vs. >10%) 0.604 (0.359-1.018) 0.059 0.936 (0.554-1.580) 0.804
Spry1 (high vs. low) 0.493 (0.284-0.857) 0.012 0.489 (0.277-0.863) 0.014
Multivariate
Stage (early vs. late) 0.374 (0.141-0.992) 0.048 0.341 (0.126-0.927) 0.035
Ascites at diagnosis (no vs. yes) 0.772 (0.460-1.297) 0.329 0.605 (0.347-1.055) 0.076
Residual tumor (no vs. <1 cm vs. 1-2 cm vs. >2 cm) 0.404 (0.208-0.783) 0.007 N/A N/A
Spry1 (high vs. low) 0.534 (0.303-0.942) 0.030 0.539 (0.303-0.959) 0.035
yr: year, Spry1: Sprouty 1 protein, HR: hazard ratio, CI: confidence interval, N/A: not applicable. P values <0.05 are considered significant.
Sprouty 1 in epithelial ovarian cancer
1538 Am J Cancer Res 2015;5(4):1531-1541
0.98; p=0.045) appeared to be significant pre-dictors of a better OS. Moreover, high Spry1 (HR=0.48; 95% CI, 0.27-0.86; p=0.014), low stage (HR=0.27; 95% CI, 0.10-0.69; p=0.007) and no ascites at diagnosis (HR=0.50; 95% CI, 0.29-0.87; p=0.015) were found to significantly affect DFS (Table 3).
Multivariate Cox proportional hazards regres-sion analysis was subsequently performed to confirm the prognostic value of the predictors found significant in the univariate analysis. Our results revealed that high Spry1 (HR=0.53; 95% CI, 0.30-0.94; p=0.030), low stage (HR =0.37; 95% CI, 0.14-0.99; p=0.048) and no residual tumor (HR=0.40; 95% CI, 0.20-0.78; p=0.007) were independent prognostic factors for a better OS. With respect to DFS, high Spry1 (HR=0.53; 95% CI, 0.30-0.95; p=0.035) and low stage (HR=0.34; 95% CI, 0.12-0.92; p= 0.035) remained independent predictors in multivariate analysis (Table 3).
Performing the ROC analysis with the area under the curve (AUC) of 0.718, we found that Spry1 as a prognostic biomarker has a sensitiv-ity of 74% and a specificity of 64%, giving a positive predictive value (95% CI) of 67.27% and a negative predictive value of 71.11% for OS. The likelihood ratios of positive and nega-tive outcomes were 2.06 and 0.41, respective-ly. With regard to DFS, the Spry1 showed 70% sensitivity and 72% specificity. We also obser- ved the positive and negative predictive values (95% CI) of 71.43% and 70.59%, respectively. The likelihood ratios of positive and negative outcomes were 2.50 and 0.42, respectively.
Expression of Spry1 correlates with the expres-sion of Spry2, but not that of Spry4
Given the known interactions among the Sp- routy isoforms for a balanced, regulatory out-
put, a possible association among the expres-sions of Spry1, Spry2 and Sprouty 4 (Spry4) was next explored employing the data extract-ed from our previous study on Spry2 and Spry4 [16]. As shown in Table 4, while a significant correlation between Spry1 and Spry2 was revealed (p value <0.001, correlation coeffi-cient = 0.679), there was no significantly mean-ingful correlation between the expression of Spry4 with either Spry1 (p value: 0.293) or Spry2 (p value: 0.514).
Discussion
For the past 15 years, an expanding body of evi-dence has continued to support the crucial role of Sprouty proteins in cell biology. Members of this protein family, in particular Spry1, Spry2 and Spry4, function as versatile modulators of receptor tyrosine kinase signaling which medi-ate the crosstalk between MAPK/ERK and other pathways for a coordinated cellular res- ponse. On this basis, deregulation of Sprouty proteins has been implicated in a variety of pathological conditions, including cancer. Sp- ry1 was the first member of the family to be identified, regulatory functions of which in or- ganogenesis and other physiological processes are well documented [4, 17-26]. Spry1 regula-tion of key cellular processes has been shown to impact biological behavior of cancer cells. Kwabi-Adoo et al [11] indicated that Spry1 transfection of prostate cancer cells had an inhibitory effect on colony formation and cell proliferation. Macia et al [27] found that ecto-pic expression of Spry1 in medullary thyroid carcinoma cells reduced proliferation of the cancer cells in vitro and inhibited growth of the xenografts in vivo. Mathieu et al [28] showed that genomic loss of Spry1 significantly contrib-utes to aggressiveness of melanoma xenograft models. Polytarchou et al [29] provided evi-dence that combined downregulation of Spry1, phosphatase and tensin homolog (PTEN) and programmed cell death 4 (PDCD4) promotes cancer cell survival under hypoxia. Our lab pre-viously reported that Spry1 suppresses uPAR-mediated migration and/or invasion of breast cancer, colon carcinoma and osteosarcoma cells [30]. Investigating the implication of Spry1 in EOC, we recently showed that the Spry1 expression inhibits activation of ERK and in- versely correlates with proliferation, migration, invasion and survival of the human EOC-derived cells, in vitro [9]. In agreement with earlier find-
Table 4. Correlations of the Spry1 expression with the expressions of Spry2 and Spry4 in EOC
Parameter Patients No.Spry1
p value
Low HighSpry2 Low 70 58 12 <0.001
High 29 3 26Spry4 Low 76 49 27 0.293
High 23 12 11No.: number. P values <0.05 are considered significant.
Sprouty 1 in epithelial ovarian cancer
1539 Am J Cancer Res 2015;5(4):1531-1541
ings indicating the inhibitory effects of Spry1 on MAPK/ERK activity and proliferative capaci-ty of the EOC cells, inverse correlation of Spry1 with p-ERK/ERK and the proliferation marker Ki67 was observed in the present study. In a contradictory report, Schaaf et al [31] argued earlier that Spry1 was essential for embryonal rhabdomyosarcoma (ERMS) cell proliferation and survival in vitro and tumor formation and maintenance in vivo. This effect, however, was observed only in oncogenic RAS mutants in the context of which aberrant activation of MAPK/ERK downstream of the Sprouty action point is evident.
Following our initial in vitro studies of the Spry1 expression and its functional outcomes in EOC cells, the expression profile of Spry1 protein and clinical significance of Spry1 deregulation in patients with EOC were investigated in the present study. To the best of our knowledge, this is the first study of this kind in EOC. Our immunohistochemical study revealed signifi-cant downregulation of Spry1 protein in EOC tis-sues that is in line with previous reports of Spry1 inactivation or downregulation at DNA, RNA or protein levels in breast [32, 33], pros-tate [11, 34, 35], and thyroid cancer [27]. Nevertheless, our results contrast with those of Schaaf et al [31] and Sirivatanauksorn et al [36] reporting elevated expression of Spry1 in ERMS and hepatocellular carcinoma (HCC), respectively. In the first study, however, upregu-lation of Spry1 was found in an oncogenic RAS background where Spry1 is expected to be transcriptionally upregulated as a result of RAS activation. Moreover, increased expression of Spry1 mRNA in the second study was found insignificant when the Spry1 expression in HCC tissues was compared with its expression in cir-rhotic tissue, thereby implicating other causes, including aberrant hepatocyte function, in upregulation of Spry1.
Consistent with the biological functions of Spry1 in cancer cells explored by others and us as discussed above, our results revealed the inverse correlation of the Spry1 expression with aggressive clinicopathological features of the disease and identified Spry1 as an indepen-dent predictor of overall survival and recur-rence in EOC. In this regard, the clinical rele-vance of the Spry1 expression in cancer has been investigated by a number of investigators
although its significance as a prognostic factor has not been reported before. In an attempt to identify the genes effectively discriminating between clinically aggressive and nonaggres-sive types of clear cell renal cell carcinoma in 29 patients with diverse clinical outcomes, Takahashi et al [37] found Spry1 among exclu-sively upregulated genes in the good outcome group. Through microarray analysis of 49 micro-dissected prostate tissue specimens, Fritzsche et al [34] observed gradually intensifying down-regulation of Spry1 mRNA from hyperplasia to severe prostatic intraepithelial neoplasia (PIN) to cancer. In a study by Faratian et al [33], Spry1 gene expression in six Affymetrix gene expression datasets representing a total of 1107 breast cancer tumors was found to be higher in normal-like subtype of the cancer and lower in tumors with higher grade. In an addi-tional single dataset containing 143 normal and 42 tumor tissues, Spry1 appeared to be downregulated in a panel of invasive ductal car-cinomas as compared with normal breast tissue.
Of the three Spry isoforms evaluated by our group, Spry1 and Spry2 represented the homo-logs with significantly correlated expression profiles in EOC tumors. This finding is consis-tent with the expression profiles of these homo-logs exhibited by our panel of EOC cells in vitro [8]. This can be justified, at least in part, by functional resemblance and interactions among Sprouty isoforms which have been mainly observed and documented for Spry1 and Spry2 [7]. As with Spry1, downregulation of Spry2, too, was found to be of significant clini-cal relevance which further supports the func-tional cooperation between the two isoforms in EOC [16].
In conclusion, we report for the first time down-regulation of Spry1 in EOC with significant impacts on tumor behavior and patient out-come. The results of this study along with simi-lar findings from other research efforts on the role of Sprouty protein family in malignant con-ditions provide a basis for further evaluation of these evolutionary-conserved proteins as bio-markers of prognosis as well as for assessment of their value in therapeutic approaches.
Disclosure of conflict of interest
None.
Sprouty 1 in epithelial ovarian cancer
1540 Am J Cancer Res 2015;5(4):1531-1541
Address correspondence to: David L Morris, Department of Surgery, St George Hospital, Gray Street, Kogarah, NSW 2217, Australia. Tel: 0061(2) 9113 2070; Fax: 0061(2) 9113 3997; E-mail: [email protected]
References
[1] http://www.cancer.org/acs/groups/content/ @research/documents/webcontent/acspc-0- 42151.pdf.
[2] Cho KR and Shih Ie M. Ovarian cancer. Annu Rev Pathol 2009; 4: 287-313.
[3] Odicino F, Pecorelli S, Zigliani L and Creasman WT. History of the FIGO cancer staging system. Int J Gynaecol Obstet 2008; 101: 205-210.
[4] Hacohen N, Kramer S, Sutherland D, Hiromi Y and Krasnow MA. sprouty encodes a novel an-tagonist of FGF signaling that patterns apical branching of the Drosophila airways. Cell 1998; 92: 253-263.
[5] Cabrita MA and Christofori G. Sprouty proteins, masterminds of receptor tyrosine kinase sig-naling. Angiogenesis 2008; 11: 53-62.
[6] Lo TL, Fong CW, Yusoff P, McKie AB, Chua MS, Leung HY and Guy GR. Sprouty and cancer: the first terms report. Cancer Lett 2006; 242: 141-150.
[7] Masoumi-Moghaddam S, Amini A and Morris DL. The developing story of Sprouty and can-cer. Cancer Metastasis Rev 2014; 33: 695-720.
[8] Masoumi-Moghaddam S, Amini A, Wei AQ, Pourgholami MH and Morris DL. Initial report on differential expression of sprouty proteins 1 and 2 in human epithelial ovarian cancer cell lines. J Oncol 2012; 2012: 373826.
[9] Masoumi-Moghaddam S, Amini A, Ehteda A, Wei AQ and Morris DL. The expression of the Sprouty 1 protein inversely correlates with growth, proliferation, migration and invasion of ovarian cancer cells. J Ovarian Res 2014; 7: 61.
[10] Chen VW, Ruiz B, Killeen JL, Cote TR, Wu XC and Correa CN. Pathology and classification of ovarian tumors. Cancer 2003; 97: 2631-2642.
[11] Kwabi-Addo B, Wang J, Erdem H, Vaid A, Castro P, Ayala G and Ittmann M. The expression of Sprouty1, an inhibitor of fibroblast growth fac-tor signal transduction, is decreased in human prostate cancer. Cancer Res 2004; 64: 4728-4735.
[12] Handra-Luca A, Bilal H, Bertrand JC and Fouret P. Extra-cellular signal-regulated ERK-1/ERK-2 pathway activation in human salivary gland mucoepidermoid carcinoma: association to aggressive tumor behavior and tumor cell pro-liferation. Am J Pathol 2003; 163: 957-967.
[13] Mattern J, Koomagi R and Volm M. Association of vascular endothelial growth factor expres-
sion with intratumoral microvessel density and tumour cell proliferation in human epidermoid lung carcinoma. Br J Cancer 1996; 73: 931-934.
[14] Terris B, Scoazec JY, Rubbia L, Bregeaud L, Pepper MS, Ruszniewski P, Belghiti J, Flejou J and Degott C. Expression of vascular endothe-lial growth factor in digestive neuroendocrine tumours. Histopathology 1998; 32: 133-138.
[15] Dowsett M, Nielsen TO, A’Hern R, Bartlett J, Coombes RC, Cuzick J, Ellis M, Henry NL, Hugh JC, Lively T, McShane L, Paik S, Penault-Llorca F, Prudkin L, Regan M, Salter J, Sotiriou C, Smith IE, Viale G, Zujewski JA, Hayes DF; International Ki-67 in Breast Cancer Working Group. Assessment of Ki67 in breast cancer: recommendations from the International Ki67 in Breast Cancer working group. J Natl Cancer Inst 2011; 103: 1656-1664.
[16] Masoumi-Moghaddam S, Amini A, Wei AQ, Ro- bertson G and Morris DL. Sprouty 2 protein, but not Sprouty 4, is an independent prognos-tic biomarker for human epithelial ovarian can-cer. Int J Cancer 2014; [Epub ahead of print].
[17] Gross I, Bassit B, Benezra M and Licht JD. Mammalian sprouty proteins inhibit cell growth and differentiation by preventing ras activa-tion. J Biol Chem 2001; 276: 46460-46468.
[18] Impagnatiello MA, Weitzer S, Gannon G, Co- mpagni A, Cotten M and Christofori G. Mam- malian sprouty-1 and -2 are membrane-an-chored phosphoprotein inhibitors of growth factor signaling in endothelial cells. J Cell Biol 2001; 152: 1087-1098.
[19] Huebert RC, Li Q, Adhikari N, Charles NJ, Han X, Ezzat MK, Grindle S, Park S, Ormaza S, Fermin D, Miller LW and Hall JL. Identification and regulation of Sprouty1, a negative inhibi-tor of the ERK cascade, in the human heart. Physiol Genomics 2004; 18: 284-289.
[20] Anteby EY, Natanson-Yaron S, Greenfield C, Goldman-Wohl D, Haimov-Kochman R, Holzer H and Yagel S. Human placental Hofbauer ce- lls express sprouty proteins: a possible modu-lating mechanism of villous branching. Pla- centa 2005; 26: 476-483.
[21] Basson MA, Watson-Johnson J, Shakya R, Ak- bulut S, Hyink D, Costantini FD, Wilson PD, Mason IJ and Licht JD. Branching morphogen-esis of the ureteric epithelium during kidney development is coordinated by the opposing functions of GDNF and Sprouty1. Dev Biol 2006; 299: 466-477.
[22] Boros J, Newitt P, Wang Q, McAvoy JW and Lovicu FJ. Sef and Sprouty expression in the developing ocular lens: implications for regu-lating lens cell proliferation and differentia-tion. Semin Cell Dev Biol 2006; 17: 741-752.
[23] Jung JE, Moon SH, Kim DK, Choi C, Song J and Park KS. Sprouty1 regulates neural and endo-
Sprouty 1 in epithelial ovarian cancer
1541 Am J Cancer Res 2015;5(4):1531-1541
thelial differentiation of mouse embryonic stem cells. Stem Cells Dev 2012; 21: 554-561.
[24] Purcell P, Jheon A, Vivero MP, Rahimi H, Joo A and Klein OD. Spry1 and Spry2 Are Essential for Development of the Temporomandibular Joint. J Dent Res 2012; 91: 387-93.
[25] Kuracha MR, Siefker E, Licht JD and Govin- darajan V. Spry1 and Spry2 are necessary for eyelid closure. Dev Biol 2013; 383: 227-238.
[26] Ching ST, Cunha GR, Baskin LS, Basson MA and Klein OD. Coordinated activity of Spry1 and Spry2 is required for normal development of the external genitalia. Dev Biol 2014; 386: 1-11.
[27] Macia A, Gallel P, Vaquero M, Gou-Fabregas M, Santacana M, Maliszewska A, Robledo M, Gar- diner JR, Basson MA, Matias-Guiu X and En- cinas M. Sprouty1 is a candidate tumor-sup-pressor gene in medullary thyroid carcinoma. Oncogene 2012; 31: 3961-3972.
[28] Mathieu V, Pirker C, Schmidt WM, Spiegl-Kre- inecker S, Lotsch D, Heffeter P, Hegedus B, Grusch M, Kiss R and Berger W. Aggressiveness of human melanoma xenograft models is pro-moted by aneuploidy-driven gene expression deregulation. Oncotarget 2012; 3: 399-413.
[29] Polytarchou C, Iliopoulos D, Hatziapostolou M, Kottakis F, Maroulakou I, Struhl K and Tsichlis PN. Akt2 regulates all Akt isoforms and pro-motes resistance to hypoxia through induction of miR-21 upon oxygen deprivation. Cancer Res 2011; 71: 4720-4731.
[30] Mekkawy AH and Morris DL. Human Sprouty1 Suppresses Urokinase Receptor-Stimulated Cell Migration and Invasion. ISRN Biochem 2013; 2013: 7.
[31] Schaaf G, Hamdi M, Zwijnenburg D, Lakeman A, Geerts D, Versteeg R and Kool M. Silencing of SPRY1 triggers complete regression of rhab-domyosarcoma tumors carrying a mutated RAS gene. Cancer Res 2010; 70: 762-771.
[32] Lo TL, Yusoff P, Fong CW, Guo K, McCaw BJ, Phillips WA, Yang H, Wong ES, Leong HF, Zeng Q, Putti TC and Guy GR. The ras/mitogen-acti-vated protein kinase pathway inhibitor and likely tumor suppressor proteins, sprouty 1 and sprouty 2 are deregulated in breast can-cer. Cancer Res 2004; 64: 6127-6136.
[33] Faratian D, Sims AH, Mullen P, Kay C, Um I, Langdon SP and Harrison DJ. Sprouty 2 is an independent prognostic factor in breast can-cer and may be useful in stratifying patients for trastuzumab therapy. PLoS One 2011; 6: e23772.
[34] Fritzsche S, Kenzelmann M, Hoffmann MJ, Muller M, Engers R, Grone HJ and Schulz WA. Concomitant down-regulation of SPRY1 and SPRY2 in prostate carcinoma. Endocr Relat Cancer 2006; 13: 839-849.
[35] Taylor BS, Schultz N, Hieronymus H, Gopalan A, Xiao Y, Carver BS, Arora VK, Kaushik P, Cerami E, Reva B, Antipin Y, Mitsiades N, Landers T, Dolgalev I, Major JE, Wilson M, Socci ND, Lash AE, Heguy A, Eastham JA, Scher HI, Reuter VE, Scardino PT, Sander C, Sawyers CL and Gerald WL. Integrative genomic profiling of human prostate cancer. Cancer Cell 2010; 18: 11-22.
[36] Sirivatanauksorn Y, Sirivatanauksorn V, Srisa- wat C, Khongmanee A and Tongkham C. Dif- ferential expression of sprouty genes in hepa-tocellular carcinoma. J Surg Oncol 2012; 105: 273-276.
[37] Takahashi M, Rhodes DR, Furge KA, Kanayama H, Kagawa S, Haab BB and Teh BT. Gene ex-pression profiling of clear cell renal cell carci-noma: gene identification and prognostic clas-sification. Proc Natl Acad Sci U S A 2001; 98: 9754-9759.


![CSF-1 Overexpression Predicts Poor Prognosis in Upper ...downloads.hindawi.com/journals/dm/2019/2724948.pdf · linked to a poor prognosis in pancreatic cancer [26], prostate cancer](https://img.pdfslide.net/doc/110x75/5ed9b1e3385b4c58025dce96/csf-1-overexpression-predicts-poor-prognosis-in-upper-linked-to-a-poor-prognosis.jpg)