Embed Size (px)
Citation preview
Introduction
Free-living amoebae (FLAs) are pathogenic and opportunistic unicellular, aerobic and eukaryotic protists protozoa that exist in environments such as soil, air and water [1-4], where they play a role as predators of bacteria, algae, viruses and fungi [5]. They have been isolated from process water systems such as cooling
towers, hospital water networks and drinking water and wastewater plants [6-8]. The main genera found in water are Acanthamoeba spp., Vermamoeba spp., Balamuthia spp., Naegleria spp. and Vahlkampfia spp. They are known to be pathogenic to humans [1, 6, 9]. Acanthamoeba species are the causative agent of amoebic keratitis (AK) [10-11], and granulomatous amoebic encephalitis (GAE) [12], while Naegleria fowleri and Balamuthia mandrillaris have been associated with amoebic meningoencephalitis (PAM) and GAE, respectively [1, 11].
Pol. J. Environ. Stud. Vol. 28, No. 4 (2019), 2815-2821
Original Research
Monitoring Water Quality Parameters in Egyptian Tap Water
Thabet Sakran1, Pessant Matooq2*, Gamal El-Shahawy1, Maisa Shalaby3, Hoda Sabry3, Mahmoud Gad4
1Department of Zoology, Faculty of Science, Beni-Suef University, Beni-Suef2Central Laboratory of Fayoum Drinking Water and Sanitation Company (FDWASC)
3Theodor Bilharz Research Institute, Imbaba, Giza4Water Pollution Research Department, National Research Centre, Dokki, Giza, Egypt
Received: 2 April 2018Accepted: 3 July 2018
Abstract
Free-living amoebae can potentially cause infections in humans and animals. Contaminants in the water can affect water quality and, consequently, human health. A total of 68 tap water samples were collected during a one-year period to evaluate the quality of tap water in six districts in Fayoum Governorate according to free-living amoebae, bacteriological and physicochemical aspects. All parameters of water were tested according to the standard methods for the examination of water and wastewater. Overall, the detection rate of free-living amoebae in tap water samples was 39.7% (27/68). Seasonally, the highest detection rates of free-living amoebae were recorded during the autumn months (52.9%), followed by spring (47.1%), summer (35.3%) and winter (23.5%). We found no correlation between free-living amoebae and water quality parameters except for temperature. In conclusion, surveillance of FLAs in water resources is an important task for controlling the transmission of these pathogens.
Keywords: water quality, physicochemical, microbiological, contamination, tap water
*e-mail: [email protected]
DOI: 10.15244/pjoes/92820 ONLINE PUBLICATION DATE: 2019-03-05
2816 Sakran T., et al.
Free-living amoebae pose a potential health risk in water systems as they may be pathogenic and harbor potential pathogenic bacteria known as amoebae-resistant bacteria such as methicillin-resistant Staphylococcus aureus, Vibrio cholerae and Legionella species, including Legionella pneumophila and environmental Mycobacterium species [13]. Therefore, FLAs are reservoirs of various bacteria and other microorganisms, among which some are pathogenic, thus being of particular importance for human health [8, 14]. FLAs have been described as biological by-passes of water treatment because they can protect intracellular bacteria as well as improving their virulence and antimicrobial resistance [15]. Their prevalence in water networks is associated with biofilms [16], where they live together with other microorganisms. These biofilms serve as feeding grounds for the FLAs and provide protection to a certain degree, while the FLAs adhere to their surfaces. They play a role in the reduction of bacterial biomass and the regeneration of nutrients. Microbial growth within drinking water distribution system (DWDS) biofilms has been associated with corrosion of pipes, and the production of various elements in water and sediments in DWDS [17-19]. Drinking water distribution system sediments are mainly composed of iron, total organic carbon (TOC), phosphorous, manganese and aluminum [20-21]. Water quality and suitability for use are determined by its taste, odor, colour and concentration of organic and inorganic matter [22]. The potential sources of water contamination are geological conditions, industrial and agricultural activities and water treatment plants. These contaminants are further categorized as microorganisms, inorganics, organics and disinfectants [18]. The present study aims to test the presence of free-living amoebae in tap water during one year in Fayoum Governorate and to assess the relationship between the prevalence of free-living amoebae and water quality factors.
Methods
Water Sample Collection and Water Quality Measurements
A total of 68 tap water samples were collected during a one-year period from January 2015 to December 2015. Sample collections were carried out from the districts of Fayoum, Sennuris, Tamia, Yosef el-sedek, Ibshawai and Itsa, located in Fayoum Governorate, Egypt. Sampling and preservation procedures were done according to standard methods for the examination of water and wastewater [23]. All samples were kept in an ice box during transportation to the Central Laboratory of Fayoum Drinking Water and Sanitation Company (FDWASC) for immediate processing, and assayed within 24 h of collection.
Cultivation and Detection of Free-Living Amoebae
Collected water samples were separately concentrated using the membrane filtration technique. One liter of each water sample was filtered through a nitro-cellulose membrane filter (0.45 μm pore size and 47 mm in diameter) that was then removed before complete dryness. Each membrane was inverted on the surface of a non-nutrient agar plate coated with Escherichia coli and incubated at 35ºC. The plates were observed daily for 14 days using an inverted microscope to detect the growth of FLAs trophozoites [24].
Bacteriological Analysis of Tap Water
Heterotrophic bacteria (total bacterial counts) were cultured on the heterotrophic plate count (HPC) agar base measured by the pour plate method at 35ºC for 48±4 h (Methods 9215 B) [23]. Total coliform (T C) were measured by membrane filtration and a differential medium described in the standard method for the examination of water and wastewater (Methods 9222 B) [23]. Total coliform cultures were placed in m-Endo LES agar (Difco, USA) at 35±1ºC for 24±2 h before counting.
Water Factors
Physicochemical parameters of water were assessed according to methods used by APHA (2012) [23]. Physical parameters of water were assessed on 68 tap water samples according to methods used by APHA (2012) [23]. Some physico-chemical parameters included turbidity, temperature, pH, total dissolved solids (TDS) and free residual chlorine. These parameters were measured in the field immediately.
Turbidity was measured using a Hach portable turbidmeter (Hach Instruments, USA) and the results were expressed in nephelometric turbidity units (NTU). Free residual chlorine for each sample was determined with the diethyl paraphenylene diamineindicator (DPD) chlorine test kit (La- Motte, Chestertown, MD, USA) and expressed in parts per million (ppm). pH was determined using a Metrohm mobile pH meter. Temperature, electrical conductivity (EC) and total dissolved solids (TDS) were measured using a Hach sension 5 conductivity meter (Hach Instruments, USA). Total alkalinity, chlorides, total hardness, total organic carbon (TOC) and nitrates were measured according to standard methods for the examination of water and wastewater [23]. The analyses of six heavy metals, including iron (Fe), aluminum (Al), cadmium (Cd), copper (Cu), lead (Pb) and manganese (Mn) were analyzed using ICP, which are approved by APHA (2012) [23].
2817Monitoring Water Quality Parameters...
Statistical Analysis
Data obtained were analyzed using the Statistical Package for Social Sciences version 20 software for Windows (SPSS Inc., Chicago, IL, USA). Bivariate correlation and linear regression analysis was used to determine if any correlations (positive or negative) existed between any of the physical, chemical or bacteriological water quality parameters and the presence/absence of free-living amoebae. The values of p<0.05 were considered as statistically significant.
Results and Discussion
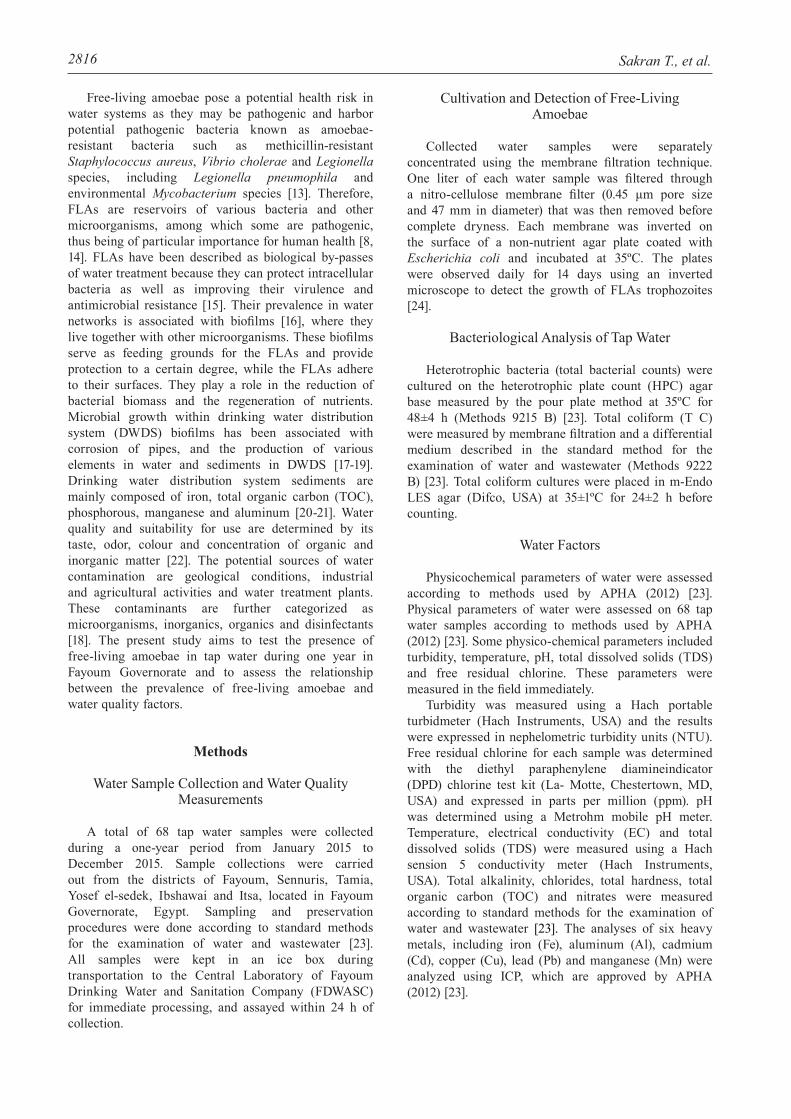
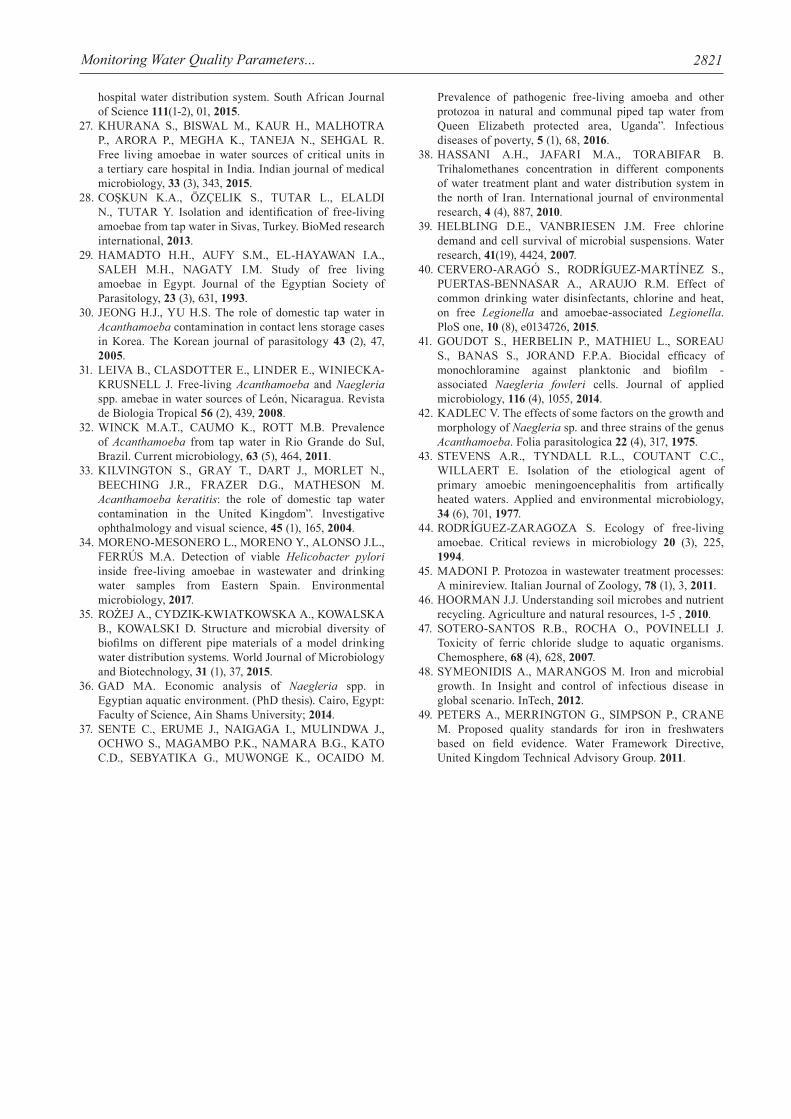
The present work examined 68 water samples collected from different drinking water pipe lines of 6 districts (Fayoum, Sennuris, Tamia, Yosef el-sedek, Ibshawai and Itsa) within Fayoum Governorate. Overall, the detection rate of free-living amoebae in tap water samples was 39.7% (27/68) during the year (Fig. 1). Free-living amoebae that were found in all sampling districts might be due to its wide ecological distribution in the environment [3]. They have been frequently found in humans and have been isolated from drinking water plants [6, 25], hospital water networks [8, 26-27] and domestic water networks [2, 16, 28]. Several studies were conducted in Egypt and recorded FLAs in tap water: 4% in samples collected from different Egyptian governorates [29] and 60.4% in Giza governorate [16]. Variable rates were reported in several studies all over the world: 46.9% in Korea [30], 23% in Nicaragua [31], 22.79% in Brazil [32], 29.4% and 22% in Sivas, Turkey [2, 28], 89% in the United Kingdom [33] and 79% in the United States of America [5]. However, nearly similar results compared to our results were obtained on examination of household tap water samples in Eastern Spain (38.7%) [34]. Conflicting results on FLA contamination in tap water from different countries might be attributed to factors known to influence their presence, such as water source, water treatment method, geographic location, sample size and differences in water temperature [5]. Also, high
contamination of tap water with FLAs might lead to more biofilm formation along the piped water network and tap outlet. This is consistent with findings from a study that showed settlement of microorganisms on the inner surfaces of water pipes that would later become a source of secondary microbial contamination [16, 35]. Biofilm formation attracts more predatory FLAs, which engulf and feed on bacterial colonies [5, 12]. Therefore, high contamination of the piped water network with FLAs would definitely result in nosocomial infections due to the survival and persistence of these pathogens in the biofilms inside the storage tanks of hospitals [8, 26-27].
Tap water samples collected in the present study were positive for FLAs in all four seasons of sampling, and the results are presented as follows: the highest detection rates of free-living amoebae were recorded during the autumn months (52.9%) followed by spring (47.1%), summer (35.3%) and winter (23.5%) (Fig. 1). Other researchers in Egypt found that free-living amoebae predominated in tap water of Greater Cairo in winter (41.7%), followed by summer (25%), while they were evenly distributed in both spring and autumn 16.7% for each [36]. In another study in Egypt, the highest occurrence percentage of free-living amoebae in tap water samples was observed in summer (75%) and then decreased to be 66.7, 58.3 and 41.7% in autumn, spring and winter, respectively [16]. Similarly, the seasonal variations may play an important role the diversity of FLAs between the seasons. They also may be attributed to differences in water quality based on the differences in drinking water treatment plant processes and in the distribution system from which samples were collected [5].
The water temperature was different among the seasons when samples were collected, ranging from as low as 15.1ºC in winter to as high as 26.4ºC in autumn. Linear correlation analysis showed an inverse correlation between the presence of free-living amoebae with temperature (p<0.05). This means that FLA growth decreased as temperature rose. These findings are in agreement with previous studies [37].
Free chlorine residual concentrations were detected at different sampling points during the study period and ranged between 0.25 and 2 ppm. The final step in treatment carried out on water resources is disinfection to maintain residual chlorine in the distribution system, chlorine and its derivatives are used as disinfectants due to their low relative cost, ease of use and appropriate functionality to eliminate microbiological regrowth in drinking water distribution networks [38]. Isolation of amoebae from chlorinated samples in our study shows that some amoebal cells can survive drinking water even after chlorination. The survival of amoebae to chlorination is because of amoebal cyst walls containing cellulose, which form a physical barrier against chlorine [14, 39]. Amoebal cysts can survive chlorine concentrations as high as 100 mg/L for 10 minutes. Therefore, the currently applied dose of free chlorine
Fig. 1. Seasonal variations of free-living amoebae in tap water in Fayoum Governorate.
2818 Sakran T., et al.
residual may not result in the inactivation of amoebal cysts [40- 41].
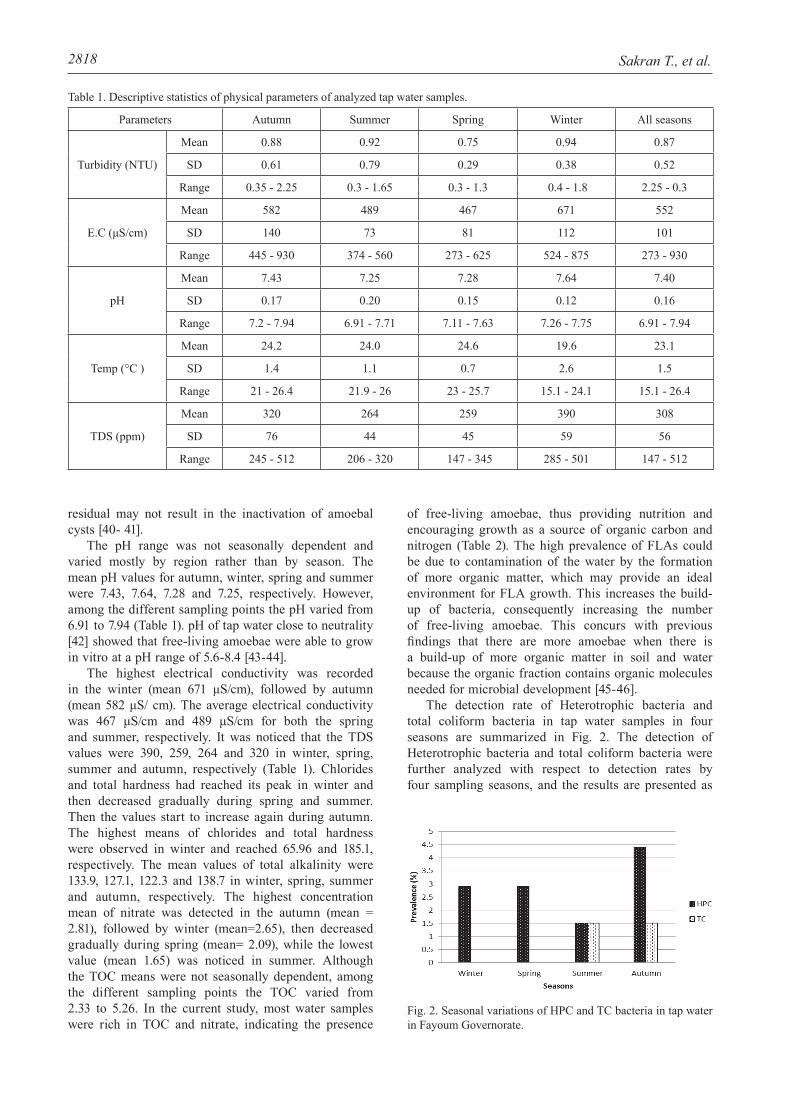
The pH range was not seasonally dependent and varied mostly by region rather than by season. The mean pH values for autumn, winter, spring and summer were 7.43, 7.64, 7.28 and 7.25, respectively. However, among the different sampling points the pH varied from 6.91 to 7.94 (Table 1). pH of tap water close to neutrality [42] showed that free-living amoebae were able to grow in vitro at a pH range of 5.6-8.4 [43-44].
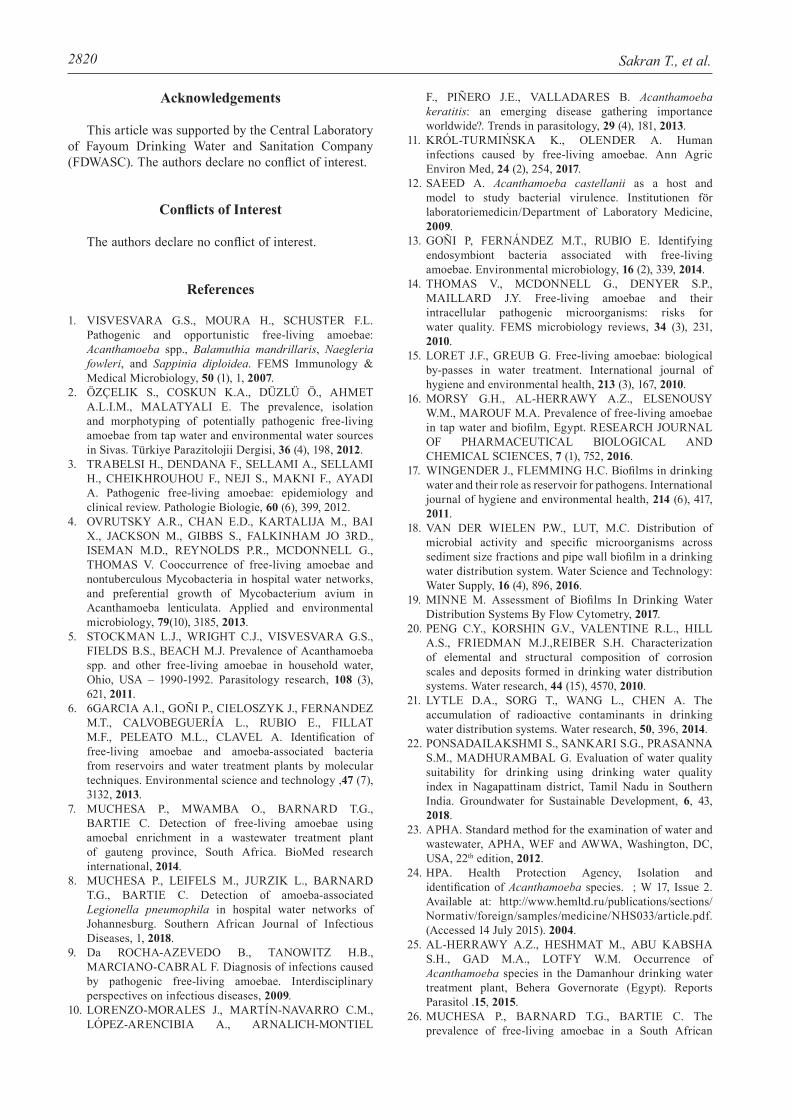
The highest electrical conductivity was recorded in the winter (mean 671 μS/cm), followed by autumn (mean 582 μS/ cm). The average electrical conductivity was 467 μS/cm and 489 μS/cm for both the spring and summer, respectively. It was noticed that the TDS values were 390, 259, 264 and 320 in winter, spring, summer and autumn, respectively (Table 1). Chlorides and total hardness had reached its peak in winter and then decreased gradually during spring and summer. Then the values start to increase again during autumn. The highest means of chlorides and total hardness were observed in winter and reached 65.96 and 185.1, respectively. The mean values of total alkalinity were 133.9, 127.1, 122.3 and 138.7 in winter, spring, summer and autumn, respectively. The highest concentration mean of nitrate was detected in the autumn (mean = 2.81), followed by winter (mean=2.65), then decreased gradually during spring (mean= 2.09), while the lowest value (mean 1.65) was noticed in summer. Although the TOC means were not seasonally dependent, among the different sampling points the TOC varied from 2.33 to 5.26. In the current study, most water samples were rich in TOC and nitrate, indicating the presence
of free-living amoebae, thus providing nutrition and encouraging growth as a source of organic carbon and nitrogen (Table 2). The high prevalence of FLAs could be due to contamination of the water by the formation of more organic matter, which may provide an ideal environment for FLA growth. This increases the build-up of bacteria, consequently increasing the number of free-living amoebae. This concurs with previous findings that there are more amoebae when there is a build-up of more organic matter in soil and water because the organic fraction contains organic molecules needed for microbial development [45-46].
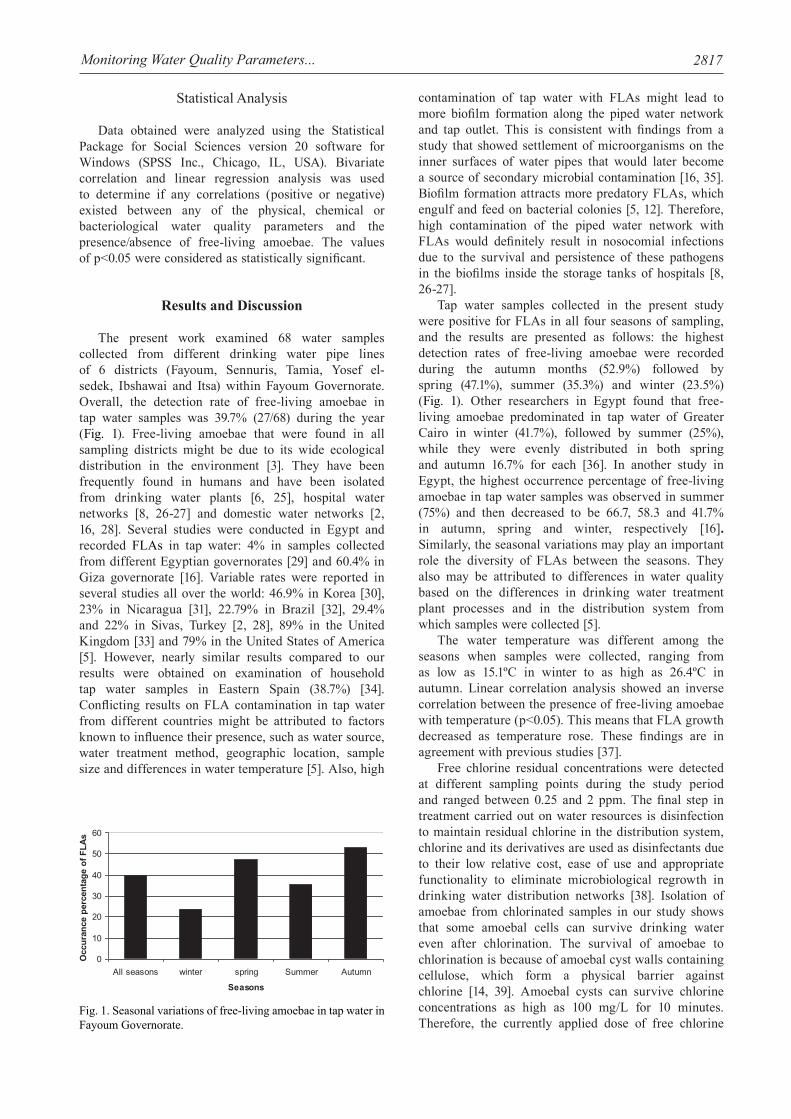
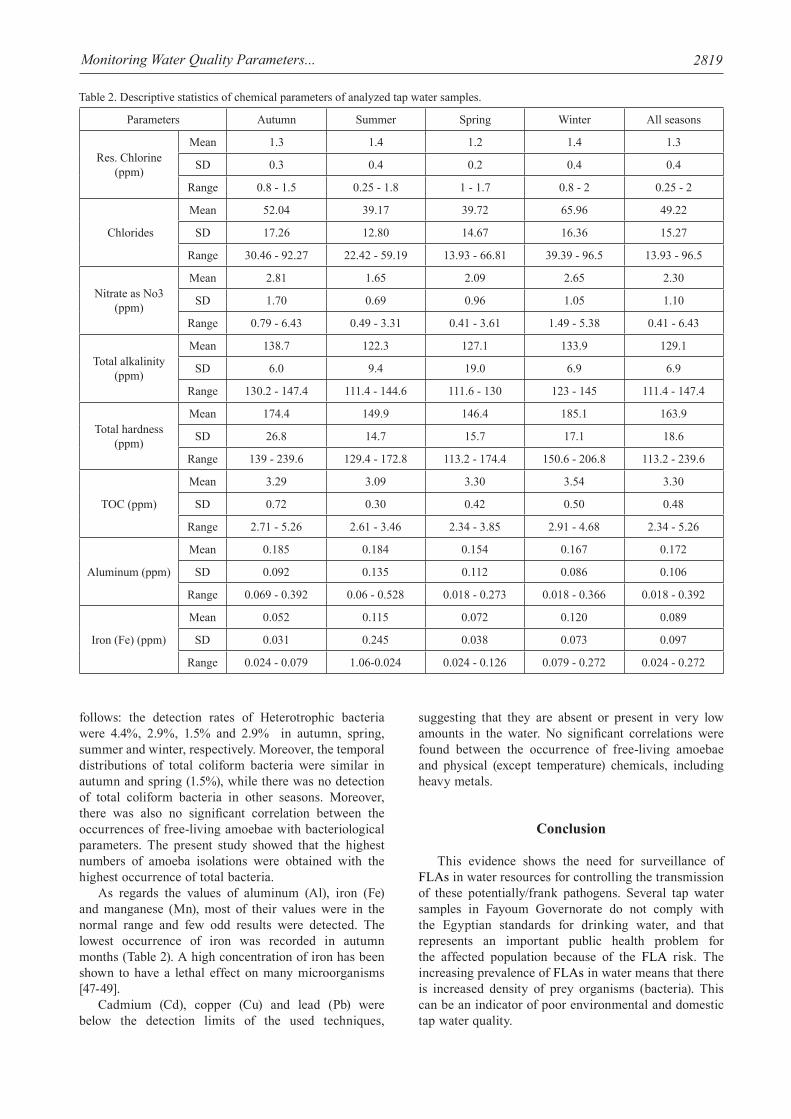
The detection rate of Heterotrophic bacteria and total coliform bacteria in tap water samples in four seasons are summarized in Fig. 2. The detection of Heterotrophic bacteria and total coliform bacteria were further analyzed with respect to detection rates by four sampling seasons, and the results are presented as
Fig. 2. Seasonal variations of HPC and TC bacteria in tap water in Fayoum Governorate.
Table 1. Descriptive statistics of physical parameters of analyzed tap water samples.
Parameters Autumn Summer Spring Winter All seasons
Turbidity (NTU)
Mean 0.88 0.92 0.75 0.94 0.87
SD 0.61 0.79 0.29 0.38 0.52
Range 0.35 - 2.25 0.3 - 1.65 0.3 - 1.3 0.4 - 1.8 2.25 - 0.3
E.C (μS/cm)
Mean 582 489 467 671 552
SD 140 73 81 112 101
Range 445 - 930 374 - 560 273 - 625 524 - 875 273 - 930
pH
Mean 7.43 7.25 7.28 7.64 7.40
SD 0.17 0.20 0.15 0.12 0.16
Range 7.2 - 7.94 6.91 - 7.71 7.11 - 7.63 7.26 - 7.75 6.91 - 7.94
Temp (°C )
Mean 24.2 24.0 24.6 19.6 23.1
SD 1.4 1.1 0.7 2.6 1.5
Range 21 - 26.4 21.9 - 26 23 - 25.7 15.1 - 24.1 15.1 - 26.4
TDS (ppm)
Mean 320 264 259 390 308
SD 76 44 45 59 56
Range 245 - 512 206 - 320 147 - 345 285 - 501 147 - 512
2819Monitoring Water Quality Parameters...
follows: the detection rates of Heterotrophic bacteria were 4.4%, 2.9%, 1.5% and 2.9% in autumn, spring, summer and winter, respectively. Moreover, the temporal distributions of total coliform bacteria were similar in autumn and spring (1.5%), while there was no detection of total coliform bacteria in other seasons. Moreover, there was also no significant correlation between the occurrences of free-living amoebae with bacteriological parameters. The present study showed that the highest numbers of amoeba isolations were obtained with the highest occurrence of total bacteria.
As regards the values of aluminum (Al), iron (Fe) and manganese (Mn), most of their values were in the normal range and few odd results were detected. The lowest occurrence of iron was recorded in autumn months (Table 2). A high concentration of iron has been shown to have a lethal effect on many microorganisms [47-49].
Cadmium (Cd), copper (Cu) and lead (Pb) were below the detection limits of the used techniques,
suggesting that they are absent or present in very low amounts in the water. No significant correlations were found between the occurrence of free-living amoebae and physical (except temperature) chemicals, including heavy metals.
Conclusion
This evidence shows the need for surveillance of FLAs in water resources for controlling the transmission of these potentially/frank pathogens. Several tap water samples in Fayoum Governorate do not comply with the Egyptian standards for drinking water, and that represents an important public health problem for the affected population because of the FLA risk. The increasing prevalence of FLAs in water means that there is increased density of prey organisms (bacteria). This can be an indicator of poor environmental and domestic tap water quality.
Parameters Autumn Summer Spring Winter All seasons
Res. Chlorine (ppm)
Mean 1.3 1.4 1.2 1.4 1.3
SD 0.3 0.4 0.2 0.4 0.4
Range 0.8 - 1.5 0.25 - 1.8 1 - 1.7 0.8 - 2 0.25 - 2
Chlorides
Mean 52.04 39.17 39.72 65.96 49.22
SD 17.26 12.80 14.67 16.36 15.27
Range 30.46 - 92.27 22.42 - 59.19 13.93 - 66.81 39.39 - 96.5 13.93 - 96.5
Nitrate as No3 (ppm)
Mean 2.81 1.65 2.09 2.65 2.30
SD 1.70 0.69 0.96 1.05 1.10
Range 0.79 - 6.43 0.49 - 3.31 0.41 - 3.61 1.49 - 5.38 0.41 - 6.43
Total alkalinity (ppm)
Mean 138.7 122.3 127.1 133.9 129.1
SD 6.0 9.4 19.0 6.9 6.9
Range 130.2 - 147.4 111.4 - 144.6 111.6 - 130 123 - 145 111.4 - 147.4
Total hardness (ppm)
Mean 174.4 149.9 146.4 185.1 163.9
SD 26.8 14.7 15.7 17.1 18.6
Range 139 - 239.6 129.4 - 172.8 113.2 - 174.4 150.6 - 206.8 113.2 - 239.6
TOC (ppm)
Mean 3.29 3.09 3.30 3.54 3.30
SD 0.72 0.30 0.42 0.50 0.48
Range 2.71 - 5.26 2.61 - 3.46 2.34 - 3.85 2.91 - 4.68 2.34 - 5.26
Aluminum (ppm)
Mean 0.185 0.184 0.154 0.167 0.172
SD 0.092 0.135 0.112 0.086 0.106
Range 0.069 - 0.392 0.06 - 0.528 0.018 - 0.273 0.018 - 0.366 0.018 - 0.392
Iron (Fe) (ppm)
Mean 0.052 0.115 0.072 0.120 0.089
SD 0.031 0.245 0.038 0.073 0.097
Range 0.024 - 0.079 1.06-0.024 0.024 - 0.126 0.079 - 0.272 0.024 - 0.272
Table 2. Descriptive statistics of chemical parameters of analyzed tap water samples.
2820 Sakran T., et al.
Acknowledgements
This article was supported by the Central Laboratory of Fayoum Drinking Water and Sanitation Company (FDWASC). The authors declare no conflict of interest.
Conflicts of Interest
The authors declare no conflict of interest.
References
1. VISVESVARA G.S., MOURA H., SCHUSTER F.L. Pathogenic and opportunistic free-living amoebae: Acanthamoeba spp., Balamuthia mandrillaris, Naegleria fowleri, and Sappinia diploidea. FEMS Immunology & Medical Microbiology, 50 (1), 1, 2007.
2. ÖZÇELIK S., COSKUN K.A., DÜZLÜ Ö., AHMET A.L.I.M., MALATYALI E. The prevalence, isolation and morphotyping of potentially pathogenic free-living amoebae from tap water and environmental water sources in Sivas. Türkiye Parazitolojii Dergisi, 36 (4), 198, 2012.
3. TRABELSI H., DENDANA F., SELLAMI A., SELLAMI H., CHEIKHROUHOU F., NEJI S., MAKNI F., AYADI A. Pathogenic free-living amoebae: epidemiology and clinical review. Pathologie Biologie, 60 (6), 399, 2012.
4. OVRUTSKY A.R., CHAN E.D., KARTALIJA M., BAI X., JACKSON M., GIBBS S., FALKINHAM JO 3RD., ISEMAN M.D., REYNOLDS P.R., MCDONNELL G., THOMAS V. Cooccurrence of free-living amoebae and nontuberculous Mycobacteria in hospital water networks, and preferential growth of Mycobacterium avium in Acanthamoeba lenticulata. Applied and environmental microbiology, 79(10), 3185, 2013.
5. STOCKMAN L.J., WRIGHT C.J., VISVESVARA G.S., FIELDS B.S., BEACH M.J. Prevalence of Acanthamoeba spp. and other free-living amoebae in household water, Ohio, USA – 1990-1992. Parasitology research, 108 (3), 621, 2011.
6. 6GARCIA A.1., GOÑI P., CIELOSZYK J., FERNANDEZ M.T., CALVOBEGUERÍA L., RUBIO E., FILLAT M.F., PELEATO M.L., CLAVEL A. Identification of free-living amoebae and amoeba-associated bacteria from reservoirs and water treatment plants by molecular techniques. Environmental science and technology ,47 (7), 3132, 2013.
7. MUCHESA P., MWAMBA O., BARNARD T.G., BARTIE C. Detection of free-living amoebae using amoebal enrichment in a wastewater treatment plant of gauteng province, South Africa. BioMed research international, 2014.
8. MUCHESA P., LEIFELS M., JURZIK L., BARNARD T.G., BARTIE C. Detection of amoeba-associated Legionella pneumophila in hospital water networks of Johannesburg. Southern African Journal of Infectious Diseases, 1, 2018.
9. Da ROCHA-AZEVEDO B., TANOWITZ H.B., MARCIANO-CABRAL F. Diagnosis of infections caused by pathogenic free-living amoebae. Interdisciplinary perspectives on infectious diseases, 2009.
10. LORENZO-MORALES J., MARTÍN-NAVARRO C.M., LÓPEZ-ARENCIBIA A., ARNALICH-MONTIEL
F., PIÑERO J.E., VALLADARES B. Acanthamoeba keratitis: an emerging disease gathering importance worldwide?. Trends in parasitology, 29 (4), 181, 2013.
11. KRÓL-TURMIŃSKA K., OLENDER A. Human infections caused by free-living amoebae. Ann Agric Environ Med, 24 (2), 254, 2017.
12. SAEED A. Acanthamoeba castellanii as a host and model to study bacterial virulence. Institutionen för laboratoriemedicin/Department of Laboratory Medicine, 2009.
13. GOÑI P, FERNÁNDEZ M.T., RUBIO E. Identifying endosymbiont bacteria associated with free-living amoebae. Environmental microbiology, 16 (2), 339, 2014.
14. THOMAS V., MCDONNELL G., DENYER S.P., MAILLARD J.Y. Free-living amoebae and their intracellular pathogenic microorganisms: risks for water quality. FEMS microbiology reviews, 34 (3), 231, 2010.
15. LORET J.F., GREUB G. Free-living amoebae: biological by-passes in water treatment. International journal of hygiene and environmental health, 213 (3), 167, 2010.
16. MORSY G.H., AL-HERRAWY A.Z., ELSENOUSY W.M., MAROUF M.A. Prevalence of free-living amoebae in tap water and biofilm, Egypt. RESEARCH JOURNAL OF PHARMACEUTICAL BIOLOGICAL AND CHEMICAL SCIENCES, 7 (1), 752, 2016.
17. WINGENDER J., FLEMMING H.C. Biofilms in drinking water and their role as reservoir for pathogens. International journal of hygiene and environmental health, 214 (6), 417, 2011.
18. VAN DER WIELEN P.W., LUT, M.C. Distribution of microbial activity and specific microorganisms across sediment size fractions and pipe wall biofilm in a drinking water distribution system. Water Science and Technology: Water Supply, 16 (4), 896, 2016.
19. MINNE M. Assessment of Biofilms In Drinking Water Distribution Systems By Flow Cytometry, 2017.
20. PENG C.Y., KORSHIN G.V., VALENTINE R.L., HILL A.S., FRIEDMAN M.J.,REIBER S.H. Characterization of elemental and structural composition of corrosion scales and deposits formed in drinking water distribution systems. Water research, 44 (15), 4570, 2010.
21. LYTLE D.A., SORG T., WANG L., CHEN A. The accumulation of radioactive contaminants in drinking water distribution systems. Water research, 50, 396, 2014.
22. PONSADAILAKSHMI S., SANKARI S.G., PRASANNA S.M., MADHURAMBAL G. Evaluation of water quality suitability for drinking using drinking water quality index in Nagapattinam district, Tamil Nadu in Southern India. Groundwater for Sustainable Development, 6, 43, 2018.
23. APHA. Standard method for the examination of water and wastewater, APHA, WEF and AWWA, Washington, DC, USA, 22th edition, 2012.
24. HPA. Health Protection Agency, Isolation and identification of Acanthamoeba species. ; W 17, Issue 2. Available at: http://www.hemltd.ru/publications/sections/Normativ/foreign/samples/medicine/NHS033/article.pdf. (Accessed 14 July 2015). 2004.
25. AL-HERRAWY A.Z., HESHMAT M., ABU KABSHA S.H., GAD M.A., LOTFY W.M. Occurrence of Acanthamoeba species in the Damanhour drinking water treatment plant, Behera Governorate (Egypt). Reports Parasitol .15, 2015.
26. MUCHESA P., BARNARD T.G., BARTIE C. The prevalence of free-living amoebae in a South African
2821Monitoring Water Quality Parameters...
hospital water distribution system. South African Journal of Science 111(1-2), 01, 2015.
27. KHURANA S., BISWAL M., KAUR H., MALHOTRA P., ARORA P., MEGHA K., TANEJA N., SEHGAL R. Free living amoebae in water sources of critical units in a tertiary care hospital in India. Indian journal of medical microbiology, 33 (3), 343, 2015.
28. COŞKUN K.A., ÖZÇELIK S., TUTAR L., ELALDI N., TUTAR Y. Isolation and identification of free-living amoebae from tap water in Sivas, Turkey. BioMed research international, 2013.
29. HAMADTO H.H., AUFY S.M., EL-HAYAWAN I.A., SALEH M.H., NAGATY I.M. Study of free living amoebae in Egypt. Journal of the Egyptian Society of Parasitology, 23 (3), 631, 1993.
30. JEONG H.J., YU H.S. The role of domestic tap water in Acanthamoeba contamination in contact lens storage cases in Korea. The Korean journal of parasitology 43 (2), 47, 2005.
31. LEIVA B., CLASDOTTER E., LINDER E., WINIECKA-KRUSNELL J. Free-living Acanthamoeba and Naegleria spp. amebae in water sources of León, Nicaragua. Revista de Biologia Tropical 56 (2), 439, 2008.
32. WINCK M.A.T., CAUMO K., ROTT M.B. Prevalence of Acanthamoeba from tap water in Rio Grande do Sul, Brazil. Current microbiology, 63 (5), 464, 2011.
33. KILVINGTON S., GRAY T., DART J., MORLET N., BEECHING J.R., FRAZER D.G., MATHESON M. Acanthamoeba keratitis: the role of domestic tap water contamination in the United Kingdom”. Investigative ophthalmology and visual science, 45 (1), 165, 2004.
34. MORENO-MESONERO L., MORENO Y., ALONSO J.L., FERRÚS M.A. Detection of viable Helicobacter pylori inside free-living amoebae in wastewater and drinking water samples from Eastern Spain. Environmental microbiology, 2017.
35. ROŻEJ A., CYDZIK-KWIATKOWSKA A., KOWALSKA B., KOWALSKI D. Structure and microbial diversity of biofilms on different pipe materials of a model drinking water distribution systems. World Journal of Microbiology and Biotechnology, 31 (1), 37, 2015.
36. GAD MA. Economic analysis of Naegleria spp. in Egyptian aquatic environment. (PhD thesis). Cairo, Egypt: Faculty of Science, Ain Shams University; 2014.
37. SENTE C., ERUME J., NAIGAGA I., MULINDWA J., OCHWO S., MAGAMBO P.K., NAMARA B.G., KATO C.D., SEBYATIKA G., MUWONGE K., OCAIDO M.
Prevalence of pathogenic free-living amoeba and other protozoa in natural and communal piped tap water from Queen Elizabeth protected area, Uganda”. Infectious diseases of poverty, 5 (1), 68, 2016.
38. HASSANI A.H., JAFARI M.A., TORABIFAR B. Trihalomethanes concentration in different components of water treatment plant and water distribution system in the north of Iran. International journal of environmental research, 4 (4), 887, 2010.
39. HELBLING D.E., VANBRIESEN J.M. Free chlorine demand and cell survival of microbial suspensions. Water research, 41(19), 4424, 2007.
40. CERVERO-ARAGÓ S., RODRÍGUEZ-MARTÍNEZ S., PUERTAS-BENNASAR A., ARAUJO R.M. Effect of common drinking water disinfectants, chlorine and heat, on free Legionella and amoebae-associated Legionella. PloS one, 10 (8), e0134726, 2015.
41. GOUDOT S., HERBELIN P., MATHIEU L., SOREAU S., BANAS S., JORAND F.P.A. Biocidal efficacy of monochloramine against planktonic and biofilm - associated Naegleria fowleri cells. Journal of applied microbiology, 116 (4), 1055, 2014.
42. KADLEC V. The effects of some factors on the growth and morphology of Naegleria sp. and three strains of the genus Acanthamoeba. Folia parasitologica 22 (4), 317, 1975.
43. STEVENS A.R., TYNDALL R.L., COUTANT C.C., WILLAERT E. Isolation of the etiological agent of primary amoebic meningoencephalitis from artifically heated waters. Applied and environmental microbiology, 34 (6), 701, 1977.
44. RODRÍGUEZ-ZARAGOZA S. Ecology of free-living amoebae. Critical reviews in microbiology 20 (3), 225, 1994.
45. MADONI P. Protozoa in wastewater treatment processes: A minireview. Italian Journal of Zoology, 78 (1), 3, 2011.
46. HOORMAN J.J. Understanding soil microbes and nutrient recycling. Agriculture and natural resources, 1-5 , 2010.
47. SOTERO-SANTOS R.B., ROCHA O., POVINELLI J. Toxicity of ferric chloride sludge to aquatic organisms. Chemosphere, 68 (4), 628, 2007.
48. SYMEONIDIS A., MARANGOS M. Iron and microbial growth. In Insight and control of infectious disease in global scenario. InTech, 2012.
49. PETERS A., MERRINGTON G., SIMPSON P., CRANE M. Proposed quality standards for iron in freshwaters based on field evidence. Water Framework Directive, United Kingdom Technical Advisory Group. 2011.