Embed Size (px)
Citation preview
Mariotti et al. EJNMMI Research 2013, 3:74http://www.ejnmmires.com/content/3/1/74
ORIGINAL RESEARCH Open Access
Assessing radiotracer kinetics in the Langendorffperfused heartErika Mariotti1*, Mattia Veronese2, Joel T Dunn1, Rodolfo A Medina1, Philip J Blower1, Richard Southworth1
and Thomas R Eykyn1,3
Abstract
Background: The Langendorff perfused heart is a physiologically relevant and controllable model with potential forassessing the pharmacokinetics of new radiotracers under a range of pathophysiological conditions.. We assess thefeasibility of extending the methods validated for in vivo PET data analysis to the characterisation of PET tracerkinetics applied to Langendorff perfused hearts.
Methods: Monte Carlo simulations were used to study the accuracy and reproducibility of linear and non-linearspectral analysis (SA/NLSA), the Patlak graphical method and normalised tissue activity (NA). The methods wereused to analyse time-activity curves of two widely used PET tracers, [18 F]-FDG and [18 F]-FMISO, acquired ex vivofrom Langendorff perfused rat hearts under normoxic and hypoxic conditions.
Results: Monte Carlo simulations showed NLSA to be superior to SA in identifying and quantifying the presence ofirreversible trapping component (αo), for low values of αo. The performance of NLSA and SA for high values oftrapping was comparable. NLSA was also more precise than SA in determining the absence of trapping over therange of simulated kinetics and SNR. Simulations also suggest that the semi-quantitative method NA is adequatefor the evaluation of trapping, and it was found to be more accurate than Patlak. The values of α0 estimated withNLSA from the time series of both [18 F]-FDG and [18 F]-FMISO increased significantly from normoxia to hypoxia inagreement with previous studies. The values of trapping derived using SA increased but not significantly, reflectingthe larger error associate with this method. Patlak estimated from the experimental datasets increased from normoxiato hypoxia but was not significant. NA estimated from the [18 F]-FDG data increased from normoxia to hypoxia, but wasnot significant, whilst NA calculated for [18 F]-FMISO time-activity curves increased significantly.
Conclusions: Monte Carlo simulations suggested that spectral-based quantitative analysis methods are adequate forthe kinetic characterisation of time-activity curves acquired ex vivo from perfused hearts. The uptake rate Patlak and theindex NA also represent a good alternative to the SA and NLSA algorithms when the aim of the kinetic analysis is tomeasure changes in the amount of tracer trapped in the irreversible compartment in response to external stimuli. Forlow levels of trapping, NLSA and NA were subject to lower errors than SA and Patlak, respectively.
Keywords: PET; Spectral analysis; Kinetic modelling; [18 F]-FDG; [18 F]-FMISO; Perfused heart
BackgroundThe isolated perfused heart is commonly used for theearly evaluation of pharmaceuticals as well as being ableto assess novel radiotracer pharmacokinetics [1-3]. It is adynamic, biologically relevant model, with an intact vas-culature, which provides insight into tracer uptake and
* Correspondence: [email protected] of Imaging Sciences and Biomedical Engineering, St. Thomas'Hospital, King's College London, London SE1 7EH, UKFull list of author information is available at the end of the article
© 2013 Mariotti et al.; licensee Springer. This isAttribution License (http://creativecommons.orin any medium, provided the original work is p
retention in a metabolically active beating heart, withoutthe potential complications of systemic metabolism andrecirculation. It is versatile in terms of allowing directdrug and tracer administration; control of perfusion, work-load and energy substrate supply; simple induction of hyp-oxia or ischemia; and the capacity to monitor the effects ofsuch interventions upon cardiac contractile function andbiochemistry [4-9].Ex vivo time-activity curves of Positron Emission
Tomography (PET) tracers from the isolated heart can be
an Open Access article distributed under the terms of the Creative Commonsg/licenses/by/2.0), which permits unrestricted use, distribution, and reproductionroperly cited.
Mariotti et al. EJNMMI Research 2013, 3:74 Page 2 of 14http://www.ejnmmires.com/content/3/1/74
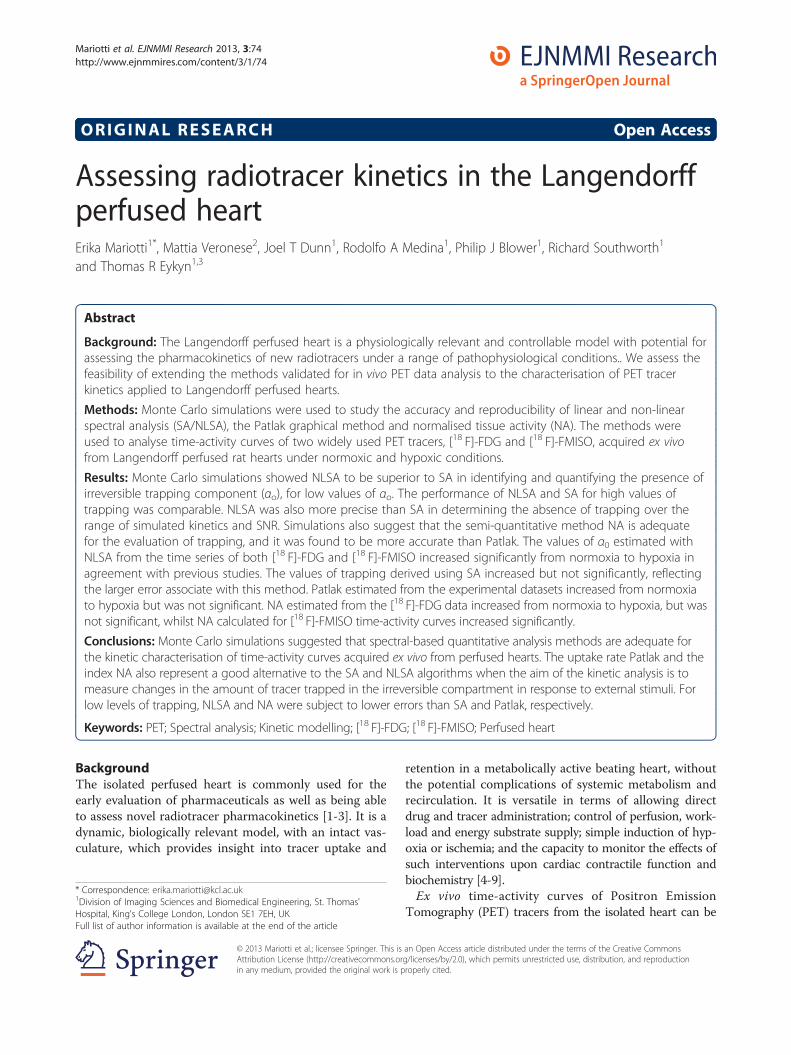
acquired through single or multiple NaI γ-detectors withno spatial information but very high temporal resolution[2,10]. Delivery input functions (Cin(t)) can be measured ina Langendorff perfused heart with a γ-detector coupledto the inflow line, while time-activity curves in the heart(Ctiss(t)) can be acquired using a single γ-detector inter-rogating the entire isolated perfused heart (see Figure 1).As tracer uptake is heterogeneous across the myocardium(from endocardium to epicardium, for example [11]), time-activity curves from perfused hearts likely represent a moreheterogeneous range of kinetics than spatially resolved im-aging data. Ex vivo time-activity curves further differ fromthose acquired in vivo in terms of signal-to-noise ratio(SNR) and lack of recirculation leading to an input func-tion that decays rapidly to zero. In order to relate themeasured activity to the underlying physiological orbiochemical processes, the application of mathematicalmodels to describe tracer kinetics is necessary.A number of quantitative and semi-quantitative ana-
lysis methods are available for the evaluation of PETtracer kinetics in vivo, but to date, relatively few studieshave investigated their validity for characterisation ofPET tracers ex vivo, where there is the potential to gainbiochemical insight into the nature of radiotracer trap-ping mechanisms or disease processes under more read-ily controlled experimental conditions. Previous studieshave fitted time-activity curves from isolated hearts withexponential functions characterised by an arbitrary num-ber of rates and quantified the tracer retention by aver-aging the activity measured in a chosen time interval atthe end of the acquisition window [10]. This approachassumes the presence of an irreversible trapping compo-nent and the number of kinetic rates characteristic of aparticular tracer a priori. The approach also rarely in-cludes consideration of the delivery input function as ameans of accurately quantifying tracer tissue kinetics.
Figure 1 Experimental set-up. In each experiment, a bolus of [18 F]-FDGthrough the perfusion line was recorded using two NaI γ-detectors whichtime-activity curves.
In this study, we explore the possibility of extendingthe approaches used for the analysis of in vivo PET datato the kinetic analysis of time-activity curves acquiredfrom Langendorff perfused rat hearts. We assess the accur-acy and reproducibility of quantitative spectral analysis(SA) [12] and non-linear spectral analysis (NLSA) methods[13], as well as of the graphical method Patlak [14] andthe semi-quantitative index normalised activity (NA) inboth simulated and experimental ex vivo PET datasets.These methods were chosen because they can be appliedto homogenous as well as heterogeneous systems with-out any a priori hypothesis on the number of com-partments necessary to describe the data. Monte Carlosimulations were used to compare the performance of SAand NLSA in (1) identifying the presence of irreversibletrapping, (2) deriving the number of kinetic componentsand (3) quantifying the irreversible trapping componentfrom ex vivo time-activity curves. SA and NLSA were usedto analyse experimental ex vivo time-activity curves ac-quired from isolated perfused rat hearts after the injectionof two widely used PET tracers, [18 F]-FDG and [18 F]-FMISO, and compared with the uptake rate Patlak andthe index NA in normoxic conditions and in response tohypoxia.
MethodsSpectral analysisIn SA, the tissue activity at time t, Ctiss(t), is modelled as aconvolution of the delivery input function, Cin(t), with thesum of M + 1 distinct exponential terms as in Equation 1.
Ctiss tð Þ ¼XMj¼0
Cin tð Þ⊗αje−βjt ð1Þ
αj and βj are assumed to be real non-negative values.The upper limit, M, represents the maximum number of
or [18 F]-FMISO was injected through the injection port, and its passageare able to measure the input (detector 1) and the tissue (detector 2)
Mariotti et al. EJNMMI Research 2013, 3:74 Page 3 of 14http://www.ejnmmires.com/content/3/1/74
terms to be included in the model. The values of therates βj are predetermined and fixed in order to cover arange of all possible kinetic components measurablefrom the data. The values of the amplitudes αj are esti-mated from the input and tissue time-activity curves bynon-negative least square algorithm, and normally, onlya few components with αj > 0 are detected.Spectral analysis was implemented as previously re-
ported [15], with Ctiss(t) referring to the activity of thetracer measured in the whole heart and Cin(t) associatedto the measured delivery input function. The grid ofvalues of the rates βj (β1 < β2 <… < βM) (Equation 1) wasdefined as a logarithmic distribution with lower limitβ1 = 1/(3Tend), where Tend was the end time of the experi-ment, and upper limit βM = 3/Tin in agreement with pre-vious studies [16]. Tin was the duration of the first timeframe of the experiment. The number of points M betweenβ1 and βM was chosen equal to 100. A component for β = 0was included in the model, corresponding to a fullytrapped component. The M + 1 unknown values of αj wereestimated through a non-negative least square estimator.Weights were inversely proportional to the variance ofdecay-corrected measured activity. The SA algorithm wasimplemented in Matlab (the MathWorks, Natik, USA).
Non-linear spectral analysisFor the implementation of NLSA, it is not necessary tospecify a grid of values of βj. The M + 1 unknown valuesof βj and αj were estimated through non-linear fittingwith the initial conditions chosen within a physiologicalrange (and in agreement with [13]) maintained constantfor all datasets analysed. The number of exponentialsnecessary to give a good fit of the data M (Equation 1)was fixed between 1 and up to a maximum of 4, in agree-ment with previous studies [13]. The Akaike informationcriterion (AIC) [17] was used to choose the model that bestfit the data. Weights were inversely proportional to thevariance of decay-corrected measured activity. The NLSAalgorithm was implemented in Matlab (the MathWorks,Natik, USA).
Graphical method: Patlak plotDue to the demonstrated irreversible tissue retention ofthe tested tracers [13,18], the Patlak plot (given by theexpression below) was chosen among the available graph-ical methods [14]:
Ctiss tð ÞCin tð Þ ¼ K
Z t
0Cin τð ÞdτCin tð Þ þ V ð2Þ
where K represents the net uptake rate of the tracer and Vthe distribution of the tracer in the compartment thatis in rapid equilibrium with the plasma. The unknown
constants K and V were obtained by linear regression
from a graph of Ctiss(t)/Cin(t) againstZ t
0
Cin τð Þdτ=Cin tð Þ
computed for t > 7.5 min. Because of the large numberof data points (five samples per second), both quantitieswere interpolated on a 6-s sub-sampled grid. K was the ul-timate parameter of interest considered, while V was ex-cluded from the tracer kinetic analysis.
Normalised activityWe defined the NA as a surrogate of the semi-quantitativeindex standard uptake value (SUV) used for the character-isation of tracer trapping in vivo. SUV is given by the ratioof the tissue radioactivity and the injected radioactivity di-vided by the body weight [19]. In ex vivo experiments, theinput function is delivered as an impulse with no recircula-tion, and therefore, the plasma radioactivity rapidly decaysto zero. Additionally, due to the experimental set-up,the measured activity is not directly proportional to theradioactivity concentration. For these reasons, the semi-quantitative index SUV could not be computed in thisstudy as it is defined for in vivo experiments. We define anew index, NA, in which the maximum measured activityin the target tissue substituted the normalised injecteddose of the tracer normally used in SUV. NA was calcu-lated as a ratio of the mean tissue activity (Ctiss(t)) mea-sured in counts per second (CPS) over a small interval atthe end of the experiment [end − 0.075 min, tend] and themaximum value of Ctiss(t) (CPS).
NA ¼ mean Ctiss tend−0:075min; tendð Þh imax Ctiss tð Þð Þ ð3Þ
Simulation studiesDatasets were simulated, reproducing the characteristicsof ex vivo time-activity curves from isolated hearts innormoxia and at different levels of hypoxia. Bi- and tri-exponential ex vivo time-activity curves with known kin-etics were simulated using Equation 1. The values of βjwere fixed (for tri-exponentials, β1 = 0.5 min−1, β2 =5 min−1 and β3 = 15 min−1; and for bi-exponentials, β1 =0.5 min−1and β2 = 15 min−1), whereas αj were randomlygenerated within a chosen interval (for tri-exponentials,0.011 min−1 < α1 < 0.11 min−1, 0.12 min−1 < α2 < 0.2 min−1,and 5 min−1 < α3 < 8 min−1; and for bi-exponentials,0.011 min−1 < α1 < 0.11 min−1 and 5 min−1 < α2 < 8 min−1).Bi- and tri-exponential curves were simulated with andwithout a trapping component α0 (for β0 = 0). Four differ-ent values of irreversible trapping were simulated (α0,1 =0.006 min−1, α0,2 = 0.06 min−1, α0,3 = 0.2 min−1 and α0,4 =0.6 min−1) (see Figure 2). The values used in the simula-tions were chosen within a physiological range and in
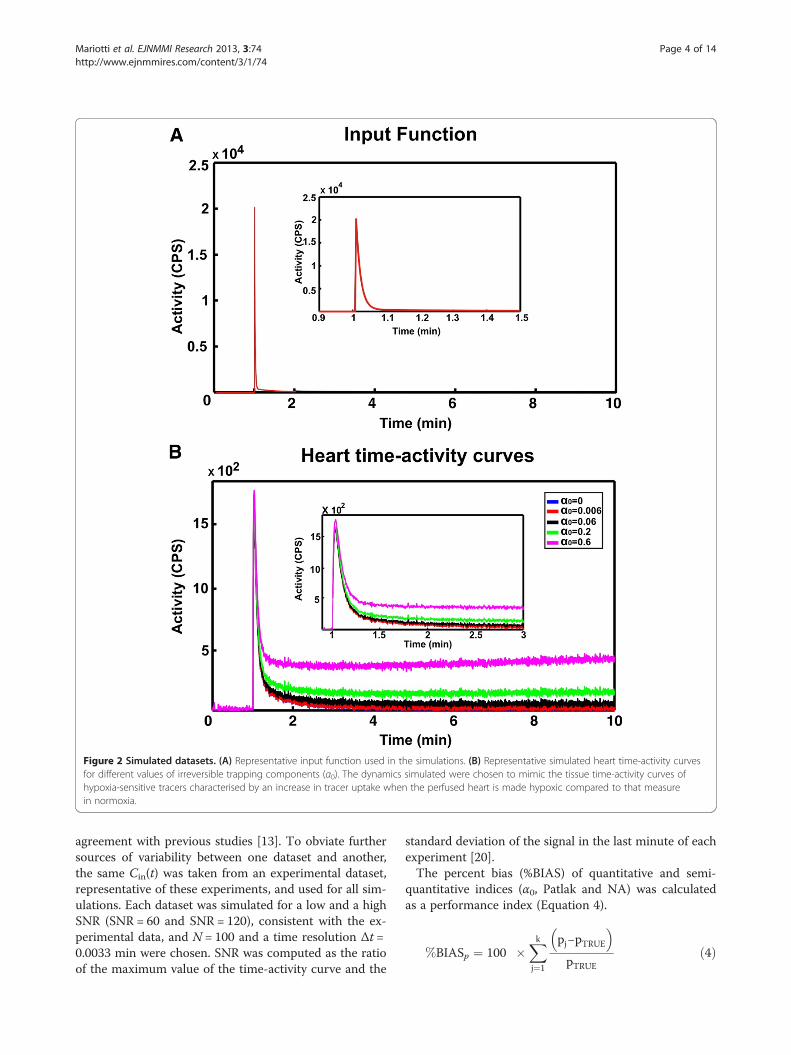
Figure 2 Simulated datasets. (A) Representative input function used in the simulations. (B) Representative simulated heart time-activity curvesfor different values of irreversible trapping components (α0). The dynamics simulated were chosen to mimic the tissue time-activity curves ofhypoxia-sensitive tracers characterised by an increase in tracer uptake when the perfused heart is made hypoxic compared to that measurein normoxia.
Mariotti et al. EJNMMI Research 2013, 3:74 Page 4 of 14http://www.ejnmmires.com/content/3/1/74
agreement with previous studies [13]. To obviate furthersources of variability between one dataset and another,the same Cin(t) was taken from an experimental dataset,representative of these experiments, and used for all sim-ulations. Each dataset was simulated for a low and a highSNR (SNR = 60 and SNR = 120), consistent with the ex-perimental data, and N = 100 and a time resolution Δt =0.0033 min were chosen. SNR was computed as the ratioof the maximum value of the time-activity curve and the
standard deviation of the signal in the last minute of eachexperiment [20].The percent bias (%BIAS) of quantitative and semi-
quantitative indices (α0, Patlak and NA) was calculatedas a performance index (Equation 4).
%BIASp ¼ 100 �Xkj¼1
pj−pTRUE� �
pTRUEð4Þ
Mariotti et al. EJNMMI Research 2013, 3:74 Page 5 of 14http://www.ejnmmires.com/content/3/1/74
where pj and pTRUE are the estimated and true value ofthe indices p.
Experimental protocolAll procedures were performed in accordance with theUnited Kingdom Home Office Guide on the Operationof the Animals (Scientific Procedures) Act 1986 andKCL's Ethical Review Process Committee.[18 F]-FDG was provided by the clinical PET Centre,
St. Thomas' Hospital, whereas [18 F]-FMISO was pre-pared following a previously reported method [21].Mature male Wistar rats (250 to 300 g) were fed ad
libitum with regular animal feed. Hearts (n = 4 for [18 F]-FDG and n = 3 for [18 F]-FMISO) were harvested underterminal anaesthesia (sodium pentobarbitone (100 mg/kg)intraperitoneal injection with heparin (200 IU)) andplunged into ice-cold Krebs Henseleit buffer (KHB), withthe following composition: NaCl 118 mM, NaHCO3
25 mM, MgSO4 1.2 mM, KCl 5.9 mM, Na2EDTA 0.6 mM,glucose 11.1 mM and CaCl2 2.5 mM, pH 7.4. Hearts werecannulated via the aorta and retrogradely perfused at con-stant flow (14 ml/min) with KHB at 37°C. Cardiac con-tractile function was monitored with a water-filled ballooninserted into the left ventricular lumen inflated to recordan end diastolic pressure of 6 to 8 mmHg, which was con-nected to a pressure transducer and recording apparatus.Perfusion pressure was measured by a further pressuretransducer inserted into the arterial line. A bolus of eachradiotracer (1 MBq in 100 μl KHB) was administered viaan in-line injection port, and its transit through the perfu-sion apparatus was monitored by NaI detectors (1) in thearterial line above the heart cannula and (2) directly oppos-ite the heart (to quantify the tracer accumulation in theheart) connected to a GinaSTAR TM ITLC unit (seeFigure 1). All datasets were acquired with a time reso-lution Δt = 0.0033 min.After a stabilisation period, where KHB perfusate was
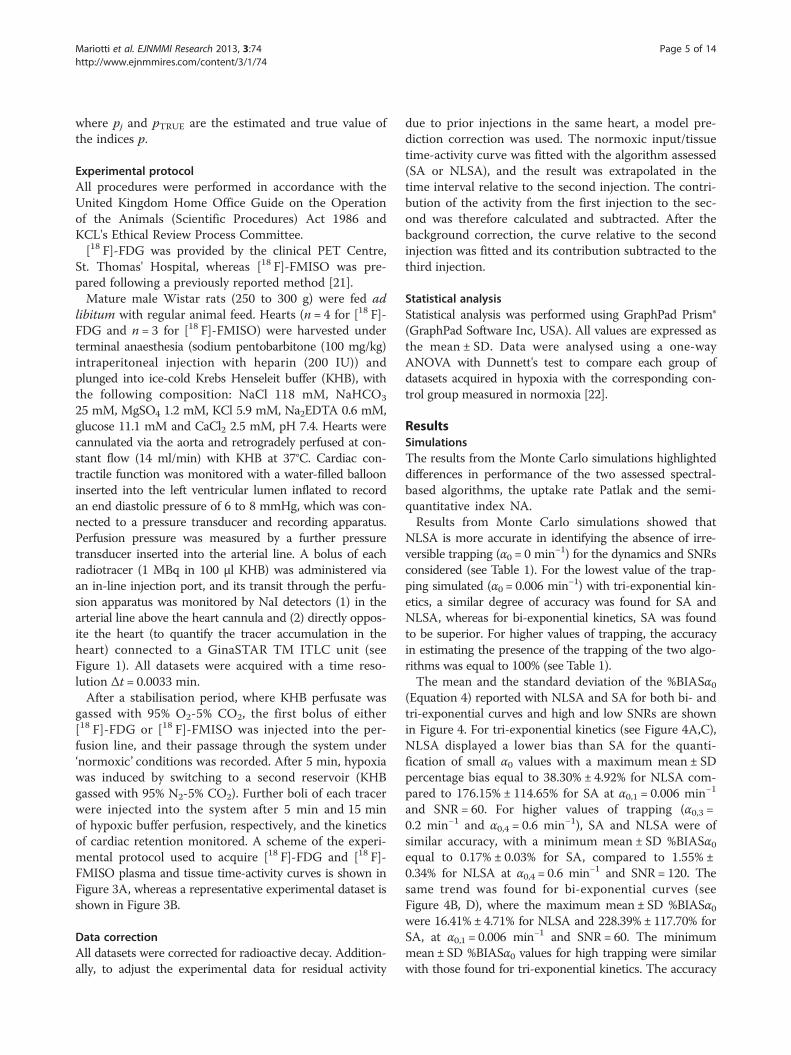
gassed with 95% O2-5% CO2, the first bolus of either[18 F]-FDG or [18 F]-FMISO was injected into the per-fusion line, and their passage through the system under‘normoxic’ conditions was recorded. After 5 min, hypoxiawas induced by switching to a second reservoir (KHBgassed with 95% N2-5% CO2). Further boli of each tracerwere injected into the system after 5 min and 15 minof hypoxic buffer perfusion, respectively, and the kineticsof cardiac retention monitored. A scheme of the experi-mental protocol used to acquire [18 F]-FDG and [18 F]-FMISO plasma and tissue time-activity curves is shown inFigure 3A, whereas a representative experimental dataset isshown in Figure 3B.
Data correctionAll datasets were corrected for radioactive decay. Addition-ally, to adjust the experimental data for residual activity
due to prior injections in the same heart, a model pre-diction correction was used. The normoxic input/tissuetime-activity curve was fitted with the algorithm assessed(SA or NLSA), and the result was extrapolated in thetime interval relative to the second injection. The contri-bution of the activity from the first injection to the sec-ond was therefore calculated and subtracted. After thebackground correction, the curve relative to the secondinjection was fitted and its contribution subtracted to thethird injection.
Statistical analysisStatistical analysis was performed using GraphPad Prism®(GraphPad Software Inc, USA). All values are expressed asthe mean ± SD. Data were analysed using a one-wayANOVA with Dunnett's test to compare each group ofdatasets acquired in hypoxia with the corresponding con-trol group measured in normoxia [22].
ResultsSimulationsThe results from the Monte Carlo simulations highlighteddifferences in performance of the two assessed spectral-based algorithms, the uptake rate Patlak and the semi-quantitative index NA.Results from Monte Carlo simulations showed that
NLSA is more accurate in identifying the absence of irre-versible trapping (α0 = 0 min−1) for the dynamics and SNRsconsidered (see Table 1). For the lowest value of the trap-ping simulated (α0 = 0.006 min−1) with tri-exponential kin-etics, a similar degree of accuracy was found for SA andNLSA, whereas for bi-exponential kinetics, SA was foundto be superior. For higher values of trapping, the accuracyin estimating the presence of the trapping of the two algo-rithms was equal to 100% (see Table 1).The mean and the standard deviation of the %BIASα0
(Equation 4) reported with NLSA and SA for both bi- andtri-exponential curves and high and low SNRs are shownin Figure 4. For tri-exponential kinetics (see Figure 4A,C),NLSA displayed a lower bias than SA for the quanti-fication of small α0 values with a maximum mean ± SDpercentage bias equal to 38.30% ± 4.92% for NLSA com-pared to 176.15% ± 114.65% for SA at α0,1 = 0.006 min−1
and SNR = 60. For higher values of trapping (α0,3 =0.2 min−1 and α0,4 = 0.6 min−1), SA and NLSA were ofsimilar accuracy, with a minimum mean ± SD %BIASα0equal to 0.17% ± 0.03% for SA, compared to 1.55% ±0.34% for NLSA at α0,4 = 0.6 min−1 and SNR = 120. Thesame trend was found for bi-exponential curves (seeFigure 4B, D), where the maximum mean ± SD %BIASα0were 16.41% ± 4.71% for NLSA and 228.39% ± 117.70% forSA, at α0,1 = 0.006 min−1 and SNR = 60. The minimummean ± SD %BIASα0 values for high trapping were similarwith those found for tri-exponential kinetics. The accuracy
Figure 3 Experimental protocol. (A) Schematic representation of the experimental protocol used to acquire [18 F]-FDG and [18 F]-FMISO ex vivotime-activity curves from perfused rat hearts. After a stabilisation period, where the KHB perfusate was gassed with 95% O2-5% CO2, the firstbolus of either [18 F]-FDG or [18 F]-FMISO was injected into the perfusion line. After 5 min, hypoxia was induced by switching to a second reservoirwith KHB gassed with 95% N2-5% CO2. Further boli of each tracer were then injected into the system after 5 min and 15 min of hypoxic bufferperfusion, respectively. (B) Representative [18 F]-FDG input and tissue time-activity curves acquired ex vivo using the protocol described in (A) (y-axis unitsare counts per second).
Mariotti et al. EJNMMI Research 2013, 3:74 Page 6 of 14http://www.ejnmmires.com/content/3/1/74
in quantification of α0 for both NLSA and SA algorithmsimproved with increasing values of trapping and SNR.Additionally, the mean ± SD percentage bias reported forboth algorithms was generally lower for bi-exponentialcurves than those estimated for tri-exponential kinetics.In Figure 5A,B, the mean and the standard deviation
of the %BIAS reported for Patlak and NA are presentedfor simulated tri-exponential curves. In the absence ofnoise, Patlak returns the exact value of α0, whereas NArepresents a surrogate of the trapping component whichis in a linear relationship. The accuracy in quantify-ing the trapping component from the simulated datausing Patlak increased with the value of trapping andSNR with a maximum mean ± SD percentage bias equalto −1,662% ± 1,053.8% at SNR = 60 and −507% ± 230% atSNR = 120 and a minimum mean ± SD percentage bias
equal to −20.2% ± 3% at SNR = 60 and −12.2% ± 2.5% atSNR = 120. The maximum mean ± SD percentage biasreported for NA is 5.3% ± 10% (a.u.) at SNR = 60 and3.2% ± 10% (a.u.) at SNR = 120, while the minimummean ± SD percentage bias is equal to 0.8% ± 12.4% (a.u.)at SNR = 60 and 0.6% ± 12.4% (a.u.) at SNR = 120. Thevalues reported for the %BIAS of both Patlak and NA esti-mated from bi-exponential curves were not significantlydifferent from those calculated for tri-exponential curves(data not reported).Table 2 shows the performance of the NLSA and SA
algorithm in estimating the number of non-trapped com-ponents from simulated bi- and tri-exponential curves. Re-sults showed the percentage of datasets where the numberof components was under estimated (UE), over esti-mated (OE) or correctly estimated (CE). For tri-exponential
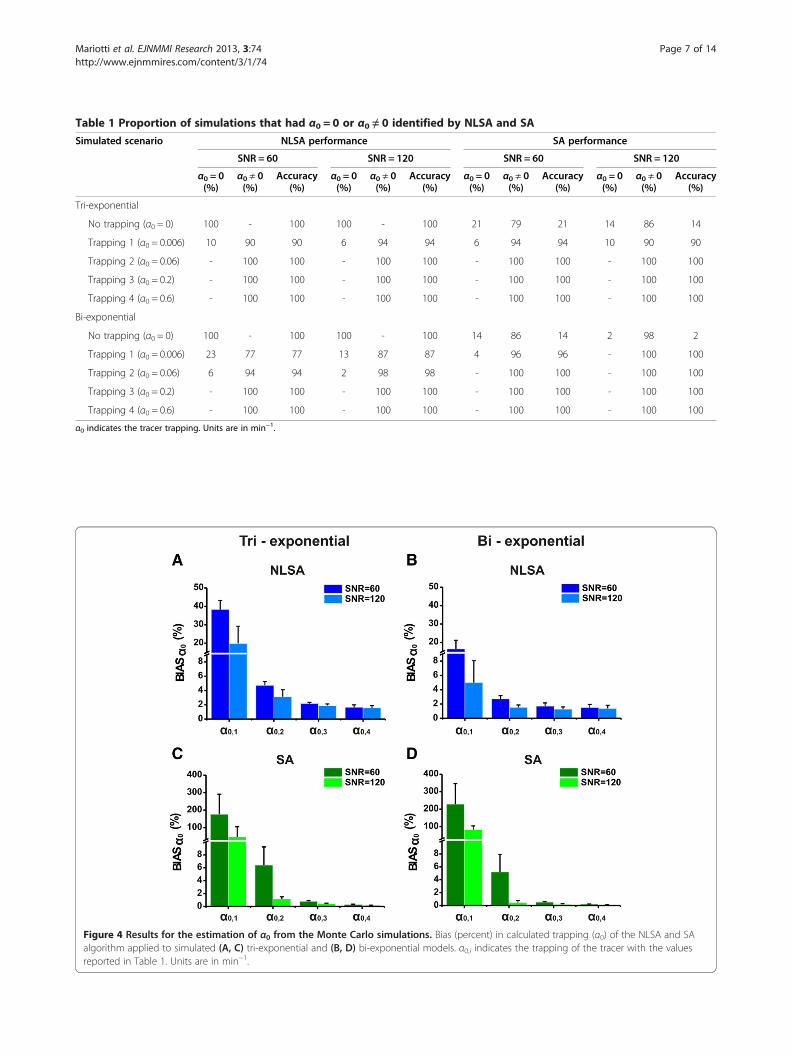
Table 1 Proportion of simulations that had α0 = 0 or α0 ≠ 0 identified by NLSA and SA
Simulated scenario NLSA performance SA performance
SNR = 60 SNR = 120 SNR = 60 SNR = 120
α0 = 0(%)
α0 ≠ 0(%)
Accuracy(%)
α0 = 0(%)
α0 ≠ 0(%)
Accuracy(%)
α0 = 0(%)
α0 ≠ 0(%)
Accuracy(%)
α0 = 0(%)
α0 ≠ 0(%)
Accuracy(%)
Tri-exponential
No trapping (α0 = 0) 100 - 100 100 - 100 21 79 21 14 86 14
Trapping 1 (α0 = 0.006) 10 90 90 6 94 94 6 94 94 10 90 90
Trapping 2 (α0 = 0.06) - 100 100 - 100 100 - 100 100 - 100 100
Trapping 3 (α0 = 0.2) - 100 100 - 100 100 - 100 100 - 100 100
Trapping 4 (α0 = 0.6) - 100 100 - 100 100 - 100 100 - 100 100
Bi-exponential
No trapping (α0 = 0) 100 - 100 100 - 100 14 86 14 2 98 2
Trapping 1 (α0 = 0.006) 23 77 77 13 87 87 4 96 96 - 100 100
Trapping 2 (α0 = 0.06) 6 94 94 2 98 98 - 100 100 - 100 100
Trapping 3 (α0 = 0.2) - 100 100 - 100 100 - 100 100 - 100 100
Trapping 4 (α0 = 0.6) - 100 100 - 100 100 - 100 100 - 100 100
α0 indicates the tracer trapping. Units are in min−1.
Figure 4 Results for the estimation of α0 from the Monte Carlo simulations. Bias (percent) in calculated trapping (α0) of the NLSA and SAalgorithm applied to simulated (A, C) tri-exponential and (B, D) bi-exponential models. α0,i indicates the trapping of the tracer with the valuesreported in Table 1. Units are in min−1.
Mariotti et al. EJNMMI Research 2013, 3:74 Page 7 of 14http://www.ejnmmires.com/content/3/1/74
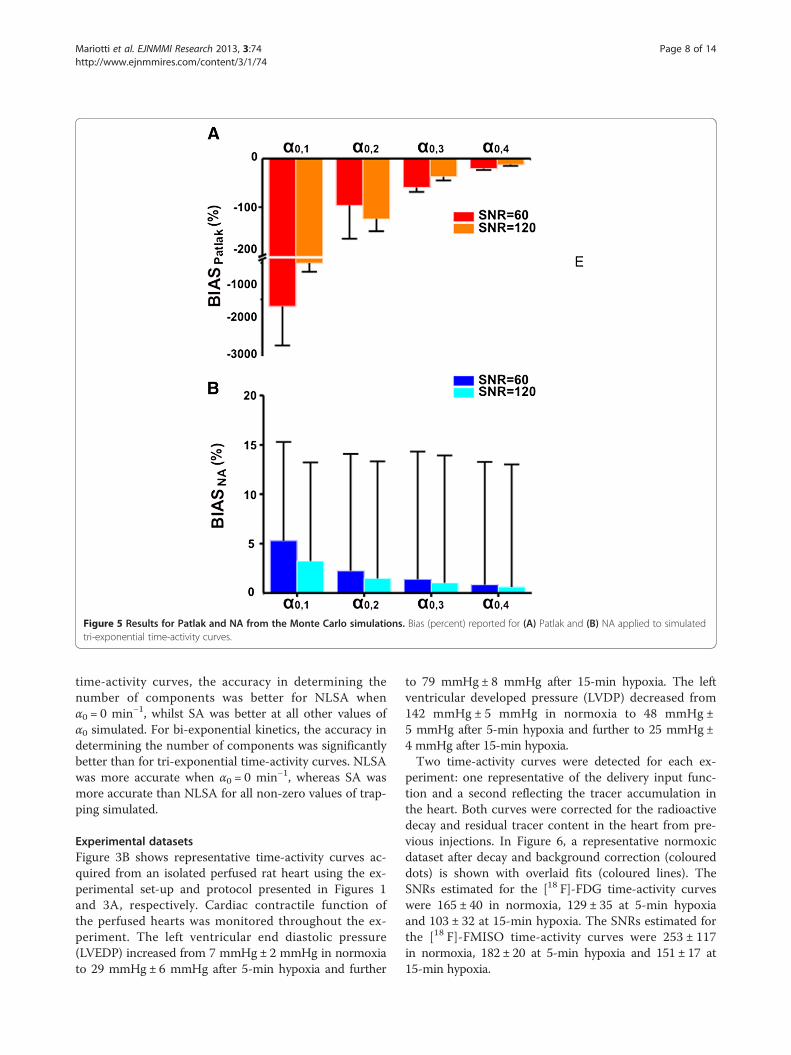
Figure 5 Results for Patlak and NA from the Monte Carlo simulations. Bias (percent) reported for (A) Patlak and (B) NA applied to simulatedtri-exponential time-activity curves.
Mariotti et al. EJNMMI Research 2013, 3:74 Page 8 of 14http://www.ejnmmires.com/content/3/1/74
time-activity curves, the accuracy in determining thenumber of components was better for NLSA whenα0 = 0 min−1, whilst SA was better at all other values ofα0 simulated. For bi-exponential kinetics, the accuracy indetermining the number of components was significantlybetter than for tri-exponential time-activity curves. NLSAwas more accurate when α0 = 0 min−1, whereas SA wasmore accurate than NLSA for all non-zero values of trap-ping simulated.
Experimental datasetsFigure 3B shows representative time-activity curves ac-quired from an isolated perfused rat heart using the ex-perimental set-up and protocol presented in Figures 1and 3A, respectively. Cardiac contractile function ofthe perfused hearts was monitored throughout the ex-periment. The left ventricular end diastolic pressure(LVEDP) increased from 7 mmHg ± 2 mmHg in normoxiato 29 mmHg ± 6 mmHg after 5-min hypoxia and further
to 79 mmHg± 8 mmHg after 15-min hypoxia. The leftventricular developed pressure (LVDP) decreased from142 mmHg ± 5 mmHg in normoxia to 48 mmHg ±5 mmHg after 5-min hypoxia and further to 25 mmHg ±4 mmHg after 15-min hypoxia.Two time-activity curves were detected for each ex-
periment: one representative of the delivery input func-tion and a second reflecting the tracer accumulation inthe heart. Both curves were corrected for the radioactivedecay and residual tracer content in the heart from pre-vious injections. In Figure 6, a representative normoxicdataset after decay and background correction (coloureddots) is shown with overlaid fits (coloured lines). TheSNRs estimated for the [18 F]-FDG time-activity curveswere 165 ± 40 in normoxia, 129 ± 35 at 5-min hypoxiaand 103 ± 32 at 15-min hypoxia. The SNRs estimated forthe [18 F]-FMISO time-activity curves were 253 ± 117in normoxia, 182 ± 20 at 5-min hypoxia and 151 ± 17 at15-min hypoxia.
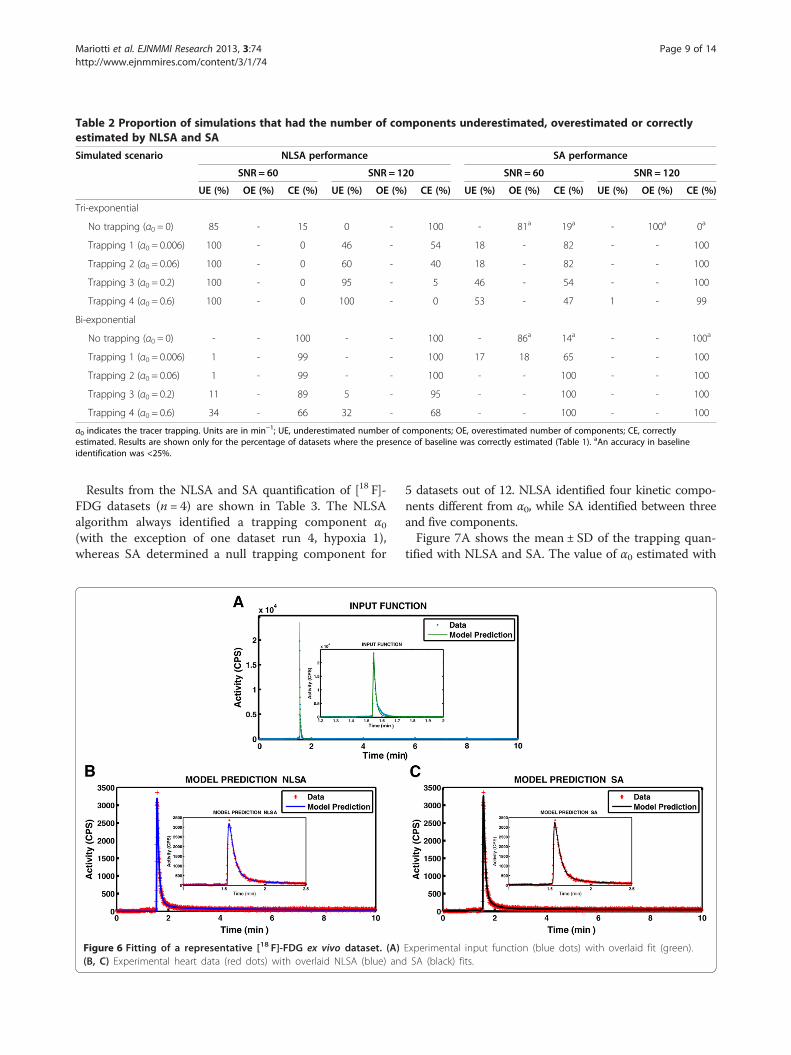
Table 2 Proportion of simulations that had the number of components underestimated, overestimated or correctlyestimated by NLSA and SA
Simulated scenario NLSA performance SA performance
SNR = 60 SNR = 120 SNR = 60 SNR = 120
UE (%) OE (%) CE (%) UE (%) OE (%) CE (%) UE (%) OE (%) CE (%) UE (%) OE (%) CE (%)
Tri-exponential
No trapping (α0 = 0) 85 - 15 0 - 100 - 81a 19a - 100a 0a
Trapping 1 (α0 = 0.006) 100 - 0 46 - 54 18 - 82 - - 100
Trapping 2 (α0 = 0.06) 100 - 0 60 - 40 18 - 82 - - 100
Trapping 3 (α0 = 0.2) 100 - 0 95 - 5 46 - 54 - - 100
Trapping 4 (α0 = 0.6) 100 - 0 100 - 0 53 - 47 1 - 99
Bi-exponential
No trapping (α0 = 0) - - 100 - - 100 - 86a 14a - - 100a
Trapping 1 (α0 = 0.006) 1 - 99 - - 100 17 18 65 - - 100
Trapping 2 (α0 = 0.06) 1 - 99 - - 100 - - 100 - - 100
Trapping 3 (α0 = 0.2) 11 - 89 5 - 95 - - 100 - - 100
Trapping 4 (α0 = 0.6) 34 - 66 32 - 68 - - 100 - - 100
α0 indicates the tracer trapping. Units are in min−1; UE, underestimated number of components; OE, overestimated number of components; CE, correctlyestimated. Results are shown only for the percentage of datasets where the presence of baseline was correctly estimated (Table 1). aAn accuracy in baselineidentification was <25%.
Mariotti et al. EJNMMI Research 2013, 3:74 Page 9 of 14http://www.ejnmmires.com/content/3/1/74
Results from the NLSA and SA quantification of [18 F]-FDG datasets (n = 4) are shown in Table 3. The NLSAalgorithm always identified a trapping component α0(with the exception of one dataset run 4, hypoxia 1),whereas SA determined a null trapping component for
Figure 6 Fitting of a representative [18 F]-FDG ex vivo dataset. (A)(B, C) Experimental heart data (red dots) with overlaid NLSA (blue) and
5 datasets out of 12. NLSA identified four kinetic compo-nents different from α0, while SA identified between threeand five components.Figure 7A shows the mean ± SD of the trapping quan-
tified with NLSA and SA. The value of α0 estimated with
Experimental input function (blue dots) with overlaid fit (green).SA (black) fits.
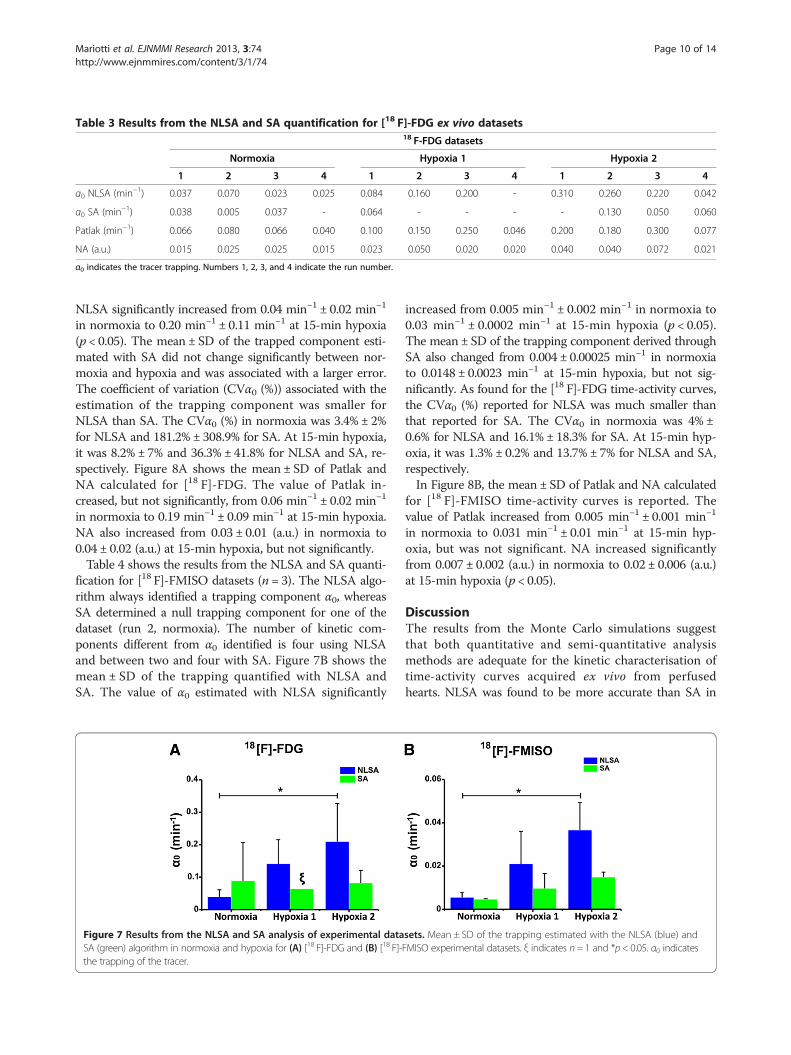
Table 3 Results from the NLSA and SA quantification for [18 F]-FDG ex vivo datasets18 F-FDG datasets
Normoxia Hypoxia 1 Hypoxia 2
1 2 3 4 1 2 3 4 1 2 3 4
α0 NLSA (min−1) 0.037 0.070 0.023 0.025 0.084 0.160 0.200 - 0.310 0.260 0.220 0.042
α0 SA (min−1) 0.038 0.005 0.037 - 0.064 - - - - 0.130 0.050 0.060
Patlak (min−1) 0.066 0.080 0.066 0.040 0.100 0.150 0.250 0.046 0.200 0.180 0.300 0.077
NA (a.u.) 0.015 0.025 0.025 0.015 0.023 0.050 0.020 0.020 0.040 0.040 0.072 0.021
α0 indicates the tracer trapping. Numbers 1, 2, 3, and 4 indicate the run number.
Mariotti et al. EJNMMI Research 2013, 3:74 Page 10 of 14http://www.ejnmmires.com/content/3/1/74
NLSA significantly increased from 0.04 min−1 ± 0.02 min−1
in normoxia to 0.20 min−1 ± 0.11 min−1 at 15-min hypoxia(p < 0.05). The mean ± SD of the trapped component esti-mated with SA did not change significantly between nor-moxia and hypoxia and was associated with a larger error.The coefficient of variation (CVα0 (%)) associated with theestimation of the trapping component was smaller forNLSA than SA. The CVα0 (%) in normoxia was 3.4% ± 2%for NLSA and 181.2% ± 308.9% for SA. At 15-min hypoxia,it was 8.2% ± 7% and 36.3% ± 41.8% for NLSA and SA, re-spectively. Figure 8A shows the mean ± SD of Patlak andNA calculated for [18 F]-FDG. The value of Patlak in-creased, but not significantly, from 0.06 min−1 ± 0.02 min−1
in normoxia to 0.19 min−1 ± 0.09 min−1 at 15-min hypoxia.NA also increased from 0.03 ± 0.01 (a.u.) in normoxia to0.04 ± 0.02 (a.u.) at 15-min hypoxia, but not significantly.Table 4 shows the results from the NLSA and SA quanti-
fication for [18 F]-FMISO datasets (n = 3). The NLSA algo-rithm always identified a trapping component α0, whereasSA determined a null trapping component for one of thedataset (run 2, normoxia). The number of kinetic com-ponents different from α0 identified is four using NLSAand between two and four with SA. Figure 7B shows themean ± SD of the trapping quantified with NLSA andSA. The value of α0 estimated with NLSA significantly
Figure 7 Results from the NLSA and SA analysis of experimental dataSA (green) algorithm in normoxia and hypoxia for (A) [18 F]-FDG and (B) [18 F]-the trapping of the tracer.
increased from 0.005 min−1 ± 0.002 min−1 in normoxia to0.03 min−1 ± 0.0002 min−1 at 15-min hypoxia (p < 0.05).The mean ± SD of the trapping component derived throughSA also changed from 0.004 ± 0.00025 min−1 in normoxiato 0.0148 ± 0.0023 min−1 at 15-min hypoxia, but not sig-nificantly. As found for the [18 F]-FDG time-activity curves,the CVα0 (%) reported for NLSA was much smaller thanthat reported for SA. The CVα0 in normoxia was 4% ±0.6% for NLSA and 16.1% ± 18.3% for SA. At 15-min hyp-oxia, it was 1.3% ± 0.2% and 13.7% ± 7% for NLSA and SA,respectively.In Figure 8B, the mean ± SD of Patlak and NA calculated
for [18 F]-FMISO time-activity curves is reported. Thevalue of Patlak increased from 0.005 min−1 ± 0.001 min−1
in normoxia to 0.031 min−1 ± 0.01 min−1 at 15-min hyp-oxia, but was not significant. NA increased significantlyfrom 0.007 ± 0.002 (a.u.) in normoxia to 0.02 ± 0.006 (a.u.)at 15-min hypoxia (p < 0.05).
DiscussionThe results from the Monte Carlo simulations suggestthat both quantitative and semi-quantitative analysismethods are adequate for the kinetic characterisation oftime-activity curves acquired ex vivo from perfusedhearts. NLSA was found to be more accurate than SA in
sets. Mean ± SD of the trapping estimated with the NLSA (blue) andFMISO experimental datasets. ξ indicates n= 1 and *p< 0.05. α0 indicates
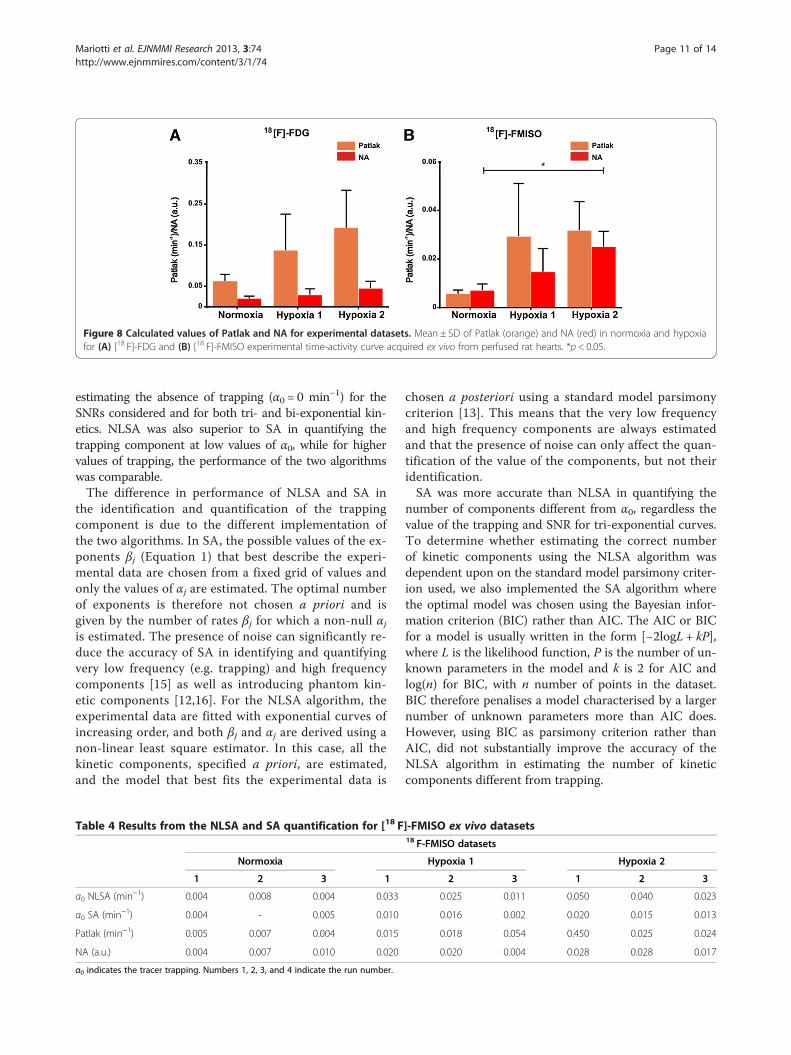
Figure 8 Calculated values of Patlak and NA for experimental datasets. Mean ± SD of Patlak (orange) and NA (red) in normoxia and hypoxiafor (A) [18 F]-FDG and (B) [18 F]-FMISO experimental time-activity curve acquired ex vivo from perfused rat hearts. *p < 0.05.
Mariotti et al. EJNMMI Research 2013, 3:74 Page 11 of 14http://www.ejnmmires.com/content/3/1/74
estimating the absence of trapping (α0 = 0 min−1) for theSNRs considered and for both tri- and bi-exponential kin-etics. NLSA was also superior to SA in quantifying thetrapping component at low values of α0, while for highervalues of trapping, the performance of the two algorithmswas comparable.The difference in performance of NLSA and SA in
the identification and quantification of the trappingcomponent is due to the different implementation ofthe two algorithms. In SA, the possible values of the ex-ponents βj (Equation 1) that best describe the experi-mental data are chosen from a fixed grid of values andonly the values of αj are estimated. The optimal numberof exponents is therefore not chosen a priori and isgiven by the number of rates βj for which a non-null αjis estimated. The presence of noise can significantly re-duce the accuracy of SA in identifying and quantifyingvery low frequency (e.g. trapping) and high frequencycomponents [15] as well as introducing phantom kin-etic components [12,16]. For the NLSA algorithm, theexperimental data are fitted with exponential curves ofincreasing order, and both βj and αj are derived using anon-linear least square estimator. In this case, all thekinetic components, specified a priori, are estimated,and the model that best fits the experimental data is
Table 4 Results from the NLSA and SA quantification for [18 F
Normoxia
1 2 3 1
α0 NLSA (min−1) 0.004 0.008 0.004 0.033
α0 SA (min−1) 0.004 - 0.005 0.010
Patlak (min−1) 0.005 0.007 0.004 0.015
NA (a.u.) 0.004 0.007 0.010 0.020
α0 indicates the tracer trapping. Numbers 1, 2, 3, and 4 indicate the run number.
chosen a posteriori using a standard model parsimonycriterion [13]. This means that the very low frequencyand high frequency components are always estimatedand that the presence of noise can only affect the quan-tification of the value of the components, but not theiridentification.SA was more accurate than NLSA in quantifying the
number of components different from α0, regardless thevalue of the trapping and SNR for tri-exponential curves.To determine whether estimating the correct numberof kinetic components using the NLSA algorithm wasdependent upon on the standard model parsimony criter-ion used, we also implemented the SA algorithm wherethe optimal model was chosen using the Bayesian infor-mation criterion (BIC) rather than AIC. The AIC or BICfor a model is usually written in the form [−2logL + kP],where L is the likelihood function, P is the number of un-known parameters in the model and k is 2 for AIC andlog(n) for BIC, with n number of points in the dataset.BIC therefore penalises a model characterised by a largernumber of unknown parameters more than AIC does.However, using BIC as parsimony criterion rather thanAIC, did not substantially improve the accuracy of theNLSA algorithm in estimating the number of kineticcomponents different from trapping.
]-FMISO ex vivo datasets18 F-FMISO datasets
Hypoxia 1 Hypoxia 2
2 3 1 2 3
0.025 0.011 0.050 0.040 0.023
0.016 0.002 0.020 0.015 0.013
0.018 0.054 0.450 0.025 0.024
0.020 0.004 0.028 0.028 0.017
Mariotti et al. EJNMMI Research 2013, 3:74 Page 12 of 14http://www.ejnmmires.com/content/3/1/74
The accuracy of both algorithms in determining thecorrect number of exponentials was significantly betterfor bi-exponential dynamics, with accuracy close to 100%for all cases studied. Two or more kinetic componentswith close values are likely to be seen by SA and NLSA asa unique component. The greater the spread of kineticvalues, the easier it is for the algorithms to discern the ex-ponentials as separate components. In our simulations,the values of the kinetic components βj were more spacedin the bi-exponential than tri-exponential curves, meaningthat it was easier for SA and NLSA to discern the twocomponents as distinct βs.The values estimated for Patlak and NA were found to
be linearly proportional to the simulated values of trap-ping, but like spectral analysis, their estimation was af-fected by the presence of the noise. The bias (percent)associated with the estimation of Patlak was always higherthan that reported for the semi-quantitative index NA, forall SNRs and trapping considered. Patlak is derived by cal-culating the ratio between tissue retention of the tracerand the delivery input function which decays rapidly tozero. Both curves exhibit noise, and therefore, dividing twonoisy quantities amplifies the noise and reduces the accur-acy of the method. The mean of the bias (percent) reportedfor NA becomes smaller with increasing values of trappingand SNRs, but the standard deviation does not change. Inour Monte Carlo simulations for a given SNR, we addedthe same amount of noise to the time-activity curves withdifferent values of the trapping component. The standarddeviation of the bias is dependent on the noise variance ofthe time-activity curve fitted, and therefore, it does notchange with increasing values of trapping for a given SNR.For experimental datasets, the values reported for
CVα0 (%) suggest that NLSA is more accurate than SA forthe kinetic characterisation on ex vivo time-activity curves.NLSA identified a trapping component for the [18 F]-FDGdatasets 11 times out of 12 and consistently indicated thepresence of trapping for the [18 F]-FMISO datasets. Add-itionally, the trapping component quantified using NLSAsignificantly increases with the level of hypoxia for both[18 F]-FDG and [18 F]-FMISO, in agreement with previ-ous studies [23]. In contrast, the Patlak values estimatedfrom the experimental time-activity curves of [18 F]-FDGand [18 F]-FMISO (see Figure 8) are characterised by alarge variability due to the noise exhibited by both tissueand input curves. An additional source of variability is as-sociated with the nature of the ex vivo experiment wherethere is no recirculation. Bolus injection of radiotracerleads to a plasma activity that decays rapidly to zero, lead-ing to an input function Cin(t) mainly characterised by lowSNR at later times.Ex vivo time-activity curves have to be corrected for
the contribution of radioactivity from previous injectionsto the residual tissue background signal in successive
injections. For both spectral-based algorithms, we cor-rected for this residual activity by fitting the previousinjection and then subtracting the contribution of thefirst injection to the second, and the contribution of thefirst and second to the third. This approach assumes that(1) the tracer studied is irreversibly trapped or, if revers-ible, has decayed entirely before the subsequent injection;(2) the concentration of exchangeable (reversible) tracerin the tissue is negligible before the next injection; and(3) the trapped component in a previous injection re-mains trapped when the condition of the heart is chan-ged. With the tracers (irreversible) used in this study andthe timing of their injections relative to their washoutkinetics, the tracer activity in the heart contributing toeach subsequent time-activity curve was very small andwas mainly represented by trapped tracer with the activ-ity of the tracer in the equilibrating compartments almostzero (<3% of the total measured signal). These conditionsare necessary to guarantee that the trapping rates quanti-fied after the first injection are associated with changes intissue metabolism rather than the presence of residualactivity in the tissue.Monte Carlo simulations showed that both NLSA and
SA are not able to reliably estimate the number of non-trapping components characterising the tracer kineticsespecially when the number of rates is high. As a result,the kinetic analysis of time-activity acquired ex vivo fromperfused hearts gives reliable information regarding thetrapping component of the tracer studied, but no informa-tion of its transport/diffusion through the capillary mem-brane or of its transport from the intracellular space intothe cells can be gained.The Langendorff perfused heart has been the model of
choice of cardiologist for years and has greatly increasedour understanding of cardiac physiology. Nevertheless,this experimental model has a number of limitations. Exvivo tissue time-activity curves are, for example, a het-erogeneous measure of the tracer kinetics in the wholeheart, as opposed to data acquired from a more spatiallyhomogeneous voxel in imaging studies. It is expectedthat the number of kinetic components returned by SAapproaches is higher than found within a given regionof tissue [13] due to heterogeneity of tracer kinetics.While in vivo the coronary flow through the rat heart is3 ml/min, in the buffer-perfused Langendorff heart, thisincreases to approximately 14 ml/min at the same perfu-sion pressure, due to the lower oxygen-carrying capacityof Krebs buffer. Because the flow rate defines tracer deliv-ery to the tissue, this might complicate interpretation ofsemi-quantitative results where the bolus input is notaccounted for. However, semi-quantitative approachesare simple to apply, and whilst less informative and moresensitive to experimental conditions, the use of NA offersa useful surrogate descriptor of tracer retention when
Mariotti et al. EJNMMI Research 2013, 3:74 Page 13 of 14http://www.ejnmmires.com/content/3/1/74
datasets are acquired under an identical experimentalset-up and protocol.When investigating the pharmacokinetics of metabolic
tracers like [18 F]-FDG, buffer substrate composition isalso a critical consideration. In the present study, heartswere perfused with glucose as a sole energy substrate. Thelack of fatty acids in the perfusion medium and their influ-ence on glucose transport and or downstream glycolysismean that [18 F]-FDG uptake may be different than thatseen in vivo. More elaborate perfusion media and the useof membrane oxygenators would be required to study [18
F]-FDG metabolism under more physiologically appropri-ate conditions.
ConclusionsAccurate quantification of radiotracer kinetics in theLangendorff perfused heart is highly desirable for the char-acterisation and development of novel radiotracers, andthe exploitation of existing tracers to probe biological pro-cesses in greater detail. In this work, we compared the per-formance of three quantitative (SA, NLSA and Patlak) andone semi-quantitative (NA) analysis methods for the kin-etic characterisation of ex vivo perfused heart time-activitycurves. We tested the SA and NLSA algorithms in termsof the accuracy in identifying and quantifying the trappingcomponent and in estimating the kinetics of non-trappingcomponents. Results from both Monte Carlo simulationsand experimental data suggest that NLSA is the algorithmof choice when the aim of the kinetic analysis is to assesswhether the radiotracer injected in the perfused heart isirreversibly trapped or not. Once the presence of a fullytrapped component has been identified, it can be quanti-fied using either NLSA or the semi-quantitative index NA.Neither analysis methods were adequate for estimating thenumber of non-trapping components characterising thekinetics of ex vivo time-activity curves probably due tothe heterogeneity of the experimental preparation.
Competing interestsThe authors declare that they have no competing interests.
Authors’ contributionsEM implemented the analysis methods, analysed the data, participated inthe design of the study and conceived and drafted the manuscript. MVparticipated in the implementation of the analysis methods and in theanalysis data, as well as in the manuscript writing. JTD contributed to thedesign of the study and the interpretation of the data, as well as in thereview of the manuscript. RAM and RS designed and carried out theperfusion experiments and participated in the critical review of themanuscript. PJB was involved in the interpretation of the data and in themanuscript review. TRE designed the study and was involved in the dataanalysis as well as in the review of the manuscript. All authors read andapproved the final manuscript.
AcknowledgementsThe authors acknowledge financial support from the Department of Healthvia the National Institute for Health Research (NIHR) comprehensiveBiomedical Research Centre award to Guy's & St Thomas' NHS FoundationTrust in partnership with King's College London and King's College Hospital
NHS Foundation Trust. The work was also funded by an Engineering andPhysical Sciences Research Council Ph.D. studentship (EM) and a British HeartFoundation project grant PG/10/20/28211 and award RE/08/003, and theCentre of Excellence in Medical Engineering Centre funded by the WellcomeTrust and EPSRC under grant number WT088641/Z/09/Z, and the King'sCollege London and UCL Comprehensive Cancer Imaging Centre. The viewsexpressed are those of the authors and not necessarily those of the NHS, theNIHR or the Department of Health.
Author details1Division of Imaging Sciences and Biomedical Engineering, St. Thomas'Hospital, King's College London, London SE1 7EH, UK. 2Institute of Psychiatry,King's College London, London SE5 8AF, UK. 3CRUK and EPSRC CancerImaging Centre, Royal Marsden NHS Trust and The Institute of CancerResearch, Sutton, Surrey SM2 5NG, UK.
Received: 16 September 2013 Accepted: 4 November 2013Published: 14 November 2013
References1. Fujibayashi Y, Taniuchi H, Yonekura Y, Ohtani H, Konishi J, Yokoyama A:
Copper-62-ATSM: a new hypoxia imaging agent with high membranepermeability and low redox potential. J Nucl Med 1997, 38:1155–1160.
2. Doenst T, Taegtmeyer H: Profound underestimation of glucose uptake by[18 F]2-deoxy-2-fluoroglucose in reperfused rat heart muscle. Circulation1998, 97:2454–2462.
3. Carvalho PA, Chiu ML, Kronauge JF, Kawamura M, Jones AG, Holman BL,Piwnica-Worms D: Subcellular distribution and analysis of technetium-99 m-MIBI in isolated perfused rat hearts. J Nucl Med 1992, 33:1516–1522.
4. Sutherland FJ, Hearse DJ: The isolated blood and perfusion fluid perfusedheart. Pharmacol Res 2000, 41:613–627.
5. Weiss K, Mariotti E, Hill DK, Orton MR, Dunn JT, Medina RA, Southworth R,Kozerke S, Eykyn TR: Developing hyperpolarized C-13 spectroscopy andimaging for metabolic studies in the isolated perfused rat heart. Appl MagnReson 2012, 43:275–288.
6. Southworth R, Garlick PB: Dobutamine responsiveness, PET mismatch, andlack of necrosis in low-flow ischemia: is this hibernation in the isolatedrat heart? Am J Physiol Heart Circ Physiol 2003, 285:H316–H324.
7. Southworth R, Shattock MJ, Hearse DJ, Kelly FJ: Developmental differencesin superoxide production in isolated guinea-pig hearts during reperfusion.J Mol Cell Cardiol 1998, 30:1391–1399.
8. Dhanjal TS, Medina RA, Leem J, Clark JE, Southworth R, Curtis MJ: Trappedplatelets activated in ischemia initiate ventricular fibrillation. Circ ArrhythmElectrophysiol 2013, 6:995–1001.
9. Schuster A, Grunwald I, Chiribiri A, Southworth R, Ishida M, Hay G, Neumann N,Morton G, Perera D, Schaeffter T, Nagel E: An isolated perfused pig heartmodel for the development, validation and translation of novelcardiovascular magnetic resonance techniques. J Cardiovasc MagnReson 2010, 12:53.
10. Ng CK, Sinusas AJ, Zaret BL, Soufer R: Kinetic analysis of technetium-99m-labeled nitroimidazole (BMS-181321) as a tracer of myocardial hypoxia.Circulation 1995, 92:1261–1268.
11. Southworth R, Dearling JL, Medina RA, Flynn AA, Pedley RB, Garlick PB:Dissociation of glucose tracer uptake and glucose transporterdistribution in the regionally ischaemic isolated rat heart: applicationof a new autoradiographic technique. Eur J Nucl Med Mol Imaging2002, 29:1334–1341.
12. Cunningham VJ, Jones T: Spectral analysis of dynamic PET studies. J CerebBlood Flow Metab 1993, 13:15–23.
13. Bertoldo A, Vicini P, Sambuceti G, Lammertsma AA, Parodi O, Cobelli C:Evaluation of compartmental and spectral analysis models of [18 F]FDGkinetics for heart and brain studies with PET. IEEE Trans Biomed Eng 1998,45:1429–1448.
14. Patlak CS, Blasberg RG: Graphical evaluation of blood-to-brain transferconstants from multiple-time uptake data. Generalizations. J Cereb BloodFlow Metab 1985, 5:584–590.
15. Veronese M, Bertoldo A, Bishu S, Unterman A, Tomasi G, Smith CB, Schmidt KC:A spectral analysis approach for determination of regional rates of cerebralprotein synthesis with the L-[1-(11)C]leucine PET method. J Cereb Blood FlowMetab 2010, 30:1460–1476.
Mariotti et al. EJNMMI Research 2013, 3:74 Page 14 of 14http://www.ejnmmires.com/content/3/1/74
16. Turkheimer F, Moresco RM, Lucignani G, Sokoloff L, Fazio F, Schmidt K: Theuse of spectral analysis to determine regional cerebral glucose utilizationwith positron emission tomography and [18 F]fluorodeoxyglucose: theory,implementation, and optimization procedures. J Cereb Blood Flow Metab1994, 14:406–422.
17. Lipkin EW, Teller DC, de Haen C: Kinetics of insulin binding to rat whitefat cells at 15 degrees C. J Biol Chem 1986, 261:1702–1711.
18. Wang W, Georgi JC, Nehmeh SA, Narayanan M, Paulus T, Bal M, O'Donoghue J,Zanzonico PB, Schmidtlein CR, Lee NY, Humm JL: Evaluation of acompartmental model for estimating tumor hypoxia via FMISOdynamic PET imaging. Phys Med Biol 2009, 54:3083–3099.
19. Kubota K, Matsuzawa T, Ito M, Ito K, Fujiwara T, Abe Y, Yoshioka S, Fukuda H,Hatazawa J, Iwata R, et al: Lung tumor imaging by positron emissiontomography using C-11 L-methionine. J Nucl Med 1985, 26:37–42.
20. Santarelli MF, Positano V, Giovannetti G, Frijia F, Menichetti L,Ardenkjaer-Larsen J-H, De Marchi D, Lionetti V, Aquaro G, Lombardi M,Landini L: How the signal-to-noise ratio influences hyperpolarized 13Cdynamic MRS data fitting and parameter estimation. NMR Biomed 2012,25:925–934.
21. Oh SJ, Chi DY, Mosdzianowski C, Kim JY, Gil HS, Kang SH, Ryu JS, Moon DH:Fully automated synthesis of [18 F]fluoromisonidazole using aconventional [18 F]FDG module. Nucl Med Biol 2005, 32:899–905.
22. Dunnett CW: A multiple comparison procedure for comparing severaltreatments with a control. J Am Stat Assoc 1955, 50:1096–1121.
23. Handley MG, Medina RA, Nagel E, Blower PJ, Southworth R: PET imaging ofcardiac hypoxia: opportunities and challenges. J Mol Cell Cardiol 2011,51:640–650.
doi:10.1186/2191-219X-3-74Cite this article as: Mariotti et al.: Assessing radiotracer kinetics in theLangendorff perfused heart. EJNMMI Research 2013 3:74.
Submit your manuscript to a journal and benefi t from:
7 Convenient online submission
7 Rigorous peer review
7 Immediate publication on acceptance
7 Open access: articles freely available online
7 High visibility within the fi eld
7 Retaining the copyright to your article
Submit your next manuscript at 7 springeropen.com

![DYNAMIC AND QUANTITATIVE ASSESSMENT OF MYOCARDIAL ... · the myocardial stiffness in Langendorff perfused rat heart. The Langendorff method [6] consists of perfusing an excised heart](https://img.pdfslide.net/doc/110x75/5e1f44f6cec12a65f0739d70/dynamic-and-quantitative-assessment-of-myocardial-the-myocardial-stiffness-in.jpg)

![[XLS] · Web viewApproaches used in the Mackenzie laboratory include theoretical modeling of transporter function, structure/function relationships, electrophysiology, radiotracer](https://img.pdfslide.net/doc/110x75/5b0875c87f8b9a992a8c4f95/xls-viewapproaches-used-in-the-mackenzie-laboratory-include-theoretical-modeling.jpg)