Embed Size (px)
Citation preview
Global J. Environ. Sci. Manage. 6(1): 85-96, Winter 2020
*Corresponding Author:Email: [email protected]: +601 9397 3408Fax: +603 8946 7463
Global Journal of Environmental Science and Management (GJESM)
Homepage: https://www.gjesm.net/
ORIGINAL RESEARCH PAPER
Variations of water quality in the monitoring network of a tropical river
M. Camara, N.R.B. Jamil, F.B. Abdullah
1Faculty of Environmental Studies, Universiti Putra Malaysia, 43400 Serdang, Selangor, Malaysia 2Department of Biological and Agricultural Engineering, Faculty of Engineering, Universiti Putra Malaysia, 43400, Serdang, Selangor DE, Malaysia
Rapid development and population growth have resulted in an ever-increasing level of water pollution in Malaysia. Therefore, this study was conducted to assess water quality of Selangor River in Malaysia. The data collected under the river water quality monitoring program by the Department of environment from 2005 to 2015 were used for statistical analyses. The local water quality indices were computed and a trend detection technique and cluster analysis were applied, respectively, to detect changes and spatial disparity in water quality trends. The results showed that the river water is of good quality at all stations, with the exception of 1SR01 and 1SR09 located upstream, which recorded moderate water quality indices of 68 and 71, respectively. The results of trend analysis showed downward trends in dissolved oxygen, biochemical oxygen demand and ammonia nitrogen, for most water quality stations, as well as increasing trends in chemical oxygen, suspended solids, pH and temperature for most stations. In addition, the results of cluster and time series analyses showed that the trend variation in dissolved oxygen, pH, and temperature between the station clusters is relatively low as compared to chemical oxygen demand, biochemical oxygen demand, suspended solids, and ammonia nitrogen. With the peak concentration of 13 mg/L for dissolved oxygen observed in cluster 2 in 2014, and the highest decrease in suspended solids (8 mg/L) observed in cluster 1 for 2015. This finding demonstrates that these combined statistical analyses can be a useful approach for assessing water quality for adequate management of water resources.
©2020 GJESM. All rights reserved.
ARTICLE INFO
Article History:Received 10 July 2019Revised 07 October 2019Accepted 08 November 2019
Keywords:Monitoring networkSelangor RiverStatistical analysisTrend detectionWater quality
ABSTRAC T
DOI: 10.22034/gjesm.2020.01.07
NUMBER OF REFERENCES
34NUMBER OF FIGURES
4NUMBER OF TABLES
5
Note: Discussion period for this manuscript open until April 1, 2020 on GJESM website at the “Show Article.
86
M. Camara et al.
INTRODUCTION
Large watersheds pose many challenges for monitoring and management of water quality, particularly in multinational basins where legislative frameworks and priorities for water resources management may differ (Bloesch et al., 2012). But whether in a local or global context, to contribute to a river basin management, it is necessary to align the monitoring activities with the following (Chapman et al., 2016): 1) identify trends over time; 2) get a full understanding of the activities impacts and their interactions in the watershed; 3) identify the impacts of downstream; and 4) most appropriate direct corrective measures. In addition, the objective of monitoring water quality is to acquire measurable information on the chemical, physical, and biological parameters of water using statistical sampling methods (Sanders et al., 1983). However, the purpose of monitoring is usually set by laws or other regulatory actions (guidelines, water quality standards, action plans) and aims to assess the state of the environment and detect trends (EEA, 2016). Many approaches have been used to assess water quality and the similarity influence between monitoring stations and the provided data. The widely used methods and techniques for maximizing information content of water quality monitoring network include multivariate statistics such as cluster analysis (CA), discriminant analysis (DA), principal component analysis (PCA), and factor analysis (FA) (Tanos et al., 2015; Ling et al., 2018; Kamal and Ramjee, 2019). These methods are more consistent and specific with regards to meeting the expectations of monitoring objectives. CA is a multivariate grouping method generally applied in grouping related observations into clusters, where within-cluster variance decreases and between-cluster variance increases (CCME, 2015; Kükrer and Mutlu, 2019). CA has been also applied to enhance sampling approaches through redesigning monitoring sites of water quality and reducing the number of sampling locations. Some researchers have employed CA to group sampling stations, suggesting that only representative stations from each group to be considered for a quick and practical assessment of water quality across the network (Juahir et al., 2011; Wang et al., 2014). They further concluded that the underlined clustering information could be considered in reducing the number of sampling points without significant loss of information. Moreover,
detection of pollution trends is an important step in assessing water quality of a given water body (Xile and Changhe 2012). Non-parametric Mann-Kendall (MK) test is a good method for identifying trends in dataset and is widely used in water quality change analysis (Antonopoulos et al., 2001; Xile and Changhe, 2012). As an advantage in this test, the data need not to follow the normality distribution condition. Another advantage is the low sensitivity of the test to discontinuities due to heterogeneous time series (Drápela and Drápelová, 2011; Wan and Li, 2018). However, the reliable assessment of water conditions via water quality trend analysis is essential for policy makers to understand, interpret and utilize the generated information to support their management strategies to protect aquatic resources (Damour et al., 2016; Khalil and Ouarda, 2009). In Malaysia, Selangor River is known to be the largest water source for the States of Kuala Lumpur and Selangor. The river will be confronted with water quality status problems to be used for multiple purposes and to provide its aquatic resources on a continuous basis (Fulazzaky et al., 2010). The main objective of this study is to assess the status of water quality, the presence of variations and trends from long-term monitored data on the water quality of Selangor River, in order to improve the water resources planning and management within the basin. This will eventually serve as a baseline for future water quality forecasting in the basin. This study has been carried out in Selangor River basin, Selangor State, Malaysia, in 2019.
MATERIALS AND METHODS
Study areaThe study area is located in the State of Selangor
in Malaysia, Selangor River basin has a catchment area approximately 2200 km2, almost a quarter of the entire area of Selangor State (Chowdhury et al., 2018). The basin is found in the north of the city of Kuala Lumpur, bounded to the south by the Klang basin and to the north by the Bernam basin. Selangor River flows southwest and travels a distance of nearly 110 km before flowing into the Channel of Malacca. The river is the largest water source for the States of Kuala Lumpur and Selangor. Sungai Batang Kali, Sungai Buloh, Sungai Serendah, Sungai Kerling, Sungai Kundang, Sungai Sembah and Sungai Rawang are among the main tributaries. This basin provides about 60% of usable water in the capital region and
87
Global J. Environ. Sci. Manage. 6(1): 85-96, Winter 2020
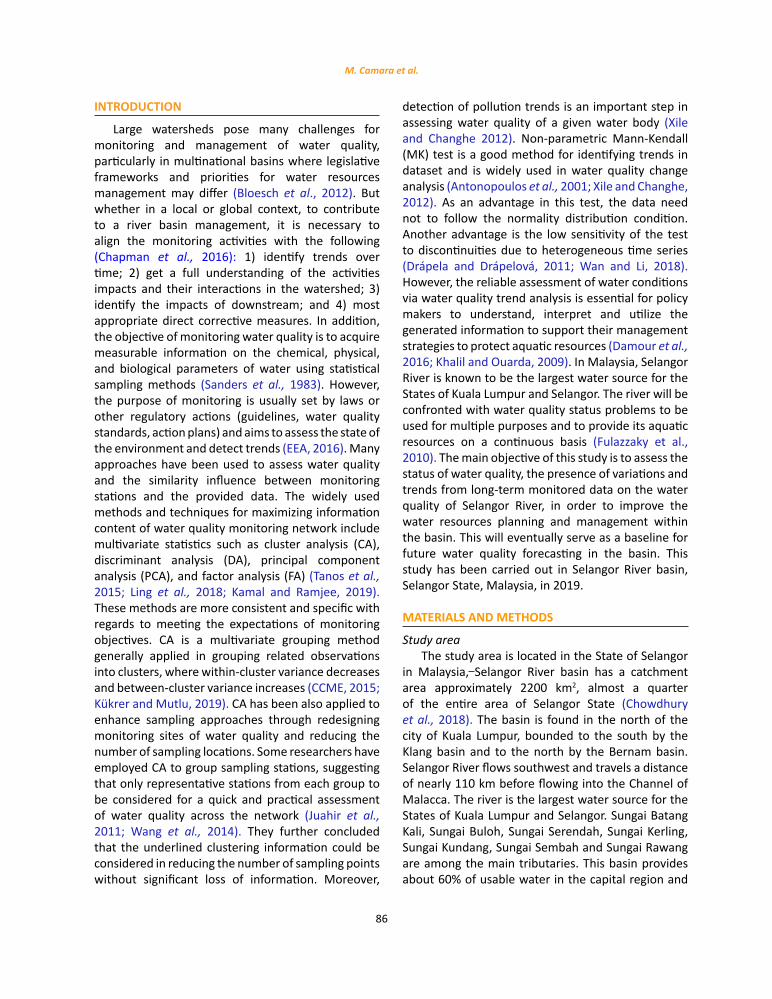
the rest comes from other sources such as the Langat and Klang River basins in the southern and central parts of the region, respectively (Sakai et al., 2017). The river basin is nearly 70 km long and 30 km large, and covers an area which is approximately 28% of the State of Selangor, where about 406,000 people lived in 2006 (Fulazzaky et al., 2010). The map of Selangor River basin is shown in Fig. 1.
The water quality parametersThe data used in this study were collected from
nine monitoring stations under the river water quality monitoring program by the Department of Environment (DOE) in Malaysia, from 2005 to 2015. Since 2000, the DOE regularly (every two months) monitors the water quality of these stations across the Selangor River system. This dataset included 603 data points resulting from 7 parameters on 66 samples. It includes the values of a set of water pollution indicators for monitoring sites that involve the lower, middle and upper streams of the basin. The measurement parameters which include dissolved oxygen (DO), chemical oxygen demand (COD), biochemical oxygen demand (BOD), suspended solids (SS), ammonia nitrogen (NH3-N), and pH were used in the analyses. The descriptive analysis of these parameters is presented in Table 3. All statistical computations were done using XLSTAT and MS Office 2013 for water quality index
(WQI) computing, non-parametric test of trend, and hierarchical agglomerative clustering (HAC) analysis.
The local water quality indexThe WQI mainly used in Malaysia was emanated
from a judgement polling procedure of a board of experts consulted on the choice for parameters and the weighting of every single parameter (Gazzaz et al., 2012). The six parameters selected for the WQI are DO, COD, BOD, SS, pH, and NH3-N. The computations are done on the sub-indices rather than the parameters themselves. From the computed WQI, a river can be categorized into a number of classes, each indicating the beneficial uses to which that river can be put. This classification is based allowable limits of designated pollution parameters. For this reason, the DOE has defined the indicative values for the WQI and the water quality variables (WQVs) which determine each class of water quality (DOE, 2007). The DEO-WQI was used in this study to determine the water quality status of Selangor River. Details on the DOE-WQI calculation procedures are provided in Tables 1 and 2.
After the sub-indices are computed, WQI is then determined by this equation: WQI = (0.22 * SIDO) +( 0.16 * SICOD) + (0.19 * SIBOD) + (0.16 * SISS) + (0.12 * SIPH) + (0.15 * SIAN) (DOE, 2007).
1
Fig. 1: Geographic location of the study area along with the sampling points in Selangor, Malaysia
Fig. 1: Geographic location of the study area along with the sampling points in Selangor, Malaysia

88
Water quality variations in a river monitoring network
Trend analysis Nonparametric methods have been the most
extensively employed tests to establish time-based variations in water variables (Antonopoulos et al., 2001; Xile and Changhe, 2012). MK test of trend is a most widely supported approach amongst non-parametric statistical methods (Jiang et al., 2015). This test supports outliers and missing values, as well as asymmetric distributed data. In this study, the change trend was calculated using the MK test method based on the monitoring data from 2005 to 2015 to detect possible trends in the data. The null hypothesis (H0) of the test is that there is no trend in the values of the time series, while the alternative hypothesis (H1) indicates that there is a trend in the dataset. In this study, the trend is significant when the value of p is below 0.05 (Umar et al., 2018).
Cluster analysisHAC is a method of multivariate grouping that
involves the use of variance analysis to measure the distance between the observation clusters, to reduce the sum of squares of every two clusters that is shaped at each step (Wang et al., 2014). Observed variables with similar characteristics are grouped together using dendrogram which represents a hierarchy of partitions. It is then possible to choose a partition by truncating the tree at a given level depending either on user-defined constraints (the user knows the number of classes that must be obtained), or on more objective criteria (Umar et al., 2018; Kovács et al., 2014). In this study, HAC was achieved with Euclidean distances to examine the similarity amongst the variables and Ward’s method for linking the clusters to one another (Ward, 1963). The time series analysis of each water quality variable within the station clusters over a 10-year monitoring period was then performed in order to observe their variations in the network, as compared with the annual mean of water quality.
Parameters Subindex-equation
DO (in % saturation) SIDO = 0 SIDO = 100 SIDO = -0.395 + 0.030 𝑥𝑥2 - 0.00020 𝑥𝑥3
for 𝑥𝑥 ≤ 8% for 𝑥𝑥 ≥ 92% for 8%< 𝑥𝑥 < 92%
BOD (mg/L) SIBOD = 100.4 - 4.23 𝑥𝑥 SIBOD = 108𝑒𝑒−0.055𝑥𝑥- 0.1
for 𝑥𝑥 ≤ 5 for 𝑥𝑥 > 5
COD (mg/L) SICOD = -1.33𝑥𝑥 + 99.1 SICOD = 103𝑒𝑒−0.0157 x- 0.04 𝑥𝑥
for 𝑥𝑥 ≤ 20 for 𝑥𝑥 > 20
NH3-N (mg/L) SIAN = 100.5 - 105x = 94𝑒𝑒−0.573x - 5 |𝑥𝑥 −2|
for 𝑥𝑥 ≤ 0.3 for 0.3 < 𝑥𝑥 < 4
SS (mg/L) SISS = 97.5𝑒𝑒−0.00676 x = 0.05𝑥𝑥 SISS = 71𝑒𝑒−0.0016x – 0.015𝑥𝑥 SISS = 0
for 𝑥𝑥 ≤ 100 for 100 < 𝑥𝑥 < 1000 for 𝑥𝑥 ≥ 1000
pH
SIpH = 17.2 -17.2 𝑥𝑥 + 5.02𝑥𝑥2 SIpH = -242+95.5𝑥𝑥 - 6.67𝑥𝑥2 SIpH = -181+82.4𝑥𝑥 - 6.05𝑥𝑥2 SIpH = 536 - 77.0𝑥𝑥 + 2.76𝑥𝑥2
for 𝑥𝑥 < 5.5 for 5.5 ≤ 𝑥𝑥 < 7 for 7 ≤ 𝑥𝑥 < 8.75 for 𝑥𝑥 ≥ 8.75
Note: x is the concentration in mg/L for all parameters except pH
Table 1: The calculation procedure of sub-indices for the local Water Quality Index (DOE, 2007)
Table 1: The calculation procedure of sub-indices for the local Water Quality Index (DOE, 2007)
Table 2: DOE classification of the local water quality based on index range/ WQI class (DOE, 2007)
Parameters Classes of water quality I II III IV V
DO (mg/L) >7 5-7 3-5 1-3 <1 pH >7 6-7 5-6 <5 >5 BOD (mg/L) <1 1-3 3-6 6-12 >12 NH3-N (mg/L) <0.1 0.1-0.3 0.3-0.9 0.9-2.7 >2.7 COD (mg/L) <10 10-25 25-50 50-100 >100 SS (mg/L) <25 25-50 50-150 150-300 >300 WQI >92.7 76.5-92.7 51.9-76.5 31.0-51.9 <31.0 Quality Very good Good Moderate Polluted Very Polluted
Table 2: DOE classification of the local water quality based on index range/ WQI class (DOE, 2007)
89
Global J. Environ. Sci. Manage. 6(1): 85-96, Winter 2020
RESULTS AND DISCUSSION
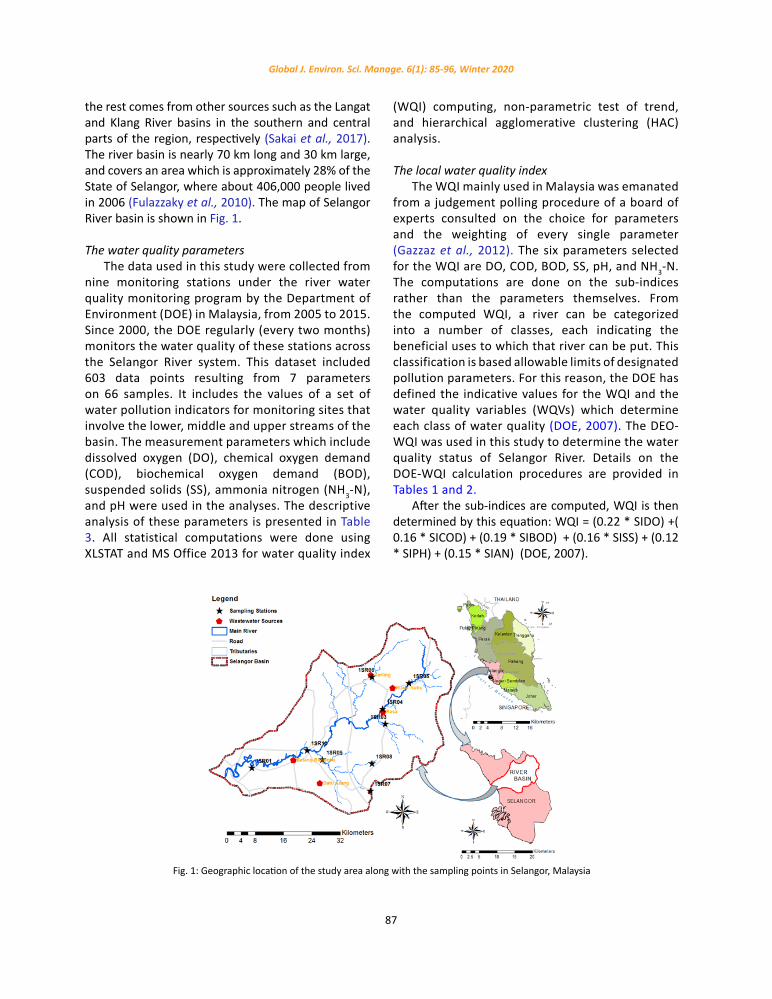
Table 3 shows the descriptive statistics of the water quality parameters for Selangor River between 2005 and 2015, with the minimum, maximum, mean, standard deviation and Standard error of the mean for each variable. A total of 66 samples of water quality were collected during these monitoring periods. As shown in Table 3, there is a considerable gap between the minimum and maximum values of variables such as BOD and SS over the monitoring periods, which could reflect the pollutants discharge events from the point sources of pollution located within the river basin (Fig. 1).
Water quality trend test
In this study, MK trend test was used to identify any significant increases (or decreases) in water
quality variables over time at the monitoring stations (Table 4). Based on the result, DO indicated negative trends at stations 1SR07, 1SR08, 1SR09, 1SR10 in the middle of the basin and 1SR04 in the downstream area, while upward trends were observed at stations 1SR01, 1SR03, 1SR05 and no trend at 1SR06 located in the Sungai kerling branch. However, for DO, the trend was statistically significant only at 1SR04 (p = 0.023). Unlike DO, for BOD, statistically significant downward trends were observed at all stations, with the exception of station 1SR09 (p = 0.442) for which no trend was found. In contrast, COD indicated increasing trends at all stations except 1SR01 in the upstream and these trends were statistically significant at all stations except 1SR01, 1SR05, and 1SR07. In addition, for SS and pH, upward trends were observed at eight stations, while no variation shown at stations 1SR05 for SS and 1SR01 for pH.
Table 3: Descriptive statistics of the water quality parameters for Selangor river from 2005 to 2015
Statistic/Parameter DO (mg/L)
BOD (mg/L) COD (mg/L) SS
(mg/L) pH NH3-N (mg/L)
TEMP. (°C)
Minimum 2.340 1.000 2.900 1.000 3.410 0.010 22.870 Maximum 9.820 36.000 261.000 5280.000 8.310 4.978 32.140 Range 7.480 35.000 258.100 5279.000 4.900 4.968 9.270 Median 7.500 3.000 17.000 21.000 7.130 0.140 27.010 Mean 7.064 3.894 19.805 76.516 7.056 0.244 27.112 Standard deviation (n) 1.260 3.795 16.530 266.035 0.604 0.345 1.549 Standard error of the mean 0.051 0.155 0.674 10.843 0.025 0.014 0.063 *N= 66
Table 3: Descriptive statistics of the water quality parameters for Selangor river from 2005 to 2015
Table 4: Results of MK trend test of water quality parameters at the stations (2005-2015)
Stations/ Parameters MK test DO BOD COD SS pH NH3-N Temp.
1SR01 Slope 0.009 -0.133 -0.034 0.944 0 -0.004 0.013
p-value 0.106 < 0.0001* 0.754 0.114 0.953 0.003* 0.240
1SR03 Slope 0.001 -0.038 0.143 0.333 0.005 -0.005 0.009
p-value 0.653 < 0.0001* 0.009* 0.001* 0.042* < 0.0001* 0.169
1SR04 Slope -0.006 -0.042 0.146 0.16 0.003 -0.001 0.017 p-value 0.023* < 0.0001* 0.004* 0.024* 0.238 < 0.0001* 0.008*
1SR05 Slope 0.001 -0.049 0.1 0 0.006 0.0003 0.027 p-value 0.669 < 0.0001* 0.056 0.849 0.008* 0.458 0.000*
1SR06 Slope 0 -0.056 0.092 0.2 0.002 -0.0003 0.008 p-value 0.965 < 0.0001* 0.029* 0.000* 0.509 0.044* 0.360
1SR07 Slope -0.001 -0.061 0.098 0.368 0.005 -0.002 0.017 p-value 0.681 < 0.0001* 0.109 < 0.0001* 0.031* 0.003* 0.023*
1SR08 Slope -0.001 -0.027 0.2 0.333 0.003 -0.003 0.015 p-value 0.803 0.001* 0.001* < 0.0001* 0.253 0.000* 0.016*
1SR09 Slope -0.004 0 0.171 1.489 0.004 -0.0003 0.02 p-value 0.475 0.442 0.017* 0.002* 0.151 0.918 0.017*
1SR10 Slope -0.0003 -0.021 0.245 0.882 0.001 -0.001 0.017
p-value 0.935 0.027* 0.000* 0.006* 0.645 0.360 0.039* Trend statistically significant at p-value =0.05; positive slope values exhibit increasing trend; negative slope values exhibit decreasing trend; null slope values exhibit no trend
Table 4: Results of MK trend test of water quality parameters at the stations (2005-2015)
90
M. Camara et al.
However, apart from 1SR01 and 1SR05, the trend was statistically significant at all the stations for SS, whereas it was statistically insignificant at all stations for pH, except stations 1SR03, 1SR05, and 1SR07. The trend was positive only at 1SR05 for NH3-N, while it was at all stations for temperature. For the both parameters, the trend was statistically significant at most stations.
However, detecting trends and variations in water quality from long-term monitored data is essential for the adequate planning and management of freshwater resources and predicting the river water quality. In this study, the trend results reveal the pattern and behaviour of water quality variables within the basin over time. In the Table 4, most water quality stations show DO, NH3-N values with downward trends, with BOD indicating the highest number of stations on water quality with significant downward trends. On the other hand, most stations show increasing trends for COD, SS, pH and TEMP, with SS indicating the highest number of stations showing significant upward trends. On the whole, water quality of Selangor River has been somewhat improved over the time period investigated, but there are still some problems in certain areas, especially in the Sungai Selangor (1SR01) and Sungai Kerling (1SR09) branches, where water quality remains degraded (Table 5). Many factors may contribute to the increasing trend in Selangor River as the river receives pollutant loads from poultry farms, municipal wastewaters, and industrial wastewaters (Fulazzaky et al., 2010). Agricultural fertilizers from farms in the area and effluents from treatment plants probably also contribute to the deterioration of water quality of Selangor River (Santhi and Mustafa, 2013; Camara et al., 2019).
WQI and spatial pattern of water quality between stations via cluster analysis
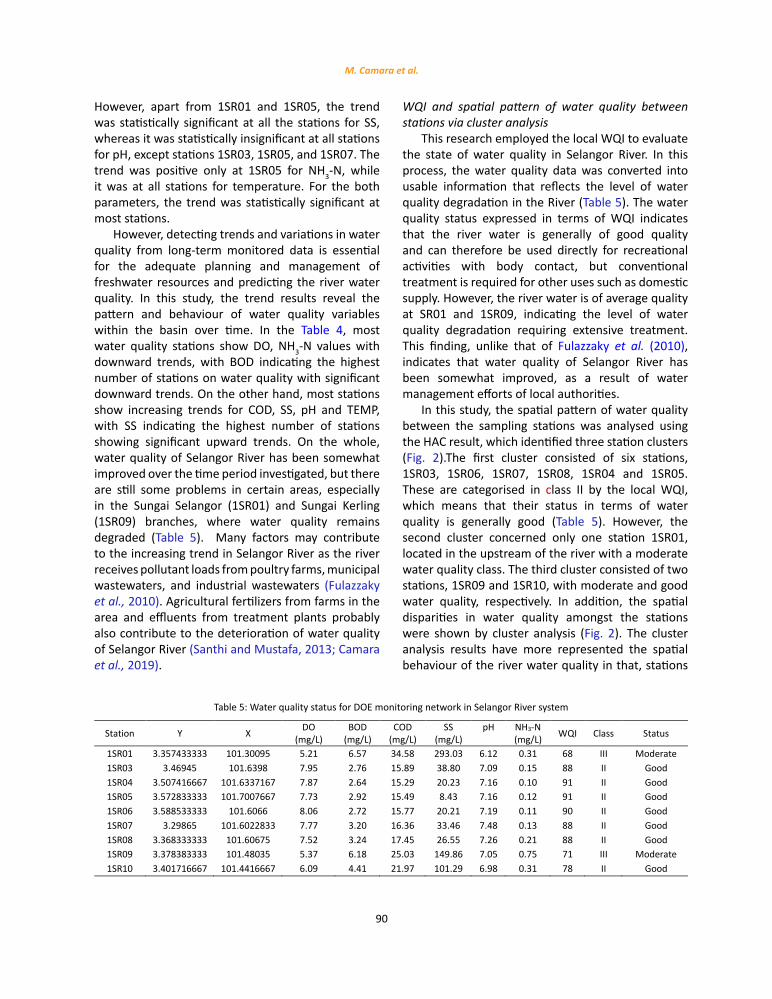
This research employed the local WQI to evaluate the state of water quality in Selangor River. In this process, the water quality data was converted into usable information that reflects the level of water quality degradation in the River (Table 5). The water quality status expressed in terms of WQI indicates that the river water is generally of good quality and can therefore be used directly for recreational activities with body contact, but conventional treatment is required for other uses such as domestic supply. However, the river water is of average quality at SR01 and 1SR09, indicating the level of water quality degradation requiring extensive treatment. This finding, unlike that of Fulazzaky et al. (2010), indicates that water quality of Selangor River has been somewhat improved, as a result of water management efforts of local authorities.
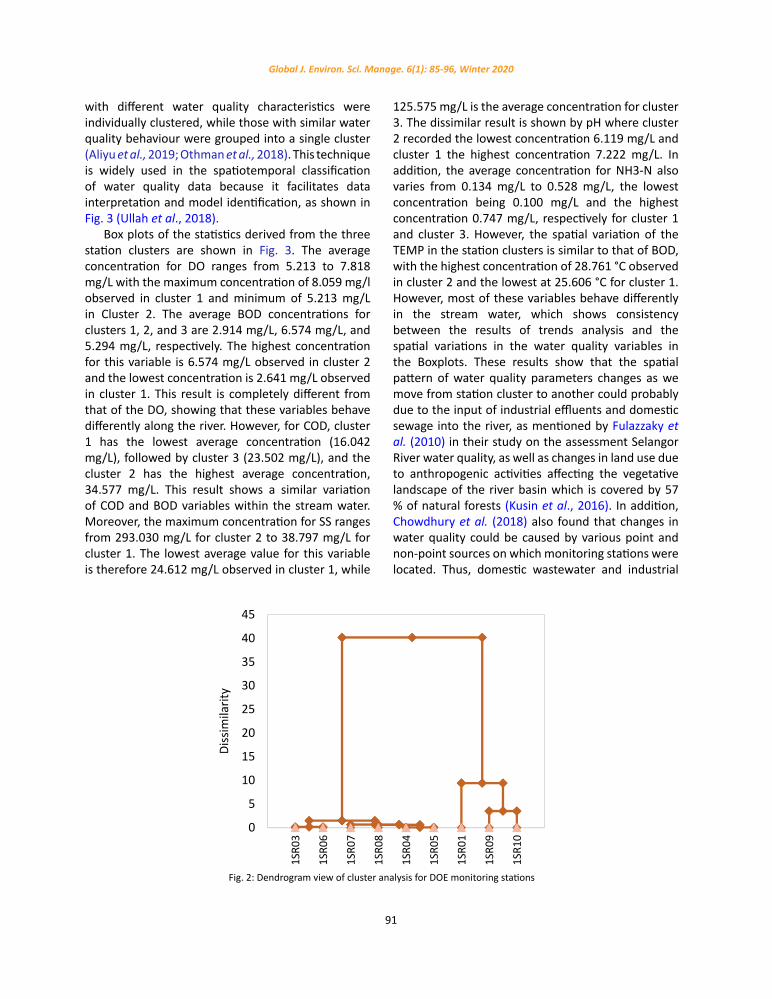
In this study, the spatial pattern of water quality between the sampling stations was analysed using the HAC result, which identified three station clusters (Fig. 2).The first cluster consisted of six stations, 1SR03, 1SR06, 1SR07, 1SR08, 1SR04 and 1SR05. These are categorised in class II by the local WQI, which means that their status in terms of water quality is generally good (Table 5). However, the second cluster concerned only one station 1SR01, located in the upstream of the river with a moderate water quality class. The third cluster consisted of two stations, 1SR09 and 1SR10, with moderate and good water quality, respectively. In addition, the spatial disparities in water quality amongst the stations were shown by cluster analysis (Fig. 2). The cluster analysis results have more represented the spatial behaviour of the river water quality in that, stations
Table 5: Water quality status for DOE monitoring network in Selangor River system
Station Y X DO (mg/L)
BOD (mg/L)
COD (mg/L)
SS (mg/L)
pH
NH3-N (mg/L) WQI Class Status
1SR01 3.357433333 101.30095 5.21 6.57 34.58 293.03 6.12 0.31 68 III Moderate 1SR03 3.46945 101.6398 7.95 2.76 15.89 38.80 7.09 0.15 88 II Good 1SR04 3.507416667 101.6337167 7.87 2.64 15.29 20.23 7.16 0.10 91 II Good 1SR05 3.572833333 101.7007667 7.73 2.92 15.49 8.43 7.16 0.12 91 II Good 1SR06 3.588533333 101.6066 8.06 2.72 15.77 20.21 7.19 0.11 90 II Good 1SR07 3.29865 101.6022833 7.77 3.20 16.36 33.46 7.48 0.13 88 II Good 1SR08 3.368333333 101.60675 7.52 3.24 17.45 26.55 7.26 0.21 88 II Good 1SR09 3.378383333 101.48035 5.37 6.18 25.03 149.86 7.05 0.75 71 III Moderate 1SR10 3.401716667 101.4416667 6.09 4.41 21.97 101.29 6.98 0.31 78 II Good
Table 5: Water quality status for DOE monitoring network in Selangor River system
91
Global J. Environ. Sci. Manage. 6(1): 85-96, Winter 2020
with different water quality characteristics were individually clustered, while those with similar water quality behaviour were grouped into a single cluster (Aliyu et al., 2019; Othman et al., 2018). This technique is widely used in the spatiotemporal classification of water quality data because it facilitates data interpretation and model identification, as shown in Fig. 3 (Ullah et al., 2018).
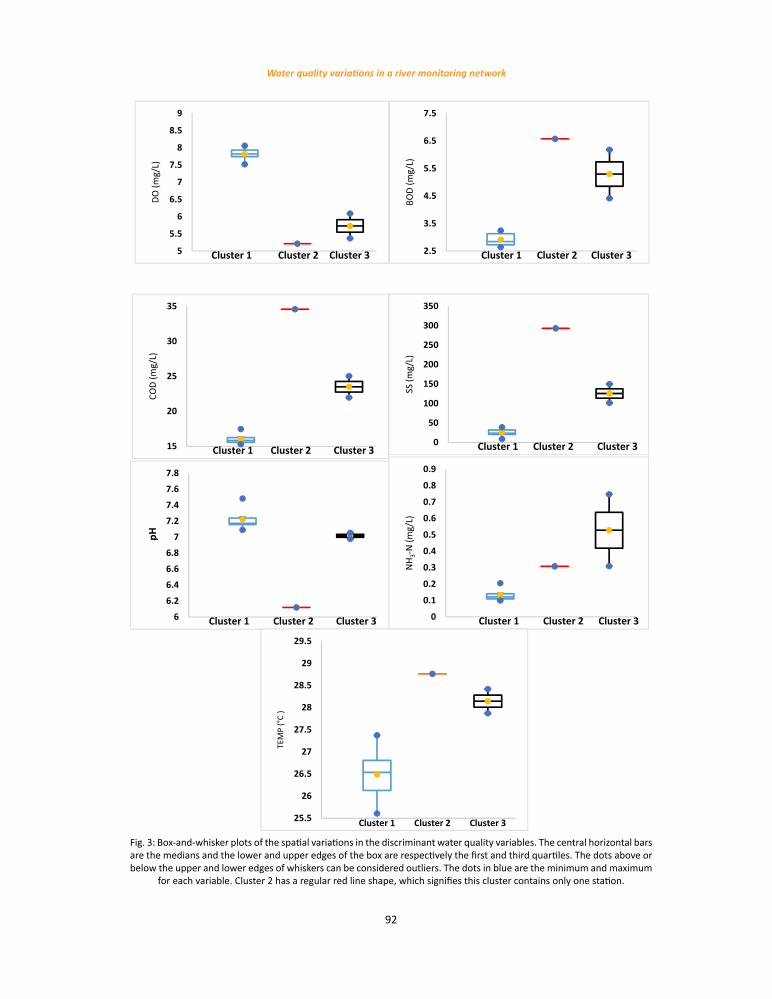
Box plots of the statistics derived from the three station clusters are shown in Fig. 3. The average concentration for DO ranges from 5.213 to 7.818 mg/L with the maximum concentration of 8.059 mg/l observed in cluster 1 and minimum of 5.213 mg/L in Cluster 2. The average BOD concentrations for clusters 1, 2, and 3 are 2.914 mg/L, 6.574 mg/L, and 5.294 mg/L, respectively. The highest concentration for this variable is 6.574 mg/L observed in cluster 2 and the lowest concentration is 2.641 mg/L observed in cluster 1. This result is completely different from that of the DO, showing that these variables behave differently along the river. However, for COD, cluster 1 has the lowest average concentration (16.042 mg/L), followed by cluster 3 (23.502 mg/L), and the cluster 2 has the highest average concentration, 34.577 mg/L. This result shows a similar variation of COD and BOD variables within the stream water. Moreover, the maximum concentration for SS ranges from 293.030 mg/L for cluster 2 to 38.797 mg/L for cluster 1. The lowest average value for this variable is therefore 24.612 mg/L observed in cluster 1, while
125.575 mg/L is the average concentration for cluster 3. The dissimilar result is shown by pH where cluster 2 recorded the lowest concentration 6.119 mg/L and cluster 1 the highest concentration 7.222 mg/L. In addition, the average concentration for NH3-N also varies from 0.134 mg/L to 0.528 mg/L, the lowest concentration being 0.100 mg/L and the highest concentration 0.747 mg/L, respectively for cluster 1 and cluster 3. However, the spatial variation of the TEMP in the station clusters is similar to that of BOD, with the highest concentration of 28.761 °C observed in cluster 2 and the lowest at 25.606 °C for cluster 1. However, most of these variables behave differently in the stream water, which shows consistency between the results of trends analysis and the spatial variations in the water quality variables in the Boxplots. These results show that the spatial pattern of water quality parameters changes as we move from station cluster to another could probably due to the input of industrial effluents and domestic sewage into the river, as mentioned by Fulazzaky et al. (2010) in their study on the assessment Selangor River water quality, as well as changes in land use due to anthropogenic activities affecting the vegetative landscape of the river basin which is covered by 57 % of natural forests (Kusin et al., 2016). In addition, Chowdhury et al. (2018) also found that changes in water quality could be caused by various point and non-point sources on which monitoring stations were located. Thus, domestic wastewater and industrial
2
1SR0
3
1SR0
6
1SR0
7
1SR0
8
1SR0
4
1SR0
5
1SR0
1
1SR0
9
1SR1
0
0
5
10
15
20
25
30
35
40
45
Dissimilarity
Fig. 2: Dendrogram view of cluster analysis for DOE monitoring stations
Fig. 2: Dendrogram view of cluster analysis for DOE monitoring stations
92
Water quality variations in a river monitoring network
3
Cluster 2Cluster 1 Cluster 35
5.5
6
6.5
7
7.5
8
8.5
9
DO (m
g/L)
Cluster 1 Cluster 2 Cluster 315
20
25
30
35
COD (m
g/L)
Cluster 1 Cluster 2 Cluster 30
50
100
150
200
250
300
350
SS (m
g/L)
Cluster 1 Cluster 2 Cluster 36
6.2
6.4
6.6
6.8
7
7.2
7.4
7.6
7.8
pH
Cluster 1 Cluster 2 Cluster 30
0.1
0.2
0.3
0.4
0.5
0.6
0.7
0.8
0.9
NH3‐N (m
g/L)
Cluster 1 Cluster 2 Cluster 32.5
3.5
4.5
5.5
6.5
7.5
BOD (m
g/L)
Cluster 1 Cluster 2 Cluster 325.5
26
26.5
27
27.5
28
28.5
29
29.5
TEMP (°C )
Fig. 3: Box‐and‐whisker plots of the spatial variations in the discriminant water quality variables. The central
Fig. 3: Box-and-whisker plots of the spatial variations in the discriminant water quality variables. The central horizontal bars are the medians and the lower and upper edges of the box are respectively the first and third quartiles. The dots above or below the upper and lower edges of whiskers can be considered outliers. The dots in blue are the minimum and maximum
for each variable. Cluster 2 has a regular red line shape, which signifies this cluster contains only one station.
93
Global J. Environ. Sci. Manage. 6(1): 85-96, Winter 2020
effluents are important point sources of pollution for surface water bodies that require adequate treatment (Gupta et al., 2016).
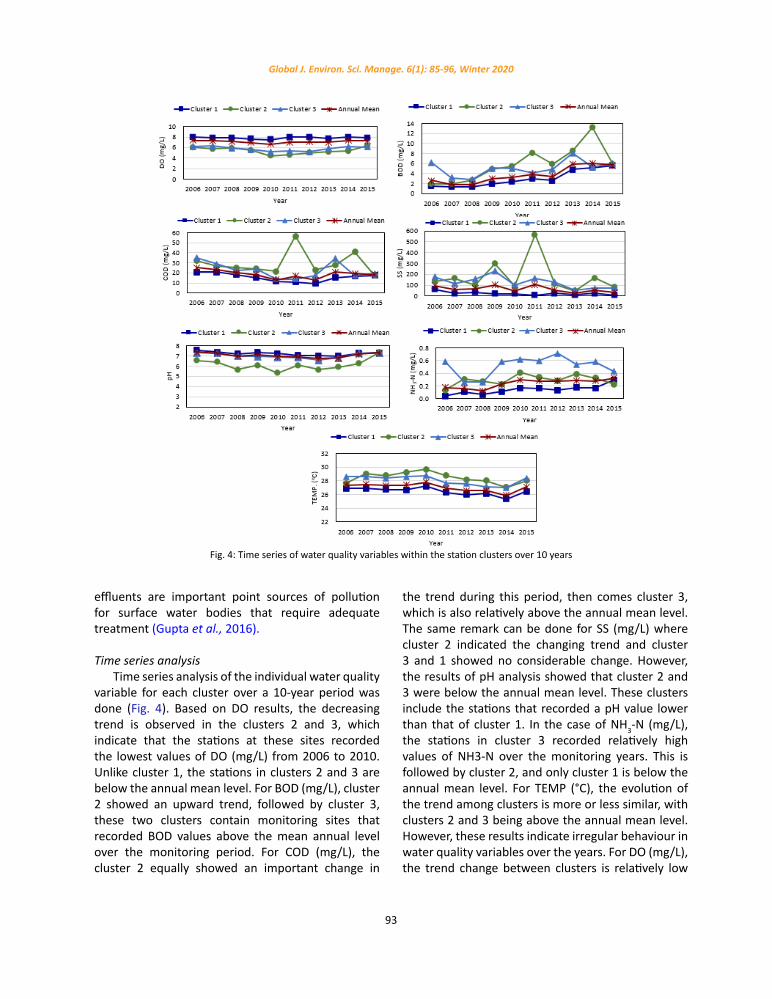
Time series analysis Time series analysis of the individual water quality
variable for each cluster over a 10-year period was done (Fig. 4). Based on DO results, the decreasing trend is observed in the clusters 2 and 3, which indicate that the stations at these sites recorded the lowest values of DO (mg/L) from 2006 to 2010. Unlike cluster 1, the stations in clusters 2 and 3 are below the annual mean level. For BOD (mg/L), cluster 2 showed an upward trend, followed by cluster 3, these two clusters contain monitoring sites that recorded BOD values above the mean annual level over the monitoring period. For COD (mg/L), the cluster 2 equally showed an important change in
the trend during this period, then comes cluster 3, which is also relatively above the annual mean level. The same remark can be done for SS (mg/L) where cluster 2 indicated the changing trend and cluster 3 and 1 showed no considerable change. However, the results of pH analysis showed that cluster 2 and 3 were below the annual mean level. These clusters include the stations that recorded a pH value lower than that of cluster 1. In the case of NH3-N (mg/L), the stations in cluster 3 recorded relatively high values of NH3-N over the monitoring years. This is followed by cluster 2, and only cluster 1 is below the annual mean level. For TEMP (°C), the evolution of the trend among clusters is more or less similar, with clusters 2 and 3 being above the annual mean level. However, these results indicate irregular behaviour in water quality variables over the years. For DO (mg/L), the trend change between clusters is relatively low
4
Fig. 4: Time series of water quality variables within the station clusters over 10 years
Fig. 4: Time series of water quality variables within the station clusters over 10 years
94
M. Camara et al.
as compared to BOD, COD, and SS, where the peak concentration (13 mg/L) is observed in cluster 2 in the year 2014. However, the annual average water quality showed a decreasing trend for most variables throughout this investigation period, with the highest decrease in SS (mg/L). This could be due to the water quality management efforts of local authorities that envisaged to effectively handle the pollution sources of the river (Kusin et al., 2016).
However, from 2014, the annual mean of water quality trend showed an upward shift for BOD, pH, NH3-N, and TEMP., which requests the local water authority to take more control measures to ensure future supply of clean water from the basin. This requires efforts to address both the sources of pollution and the pollution processes (Camara et al., 2019). Overall, the results of the trend analysis, time series analysis and CA provide the same picture of water quality behaviour within the watershed over the monitoring period. This result is in line with a finding of Hatvani et al. (2011) where they noted a consistency between the results of time series analysis and the multivariate statistics. In addition, the clustering results are supportive to the finding of Othman et al. (2018) in clustering the sampling stations for risk assessment and identification of heavy metals sources in Selangor River. The results of this study demonstrate that water quality patterns and trends can be investigated by various analytical techniques to reveal hidden information for better planning and management purposes. These techniques are also capable to illustrate temporal variation in water quality and indicate variables that cause variation in water quality.
CONCLUSION
By combining the MK trend test, HAC and time series analyses, the pattern and behaviour of water quality variables and their spatial disparities within the monitoring network of Selangor River were analysed. Based on the results of annual trend analysis, the variables such as DO, NH3-N, and BOD showed decreasing trends for most stations in the network, while COD, SS, pH and TEMP showed increasing trends. In addition, Boxplots showed a similar behaviour between BOD, COD, and TEMP in the station clusters. However, most variables behave differently in the network, showing the consistency between trend analysis results and whisker diagrams.
Moreover, the time series results showed that the trend variation in DO, pH, and TEMP between the station clusters is relatively low compared to BOD, COD, SS, and NH3-N. Even though spatial variations are commonly more notable, however, both the trends and variations need to be further explored to discover the real reasons for these disparities. In general, the results of this study indicate that the monitoring sites were insignificantly polluted and could be utilized as a source of usable water. Based on the obtained information, it can be noted that, water quality of Selangor River has been somewhat improved, as a result of water management efforts of local authorities. However, the study suggests similar research on other water quality parameters, such as heavy metals and biological parameters, to draw a more reliable conclusion.
ACKNOWLEDGMENT
The authors thank the Department of Environment Studies of Malaysia for providing us with the long-term monitoring data for the Selangor River that was used in this study. Authors also thank the Department of Environmental Sciences of the Faculty of Environmental Studies of Universiti Putra Malaysia for financial support [Geran Putra IPS N6.5] for this study.
CONFLICT OF INTEREST
The author declares that there is no conflict of interests regarding the publication of this manuscript. In addition, the ethical issues, including plagiarism, informed consent, misconduct, data fabrication and/or falsification, double publication and/or submission, and redundancy have been completely observed by the authors.
ABBREVIATIONS
°C Degree celsius% PercentageBOD Biochemical oxygen demandCA Cluster analysisCOD Chemical oxygen demandDA Discriminant analysisDO Dissolved oxygenDOE Department of environment
95
Global J. Environ. Sci. Manage. 6(1): 85-96, Winter 2020
FA Factor analysisFig. FigureH0 Null hypothesisH1 Alternative hypothesisHAC Hierarchical agglomerative clusteringkm kilometrekm2 Square kilometreN Number of samplesmg/L milligrams per litreMK Mann-KendallNH3-N Ammonia nitrogenp ProbabilityPCA Principal component analysispH Potential of HydrogenSI SubindexSS Suspended solidsTEMP. TemperatureUPM Universiti Putra MalaysiaWQI Water quality IndexWQVs water quality variables
REFERENCESAliyu, G. A.; Jamil, N.R.B.; Adam, M.B.; Zulkeflee, Z., (2019).
Assessment of Guinea Savanna River system to evaluate water quality and water monitoring networks. Global J. Environ. Sci. Manage., 5: 345–356 (12 pages).
Antonopoulos, V.Z.; Papamichail D.M.; Mitsiou, K.A., (2001). Statistical and trend analysis of water quality and quantity data for the Strymon River in Greece. Hydrol. Earth Syst. Sci., 5: 679–692 (14 pages).
Behmel S.; Damour, M.; Ludwig, R.; Rodriguez, M.J., (2016). Water quality monitoring strategies — A review and future perspectives. Sci. Total Environ., 571: 1312–1329 (18 pages).
Bloesch, J.; Sandu, C.; Janning, J., (2012). Integrative water protection and river basin management policy: The Danube case. River Syst., 20: 129–144 (16 pages).
Camara, M.; Jamil, N.R.; Abdullah, A.F.B., (2019). Impact of land uses on water quality in Malaysia: a review. Ecol. Process., 8: 10 (10 pages).
CCME, (2015). Guidance manual for optimizing water quality monitoring program design. (88 pages).
Chapman D. V.; Bradley, C.; Gettel, G.M., (2016). Developments in water quality monitoring and management in large river catchments using the Danube River as an example. Environ. Sci. Policy. 64: 141–154 (14 pages).
DOE, (2007). Malaysia Environmental Quality Report 2006. Department of Environment (3 pages).
Drápela, K. ; Drápelová, I., (2011). Application of Mann-Kendall test and the Sen’s slope estimates for trend detection in deposition data from Bílý Kříž (Beskydy Mts., the Czech Republic) 1997-2010 (14 pages).
EEA, (2016). Surface water quality monitoring — European Environment Agency (3 pages).
Fulazzaky, M.A.; Seong, T.W.; Masirin, M.I.M., (2010). Assessment of Water Quality Status for the Selangor River in Malaysia. Water Air Soil Pollut., 205: 63–77 (15 pages).
Gazzaz, N.M.; Yusoff, M.K.; Aris, A.Z., (2012). Artificial neural network modeling of the water quality index for Kinta River (Malaysia) using water quality variables as predictors. Mar. Pollut. Bull., 64: 2409–2420 (12 pages).
Gupta, V.K.; Tyagi, I.; Agarwal, S.; Singh, R.; Chaudhary, M.; Harit, A.; Kushwaha, S., (2016). Column operation studies for the removal of dyes and phenols using a low cost adsorbent. Global J. Environ. Sci. Manage, 2(1): 1–10 (10 pages).
Hatvani, I. G.; Kovács, J.; Kovács, I. S.; Jakusch, P.; Korponai, J., (2011). Analysis of long-term water quality changes in the Kis-Balaton Water Protection System with time series-, cluster analysis and Wilks’ lambda distribution. Ecol. Eng., 37(4): 629–635 (7 pages).
Jiang, C.; Xiong, L.; Wang, D., (2015). Separating the impacts of climate change and human activities on runoff using the Budyko-type equations with time-varying parameters. J. Hydrol., 522: 326–338 (13 pages).
Juahir, H.; Zain, S.M.; Mohd, (2011). Spatial water quality assessment of Langat River Basin (Malaysia) using environmetric techniques. Env. Monit. Assess., 173: 625–641 (17 pages).
Kamal, J.M.; Ramjee, C., (2019). Principal Component Analysis for Water Quality Assessment of the Ganga River in Uttar Pradesh, India. Water Resour., 46: 789–806 (18 pages).
Khalil, B.; Ouarda, T.B.M.J., (2009). Statistical approaches used to assess and redesign surface water-quality-monitoring networks. J. Environ. Monit., 11: 1915 (15 pages).
Kovács, J.; Kovács, S.; Magyar, N., (2014). Classification into homogeneous groups using combined cluster and discriminant analysis. Environ. Model. Software. 57:52–59 (8 pages).
Kükrer, S.; Mutlu, E., (2019). Assessment of surface water quality using water quality index and multivariate statistical analyses in Saraydüzü Dam Lake, Turkey. Environ. Monit. Assess., 191: 71 (16 pages).
Kusin, F.M.; Muhammad, S.N.; Zahar, M.S.M.; Madzin, Z., (2016). Integrated River Basin Management: incorporating the use of abandoned mining pool and implication on water quality status. Desalin. Water Treat., 57: 29126–29136 (11 pages).
Ling, T.Y.; Soo, C.L.; Heng, T.L.E., (2018). Water Quality Assessment of Tributaries of Batang Baleh in Sarawak Using Cluster Analysis. Sci. World. J., 2018: 1–9 (9 pages).
Luo, P.; He, B.; Takara, K., (2011). Spatiotemporal trend analysis of recent river water quality conditions in Japan. J. Environ. Monit., 13: 2819 (11 pages).
MD, S.U.C.; Faridah, O.; Wan, Z.W.; Jaafar, N.C.M., (2018). Assessment of Pollution and Improvement Measure of Water Quality Parameters using Scenarios Modeling for Sungai Selangor Basin. Sains. Malaysiana., 47: 457–469 (13 pages).
Othman, F.; Chowdhury, M.S.; Wan, J.W.Z, (2018). Assessing Risk and Sources of Heavy Metals in a Tropical River Basin: A Case Study of the Selangor River, Malaysia. Polish. J. Environ. Stud., 27: 1659–1671 (13 pages).

96
M. Camara et al.
Sakai, N.; Alsaad, Z.; Thuong, N.T., (2017). Source profiling of arsenic and heavy metals in the Selangor River basin and their maternal and cord blood levels in Selangor State, Malaysia. Chemosphere, 184: 857–865 (9 pages).
Sanders, T.G., (1983). Design of networks for monitoring water quality. Water Resources Publications. (328 pages).
Santhi, V.A.; Mustafa, A.M., (2013). Assessment of organochlorine pesticides and plasticisers in the Selangor River basin and possible pollution sources. Environ. Monit. Assess., 185: 1541–1554 (14 pages).
Tanos, P.; Kovács, J.; Kovács, S., (2015). Optimization of the monitoring network on the River Tisza (Central Europe, Hungary) using combined cluster and discriminant analysis, taking seasonality into account. Enviro.n Monit. Assess., 187: 575 (14 pages).
Ullah, K. A.; Jiang, J.; Wang, P., (2018). Land use impacts on surface water quality by statistical approaches. Global J. Environ. Sci. Manage, 4(2), 231–250 (20 pages).
Wan, L.; Li, Y.C.; (2018). Time series trend analysis and prediction of water quality in a managed canal system, Florida (USA). IOP Conf. Ser. Earth Environ. Sci., 191: 012013 (12 pages).
Wang, Y.B.; Liu, C.W.; Liao, P.Y.; Lee, J.J., (2014). Spatial pattern assessment of river water quality: implications of reducing the number of monitoring stations and chemical parameters. Environ. Monit. Assess., 186: 1781–1792 (12 pages).
Ward, J.H., (1963). Hierarchical Grouping to Optimize an Objective Function. J. Am. Stat. Assoc., 58: 236–244 (9 pages).
Xile, D.; Changhe, L., (2012). Evaluation and Trend Analysis of Surface Water Quality in Zhengzhou in 1998–2008. Chinese J. Popul. Resour. Environ., 10: 44–51 (8 pages).
AUTHOR (S) BIOSKETCHES
Camara, M., Ph.D. Candidate, Faculty of Environmental Studies, Universiti Putra Malaysia, 43400 Serdang, Selangor, Malaysia. Email: [email protected]
Jamil, N.R.B., Ph.D., Associate Professor, Faculty of Environmental Studies, Universiti Putra Malaysia UPM, 43400 Serdang, Selangor, Malaysia. Email: [email protected]
Abdullah, F.B., Ph.D., Senior Lecturer, Department of Biological and Agricultural Engineering, Faculty of Engineering, Universiti Putra Malaysia, 43400, Serdang, Selangor DE, Malaysia. Email: [email protected]
HOW TO CITE THIS ARTICLE
Camara, M.; Jamil, N.R.B.; Abdullah, F.B., (2020). Variations of water quality in the monitoring network of a tropical river. Global J. Environ. Sci. Manage., 6(1): 85-96.
DOI: 10.22034/gjesm.2020.01.07
url: https://www.gjesm.net/article_37130.html
COPYRIGHTS
© 2020 The author(s). This is an open access article distributed under the terms of the Creative Commons Attribution (CC BY 4.0), which permits unrestricted use, distribution, and reproduction in any medium, as long as the original authors and source are cited. No permission is required from the authors or the publishers.