Embed Size (px)
Citation preview
Introduction
Nitrate pollution of water has become a worldwide water quality problem, which has been an important factor in ecosystem destruction [1-2]. In recent years, the increased nitrate concentrations in water bodies caused by intensive human activity, industrial production, domestic sewage discharge, fertilizer application, landfill pollutants, and fossil fuel leakage have attracted the attention of researchers [3-4]. Excessive nitrates in drinking water and food can transform into nitrosamines, which is a carcinogenic substance in the intestines and
stomach, endangering the health of humans and animals [5]. Accordingly, numerous independent countries and the World Health Organization (WHO) have stipulated that NO3
--N concentrations in drinking water be limited to under 10 mg/L [6].
The composition and variation of a stable isotope in water originates from the stage of water vapor entering the atmosphere during the hydrological cycle. Isotope fractionation also runs through all sections of the hydrological cycle. Therefore, a stable isotope can be used to analyze the source, pathway, redistribution, and recharge of water vapor in a more comprehensive way, so as to further understand the continuous changes of water vapor in various temporal and spatial scales [7-9]. The global meteoric water line (GMWL), defined by Craig
Pol. J. Environ. Stud. Vol. 27, No. 6 (2018), 2677-2685
Original Research
Pollution Processes in Chinese Mining Area from Isotope Evidence
Zhilong Meng, Yonggang Yang*, Zuodong Qin
Institute of Loess Plateau, Shanxi University, Taiyuan, China
Received: 20 October 2017Accepted: 14 December 2017
Abstract
Hydrological and nitrate pollution processes are important parts of aquatic ecosystems. For this study we collected samples of river water, reservoir water, shallow groundwater, deep groundwater, and precipitation in the Fenhe River Basin. δD and δ18O were used to identify the hydrological process. δ15N-NO3
- and δ18O-NO3- were used to identify the sources and pollution process of NO3
-. The results show that precipitation is the main source of water in the study area, and there is an obvious isotopic fractionation caused by evaporation. The reservoir water, river water, soil water, and shallow groundwater had a mutual recharge and discharge association. Deep groundwater is recharged by archaic groundwater and less affected by evaporation and human activity. NO3
- is the main N species in the study area, nitrification is the main source of NO3
-, and denitrification is also found in some river branches. 46.2% of NO3
--N concentrations exceeded the drinking water standard of China. NO3- Sources are mainly
controlled by land use type. Nitrogen in precipitation and soil organic N are the major sources of NO3- in
the upstream. The midstream area is mainly polluted by manure and sewage, while the downstream area is polluted by a mixture of soil organic N and fertilizers.
Keywords: hydrochemical, hydrological processes, isotope, nitrate, pollution processes
*e-mail: [email protected]
DOI: 10.15244/pjoes/81211 ONLINE PUBLICATION DATE: 2018-06-11
2678 Meng Z., et al.
[10], shows the relationship between δ18O and δD in rain, snow, rivers, and lakes throughout the world and can be represented by the equation δD = 8δ18O+10‰. At the same time, runoff is the interaction between different water bodies in the hydrological cycle, which has an important influence on the distribution of stable isotopes in surface water and groundwater, δD-H2O and δ18O-H2O has been applied to reveal the relationship between surface water and groundwater [11-13].
Accurately identifying nitrate pollution sources in water is a key part to controlling nitrate pollution. However, distinguishing the point source and non-point source of nitrate is difficult. The problem of nitrate overlapping caused by isotopic fractionation during the physical and biological processes must first be resolved. Traditional methods have investigated land use type and characteristics of local hydrochemicals in polluted areas to identify sources of nitrate pollution. However, results from these methods have not been satisfactory. In recent years, researchers have found that different nitrate sources contain different nitrogen (N) and oxygen (O) isotope ratios. Therefore, nitrate sources in water can be identified according to the values of N and O isotopes of NO3
--N, which can compensate for the deficiency in traditional methods and provide a new way to directly identify pollution sources [14-16]. Accordingly, both isotopic δ15N-NO3
- and δ18O-NO3-
methods were applied to identify nitrate pollution sources in this study.
In the past few decades, the mining area of the Fenhe River Basin has undergone severe contamination [17]. Many coal mines, thermal power stations, and coal preparation plants exist in the area due to the geographical vantage point and good industrial foundation. The annual untreated wastewater discharge amount is 33.7 billion tons in the Fenhe River Basin. The main industrial pollutants are reducing substances, volatile phenols, and ammonia nitrogen in the study area. These pollutants account for 42% of the wastewater discharge, the reducing substances metered as chemical oxygen demand (COD) discharge amounts to as much as 57.8 thousand tons, and ammonia nitrogen discharge up to 9.1 thousand tons per year. Despite this, only limited data is available on pollution sources and NO3
- transformation based on δ15N-NO3
- and δ18O-NO3- isotopic methods from
this area, while the hydrological process study based on δD-H2O and δ18O-H2O is also limited. Accordingly, we analyzed hydrochemical and isotopic composition of river water, reservoir water, shallow groundwater (water level between 0-30 m), deep groundwater (water level≥50m), and precipitation in the mining area of the Fenhe River Basin. The objectives of this study were to reveal the hydrological cycling processes via δD-H2O and δ18O-H2O and determine the concentration and transformation of nitrogen species. At the same time, the nitrate pollution processes also have been identified in this study combined with the δ15N-NO3
-, δ18O-NO3-,
and hydrochemical methods.
Materials and Methods
Experimental Site
The experimental site is located in the mining area of the Fenhe River Basin, with latitude 35°20′13′′N - 38°56′17′′N and longitude 110°29′48′′E - 113°32′27′′E. The Fenhe River Basin covers a catchment area of 3.9×10⁴ km2. The altitude ranges from 368 m to 1,670 m (AMSL). The study area is the major coal producing area of China, and it is also the main industrial area, agricultural area, and urban residential area of Shanxi Province. 2.32×10⁹ m3/a of Fenhe River water is used for industrial production and residents living by the riverbank, which accounts for about 46% of total water consumption of Shanxi Province.
The climate of the Fenhe River Basin belonged to a warm temperate continental monsoon climate zone. The average annual precipitation is 504.8 mm. The precipitation is decreasing with a rate of 21.49 mm/10a in the past 50 years, which shows a characteristic of small annual variety but a big seasonal variety. Therefore, the mining area of the Fenhe River Basin has a congenitally deficient condition of water resources and a fragile ecological environment. The precipitation is concentrated in June to September in the form of heavy rain (about 70% of total precipitation). The spatial distribution shows that the regional precipitation is unevenly distributed. Evaporation of surface water is between 1,000 mm to 1,200 mm, the high value area is in Yuncheng Basin.
The terrain of Fenhe River Basin is a graben rift valley, the alluvial fan of border mount is a hypsographic feature and complicated ditches, with a small area and a huge slope. There are different shapes of loess hills and tableland between the mountain and basin in the east due to the slowly changing terrain. The Fenhe River can be divided into upstream, midstream, and downstream by Lancun and Shitan according to the characteristics of the river.
Sample Collection and Field Experiment
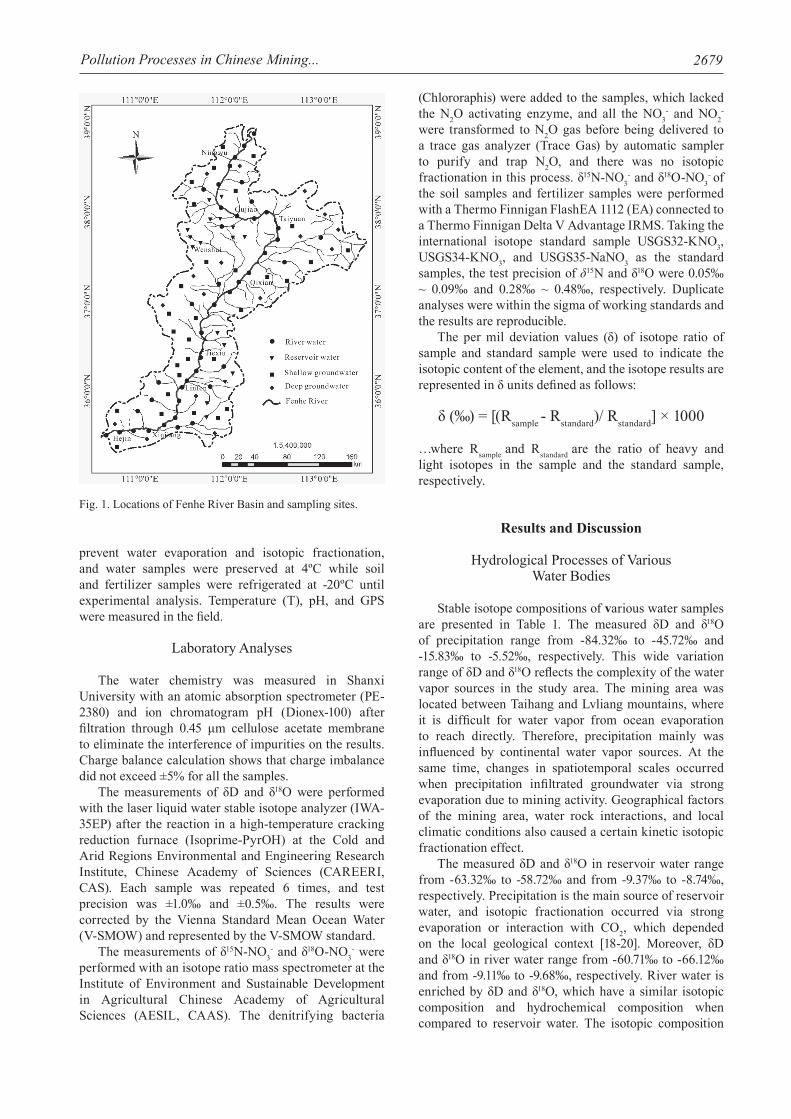
The samples of river water, reservoir water, shallow groundwater, deep groundwater, and precipitation were collected from April 2012 to May 2015 in the mining areas of the Fenhe River Basin (Fig. 1). Precipitation was collected by a rainwater collector and stored in the sample bottle after each rainfall event. River and reservoir waters were collected 30 cm below the surface water. Shallow groundwater and deep groundwater were directly collected from the irrigation wells or drinking water wells, respectively. Soil samples were collected in the urban resident living areas and farmland. All the sample bottles were washed with the collected water 3 times before storing water samples. The samples were stored in 1 L polyethylene bottles used for hydrochemicals, in 0.1 L polyethylene bottle for δ15N-NO3
-, δ18O-NO3-,
and in 8 mL glass bottle for δD-H2O and δ18O-H2O, respectively. All samples were sealed with parafilm to
2679Pollution Processes in Chinese Mining...
prevent water evaporation and isotopic fractionation, and water samples were preserved at 4ºC while soil and fertilizer samples were refrigerated at -20ºC until experimental analysis. Temperature (T), pH, and GPS were measured in the field.
Laboratory Analyses
The water chemistry was measured in Shanxi University with an atomic absorption spectrometer (PE-2380) and ion chromatogram pH (Dionex-100) after filtration through 0.45 μm cellulose acetate membrane to eliminate the interference of impurities on the results. Charge balance calculation shows that charge imbalance did not exceed ±5% for all the samples.
The measurements of δD and δ18O were performed with the laser liquid water stable isotope analyzer (IWA-35EP) after the reaction in a high-temperature cracking reduction furnace (Isoprime-PyrOH) at the Cold and Arid Regions Environmental and Engineering Research Institute, Chinese Academy of Sciences (CAREERI, CAS). Each sample was repeated 6 times, and test precision was ±1.0‰ and ±0.5‰. The results were corrected by the Vienna Standard Mean Ocean Water (V-SMOW) and represented by the V-SMOW standard.
The measurements of δ15N-NO3- and δ18O-NO3
- were performed with an isotope ratio mass spectrometer at the Institute of Environment and Sustainable Development in Agricultural Chinese Academy of Agricultural Sciences (AESIL, CAAS). The denitrifying bacteria
(Chlororaphis) were added to the samples, which lacked the N2O activating enzyme, and all the NO3
- and NO2-
were transformed to N2O gas before being delivered to a trace gas analyzer (Trace Gas) by automatic sampler to purify and trap N2O, and there was no isotopic fractionation in this process. δ15N-NO3
- and δ18O-NO3- of
the soil samples and fertilizer samples were performed with a Thermo Finnigan FlashEA 1112 (EA) connected to a Thermo Finnigan Delta V Advantage IRMS. Taking the international isotope standard sample USGS32-KNO3, USGS34-KNO3, and USGS35-NaNO3 as the standard samples, the test precision of δ15N and δ18O were 0.05‰ ~ 0.09‰ and 0.28‰ ~ 0.48‰, respectively. Duplicate analyses were within the sigma of working standards and the results are reproducible.
The per mil deviation values (δ) of isotope ratio of sample and standard sample were used to indicate the isotopic content of the element, and the isotope results are represented in δ units defined as follows:
δ (‰) = [(Rsample - Rstandard)/ Rstandard] × 1000
…where Rsample and Rstandard are the ratio of heavy and light isotopes in the sample and the standard sample, respectively.
Results and Discussion
Hydrological Processes of Various Water Bodies
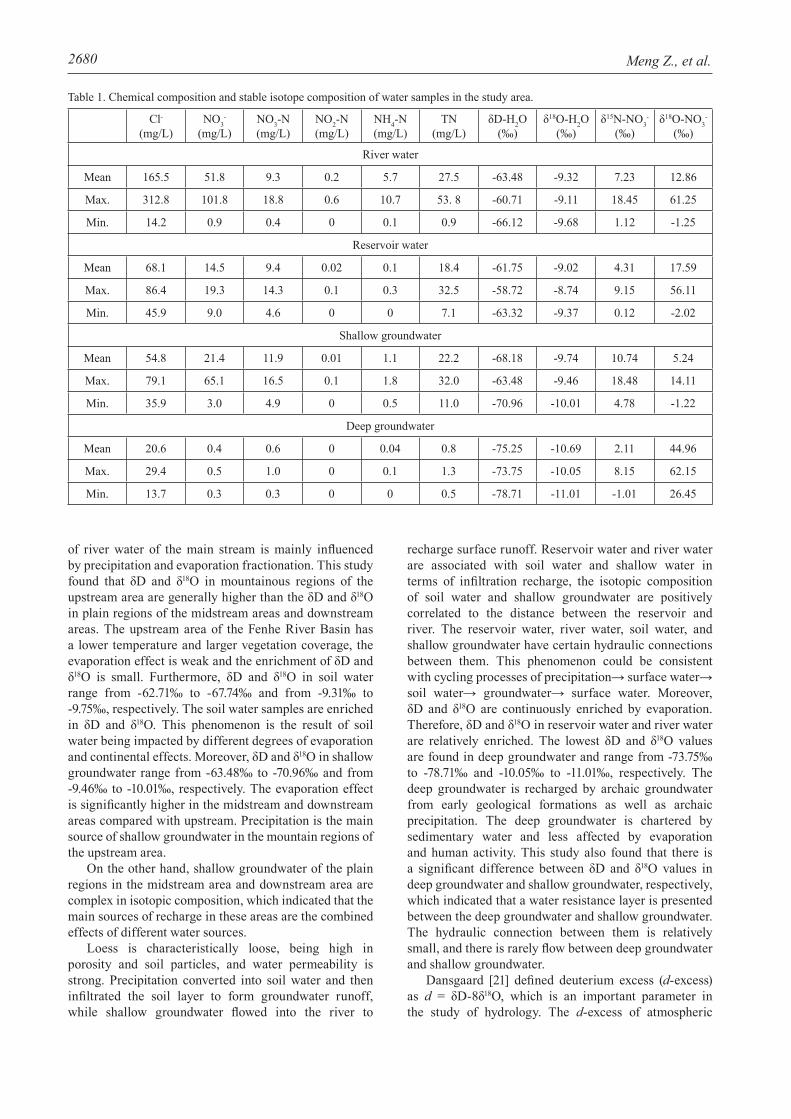
Stable isotope compositions of various water samples are presented in Table 1. The measured δD and δ18O of precipitation range from -84.32‰ to -45.72‰ and -15.83‰ to -5.52‰, respectively. This wide variation range of δD and δ18O reflects the complexity of the water vapor sources in the study area. The mining area was located between Taihang and Lvliang mountains, where it is difficult for water vapor from ocean evaporation to reach directly. Therefore, precipitation mainly was influenced by continental water vapor sources. At the same time, changes in spatiotemporal scales occurred when precipitation infiltrated groundwater via strong evaporation due to mining activity. Geographical factors of the mining area, water rock interactions, and local climatic conditions also caused a certain kinetic isotopic fractionation effect.
The measured δD and δ18O in reservoir water range from -63.32‰ to -58.72‰ and from -9.37‰ to -8.74‰, respectively. Precipitation is the main source of reservoir water, and isotopic fractionation occurred via strong evaporation or interaction with CO2, which depended on the local geological context [18-20]. Moreover, δD and δ18O in river water range from -60.71‰ to -66.12‰ and from -9.11‰ to -9.68‰, respectively. River water is enriched by δD and δ18O, which have a similar isotopic composition and hydrochemical composition when compared to reservoir water. The isotopic composition
Fig. 1. Locations of Fenhe River Basin and sampling sites.
2680 Meng Z., et al.
of river water of the main stream is mainly influenced by precipitation and evaporation fractionation. This study found that δD and δ18O in mountainous regions of the upstream area are generally higher than the δD and δ18O in plain regions of the midstream areas and downstream areas. The upstream area of the Fenhe River Basin has a lower temperature and larger vegetation coverage, the evaporation effect is weak and the enrichment of δD and δ18O is small. Furthermore, δD and δ18O in soil water range from -62.71‰ to -67.74‰ and from -9.31‰ to -9.75‰, respectively. The soil water samples are enriched in δD and δ18O. This phenomenon is the result of soil water being impacted by different degrees of evaporation and continental effects. Moreover, δD and δ18O in shallow groundwater range from -63.48‰ to -70.96‰ and from -9.46‰ to -10.01‰, respectively. The evaporation effect is significantly higher in the midstream and downstream areas compared with upstream. Precipitation is the main source of shallow groundwater in the mountain regions of the upstream area.
On the other hand, shallow groundwater of the plain regions in the midstream area and downstream area are complex in isotopic composition, which indicated that the main sources of recharge in these areas are the combined effects of different water sources.
Loess is characteristically loose, being high in porosity and soil particles, and water permeability is strong. Precipitation converted into soil water and then infiltrated the soil layer to form groundwater runoff, while shallow groundwater flowed into the river to
recharge surface runoff. Reservoir water and river water are associated with soil water and shallow water in terms of infiltration recharge, the isotopic composition of soil water and shallow groundwater are positively correlated to the distance between the reservoir and river. The reservoir water, river water, soil water, and shallow groundwater have certain hydraulic connections between them. This phenomenon could be consistent with cycling processes of precipitation→ surface water→ soil water→ groundwater→ surface water. Moreover, δD and δ18O are continuously enriched by evaporation. Therefore, δD and δ18O in reservoir water and river water are relatively enriched. The lowest δD and δ18O values are found in deep groundwater and range from -73.75‰ to -78.71‰ and -10.05‰ to -11.01‰, respectively. The deep groundwater is recharged by archaic groundwater from early geological formations as well as archaic precipitation. The deep groundwater is chartered by sedimentary water and less affected by evaporation and human activity. This study also found that there is a significant difference between δD and δ18O values in deep groundwater and shallow groundwater, respectively, which indicated that a water resistance layer is presented between the deep groundwater and shallow groundwater. The hydraulic connection between them is relatively small, and there is rarely flow between deep groundwater and shallow groundwater.
Dansgaard [21] defined deuterium excess (d-excess) as d = δD-8δ18O, which is an important parameter in the study of hydrology. The d-excess of atmospheric
Cl-
(mg/L)NO3
-
(mg/L)NO3-N(mg/L)
NO2-N(mg/L)
NH4-N(mg/L)
TN(mg/L)
δD-H2O(‰)
δ18O-H2O(‰)
δ15N-NO3-
(‰)δ18O-NO3
-
(‰)
River water
Mean 165.5 51.8 9.3 0.2 5.7 27.5 -63.48 -9.32 7.23 12.86
Max. 312.8 101.8 18.8 0.6 10.7 53. 8 -60.71 -9.11 18.45 61.25
Min. 14.2 0.9 0.4 0 0.1 0.9 -66.12 -9.68 1.12 -1.25
Reservoir water
Mean 68.1 14.5 9.4 0.02 0.1 18.4 -61.75 -9.02 4.31 17.59
Max. 86.4 19.3 14.3 0.1 0.3 32.5 -58.72 -8.74 9.15 56.11
Min. 45.9 9.0 4.6 0 0 7.1 -63.32 -9.37 0.12 -2.02
Shallow groundwater
Mean 54.8 21.4 11.9 0.01 1.1 22.2 -68.18 -9.74 10.74 5.24
Max. 79.1 65.1 16.5 0.1 1.8 32.0 -63.48 -9.46 18.48 14.11
Min. 35.9 3.0 4.9 0 0.5 11.0 -70.96 -10.01 4.78 -1.22
Deep groundwater
Mean 20.6 0.4 0.6 0 0.04 0.8 -75.25 -10.69 2.11 44.96
Max. 29.4 0.5 1.0 0 0.1 1.3 -73.75 -10.05 8.15 62.15
Min. 13.7 0.3 0.3 0 0 0.5 -78.71 -11.01 -1.01 26.45
Table 1. Chemical composition and stable isotope composition of water samples in the study area.

2681Pollution Processes in Chinese Mining...
precipitation varies between different regions, and is mainly affected by air relative humidity of the water vapor origin area when water is evaporating, while the influence of water surface temperature and wind speed are relatively small. If the air relative humidity of the water vapor origin area increased by 10%, the d-excess of precipitation will fall by 6‰. Therefore, it could not only be used as a direct response of the degree of imbalance between precipitation, evaporation, and condensation processes in the study area, but it could also be used as a response to the degree of spatiotemporal variation in water cycling in the region.
The d-excess of precipitation, reservoir water, river water, soil water, shallow groundwater, and deep groundwater in the study area are 6.8-24.2‰, 6.4-15.1‰, 5.8-14.3‰, 6.3-13.1‰, 10.1-16.3‰, and 4.2-7.3‰, respectively. The d-excess exhibited large amplitudes and high value characteristics, which is mainly due to the fact that the study area is located in an arid-semiarid area, that precipitation is complex in the area, and that the second stage of surface water evaporation in the area is severe. The isotopic fractionation between gas and liquids during the precipitating formation processes of clouds is also imbalanced, which forms uncommon local water cycling conditions.
As Fig. 2 shows, most reservoir water, river water, soil water, and shallow groundwater are plotted in a triangular area of precipitation, which indicated the characteristics of mixed recharge. Deep groundwater is plotted outside the triangular area of precipitation, which indicated that there is less modern precipitation recharge. Some of the reservoir water, river water, and soil water are also plotted outside the triangular area of precipitation, which indicated that the seasonal variations of precipitation recharge need to be taken into account in some sampling sites. Fig. 2 show that associations between mutual recharge and discharge existed among reservoir water, river water, soil water, and shallow groundwater, which indicated that water in the Fenhe River Basin is recharged by a variety of water sources.
Concentration and Transformation of Nitrogen Species
The N species (NH4+-N, NO3
--N, NO2--N, TN,
and NO3-) compositions of various water samples are
presented in Table 1. The NO3- concentrations of all
water samples ranged from 0.52 to 101.77 mg/L, with a mean value of 29.76 mg/L. 25.6% of the water samples exceeding the maximum permissible limit for nitrate in drinking water (50 mg/L), as recommended by WHO. The NO3
--N concentration of all water samples range from 0.32 to 18.83 mg/L, with a mean value of 8.71 mg/L. 46.2% of the water samples exceeding the drinking water standard of China (10 mg/L). The NO3
- contamination of groundwater in the Fenhehe River Basin has already caused serious health problems for local residents. The NO2
--N concentration of all water samples ranges from BDL (below detection limit) to 0.57 mg/L, with a mean value of 0.07 mg/L. 14.1% of the water samples exceeding the maximum permissible limit for NO2
--N in drinking water (0.2 mg/L), as recommended by WHO, which indicates the high toxicity and severe pollution in the study area. The NH4
+-N concentration for all water samples range from BDL to 10.74 mg/L, with a mean value of 2.69 mg/L.
The minimum concentrations of all N species are found in deep groundwater, which indicates that the deep groundwater is rarely affected by industrial and domestic sewage. This phenomenon also illustrates the fact that the denitrification caused by denitrifying bacteria exists in the deep groundwater. The maximum concentrations of all N species are found in the Jiexiu, Huozhou, Hongtong, and LinFen sampling sites, which indicates that the river water, reservoir water, and shallow groundwater have been polluted by industrial and domestic sewage to varying degrees. These sampling sites are distributed within the industrial and urban areas, and industrial point source pollution and urban non-point source pollution are the main nitrate pollution sources in this area. The concentrations of both NH4
+-N and NO3--N are increased
due to the excessive application of fertilizer and the discharge of domestic sewage.
The denitrification caused by microorganisms in river water are obviously due to the wide river channel and slow water velocity downstream, which led to a lower NO3
- concentration. The NH4+-N concentration
increased in these polluted areas, which indicates that the degradation rate of pollutants in water is slow. The process of denitrification generally proceeds through some combination of the following intermediate forms: NO3
-→NO2-→NO+N2O→N2 (g) under the condition
of an anaerobic environment. Direct reduction from NO3
- to NH4+ only occurs when the denitrifying
microorganisms have the nrf-gene, which is a process known as dissimilatory nitrate reduction to ammonium (DNRA). However, DNRA is generally less common than denitrification in the process of nitrate reduction in most ecosystems. The lower NO3
- concentration and increased NH4
+-N concentration indicated that the DNRA process Fig. 2. Plot of d-excess versus δ18O from various water samples collected in the Fenhe River Basin.
2682 Meng Z., et al.
maybe happened in urban residential and agricultural areas around the Fenhe River Basin. The urban residential area and industrial area are rarely distributed around the Fenhe Reservoir and Wenyuhe Reservoir. Agricultural cultivation is the main human activity in this area. Both the NH4
+-N and NO2--N concentrations are very low in
reservoir water, which indicated that soil organic N and nitrogenous fertilizer are the major sources of N species in reservoir water.
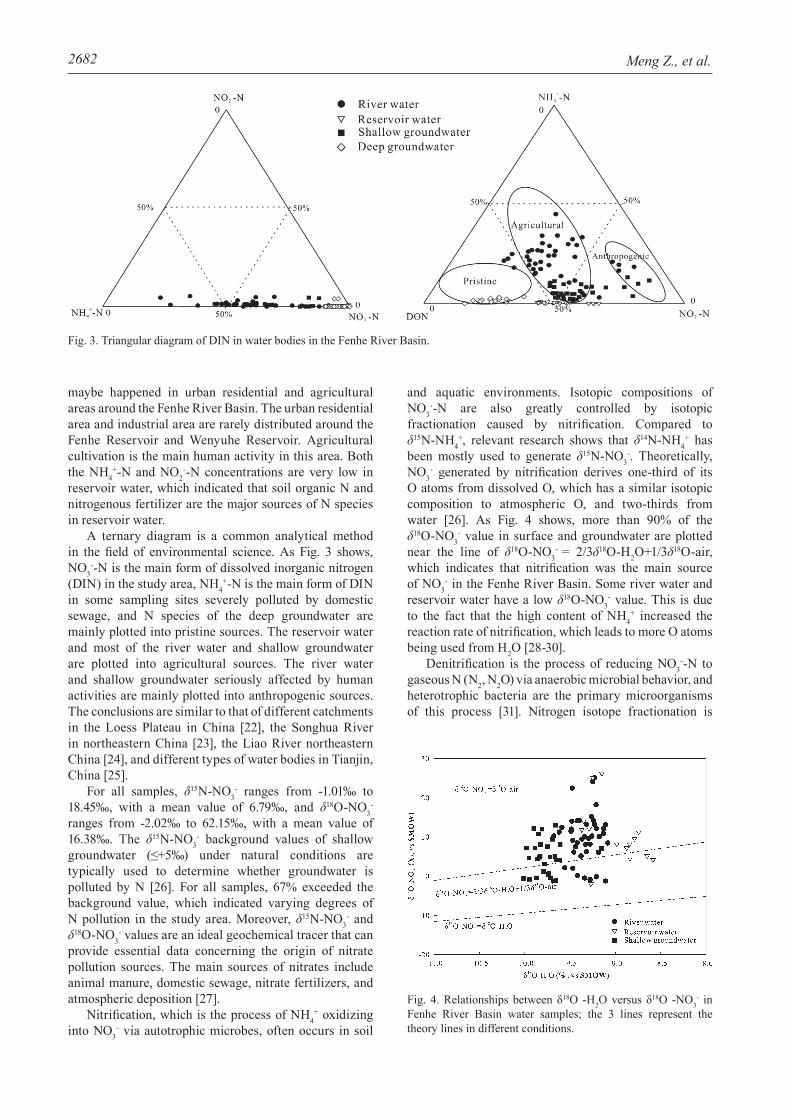
A ternary diagram is a common analytical method in the field of environmental science. As Fig. 3 shows, NO3
--N is the main form of dissolved inorganic nitrogen (DIN) in the study area, NH4
+-N is the main form of DIN in some sampling sites severely polluted by domestic sewage, and N species of the deep groundwater are mainly plotted into pristine sources. The reservoir water and most of the river water and shallow groundwater are plotted into agricultural sources. The river water and shallow groundwater seriously affected by human activities are mainly plotted into anthropogenic sources. The conclusions are similar to that of different catchments in the Loess Plateau in China [22], the Songhua River in northeastern China [23], the Liao River northeastern China [24], and different types of water bodies in Tianjin, China [25].
For all samples, δ15N-NO3- ranges from -1.01‰ to
18.45‰, with a mean value of 6.79‰, and δ18O-NO3-
ranges from -2.02‰ to 62.15‰, with a mean value of 16.38‰. The δ15N-NO3
- background values of shallow groundwater (≤+5‰) under natural conditions are typically used to determine whether groundwater is polluted by N [26]. For all samples, 67% exceeded the background value, which indicated varying degrees of N pollution in the study area. Moreover, δ15N-NO3
- and δ18O-NO3
- values are an ideal geochemical tracer that can provide essential data concerning the origin of nitrate pollution sources. The main sources of nitrates include animal manure, domestic sewage, nitrate fertilizers, and atmospheric deposition [27].
Nitrification, which is the process of NH4+ oxidizing
into NO3- via autotrophic microbes, often occurs in soil
and aquatic environments. Isotopic compositions of NO3
--N are also greatly controlled by isotopic fractionation caused by nitrification. Compared to δ15N-NH4
+, relevant research shows that δ14N-NH4+ has
been mostly used to generate δ15N-NO3-. Theoretically,
NO3- generated by nitrification derives one-third of its
O atoms from dissolved O, which has a similar isotopic composition to atmospheric O, and two-thirds from water [26]. As Fig. 4 shows, more than 90% of the δ18O-NO3
- value in surface and groundwater are plotted near the line of δ18O-NO3
- = 2/3δ18O-H2O+1/3δ18O-air, which indicates that nitrification was the main source of NO3
- in the Fenhe River Basin. Some river water and reservoir water have a low δ18O-NO3
- value. This is due to the fact that the high content of NH4
+ increased the reaction rate of nitrification, which leads to more O atoms being used from H2O [28-30].
Denitrification is the process of reducing NO3--N to
gaseous N (N2, N2O) via anaerobic microbial behavior, and heterotrophic bacteria are the primary microorganisms of this process [31]. Nitrogen isotope fractionation is
Fig. 3. Triangular diagram of DIN in water bodies in the Fenhe River Basin.
Fig. 4. Relationships between δ18O -H2O versus δ18O -NO3- in
Fenhe River Basin water samples; the 3 lines represent the theory lines in different conditions.

2683Pollution Processes in Chinese Mining...
very significant in this process. Residual nitrates are significantly enriched in 18O and 15N compared to products of N2 and N2O. Moreover, nitrification and denitrification are the main controlling factors in the process of N cycling and N balance in ecological systems. Enrichment of 18O -NO3
- is found in some river water and reservoir water, which may have been affected by denitrification, bacterial respiration, or the evaporation effect of soil water and surface groundwater. In general, nitrification is the main source of nitrates in the Fenhe River Basin.
Identification of Nitrate Pollution Processes
Cl- can be used as an indicator to trace the changes of NO3
- concentrations under mixing processes and denitrification in surface water and groundwater. This is due to it being a conservative element in natural water environments. There is no significant correlation between NO3
- and Cl- due to the large variation of Cl- concentration in the study area. The high Cl- values in surface water and shallow groundwater could signify multi-anthropogenic sources. This is due to a rare halite weathering effect in the study area. The NO3
- concentrations of sewage, manure, and fertilizer collected in this study are 1.53±0.7 mmol/L, 0.71 ±0.13 mmol/L, and 0.15±0.12 mmol/L, respectively. The Cl- concentrations of sewage, manure, and fertilizer are 1.68 ±0.14 mmol/L, 2.37±0.11 mmol/L, and 0.11±0.05 mmol/L, respectively. Both NO3
- and Cl- concentrations of samples are low in the reservoir water samplings, which suggests that fertilizer is the main source of nitrate in the reservoir water due to the NO3
- and Cl- concentrations of the fertilizer being high. The Fenhe and Wenyuhe reservoirs are far away from human production and living areas, and human activities have less influence on water quality. Natural effects are far greater than anthropogenic influence. Atmospheric deposition and soil organic N are the key factors affecting water quality in this area. While in the urban living area, the NO3
-concentration is low and Cl- concentration
is high, which indicates that the domestic sewage discharged and livestock manures from local residents are the dominant sources due to domestic sewage, and livestock manures have been found with the higher Cl- and lower NO3
- concentrations. The water samplings from Taiyuan, Lingshi, and LinFen show a higher Cl- value and a lower NO3
- value, which indicates that NO3- sources
were mainly controlled by the large amount of sewage discharged from local residents. The industrial production area had a relatively low Cl- concentration but a high NO3
- concentration, which indicated that industrial sewage is the major factor controlling hydrochemical composition in these sampling sites. The water samples from Huozhou and Hejin have a relatively low Cl- value but a high NO3
- value, which indicates that industrial sewage is the major factor controlling hydrochemical composition in these sampling sites.
Different nitrate sources show evidence of their respective N isotopic characteristics. The δ15N of chemical fertilizers are -3.8-5‰, and this is mainly due to the atmospheric deposition N. δ15N values of domestic sewage and industrial sewage being 10-21‰, δ15N of soil organic N being 4-9‰, and δ15N of manure being 10-20‰ [32-33]. As Fig. 5 shows, the δ15N-NO3
- values of water bodies in the Fenhe River Basin are mainly plotted in 5 sectors: NO3
- in precipitation, nitrate fertilizer, soil organic N, manure, and sewage. Relevant research shows that NO3
- concentration and the isotopic composition of water bodies are significantly controlled by land use type and human activity [34-36]. The precipitation, soil organic N, chemical fertilizers, domestic sewage, and livestock manure samples in the study area were also selected in this study to examine the effects of different pollution sources on the isotopic composition of water bodies. The results are provided in Table 2.
Low NO3- concentration and low δ15N-NO3
- are found in reservoirs and upstream of the study area, which is due to less human activity. Compared to Table 2, the δ15N-NO3
- value upstream is within the limit values of precipitation and soil organic N in the study area, which indicated that NO3
- in precipitation and soil organic N are the major sources. The δ15N-NO3
- values are higher midstream and downstream than upstream, which indicated the characteristics of multiple pollution sources via soil organic N, fertilizer, manure, and sewage. This is due to the different land use types along the
Fig. 5. Relationships between δ15N-NO3- versus δ18O-NO3
- in the Fenhe River Basin; isotopic composition of various sources in the diagram were modified.
Nitrogen sources δ15N(‰) δ18O(‰) n
Chemical fertilizers -2.2~3.1 -3.2~16.7 6
Precipitation -1.9~8.3 18.1~68.7 14
Soil organic N 4.9~7.2 -2.8~11.4 11
Domestic sewage 7.1~11.4 -2.4~10.3 7
Livestock manure 11.7~17.6 -1.8~10.7 6
Table 2. Isotopic signature of some nitrogen source materials in the study area.
2684 Meng Z., et al.
riverbank. δ15N-NO3- values in midstream Fenhe River
and downstream tributaries are lower, which indicated that the river water has a certain self-purification capacity (such as microbial denitrification), and that nitrate sources are mainly controlled by fertilizers and soil organic N in these river branches. Related studies show that there are great differences between NO3
- concentrations and δ15N-NO3
- values among the different river inputs. Isotopic compositions of agricultural inputs are lower than those of urban and industrial pollution inputs. These results are in agreement with this study [37-39].
The NO3- concentration and δ15N-NO3
- value in shallow groundwater are similar to that of surface water, which indicated that there is a hydraulic association between surface water and shallow groundwater. On the other hand, NO3
- concentration and δ15N-NO3- value
in deep groundwater show obvious differences when compared to shallow groundwater and surface water. Pollution in deep groundwater is rarely found in the study area. Nitrate sources are mainly controlled by archaic precipitation. This phenomenon is the result of an obvious aquiclude barrier between deep groundwater and shallow groundwater. Owing to this, hydraulic connections could rarely be found between them.
Conclusions
We discussed the hydrological and pollution processes in this study using hydrochemical and multiple isotope methods. The following conclusions can be drawn from the present study: Precipitation is the main source of water in the study area, and there is an obvious isotopic fractionation caused by evaporation. Values of δD and δ18O in tributaries are generally higher than in the main stream, and they decreased along with the direction of river flow. Deep groundwater is significantly less affected by evaporation and human activity, which is recharged by archaic groundwater. Results from d-excess indicated that the reservoir water, river water, soil water, and shallow groundwater had a mutual recharge and discharge association. NO3
- is the main N species in the study area, and 46.2% of NO3
--N concentrations exceeded the drinking water standard of China (NO3
--N≤10mg/L). It must be noted that these concentrations have already endangered the health of local residents of the area.
Values of 15N-NO3- and 18O-NO3
- indicated that nitrification is the main source of NO3
-. On the other hand, denitrification is also found in some river branches. Sources of NO3
- are mainly controlled by land use type along the riverbank. Nitrogen in precipitation and soil organic N are the major sources of NO3
- in the upstream. The midstream area is mainly polluted by manure and sewage, the downstream area is polluted by a mixture of soil organic N and fertilizers. There is a hydraulic association between surface water and shallow groundwater. Deep groundwater is rarely polluted in the study area, and NO3
- is mainly controlled by archaic precipitation, which indicates that there is an obvious
aquiclude between shallow groundwater and deep groundwater.
Acknowledgements
This work was supported by the National Natural Science Foundation of China (41390464), the China Postdoctoral Science Foundation Funded Project (2014M550095), and the Science and Technology Major Projects of Shanxi Province (20121101011). The authors are grateful to the experimental research station and all participants in the field for their contributions to the progress of this study. We also express our appreciation to the anonymous reviewers of the manuscript.
References
1. NESTLER A., BERGLUND M., ACCOE F., DUTA S., XUE D., BOECKX P., TAYLOR P. Isotopes for improved management of nitrate pollution in aqueous resources: review of surface water field studies. Environment Science & Pollution Research 18 (4), 519, 2011.
2. XUE D., DE B.B., VAN C.O., HENNESSY C., BERGLUND M., BOECKX P. Classification of Nitrate Polluting Activities through Clustering of Isotope Mixing Model Outputs. Journal of Environment Quality 42 (5), 1486, 2013.
3. KEELER B. L., POLASKY S. Land-use change and costs to rural households: a case study in groundwater nitrate contamination. Environmental Research Letters 9 (7), 074002, 2015.
4. TOBARI Y., KOBA K., FUKUSHIMA K. TOKUCHI N., OHTE N., TATENO R., TOYODA S., YOSHIOKA T., YOSHIDA N. Contribution of atmospheric nitrate to stream-water nitrate in Japanese coniferous forests revealed by the oxygen isotope ratio of nitrate. Rapid Communications in Mass Spectrometry Rcm 24 (9), 1281, 2010.
5. GUPTA S. K., GUPTA R. C., SETH A. K., GUPTA A. B., BASSIN J. K., GUPTA A. Methaemoglobinaemia in areas with high nitrate concentration in drinking water. National Medical Journal of India 13 (2), 58, 2016.
6. WHO (World Health Organization). Guidelines for drinking water quality, Recommendations. Geneva, World Health Organization 124, 1993.
7. HUANG L., WEN X. Temporal variations of atmospheric water vapor δD and δ18O above an arid artificial oasis cropland in the Heihe River Basin. Journal of Geophysical Research Atmospheres 119 (19), 456, 2015.
8. LIU J., SONG X., YUAN G., SUN X., YANG L. Stable isotopic compositions of precipitation in China. Tellus Series B-chemical & Physical Meteorology 66 (66), 39, 2014.
9. WU H., ZHANG X., LI X., LI G., HUANG Y. Seasonal variations of deuterium and oxygen-18 isotopes and their response to moisture source for precipitation events in the subtropical monsoon region. Hydrological Processes 29 (1), 90, 2015.
10. CRAIG H. Isotopic Variations in Meteoric Waters. Science 133 (3465), 1702, 1961.
11. BERSHAW J., PENNY S.M., GARZIONE C.N. Stable isotopes of modern water across the Himalaya and eastern Tibetan Plateau: Implications for estimates of

2685Pollution Processes in Chinese Mining...
paleoelevation and paleoclimate. Journal of Geophysical Research Atmospheres, 117 (D2), 2110, 2012.
12. PANF Z.H., KONG Y.L., Froehlich K, HUANG T.M., YUAN L.J., LI Z.Q., WANG F.T. Processes affecting isotopes in precipitation of an arid region. Tellus 63 (3), 352, 2011.
13. PENG T., CHEN K., ZHAN W., Lu W., TONG L.J. Use of stable water isotopes to identify hydrological processes of meteoric water in Montane catchments. Hydrological Processes 29, 4957, 2015.
14. KENDALL C., COPLEN T.B. Distribution of oxygen-18 and deuterium in river waters across the United States. Hydrological Processes 15, 1363, 2001.
15. AMIRI H., ZARE M., WIDORY D. Assessing sources of nitrate contamination in the Shiraz urban aquifer (Iran) using the δ15N and δ18O dual-isotope approach. Isotopes in Environmental & Health Studies 51 (3), 392, 2015.
16. WASSENAAR, L., ATHANASOPOULOS P., HENDRY, M.J. Isotope hydrology of precipitation, surface and ground waters in the Okanagan Valley, British Columbia, Canada. Journal of Hydrology 411, 37, 2011.
17. SHAO W.W., CAI J.Y., LIU J.H., LUAN Q.H., MAO X.M, YANG G.Y., WANG J.H., ZHANG H.X., ZHANG J. Impact of Water Scarcity on the Fenhe River Basin and Mitigation Strategies. Water 9, 30, 2017.
18. YANG Y.G., XIAO H.L., QIN Z.D., ZOU, S.B. Hydrogen and oxygen isotopic records in monthly scales variations of hydrological characteristics in the different landscape zones. Journal of Hydrology 499, 124, 2013.
19. YANG Y.G., XIAO H.L., WEI Y.P., ZHAO L.J., ZOU S.B., YANG Q., YIN Z.L. Hydrological processes in the different landscape zones of alpine cold regions in the wet season, combining isotopic and hydrochemical tracers. Hydrological Processes 26 (10), 1457, 2012.
20. YURTSEVER, Y. GAT., J.R. COPLEN, TYLER. Stable Isotope Hydrology: Deuterium and Oxygen-18 in the Water Cycle. Eos Transactions American Geophysical Union 63, 45, 861, 1982.
21. DANGSGAARD W. Stable isotopes in precipitation. Tellus 16 (4), 436, 1964.
22. XING M., LIU W.G. Using dual isotopes to identify sources and transformations of nitrogen in water catchments with different land uses, Loess Plateau of China. Environment Science & Pollution Research 23, 388, 2016.
23. YUE F.J., LIU C.Q., LI S.L., ZHAO Z.Q., LIU X.L., DING H., LIU B.J., ZHONG J. Analysis of δ15N and δ18O to identify nitrate sources and transformations in Songhua River, Northeast China. Journal of Hydrology 519, 329, 2014.
24. YUE F.J., LI S.L., LIU C.Q.,ZHAO Z.Q., HU J. Using dual isotopes to evaluate sources and transformation of nitrogen in the Liao River, Northeast China. Applied Geochemistry 36 (2013), 1, 2013.
25. YUE, F.J., LIU, X.L., LI, J., ZHU Z., WANG Z. Using Nitrogen Isotopic Approach to Identify Nitrate Sources in Waters of Tianjin, China. Bulletin of Environment Contamination and Toxicology 85, 562, 2010.
26. LI R., MERCHANT J.W., CHEN X.H., A geospatial approach for assessing groundwater vulnerability to nitrate contamination in agricultural settings. Water Air & Soil Pollution 225, 1, 2014.
27. KENDALL C., ELLIOTT E.M., WANKEL S.D. Tracing Anthropogenic Inputs of Nitrogen to Ecosystems. Stable Isotopes in Ecology and Environmental Science, Second Edition. 2008.
28. SHANG F., REN S., YANG P., LI C., MA N. Effects of Different Fertilizer and Irrigation Water Types, and Dissolved Organic Matter on Soil C and N Mineralization in Crop Rotation Farmland. Water Air & Soil Pollution 226 (12), 396, 2015.
29. LI S.L., LIU C.Q., LI J., LIU X., CHETELAT B., WANG B., WANG F. Assessment of the sources of nitrate in the Changjiang River, China using a nitrogen and oxygen isotopic approach. Environmental Science & Technology 44 (5), 1573, 2017.
30. WEXLER S.K., HISCOCK K.M., DENNIS P.F. Microbial and hydrological influences on nitrate isotopic composition in an agricultural lowland catchment. Journal of Hydrology s 468–469 (s 468–469), 85, 2012.
31. BURT T.P., MATCHETT L.S., GOULDING K.W.T., WEBSTER C.P., HAYCOCK N.E. Denitrification in riparian buffer zones: the role of floodplain hydrology. Hydrological Processes 13 (10), 1451, 2015.
32. KOHL D.H., COMMONER B. Fertilizer nitrogen: contribution to nitrate in surface water in a Corn Belt watershed. Science 174 (4016), 1331, 1971.
33. GAOUZI F.Z.J.E., SEBILO M., RIBSTEIN P., PLAGNES V., BOECKX P., XUE D.M., DERENNE S., ZAKEOSSIAN M. Using δ15N and δ18O values to identify sources of nitrate in Karstic Springs in the Paris Basin (France). Applied Geochemistry 35 (3), 230, 2013.
34. MATIATOS I. Nitrate source identification in groundwater of multiple land-use areas by combining isotopes and multivariate statistical analysis: A case study of Asopos basin (Central Greece). Science of the Total Environment 541, 802, 2016.
35. OHTE, N., TAYASU, I., KOHZU, A., YOSHIMIZU C., OSAKA K., MAKABE A., KOBA K., YOSHIDA N., NAGATA T. Spatial distribution of nitrate sources of rivers in the Lake Biwa Basin, Japan: controlling factors revealed by nitrogen and oxygen isotope values. Water Resources Research 48, 1, 2010.
36. BARNES R.T., RAYMOND P.A. Land-use controls on sources and processing of nitrate in small watersheds: insights from dual isotopic analysis. Ecological Application A Publication of the America 20 (7), 1961, 2010.
37. JOHANNSEN A, DAHNKE K, EMEIS K. Isotopic composition of nitrate in five German rivers discharging into the North Sea. Organic Geochemistry 39 (12), 1678, 2008.
38. SACCON P., LEIS A., MARCA A., KAISER J., CAMPISI L., BOTTCHER M.E., SAVARINO J. ESCHER P., EISENHAUER A., ERBLAND J. Multi-isotope approach for the identification and characterisation of nitrate pollution sources in the Marano lagoon (Italy) and parts of its catchment area. Applied Geochemistry 34 (4), 75, 2013.
39. WIDORY D., PETELET-GIRAUD E., BRENOT A., BRONDERS J., TIREZ K., BOECKX P. Improving the management of nitrate pollution in water by the use of isotope monitoring: the δ15N, δ18O and δ11B triptych. Isotopes Environ Health Study 49 (1), 29, 2013.