Embed Size (px)
Citation preview

d OAK RIDGE
~ NATIONAL LABORATORY
L O C K H E E D M A R T I N *i
YNAGEDAHDOPERATEDBY LOCKHEED UARTlN ENERGY RESEARCH CORPORATION FOR THE UNllED STATES DEPMrmENT OF ENERGY
ORNWM-13238
Portsmouth X300 Remote Assay Mo n it or System
D. E. Smith
DISTRIBbrlON OF THIS DOCUMENT IS UNLIMITE I

This report has been reproduced directly from the best available copy.
Available to DOE and DOE contractors from the Office of Scientific and Technical Information, P. 0. Box 62, Oak Ridge, TN 3783 I : prices available from (423) 576-840 I , FTS 626-840 1 .
Available to the public from the National Technical Information Service, U.S. Department of Commerce, 5285 Port Royal Road, Springfield. VA 22161.
This report was prepared as an account of work sponsorcd by an agency of the United States Government. <Neither the United States Government nor any agency thereof, nor any of their employees. makcs any warranty, express or implied, or assumes any legal liability or responsibility for the accuracy, completeness, or usefulness of any information, apparatus, product, or process disclosed. or represents that its use would not infringe privately owned rights. Reference herein to any specific commercial product, process, or service by trade name. trademark. manufacturer, or otherwise, does not necessarily constitute or imply its endorsement, recommendation, or favoring by the United States Government or any agency thereof. The views and opinions of authors expressed herein do not necessarily state or reflect those of the United States Government of anv agency thereof.

0RNIJT.M-13238
Instrumentation and Controls Division
PORTSMOUTH B O O REMOTE ASSAY MONITOR SYSTEM
D. E. Smith
Date Published-July 1996
Prepared by OAK RIDGENATIONAL LABORATORY
Oak Ridge, Tennessee 37831-6285 managed by
LOCJSHEED MARTIN ENERGY RESEARCH COW. for the
U.S. DEPARTMENT OF ENERGY under contract DE-ACO5-96OR22464

DISCLAIMER
Portions of this document may be illegible in electronic image products. Images are produced from the best available original document.

CONTENTS
ABSTRACT ..................................................................................................................................... v
1 . INTRODUCTION ....................................................................................................................... 1
2 . FUNCTIONAL OVERVIEW ..................................................................................................... 3
. ............................................................................................................. 3 SYSTEM HARDWARE 4 3.1 PERSONAL COMPUTER .................................................................................................. 4 3.2 SERIAL COMMUNICATIONS .......................................................................................... 4
4 . SYSTEM SOFTWARE ............................................................................................................... 5 4.1 SYSTEM AND SUPPORT FILES ...................................................................................... 5 4.2 MAIN PROGRAM .............................................................................................................. 5 4.3 INITIALIZATION FILE ...................................................................................................... 5
5 . OPERATOR INTERFACE ......................................................................................................... 7 5.1 MAIN SCREEN ................................................................................................................... 7 5.2 STATUS CONTROL SCREEN ........................................................................................... 8 5.3 MONITOR SCREEN ........................................................................................................... 9 5.4 CYLINDER PLOT SCREFN ............................................................................................ 10
6 . PRINTER OUTPUT .................................................................................................................. 12
7 . BIBLIOGRAPHY ..................................................................................................................... 13
iii
.. --_. . .


ABSTRACT
Personnel in the Instrumentation and Controls Division at Oak Ridge National Laboratory ( O W ) in association with the United States Enrichment Corporation (USEC) have recently developed a system for monitoring and tracking the assay of enriched uranium from the production facilities at the Portsmouth Gaseous Diffusion Plant (PORTS). This work was sponsored by the USEC and has involved the expansion and improvement of an existing system that was developed by ORNL. The system provides control room operators with real-time information on the withdrawal operations of uranium hexafluoride at the withdrawal stations at PORTS. An additional system was developed to display the real-time information from each of the three withdrawal stations at a remotely located building. This report describes the remote assay monitor and display system that has been developed and installed at PORTS Building moo.
V

1. INTRODUCTION
The United States Enrichment Corporation (USEC) controls two uranium enrichment facilities that produce enriched uranium for both military and commercial use. The process requires both feed and withdrawal operations. The withdrawal process requires both product (enriched uranium) withdrawal stations and tails (depleted uranium) withdrawal stations. A previous prototype system, “X-330 Tails Cylinder Assay Monitor,” was developed as a demonstration for the tails withdrawal station at the Portsmouth Gaseous Diffbsion Plant (PORTS). The prototype system was done in response to potential problems with the original method for determining the hourly weighted assay averages that are used to calculate the final weighted assay of the cylinder. In the original method the 235U assay of uranium hexaflouride withdrawn from the PORTS cascade into tails cylinders is determined every 5 min by measurements from an in-line assay mass spectrometer ( M S ) . An average value for a l-h period is then calculated by area control room personnel and assigned to the accumulated weight in the cylinder for the period. A potential problem with this method is that cylinder weight is not automatically recorded as often as the assay. The assay and withdrawal rate can both vary during the given period. This variation results in inaccuracies in the hourly weighted assays that are used to calculate the final weighted assay of the cylinder. Laboratory analysis is considered to be the most accurate method for determining the final cylinder assay; however, the cost and safety considerations of redundant cylinder handling limit the number of cylinders sampled to less than 10%.
statistical1 significant bias, which could result in a potential cumulative effect on the calculated cascade 23% inventory, existed in the 235U assay assigned to the tails cylinders. The prototype system “X-330 Tails Cylinder Assay Monitor” was developed to improve and automate the process by tracking both MS assay values and cylinder weights during the filling of tails cylinders. This system was a demonstration system that allowed the operator to monitor only the filling of one cylinder position at a time. The system was installed in area control room two (ACR-2) in X330 in June 1991. The system was evaluated by PORTS Operations personnel over the next 2 years. As a result of the demonstration system, PORTS Operations personnel requested the development of a new system with increased capabilities and design requirements. The new system would be considered as a product cylinder assay monitor system that would be used at both the tails and the product withdrawal stations.
system was installed in June 1994. The new system uses a single software package for all the withdrawal stations. The new system uses the concepts of the prototype demonstration system; however, the new system was redesigned to include many new requirements. Several of the new requirements included
An analysis of data from the PORTS liquid sampling program in 1990 indicated that a
Development of a product cylinder assay monitor system was started in June 1993, and the
1. product withdrawal monitoring, 2. tracking and recording the total weight and assay fed into cylinders located on any of four
3. simultaneous monitoring of two active scale positions, 4. operator selectability of one of three possible assay mass spectrometers to an active scale
possible scale positions,
position,
1

5. a status control screen that shows status mode and relevant cylinder information for all four
6. operator selectability of one of four different types of scales for each position, 7. manual entry of data during periods of MS failure, and 8. allowing for negative flow rates fiom the cylinders.
scale positions,
Development of a remote monitoring and display system was started in July 1994. The remote system communicates with each of the three withdrawal stations: Tails, Enriched Reactor Product (ERP), and Low Assay Withdrawal (LAW), to provide withdrawal operations information at a remote building. The remote system required not only the development of another system, but also required enchancements to the withdrawal station software that allow each withdrawal station to send data to the remote system. The remote system provides the operator with all the withdrawal information in real-time from d l on-line positions from the three withdrawal stations. The remote syst6m was installed in March 1995 in PORTS Building X300.

2. FUNCTIONAL OVERVIEW
The remote assay monitor system communicates by a serial communication link with each withdrawal station assay monitor system. The remote assay monitor system displays the information from the withdrawal stations in the same manner as withdrawal stations assay monitoring systems. This configuration allows one remote assay monitoring system to display in real-time the assay monitoring withdrawal information from up to three different withdrawal stations. An overview of the withdrawal station assay monitoring system follows.
The withdrawal station assay monitor system monitors and records the total weight and assay of the UFs fed into cylinders at the withdrawal station. Each withdrawal station requires one complete cylinder assay monitor system. The system can monitor up to three different MSs and interface to a total of four weigh-scale positions. The system allows for the simultaneous monitoring of two on-line positions. The withdrawal station operator selects the MS and the scale position to be monitored before the cylinder is placed on-line. The system starts to monitor and display the withdrawal information for the selected position after the operator places the position on-line. The system requests a weight reading from the weigh scale each time an assay value is received (about every 5 min) from the MS that is associated with an on-line position. The weight difference of the cylinder during the time period between two latest assay values is determined. The weight difference and the last assay value are then used to calculate the weight increase of the fissionable portion. This method helps to maintain the value of the continuous weighted assay of the cylinder contents.
information for each of the four possible scales, only two cylinders at a time can be monitored as they fill. The four possible status modes for cylinders are defined as follows:
Although the withdrawal assay monitoring system maintains status and cylinder content
ON-LME - for a cylinder currently being filled STANDBY - for a cylinder waiting to go on-line or cooling
and awaiting final weighing EMPTY - for an empty position DEAD - for no scale position or a position with a
nonelectronic scale
The withdrawal assay monitoring system allows two cylinders to be monitored on-line simultaneously. Any or all positions can be simultaneously in standby or empty.
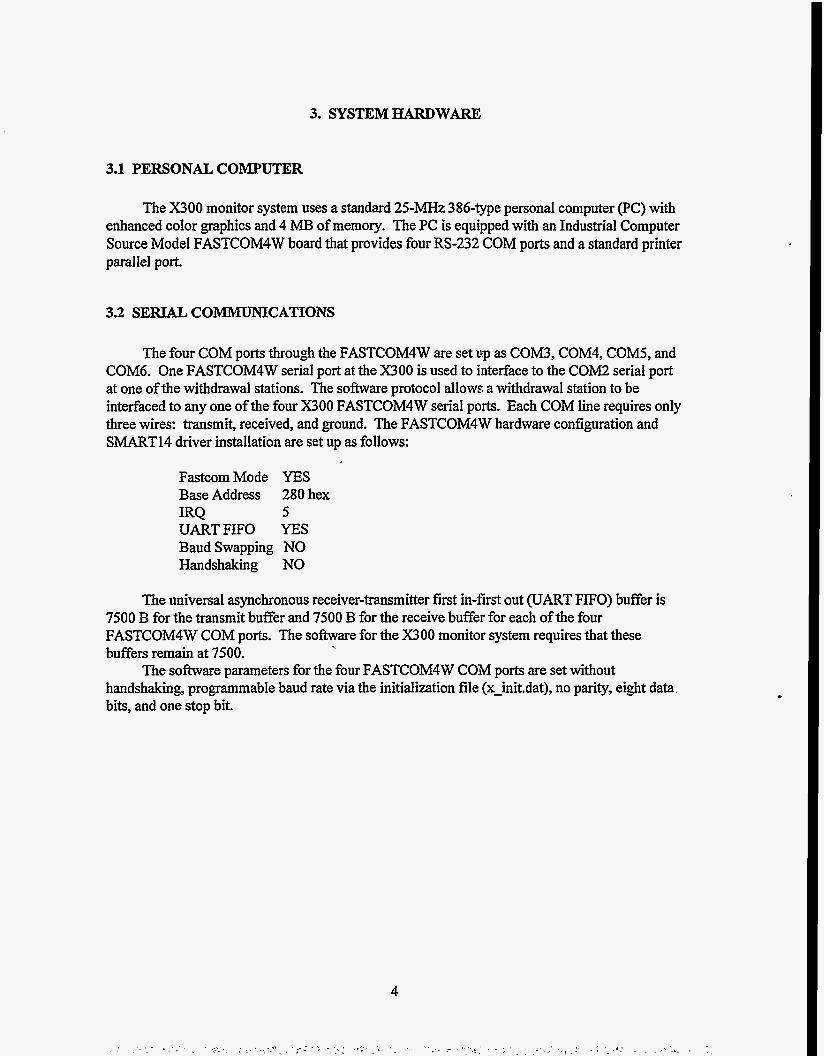
3. SYSTEMHARDWARE
3.1 PERSONAL COMPUTER
The B O O monitor system uses a standard 25-MHz 386-type personal computer (PC) with enhanced color graphics and 4 MB of memory. The PC is equipped with an Industrial Computer Source Model FASTCOM4W board that provides four RS-232 COM ports and a standard printer parallel port.
3.2 SERIAL COMMUNICATIONS
The four COM ports through the FASTCOM4W are set up as COM3, COM4, COM5, and COM6. One FASTCOM4W serial port at the X300 is used to interface to the COM2 serial port at one of the withdrawal stations. The software protocol allows a withdrawal station to be interfaced to any one of the four B O O FASTCOM4W serial ports. Each COM line requires only three wires: transmit, received, and ground. The FASTCOM4W hardware configuration and SMART14 driver installation are set up as follows:
FastcomMode YES Base Address 280 hex
UARTFIFO YES Baud Swapping NO Handshaking NO
IRQ 5
The universal asynchronous receiver-transmitter first in-ikst out WART FIFO) buffer is 7500 B for the transmit buffer and 7500 B for the receive buffer for each of the four FASTCOM4W COM ports. The software for the B O O monitor system requires that these buffers remain at 7500.
The software parameters for the four FASTCOM4W COM ports are set without handshaking, programmable baud rate via the initialization file (x-init.dat), no parily, eight data bits, and one stop bit.
4

4. SYSTEMSOFTWARE
The X300 monitor PC operates under DOS 6.0 or higher. The X300 monitor custom s o h a r e is written in compiled C using Microsoft C Compiler version 6. The COM3, COM4, COM5, and COM6 serial ports are controlled by the Microsoft C routines through the Industrial Computer Source SMART14 driver for the FASTCOM4W multiplexer board. The C source routines were compiled in the large memory model mode and then linked to form the executable file, "x300.exe."
4.1 SYSTEM AND SUPPORT FlLES
The SMART14 driver for the FASTCOM4W was built according to the manufacturer's installation routine using the parameters listed in Sect. 3.2, Serial Communications. The SMART14 driver is loaded in the autoexec.bat file. The library "asy-mcl" is required during the linking of the X300 monitor C routines.
4.2 MAINPROGRAM
Starting the X300 monitor software from DOS requires more than just the "x3OO.exe" file. Prior to loading the main program, "smartl4.exe" must be run to set up the FASTCOM4W driver. This driver setup is usually done from the "autoexec.bat" at the time the system is booted. When the "x300.exe" is loaded, it requires access to two other files that must be in the same directory. These files are the Microsoft font file "tmsrb.fon" and the initialization file ck-init.dat.yy
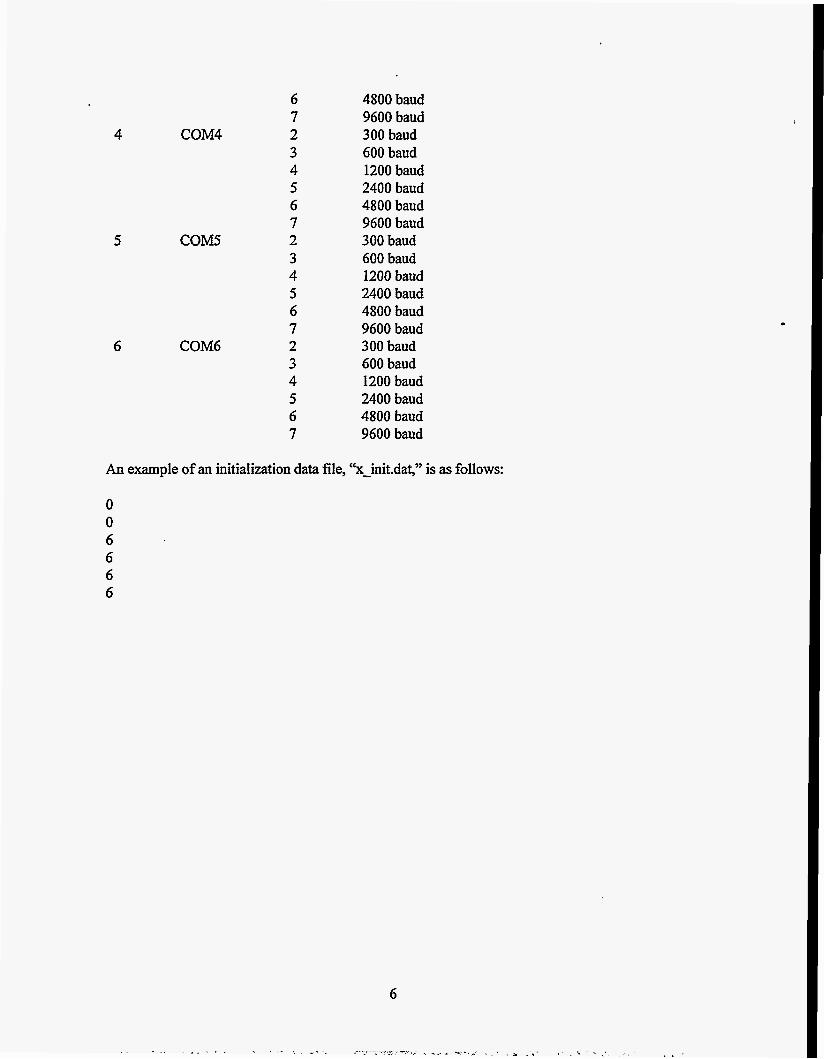
4.3 INITLALIZATION FILE
The initialization data file 'k-init.dat" preloads parameter values for the main program "x300.exe." The main program requires that a value be placed in each line. The "x-init.dat" file is an ASCII file that can be edited by an ASCII editor. The 'k-init.dat" file for the 'k300.exe" is as follows:
m 1
2
3
b)escription Value Plant ID 0
1 Default Screen 0 after the 1 Main Screen 2 cow 2
3 4 5
Explanation Portsmouth Paducah Monitor Screen Cylinder Plot Screen Status Control Screen 300 baud 600 baud 1200 baud 2400 baud
5
6 7
4 COM4 2 3 4 5 6 7
5 COM5 2 3 4 5 6 7
6 COM6 2 3 4 5 6 7
4800 baud 9600 baud 300 baud 600 baud 1200 baud 2400 baud 4800 baud 9600 baud 300 baud 600 baud 1200 baud 2400 baud 4800 baud 9600 baud 300 baud 600 baud 1200 baud 2400 baud 4800 baud 9600 baud
An example of an initialization data file, ‘’x-init.dat,” is as follows:

5. OPERATOR INTERFACE
The B O O monitor system is designed to display the withdrawal operations from up to three remote withdrawal stations. The X300 monitor system provides the same on-line information as the assay monitor system does at the withdrawal station. The information from a withdrawal station is displayed in real time providing that the communication lines are operational. Several operator selectable displays are used to present both graphical and textual information. Four display screens are used to relate cylinder and scale position information to the operator. All of the measured and calculated values are determined by the assay monitor system at the withdrawal station. The values are then sent in real time from the withdrawal station to the X300 monitor system.
5.1 MAINSCREEN
The Main Screen (see Fig. 5.1) appears when the system s o h a r e is initially loaded. The Main Screen displays three columns, with each column representing one withdrawal station, TAILS, ERP, and LAW. If the assay monitor system at a withdrawal station is not operational or
7
if a communication failure exists, then the message '?\Tot Responding" appears in the column for that withdrawal station. Four boxes appear in the column for a withdrawal station once an assay monitor system at a withdrawal station becomes operational and establishes communication with the X300 monitor system. The four boxes represent the four scale positions at the withdrawal station and are labeled with a position number and a function key. If a scale position is on-line, the corresponding box is highlighted; otherwise, the background in the box is black. The operator selects the function key for the highlighted on-line position to vlew the information for that position. The default screen, as programmed by the initialization file, appears for the selected on-line position. When the <EsC> key is pressed, the X300 monitor system program is terminated and the PC returns to DOS.
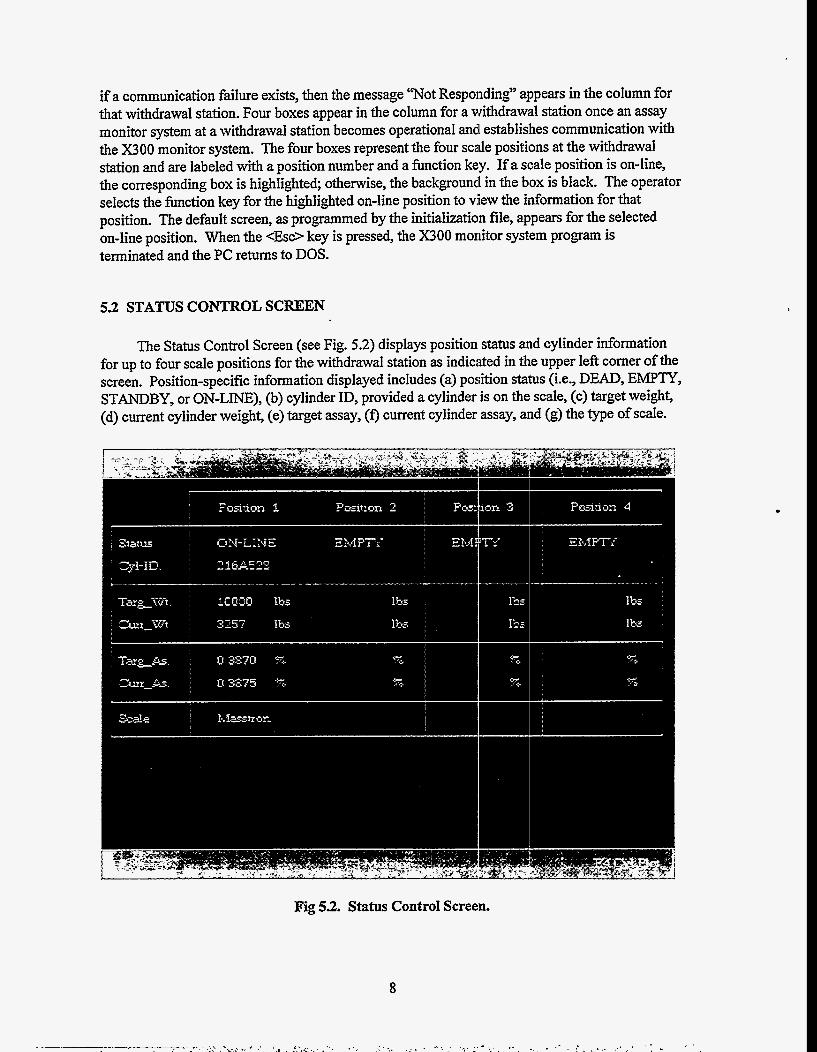
5.2 STATUS CONTROL SCREEN
The Status Control Screen (see Fig. 5.2) displays position status and cylinder information for up to four scale positions for the withdrawal station as indicated in the upper left corner of the screen. Position-specific information displayed includes (a) position status (Le., DEAD, EMPTY, STANDBY, or ON-LINE), (b) cylinder ID, provided a cylinder is on the scale, (c) target weight, (d) current cylinder weight, (e) target assay, (0 current cylinder assay, and (g) the type of scale.
Fig 5.2. Status Control Screen.
8
I' ,* 1

The following actions are taken when a function key at the bottom of the screen is pressed:
<F1> Main-transfers control to the Main Screen <F3> Monitor-transfers control to the Monitor Screen <F4> Cyl.Plot-transfers control to the Cylinder Plot Screen
5.3 MONITOR SCREEN
The Monitor Screen (see Fig. 5.3) is the primary display that is used to keep control room operators informed on the current withdrawal operation at the specified withdrawal station. A strip-chart type plot of the withdrawal assay over the past 2 h occupies most of the center of the display. This plot is displayed and kept updated on this screen only during an active on-line cylinder fill operation. The "Mass Spec:" above the strip chart indicates the mass spectrometer (MS) assigned to the position. The color of the strip chart is normally red, indicating a positive fill rate. The color of the strip chart is yellow in the case of product being withdrawn from a cylinder, indicating a negative fill rate. In the case of a negative fill rate, the last value of the weighted assay before the fill rate started going negative is used in the data calculations that are sent from the withdrawal station.
Fig. 53. Monitor Screen.
9
Several other measured and calculated values are also displayed when a position is on-line. To the left side of the display is a fill level indicator, which shows the percent of the target weight already filled. The' color of the fill level indicator is normally blue, indicating a positive fill rate. A yellow color for the fill level indicates a negative fill rate. To the right of the strip chart is a numerical assay range scale with the target value shown in red. To the right of the assay range scale are two pointers. The blue pointer indicates the current assay of the cylinder. A numerical value is also displayed in blue above the assay range scale. The: green pointer indicates the needed assay to achieve the target assay for the target weight ofthe full cylinder. A numerical value is also displayed in green at the top of the range scale. A numerical value for the predicted assay is displayed in yellow below the assay range. The predicated assay value indicates the assay value of the target weight of the full cylinder, assuming that the feed will remain at the last assay read by the MS. A numerical value for the latest assay value received from the MS is located below the predicted assay value. Below the left side of the strip chart are displayed the hourly average of the assay value and the 30-min average of the: assay value.
There are seven data boxes on the right side of the disp1a;y. The "Cylinder No." is the label assigned to the cylinder as well as the "Target Wt." The "Current Wt." is updated when the assay value is received by the withdrawal station and sent to the B O O system. The "Fill Rate" is calculated based on the time interval between readings every time an assay and weight measurement are obtained, starting after the second reading. The "Until Fill" projects the time remaining to fill the cylinder based on the current fill rate and target weight. The "MS Bias" shows the current correction factor, if any, added to all the readings from the assigned mass spectrometer. The "MS Tolerance" is the tolerance or allowed deviation from the last reading. Any unacknowledged out-of-tolerance assay values will show up above the strip chart as "Tol. UnAck" with the count.
The bottom portion of the Monitor Screen displays the operator function keys. The following actions are taken when a function key at the bottom of the screen is pressed:
<F1> Main-transfers control to the Main Screen 4%- Control-transfers control to the Status Control Screen <F4> CylSlot-transfers control to the Cylinder Plot Screen <F5> Span(+)-increases the scaling on the assay plot <F6> Span(-wecreases the scaling on the assay plot
5.4 CYLINDER PLOT SCREEN
The Cylinder Plot Screen (see Fig. 5.4) is a plot of the weighted assay of the on-line cylinder vs weight. The upper left comer of the screen indicates the withdrawal station. The center of the top portion of the screen indicates the on-line posi.tion. As the cylinder fills, the assay line in green progresses across the cylinder plot chart. The weight range on the horizontal axis is based on the target weight for the cylinder. The plot chart will display up to 100 data points. The resolution of each data point is 1% of the target weight. The assay range on the vertical axis is the same as on the assay plot on the Monitor Screen and can be temporarily increased or decreased with the function keys <F5> or <F6>. The position number is shown above the vertical axis. The bottom portion of the Cylinder Plot Screen displays the operator
10

Fig. 5.4. Cylinder Plot Screen.
function keys. The following actions are taken when a function key at the bottom of the screen is pressed:
<F1> Main-transfers control to the Main Screen <F2, Control-transfers control to the Status Control Screen <F3> Monitor-transfers control to the Monitor Screen <F5> Span(+)-imcreases the scaling on the plot <F6> Span(-wecreases the scaling on the plot .
11

6. PRINTEROUTPUT
A continuous feed printer connected to the PC port LPTl is used to record certain statistical and event data. The printer output shows data for any ON-LINE position for each of the three withdrawal stations provided the communication interface is operating properly. The output is printed in three columns, which represent the three withdrawal stations: Tails, ERP, and LAW. Each column is formatted with the withdrawal station (T for Tails, E for ERP’ and L for LAW) and position, a time stamp, and the assay value. MHA (mass spectrometer hourly average) indicates that the assay value is an hourly average from the mass spectrometer. CHA (calculated hourly average) indicates that the assay value is an hourly average that was calculated by the withdrawal stations’ assay monitor system. Below is an example of the printer output:
T1 09:42 0.3578 T1 09:46 0.3574 T1 0950 0.3571 T1 0954 0.3577 T1 0958 0.3568 T1 1O:OO 0.3570 MHA T1 1O:OO 0.3575 CHA T1 10:02 0.3574
T1 10:06 0.3571 E2 10:02 0.3872
E2 10:06 0.3880 L1 10:07 0.3431
T1 1O:lO 0.3579 E2 1O:lO 0.3872
L1 1O:ll 0.3436 T1 10:14 0.3584
7. BIBLIOGRAPHY
CastIeberry, K. N., X-330 Tails Cylinder Assay Monitor, WETO-72, Oak Ridge K-25 Site, 1991.
Smith, D. E., Withdrawal Assay Monitoring at US. Enrichment Facilities, ORNL/TM-13 138, Oak Ridge National Laboratory, January 1996.


ORNL/TM-13238
1-5. D. E. Smith 6. G. T. Alley 7. B.G.Eads 8. R.A.Hess 9. J. M. Jansen 10. D. W. McDonald 11. G. N. Miller 12. J. D. White 13. R. E. Uhrig 14. J. 0. Stiegler 15. K. N. Castleberry 16. D. A. Clayton 17. J. A. Adkins 18. G. T. Cook 19. J. W.Deck
20-21. C. J. Deffenbaugh
INTERNAL DISTRIBUTION
22. J. D. Draher 23. C. F. Harley 24. M. M. Hibdon 25. W. E. Landrum 26. C. J. Mine 27. D. W. Rigdon 28. C. W. Sheward 29. K. D. Stratemeyer 30. D. L. Weishaar 31. J.B.Wood 32. P. R. Wooldridge
33-37. K. J. Yarbrough 38. Central Research Library 39. Y-12 Technical Reference Section 40. Laboratory Records-Record Copy 41. I&C Division Publications Office
EXTERNAL DISTRIBUTION
42. L. Ewing, United States Enrichment Corporation, Two Democracy Center, 6903 Rockledge Drive, Bethesda, MD 208 17
43. W. Jordan, United States Enrichment Corporation, Two Democracy Center, 6903 Rockledge Drive, Bethesda, MD 20817
44-45. Office of Scientific and Technical Information, U.S. Department of Energy, P.O. Box 62, Oak Ridge, TN 3783 1
15