Embed Size (px)
Citation preview
5/2/08 1:34 PMPicoScope Oscilloscope Software
Page 1 of 8http://www.picotech.com/picoscope-oscilloscope-software.html
PicoScope software enables Pico Technology products to be used as a variety of instruments. It is
supplied free of charge with Pico oscilloscope and data acquisition products, and updates can be
downloaded for free.
Main functions
Oscilloscope
Spectrum Analyser
XY Scope
Meter
Measurements
Features
PicoScope’s features include:
Multiple views of the same signal (scope, analyzer and meter)
Add test menus to automate common tasks
Save settings for multiple tests and experiments
Waveforms can be annotated, saved and printed
Data can be exported to other applications for further analysis
Automated parameter measurements (rise time, duty cycle, etc)
Advanced display and trigger modes capture infrequent events
Zoom function for increased detail
Custom ranges to display data in other units such as dB
Add rulers to show exact values
Pico
Technology
Oscilloscope and Spectrum Analyser Software
5/2/08 1:34 PMPicoScope Oscilloscope Software
Page 2 of 8http://www.picotech.com/picoscope-oscilloscope-software.html
Autosetup function to automatically set up the scope to display any signals that it finds on the oscilloscope’s inputs
English, French, German, Italian, Spanish and Swedish versions
Free updates available from our website
Compatible with Microsoft Windows 98SE, ME, 2000 and XP
(a 16-bit version of PicoScope is available for Windows 3.1 and DOS users)
Download your free copy of PicoScope oscilloscope software to see for yourself just how good it is.
Oscilloscope
The real time digital storage oscilloscope (DSO) combines all the functionality of a traditional ‘benchtop’ scope with the benefits of a
PC. Regular scope users will feel at home with the usual timebase, trigger options, etc, but will welcome the advantages of other useful
features.
A number of display modes are available in PicoScope for reducing noise, capturing one-off glitches, and highlighting signal jitter. A
chart recorder option is included to trend slowly changing signals.
Trigger options include a ‘save to disk’ mode which makes tracking down elusive intermittent faults easy. The ability to save waveforms
means service engineers can have a library of waveforms on disk showing working instruments and likely faults.
5/2/08 1:34 PMPicoScope Oscilloscope Software
Page 3 of 8http://www.picotech.com/picoscope-oscilloscope-software.html
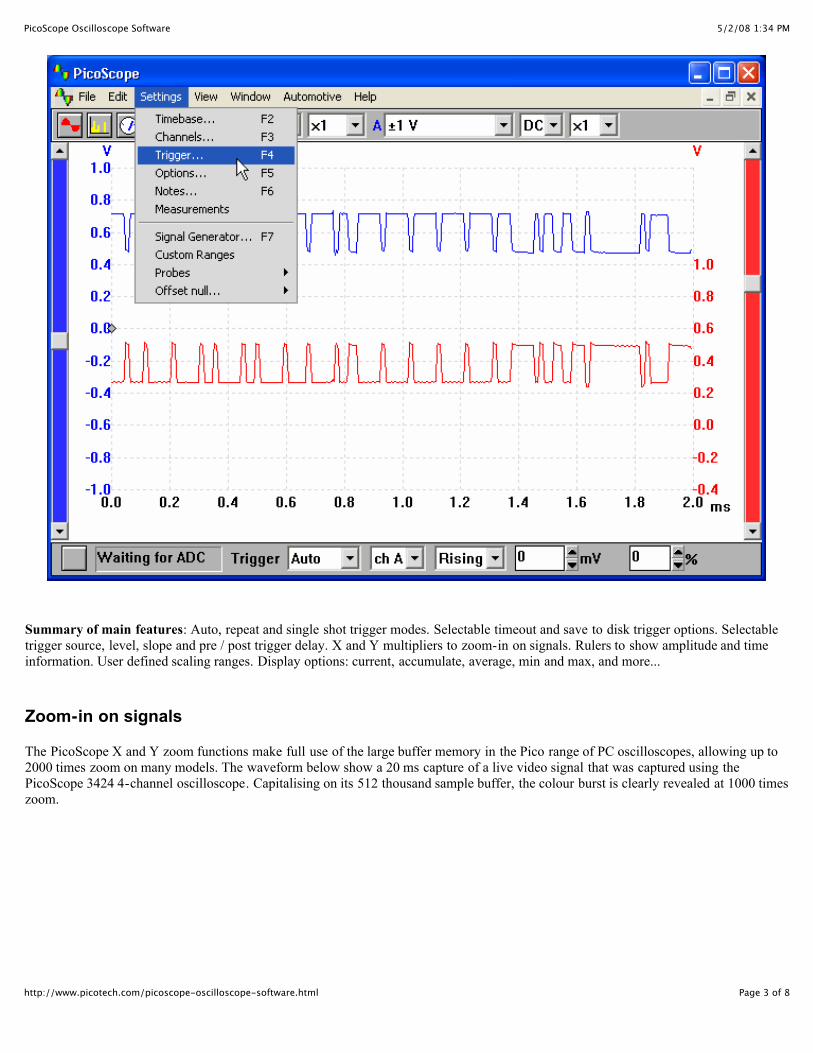
Summary of main features: Auto, repeat and single shot trigger modes. Selectable timeout and save to disk trigger options. Selectable
trigger source, level, slope and pre / post trigger delay. X and Y multipliers to zoom-in on signals. Rulers to show amplitude and time
information. User defined scaling ranges. Display options: current, accumulate, average, min and max, and more...
Zoom-in on signals
The PicoScope X and Y zoom functions make full use of the large buffer memory in the Pico range of PC oscilloscopes, allowing up to
2000 times zoom on many models. The waveform below show a 20 ms capture of a live video signal that was captured using the
PicoScope 3424 4-channel oscilloscope. Capitalising on its 512 thousand sample buffer, the colour burst is clearly revealed at 1000 times
zoom.

5/2/08 1:34 PMPicoScope Oscilloscope Software
Page 4 of 8http://www.picotech.com/picoscope-oscilloscope-software.html
Spectrum Analyser
The spectrum analyser plots amplitude against frequency, in other words it shows signals in the frequency domain. (as opposed to the
oscilloscope which shows signals in the time domain — amplitude against time). It is especially useful for tracking down the cause of
noise or distortion in measured signals. As an example, a peak at 50 or 60 Hz would suggest noise due to mains pick up. Higher
frequency peaks may be easily identified as switching noise from power supplies or noise from digital circuits. An averaging mode is
provided to reduce the effects of random noise and a peak detect mode is useful for testing amplifier bandwidths.
The spectrum analyser has the same trigger options as the oscilloscope. This makes it possible to capture the spectrum of a ‘one off’
event such a single drum beat.
When used with a high resolution unit like the PicoScope 3224 or PicoScope 3424, it is ideal for audio spectrum analysis, and noise and
vibration measurements.

5/2/08 1:34 PMPicoScope Oscilloscope Software
Page 5 of 8http://www.picotech.com/picoscope-oscilloscope-software.html
Summary of main features: FFT based spectrum analyser. Normal, average and peak detect modes. Linear/Log scales for both
amplitude and frequency. Rulers to show amplitude, frequency and phase. Seven window types. Variable number of spectrum bands.
Same trigger functions as oscilloscope.
XY Scope
The XY scope is used to plot one parameter against another. This is useful when comparing the phase of two signals. The XY scope has
the same trigger and timebase functions as described above. XY scope mode is only available on units with 2 or more channels.

5/2/08 1:34 PMPicoScope Oscilloscope Software
Page 6 of 8http://www.picotech.com/picoscope-oscilloscope-software.html
Meter
The meter displays one or more parameters as numbers, together with an optional bar graph. The multimeter displays AC volts (true
RMS), DC volts, decibels or frequency. Other parameters can be displayed (for example pressure or acceleration) by adding custom
ranges.

5/2/08 1:34 PMPicoScope Oscilloscope Software
Page 7 of 8http://www.picotech.com/picoscope-oscilloscope-software.html
Measurements
Parameter measurements can be displayed at the foot of the trace, with a variety of statistical indicators. For each parameter it is possible
to display: Current value, average value, standard deviation, minimum, maximum.
For production testing, pass / fail test limits can be added to each parameter.

5/2/08 1:34 PMPicoScope Oscilloscope Software
Page 8 of 8http://www.picotech.com/picoscope-oscilloscope-software.html
Available measurements: Frequency, High pulse width, Low pulse width, Duty cycle, Cycle time, DC voltage, AC voltage, Peak to
peak, Crest factor, Minimum, Maximum, Risetime, Falltime, Rising rate, Falling rate, Voltage at X cursor, Voltage at 0 cursor, Time at
X cursor, Time at 0 cursor.


![[XLS] _ types calibrated.xls · Web viewAF SIGNAL GENERATOR PULSE GENERATOR PLOTTER SPECTRUM ANALYSER SPECTRUM ANALYSER 3.5GHZ FFT SERVO ANALYSER TRACKING GENERATOR AC HIPOT WRIST](https://img.pdfslide.net/doc/110x75/5aab344e7f8b9aa9488bb6fb/xls-types-calibratedxlsweb-viewaf-signal-generator-pulse-generator-plotter.jpg)