Embed Size (px)
Citation preview
1
New York City’s Operations Support
Tool (OST) White Paper
Table of Contents
EXECUTIVE SUMMARY .......................................................................................................... 3
New York City’s Operations Support Tool (OST) White Paper .................................................. 12
1. Operations Support Tool Background ................................................................................... 12
1.1. New York City Water Supply System ........................................................................... 12
1.1.1. Complex Water Supply System Facing Future Challenges .................................... 12
1.1.2. Regulatory Drivers .................................................................................................. 14
1.1.3. Multiple Objective Management Philosophy ......................................................... 14
1.2. Operations Support Tool Background............................................................................ 18
2. Operations Support Tool Components .................................................................................. 19
2.1. OASIS Model ................................................................................................................. 20
2.1.1. Inflows .................................................................................................................... 21
2.1.2. Demands ................................................................................................................. 21
2.1.3. System Physical Data .............................................................................................. 22
2.1.4. Operating Rules ...................................................................................................... 22
2.2. W2 Water Quality Models ............................................................................................. 23
2.3. OASIS/W2 Linkages ...................................................................................................... 24
2.4. Data Sources, Data Acquisition, Data Scrubbing and Water Information Systems
Kisters (WISKI) Integration ...................................................................................................... 24
2.4.1. Data Sources ........................................................................................................... 24
2.4.2. Data Acquisition and the WISKI Framework ......................................................... 26
2.5. Post-processing / Reporting ........................................................................................... 27
3. Use of Forecasts in OST ........................................................................................................ 27
3.1. Utilizing Forecasts in OST ............................................................................................. 27
3.1.1. Real-time Operations Decisions ............................................................................. 28
3.1.2. Developing Long-Term Operating Rules ............................................................... 29
3.1.3. Forecast Selection and OST Flexibility .................................................................. 30
2
3.2. Stochastic Forecasts Based on Historical Hydrologic Observations ............................. 30
3.2.1. Historical Observations ........................................................................................... 30
3.2.2. Conditional Forecasts.............................................................................................. 31
3.3. NWS Products for Climate/Meteorological Driven Forecasts ....................................... 33
3.3.1. Anticipated Hydrologic Ensemble Forecasts .......................................................... 34
4. Operations Support Tool Usage ............................................................................................ 37
4.1. OST Usage - General ..................................................................................................... 37
4.1.1. Operational Projections ........................................................................................... 37
4.1.2. Refill Probability and Drought Risk Analysis ........................................................ 38
4.1.3. Outage Planning and Emergency Management ...................................................... 38
4.1.4. Operating Rule Development and Water Supply Planning .................................... 38
4.1.5. Climate Change Planning and Demand Management Studies ............................... 39
4.1.6. New Infrastructure .................................................................................................. 39
4.2. OST Usage in the context of the Delaware River Basin ................................................ 40
4.2.1. Conceptual Use of OST in DRB Release Program ................................................. 40
4.2.2. OST in Support of the FFMP Agreement ............................................................... 42
4.2.3. OST Use under Modified Release Plan .................................................................. 42
5. Operations Support Tool Development Timeline ................................................................. 50
Citations ........................................................................................................................................ 52
3
EXECUTIVE SUMMARY
1. Operations Support Tool Background
New York City’s Department of Environmental Protection (”City”) is developing a state-of-the-
art decision support system to support operations and planning throughout the water supply
system. The Operations Support Tool (OST) is a forecast-driven simulation and analysis tool that
will provide City operators and managers with probabilistic predictions of future system status
based on simulation scenarios. The purpose of this paper is to describe OST and discuss the
potential that it offers for supporting and enhancing the current releases program from
Cannonsville, Pepacton and Neversink Reservoirs of the Delaware River Basin.
2. New York City Water Supply System
New York City’s reservoir system is among the most complex water supply systems in the world
and comprises the Delaware, Catskill, and Croton Systems. It was built by the City to meet the
water supply needs of more than 9 million residents of the City and the surrounding
communities. The City professionally manages the system to balance water supply reliability,
water quality, environmental objectives, and minimizes water supply costs.
This already complex water supply system faces additional challenges in the future due to aging
infrastructure, a projected increase in system demand over the next few decades, potential
climate change induced impacts on water quantity and quality, and an evolving regulatory
environment. The City is taking a proactive approach to meeting these varied challenges in
developing OST, an innovative, real-time decision support system that will assist the City in
making short-term and long-term water and demand management decisions using real-time data
and forecasted future reservoir inflows. It is a robust state-of-the-art analytical tool to guide the
City system operations, evaluate alternative operational strategies, and document diversion and
release decisions. It presents an opportunity for the 1954 U. S. Supreme Court Decree Parties
(Decree Parties) to evaluate and implement alternative releases programs to effectively manage
the Delaware River Basin for enhanced habitat protection, flood mitigation and other
environmental concerns while accounting for uncertainty in future hydrological conditions.
2.1. Water Supply Reliability
Ensuring overall water supply system reliability is a key management responsibility and it is
critical that the City consistently operate the system in a proactive manner such that it is prepared
for unplanned events, such as droughts or infrastructure outages, which could impair its ability to
deliver high quality drinking water. It is important to note that the system is not managed in a
way that would result in emptying all reservoirs at the worst point in the drought of record.
Although this type of operation is assumed in determining the “safe yield” (defined in this White
Paper, Section 1.1.3.1) of the system, it is unworkable in actual practice. The consequences of
emptying all reservoirs would be catastrophic, and in actual operations, there is no assurance that
the historical drought ending rainfall will come to “save the day.” Operators need to take action
4
to reduce demands and/or find auxiliary supplies to provide reserves well in advance of reaching
extreme drawdown conditions. OST will provide an analytical tool for supporting operation of
the New York City water supply to maximize reliability and strengthen the City’s ability to make
objective, risk-based decisions. It will allow operators and managers to compare different sets of
operating rules and evaluate the predicted impacts on water supply reliability criteria quickly and
efficiently so that they can make appropriate short-term and long-term decisions. It will also
provide a means to document the rationale for those decisions.
2.2. Water Quality Reliability
The City must maintain a safe, high quality water supply for consumers. The system must be
ready to respond to a water quality event when it occurs (e.g. turbidity events, chemical spills in
or near a reservoir, or an increase in concentrations of disinfection by-product (DBP) precursors,
which are naturally organic matter compounds that can react with chlorine to produce DBPs). An
integral part of maintaining water quality reliability includes management of the reservoir system
such that quality of delivered water is maximized. In the event that contaminants in delivered
water could rise to unacceptable levels, appropriate physical and/or chemical treatment must be
undertaken. OST will integrate water quality monitoring data on a near real time basis to
facilitate decision-making by the City’s operations staff.
2.3. Environmental and Other Objectives
In addition to providing a reliable supply of high quality drinking water to its water supply users,
the City’s operating rules serve to protect downstream users as well as fish habitat and stream
ecosystems. Per New York State Conservation Regulations, conservation releases are made to
maintain minimum downstream flows in the tailwaters below the City’s reservoirs. In addition,
releases are also made to maintain flow targets in the Delaware River at Montague and Trenton
in accordance with the existing agreements.
Other objectives of Decree Parties include flood mitigation and support for recreation. OST will
allow operators to support these objectives by providing assurance that the actions taken will not
impact the ability of the City to reliably deliver high quality drinking water. There is great
potential for use of OST to support decisions to make releases that provide additional benefits to
downstream communities and the Delaware River, over and above the City’s obligations. With
increased knowledge of water supply system operations and probability of the future inflows
coupled with the analytical power of OST, there would be substantial benefits for both New
York City and all downstream water users.
5
3. Operations Support Tool
OST is an analytical tool designed to help guide operating decisions. It simulates and evaluates
operating alternatives using forecasted and near real time system information. A given OST
simulation is comprised of operating rules and scenario assumptions (e.g. which facilities are
currently in or out of service). Most often, the rules and assumptions used will reflect the City’s
current operating policies and current or planned system conditions. The model input that reflects
current policies and conditions will be stored and immediately available for analysis. However,
OST itself is not bound to a specific set of rules or assumptions. Rather, it is a platform for
developing and testing a variety of operating policies that will provide feedback to operators as
to the impacts of particular policies on system performance.
OST is being designed to allow and encourage managers and operators to test the implications of
modifying existing rules and system assumptions. OST does not control how operators/managers
proceed, but rather it provides data based on realistic simulations that can help guide
development of successful operating policies/decisions necessary to achieve short-term and/or
long-term objectives. Standard performance criteria for a given simulation are automatically
generated by OST, and the user can create additional performance criteria and displays as
desired. OST will provide the City’s operations staff with the analytical guidance necessary to
operate the complex New York City reservoir system and strike a balance between multiple
objectives including water supply reliability, water quality goals, environmental concerns,
downstream objectives, and treatment/ pumping costs.
OST, built upon the New York City water quality and quantity models, as well as the OASIS
model for the Delaware River Basin, is a robust tool that accounts for lower Delaware Basin
needs and New York City operational requirements. The City’s approach to the use of system
models to guide management decisions has proceeded in a step-wise manner, with each step
adding complexity and providing overall improvements. OST will continue this step-wise
approach, with intermediate upgraded functionality along the way to final deployment of OST.
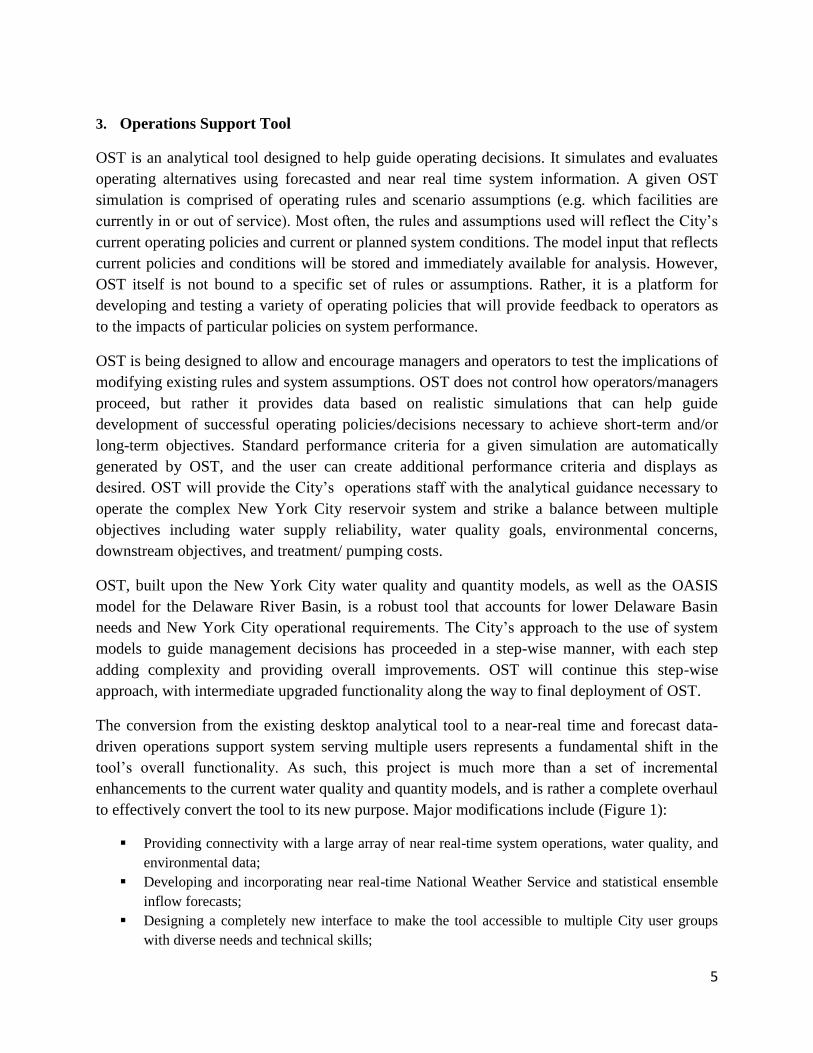
The conversion from the existing desktop analytical tool to a near-real time and forecast data-
driven operations support system serving multiple users represents a fundamental shift in the
tool’s overall functionality. As such, this project is much more than a set of incremental
enhancements to the current water quality and quantity models, and is rather a complete overhaul
to effectively convert the tool to its new purpose. Major modifications include (Figure 1):
Providing connectivity with a large array of near real-time system operations, water quality, and
environmental data;
Developing and incorporating near real-time National Weather Service and statistical ensemble
inflow forecasts;
Designing a completely new interface to make the tool accessible to multiple City user groups
with diverse needs and technical skills;
6
Improving model post-processing capabilities for easier and more powerful data analysis and
presentation; and
Developing a database to store and manage multiple data sets from multiple users, and deploying
OST across the City’s network.
Figure 1: Major OST Components
4. Use of Forecasts in OST
Probabilistic streamflow (reservoir inflow) forecasts are critical in helping to quantify water
supply quantity and quality risks. In addition, streamflow forecasts will aid water managers in
developing robust long-term operating rules for the New York City system. There are essentially
two types of forecasts that will be included in OST: (1) forecasts based solely on historical
streamflow observations and (2) forecasts based on a combination of historical information,
estimates of current meteorologic, hydrologic and climatic conditions, and meteorological
forecast information. In OST, forecasts will be used to inform real-time day-to-day operating
decisions and to evaluate the near-term (up to a year) expected benefits of alternative operating
rules and policies.
Using probabilistic inflow forecasts allows managers to assess the risks and uncertainties
associated with operating decisions. When making real-time operating decisions, water managers
will use OST in Position Analysis (PA) mode. PA involves multiple simulations of potential
operations over a future period (several weeks to a year). Each simulation starts with the system
at its current state (current reservoir elevations, current water quality, etc.), but uses a different
projection of future inflows and other important system drivers.
7
5. Operations Support Tool Usage
OST makes use of real-time system information (e.g. reservoir levels, streamflows) and forecasts
(e.g. streamflows, meteorological drivers) to provide the City with objective, data-based decision
support that will improve system operations including operation of the Delaware Reservoirs and
potentially in improving the Delaware release program.
The following sections describe how OST will be used with respect to the overall system and in
the context of the Delaware release program.
5.1. OST Usage - General
There are two operating modes for OST, Position Analysis (PA) and Simulation (Sim) modes.
PA mode generally is intended to support near-real time operations decision-making. PA
simulations begin with today’s date and look forward (days, months) using the forecasted inflow
and meteorological drivers. All members of the forecast ensemble begin from the same set of
initial system conditions, which would include today’s reservoir storage levels, streamflows, etc.
Typically, these PA simulations might include a “baseline” operations scenario and several sets
of alternate operating rules. The impact of these alternate operations can then be evaluated based
on the performance measures chosen to meet the objectives.
In contrast, rather than running an ensemble of forecasts for a short period of time (i.e. less than
one year), Sim mode consists of a single long-term (e.g. 80 years of historical hydrology for the
New York City OST) simulation. This allows for evaluation of operating rules or infrastructure
changes over a long-term basis and will typically be used for development/testing of long-term
operating rules and for capital planning. In addition, Sim mode could be used to evaluate the
sensitivity of system parameters to long-term hydrologic changes (e.g. climate change scenarios).
5.2. OST Usage in the context of the Delaware River Basin
OST is a robust platform for real-time operations that accounts for multiple objectives and
system complexity in a way that static analyses (e.g. safe yield and table-based approaches)
cannot. OST therefore is a platform that is well-suited for developing and testing release rules for
the Delaware Reservoirs. OST could be used to provide near term support of the FFMP program
and ultimately, in association with a commitment to provide long term sustainable source(s) of
water by the other Decree Party members could form the basis for an enhanced future release
program.
5.3. OST in Support of the FFMP Agreement
OST can initially support releases under the current FFMP program by providing an analytical
tool to evaluate the volume of water available for release. Since OST includes operating rules for
the entire New York City System, it necessarily accounts for water quality and other objectives
8
throughout the system, providing a more realistic accounting of water and protecting water
supply reliability objectives, such as ensuring refill prior to the start of the drawdown season.
Since OST relies on an ensemble of forecasts of possible future inflows, this approach would
represent a risk-based approach, in which the risks of not meeting water supply and water quality
objectives can be quantified. A risk-based approach would protect the City’s water supply users
while helping to define a forecast-based excess release quantity of additional water from
unallocated Delaware Basin storage that can be made available to meet Delaware Basin release
objectives. In more general terms, better system-wide operation with OST will protect the New
York City supply and provide benefits for the Decree Parties.
OST would further enable the Decree Parties, in cooperation with the City, to develop enhanced
FFMP programs (similar to the releases program suggested by Fisheries staff of the New York
State Department of Environmental Conservation (NYS DEC) and the Pennsylvania Fish and
Boat Commission (PFBC)). OST enables sensitivity testing of alternative operating rules to
variable system parameters (e.g. demand, infrastructure, etc). Better system-wide operations with
OST will protect New York City and provide opportunities for improved fisheries habitat
protection and enhanced flood mitigation.
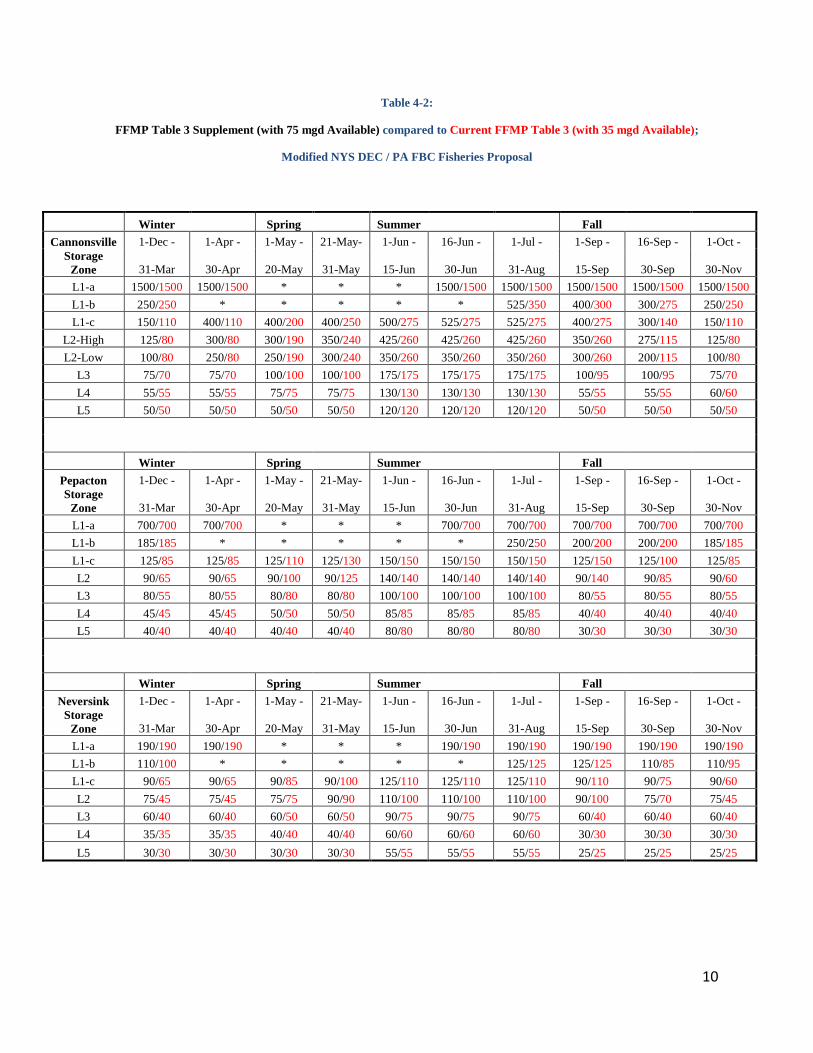
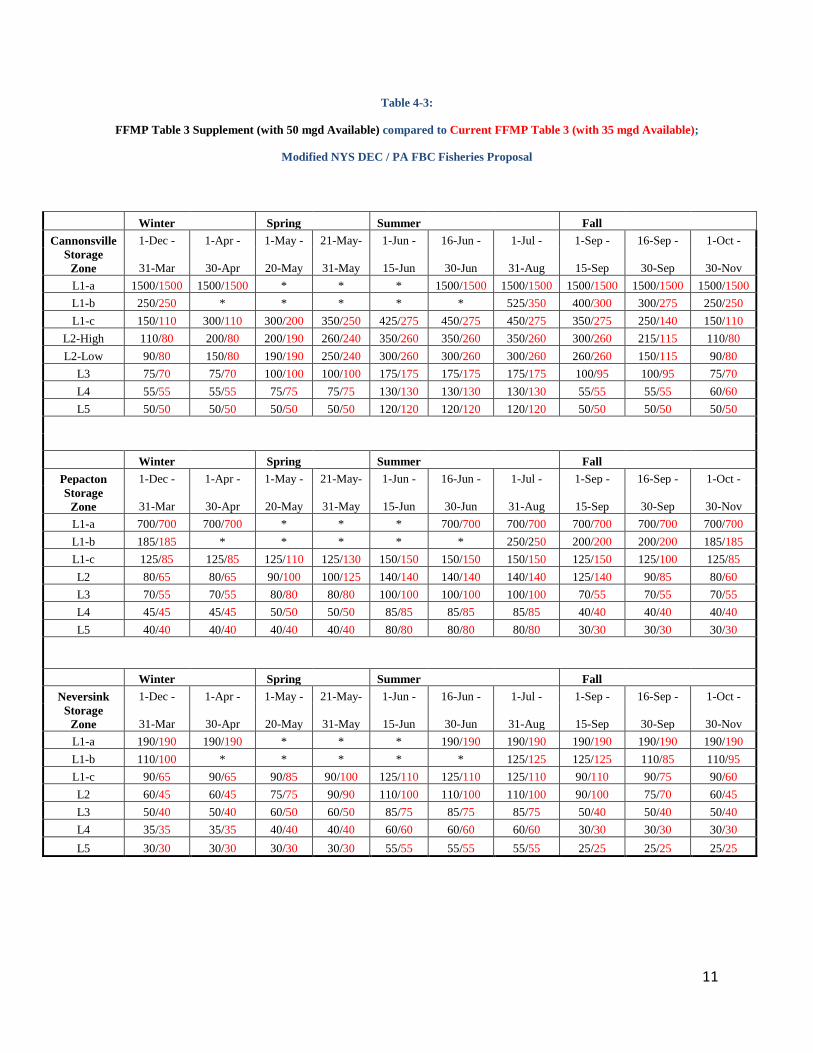
5.4. OST Use for Modified Release Plan
The NYS DEC and PFBC Joint Fisheries White Paper (JFWP), submitted to the Decree Parties,
calls for large reservoir releases, particularly from Neversink Reservoir. The proposal also results
in increased drought days, based on 35 mgd currently available for releases from the unused
portion of the New York City diversion allocation of 800 mgd and violates the drought neutral
criterion prescribed by the Decree Parties. Tangible examples, for illustrative purposes, of
enhanced releases with forecast-based excess release quantities of 100 mgd, 75 mgd, or 50 mgd
available are presented below. Adjustments in releases may be needed to ensure that the drought
day criterion, prescribed by the Decree Parties, is not violated with these tables. The tables
presented supplement the four schedules of releases, with 35 mgd, 20 mgd, 10 mgd or 0 mgd, in
the current FFMP.

9
Table 4-1:
FFMP Table 3 Supplement (with 100 mgd Available) compared to Current FFMP Table 3 (with 35 mgd Available);
Modified NYS DEC / PA FBC Fisheries Proposal
Winter Spring Summer Fall
Cannonsville 1-Dec - 1-Apr - 1-May - 21-May- 1-Jun - 16-Jun - 1-Jul - 1-Sep - 16-Sep - 1-Oct -
Storage
Zone 31-Mar 30-Apr 20-May 31-May 15-Jun 30-Jun 31-Aug 15-Sep 30-Sep 30-Nov
L1-a 1500/1500 1500/1500 * * * 1500/1500 1500/1500 1500/1500 1500/1500 1500/1500
L1-b 250/250 * * * * * 525/350 400/300 300/275 250/250
L1-c 150/110 400/110 400/200 400/250 500/275 525/275 525/275 400/275 300/140 150/110
L2-High 135/80 325/80 325/190 350/240 400/260 425/260 425/260 350/260 250/115 135/80
L2-Low 115/80 300/80 300/190 325/240 400/260 400/260 400/260 325/260 250/115 125/80
L3 100/70 125/70 150/100 175/100 200/175 200/175 200/175 150/95 125/95 100/70
L4 55/55 55/55 75/75 75/75 130/130 130/130 130/130 55/55 55/55 60/60
L5 50/50 50/50 50/50 50/50 120/120 120/120 120/120 50/50 50/50 50/50
Winter Spring Summer Fall
Pepacton 1-Dec - 1-Apr - 1-May - 21-May- 1-Jun - 16-Jun - 1-Jul - 1-Sep - 16-Sep - 1-Oct -
Storage
Zone 31-Mar 30-Apr 20-May 31-May 15-Jun 30-Jun 31-Aug 15-Sep 30-Sep 30-Nov
L1-a 700/700 700/700 * * * 700/700 700/700 700/700 700/700 700/700
L1-b 185/185 * * * * * 250/250 200/200 200/200 185/185
L1-c 125/85 125/85 125/110 125/130 150/150 150/150 150/150 125/150 125/100 125/85
L2 100/65 100/65 100/100 100/125 140/140 140/140 140/140 100/140 100/85 100/60
L3 80/55 80/55 80/80 80/80 100/100 100/100 100/100 80/55 80/55 80/55
L4 45/45 45/45 50/50 50/50 85/85 85/85 85/85 40/40 40/40 40/40
L5 40/40 40/40 40/40 40/40 80/80 80/80 80/80 30/30 30/30 30/30
Winter Spring Summer Fall
Neversink 1-Dec - 1-Apr - 1-May - 21-May- 1-Jun - 16-Jun - 1-Jul - 1-Sep - 16-Sep - 1-Oct -
Storage
Zone 31-Mar 30-Apr 20-May 31-May 15-Jun 30-Jun 31-Aug 15-Sep 30-Sep 30-Nov
L1-a 190/190 190/190 * * * 190/190 190/190 190/190 190/190 190/190
L1-b 110/100 * * * * * 125/125 125/125 110/85 110/95
L1-c 90/65 90/65 90/85 90/100 125/110 125/110 125/110 90/110 90/75 90/60
L2 75/45 75/45 75/75 90/90 110/100 110/100 110/100 90/100 75/70 75/45
L3 60/40 60/40 60/50 60/50 90/75 90/75 90/75 60/40 60/40 60/40
L4 35/35 35/35 40/40 40/40 60/60 60/60 60/60 30/30 30/30 30/30
L5 30/30 30/30 30/30 30/30 55/55 55/55 55/55 25/25 25/25 25/25
10
Table 4-2:
FFMP Table 3 Supplement (with 75 mgd Available) compared to Current FFMP Table 3 (with 35 mgd Available);
Modified NYS DEC / PA FBC Fisheries Proposal
Winter Spring Summer Fall
Cannonsville 1-Dec - 1-Apr - 1-May - 21-May- 1-Jun - 16-Jun - 1-Jul - 1-Sep - 16-Sep - 1-Oct -
Storage
Zone 31-Mar 30-Apr 20-May 31-May 15-Jun 30-Jun 31-Aug 15-Sep 30-Sep 30-Nov
L1-a 1500/1500 1500/1500 * * * 1500/1500 1500/1500 1500/1500 1500/1500 1500/1500
L1-b 250/250 * * * * * 525/350 400/300 300/275 250/250
L1-c 150/110 400/110 400/200 400/250 500/275 525/275 525/275 400/275 300/140 150/110
L2-High 125/80 300/80 300/190 350/240 425/260 425/260 425/260 350/260 275/115 125/80
L2-Low 100/80 250/80 250/190 300/240 350/260 350/260 350/260 300/260 200/115 100/80
L3 75/70 75/70 100/100 100/100 175/175 175/175 175/175 100/95 100/95 75/70
L4 55/55 55/55 75/75 75/75 130/130 130/130 130/130 55/55 55/55 60/60
L5 50/50 50/50 50/50 50/50 120/120 120/120 120/120 50/50 50/50 50/50
Winter Spring Summer Fall
Pepacton 1-Dec - 1-Apr - 1-May - 21-May- 1-Jun - 16-Jun - 1-Jul - 1-Sep - 16-Sep - 1-Oct -
Storage
Zone 31-Mar 30-Apr 20-May 31-May 15-Jun 30-Jun 31-Aug 15-Sep 30-Sep 30-Nov
L1-a 700/700 700/700 * * * 700/700 700/700 700/700 700/700 700/700
L1-b 185/185 * * * * * 250/250 200/200 200/200 185/185
L1-c 125/85 125/85 125/110 125/130 150/150 150/150 150/150 125/150 125/100 125/85
L2 90/65 90/65 90/100 90/125 140/140 140/140 140/140 90/140 90/85 90/60
L3 80/55 80/55 80/80 80/80 100/100 100/100 100/100 80/55 80/55 80/55
L4 45/45 45/45 50/50 50/50 85/85 85/85 85/85 40/40 40/40 40/40
L5 40/40 40/40 40/40 40/40 80/80 80/80 80/80 30/30 30/30 30/30
Winter Spring Summer Fall
Neversink 1-Dec - 1-Apr - 1-May - 21-May- 1-Jun - 16-Jun - 1-Jul - 1-Sep - 16-Sep - 1-Oct -
Storage
Zone 31-Mar 30-Apr 20-May 31-May 15-Jun 30-Jun 31-Aug 15-Sep 30-Sep 30-Nov
L1-a 190/190 190/190 * * * 190/190 190/190 190/190 190/190 190/190
L1-b 110/100 * * * * * 125/125 125/125 110/85 110/95
L1-c 90/65 90/65 90/85 90/100 125/110 125/110 125/110 90/110 90/75 90/60
L2 75/45 75/45 75/75 90/90 110/100 110/100 110/100 90/100 75/70 75/45
L3 60/40 60/40 60/50 60/50 90/75 90/75 90/75 60/40 60/40 60/40
L4 35/35 35/35 40/40 40/40 60/60 60/60 60/60 30/30 30/30 30/30
L5 30/30 30/30 30/30 30/30 55/55 55/55 55/55 25/25 25/25 25/25
11
Table 4-3:
FFMP Table 3 Supplement (with 50 mgd Available) compared to Current FFMP Table 3 (with 35 mgd Available);
Modified NYS DEC / PA FBC Fisheries Proposal
Winter Spring Summer Fall
Cannonsville 1-Dec - 1-Apr - 1-May - 21-May- 1-Jun - 16-Jun - 1-Jul - 1-Sep - 16-Sep - 1-Oct -
Storage
Zone 31-Mar 30-Apr 20-May 31-May 15-Jun 30-Jun 31-Aug 15-Sep 30-Sep 30-Nov
L1-a 1500/1500 1500/1500 * * * 1500/1500 1500/1500 1500/1500 1500/1500 1500/1500
L1-b 250/250 * * * * * 525/350 400/300 300/275 250/250
L1-c 150/110 300/110 300/200 350/250 425/275 450/275 450/275 350/275 250/140 150/110
L2-High 110/80 200/80 200/190 260/240 350/260 350/260 350/260 300/260 215/115 110/80
L2-Low 90/80 150/80 190/190 250/240 300/260 300/260 300/260 260/260 150/115 90/80
L3 75/70 75/70 100/100 100/100 175/175 175/175 175/175 100/95 100/95 75/70
L4 55/55 55/55 75/75 75/75 130/130 130/130 130/130 55/55 55/55 60/60
L5 50/50 50/50 50/50 50/50 120/120 120/120 120/120 50/50 50/50 50/50
Winter Spring Summer Fall
Pepacton 1-Dec - 1-Apr - 1-May - 21-May- 1-Jun - 16-Jun - 1-Jul - 1-Sep - 16-Sep - 1-Oct -
Storage
Zone 31-Mar 30-Apr 20-May 31-May 15-Jun 30-Jun 31-Aug 15-Sep 30-Sep 30-Nov
L1-a 700/700 700/700 * * * 700/700 700/700 700/700 700/700 700/700
L1-b 185/185 * * * * * 250/250 200/200 200/200 185/185
L1-c 125/85 125/85 125/110 125/130 150/150 150/150 150/150 125/150 125/100 125/85
L2 80/65 80/65 90/100 100/125 140/140 140/140 140/140 125/140 90/85 80/60
L3 70/55 70/55 80/80 80/80 100/100 100/100 100/100 70/55 70/55 70/55
L4 45/45 45/45 50/50 50/50 85/85 85/85 85/85 40/40 40/40 40/40
L5 40/40 40/40 40/40 40/40 80/80 80/80 80/80 30/30 30/30 30/30
Winter Spring Summer Fall
Neversink 1-Dec - 1-Apr - 1-May - 21-May- 1-Jun - 16-Jun - 1-Jul - 1-Sep - 16-Sep - 1-Oct -
Storage
Zone 31-Mar 30-Apr 20-May 31-May 15-Jun 30-Jun 31-Aug 15-Sep 30-Sep 30-Nov
L1-a 190/190 190/190 * * * 190/190 190/190 190/190 190/190 190/190
L1-b 110/100 * * * * * 125/125 125/125 110/85 110/95
L1-c 90/65 90/65 90/85 90/100 125/110 125/110 125/110 90/110 90/75 90/60
L2 60/45 60/45 75/75 90/90 110/100 110/100 110/100 90/100 75/70 60/45
L3 50/40 50/40 60/50 60/50 85/75 85/75 85/75 50/40 50/40 50/40
L4 35/35 35/35 40/40 40/40 60/60 60/60 60/60 30/30 30/30 30/30
L5 30/30 30/30 30/30 30/30 55/55 55/55 55/55 25/25 25/25 25/25
12
New York City’s Operations Support Tool (OST) White Paper
1. Operations Support Tool Background
The New York City Department of Environmental Protection (City) is developing a state-of-the-
art decision support system to improve operations and planning throughout the water supply
system. The Operations Support Tool (OST) is a forecast-driven simulation and analysis tool that
will provide the City’s operators and managers with probabilistic predictions of future system
status based on simulation scenarios. The OST will significantly impact all three of the City’s
systems, the Delaware System, the Catskill System, and the Croton System. The purpose of this
paper is to describe OST and discuss the potential that it offers for supporting and improving
releases from New York City Reservoirs in the Delaware River Basin.
This section provides an introduction of OST in the context of the challenges faced by the New
York City Water Supply System. Sections 2 and 3 describe the major components of OST, while
Section 4 describes usage of OST, including potential usage for Delaware River Basin releases.
Finally, Section 5 presents OST project timeline.
1.1. New York City Water Supply System
1.1.1. Complex Water Supply System Facing Future Challenges
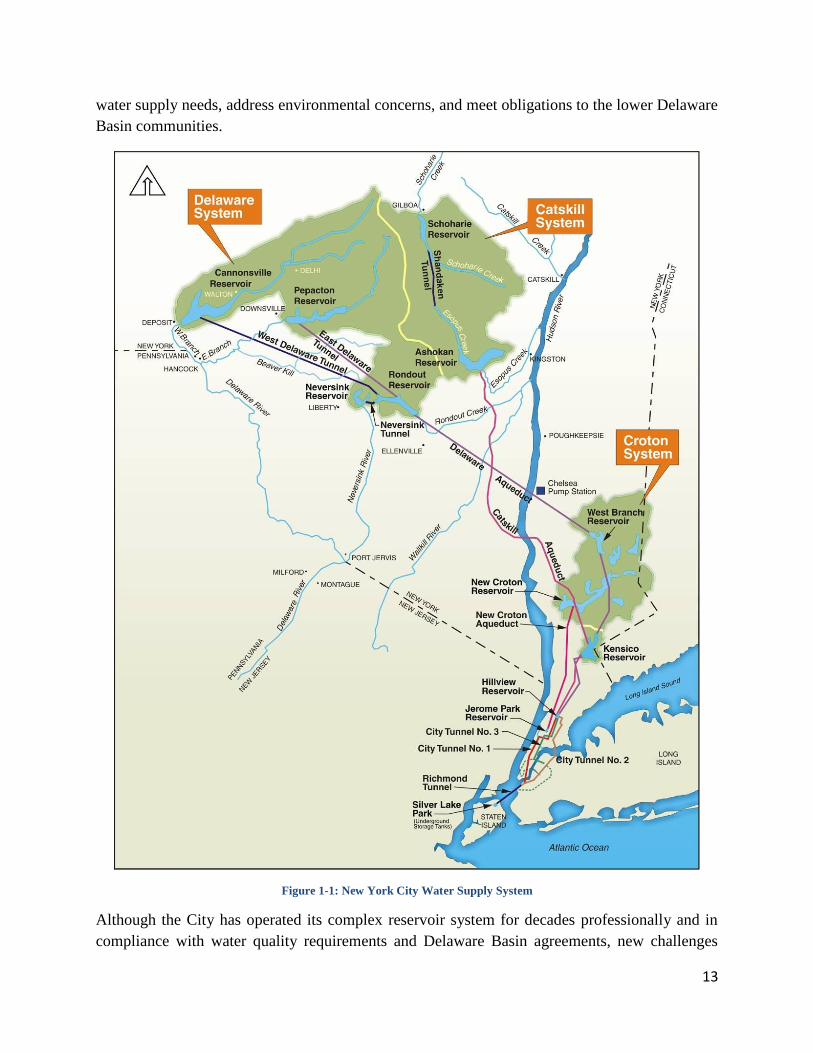
New York City’s reservoir system is among the most complex water supply systems in the world
(Figure 1-1). More than 1 billion gallons (BG) of water flows each day by gravity from the
Delaware, Catskill, and Croton Systems to meet the demand of more than 9 million residents of
the City and the surrounding communities. The City must manage the system in a way that
protects water supply reliability and balances multiple objectives including water quantity and
quality, as well as environmental, and economic objectives.
The New York City Delaware System includes Pepacton, Cannonsville, and Neversink
Reservoirs, from which water is diverted to Rondout Reservoir. From Rondout Reservoir, water
can be diverted to West Branch and Kensico Reservoirs via the Delaware Aqueduct. Water from
Kensico, which includes water from the Catskill and the Delaware Systems, is diverted to
Hillview Reservoir and subsequently conveyed to the City via City Tunnel Nos. 1, 2, and 3. On
average, the Delaware System is used to meet 60-70% of the City demand. In addition, Delaware
water is historically the highest quality water in the system and there is often a need to divert
more from the Delaware System, such as during turbidity events in Schoharie and Ashokan
Reservoirs, during droughts, or when a critical piece of infrastructure is offline (e.g. for repairs
or inspection ).
It is in this context that the City must manage the Delaware System carefully to maximize overall
system reliability, maintain high quality water for those dependent on the City’s system for their
13
water supply needs, address environmental concerns, and meet obligations to the lower Delaware
Basin communities.
Figure 1-1: New York City Water Supply System
Although the City has operated its complex reservoir system for decades professionally and in
compliance with water quality requirements and Delaware Basin agreements, new challenges
14
and regulatory requirements require development of a robust analytical tool to guide system
operations and evaluate alternative operational strategies.
This already complex water supply system faces additional challenges in the future due to aging
infrastructure, a projected increase in City and outside community demand over the next few
decades, potential storage and water quality impacts due to climate change, and an evolving
regulatory environment. The City is taking a proactive approach to meeting these varied
challenges in developing OST, an innovative, real-time decision support system that will assist
the City in making short-term and long-term water and demand management decisions using
real-time data and forecasted future reservoir inflows.
1.1.2. Regulatory Drivers
In 2002, New York City was granted a five-year Filtration Avoidance Determination (FAD) by
the United States Environmental Protection Agency (USEPA) for the Catskill and Delaware
water supply systems (US Environmental Protection Agency Region 2, 2002). The FAD waived
the requirements for unfiltered water systems to provide filtration, as promulgated by the Surface
Water Treatment Rule, contingent on several conditions: construction of a UV Disinfection
Facility to treat the Catskill and Delaware water supplies; implementation of a Catskill Turbidity
Control Program (CTCP); and continued implementation of a broad suite of watershed protection
by the City, among others. The Catskill Turbidity Control Program was originally proposed by
the City in Section 6.4.9 of New York City’s 2001 Watershed Protection Program Summary, and
updated and refined in Section 2.3.11 of New York City’s 2006 Long-term Watershed Protection
Program (New York City Department of Environmental Protection, 2001; New York City
Department of Environmental Protection, 2006).
Catskill turbidity control remained a priority concern in the 2007 FAD, which required
implementation of an Operations Support Tool for controlling turbidity export from Schoharie,
as described in the CTCP Phase II Implementation Plan (US Environmental Protection Agency
Region 2, 2007). Further the 2007 FAD required the City to continue to study turbidity control
options for the Ashokan Reservoir, and implement any selected options. The 2006 State
Pollution Discharge Elimination System (SPDES) discharge permit that governs releases from
Schoharie Reservoir through the Shandaken Tunnel also establishes the requirement for an
Operations Support Tool (New York State Department of Environmental Conservation, 2006).
1.1.3. Multiple Objective Management Philosophy
OST fits well within the City’s overall multi-objective water supply management philosophy. It
provides the City with the analytical tools to better meet its various objectives while accounting
for uncertainty in future hydrologic conditions. OST will further allow the City to better manage
the tradeoffs between competing objectives and provide the capability for evaluating the impacts
(positive and negative) for various operating strategies.
15
From a broader perspective, OST serves as a template for water supply operators throughout the
US and globally as they face increasingly difficult decisions about balancing water quality, water
quantity, environmental, and economic objectives. As population, water consumption, and
environmental concerns increase, so will the need for state-of-the-art tools for effectively
managing our water resources. These same tools are equally critical in demonstrating to utilities,
managers and stakeholders when capital expenditures are necessary and, when they are not.
The following sections review in more detail the major objectives for which the New York City
water supply is operated.
1.1.3.1. Water Supply Reliability
The City’s main priority is to meet the water supply needs of the City and upstate users.
Accordingly, management of the system must maintain overall system reliability as the most
important objective. There are serious consequences for poor management of the water supply;
thus it is critical that the City consistently operates the system in a proactive manner such that it
is prepared for unplanned events that could impair its ability to deliver high-quality water. As the
highest quality, most reliable year-round water supply within the New York City System, the
Delaware reservoirs are critical for maintaining this overall supply reliability.
The City is faced with the constant need to maintain the hydrologic reliability of the water supply
and protect against potential drought or infrastructure failure conditions. To this end, operators
endeavor to manage the system so that reservoirs are full by the beginning of the drawdown
period (June 1st). Operators and managers then balance reservoir drawdown, taking in account
refill probability, water quality, reservoir release requirements and economics. To do this,
operators must forecast the range of inflow to each reservoir and estimate the probability of
drawing the reservoirs down to undesirably low levels during the upcoming drawdown period
and of refilling the system by the beginning of the next drawdown period. Doing this analysis in
a robust fashion is a very difficult task, particularly in a system as complex as New York City’s.
It is important to note that operators should not and do not operate the system in a way that
would result in emptying all reservoirs at the worst point in the drought of record. Although this
type of operation is assumed in determining the “safe yield” of the system, it is unworkable in
actual practice. The consequences of emptying all reservoirs would be catastrophic, and in actual
operations, there is no assurance that the historical drought-ending rainfall will come to “save the
day.”
Although there are various definitions, the American Water Works Association (“AWWA”)
defines safe yield as “[t]he maximum rate at which water can be withdrawn continuously over a
long period of time including very dry periods."1 The City calculates safe yield as the maximum
continuous demand that can be met by the City water supply system during a repetition of the
1 See AWWA’s “Principles and Practices of Water Supply Operations: Water Sources” (2003)
16
drought of record while maintaining a 25% storage reserve in the collection reservoirs of the
Catskill and Croton Systems and in Rondout Reservoir.
Like numerous other municipalities that maintain such reserve for various reasons, the City
maintains this reserve capacity based on the following rationale:
1. To have reserve storage should a period occur which is drier than that experienced
in the past (i.e., drought of record)
2. To limit water quality impacts caused by reservoir drawdown
3. To allow for the effect of silting which most likely has reduced reservoir storage
4. To provide adequate hydraulic head to deliver water at full aqueduct capacities
5. To provide reservoir storage in the event a dry period occurs while spring runoff is
frozen.
OST will provide an analytical tool for improving operation of the New York City water supply
to maximize reliability. It will allow operators and managers to compare different sets of
operating rules and evaluate the predicted impacts on water supply reliability criteria quickly and
efficiently so that they can make appropriate short-term and long-term decisions. It will also
provide a means to document the rationale for those decisions. While the overall water supply
management philosophy will not change, the ability of the City to make objective, risk-based
decisions will be strengthened by OST.
1.1.3.2. Water Quality Reliability
The City must maintain a safe, reliable, high quality water supply for its consumers. As with
water supply reliability, the system must be ready to respond to a water quality event when it
occurs (e.g. turbidity events, chemical spills in or near a reservoir, or an increase in
concentrations of disinfection by-product (DBP) precursors, which are naturally organic matter
compounds that can react with chlorine to produce DBPs). An integral part of maintaining water
quality reliability includes management of the reservoir system such that quality of delivered
water is maximized. In the event that contaminants in delivered water could rise to unacceptable
levels, appropriate physical and/or chemical treatment must be undertaken.
The City’s comprehensive water quality monitoring plan (New York City Department of
Environmental Protection, 2009) is designed to ensure compliance with all federal, state, and
local regulations; protect the water supply for public health; protect and improve the watersheds
to meet the terms of the FAD (US Environmental Protection Agency Region 2, 2007); meet the
needs for current and future predictions of watershed conditions and reservoir water quality;
support operational decisions and policies; and provide surveillance to ensure delivery of the best
quality water to consumers. OST will integrate water quality monitoring data on a near-real time
basis to facilitate decision-making by the City’s operations staff.
17
As described below, the OST concept arose from the need to provide analytical and predictive
support for controlling turbidity in the Catskill System and meeting the requirements of the FAD.
Preliminary rules for operating the Catskill reservoirs during a turbidity event are already
encoded in OST. Additional rules for other water quality events will likely be developed and
tested using this tool. Therefore, use of OST will enable the City develop operations that will
protect the water supply against a diverse range of specific water quality impacts.
1.1.3.3. Environmental Objectives
In addition to providing a high quality, reliable supply of drinking water to its water supply
users, the City operates pursuant to rules which serve to protect downstream users as well as fish
habitat and stream ecosystems. See New York State Environmental Conservation Law 6 NYCRR
Parts 670-672. Reservoir releases are made in accordance with these regulations to maintain
flows from Rondout Reservoir and in the Croton and Catskill Systems. Minimum releases to
tributaries of the Delaware River are defined by the terms of the 1954 Supreme Court Decree
(Decree), agreements amongst the Parties of the Decree, DRBC dockets, and the current Flexible
Flow Management Program (FFMP).
As described further in Section 4, there is great potential for use of OST to support decisions to
make releases that provide additional benefits to downstream communities and the Delaware
River. Increased knowledge of system operations and probability of future inflows, coupled with
the analytical power of OST, should provide substantial benefits for both New York City and
downstream interests.
1.1.3.4. Economic Considerations
The suggestion that we operate at all times in a prescriptive manner based on the safe yield
(rather than using the safe yield as a threshold for reliability during drought conditions) could
require the City to pump and treat Croton or Catskill water when there is other high quality water
available. Such a practice would not be reasonable or consistent with conventional principals of
water supply management, nor would it be consistent with the Decree in that sources of water
that require pumping are specifically excluded from the City’s calculation of safe yield for the
purposes of determining the Excess Release Quantity. This would also result in additional
unnecessary environmental impacts associated with increased energy use. Moreover, the
economic costs for pumping and treating could be significant.
1.1.3.5. Other Objectives
Other system objectives include, to the extent consistent with City's mandate to provide an
adequate supply of high quality and affordable water, flood mitigation and support for recreation.
In both cases, OST will allow operators to support these needs by providing assurance that any
18
actions ultimately taken will not significantly impact the ability to achieve New York City’s
primary operating objectives.
1.2. Operations Support Tool Background
OST is an analytical tool designed to help guide operating decisions. It simulates and evaluates
operating alternatives using forecasted and near-real time system information. A given OST
simulation is comprised of operating rules and scenario assumptions (e.g. which facilities are
currently in or out of service). Most often, the rules and assumptions used will reflect New York
City’s current operating policies and current or planned system conditions. The model input that
reflects current policies and conditions will be stored and immediately available for analysis.
However, OST itself is not bound to a specific set of rules or assumptions. Rather, it is a
platform for developing and testing a variety of operating policies that will provide feedback to
operators as to the impacts of particular policies on system performance.
OST is being designed to allow and encourage operators and managers to test the implications of
modifying existing rules and system assumptions. OST does not control how operators/managers
proceed, but rather it provides data based on realistic simulations that can help guide
development of successful operating policies/decisions necessary to achieve short-term and/or
long-term objectives. Standard performance criteria for a given simulation are automatically
generated by OST, and the user can create additional performance criteria and displays as
desired.
The concept for OST was identified in the CTCP as the most effective and cost-effective method
of controlling turbidity for the Catskill System. OST is being developed as part of the overall
program to sustain the City’s FAD, as well as comply with the SPDES permit parameters for
turbidity and temperature of diversions from Schoharie Reservoir into the Esopus Creek. Under
the Catskill Turbidity Control Study (Gannett Fleming/Hazen & Sawyer, 2009; Gannett
Fleming/Hazen & Sawyer, 2008), the City evaluated a range of structural and operational
alternatives for (a) improving control over turbidity and temperature levels in diversions from
Schoharie Reservoir into Esopus Creek, and (b) reducing the frequency of alum treatment at
Kensico Reservoir subsequent to major storm events. The key finding of this multi-phase study
was that modification of reservoir operations could provide substantial improvements to Catskill
water quality, provided the City was equipped with robust monitoring and analytical tools to
provide near-real time operational guidance.
Though the genesis of OST was in Catskill turbidity issues, OST will provide multiple benefits
to the City throughout the water supply system. OST will provide City operations staff with the
analytical guidance necessary to operate the complex New York City reservoir system and strike
a balance between multiple objectives – water supply reliability, water quality goals,
environmental concerns, downstream objectives, and treatment/ pumping costs. This is
particularly important as numerous planned system improvements (e.g., Croton Water Filtration
19
Plant, Catskill/Delaware Ultra Violet Disinfection Facility, Catskill-Delaware Shaft 4
Connection) are brought on-line in the coming years. OST will also provide a robust analytical
basis for supporting and documenting the City’s operational decisions.
2. Operations Support Tool Components
OST builds upon the New York City OASIS-W2 model, an analytical tool developed to meet the
objectives of the Catskill Turbidity Control Study and designed for use primarily by modelers
and engineers. In virtually all cases the functionalities of the existing model and the underlying
OASIS software will be preserved in OST. However, OST represents a major overhaul and
advancement of the OASIS-W2 model, itself an upgrade of the City’s previous system models.
The OASIS-W2 linked model combined the OASIS model for the Delaware River Basin
(developed for and used by the DRBC) and the City’s previous OASIS model, resulting in a
more robust tool that accounts for the impacts of the lower Delaware Basin needs with New
York City operations, and vice-versa. It further included water quality models for Schoharie,
Ashokan, and Kensico Reservoir to account for the impacts of Catskill turbidity on system
operations, and vice-versa. Thus, New York City’s approach to the use of system models to
guide management decisions has proceeded in a step-wise manner, with each step adding
complexity and providing an improved tool overall. OST will continue this step-wise approach,
with intermediate upgraded functionality along the way to final deployment of OST.
The conversion from the existing desktop analytical tool to a near-real time and forecast data-
driven operations support system serving multiple users represents a fundamental shift in the
tool’s overall functionality. As such, this project is much more than a set of incremental
enhancements to the OASIS-W2 model, and is rather a complete overhaul to effectively convert
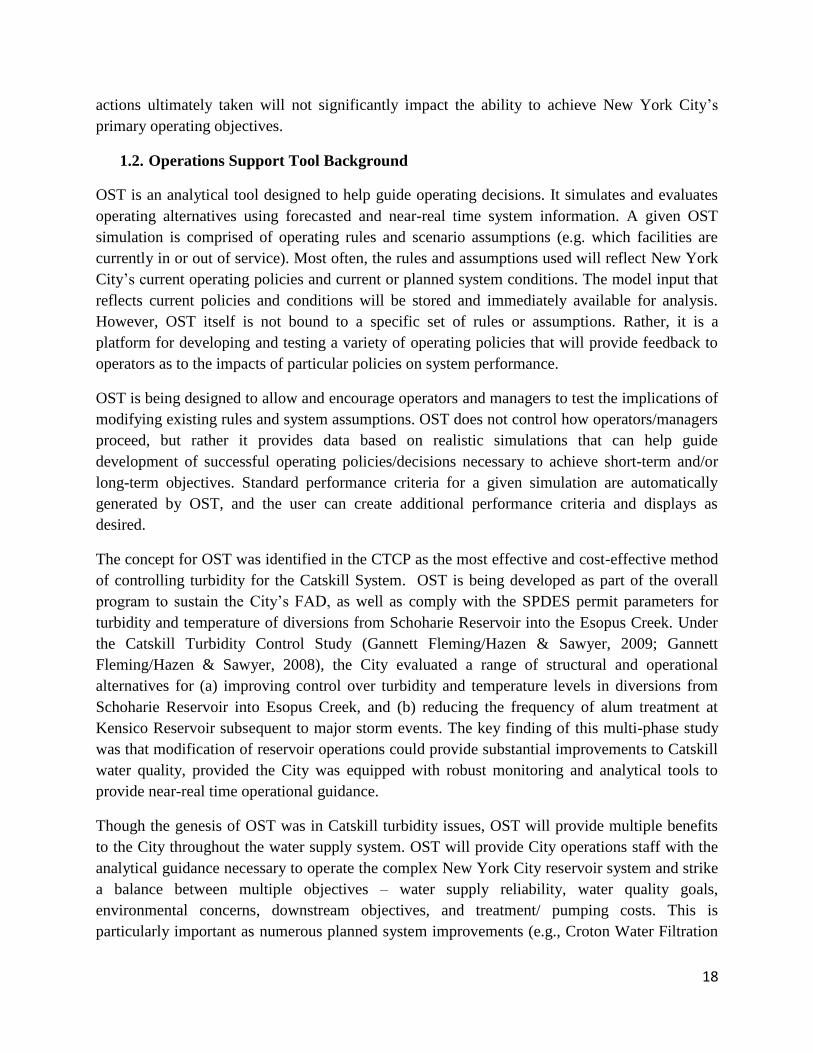
the tool to its new purpose. Major modifications include (Figure 2-1):
Providing connectivity with a large array of near real-time system operations, water
quality, and environmental data;
Developing and incorporating near real-time National Weather Service and statistical
ensemble inflow forecasts;
Designing a completely new interface to make the tool accessible to multiple City user
groups with diverse needs and technical skills;
Improving model post-processing capabilities for easier and more powerful data analysis
and presentation; and
Developing a database to store and manage multiple data sets from multiple users, and
deploying OST across the City’s network.
20
Figure 2-1: Major OST Components
Key features of OST data acquisition utilities and the OASIS and W2 models are described in the
following sections, followed by descriptions of the underlying OASIS and W2 models and the
post-processing and reporting capabilities of OST. Because of their complexity and importance
in OST, the forecasts are described separately in Section 3.
2.1. OASIS Model
OASIS is a generalized computer program for modeling the operation of water resources systems
(HydroLogics, Inc., 2007). OASIS represents a system using nodes (reservoirs, junctions) and
arcs (aqueducts, streams) and uses linear programming optimization to simulate water routing
decisions (e.g., reservoir releases or diversions) in the system, subject to both human operating
rules and physical constraints. The OASIS model of the City’s reservoir system simulates daily
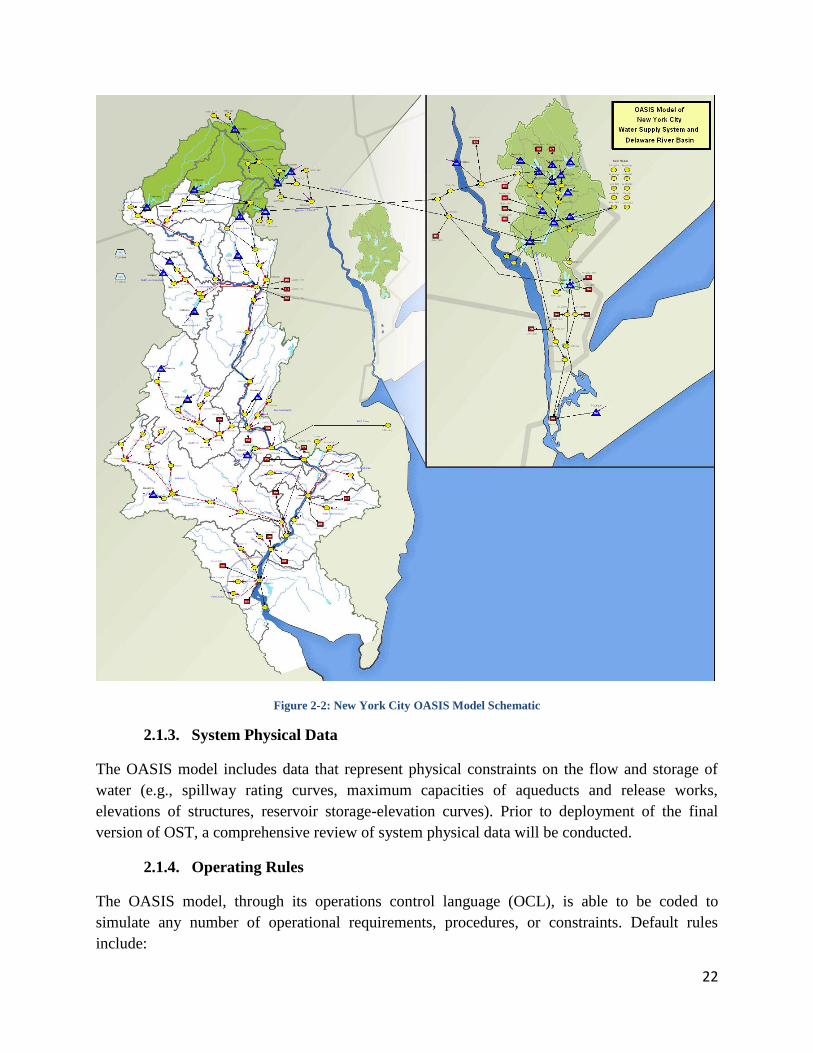
operations throughout the entire system and the Delaware River Basin (Figure 2-2).
OASIS is a simulation model and simulates the system as the user has defined it, including
demand level, infrastructure scenario, and operating rules. In this way, the user can efficiently
simulate several different operating scenarios and use the simulation results to evaluate the best
course of action based on the chosen performance criteria.
Major components of the OASIS model include reservoir inflows, consumptive demands, system
physical data, and operating rules. These components are described in the following sections.
21
2.1.1. Inflows
In OASIS, inflow to a reservoir represents the local inflow to that reservoir, not including flows
from upstream reservoirs. Flows between reservoirs are based on release and diversion decisions
made by the model, while the local inflow is a daily time series representing possible future
hydrologic conditions. Future inflows can be represented by historical hydrology, statistically
based forecasts, or climatologically based forecasts. In addition, synthetic inflows can be used to
drive the model, as for example, in sensitivity studies evaluating the potential impacts of
increasing flows under climate change scenarios. The inflow options included in OST are
discussed in more detail in Section 3.
2.1.2. Demands
Demands in the OASIS model include both New York City and outside community (OC)
demands. New York City demand is withdrawn from the model via one demand node
downstream of Hillview and Jerome Park Reservoirs. OC demands on the New York City
system are aggregated into 12 different demand nodes, each drawing from the reservoir or
aqueduct reach from which they are served.
Demands are modeled as recurring annual patterns throughout the simulation period. The annual
patterns consist of constant values for each month. Demand in a given month is calculated as the
product of the annual average demand level and a monthly peaking factor. Default monthly
peaking factors for New York City and each OC demand are currently based on historical data
from 1987 through 2005. Annual average New York City and OC demands are specified by the
user.
22
Figure 2-2: New York City OASIS Model Schematic
2.1.3. System Physical Data
The OASIS model includes data that represent physical constraints on the flow and storage of
water (e.g., spillway rating curves, maximum capacities of aqueducts and release works,
elevations of structures, reservoir storage-elevation curves). Prior to deployment of the final
version of OST, a comprehensive review of system physical data will be conducted.
2.1.4. Operating Rules
The OASIS model, through its operations control language (OCL), is able to be coded to
simulate any number of operational requirements, procedures, or constraints. Default rules
include:
23
Diversion rules for the Delaware, Catskill, and Croton Systems to account for: turbidity
conditions in the Catskill System; forecasted inflows in all three systems and associated
probabilities of refill; and Croton system operating logic under either pre- or post-Croton
filtration scenarios.
Alum addition rules at Kensico Reservoir
Release requirements for New York City reservoirs
o Croton system (per requirements in NYSDEC Part 672-3)
o Schoharie Reservoir (per requirements in NYSDEC Part 670 and the Shandaken
SPDES Permit)
o Rondout Reservoir (per requirements in NYSDEC Part 672-2)
o Cannonsville, Pepacton, and Neversink Reservoirs (per the current FFMP). These
rules in the OASIS model reflect provisions which are intended to adaptively
manage releases from Cannonsville, Pepacton, and Neversink to meet multiple
objectives (e.g., water supply, drought and spill mitigation, tailwaters fishery
protection, and habitat needs, recreation).2 Other rule sets can also be simulated.
Release and diversion requirements for lower Delaware River reservoirs (Beltsville, Blue
Marsh, Nockamixon, and Merrill Creek) per current DRBC rules. Alternative rules can
be simulated.
The OASIS model is fully capable of simulating any combination of rules for the system. As
such, the model is not limited to the current set of rules and can be modified to add alternate
rules for testing or comparison of proposed operating policies. As future operating rules are
developed and codified, they will be added to OST.
2.2. W2 Water Quality Models
Two-dimensional water quality models of Schoharie Reservoir, the West and East Basins of
Ashokan Reservoir, and Kensico Reservoir were developed by the Upstate Freshwater Institute
(UFI). These models are based on CE-QUAL-W2 (W2), a dynamic, laterally averaged, two-
dimensional (longitudinal-vertical) hydrothermal/transport model developed by the Army Corps
of Engineers(Cole & Wells, 2006). In addition to the underlying fluid motion and mass transport
framework, the Catskill W2 models include a three particle size class turbidity submodel that
simulates the fate and transport of turbidity in the reservoirs, and accounts for both settling and
resuspension processes. Specification of model coefficients and model testing for the Catskill
W2 models is supported by process studies and by extensive, temporally and spatially detailed,
in-reservoir automated and event-based water quality monitoring.
2 Agreement of the Parties to the 1954 U.S. Supreme Court Decree (Provisional) (9/27/07).
24
2.3. OASIS/W2 Linkages
W2 models for Schoharie, West and East Basins of Ashokan, and Kensico Reservoirs have been
linked as external modules to the OASIS model. The water quality models run in parallel with
OASIS, such that for each simulation day, the W2 models simulated one day of reservoir water
quality before OASIS continues on to the next simulation day. In this way, OASIS-simulated
water supply decisions are informed by the simulated water quality and vice-versa. Therefore,
the linked water supply – water quality model is able to simulate the feedback between reservoir
operations (e.g., diversion and release decisions) and water quality for the Catskill System and
Kensico Reservoir.
Furthermore, each of the four W2 modules provides dynamic feedback to the other modules. For
example, the W2-predicted turbidity and temperature levels in Schoharie diversions via the
Shandaken Tunnel become inputs to the Ashokan West Basin W2 module; likewise, turbidity
loads leaving the West Basin over the Dividing Weir spillway or through the Dividing Weir
gates are inputs to the East Basin W2 module. Thus, the combined OASIS/W2 model
incorporates realistic, relevant water quality information into operations for reservoirs in the
Croton, Catskill, and Delaware basins that cannot be simulated with simplistic tools.
2.4. Data Sources, Data Acquisition, Data Scrubbing and Water Information Systems
Kisters (WISKI) Integration
OST relies upon near real-time system data from a variety of internal and external sources to
drive the underlying OASIS water supply and W2 water quality models. These data must be
acquired from the appropriate sources, run through QA/QC routines, and stored within reach of
OST modules. The following sections describe data sources and data acquisition/scrubbing
routines. In addition, OST will ultimately be integrated with the data management architecture
currently being developed for the City under the WISKI framework (Kisters North America,
Citrus Heights, CA; www.kisters.net).
2.4.1. Data Sources
2.4.1.1. USGS Data
The USGS maintains a network of continuously telemetrically monitored gaging stations to
measure surface elevations and associated flow rates for many streams in the New York City
watershed and the Delaware Basin. OST will automatically acquire stream flow data for gaging
stations that are primary to the core requirements of the model and stations that could provide
proxy values should primary stations become unavailable.
2.4.1.2. National Weather Service Forecast Data
Ultimately, inflows for OST operations support runs will be based on long-term ensemble
streamflow forecasts provided by the NWS, using basin rainfall-runoff models that either exist or
25
are developed under OST. When fully implemented, NWS ensemble forecasts and associated
hindcasts will be acquired by OST via File Transfer Protocol (FTP), Secure File Transfer
Protocol (SFTP), or Local Data Manager (LDM) protocol and subjected to automated bias
correction and mapping/scaling functions within OST.
The meteorological drivers for the water quality models (air temperature, dew point temperature,
wind speed, wind direction, cloud cover, solar radiation) will also be informed by NWS surface
weather forecasts. Additional post-processing functions within OST will convert NWS surface
weather forecast products into the necessary water quality meteorological model drivers.
2.4.1.3. SCADA Data
The City operates and maintains an automated reservoir and transmission system supervisory
control and data acquisition (SCADA) system to support system monitoring and control. The
SCADA system provides real-time monitoring of remote facilities and sensors and electronically
archives associated data.
2.4.1.4. New York City Keypoint Water Quality Data
The City monitors selected water quality parameters at critical locations within the water supply
system through its Keypoint Monitoring Program. Some data are collected as grab-samples and
analyzed in a laboratory while others are collected using automated monitoring equipment and
are transmitted continuously.
Keypoint data are currently generated and managed separately for East of Hudson (EOH) and
West of Hudson (WOH) operations. EOH turbidities are monitored telemetrically and are viewed
and archived through a dedicated SCADA/Historian system. Once collected and archived,
turbidity data are managed and distributed using a WISKI data management system. WOH
turbidities are monitored telemetrically via the WOH SCADA/Historian system, with the data
being available in real time to water supply operators in the Water Supply Control Center and
archived for future use.
2.4.1.5. Near Real Time Network Water Quality Data
Under terms of a contract with the City, the Upstate Freshwater Institute (UFI; Syracuse, NY)
operates in-reservoir sampling buoys at selected reservoirs to support water quality modeling and
the City’s operational efforts. The buoys measure turbidity, temperature, conductivity and
dissolved oxygen at 1 meter intervals from the water surface to the near bottom. Additional
automated sampling instruments measure temperature, conductivity and turbidity at major
reservoir inflow points.
Data from both reservoir and stream sites are currently collected by UFI telemetrically, subjected
to a QA/QC evaluation and distributed via FTP.
26
2.4.1.6. New York City Meteorological (Met) Station and Snow Pillow Data
Meteorological and snow pillow data are collected by the City from its own distributed network
of weather stations. Data are transmitted telemetrically using radio telemetry to base stations at
five City facilities in the New York City watersheds, and then retransmitted to a server in
Grahamsville via the City’s local area network (LAN) where they are compiled and archived.
2.4.1.7. New York City Laboratory Water Quality Data
Laboratory data associated with both keypoint and reservoir grab-sampling are processed and
managed through the City’s Laboratory Information Management System (LIMS). Daily water
quality reports can be distributed though a very flexible Web Services module associated with
the LIMS application. Water quality data for OST model initialization and limnological data for
backup to UFI NRT data, will be obtained automatically through the LIMS Web interface.
2.4.1.8. Manual Data
Currently, EOH operations data (reservoir elevation, instantaneous and totalized flow) at
reservoirs upstream of New Croton are logged weekly by operations staff from observations of
local devices typically located at reservoir gate houses. Hand-logged reservoir surface elevation
and outflow data from reservoirs upstream of Croton will, in the near term, be summarized in a
daily report in delimited file format and transmitted to WOH operations for publishing to an FTP
site along with WOH operational data.
The City has begun a project that will implement a fully functional SCADA system for
monitoring key EOH reservoir and water transmission system variables. At present, New Croton
Reservoir is the only site integrated into this SCADA system. It is expected that all EOH
reservoirs, including Kensico Reservoir, will be monitored from the EOH SCADA servers.
WOH operations data (reservoir elevation, instantaneous and totalized flow) are typically logged
weekly and are used to assist in quality control of automated SCADA monitoring functions.
2.4.2. Data Acquisition and the WISKI Framework
Kisters’ WISKI data management platform provides an interface to diverse water management
data sources including databases, a variety of sensor technology, and manual entry from field
personnel. The City's selection of WISKI followed an evaluation of numerous water quality and
flow time series data management software packages. The City has been using WISKI since
2006 to manage EOH hydrology time series data (stream gages, flow and rating curves, weather
station data and USGS data). OST will be integrated with WISKI as an existing, common
platform for storing system data.
WISKI is not a SCADA system, in that equipment is not controlled through WISKI. It is a time
series data management, acquisition and visualization tool. The provisional goal is to implement
27
data acquisition solutions for all OST data sources within the WISKI framework. The solutions
may include direct connectivity with the City’s SCADA systems as well as direct import of time
series data from non-City sources, e.g. NWS, USGS, etc.
WISKI further provides a calculation framework for the implementation of automated QA/QC
data scrubbing routines specific to each of the above listed data sources. Unless otherwise
required, these routines will execute daily. Email alerts may be sent to designated City staff
when manual inspection / data completion is required for one or more OST data sources.
2.5. Post-processing / Reporting
OST will support the City’s need to routinely prepare reports and documentation for both
internal and external usage. OST will archive a substantial body of operations, water quality, and
environmental data. OST will provide the City’s users with the ability to interact with these data
via built-in tables, plots, and reports, or retrieve the data and export to common data processing
software (e.g. MS Excel). Example reports could include daily system operations summaries,
monthly Shandaken SPDES Permit reports, and turbidity after-action reports. OST will also
generate system summary data suitable for inclusion on the City’s website or other venues for
disseminating information to the public and/or stakeholder agencies.
Reports and documentation will be customizable to meet the needs of the City and other
stakeholders. The City expects to consult with other Decree Parties in developing outputs for use
in describing, presenting, and evaluating the results of proposed near-term and long-term
operations.
3. Use of Forecasts in OST
In order to ensure overall water supply reliability, the City’s operators and managers must
understand the risks and uncertainties associated with operating decisions. Probabilistic
streamflow (reservoir inflow) forecasts are critical in helping to quantify those risks. In addition,
streamflow forecasts will aid water managers in developing robust long-term operating rules for
the New York City system.
This section introduces and describes the probabilistic streamflow forecasts to be incorporated
into OST, and presents an outline for how the forecasts will be utilized within OST framework.
There are essentially two types of forecasts that will be included in OST: (1) forecasts based
solely on historical streamflow observations (Section 3.2) and (2) forecasts based on a
combination of historical information, estimates of current meteorologic, hydrologic and climatic
conditions, and meteorological forecast information (Section 3.3).
3.1. Utilizing Forecasts in OST
In OST, forecasts will be used to inform real-time day-to-day operating decisions and to evaluate
the near-term (up to a year) expected benefits of alternative operating rules and policies.
28
3.1.1. Real-time Operations Decisions
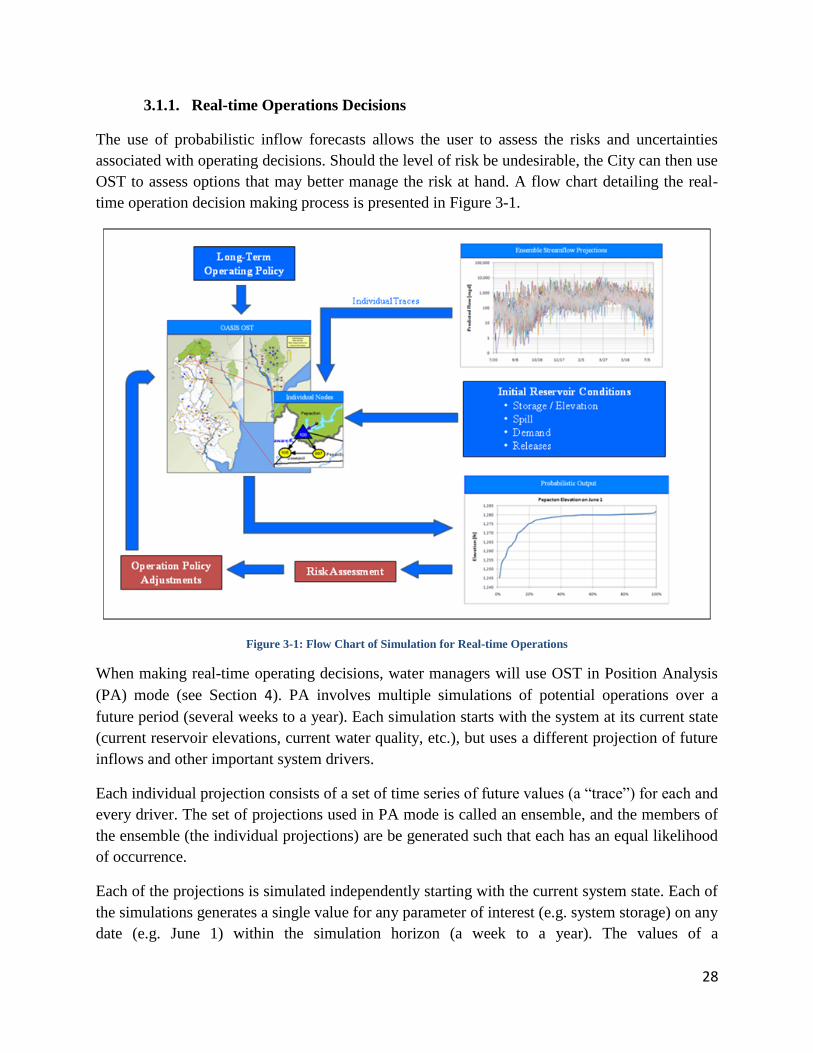
The use of probabilistic inflow forecasts allows the user to assess the risks and uncertainties
associated with operating decisions. Should the level of risk be undesirable, the City can then use
OST to assess options that may better manage the risk at hand. A flow chart detailing the real-
time operation decision making process is presented in Figure 3-1.
Figure 3-1: Flow Chart of Simulation for Real-time Operations
When making real-time operating decisions, water managers will use OST in Position Analysis
(PA) mode (see Section 4). PA involves multiple simulations of potential operations over a
future period (several weeks to a year). Each simulation starts with the system at its current state
(current reservoir elevations, current water quality, etc.), but uses a different projection of future
inflows and other important system drivers.
Each individual projection consists of a set of time series of future values (a “trace”) for each and
every driver. The set of projections used in PA mode is called an ensemble, and the members of
the ensemble (the individual projections) are be generated such that each has an equal likelihood
of occurrence.
Each of the projections is simulated independently starting with the current system state. Each of
the simulations generates a single value for any parameter of interest (e.g. system storage) on any
date (e.g. June 1) within the simulation horizon (a week to a year). The values of a
29
parameter/date combination over all the simulations define points on a predicted probability
distribution for that parameter on that date (e.g. the probability distribution of the value of
system storage on June 1). These distributions quantify the uncertainty of future reservoir and
system states and help managers judge the risk associated with the simulated operation.
Because initial storage conditions are near certain and demands are more or less static in the
short-term, most of the uncertainty inherent in these questions is caused by the uncertainty about
the volume of future streamflow into the system. Probabilistic streamflow forecasts utilized in
OST position analysis will make it possible to quantify this uncertainty. Using OST, the water
manager can utilize these forecasts and adjust operational decisions to reduce the risk of not
meeting one or more system objectives (e.g. supply reliability, water quality, environmental
flows, economic assessments, etc.).
3.1.2. Developing Long-Term Operating Rules
In addition to assisting in short-term operational decisions, forecasts will be needed to help
managers develop robust long-term operating rules. Long-term operating rules are fundamentally
different from short-term operational decisions. Long-term operating rules can be described as
fixed rules that will best manage the system under a specific set of real-time information (e.g.
reservoir levels, demand levels, stream inflows, release requirements, meteorological and
hydrologic forecasts, etc). Short-term operating decisions that differ from the long term rules can
be classified as “adjustments.” Adjustments are desirable because they allow operators to use
their judgment, their knowledge of the system, and additional, real-time information about
current conditions to continuously improve system performance above and beyond what might
be achieved by strictly following set rules. Long-term operating rules set the benchmark against
which adjustments are evaluated, and the better the long-term rules, the better the overall system
performance.
Over a number of previous studies of the New York City system, a set of preliminary long-term
rules has been developed for the current OASIS-W2 model.3 However, the current long term
rules do not use forecast information. This is because historical forecasts (hindcasts) are
currently not available, so it is impossible to simulate the performance of rules that used
forecasts (forecasts could not be a part of the information available to the rule). Hindcasts will be
available as a part of OST, and thus, OST can be used to develop better long term rules that use
the forecast information that will be available to operators in real-time.
When setting long-term operating rules, OST is operated in “Simulation” mode rather than PA
mode. In Simulation mode, operating rules can be developed and evaluated by analyzing their
3 Note that these rules are relatively informal and were designed to reflect current City policies. Part of OST
development process will focus on review of these operations. In addition, it is expected that these rules will evolve
over time as the City uses OST to improve operations where appropriate.
30
performance4 over the entire length of the historical hydrologic record. A critical part of the
long-term operating rule design involves developing ways in which managers could use reservoir
inflow and other forecasts to enhance operating performance. OST simulation runs will have
access to the hindcasts required to simulate the performance of forecast-based rules over the
historical hydrologic record.
Long-term operating rule development using Simulation mode can be illustrated using June 1st
system refill as an example. For water supply reliability, all of the major sub-systems should be
near full by roughly June 1st of each year (start of the drawdown season). In order to support this
goal, there should be robust baseline operating rules that have been validated over a long period
of time under the range of potential hydrologic drivers. In Simulation mode, managers can use
hindcasts and the historical record to develop, test, and standardize operating rules that increase
refill probability for June 1st.
3.1.3. Forecast Selection and OST Flexibility
The final build of OST will be an extremely flexible tool in terms of forecast selection.
Currently, OST allows the user to select between historical and conditional Hirsch forecasts (see
Sections 3.2.1 and 3.2.2.1, respectively). However, as more forecast products become available,
the user will be able to choose between the traditional Hirsch forecasts, extended daily Hirsch
forecasts (Section 3.2.2.2), and the National Weather Service (NWS) ensemble hydrologic
forecasts (Section 2.4.1.2).
3.2. Stochastic Forecasts Based on Historical Hydrologic Observations
Currently, the forecasts that are available as inputs to OST are statistical in nature and are based
solely on historical streamflow observations. The two methods included in OST include these
historical “forecasts” and conditional Hirsch forecasts, originally described by Hirsch (Hirsch,
1979) (Hirsch, 1981).
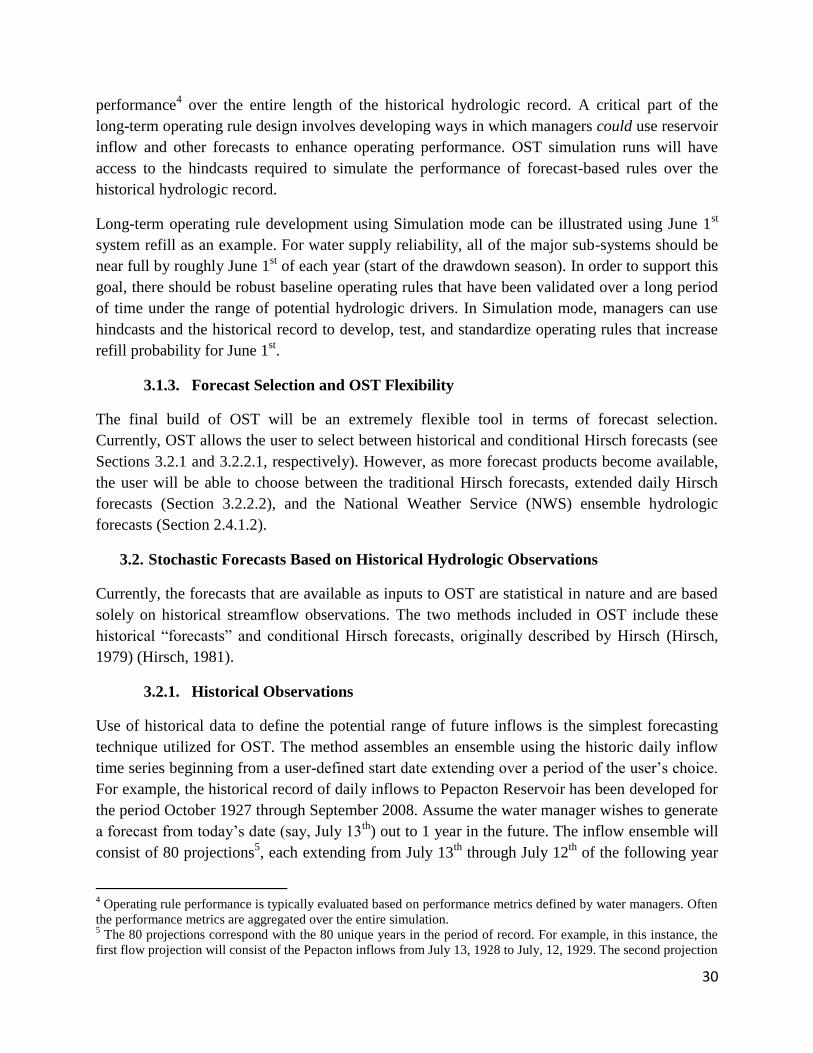
3.2.1. Historical Observations
Use of historical data to define the potential range of future inflows is the simplest forecasting
technique utilized for OST. The method assembles an ensemble using the historic daily inflow
time series beginning from a user-defined start date extending over a period of the user’s choice.
For example, the historical record of daily inflows to Pepacton Reservoir has been developed for
the period October 1927 through September 2008. Assume the water manager wishes to generate
a forecast from today’s date (say, July 13th
) out to 1 year in the future. The inflow ensemble will
consist of 80 projections5, each extending from July 13
th through July 12
th of the following year
4 Operating rule performance is typically evaluated based on performance metrics defined by water managers. Often
the performance metrics are aggregated over the entire simulation. 5 The 80 projections correspond with the 80 unique years in the period of record. For example, in this instance, the
first flow projection will consist of the Pepacton inflows from July 13, 1928 to July, 12, 1929. The second projection

31
(Figure 3-2). Each projection in the ensemble is assumed to have an equally likely chance of
occurring in the future. Essentially, this method assumes that future inflows for a given time of
year can be represented by the range of past inflows for the same relative time of year. In this
method, the projections do not take into account current or recent hydrologic or meteorologic
conditions.
3.2.2. Conditional Forecasts
Conditional Hirsch forecast ensembles are generated using a stochastic model based on the
historical record conditioned on recent observed flows (Hirsch, 1981). Conditional Hirsch
forecasts can be generated using monthly data or daily data (extended Hirsch).
3.2.2.1. Monthly Forecast Algorithm
At the monthly time scale, streamflows often exhibit serial correlation (essentially, monthly
streamflow can be imagined as the continuation of the current hydrologic trend). This “memory”
is commonly attributed to month-to-month persistence in baseflow and/or soil moisture.
According to Hirsch (1981), this serial correlation allows for the generation of monthly
streamflow forecast ensembles based on flows from the preceding month and the application of
random noise. Generally, this serial correlation allows for forecasts with tighter distributions
(less variance and uncertainty) when compared to the historical method presented in the last
section. This means that the forecasts reflect more forecast skill. The monthly conditional Hirsch
forecasts used in OST utilize this assumption.
will consist of inflows from July 13, 1929 to July, 12, 1930. The final (80
th) projection will consist of inflows from
July 13, 2007 to July, 12, 2008.
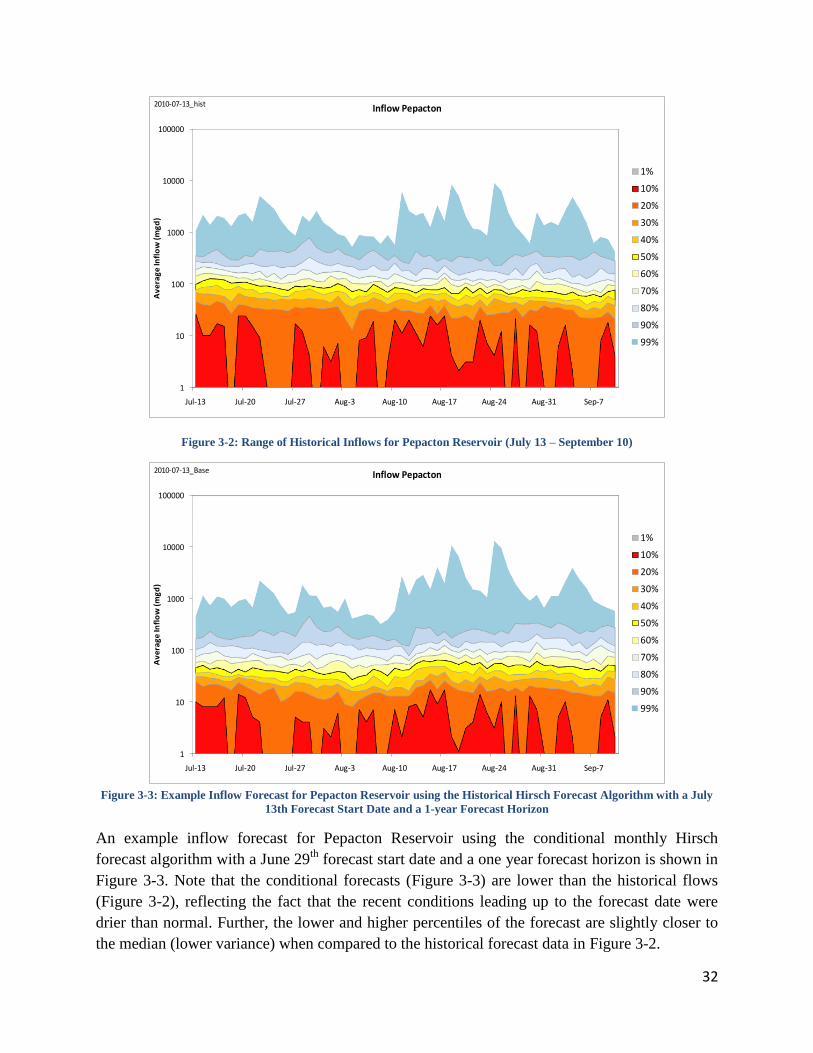
32
Figure 3-2: Range of Historical Inflows for Pepacton Reservoir (July 13 – September 10)
Figure 3-3: Example Inflow Forecast for Pepacton Reservoir using the Historical Hirsch Forecast Algorithm with a July
13th Forecast Start Date and a 1-year Forecast Horizon
An example inflow forecast for Pepacton Reservoir using the conditional monthly Hirsch
forecast algorithm with a June 29th
forecast start date and a one year forecast horizon is shown in
Figure 3-3. Note that the conditional forecasts (Figure 3-3) are lower than the historical flows
(Figure 3-2), reflecting the fact that the recent conditions leading up to the forecast date were
drier than normal. Further, the lower and higher percentiles of the forecast are slightly closer to
the median (lower variance) when compared to the historical forecast data in Figure 3-2.
1
10
100
1000
10000
100000
Jul-13 Jul-20 Jul-27 Aug-3 Aug-10 Aug-17 Aug-24 Aug-31 Sep-7
Av
era
ge
Infl
ow
(m
gd
)
Inflow Pepacton
1%
10%
20%
30%
40%
50%
60%
70%
80%
90%
99%
2010-07-13_hist
1
10
100
1000
10000
100000
Jul-13 Jul-20 Jul-27 Aug-3 Aug-10 Aug-17 Aug-24 Aug-31 Sep-7
Av
era
ge
Infl
ow
(m
gd
)
Inflow Pepacton
1%
10%
20%
30%
40%
50%
60%
70%
80%
90%
99%
2010-07-13_Base
33
3.2.2.2. Extended Daily Hirsch Method
An extended daily version of the conditional Hirsch forecasting scheme is currently under
development. The conceptual design is similar to the monthly forecast algorithm in that it will
also have random components derived from historical data to preserve joint relationships among
inflow forecasts to different reservoirs. The extended daily version is expected to improve the
forecast skill compared to the monthly algorithm, especially in the initial days/weeks following
the forecast date.
The stochastic Hirsch forecasts have a number of strengths that recommend their use in OST.
First, these forecasts are a relatively simple way to generate probabilistic streamflow forecast
ensembles and they are available for use immediately. From an accuracy standpoint, both the
historical and conditional Hirsch forecasts have relatively good skill over long forecast horizons
(months to a year) since they preserve the month-to-month serial correlations6. For forecast lead
times less than a month, the forecast skill diminishes for both the historical and conditional
methods; however, on average the conditional forecasts will perform better than the historical
since they are conditioned on the previous month’s observed flows.
While Hirsch forecasts are a simple and versatile method for developing ensemble inflow
forecasts for OST, it should be noted that they do not incorporate any climate or meteorological
information. This has the largest consequences for operating decisions having a short forecast
horizon (days to weeks). Over days to weeks subsequent to an initial forecast date, concurrent
meteorological information (e.g. precipitation, humidity, evapotranspiration) has a large effect on
streamflow. Since the Hirsch method does not incorporate this meteorological signal, its short-
term daily forecasts tend to lack skill. The extended daily method is expected to improve this
weakness; however the extent of the benefit has not yet been quantified. The long-term plan for
incorporating climate and meteorological data into OST is described below.
3.3. NWS Products for Climate/Meteorological Driven Forecasts
The City is currently cooperating with the National Weather Service (NWS) to share data and
develop forecasting products to improve OST. The products produced by the NWS utilize
climatological and meteorological information in conjunction with local hydrologic models to
produce ensemble streamflow forecasts.
Currently, the NWS issues two types of weather-based streamflow forecasts that are utilized by
the City on a qualitative basis. These products include single-value streamflow forecasts for the
New York City system with 24 and 48 hour lead times, as well as 1 to 3 month average
streamflow forecasts from the Advanced Hydrologic Prediction Service (AHPS). While these
6 Since the historical Hirsch forecasts use purely historical data, serial correlation in the historical time series will be
preserved.
34
forecast products are useful on a short-term qualitative basis, they lack the resolution and
forecast length to be used quantitatively in OST. The NWS is currently in development of a new
ensemble streamflow forecast system that will address these issues and allow quantitative
evaluation.
The City has offered support to NWS to expedite the development of these new ensemble
streamflow forecasts. At the time this white paper was released, NWS was actively evaluating
how it could best expedite forecast development with New York City support. It is anticipated
that an agreement will be in place by early 2011.
3.3.1. Anticipated Hydrologic Ensemble Forecasts
Like the current NWS forecast products described above, the anticipated ensemble forecasts are
based on climate/meteorological information driven hydrologic forecast models. The anticipated
ensemble forecasts will have a daily output and will predict inflows up to a year in advance. In
this format, the anticipated ensemble forecasts can be directly entered as input to OST and may
be used interchangeably with the Hirsch forecasts. A brief methodology describing how the
NWS is expected to generate these forecasts followed by their strengths and weaknesses are
presented below.
3.3.1.1. Brief Methodology
Before the NWS generates the ensemble hydrologic forecasts, it gathers atmospheric ensemble
(precipitation, temperature, etc.) forecasts from the National Oceanic and Atmospheric
Administration’s (NOAA) National Centers for Environmental Prediction (NCEP). The NWS
must “pre-process” these atmospheric forecasts to produce atmospheric forcing at the space and
time scales of the hydrologic forecast models. This includes spatial and temporal downscaling7,
statistical model bias correction, and an analysis of model hindcasts together with corresponding
observations to calibrate the pre-processing algorithms.
After the pre-processing is complete, the NWS hydrologic models are initialized with the current
basin conditions and the atmospheric ensemble members are run through the hydrologic model
one at a time, generating a hydrologic ensemble forecast. At this point, OST routines will “post-
process” the NWS ensemble flow forecasts by correcting any statistical bias in the hydrologic
model and will appropriately format the ensemble traces for input into OST. The post-processing
step will also compensate for any differences between the flow variables predicted by the NWS
and inflow variables required by OST (e.g. differences in drainage area). A flow chart illustrating
the critical aspects of the forecast methodology is presented below in Figure 3-4.
7 NCEP’s atmospheric forecast models used by the NWS, the Global Ensemble Forecast System (GEFS) and the
Climate Forecast System (CFS), contain ensemble output at a relatively large, low-resolution spatial domain and
time step. In order to be properly input to the NWS hydrologic models, the NCEP forecast ensembles must be
“downscaled” from the default low-resolution output to a higher resolution.

35
The most important strength of the anticipated NWS hydrologic ensemble forecasts is that
atmospheric forecasts and current hydrologic conditions are used to develop the predictions.
Over short forecast horizons, the atmospheric and hydrologic drivers in the NWS forecasts will
theoretically improve forecast skill compared to the Hirsch method. At long lead times, if climate
predictions have skill, the NWS hydrologic ensembles should also improve upon the Hirsch
forecast skill. However, again at long lead times, if no addition information is gained by climate
forecasts, the hydrologic predictions will default to historic hydrology and should have similar
skill to the Hirsch predictions.
Additionally, the NWS forecast ensembles have potential to provide ensemble hydrologic
forecasts for future climate change scenarios. The NCEP atmospheric forecasts can be run using
varying CO2 and other greenhouse gas forcing scenarios which can be run in the NWS
hydrologic models. These potential hydrologic scenarios could be run in OST simulation mode,
and would be extremely valuable for developing long-term operating rules.
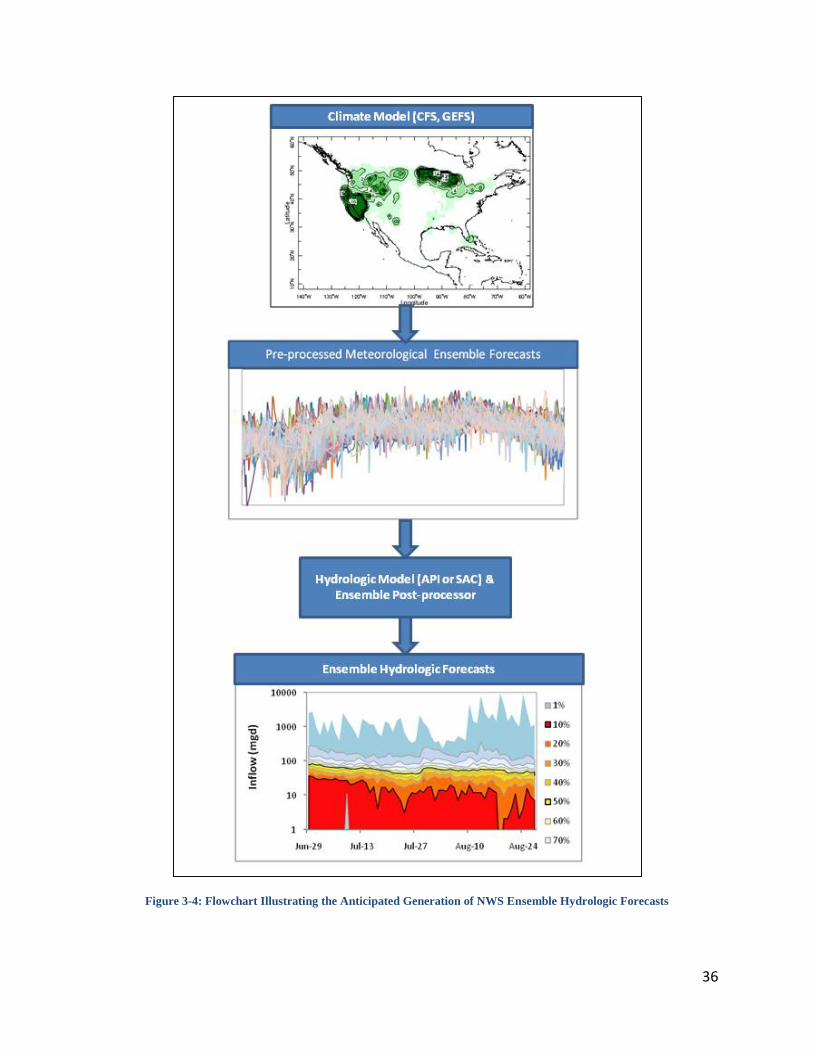
36
Figure 3-4: Flowchart Illustrating the Anticipated Generation of NWS Ensemble Hydrologic Forecasts
37
4. Operations Support Tool Usage
OST is an analytical tool for supporting the City’s operators and managers in both short-term and
long-term decision making. OST makes use of real-time system information (e.g. reservoir
levels, streamflows) and forecasts (e.g. streamflows, meteorological drivers) to provide the City
with objective, data-based decision support that will improve operations system-wide, including
operation of the Delaware reservoirs and potentially in improving the Delaware release program.
The following sections describe the expected use cases for OST, with respect to the overall
system (Section 4.1) and in the context of the Delaware Reservoir release program (Section 4.2).
4.1. OST Usage - General
There are two operating modes for OST, Position Analysis (PA) and Simulation (Sim) modes.
PA mode generally is intended to support near-real time operations decision-making. PA
simulations begin on today’s date and look forward (days, months) using the forecasted inflow
and meteorological drivers. All members of the forecast ensemble begin from the same set of
initial system conditions, which would include today’s reservoir storage levels, recent
streamflows, etc. Typically, these PA simulations might include a “baseline” operations scenario
plus one or more scenarios representing alternate operating rules. The impact of these alternate
operations can then be evaluated based on system performance measures.
In contrast, rather than running an ensemble of forecasts for a short period of time (i.e. less than
one year), Sim mode consists of a single long-term (e.g. 80 years of historical hydrology for the
New York City OST) simulation. This allows for evaluation of operating rules or infrastructure
changes over a long-term basis and will typically be used for development/testing of long-term
operating rules and for capital planning. In addition, Sim mode could be used to evaluate the
sensitivity of system parameters to long-term hydrologic changes (e.g. climate change scenarios).
4.1.1. Operational Projections
System operators/managers will use OST to evaluate the potential status of the New York City
water supply system for periods of up to roughly one year in the future under current and/or
alternative operating policies. OST will allow operators to conduct such PA simulations using
historical reservoir flows, Hirsch inflow forecasts, or National Weather Service (NWS) inflow
forecasts.
OST will facilitate the rapid development of alternatives for testing and provide efficient and
effective means of comparing the predicted results for the alternatives. The projections will
specifically include both hydrologic and water quality parameters. The water quality analyses
will be specifically targeted at evaluating filtration avoidance criteria and relevant in-stream
water quality standards, including temperature and turbidity. OST will automatically archive all
38
evaluations supporting operational decisions, and provide a means for capturing real-time and
retrospective comments on the basis for decisions.
4.1.2. Refill Probability and Drought Risk Analysis
OST will enable system operators and managers to quickly and routinely conduct robust refill
probability analyses using PA mode. OST will automatically access ensemble inflow forecasts
that take into account current basin conditions, and characterize the likely range of reservoir
inflows over the coming months. Each of these forecasts is fed into the OASIS model, which
then simulates operations – under realistic operating rules and release requirements – for the
length of the planning period (e.g. until June 1). The results of the PA simulations can be
interpreted to estimate the probability of refill by the following June 1. Operators will be able to
conduct runs under baseline versus alternative operating rules, and thereby compare the potential
impacts of near-term operational decisions on long-term supply reliability. In addition, OST will
allow for estimation of the probability of reaching a low storage threshold at the height of the
drawdown period that could trigger a drought response.
4.1.3. Outage Planning and Emergency Management
The problem of aging infrastructure is perhaps the greatest single challenge facing utilities
nationwide, and New York City is no exception. Critical portions of the system will have to be
taken off-line for planned repair/rehabilitation for extended periods of time without service
interruptions, while minimizing any potential impact on public health and safety. In addition, as
is the case for any utility, there is always the risk of unplanned infrastructure outages that require
rapid decision-making to maintain system function. System managers and operators need to be
able to assess the long and short-term risks associated with taking facilities off-line and be able
to evaluate mitigation plans for these outages.
OST will support the City’s efforts to prepare for planned outages of critical facilities. OST will
allow operators to schedule a planned facility shutdown, test rules for balancing the system prior
to the shutdown, and evaluate the probability that the system can sustain and recover from the
shutdown without encountering low storage levels. OST will also support the City’s efforts to
rapidly respond to unplanned facility outages and water quality contamination events by
allowing operators/managers to test alternative operations response and demand reduction
strategies on-the-fly.
4.1.4. Operating Rule Development and Water Supply Planning
OST will provide the City with an analytical platform to conduct long-term planning analyses,
evaluate and adopt formal system operating rules, and perform climate change impact
assessments and other studies. All of the analytical capabilities of the New York City OASIS-
W2 model that currently support long-term planning and rule-development applications will be
preserved in OST. In addition, OST will provide planners with the ability to test operations based
39
on Hirsch or NWS inflow forecasts. OST inflow database will include hindcasts that can be
referenced to test such operating rules.
In testing potential long-term operating rules, the user would prepare several long-term
simulations representing baseline or default operations as well as the alternative sets of
operations to be tested. These simulations would be conducted using the historical inflows (e.g.
using the 80-year record), allowing the user to evaluate the performance of each rule set over the
range of hydrologic conditions represented by the historical record. Rules that would rely on
inflow forecasts could be tested over the historical record using the hindcasts, which represent
the forecasts that would have been available for each day in the record.
The user’s ability to construct alternatives and compare runs will also be enhanced. Provision
will be made to allow users to drive the underlying OASIS and W2 models with alternative
hydrologic and meteorological scenarios. Hardware specifications for OST servers and databases
will support intensive usage by modelers, planners, and system operators.
4.1.5. Climate Change Planning and Demand Management Studies
OST is driven by a set of reservoir inflows, which may be historical inflows, forecasted inflows,
or some other time series of interest. Model simulations can be conducted with OST using inflow
time series that represent flows under different climate change operations. This will allow the
City to evaluate the probability of water supply and water quality challenges associated with
climate change. For example, larger and more frequent storm events could increase the
frequency and magnitude of turbidity events in the Catskill reservoirs, leading to the need for
increased reliance on the Delaware supplies.
In addition, OST simulations can be used to evaluate the impacts of increased future demands, as
the City’s current projections indicate an increase of roughly 100 mgd by the year 2020.
Scenarios can be developed to look at possible changes in operations, demand reduction
strategies, and alternate supplies to mitigate increased demand.
4.1.6. New Infrastructure
A major function of OST will be to provide decision support for planning and utilization of new
infrastructure, such as the Delaware Aqueduct Shaft 4 connection to the Catskill Aqueduct and
the repair of the Rondout West Branch (RWB) Tunnel. When installing and repairing Aqueduct
infrastructure, the tunnels need to be drained and kept dry until work is completed. In these
instances, it is important to understand the risks to the system’s water supply and water quality
reliability. Using the ensemble streamflow forecasts, OST will assist in quantifying these risks.
OST will further assist operators in developing operating rules for optimum use of new
infrastructure. For example, when the Delaware Aqueduct Shaft 4 connection is complete, the
City may use OST to optimize its operation for turbidity control. Suppose the streamflow
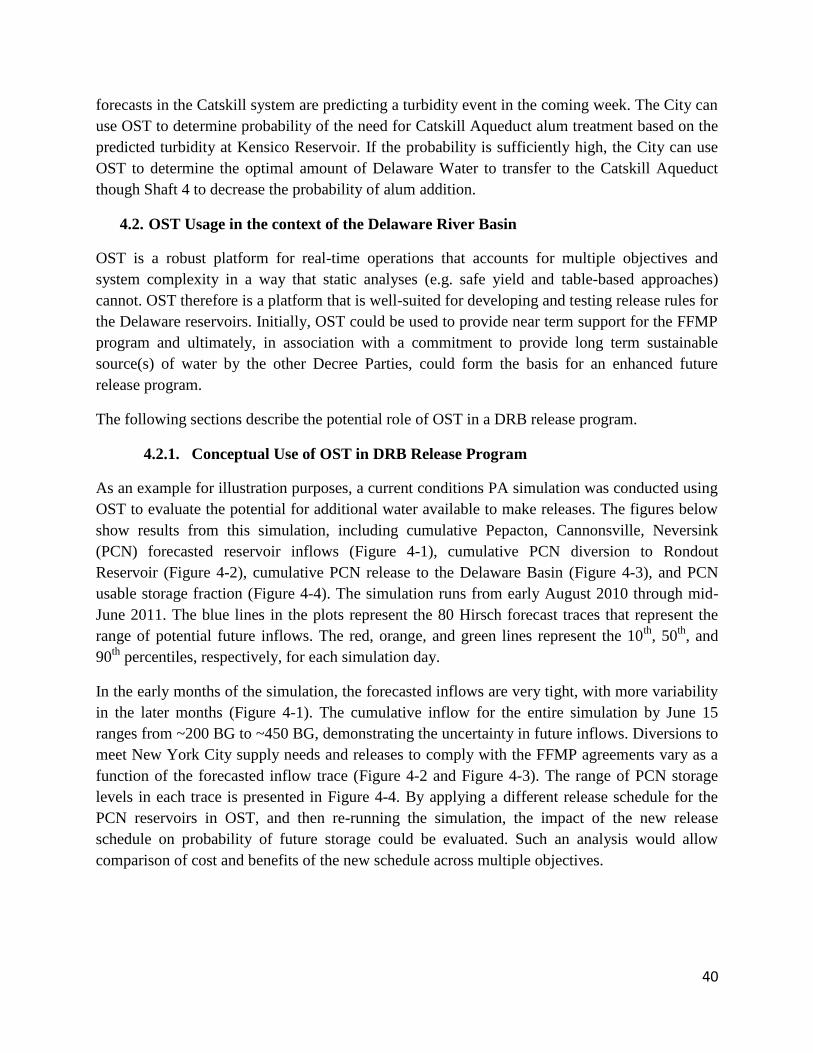
40
forecasts in the Catskill system are predicting a turbidity event in the coming week. The City can
use OST to determine probability of the need for Catskill Aqueduct alum treatment based on the
predicted turbidity at Kensico Reservoir. If the probability is sufficiently high, the City can use
OST to determine the optimal amount of Delaware Water to transfer to the Catskill Aqueduct
though Shaft 4 to decrease the probability of alum addition.
4.2. OST Usage in the context of the Delaware River Basin
OST is a robust platform for real-time operations that accounts for multiple objectives and
system complexity in a way that static analyses (e.g. safe yield and table-based approaches)
cannot. OST therefore is a platform that is well-suited for developing and testing release rules for
the Delaware reservoirs. Initially, OST could be used to provide near term support for the FFMP
program and ultimately, in association with a commitment to provide long term sustainable
source(s) of water by the other Decree Parties, could form the basis for an enhanced future
release program.
The following sections describe the potential role of OST in a DRB release program.
4.2.1. Conceptual Use of OST in DRB Release Program
As an example for illustration purposes, a current conditions PA simulation was conducted using
OST to evaluate the potential for additional water available to make releases. The figures below
show results from this simulation, including cumulative Pepacton, Cannonsville, Neversink
(PCN) forecasted reservoir inflows (Figure 4-1), cumulative PCN diversion to Rondout
Reservoir (Figure 4-2), cumulative PCN release to the Delaware Basin (Figure 4-3), and PCN
usable storage fraction (Figure 4-4). The simulation runs from early August 2010 through mid-
June 2011. The blue lines in the plots represent the 80 Hirsch forecast traces that represent the
range of potential future inflows. The red, orange, and green lines represent the 10th
, 50th
, and
90th
percentiles, respectively, for each simulation day.
In the early months of the simulation, the forecasted inflows are very tight, with more variability
in the later months (Figure 4-1). The cumulative inflow for the entire simulation by June 15
ranges from ~200 BG to ~450 BG, demonstrating the uncertainty in future inflows. Diversions to
meet New York City supply needs and releases to comply with the FFMP agreements vary as a
function of the forecasted inflow trace (Figure 4-2 and Figure 4-3). The range of PCN storage
levels in each trace is presented in Figure 4-4. By applying a different release schedule for the
PCN reservoirs in OST, and then re-running the simulation, the impact of the new release
schedule on probability of future storage could be evaluated. Such an analysis would allow
comparison of cost and benefits of the new schedule across multiple objectives.
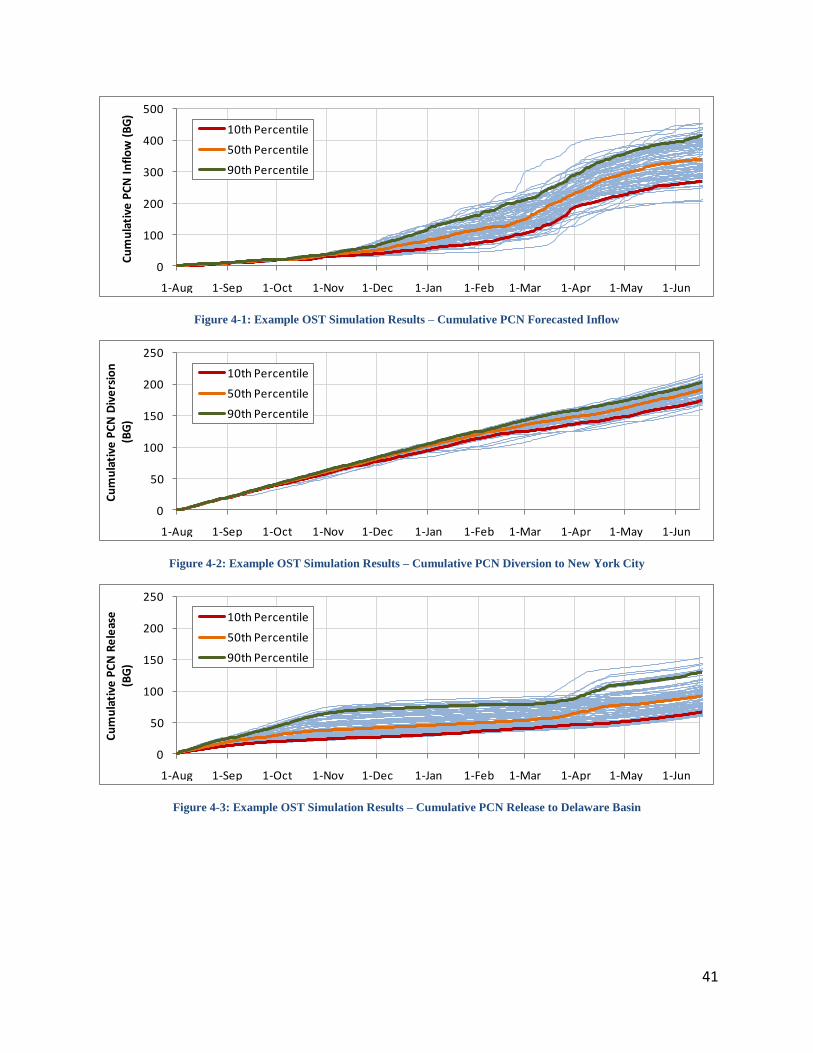
41
Figure 4-1: Example OST Simulation Results – Cumulative PCN Forecasted Inflow
Figure 4-2: Example OST Simulation Results – Cumulative PCN Diversion to New York City
Figure 4-3: Example OST Simulation Results – Cumulative PCN Release to Delaware Basin
0
100
200
300
400
500
1-Aug 1-Sep 1-Oct 1-Nov 1-Dec 1-Jan 1-Feb 1-Mar 1-Apr 1-May 1-Jun
Cu
mu
lati
ve P
CN
In
flo
w (
BG
)10th Percentile
50th Percentile
90th Percentile
0
50
100
150
200
250
1-Aug 1-Sep 1-Oct 1-Nov 1-Dec 1-Jan 1-Feb 1-Mar 1-Apr 1-May 1-Jun
Cu
mu
lati
ve P
CN
Div
ers
ion
(B
G)
10th Percentile
50th Percentile
90th Percentile
0
50
100
150
200
250
1-Aug 1-Sep 1-Oct 1-Nov 1-Dec 1-Jan 1-Feb 1-Mar 1-Apr 1-May 1-Jun
Cu
mu
lati
ve P
CN
Re
leas
e
(BG
)
10th Percentile
50th Percentile
90th Percentile

42
Figure 4-4: Example OST Simulation Results – PCN Usable Storage Fraction
4.2.2. OST in Support of the FFMP Agreement
OST can initially support releases under the current FFMP program by providing an analytical
tool to evaluate the volume of water available for release. Since OST includes operating rules for
the entire New York City System, it necessarily accounts for water quantity, water quality,
economics, and other objectives throughout the system, providing a more realistic accounting of
water and protecting water supply reliability objectives, such as ensuring refill prior to the start
of the drawdown season.
Since OST relies on ensemble forecasts of possible future inflows, this approach would represent
a risk-based approach, in which the risks of not meeting water supply and water quality
objectives can be quantified. A risk-based approach would protect the nine million people who
rely on the City’s water supply system daily while helping to define a forecast-based excess
release quantity of additional water from unallocated Delaware Basin storage that can be made
available to meet enhanced Delaware Basin release objectives, given a commitment by the other
Decree Party members to provide long-term, sustainable source(s) of water in the future. More
generally, better system-wide operation with OST will protect the New York City supply and
provide benefits to downstream basin stakeholders.
4.2.3. OST Use under Modified Release Plan
OST would further enable the DRB Decree Parties to develop enhanced FFMP programs (similar
to the releases program suggested by Fisheries staff of NYS DEC and PA FBC in their Joint
Fisheries White Paper (JFWP)) based on Decree Parties’ commitment to long-term
sustainability. OST enables sensitivity testing of alternative operating rules to variable system
parameters (e.g. demand, infrastructure etc). Better system-wide operations with OST will ensure
the City is able to meet its water supply needs and provide a great opportunity for enhanced
0.2
0.4
0.6
0.8
1
1-Aug 1-Sep 1-Oct 1-Nov 1-Dec 1-Jan 1-Feb 1-Mar 1-Apr 1-May 1-Jun
PC
N U
sab
le S
tora
ge
Frac
tio
n10th Percentile
50th Percentile
90th Percentile
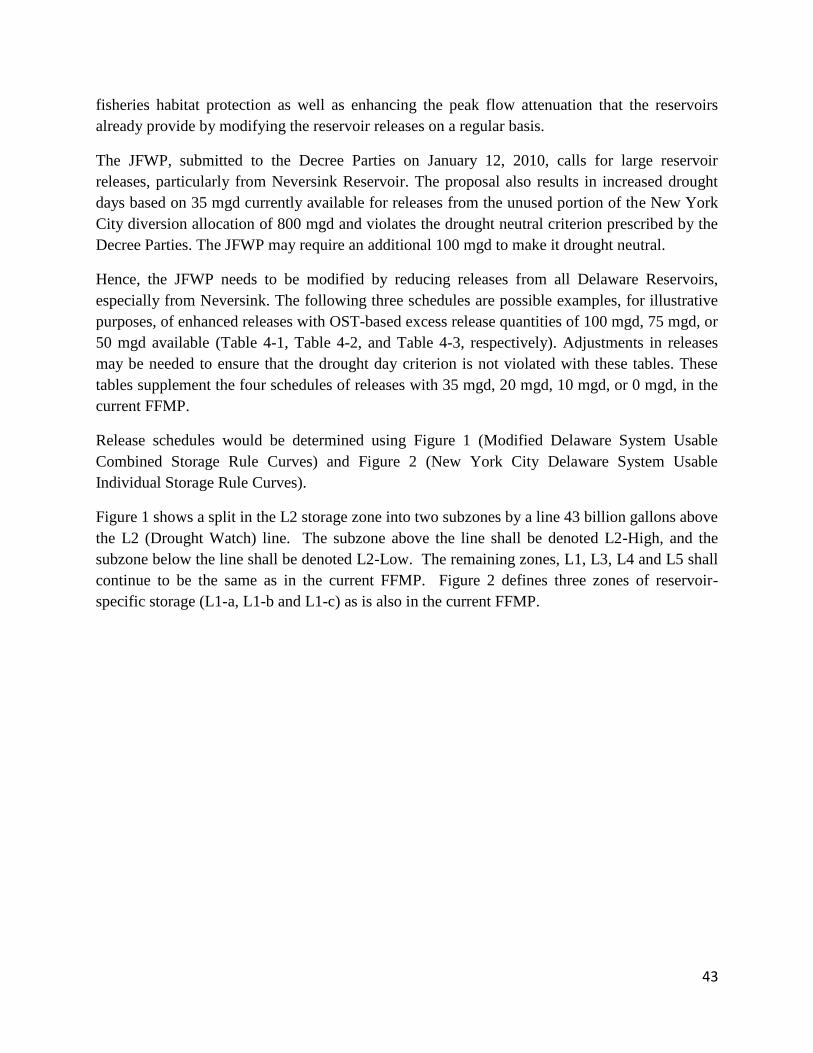
43
fisheries habitat protection as well as enhancing the peak flow attenuation that the reservoirs
already provide by modifying the reservoir releases on a regular basis.
The JFWP, submitted to the Decree Parties on January 12, 2010, calls for large reservoir
releases, particularly from Neversink Reservoir. The proposal also results in increased drought
days based on 35 mgd currently available for releases from the unused portion of the New York
City diversion allocation of 800 mgd and violates the drought neutral criterion prescribed by the
Decree Parties. The JFWP may require an additional 100 mgd to make it drought neutral.
Hence, the JFWP needs to be modified by reducing releases from all Delaware Reservoirs,
especially from Neversink. The following three schedules are possible examples, for illustrative
purposes, of enhanced releases with OST-based excess release quantities of 100 mgd, 75 mgd, or
50 mgd available (Table 4-1, Table 4-2, and Table 4-3, respectively). Adjustments in releases
may be needed to ensure that the drought day criterion is not violated with these tables. These
tables supplement the four schedules of releases with 35 mgd, 20 mgd, 10 mgd, or 0 mgd, in the
current FFMP.
Release schedules would be determined using Figure 1 (Modified Delaware System Usable
Combined Storage Rule Curves) and Figure 2 (New York City Delaware System Usable
Individual Storage Rule Curves).
Figure 1 shows a split in the L2 storage zone into two subzones by a line 43 billion gallons above
the L2 (Drought Watch) line. The subzone above the line shall be denoted L2-High, and the
subzone below the line shall be denoted L2-Low. The remaining zones, L1, L3, L4 and L5 shall
continue to be the same as in the current FFMP. Figure 2 defines three zones of reservoir-
specific storage (L1-a, L1-b and L1-c) as is also in the current FFMP.
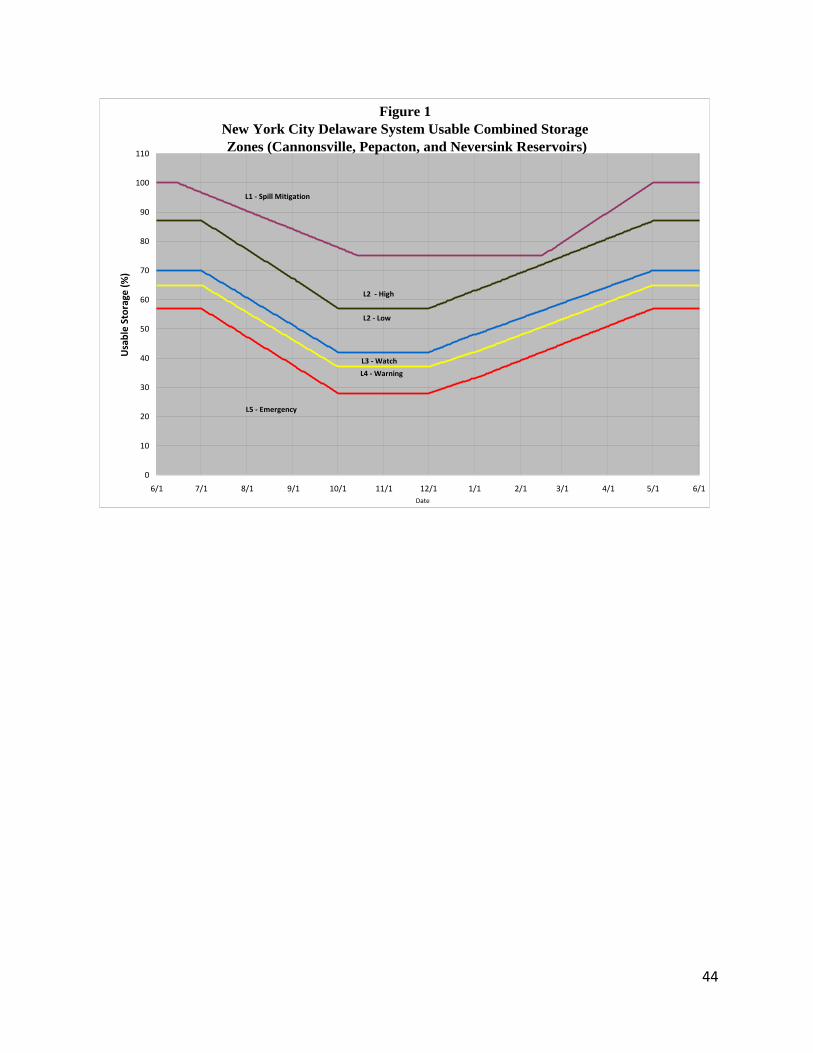
44
Figure 1
New York City Delaware System Usable Combined Storage
Zones (Cannonsville, Pepacton, and Neversink Reservoirs)
0
10
20
30
40
50
60
70
80
90
100
110
6/1 7/1 8/1 9/1 10/1 11/1 12/1 1/1 2/1 3/1 4/1 5/1 6/1
Usa
ble
Sto
rage
(%
)
L5 - Emergency
L1 - Spill Mitigation
L2 - High
L2 - Low
L4 - Warning
L3 - Watch
Date
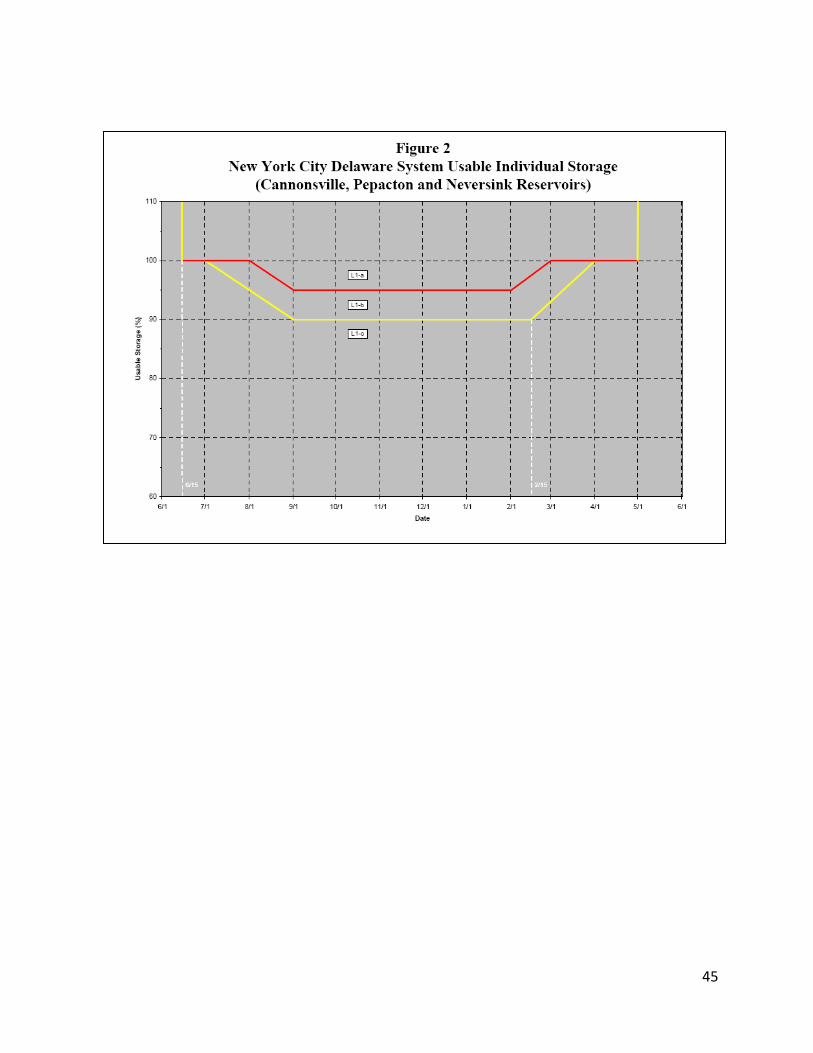
45
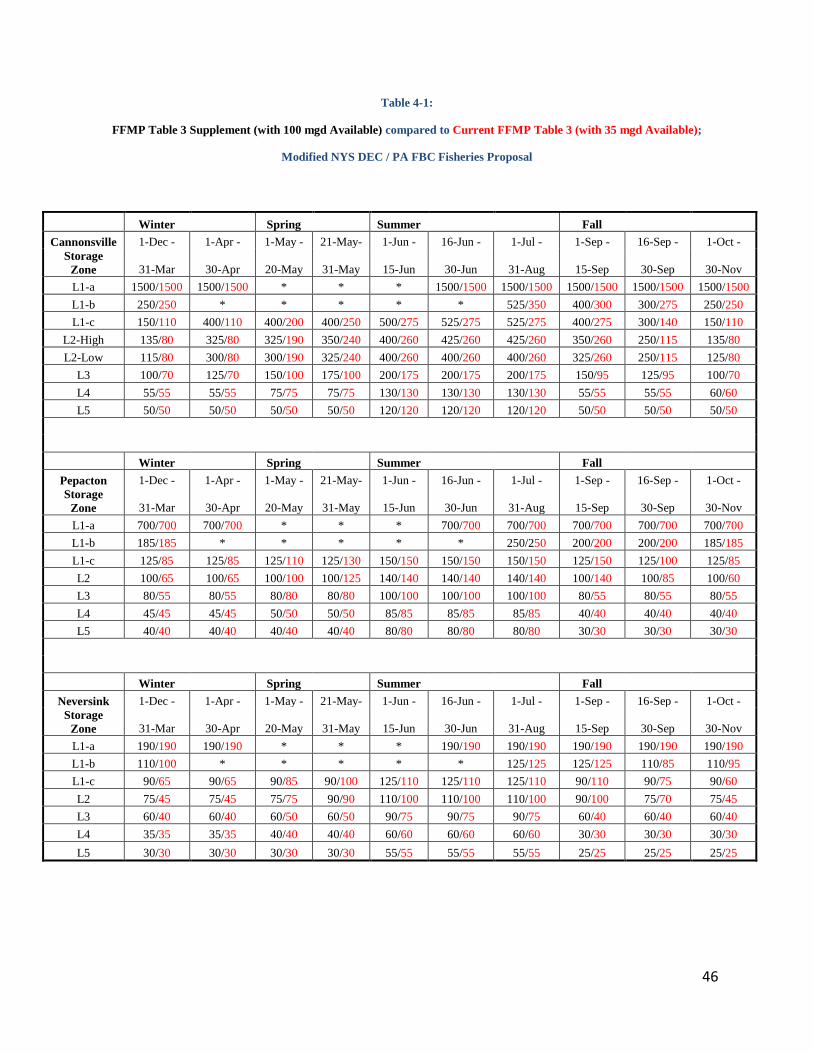
46
Table 4-1:
FFMP Table 3 Supplement (with 100 mgd Available) compared to Current FFMP Table 3 (with 35 mgd Available);
Modified NYS DEC / PA FBC Fisheries Proposal
Winter Spring Summer Fall
Cannonsville 1-Dec - 1-Apr - 1-May - 21-May- 1-Jun - 16-Jun - 1-Jul - 1-Sep - 16-Sep - 1-Oct -
Storage
Zone 31-Mar 30-Apr 20-May 31-May 15-Jun 30-Jun 31-Aug 15-Sep 30-Sep 30-Nov
L1-a 1500/1500 1500/1500 * * * 1500/1500 1500/1500 1500/1500 1500/1500 1500/1500
L1-b 250/250 * * * * * 525/350 400/300 300/275 250/250
L1-c 150/110 400/110 400/200 400/250 500/275 525/275 525/275 400/275 300/140 150/110
L2-High 135/80 325/80 325/190 350/240 400/260 425/260 425/260 350/260 250/115 135/80
L2-Low 115/80 300/80 300/190 325/240 400/260 400/260 400/260 325/260 250/115 125/80
L3 100/70 125/70 150/100 175/100 200/175 200/175 200/175 150/95 125/95 100/70
L4 55/55 55/55 75/75 75/75 130/130 130/130 130/130 55/55 55/55 60/60
L5 50/50 50/50 50/50 50/50 120/120 120/120 120/120 50/50 50/50 50/50
Winter Spring Summer Fall
Pepacton 1-Dec - 1-Apr - 1-May - 21-May- 1-Jun - 16-Jun - 1-Jul - 1-Sep - 16-Sep - 1-Oct -
Storage
Zone 31-Mar 30-Apr 20-May 31-May 15-Jun 30-Jun 31-Aug 15-Sep 30-Sep 30-Nov
L1-a 700/700 700/700 * * * 700/700 700/700 700/700 700/700 700/700
L1-b 185/185 * * * * * 250/250 200/200 200/200 185/185
L1-c 125/85 125/85 125/110 125/130 150/150 150/150 150/150 125/150 125/100 125/85
L2 100/65 100/65 100/100 100/125 140/140 140/140 140/140 100/140 100/85 100/60
L3 80/55 80/55 80/80 80/80 100/100 100/100 100/100 80/55 80/55 80/55
L4 45/45 45/45 50/50 50/50 85/85 85/85 85/85 40/40 40/40 40/40
L5 40/40 40/40 40/40 40/40 80/80 80/80 80/80 30/30 30/30 30/30
Winter Spring Summer Fall
Neversink 1-Dec - 1-Apr - 1-May - 21-May- 1-Jun - 16-Jun - 1-Jul - 1-Sep - 16-Sep - 1-Oct -
Storage
Zone 31-Mar 30-Apr 20-May 31-May 15-Jun 30-Jun 31-Aug 15-Sep 30-Sep 30-Nov
L1-a 190/190 190/190 * * * 190/190 190/190 190/190 190/190 190/190
L1-b 110/100 * * * * * 125/125 125/125 110/85 110/95
L1-c 90/65 90/65 90/85 90/100 125/110 125/110 125/110 90/110 90/75 90/60
L2 75/45 75/45 75/75 90/90 110/100 110/100 110/100 90/100 75/70 75/45
L3 60/40 60/40 60/50 60/50 90/75 90/75 90/75 60/40 60/40 60/40
L4 35/35 35/35 40/40 40/40 60/60 60/60 60/60 30/30 30/30 30/30
L5 30/30 30/30 30/30 30/30 55/55 55/55 55/55 25/25 25/25 25/25

47
Table 4-2:
FFMP Table 3 Supplement (with 75 mgd Available) compared to Current FFMP Table 3 (with 35 mgd Available);
Modified NYS DEC / PA FBC Fisheries Proposal
Winter Spring Summer Fall
Cannonsville 1-Dec - 1-Apr - 1-May - 21-May- 1-Jun - 16-Jun - 1-Jul - 1-Sep - 16-Sep - 1-Oct -
Storage
Zone 31-Mar 30-Apr 20-May 31-May 15-Jun 30-Jun 31-Aug 15-Sep 30-Sep 30-Nov
L1-a 1500/1500 1500/1500 * * * 1500/1500 1500/1500 1500/1500 1500/1500 1500/1500
L1-b 250/250 * * * * * 525/350 400/300 300/275 250/250
L1-c 150/110 400/110 400/200 400/250 500/275 525/275 525/275 400/275 300/140 150/110
L2-High 125/80 300/80 300/190 350/240 425/260 425/260 425/260 350/260 275/115 125/80
L2-Low 100/80 250/80 250/190 300/240 350/260 350/260 350/260 300/260 200/115 100/80
L3 75/70 75/70 100/100 100/100 175/175 175/175 175/175 100/95 100/95 75/70
L4 55/55 55/55 75/75 75/75 130/130 130/130 130/130 55/55 55/55 60/60
L5 50/50 50/50 50/50 50/50 120/120 120/120 120/120 50/50 50/50 50/50
Winter Spring Summer Fall
Pepacton 1-Dec - 1-Apr - 1-May - 21-May- 1-Jun - 16-Jun - 1-Jul - 1-Sep - 16-Sep - 1-Oct -
Storage
Zone 31-Mar 30-Apr 20-May 31-May 15-Jun 30-Jun 31-Aug 15-Sep 30-Sep 30-Nov
L1-a 700/700 700/700 * * * 700/700 700/700 700/700 700/700 700/700
L1-b 185/185 * * * * * 250/250 200/200 200/200 185/185
L1-c 125/85 125/85 125/110 125/130 150/150 150/150 150/150 125/150 125/100 125/85
L2 90/65 90/65 90/100 90/125 140/140 140/140 140/140 90/140 90/85 90/60
L3 80/55 80/55 80/80 80/80 100/100 100/100 100/100 80/55 80/55 80/55
L4 45/45 45/45 50/50 50/50 85/85 85/85 85/85 40/40 40/40 40/40
L5 40/40 40/40 40/40 40/40 80/80 80/80 80/80 30/30 30/30 30/30
Winter Spring Summer Fall
Neversink 1-Dec - 1-Apr - 1-May - 21-May- 1-Jun - 16-Jun - 1-Jul - 1-Sep - 16-Sep - 1-Oct -
Storage
Zone 31-Mar 30-Apr 20-May 31-May 15-Jun 30-Jun 31-Aug 15-Sep 30-Sep 30-Nov
L1-a 190/190 190/190 * * * 190/190 190/190 190/190 190/190 190/190
L1-b 110/100 * * * * * 125/125 125/125 110/85 110/95
L1-c 90/65 90/65 90/85 90/100 125/110 125/110 125/110 90/110 90/75 90/60
L2 75/45 75/45 75/75 90/90 110/100 110/100 110/100 90/100 75/70 75/45
L3 60/40 60/40 60/50 60/50 90/75 90/75 90/75 60/40 60/40 60/40
L4 35/35 35/35 40/40 40/40 60/60 60/60 60/60 30/30 30/30 30/30
L5 30/30 30/30 30/30 30/30 55/55 55/55 55/55 25/25 25/25 25/25

48
Table 4-3:
FFMP Table 3 Supplement (with 50 mgd Available) compared to Current FFMP Table 3 (with 35 mgd Available);
Modified NYS DEC / PA FBC Fisheries Proposal
Winter Spring Summer Fall
Cannonsville 1-Dec - 1-Apr - 1-May - 21-May- 1-Jun - 16-Jun - 1-Jul - 1-Sep - 16-Sep - 1-Oct -
Storage
Zone 31-Mar 30-Apr 20-May 31-May 15-Jun 30-Jun 31-Aug 15-Sep 30-Sep 30-Nov
L1-a 1500/1500 1500/1500 * * * 1500/1500 1500/1500 1500/1500 1500/1500 1500/1500
L1-b 250/250 * * * * * 525/350 400/300 300/275 250/250
L1-c 150/110 300/110 300/200 350/250 425/275 450/275 450/275 350/275 250/140 150/110
L2-High 110/80 200/80 200/190 260/240 350/260 350/260 350/260 300/260 215/115 110/80
L2-Low 90/80 150/80 190/190 250/240 300/260 300/260 300/260 260/260 150/115 90/80
L3 75/70 75/70 100/100 100/100 175/175 175/175 175/175 100/95 100/95 75/70
L4 55/55 55/55 75/75 75/75 130/130 130/130 130/130 55/55 55/55 60/60
L5 50/50 50/50 50/50 50/50 120/120 120/120 120/120 50/50 50/50 50/50
Winter Spring Summer Fall
Pepacton 1-Dec - 1-Apr - 1-May - 21-May- 1-Jun - 16-Jun - 1-Jul - 1-Sep - 16-Sep - 1-Oct -
Storage
Zone 31-Mar 30-Apr 20-May 31-May 15-Jun 30-Jun 31-Aug 15-Sep 30-Sep 30-Nov
L1-a 700/700 700/700 * * * 700/700 700/700 700/700 700/700 700/700
L1-b 185/185 * * * * * 250/250 200/200 200/200 185/185
L1-c 125/85 125/85 125/110 125/130 150/150 150/150 150/150 125/150 125/100 125/85
L2 80/65 80/65 90/100 100/125 140/140 140/140 140/140 125/140 90/85 80/60
L3 70/55 70/55 80/80 80/80 100/100 100/100 100/100 70/55 70/55 70/55
L4 45/45 45/45 50/50 50/50 85/85 85/85 85/85 40/40 40/40 40/40
L5 40/40 40/40 40/40 40/40 80/80 80/80 80/80 30/30 30/30 30/30
Winter Spring Summer Fall
Neversink 1-Dec - 1-Apr - 1-May - 21-May- 1-Jun - 16-Jun - 1-Jul - 1-Sep - 16-Sep - 1-Oct -
Storage
Zone 31-Mar 30-Apr 20-May 31-May 15-Jun 30-Jun 31-Aug 15-Sep 30-Sep 30-Nov
L1-a 190/190 190/190 * * * 190/190 190/190 190/190 190/190 190/190
L1-b 110/100 * * * * * 125/125 125/125 110/85 110/95
L1-c 90/65 90/65 90/85 90/100 125/110 125/110 125/110 90/110 90/75 90/60
L2 60/45 60/45 75/75 90/90 110/100 110/100 110/100 90/100 75/70 60/45
L3 50/40 50/40 60/50 60/50 85/75 85/75 85/75 50/40 50/40 50/40
L4 35/35 35/35 40/40 40/40 60/60 60/60 60/60 30/30 30/30 30/30
L5 30/30 30/30 30/30 30/30 55/55 55/55 55/55 25/25 25/25 25/25
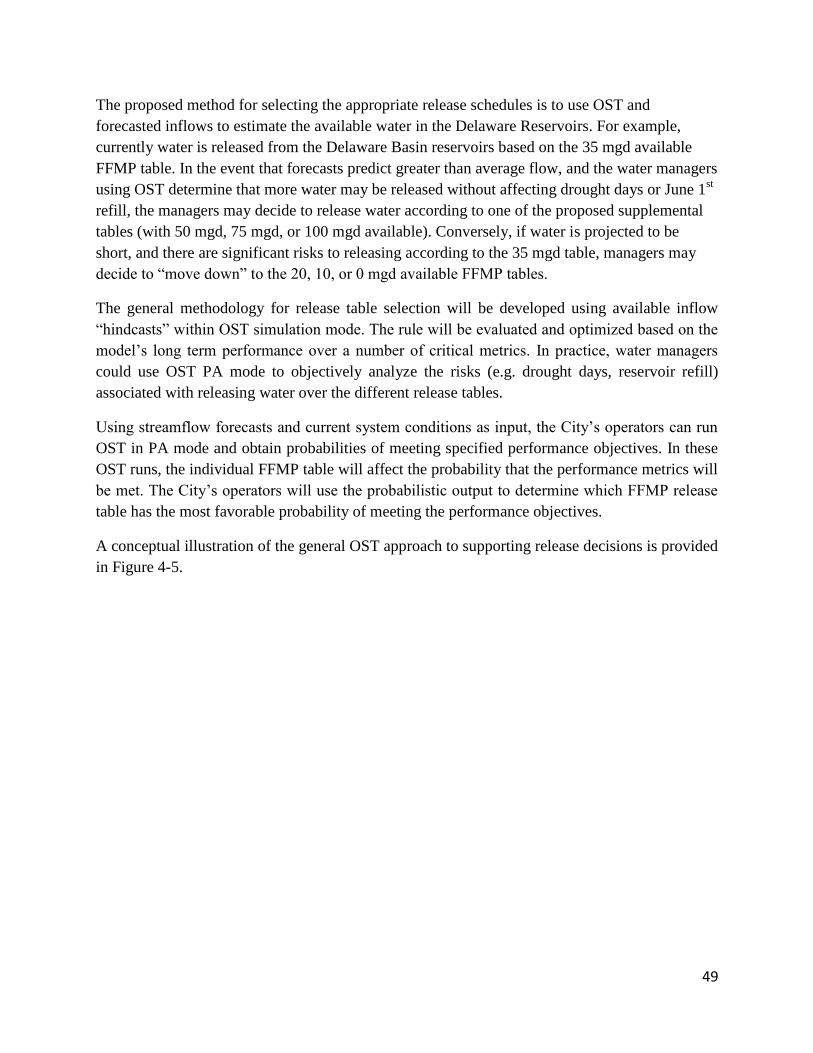
49
The proposed method for selecting the appropriate release schedules is to use OST and
forecasted inflows to estimate the available water in the Delaware Reservoirs. For example,
currently water is released from the Delaware Basin reservoirs based on the 35 mgd available
FFMP table. In the event that forecasts predict greater than average flow, and the water managers
using OST determine that more water may be released without affecting drought days or June 1st
refill, the managers may decide to release water according to one of the proposed supplemental
tables (with 50 mgd, 75 mgd, or 100 mgd available). Conversely, if water is projected to be
short, and there are significant risks to releasing according to the 35 mgd table, managers may
decide to “move down” to the 20, 10, or 0 mgd available FFMP tables.
The general methodology for release table selection will be developed using available inflow
“hindcasts” within OST simulation mode. The rule will be evaluated and optimized based on the
model’s long term performance over a number of critical metrics. In practice, water managers
could use OST PA mode to objectively analyze the risks (e.g. drought days, reservoir refill)
associated with releasing water over the different release tables.
Using streamflow forecasts and current system conditions as input, the City’s operators can run
OST in PA mode and obtain probabilities of meeting specified performance objectives. In these
OST runs, the individual FFMP table will affect the probability that the performance metrics will
be met. The City’s operators will use the probabilistic output to determine which FFMP release
table has the most favorable probability of meeting the performance objectives.
A conceptual illustration of the general OST approach to supporting release decisions is provided
in Figure 4-5.
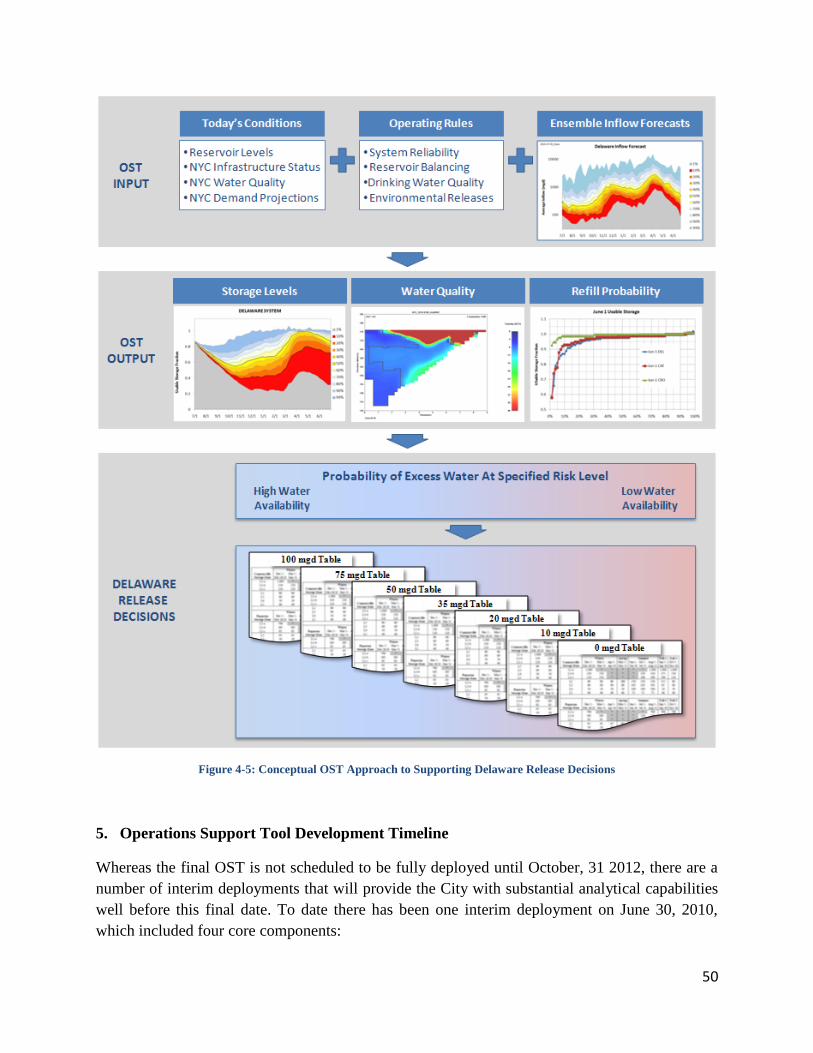
50
Figure 4-5: Conceptual OST Approach to Supporting Delaware Release Decisions
5. Operations Support Tool Development Timeline
Whereas the final OST is not scheduled to be fully deployed until October, 31 2012, there are a
number of interim deployments that will provide the City with substantial analytical capabilities
well before this final date. To date there has been one interim deployment on June 30, 2010,
which included four core components:
51
Hirsch Forecast application
Data Acquisition utilities
OST database
Oasis Assist data QA/QC utility
Earlier versions of OASIS used historical hydrology to drive position analysis runs, providing a
range of potential future scenarios without reference to current conditions. The June 30, 2010
deployment updated the model with a Hirsch Forecast application that computes an ensemble of
potential traces of future inflow. As described in Section 3.2.2, the Hirsch technique uses an
autoregressive time series model to modify the historical hydrology based on antecedent
hydrology. The resulting inflow traces are described as “conditional” forecasts and represent the
statistical probabilities of various magnitudes of inflow (based on historical flows) as well as the
current watershed and stream conditions.
To support this interim OST deployment, four utilities were developed for automatic acquisition
of data from the City’s EOH and WOH reservoirs, Delaware River Basin reservoirs, and USGS
gages. An automated Quality Assurance Quality Control utility was deployed to assist with data
verification, and an updated database using Microsoft SQL Server 2008 was developed to store
the requisite data.
Upcoming interim deployments include:
Fall 2010 – Deployment of the W2 water quality models in position analysis mode
Winter 2011 – Deployment of the Hirsch extended daily forecast and linkages with the
City’s WISKI database
Summer 2011 – Deployment of a prototype Graphical User Interface
Prior to final deployment, a beta version of OST and all requisite hardware will be deployed,
connected, and made fully operational at a City facility by the fall of 2011. Following
deployment, a one-year acceptance phase will allow the City to use the model and receive
technical support, troubleshooting, and minor interface customization services. This acceptance
phase will be followed by the deployment of the final OST.
52
Citations:
Cole, T. M., & Wells, S. A. (2006). CE-QUAL-W2: A Two-dimensional, Laterally Averaged,
Hydrodynamic and Water Quality Model. U.S. Army Engineering and Research Development.
Gannett Fleming/Hazen & Sawyer. (2009). Phase II Implementation Plan: Updates and
Supporting Analyses; Catskill Turbidity Control Studies.
Gannett Fleming/Hazen & Sawyer. (2008). Phase III Implementation Plan: Catskill Turbidity
Control Studies.
Hirsch, R. M. (1981). Stochastic Hydrologic Model for Drought Management. Journal of the
Water Resources Planning and Management Division , 303-313.
Hirsch, R. M. (1979). Synthetic Hydrology and Water Supply Reliability. Water Resources
Research , 1603-1615.
HydroLogics, Inc. (2007). User Manual for OASIS with OCL.
New York City Department of Environmental Protection. (2009). 2009 Watershed Water Quality
Monitoring Plan.
New York City Department of Environmental Protection. (2006). Long-term Watershed
Protection Program.
New York City Department of Environmental Protection. (2001). Watershed Protection
Program Summary.
New York State Department of Environmental Conservation. (2006). State Pollutant Discharge
Elimination System (SPDES) Discharge Permit for the Shandaken Tunnel Outlet.
US Environmental Protection Agency Region 2. (2002). New York City Filtration Avoidance
Determination. http://www.epa.gov/r02earth/water/nycshed/.
US Environmental Protection Agency Region 2. (2007). New York City Filtration Avoidance
Determination. http://www.epa.gov/r02earth/water/nycshed/.