Embed Size (px)
Citation preview
Out of Recession But Out of Sync:
Risks and Opportunities
in the Global Recovery
David Kelly,
Chief Market Strategist,
JP Morgan Funds
2
Highlights
The U.S. Outlook: From Recovery to ExpansionThe Global Outlook: Out of Recession but Out of SyncRisks Opportunities
3
-$2,000
$0
$2,000
$4,000
$6,000
$8,000
$10,000
$12,000
$14,000
$16,000
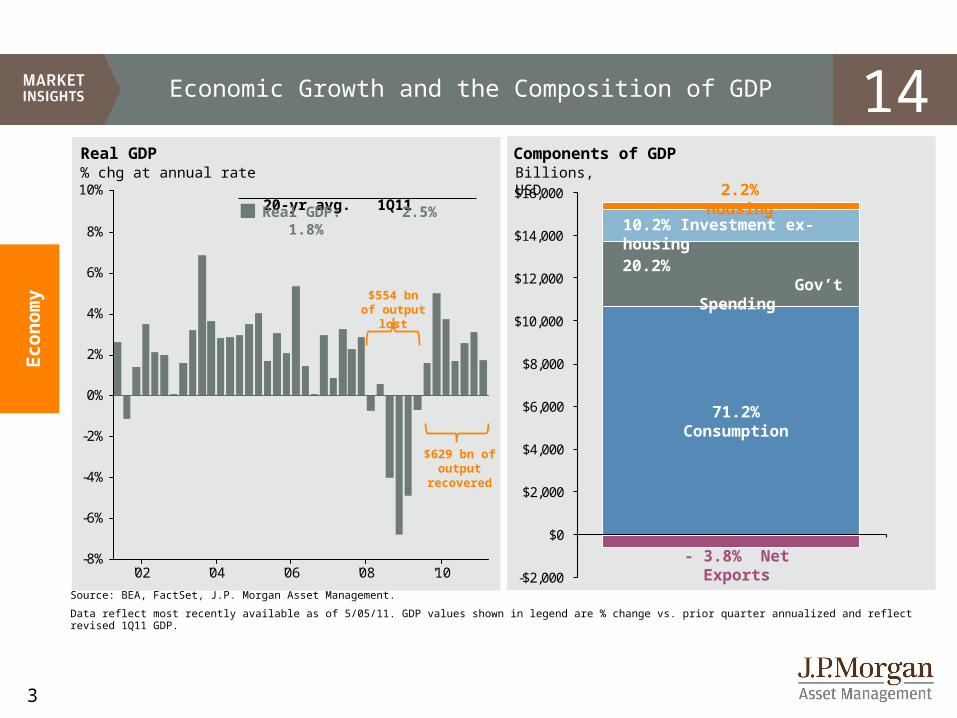
Economic Growth and the Composition of GDP
'02 '04 '06 '08 '10-8%
-6%
-4%
-2%
0%
2%
4%
6%
8%
10%
Source: BEA, FactSet, J.P. Morgan Asset Management.
Data reflect most recently available as of 5/05/11. GDP values shown in legend are % change vs. prior quarter annualized and reflect revised 1Q11 GDP.
Real GDP % chg at annual rate
Econ
om
y
20-yr avg. 1Q11
Real GDP: 2.5% 1.8%
Components of GDP
10.2% Investment ex-housing
71.2% Consumption
20.2% Gov’t Spending
Billions, USD2.2% Housing
- 3.8% Net Exports
$554 bn of output lost
$629 bn of output
recovered
14
4
'98 '00 '02 '04 '06 '08 '1040
45
50
55
60
65
70
75
'70 '75 '80 '85 '90 '95 '00 '05 '10-200
-150
-100
-50
0
50
100
150
'75 '80 '85 '90 '95 '00 '05 '100
400
800
1,200
1,600
2,000
2,400
'85 '90 '95 '00 '05 '108
10
12
14
16
18
20
22
24
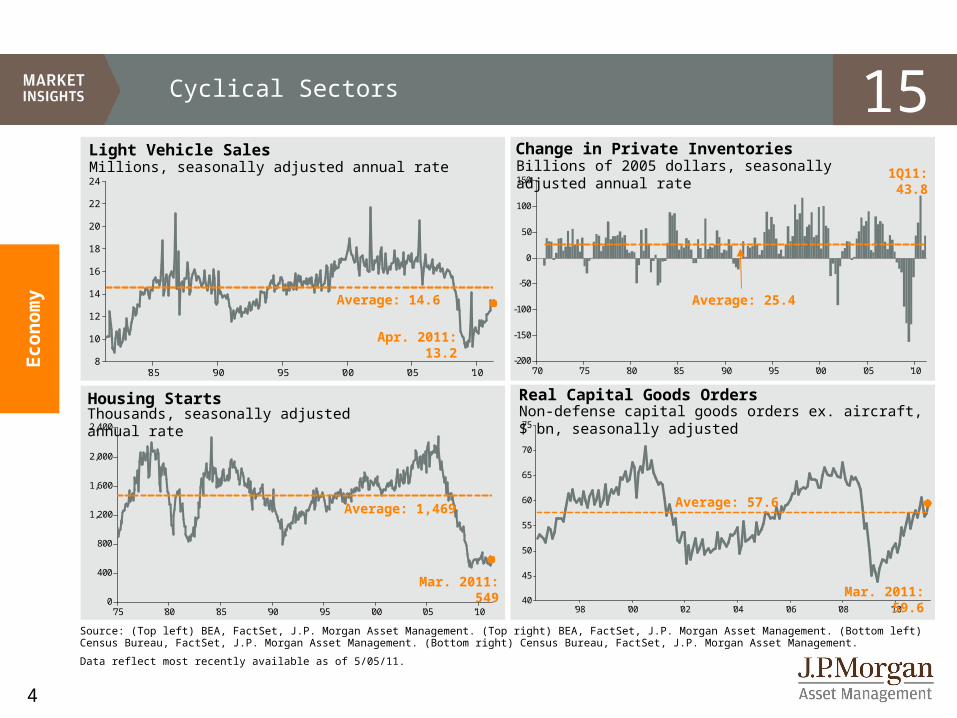
Cyclical Sectors
Econ
om
y
Change in Private Inventories
Source: (Top left) BEA, FactSet, J.P. Morgan Asset Management. (Top right) BEA, FactSet, J.P. Morgan Asset Management. (Bottom left) Census Bureau, FactSet, J.P. Morgan Asset Management. (Bottom right) Census Bureau, FactSet, J.P. Morgan Asset Management.
Data reflect most recently available as of 5/05/11.
Billions of 2005 dollars, seasonally adjusted annual rateMillions, seasonally adjusted annual rateLight Vehicle Sales
Real Capital Goods OrdersNon-defense capital goods orders ex. aircraft, $ bn, seasonally adjusted
Mar. 2011: 549
Housing StartsThousands, seasonally adjusted annual rate
Average: 14.6 Average: 25.4
Average: 57.6
Mar. 2011: 59.6
1Q11: 43.8
Apr. 2011: 13.2
Average: 1,469
15
5
'01 '02 '03 '04 '05 '06 '07 '08 '09 '10-1,000
-800
-600
-400
-200
0
200
400
600
'70 '80 '90 '00 '103%
4%
5%
6%
7%
8%
9%
10%
11%
12%
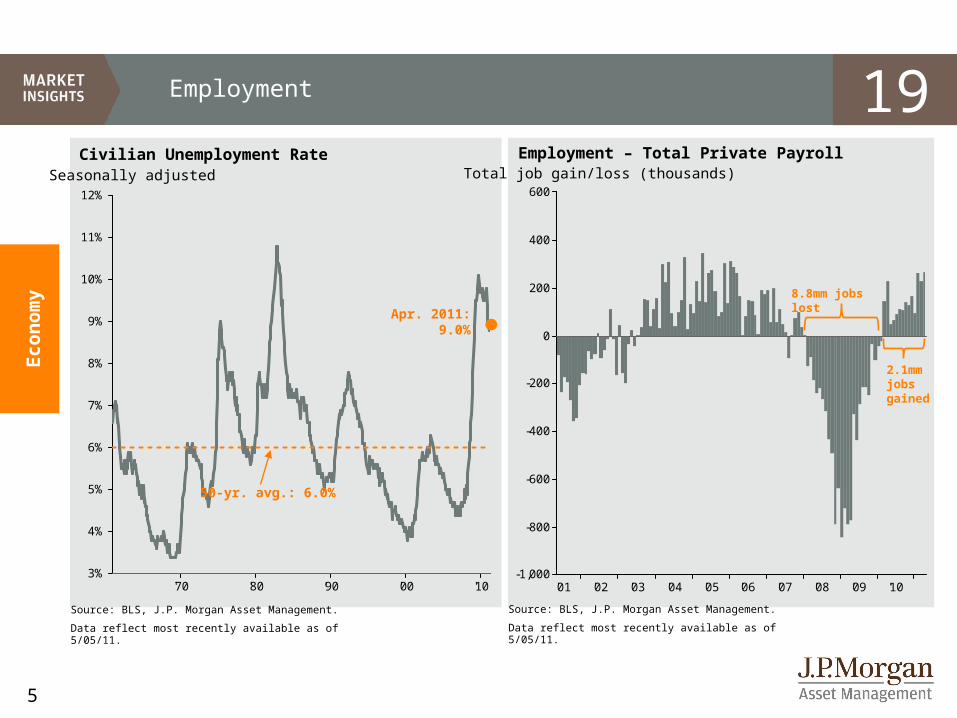
Employment
Source: BLS, J.P. Morgan Asset Management.
Data reflect most recently available as of 5/05/11.
Civilian Unemployment Rate Employment – Total Private Payroll
Econ
om
y
50-yr. avg.: 6.0%
Source: BLS, J.P. Morgan Asset Management.
Data reflect most recently available as of 5/05/11.
Seasonally adjusted Total job gain/loss (thousands)
Apr. 2011: 9.0%
8.8mm jobs lost
2.1mm jobs gained
19
6
-$1
$2
$5
$8
$11
$14
$17
$20
$23
$26
'10'08'06'04'02'00
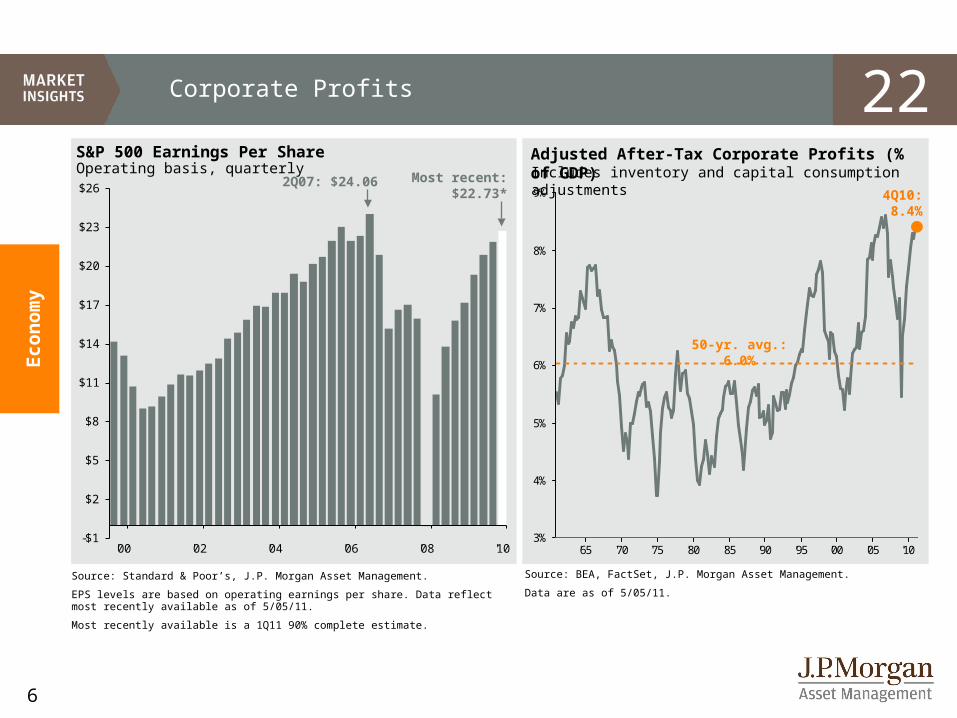
Corporate Profits
Source: BEA, FactSet, J.P. Morgan Asset Management.
Data are as of 5/05/11.
Adjusted After-Tax Corporate Profits (% of GDP)Includes inventory and capital consumption adjustments
Econ
om
y
S&P 500 Earnings Per ShareOperating basis, quarterly
Source: Standard & Poor’s, J.P. Morgan Asset Management.
EPS levels are based on operating earnings per share. Data reflect most recently available as of 5/05/11.
Most recently available is a 1Q11 90% complete estimate.
Most recent: $22.73*
'65 '70 '75 '80 '85 '90 '95 '00 '05 '103%
4%
5%
6%
7%
8%
9%
50-yr. avg.: 6.0%
2Q07: $24.064Q10:8.4%
22
7
'65 '70 '75 '80 '85 '90 '95 '00 '05 '10-3%
0%
3%
6%
9%
12%
15%
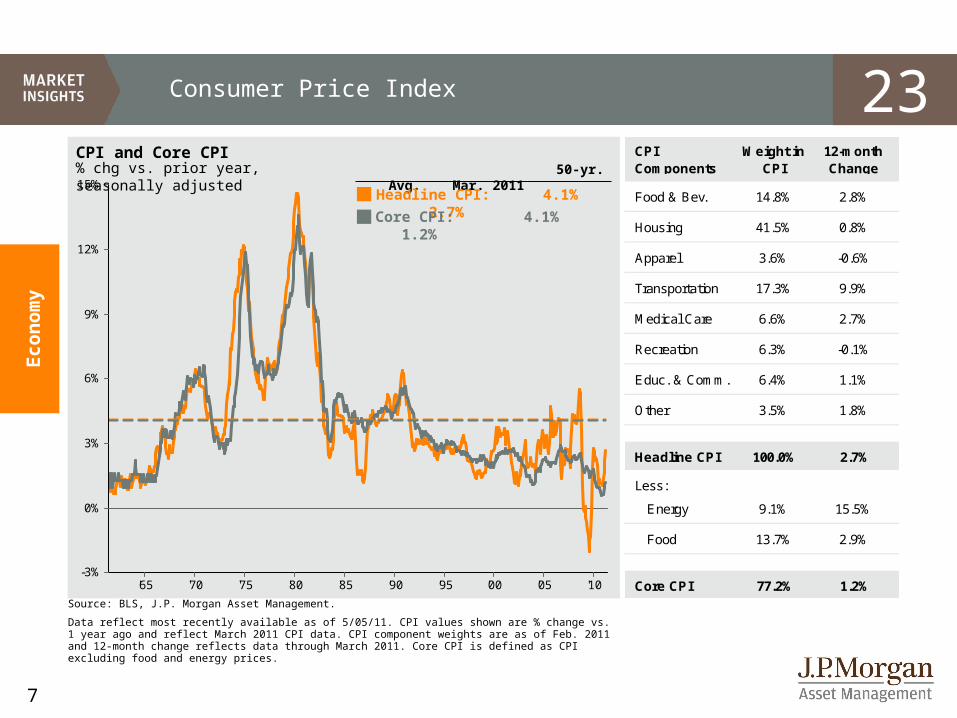
Source: BLS, J.P. Morgan Asset Management.
Data reflect most recently available as of 5/05/11. CPI values shown are % change vs. 1 year ago and reflect March 2011 CPI data. CPI component weights are as of Feb. 2011 and 12-month change reflects data through March 2011. Core CPI is defined as CPI excluding food and energy prices.
Econ
om
y
CPI and Core CPI 50-yr. Avg. Mar. 2011
Headline CPI: 4.1% 2.7% Core CPI: 4.1% 1.2%
% chg vs. prior year, seasonally adjusted
Consumer Price Index 23CPI Components
Weight in CPI
12-month Change
Food & Bev. 14.8% 2.8%
Housing 41.5% 0.8%
Apparel 3.6% -0.6%
Transportation 17.3% 9.9%
Medical Care 6.6% 2.7%
Recreation 6.3% -0.1%
Educ. & Comm. 6.4% 1.1%
Other 3.5% 1.8%
Headline CPI 100.0% 2.7%
Less:
Energy 9.1% 15.5%
Food 13.7% 2.9%
Core CPI 77.2% 1.2%
8
'05 '06 '07 '08 '09 '10$0.0
$0.5
$1.0
$1.5
$2.0
$2.5
$3.0
'88 '90 '92 '94 '96 '98 '00 '02 '04 '06 '08 '100%
2%
4%
6%
8%
10%
12%
'82 '84 '86 '88 '90 '92 '94 '96 '98 '00 '02 '04 '06 '08 '100%
2%
4%
6%
8%
10%
12%
14%
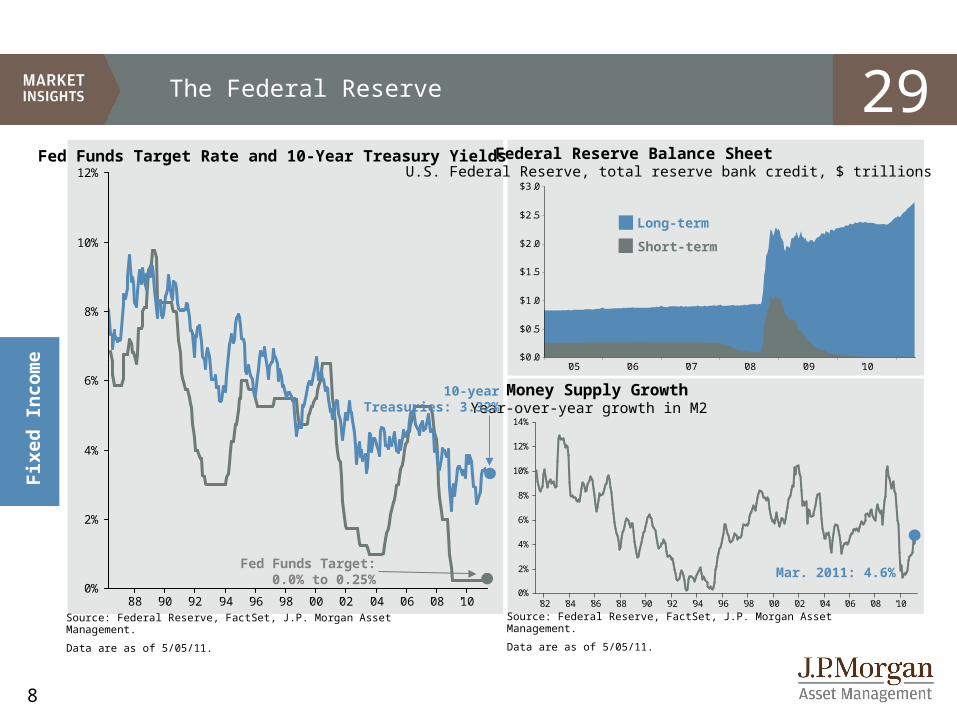
The Federal Reserve
Source: Federal Reserve, FactSet, J.P. Morgan Asset Management.
Data are as of 5/05/11.
Fix
ed
In
com
e
Fed Funds Target Rate and 10-Year Treasury Yields
Source: Federal Reserve, FactSet, J.P. Morgan Asset Management.
Data are as of 5/05/11.
Money Supply GrowthYear-over-year growth in M2
Federal Reserve Balance SheetU.S. Federal Reserve, total reserve bank credit, $ trillions
Long-term
Short-term
Fed Funds Target: 0.0% to 0.25%
10-year Treasuries: 3.32%
Mar. 2011: 4.6%
29
9
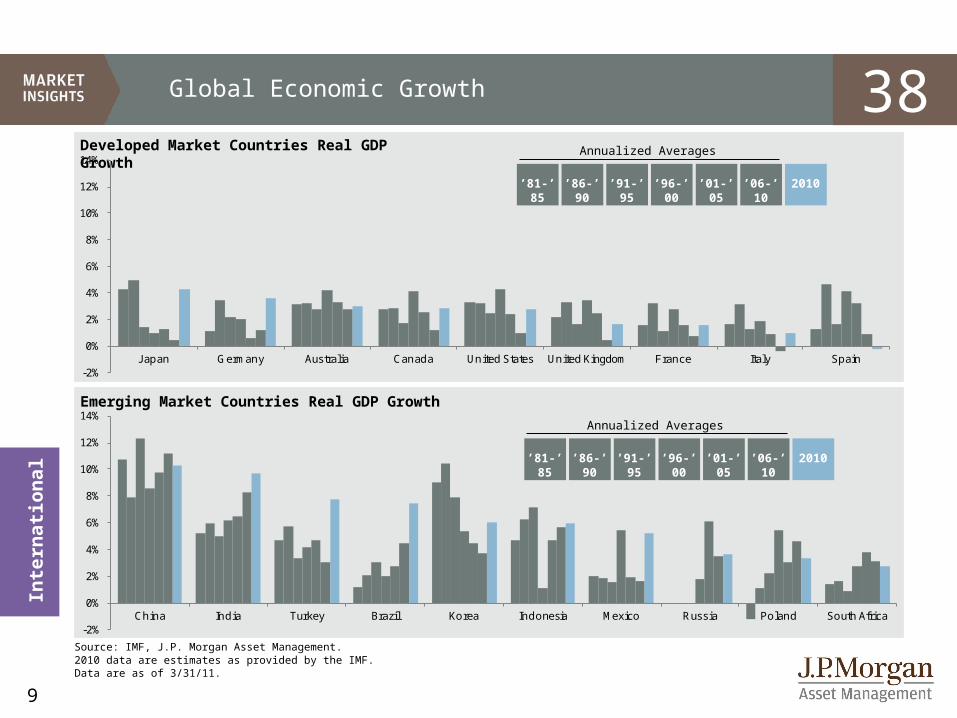
Source: IMF, J.P. Morgan Asset Management.2010 data are estimates as provided by the IMF.Data are as of 3/31/11.
Global Economic Growth
Inte
rnati
on
al
’81-’85
Developed Market Countries Real GDP Growth
Emerging Market Countries Real GDP Growth
’86-’90 ’91-’95 ’96-’00 ’01-’05 ’06-’10 2010
Annualized Averages
’81-’85 ’86-’90 ’91-’95 ’96-’00 ’01-’05 ’06-’10 2010
Annualized Averages
-2%
0%
2%
4%
6%
8%
10%
12%
14%
Japan Germany Australia Canada United States United Kingdom France Italy Spain
-2%
0%
2%
4%
6%
8%
10%
12%
14%
China India Turkey Brazil Korea Indonesia Mexico Russia Poland South Africa
38
10
Risks
Downside RisksOil Emerging Market/Commodity BubblesSovereign Debt
Upside RisksConfidence
11
0
1
2
3
4
5
6
7
8
'94 '96 '98 '00 '02 '04 '06 '08 '10-4%
-2%
0%
2%
4%
6%
8%
10%
'70 '74 '78 '82 '86 '90 '94 '98 '02 '06 '10
'94 '96 '98 '00 '02 '04 '06 '08 '10$0
$20
$40
$60
$80
$100
$120
$140
$160
$0.50
$1.00
$1.50
$2.00
$2.50
$3.00
$3.50
$4.00
$4.50
'70 '75 '80 '85 '90 '95 '00 '05 '100%
1%
2%
3%
4%
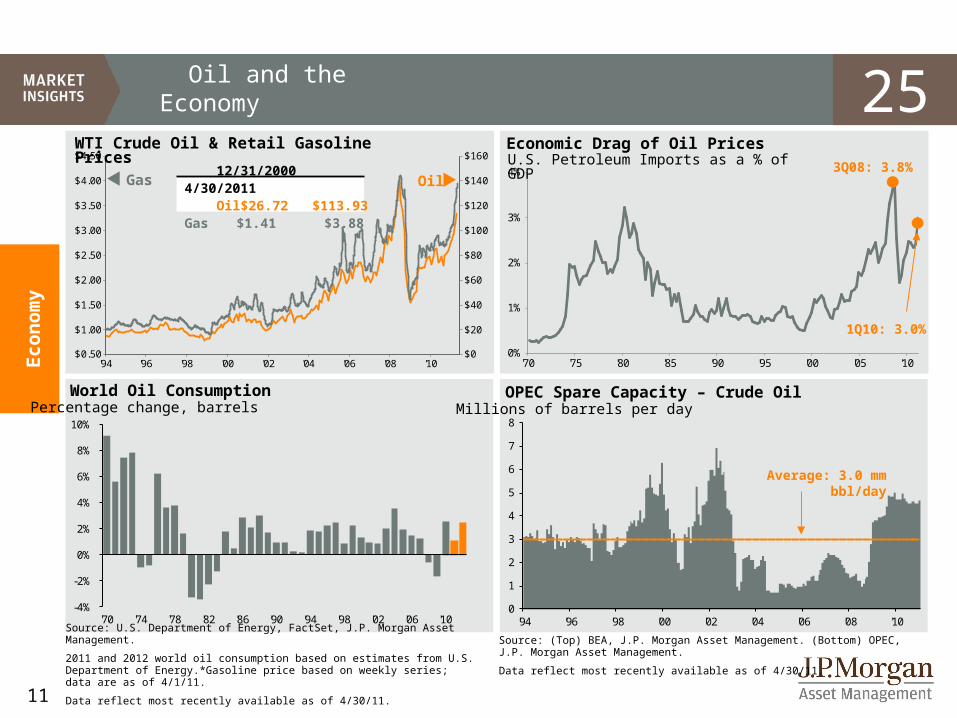
Oil and the Economy
Source: U.S. Department of Energy, FactSet, J.P. Morgan Asset Management.
2011 and 2012 world oil consumption based on estimates from U.S. Department of Energy.*Gasoline price based on weekly series; data are as of 4/1/11.
Data reflect most recently available as of 4/30/11.
WTI Crude Oil & Retail Gasoline Prices
Econ
om
y
OilGas
Source: (Top) BEA, J.P. Morgan Asset Management. (Bottom) OPEC, J.P. Morgan Asset Management.
Data reflect most recently available as of 4/30/11.
12/31/2000 4/30/2011 Oil $26.72
$113.93Gas $1.41 $3.88
Economic Drag of Oil PricesU.S. Petroleum Imports as a % of GDP
1Q10: 3.0%
OPEC Spare Capacity – Crude Oil
3Q08: 3.8%
Millions of barrels per dayWorld Oil ConsumptionPercentage change, barrels
Average: 3.0 mm bbl/day
25
12
-6%
-3%
0%
3%
6%
9%
12%
U.K
.
Ho
ng
Ko
ng
Can
ada
Eur
o a
rea
U.S
.
Jap
an
Aus
tral
ia
Rus
sia
Ind
ia
Arg
entin
a
Tur
key
Ko
rea
Th
aila
nd
Mex
ico
Ind
one
sia
Tai
wan
Po
lan
d
Ch
ina
So
uth
Afr
ica
Bra
zil
-6%
-4%
-2%
0%
2%
4%
6%
8%
10%
'02 '03 '04 '05 '06 '07 '08 '09 '10
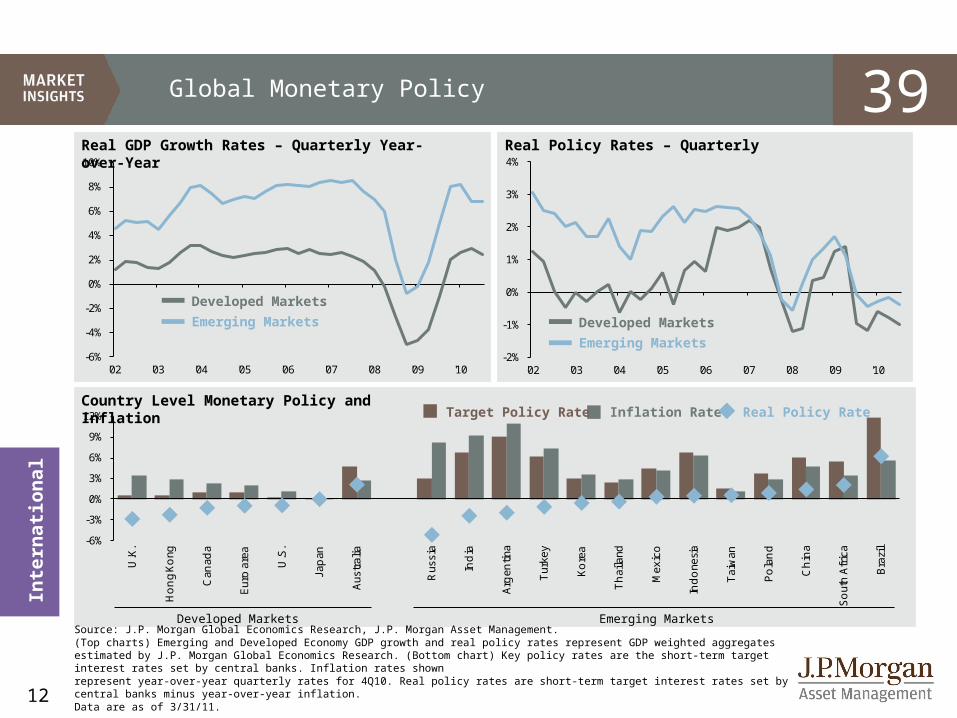
Source: J.P. Morgan Global Economics Research, J.P. Morgan Asset Management.(Top charts) Emerging and Developed Economy GDP growth and real policy rates represent GDP weighted aggregates estimated by J.P. Morgan Global Economics Research. (Bottom chart) Key policy rates are the short-term target interest rates set by central banks. Inflation rates shownrepresent year-over-year quarterly rates for 4Q10. Real policy rates are short-term target interest rates set by central banks minus year-over-year inflation.Data are as of 3/31/11.
Global Monetary Policy
Inte
rnati
on
al
Developed Markets
Real GDP Growth Rates – Quarterly Year-over-Year
Country Level Monetary Policy and Inflation
Emerging Markets
Inflation Rate Real Policy Rate
Real Policy Rates – Quarterly
Developed Markets
Emerging Markets
Target Policy Rate
Developed Markets Emerging Markets
-2%
-1%
0%
1%
2%
3%
4%
'02 '03 '04 '05 '06 '07 '08 '09 '10
39
13
1.3%
3.3%
3.3%
3.5%
3.6%
3.7%
4.8%
5.3%
8.3%
10.0%
12.8%
0% 2% 4% 6% 8% 10% 12% 14%
Japan
Germany
Canada
United States
United Kingdom
France
Italy
Spain
Portugal
Ireland
Greece
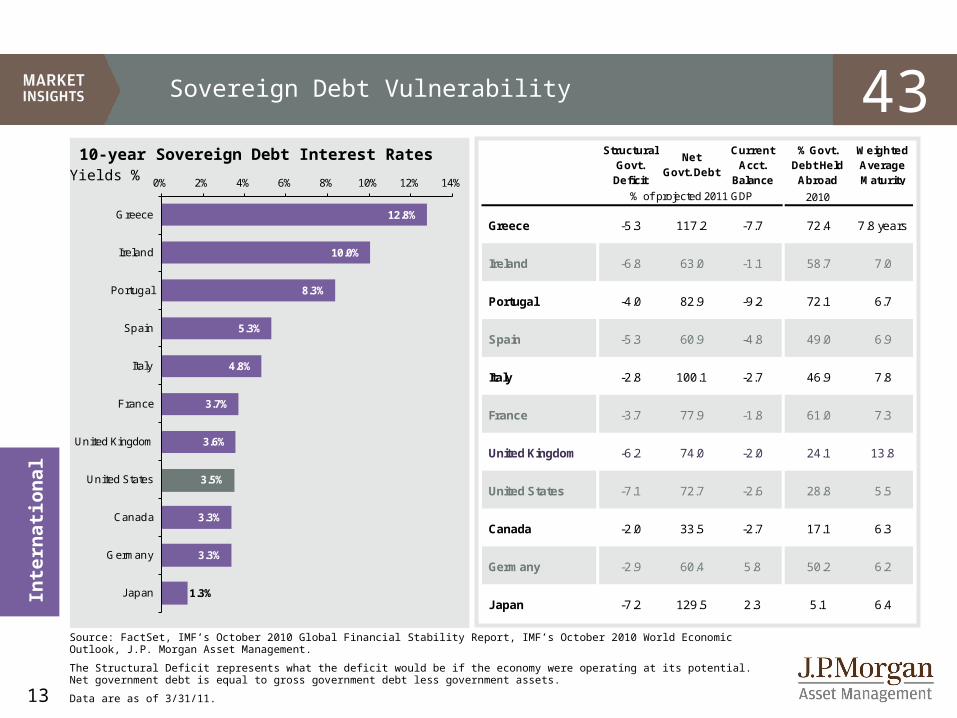
Sovereign Debt Vulnerability
10-year Sovereign Debt Interest RatesYields %
Inte
rnati
on
al
Source: FactSet, IMF’s October 2010 Global Financial Stability Report, IMF’s October 2010 World Economic Outlook, J.P. Morgan Asset Management.
The Structural Deficit represents what the deficit would be if the economy were operating at its potential. Net government debt is equal to gross government debt less government assets.
Data are as of 3/31/11.
Structural Govt. Deficit
Net Govt. Debt
Current Acct.
Balance
% Govt. Debt Held Abroad
Weighted Average Maturity
2010
Greece -5.3 117.2 -7.7 72.4 7.8 years
Ireland -6.8 63.0 -1.1 58.7 7.0
Portugal -4.0 82.9 -9.2 72.1 6.7
Spain -5.3 60.9 -4.8 49.0 6.9
Italy -2.8 100.1 -2.7 46.9 7.8
France -3.7 77.9 -1.8 61.0 7.3
United Kingdom -6.2 74.0 -2.0 24.1 13.8
United States -7.1 72.7 -2.6 28.8 5.5
Canada -2.0 33.5 -2.7 17.1 6.3
Germany -2.9 60.4 5.8 50.2 6.2
Japan -7.2 129.5 2.3 5.1 6.4
% of projected 2011 GDP
43
14
'72 '74 '76 '78 '80 '82 '84 '86 '88 '90 '92 '94 '96 '98 '00 '02 '04 '06 '08 '1040
50
60
70
80
90
100
110
120
130
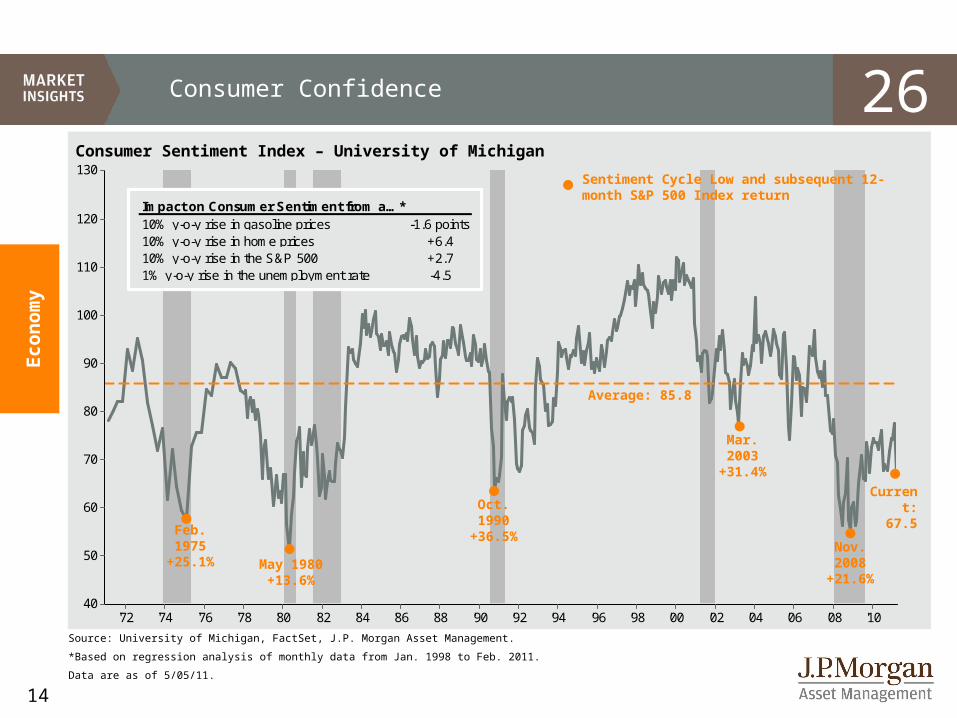
Consumer Confidence
Source: University of Michigan, FactSet, J.P. Morgan Asset Management.
*Based on regression analysis of monthly data from Jan. 1998 to Feb. 2011.
Data are as of 5/05/11.
Consumer Sentiment Index – University of Michigan
Average: 85.8
Econ
om
y
Feb. 1975+25.1%
May 1980+13.6%
Oct. 1990+36.5%
Mar. 2003+31.4%
Nov. 2008+21.6%
Sentiment Cycle Low and subsequent 12-month S&P 500 Index return
-1.6 points+6.4+2.7-4.5
10% y-o-y rise in gasoline prices10% y-o-y rise in home prices10% y-o-y rise in the S&P 5001% y-o-y rise in the unemployment rate
Impact on Consumer Sentiment from a…*
Current: 67.5
26
15
'01 '02 '03 '04 '05 '06 '07 '08 '09 '10$0
$20
$40
$60
$80
$100
$120
'94 '96 '98 '00 '02 '04 '06 '08 '108x
12x
16x
20x
24x
28x
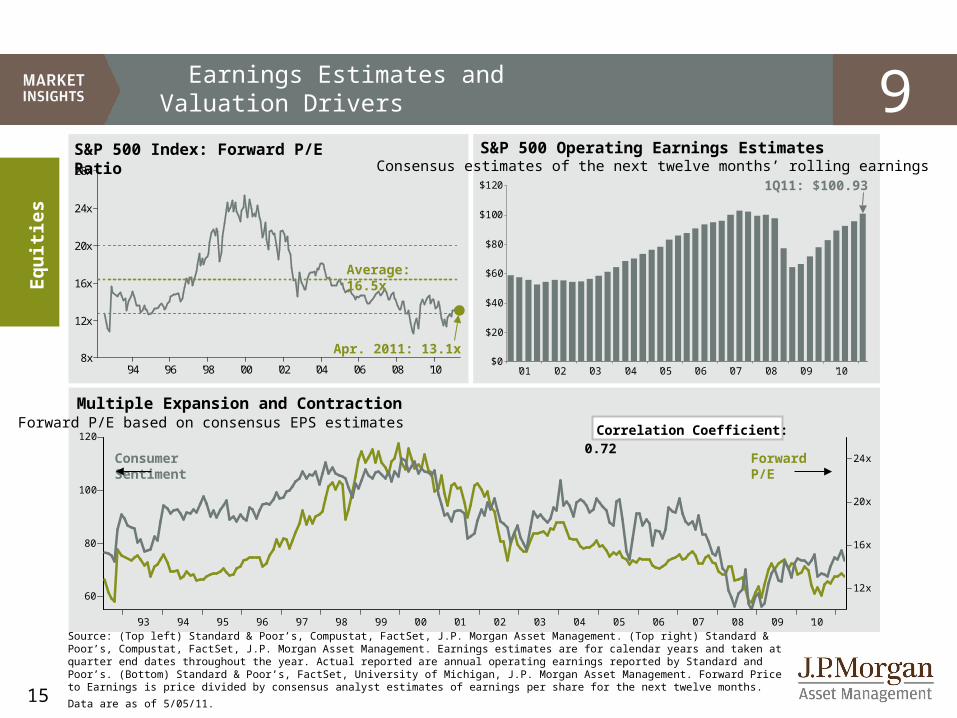
S&P 500 Index: Forward P/E Ratio S&P 500 Operating Earnings Estimates
Average: 16.5x
1Q11: $100.93
Apr. 2011: 13.1x
'93 '94 '95 '96 '97 '98 '99 '00 '01 '02 '03 '04 '05 '06 '07 '08 '09 '10
12x
16x
20x
24x
60
80
100
120
Earnings Estimates and Valuation Drivers
Eq
uit
ies
Source: (Top left) Standard & Poor’s, Compustat, FactSet, J.P. Morgan Asset Management. (Top right) Standard & Poor’s, Compustat, FactSet, J.P. Morgan Asset Management. Earnings estimates are for calendar years and taken at quarter end dates throughout the year. Actual reported are annual operating earnings reported by Standard and Poor’s. (Bottom) Standard & Poor’s, FactSet, University of Michigan, J.P. Morgan Asset Management. Forward Price to Earnings is price divided by consensus analyst estimates of earnings per share for the next twelve months.
Data are as of 5/05/11.
Forward P/EConsumer Sentiment
Multiple Expansion and ContractionForward P/E based on consensus EPS estimates Correlation Coefficient: 0.72
Consensus estimates of the next twelve months’ rolling earnings
9
16
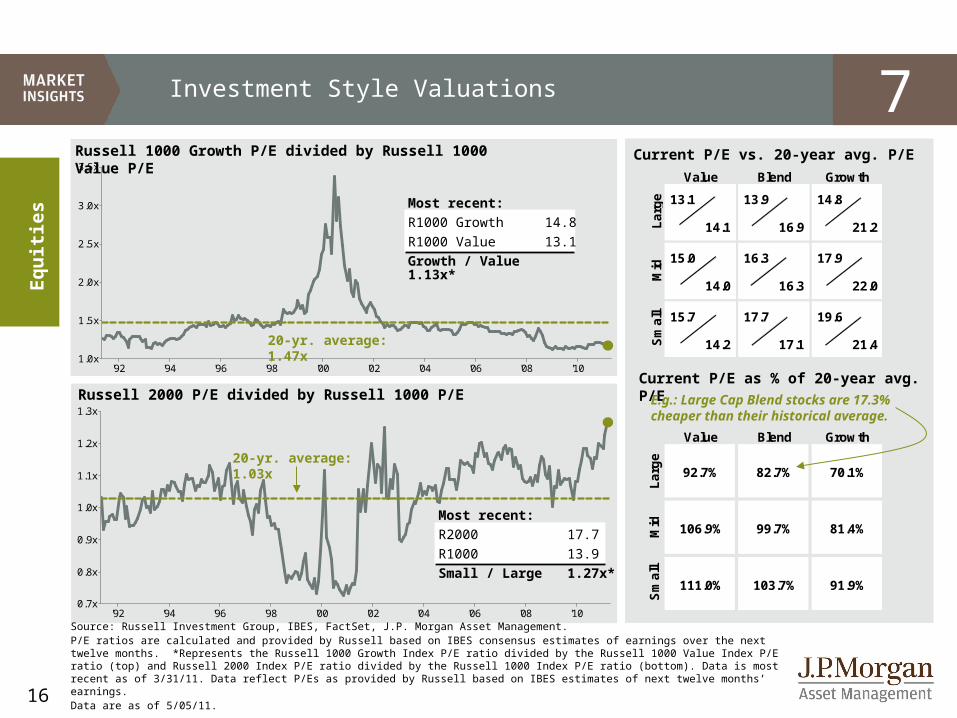
13.1 13.9 14.8
14.1 16.9 21.2
15.0 16.3 17.9
14.0 16.3 22.0
15.7 17.7 19.6
14.2 17.1 21.4Sm
all
Value Blend Growth
La
rge
Mid
Value Blend Growth
La
rge
92.7% 82.7% 70.1%
Mid 106.9% 99.7% 81.4%
Sm
all
111.0% 103.7% 91.9%
'92 '94 '96 '98 '00 '02 '04 '06 '08 '100.7x
0.8x
0.9x
1.0x
1.1x
1.2x
1.3x
'92 '94 '96 '98 '00 '02 '04 '06 '08 '101.0x
1.5x
2.0x
2.5x
3.0x
3.5x
Investment Style Valuations
Source: Russell Investment Group, IBES, FactSet, J.P. Morgan Asset Management. P/E ratios are calculated and provided by Russell based on IBES consensus estimates of earnings over the next twelve months. *Represents the Russell 1000 Growth Index P/E ratio divided by the Russell 1000 Value Index P/E ratio (top) and Russell 2000 Index P/E ratio divided by the Russell 1000 Index P/E ratio (bottom). Data is most recent as of 3/31/11. Data reflect P/Es as provided by Russell based on IBES estimates of next twelve months’ earnings.Data are as of 5/05/11.
Russell 1000 Growth P/E divided by Russell 1000 Value P/E
Eq
uit
ies
Russell 2000 P/E divided by Russell 1000 P/E
20-yr. average: 1.47x
Most recent:
R1000 Growth 14.8
R1000 Value 13.1
Growth / Value 1.13x*
Most recent:
R2000 17.7
R1000 13.9
Small / Large 1.27x*
20-yr. average: 1.03x
Current P/E as % of 20-year avg. P/E
E.g.: Large Cap Blend stocks are 17.3% cheaper than their historical average.
Current P/E vs. 20-year avg. P/E
7
17
'92 '94 '96 '98 '00 '02 '04 '06 '08 '100%
1%
2%
3%
4%
5%
6%
'80 '85 '90 '95 '00 '05 '100%
2%
4%
6%
8%
10%
12%
14%
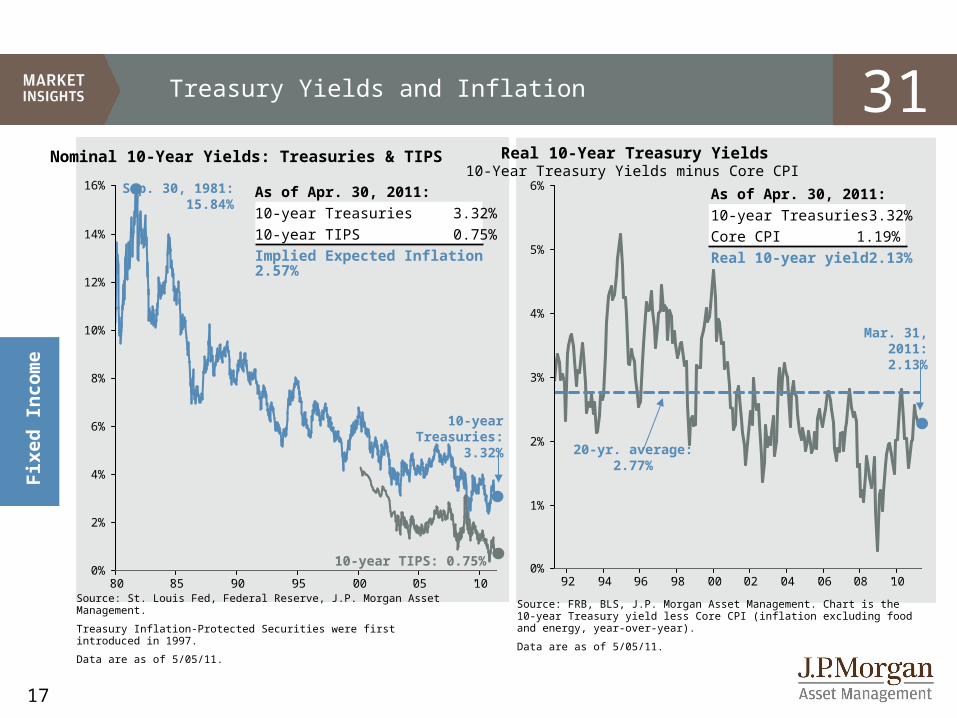
16%As of Apr. 30, 2011:
10-year Treasuries 3.32%Core CPI 1.19%Real 10-year yield2.13%
As of Apr. 30, 2011:
10-year Treasuries 3.32%10-year TIPS 0.75%Implied Expected Inflation 2.57%
Treasury Yields and Inflation
Source: FRB, BLS, J.P. Morgan Asset Management. Chart is the 10-year Treasury yield less Core CPI (inflation excluding food and energy, year-over-year).
Data are as of 5/05/11.
Real 10-Year Treasury Yields
Fix
ed
In
com
e
Nominal 10-Year Yields: Treasuries & TIPS
20-yr. average: 2.77%
10-year Treasuries: 3.32%
10-year TIPS: 0.75%
Source: St. Louis Fed, Federal Reserve, J.P. Morgan Asset Management.
Treasury Inflation-Protected Securities were first introduced in 1997.
Data are as of 5/05/11.
Mar. 31, 2011:2.13%
10-Year Treasury Yields minus Core CPISep. 30, 1981:
15.84%
31
18
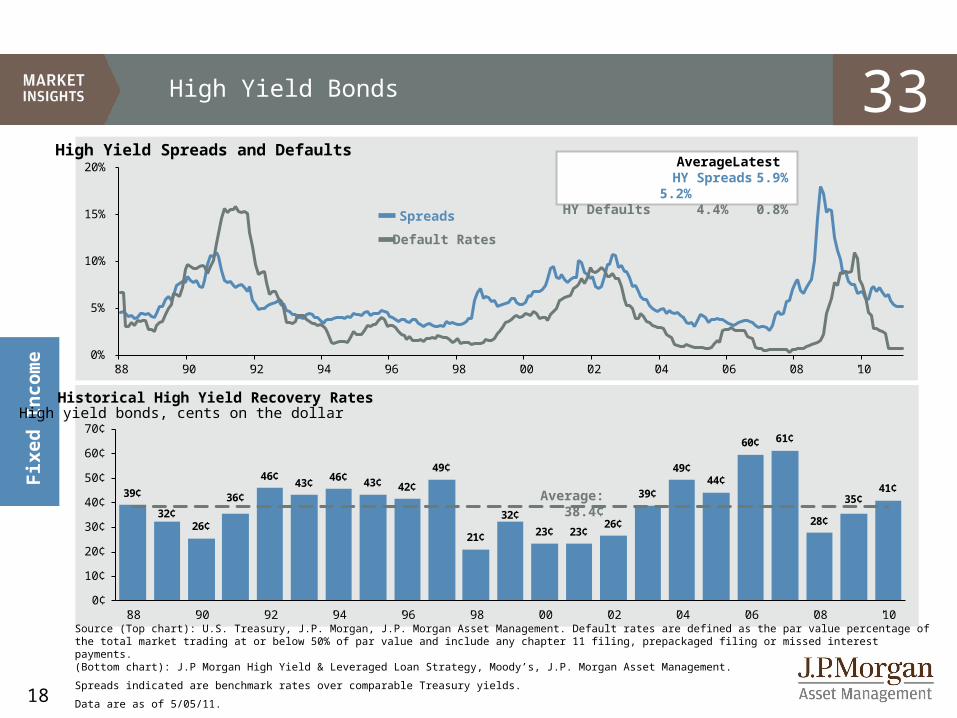
AverageLatest HY Spreads 5.9% 5.2%
HY Defaults 4.4% 0.8%
High Yield Bonds
Source (Top chart): U.S. Treasury, J.P. Morgan, J.P. Morgan Asset Management. Default rates are defined as the par value percentage of the total market trading at or below 50% of par value and include any chapter 11 filing, prepackaged filing or missed interest payments.(Bottom chart): J.P Morgan High Yield & Leveraged Loan Strategy, Moody’s, J.P. Morgan Asset Management.
Spreads indicated are benchmark rates over comparable Treasury yields.
Data are as of 5/05/11.
Fix
ed
In
com
e
Historical High Yield Recovery RatesHigh yield bonds, cents on the dollar
High Yield Spreads and Defaults
Spreads
Default Rates
Average: 38.4¢39¢
32¢26¢
36¢
46¢43¢
46¢ 43¢ 42¢
49¢
21¢
32¢
23¢ 23¢26¢
39¢
49¢44¢
60¢ 61¢
28¢
35¢41¢
0¢
10¢
20¢
30¢
40¢
50¢
60¢
70¢
'88 '90 '92 '94 '96 '98 '00 '02 '04 '06 '08 '10
33
0%
5%
10%
15%
20%
'88 '90 '92 '94 '96 '98 '00 '02 '04 '06 '08 '10
19
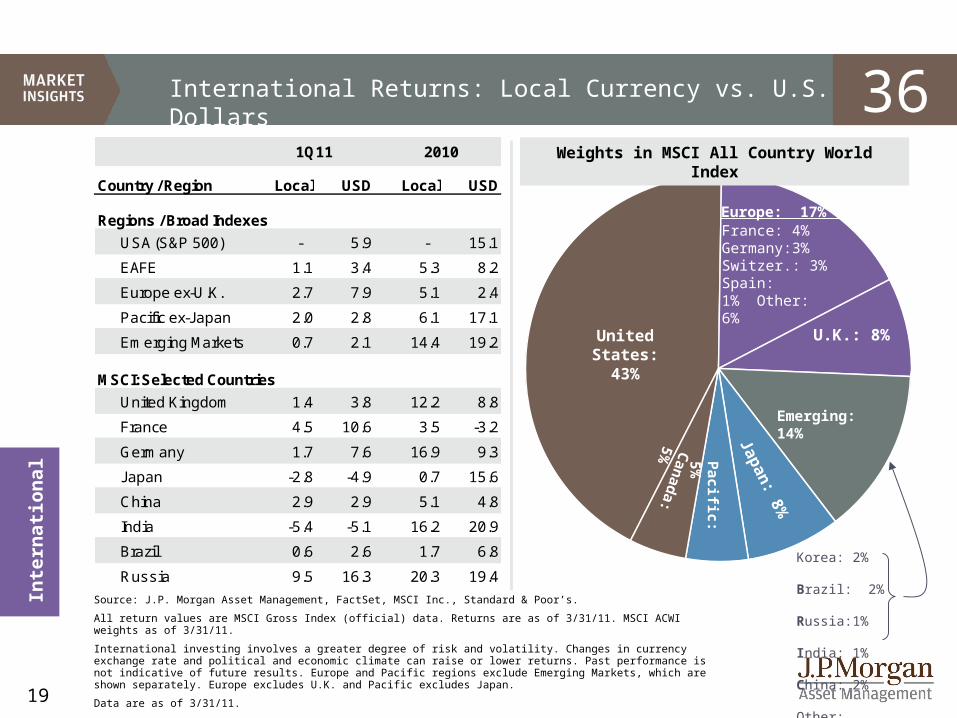
International Returns: Local Currency vs. U.S. Dollars
Source: J.P. Morgan Asset Management, FactSet, MSCI Inc., Standard & Poor’s.
All return values are MSCI Gross Index (official) data. Returns are as of 3/31/11. MSCI ACWI weights as of 3/31/11.
International investing involves a greater degree of risk and volatility. Changes in currency exchange rate and political and economic climate can raise or lower returns. Past performance is not indicative of future results. Europe and Pacific regions exclude Emerging Markets, which are shown separately. Europe excludes U.K. and Pacific excludes Japan.
Data are as of 3/31/11.
Inte
rnati
on
al
Weights in MSCI All Country World Index
United States:
43%
U.K.: 8%
Japan: 8%
France: 4% Germany:3% Switzer.: 3% Spain: 1% Other: 6%
Korea: 2% Brazil: 2% Russia:1% India: 1% China: 2% Other: 6%
Can
ada: 5%
Europe: 17%
Pacific: 5%
Emerging: 14%
Country / Region
Regions / Broad Indexes
USA (S&P 500) - 5.9 - 15.1
EAFE 1.1 3.4 5.3 8.2
Europe ex-U.K. 2.7 7.9 5.1 2.4
Pacific ex-Japan 2.0 2.8 6.1 17.1
Emerging Markets 0.7 2.1 14.4 19.2
MSCI: Selected Countries
United Kingdom 1.4 3.8 12.2 8.8
France 4.5 10.6 3.5 -3.2
Germany 1.7 7.6 16.9 9.3
Japan -2.8 -4.9 0.7 15.6
China 2.9 2.9 5.1 4.8
India -5.4 -5.1 16.2 20.9
Brazil 0.6 2.6 1.7 6.8
Russia 9.5 16.3 20.3 19.4
1Q11 2010
Local USD Local USD
36
20
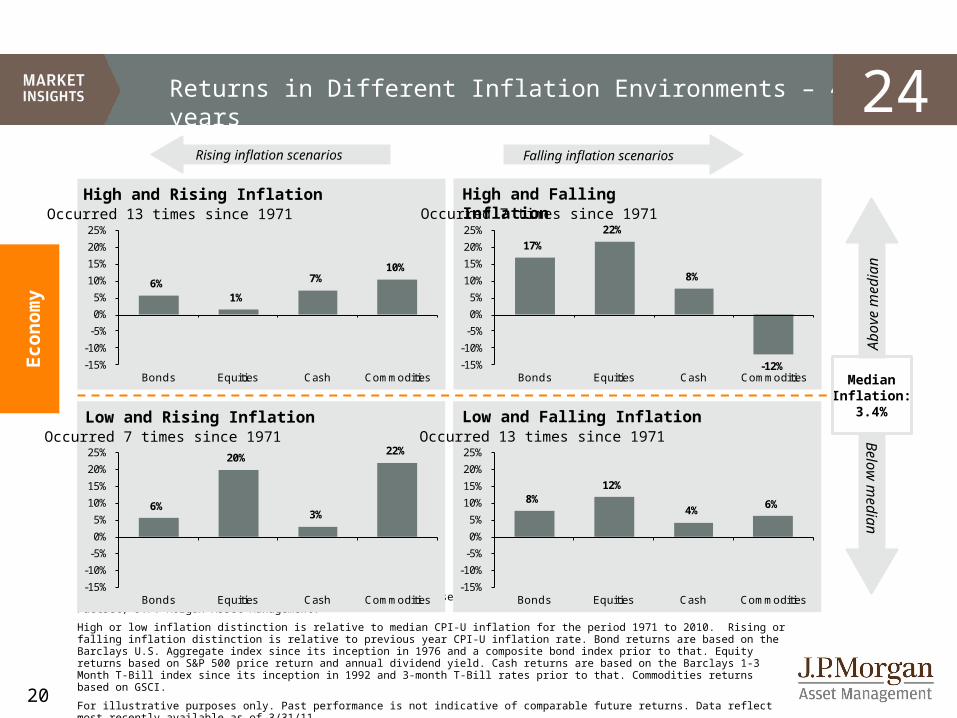
Returns in Different Inflation Environments – 40 years
Source: BLS, Barclays Capital, Robert Shiller, Federal Reserve, Strategas/Ibbotson, Standard and Poor’s, FactSet, J.P. Morgan Asset Management.
High or low inflation distinction is relative to median CPI-U inflation for the period 1971 to 2010. Rising or falling inflation distinction is relative to previous year CPI-U inflation rate. Bond returns are based on the Barclays U.S. Aggregate index since its inception in 1976 and a composite bond index prior to that. Equity returns based on S&P 500 price return and annual dividend yield. Cash returns are based on the Barclays 1-3 Month T-Bill index since its inception in 1992 and 3-month T-Bill rates prior to that. Commodities returns based on GSCI.
For illustrative purposes only. Past performance is not indicative of comparable future returns. Data reflect most recently available as of 3/31/11.
High and Rising Inflation
Econ
om
y
Occurred 13 times since 1971High and Falling InflationOccurred 7 times since 1971
Low and Rising InflationOccurred 7 times since 1971
Low and Falling InflationOccurred 13 times since 1971
Abo
ve m
edia
n
Below
median
Median Inflation:
3.4%
Falling inflation scenariosRising inflation scenarios
6%1%
7%10%
-15%
-10%
-5%
0%
5%
10%
15%
20%
25%
Bonds Equities Cash Commodities
17%
22%
8%
-12%-15%
-10%
-5%
0%
5%
10%
15%
20%
25%
Bonds Equities Cash Commodities
6%
20%
3%
22%
-15%
-10%
-5%
0%
5%
10%
15%
20%
25%
Bonds Equities Cash Commodities
8%12%
4%6%
-15%
-10%
-5%
0%
5%
10%
15%
20%
25%
Bonds Equities Cash Commodities
24
21
-$80
-$60
-$40
-$20
$0
$20
$40
Aug '07 Feb '08 Aug '08 Feb '09 Aug '09 Feb '10 Aug '10 Feb '11200
400
600
800
1000
1200
1400
1600
-$80
-$60
-$40
-$20
$0
$20
$40
$60
$80
$100
$120
'90 '92 '94 '96 '98 '00 '02 '04 '06 '08 '10
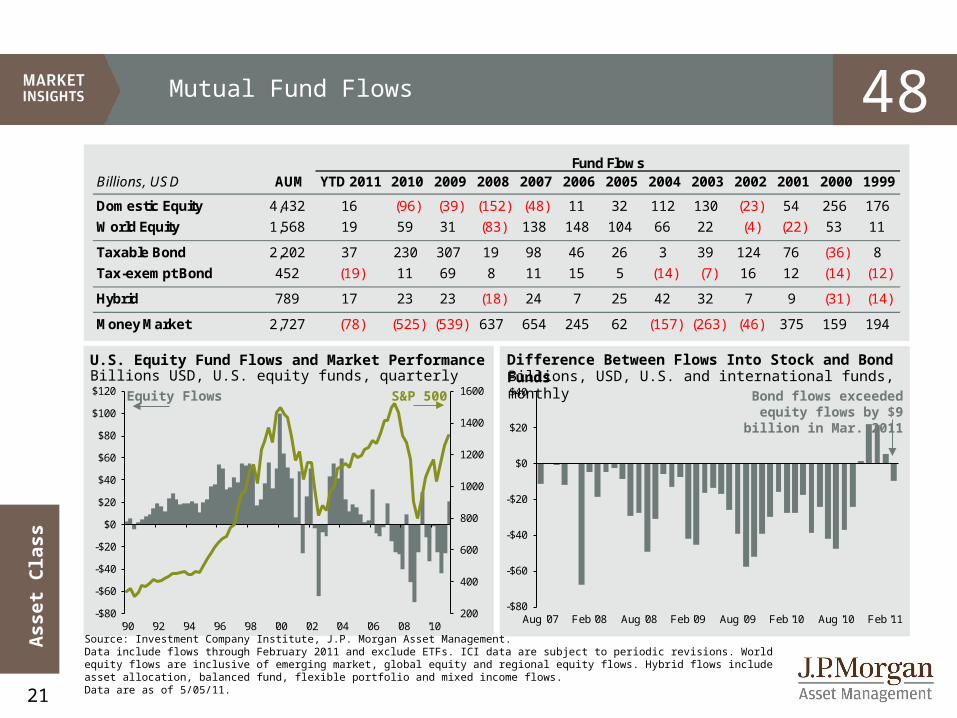
Source: Investment Company Institute, J.P. Morgan Asset Management.Data include flows through February 2011 and exclude ETFs. ICI data are subject to periodic revisions. World equity flows are inclusive of emerging market, global equity and regional equity flows. Hybrid flows include asset allocation, balanced fund, flexible portfolio and mixed income flows.Data are as of 5/05/11.
Mutual Fund Flows
Difference Between Flows Into Stock and Bond FundsU.S. Equity Fund Flows and Market PerformanceBillions, USD, U.S. and international funds, monthlyBillions USD, U.S. equity funds, quarterly
Equity Flows S&P 500 Bond flows exceeded equity flows by $9 billion in Mar. 2011
Asset
Cla
ss
48Billions, USD AUM YTD 2011 2010 2009 2008 2007 2006 2005 2004 2003 2002 2001 2000 1999
Domestic Equity 4,432 16 (96) (39) (152) (48) 11 32 112 130 (23) 54 256 176
World Equity 1,568 19 59 31 (83) 138 148 104 66 22 (4) (22) 53 11
Taxable Bond 2,202 37 230 307 19 98 46 26 3 39 124 76 (36) 8
Tax-exempt Bond 452 (19) 11 69 8 11 15 5 (14) (7) 16 12 (14) (12)
Hybrid 789 17 23 23 (18) 24 7 25 42 32 7 9 (31) (14)
Money Market 2,727 (78) (525) (539) 637 654 245 62 (157) (263) (46) 375 159 194
Fund Flows
22
10-yrs
2000 2001 2002 2003 2004 2005 2006 2007 2008 2009 2010 1Q11 '01 - '10
REITs REITsDJ UBSCmdty
MSCIEME
REITsMSCIEME
REITsMSCIEME
Barclays Agg
MSCIEME
REITsRussell
2000MSCIEME
26.4% 13.9% 23.9% 56.3% 31.6% 34.5% 35.1% 39.8% 5.2% 79.0% 28.0% 7.9% 350.0%
DJ UBSCmdty
Market Neutral
Barclays Agg
Russell 2000
MSCIEME
DJ UBSCmdty
MSCIEME
MSCI EAFE
Market Neutral
MSCI EAFE
Russell 2000
REITs REITs
24.2% 9.3% 10.3% 47.3% 26.0% 17.6% 32.6% 11.6% 1.1%* 32.5% 26.9% 7.5% 178.0%
Market Neutral
Barclays Agg
Market Neutral
MSCI EAFE
MSCI EAFE
MSCI EAFE
MSCI EAFE
DJ UBSCmdty
Asset Alloc.
REITsMSCIEME
S&P500
Russell 2000
15.0% 8.4% 7.4% 39.2% 20.7% 14.0% 26.9% 11.1% -23.8% 28.0% 19.2% 5.9% 84.8%
Barclays Agg
Russell 2000
REITs REITsRussell
2000REITs
Russell 2000
Market Neutral
Russell 2000
Russell 2000
DJ UBSCmdty
DJ UBSCmdty
Asset Alloc.
11.6% 2.5% 3.8% 37.1% 18.3% 12.2% 18.4% 9.3% -33.8% 27.2% 16.7% 4.4% 80.2%
Asset Alloc.
MSCIEME
Asset Alloc.
S&P500
Asset Alloc.
Asset Alloc.
S&P500
Asset Alloc.
DJ UBSCmdty
S&P500
S&P500
Asset Alloc.
Market Neutral
0.6% -2.4% -5.4% 28.7% 12.5% 8.0% 15.8% 7.3% -36.6% 26.5% 15.1% 3.7% 76.9%.
Russell 2000
Asset Alloc.
MSCIEME
Asset Alloc.
S&P500
Market Neutral
Asset Alloc.
Barclays Agg
S&P500
Asset Alloc.
Asset Alloc.
MSCI EAFE
Barclays Agg
-3.0% -3.4% -6.0% 25.2% 10.9% 6.1% 14.9% 7.0% -37.0% 22.5% 12.7% 3.5% 76.3%
S&P500
S&P500
MSCI EAFE
DJ UBSCmdty
DJ UBSCmdty
S&P500
Market Neutral
S&P500
REITsDJ UBSCmdty
MSCI EAFE
Market Neutral
MSCI EAFE
-9.1% -11.9% -15.7% 22.7% 7.6% 4.9% 11.2% 5.5% -37.7% 18.7% 8.2% 2.3% 47.1%
MSCI EAFE
MSCI EAFE
Russell 2000
Market Neutral
Market Neutral
Russell 2000
Barclays Agg
Russell 2000
MSCI EAFE
Barclays Agg
Barclays Agg
MSCIEME
DJ UBSCmdty
-14.0% -21.2% -20.5% 7.1% 6.5% 4.6% 4.3% -1.6% -43.1% 5.9% 6.5% 2.1% 41.7%
MSCIEME
DJ UBSCmdty
S&P500
Barclays Agg
Barclays Agg
Barclays Agg
DJ UBSCmdty
REITsMSCIEME
Market Neutral
Market Neutral
Barclays Agg
S&P500
-30.6% -22.3% -22.1% 4.1% 4.3% 2.4% -2.7% -15.7% -53.2% 4.1% -2.5% 0.4% 15.1%
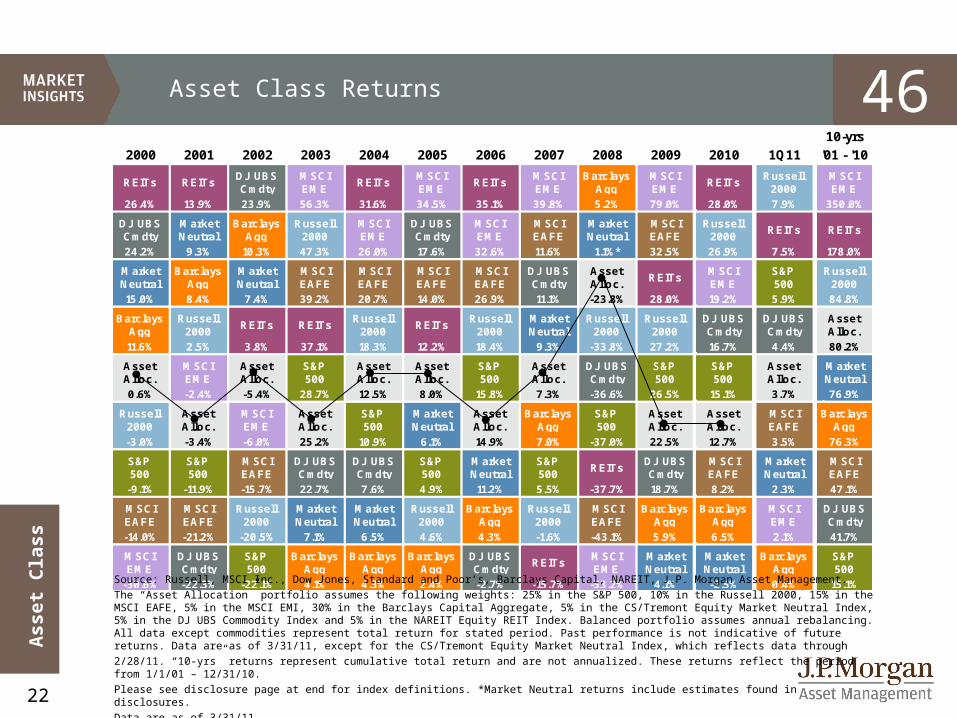
Asset Class Returns
Asset
Cla
ss
Source: Russell, MSCI Inc., Dow Jones, Standard and Poor’s, Barclays Capital, NAREIT, J.P. Morgan Asset Management.
The “Asset Allocation” portfolio assumes the following weights: 25% in the S&P 500, 10% in the Russell 2000, 15% in the MSCI EAFE, 5% in the MSCI EMI, 30% in the Barclays Capital Aggregate, 5% in the CS/Tremont Equity Market Neutral Index, 5% in the DJ UBS Commodity Index and 5% in the NAREIT Equity REIT Index. Balanced portfolio assumes annual rebalancing. All data except commodities represent total return for stated period. Past performance is not indicative of future returns. Data are as of 3/31/11, except for the CS/Tremont Equity Market Neutral Index, which reflects data through
2/28/11. “10-yrs” returns represent cumulative total return and are not annualized. These returns reflect the period from 1/1/01 – 12/31/10.
Please see disclosure page at end for index definitions. *Market Neutral returns include estimates found in disclosures.
Data are as of 3/31/11.
46

23
Disclosures
This material is intended to report solely on the investment strategies and opportunities identified by J.P. Morgan Asset Management. Additional information is available upon request. Information herein is believed to be reliable but J.P. Morgan Asset Management does not warrant its completeness or accuracy. Opinions and estimates constitute our judgment and are subject to change without notice. The material is not intended as an offer or solicitation for the purchase or sale of any financial instrument. J.P. Morgan Asset Management and/or its affiliates and employees may hold a position or act as market maker in the financial instruments of any issuer discussed herein or act as underwriter, placement agent, advisor or lender to such issuer. The investments and strategies discussed herein may not be suitable for all investors; if you have any doubts you should consult your J.P. Morgan Asset Management Client Adviser, Broker or Portfolio Manager. The material is not intended to provide, and should not be relied on for, accounting, legal or tax advice, or investment recommendations. You should consult your tax or legal adviser about the issues discussed herein. The investments discussed may fluctuate in price or value. Investors may get back less than they invested. Changes in rates of exchange may have an adverse effect on the value, price or income of investments. Past performance is no guarantee of comparable future results. Diversification does not guarantee investment returns and does not eliminate the risk of loss.
Bonds are subject to interest rate risks. Bond prices generally fall when interest rates rise. The price of equity securities may rise, or fall because of changes in the broad market or changes in a company’s financial condition, sometimes rapidly or unpredictably. These price movements may result from factors affecting individual companies, sectors or industries, or the securities market as a whole, such as changes in economic or political conditions. Equity securities are subject to “stock market risk” meaning that stock prices in general may decline over short or extended periods of time. Real estate investments may be subject to a higher degree of market risk because of concentration in a specific industry, sector or geographical sector. Real estate investments may be subject to risks including, but not limited to, declines in the value of real estate, risks related to general and economic conditions, changes in the value of the underlying property owned by the trust and defaults by borrower. International investing involves a greater degree of risk and increased volatility. Changes in currency exchange rates and differences in accounting and taxation policies outside the U.S. can raise or lower returns. Also, some overseas markets may not be as politically and economically stable as the United States and other nations. Investments in emerging markets can be more volatile. As mentioned above, the normal risks of investing in foreign countries are heightened when investing in emerging markets. In addition, the small size of securities markets and the low trading volume may lead to a lack of liquidity, which leads to increased volatility. Also, emerging markets may not provide adequate legal protection for private or foreign investment or private property. Investments in commodities may have greater volatility than investments in traditional securities, particularly if the instruments involve leverage. The value of commodity-linked derivative instruments may be affected by changes in overall market movements, commodity index volatility, changes in interest rates, or factors affecting a particular industry or commodity, such as drought, floods, weather, livestock disease, embargoes, tariffs and international economic, political and regulatory developments. Use of leveraged commodity-linked derivatives creates an opportunity for increased return but, at the same time, creates the possibility for greater loss. Derivatives may be riskier than other types of investments because they may be more sensitive to changes in economic or market conditions than other types of investments and could result in losses that significantly exceed the original investment. The use of derivatives may not be successful, resulting in investment losses, and the cost of such strategies may reduce investment returns. There is no guarantee that the use of long and short positions will succeed in limiting an investor's exposure to domestic stock market movements, capitalization, sector swings or other risk factors. Investing using long and short selling strategies may have higher portfolio turnover rates. Short selling involves certain risks, including additional costs associated with covering short positions and a possibility of unlimited loss on certain short sale positions.
J.P. Morgan Asset Management is the marketing name for the asset management businesses of JPMorgan Chase & Co. Those businesses include, but are not limited to, J.P. Morgan Investment Management Inc., Security Capital Research & Management Incorporated and J.P. Morgan Alternative Asset Management, Inc.

![CYCLES OUT OF SYNC - blackrock.com · [2] CYCLES OUT OF SYNC Jean Boivin (LEFT) Deputy Chief Investment Strategist, BlackRock Investment Institute Nigel Bolton (RIGHT) Chief Investment](https://img.pdfslide.net/doc/110x75/5ae603de7f8b9a6d4f8c18d2/cycles-out-of-sync-2-cycles-out-of-sync-jean-boivin-left-deputy-chief-investment.jpg)