Embed Size (px)
Citation preview
Outcome Performance Measures
Presentation Derived from Martin & Kettner’s Measuring the Performance of Human Service Programs, Sage, 1996
Defining Outcome Measures
Results or Accomplishments that are attributable at least in part to a service program (GASB, 1994)
Perspectives in Caregiving
• Problem Approach: I.E. client has housing problem, drug problem etc. is good for diagnosis
• Quality-of-Life Approach: focuses on end states and attempt to move client toward one of a number of desirable end states.
Performance Outcome Measures: 4 Types
• Numeric Counts– used to measure client conditions, status;
behavior
• Standardized Measures– used to measure client feelings, attitudes, etc.
• Level of Functioning Scales– measures client, family functioning or condition
• Client Satisfaction– measures client perceptions
Intermediate & Ultimate Outcomes
• Intermediate Outcome Performance Measures– Numeric Counts– Standardized Measures– LOF Scales– Client Satisfaction
• Ultimate Outcome Performance Measures– Numeric Counts– Standardized Measures– LOF Scales
Selecting Outcome Performance Measures
• Step 1: Use focus group which includes a representative group of stakeholders to discuss how to assess quality outcomes
• Step 2: As many outcome performance as possible should be identified
• Step 3: Group should arrive at a consensus on the best two outcome performance measures for the particular program
Cause & Effect
• In many cases cause & effect relationships between program activities and outcomes cannot be established
• In other cases cause & effect relationships may exist to the extent that programs contributed, and maybe even contributed significantly to an outcome
• However, in most cases we avoid the word “cause” and speak of “program contributions” toward a change etc.
Social Indicators As Ultimate Outcome Measures
• Definition: Data that enable evaluative judgements to be made about social problems in a community or state (Miller, 1991)
• Social Indicators as Ultimate Outcome Measures: Examples – Benchmarking in Oregon (Oregon Options)– Goals 2000– Healthy People 2000
Assessing The Four Types of Outcome Performance Measures: Criteria
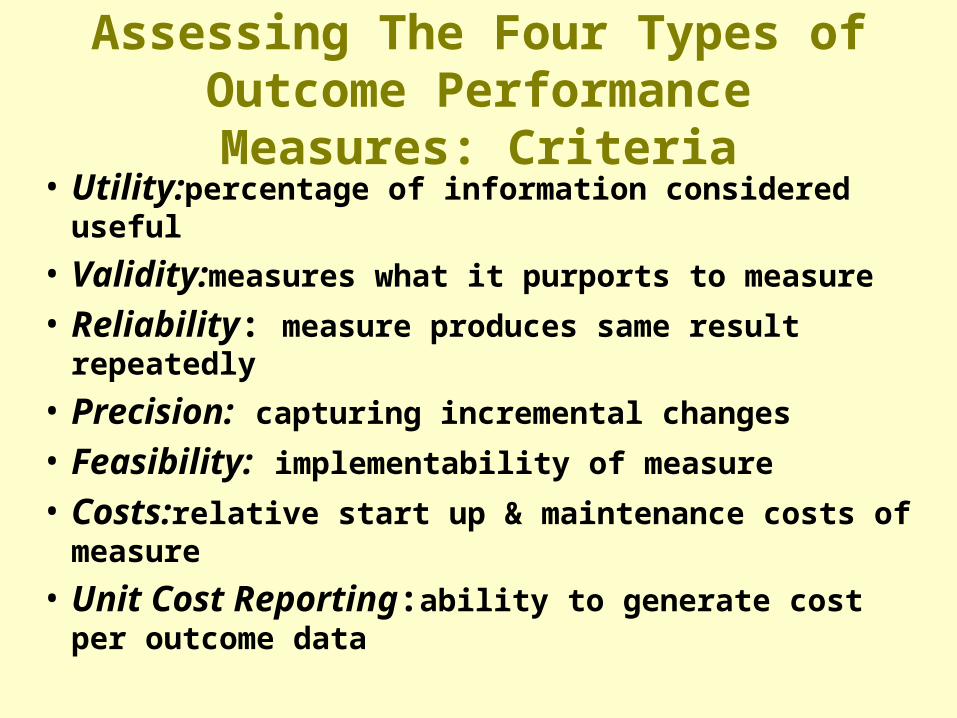
• Utility:percentage of information considered useful
• Validity:measures what it purports to measure
• Reliability: measure produces same result repeatedly
• Precision: capturing incremental changes
• Feasibility: implementability of measure
• Costs:relative start up & maintenance costs of measure
• Unit Cost Reporting:ability to generate cost per outcome data
Numeric Counts
Numeric Counts:Various Definitions
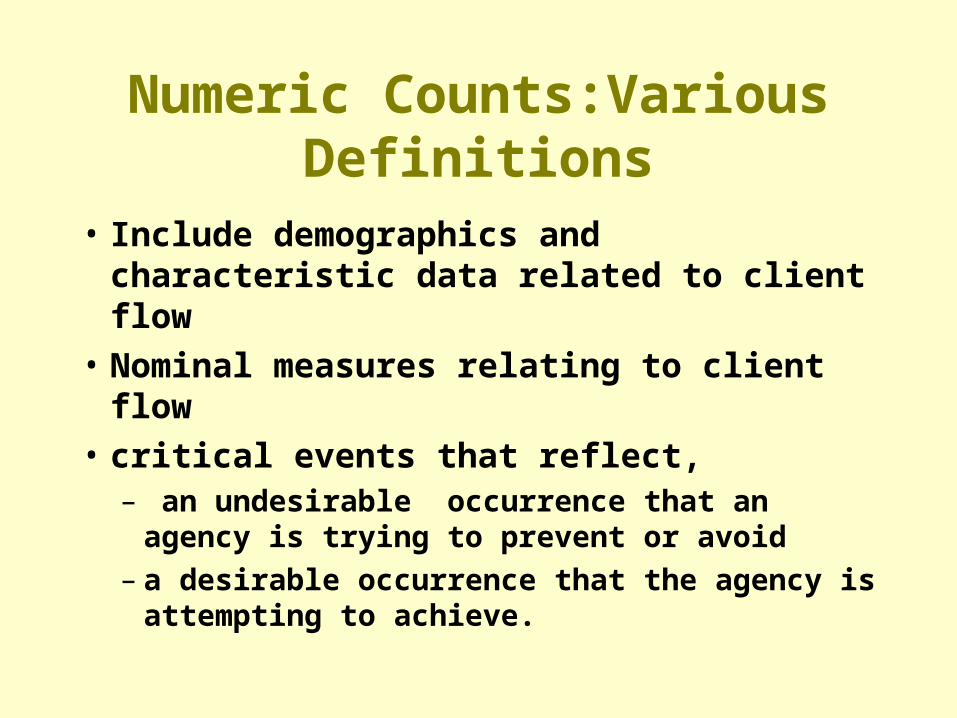
• Include demographics and characteristic data related to client flow
• Nominal measures relating to client flow
• critical events that reflect,– an undesirable occurrence that an agency is
trying to prevent or avoid– a desirable occurrence that the agency is
attempting to achieve.
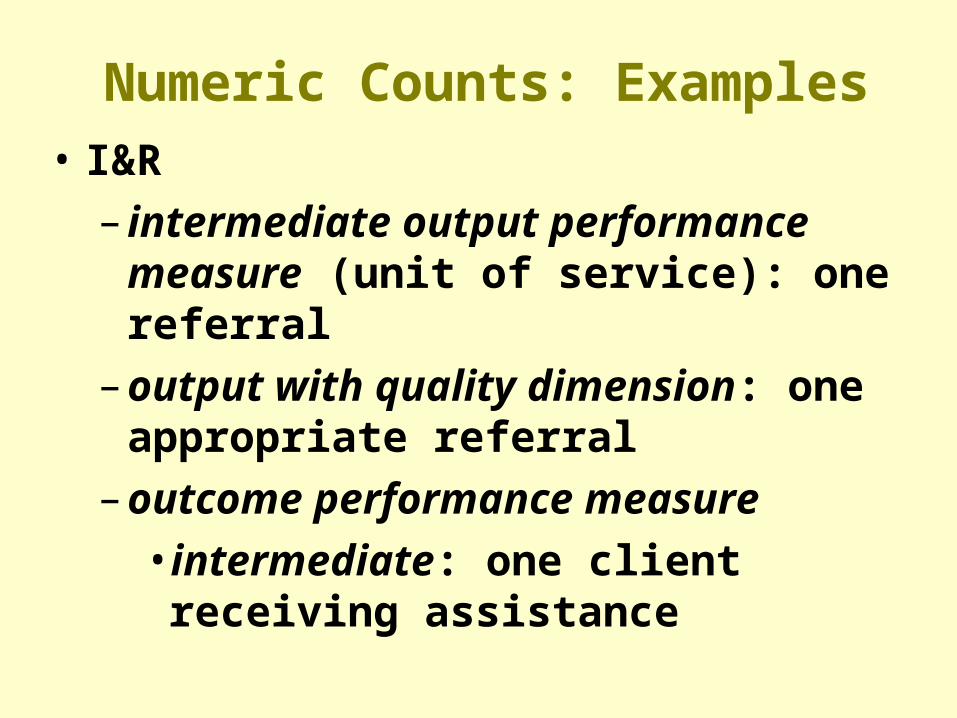
Numeric Counts: Examples• I&R
– intermediate output performance measure (unit of service): one referral
– output with quality dimension: one appropriate referral
– outcome performance measure
• intermediate: one client receiving assistance
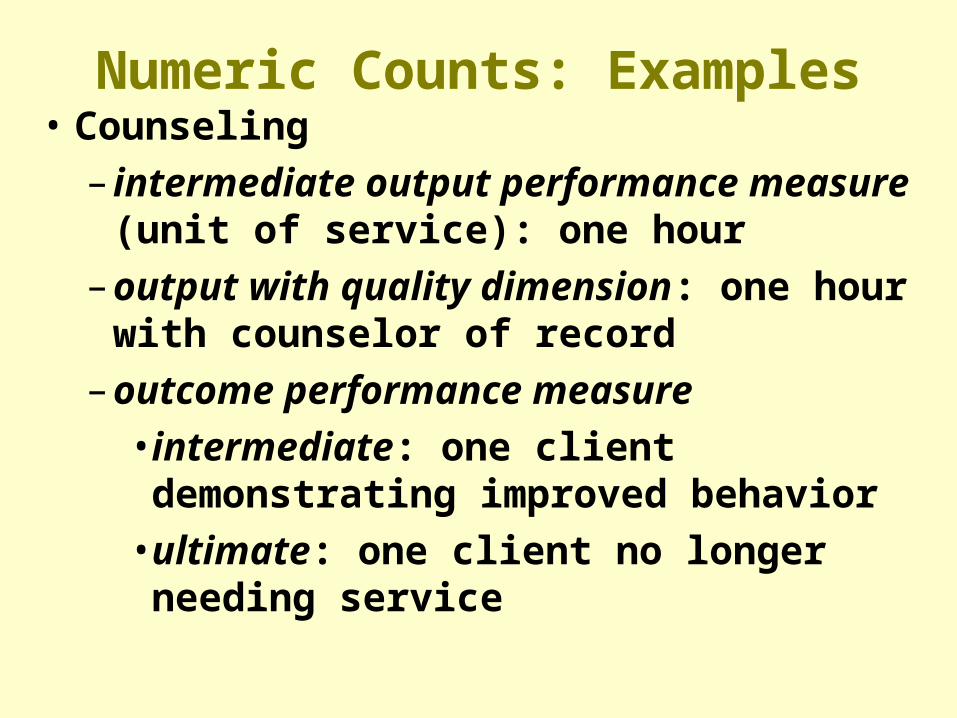
Numeric Counts: Examples• Counseling
– intermediate output performance measure (unit of service): one hour
– output with quality dimension: one hour with counselor of record
– outcome performance measure
• intermediate: one client demonstrating improved behavior
• ultimate: one client no longer needing service
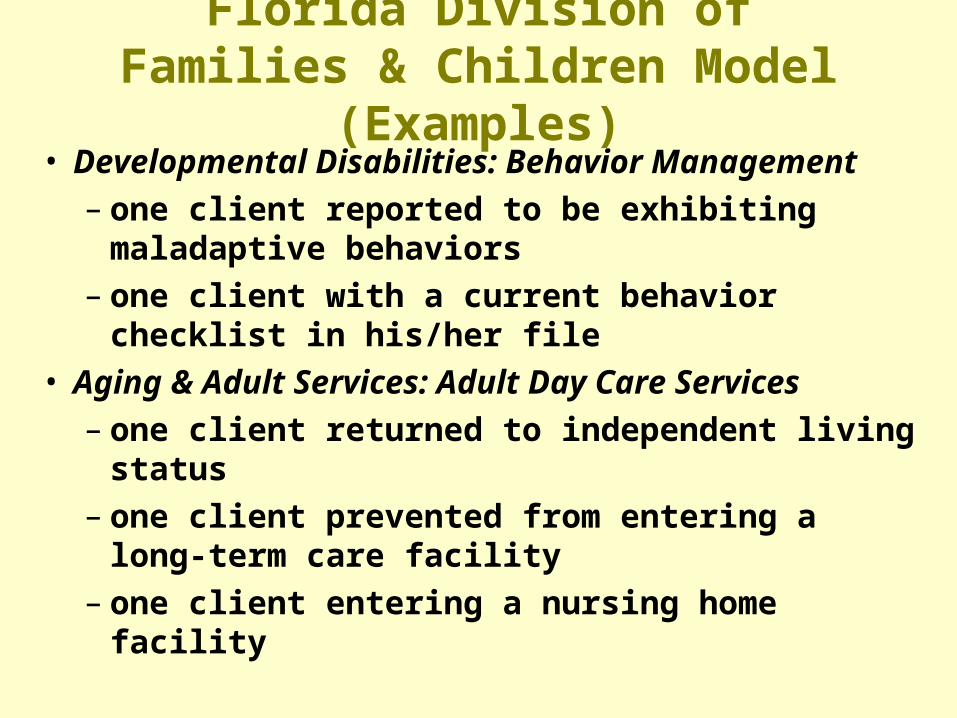
Florida Division of Families & Children Model (Examples)
• Developmental Disabilities: Behavior Management– one client reported to be exhibiting maladaptive
behaviors– one client with a current behavior checklist in
his/her file• Aging & Adult Services: Adult Day Care Services
– one client returned to independent living status– one client prevented from entering a long-term
care facility– one client entering a nursing home facility
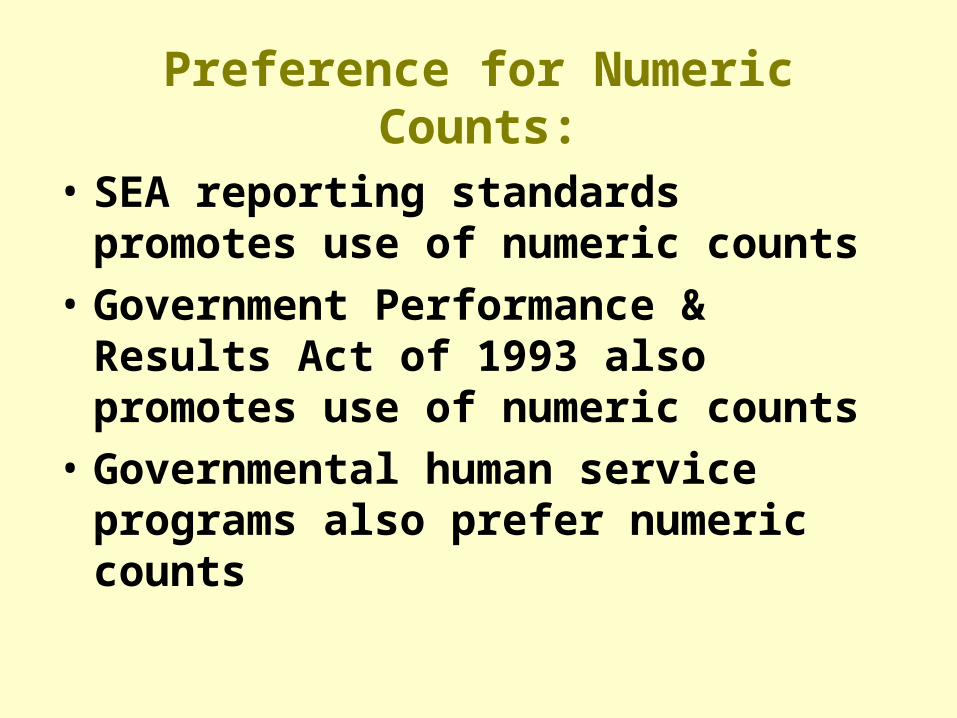
Preference for Numeric Counts:
• SEA reporting standards promotes use of numeric counts
• Government Performance & Results Act of 1993 also promotes use of numeric counts
• Governmental human service programs also prefer numeric counts
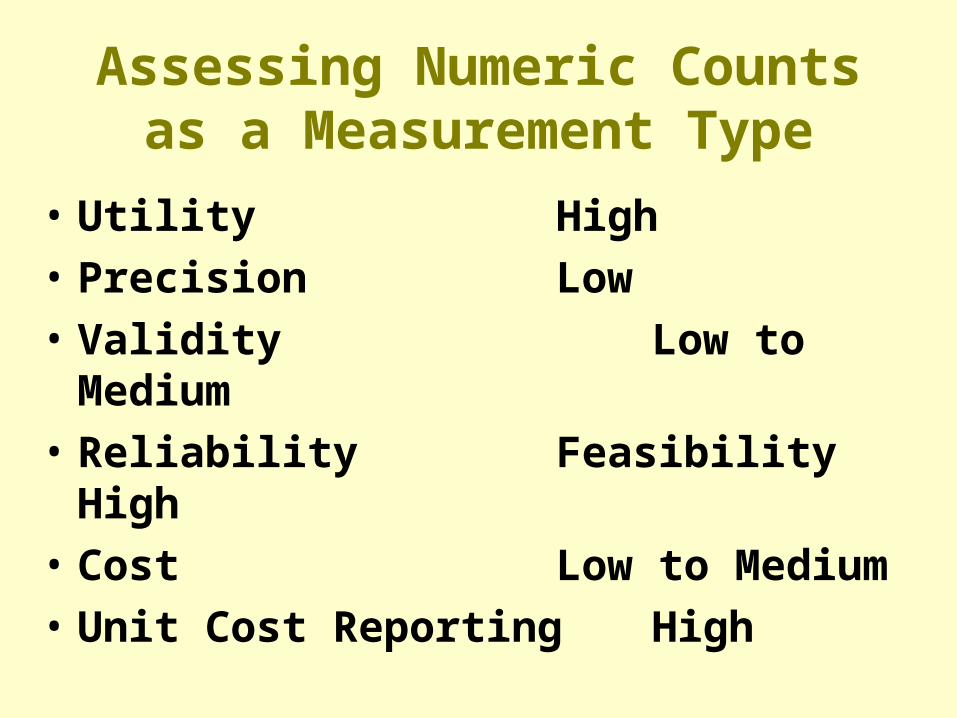
Assessing Numeric Counts as a Measurement Type
• Utility High
• Precision Low
• Validity Low to Medium
• Reliability Feasibility High
• Cost Low to Medium
• Unit Cost Reporting High
Standardized Measures
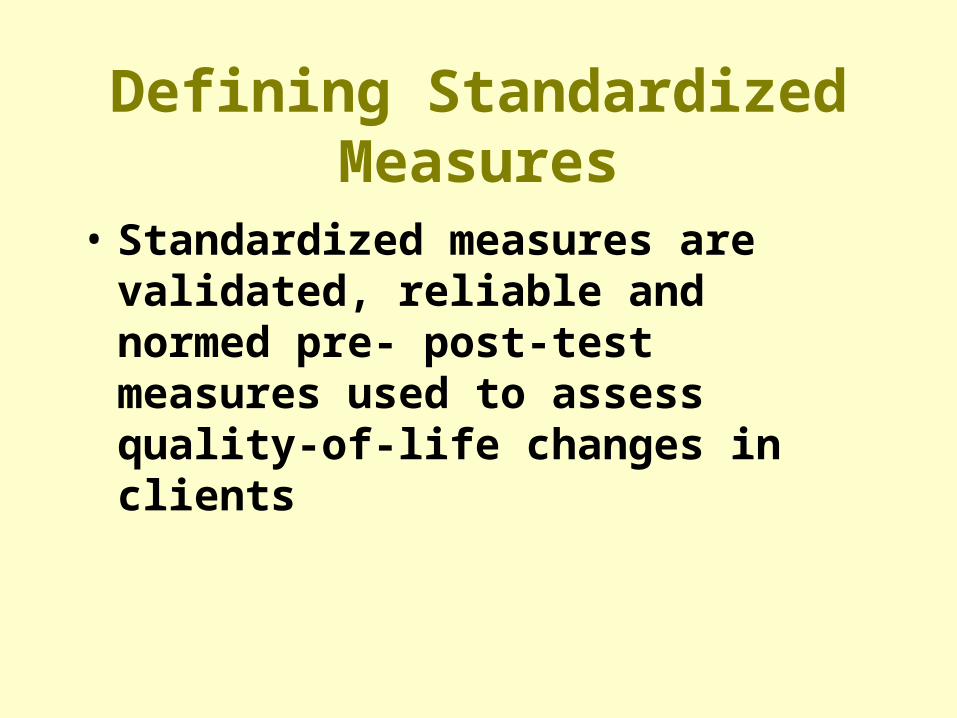
Defining Standardized Measures
• Standardized measures are validated, reliable and normed pre- post-test measures used to assess quality-of-life changes in clients
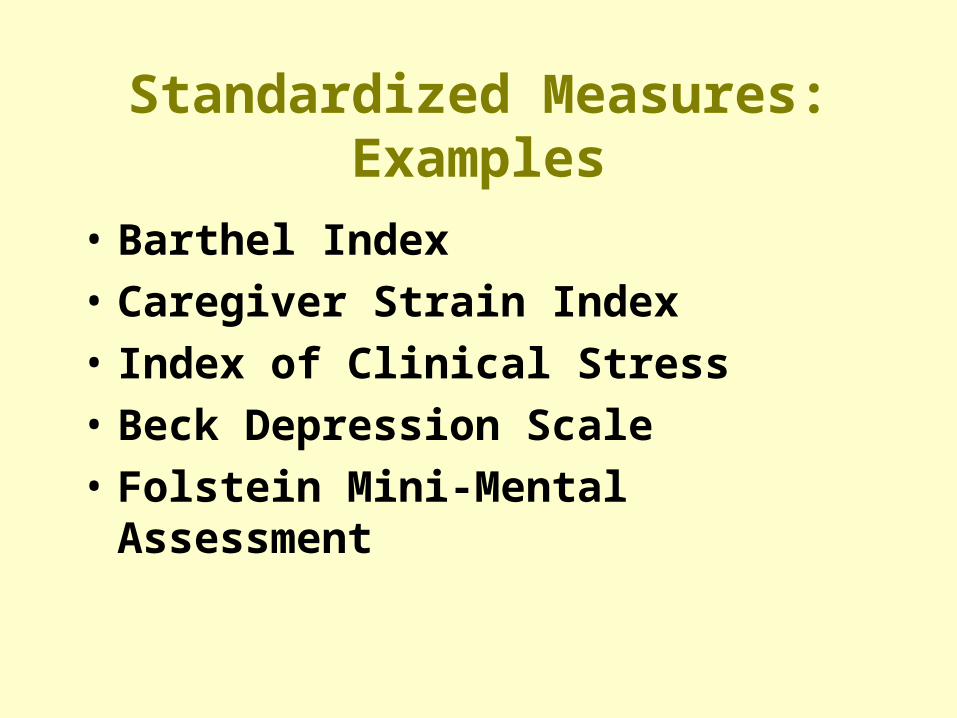
Standardized Measures: Examples
• Barthel Index
• Caregiver Strain Index
• Index of Clinical Stress
• Beck Depression Scale
• Folstein Mini-Mental Assessment
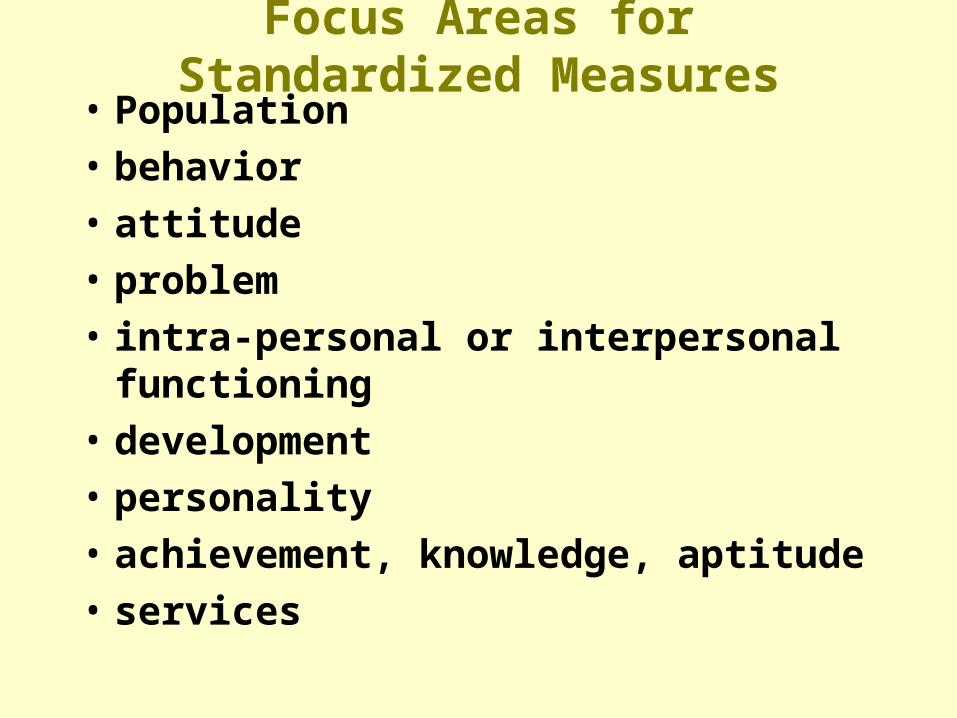
Focus Areas for Standardized Measures
• Population• behavior• attitude• problem• intra-personal or interpersonal functioning• development• personality• achievement, knowledge, aptitude• services
Likert - Scales
Most standardized measures use Likert Scale response formats which are typically treated as ordinal or continuous data
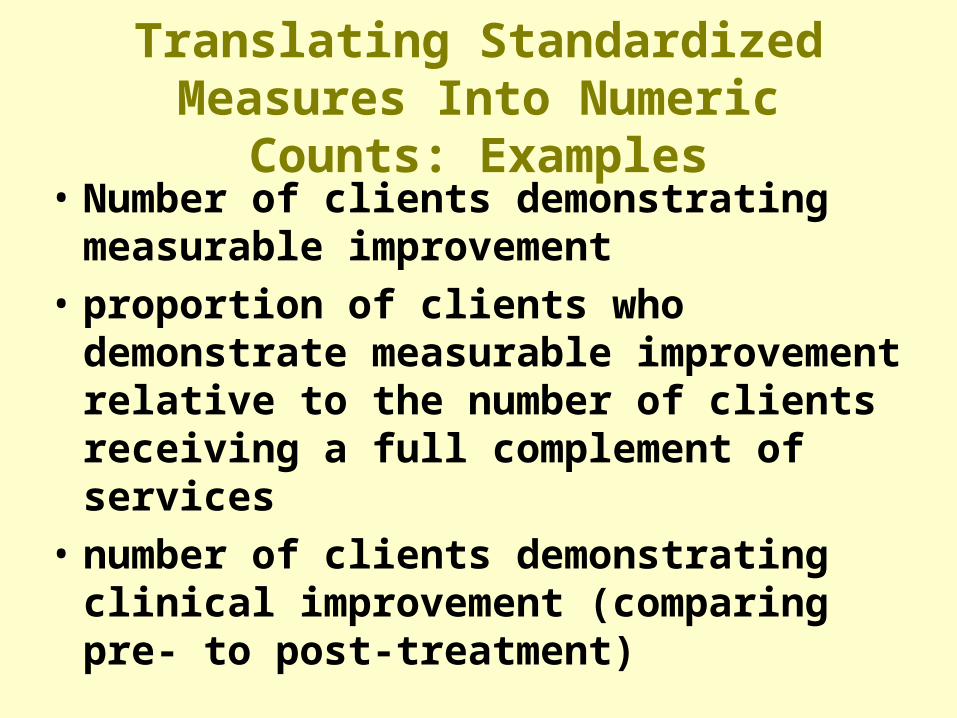
Translating Standardized Measures Into Numeric Counts: Examples
• Number of clients demonstrating measurable improvement
• proportion of clients who demonstrate measurable improvement relative to the number of clients receiving a full complement of services
• number of clients demonstrating clinical improvement (comparing pre- to post-treatment)
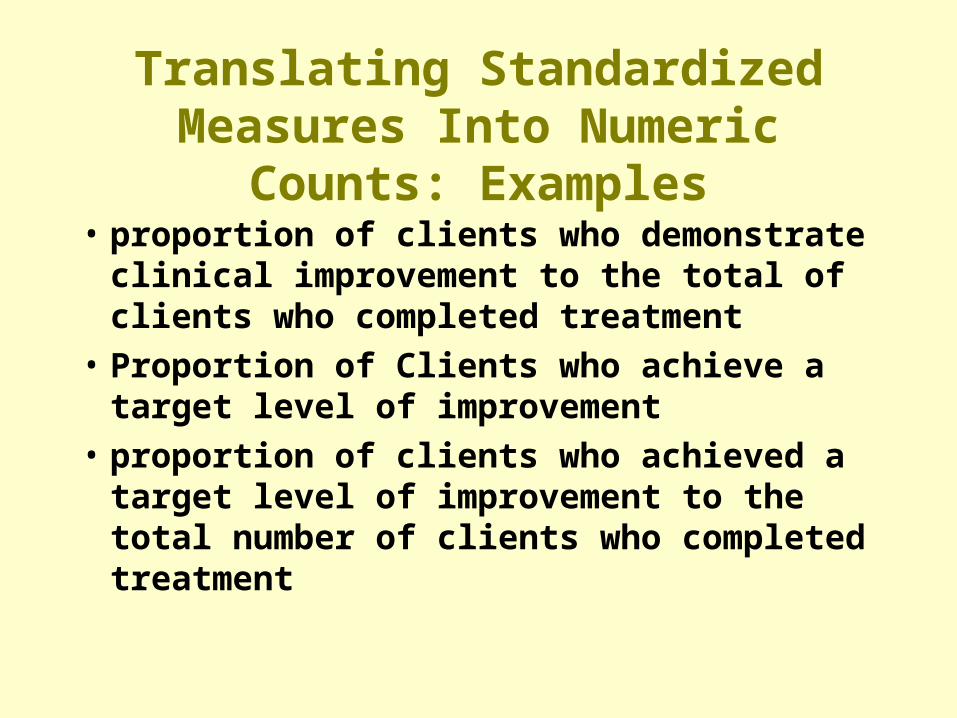
Translating Standardized Measures Into Numeric Counts: Examples
• proportion of clients who demonstrate clinical improvement to the total of clients who completed treatment
• Proportion of Clients who achieve a target level of improvement
• proportion of clients who achieved a target level of improvement to the total number of clients who completed treatment
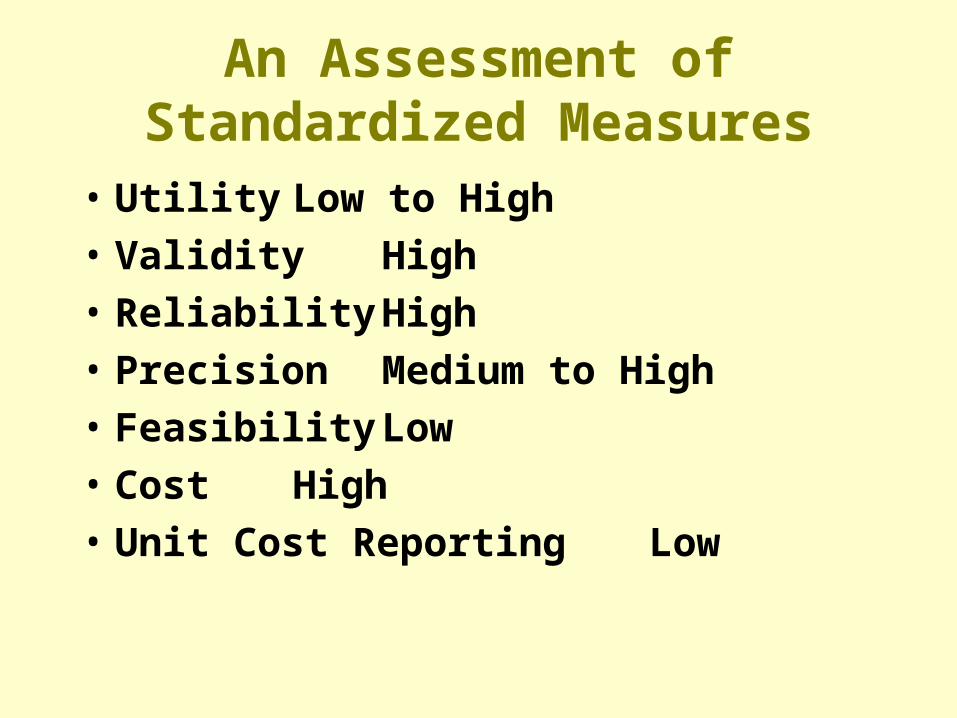
An Assessment of Standardized Measures
• Utility Low to High
• Validity High
• Reliability High
• Precision Medium to High
• Feasibility Low
• Cost High
• Unit Cost Reporting Low
Level of Functioning Scales
Level of Functioning Scales (LOFs): What are They?
Before & after client assessment tools designed for use with a particular human service program that attempts to capture an important dimension of client functioning
LOF Characteristics
• LOFs are typically focused on only one dimension of client functioning
• Consequently, LOF’s are typically used in combination to assess multiple dimensions of client functioning
• LOFs are typically (but not always) ranked from very low to very high
Principles of Designing an LOF Scale
• Conceptual Framework: Dimensions of functioning and descriptors anchoring the assessment scale must be based upon a thorough understanding of the program, clients, and the underlying problem
• Developing Descriptors:– should describe levels of functioning– should discriminate between different function
levels– should accurately reflect client behaviors
Principles of Designing an LOF Scale
• Respondent Considerations:
– Developing Scales with Client in Mind
• observe client
• ask client
• get information on client from third party
Observing Clients
• Identifying Behavior to be Observed: Involves becoming familiar with scales first, then observing clients
• Site of Observation: Behaviors change with setting so choose setting or settings
• Frequency of Observation: Utilize a discrete of settings in which the respondent uses to complete an LOF scale.
Observing Clients
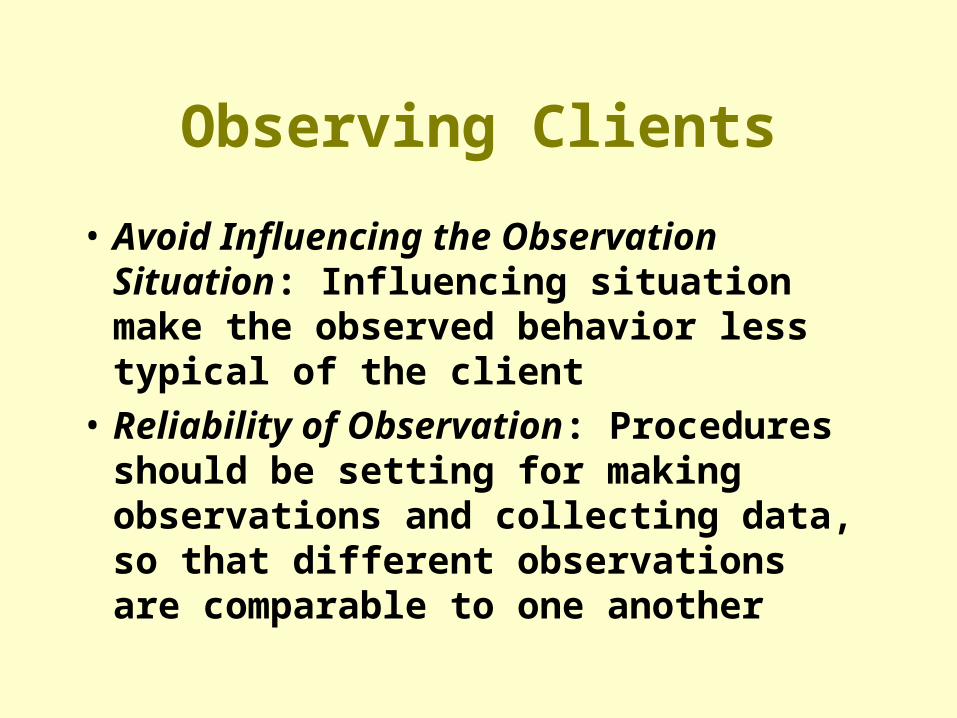
• Avoid Influencing the Observation Situation: Influencing situation make the observed behavior less typical of the client
• Reliability of Observation: Procedures should be setting for making observations and collecting data, so that different observations are comparable to one another
Constructing LOF Scales: Key Steps
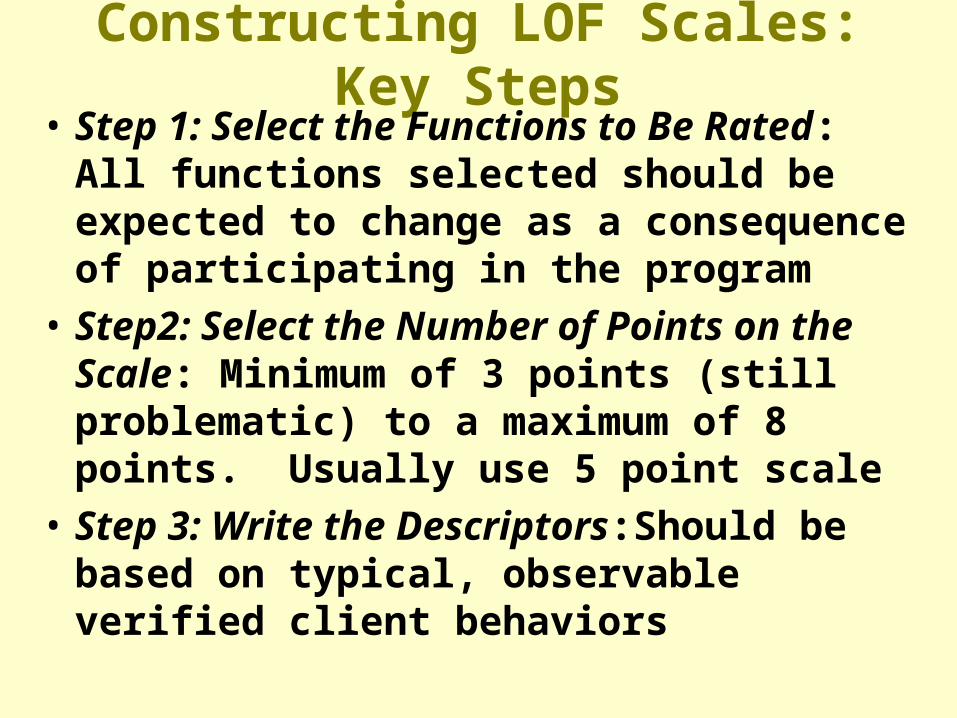
• Step 1: Select the Functions to Be Rated: All functions selected should be expected to change as a consequence of participating in the program
• Step2: Select the Number of Points on the Scale: Minimum of 3 points (still problematic) to a maximum of 8 points. Usually use 5 point scale
• Step 3: Write the Descriptors:Should be based on typical, observable verified client behaviors
Constructing LOF Scales: Key Steps
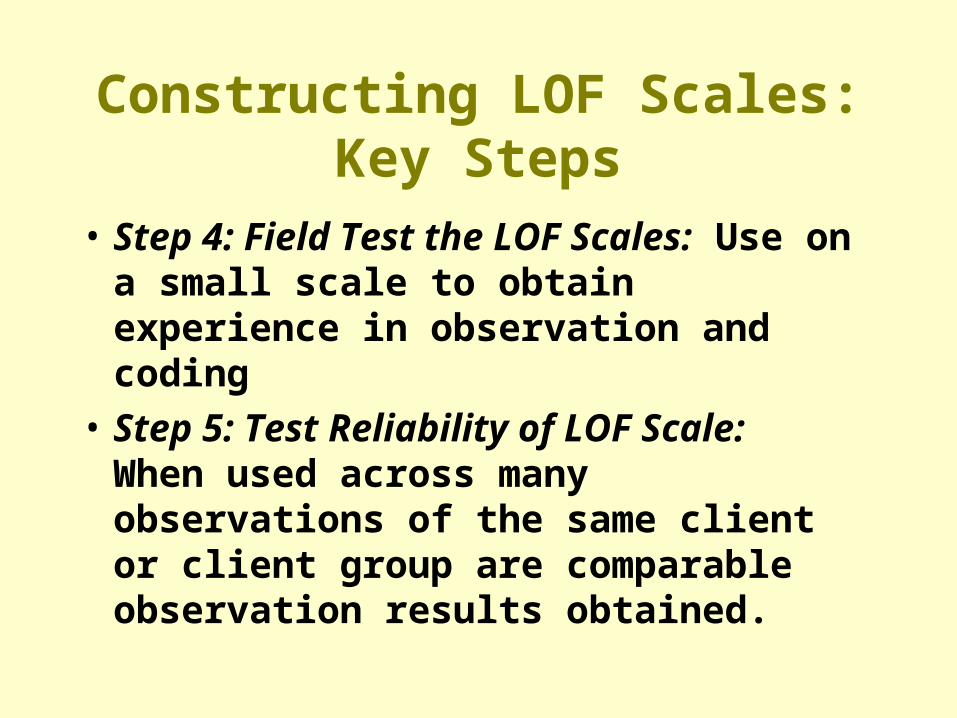
• Step 4: Field Test the LOF Scales: Use on a small scale to obtain experience in observation and coding
• Step 5: Test Reliability of LOF Scale: When used across many observations of the same client or client group are comparable observation results obtained.
Assessment of LOF Scales
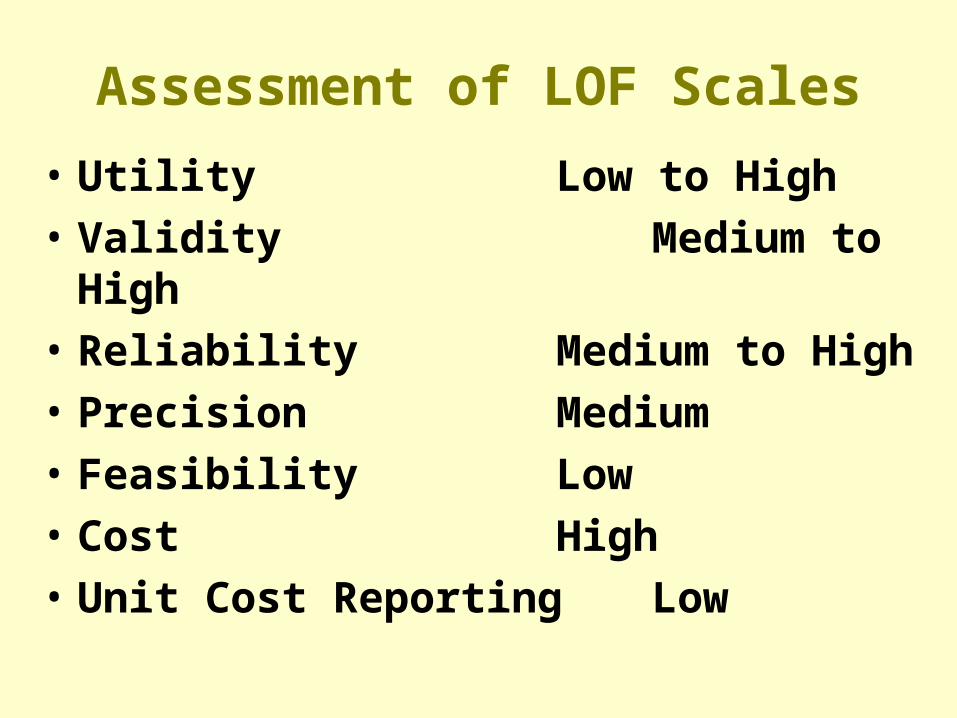
• Utility Low to High
• Validity Medium to High
• Reliability Medium to High
• Precision Medium
• Feasibility Low
• Cost High
• Unit Cost Reporting Low
Client Satisfaction
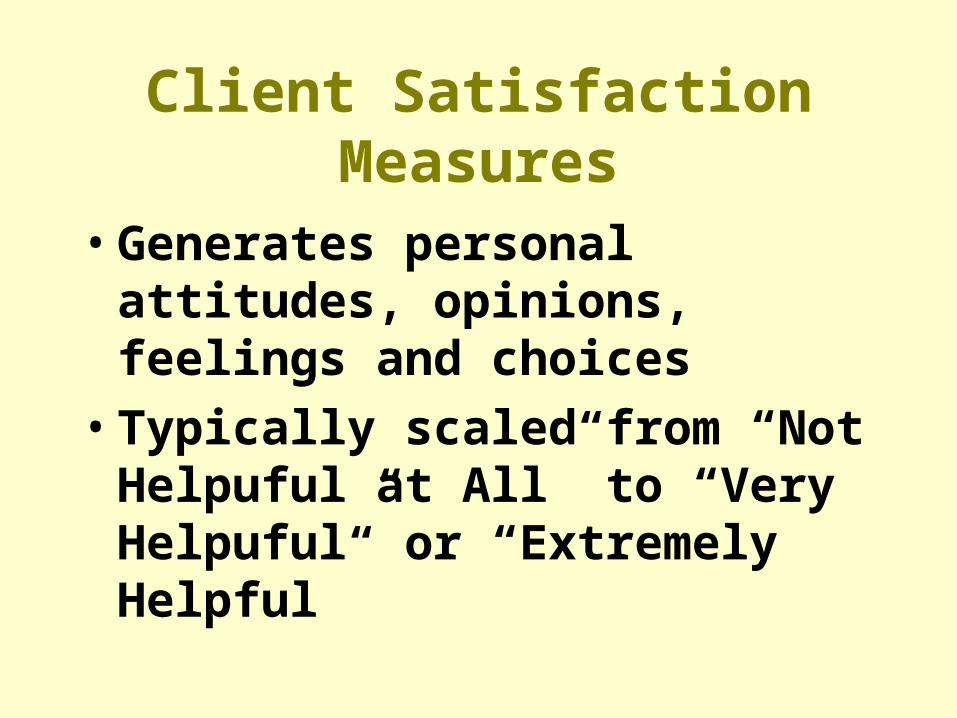
Client Satisfaction Measures
• Generates personal attitudes, opinions, feelings and choices
• Typically scaled from “Not Helpuful at All” to “Very Helpuful” or “Extremely Helpful”
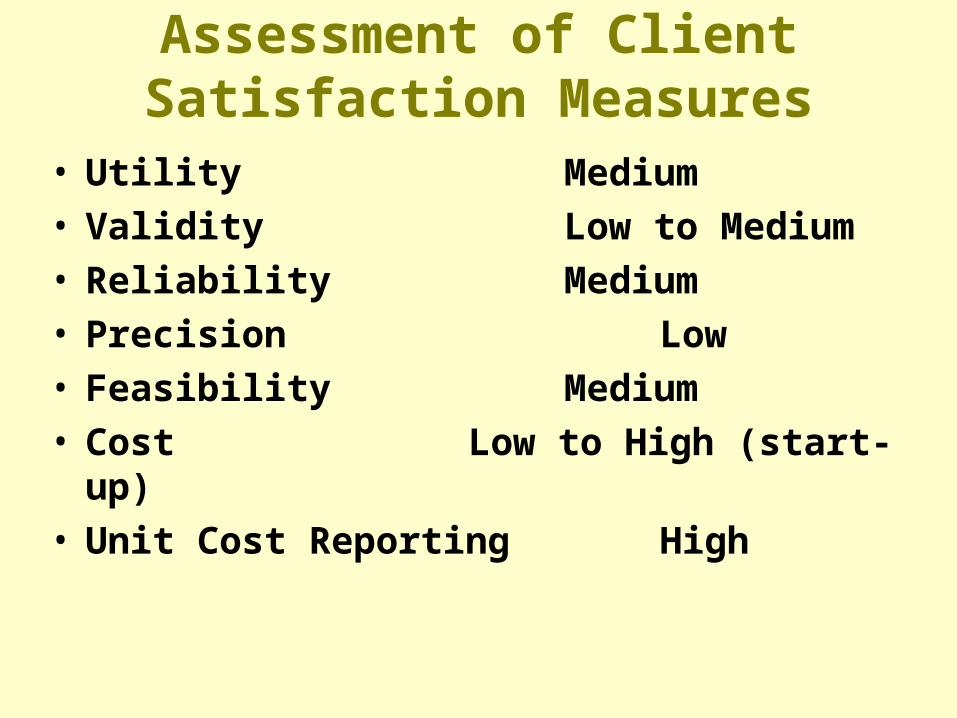
Assessment of Client Satisfaction Measures
• Utility Medium• Validity Low to Medium• Reliability Medium• Precision Low• Feasibility Medium• Cost Low to High (start-up)• Unit Cost Reporting High
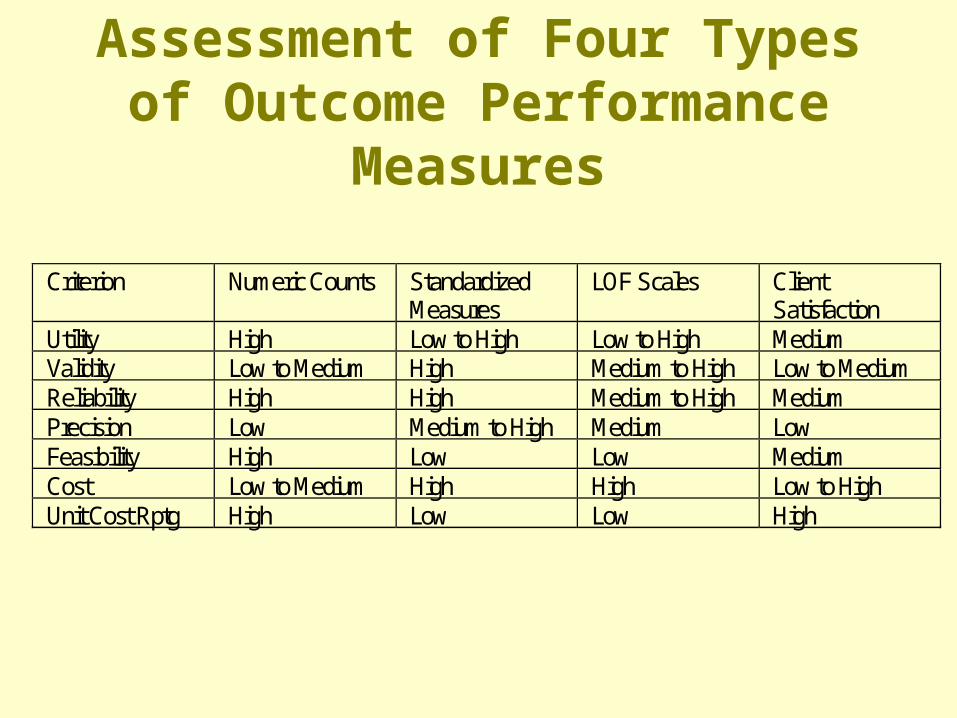
Assessment of Four Types of Outcome Performance Measures
Criterion Numeric Counts StandardizedMeasures
LOF Scales ClientSatisfaction
Utility High Low to High Low to High MediumValidity Low to Medium High Medium to High Low to MediumReliability High High Medium to High MediumPrecision Low Medium to High Medium LowFeasibility High Low Low MediumCost Low to Medium High High Low to HighUnit Cost Rptg High Low Low High

Issues in Selecting, Collecting, Reporting & Using Performance
Measures
Recurring Problems in Federal Grants
• Failing to relate performance measures to a program’s mission
• Relying too heavily on existing data
• Excluding stakeholders from the process
• Selecting too few quality performance measures
Three Key Questions in Reporting Performance Measurement Data
• How often should performance measurement data be reported? At least annually, semi-annually to quarterly is more functional
• How much time does it take to collect and aggregate performance measurement data? If performance data is collected regularly and automated then time required ranges from 10 to 20 hours to collect and aggregate a year’s worth of data
Three Key Questions in Reporting Performance Measurement Data: Displaying Performance
Measurement Data: • Inputs: Financial Resources in $; personnel
in FTE
• Outputs: intermediate (time, material); final outputs (service completions)
• Quality: client satisfaction%; Outputs with quality dimensions
• Outcomes & Ultimate Outcomes: intermediate outcomes (numeric counts of quality outcomes
Three Key Questions in Reporting Performance Measurement Data: Displaying
Performance Measurement Data:
• Cost Efficiency Ratios: Cost per intermediate outputs, & final outputs per FTE; cost per final output
• Cost Effectiveness Ratios: Cost per intermediate outcome, costs per intermediate & final outcomes per FTE, and cost per ultimate outcome.