Embed Size (px)
Citation preview
Center for Mass Spectrometry and Proteomics | Phone | (612)625-2280 | (612)625-2279
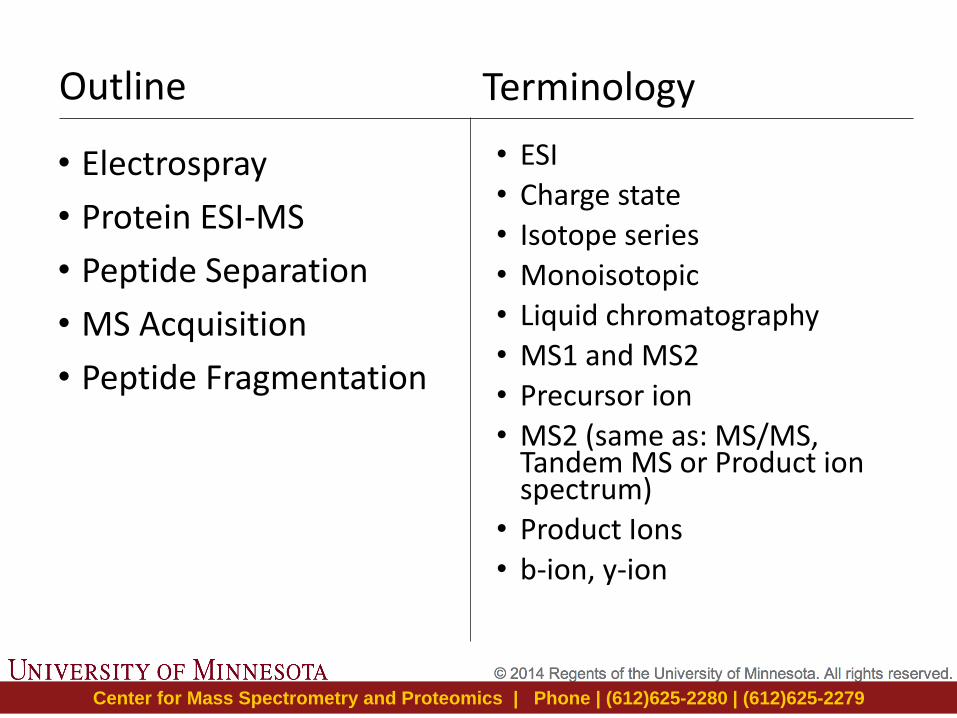
Outline
• Electrospray
• Protein ESI-MS
• Peptide Separation
• MS Acquisition
• Peptide Fragmentation
Terminology
• ESI
• Charge state
• Isotope series
• Monoisotopic
• Liquid chromatography
• MS1 and MS2
• Precursor ion
• MS2 (same as: MS/MS, Tandem MS or Product ion spectrum)
• Product Ions
• b-ion, y-ion
Center for Mass Spectrometry and Proteomics | Phone | (612)625-2280 | (612)625-2279
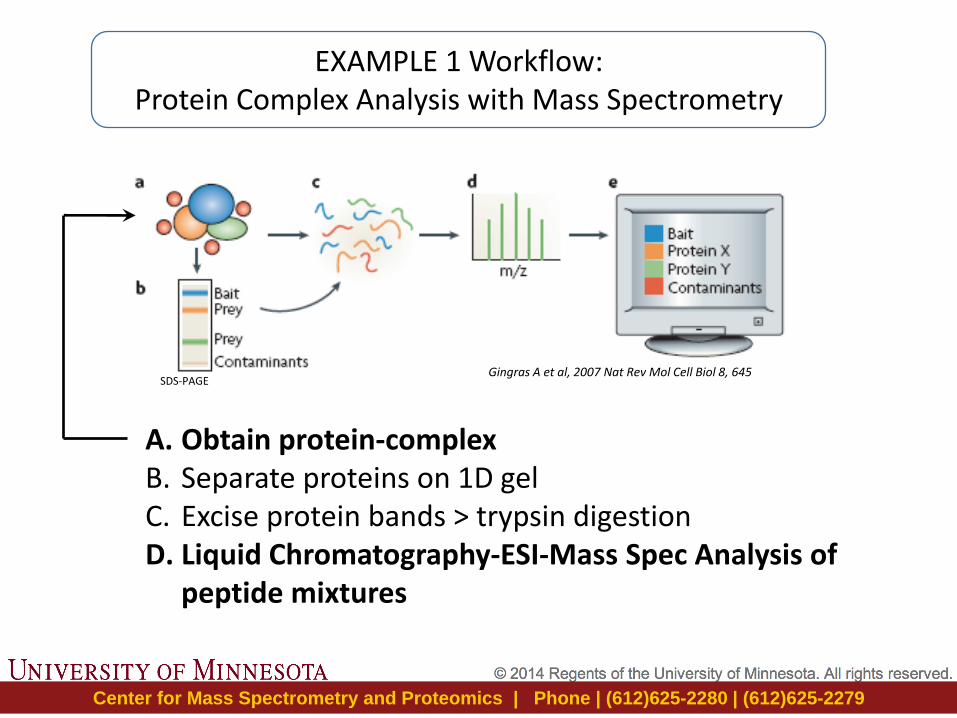
Gingras A et al, 2007 Nat Rev Mol Cell Biol 8, 645
A. Obtain protein-complex B. Separate proteins on 1D gel C. Excise protein bands > trypsin digestion D. Liquid Chromatography-ESI-Mass Spec Analysis of
peptide mixtures
SDS-PAGE
EXAMPLE 1 Workflow: Protein Complex Analysis with Mass Spectrometry
Center for Mass Spectrometry and Proteomics | Phone | (612)625-2280 | (612)625-2279
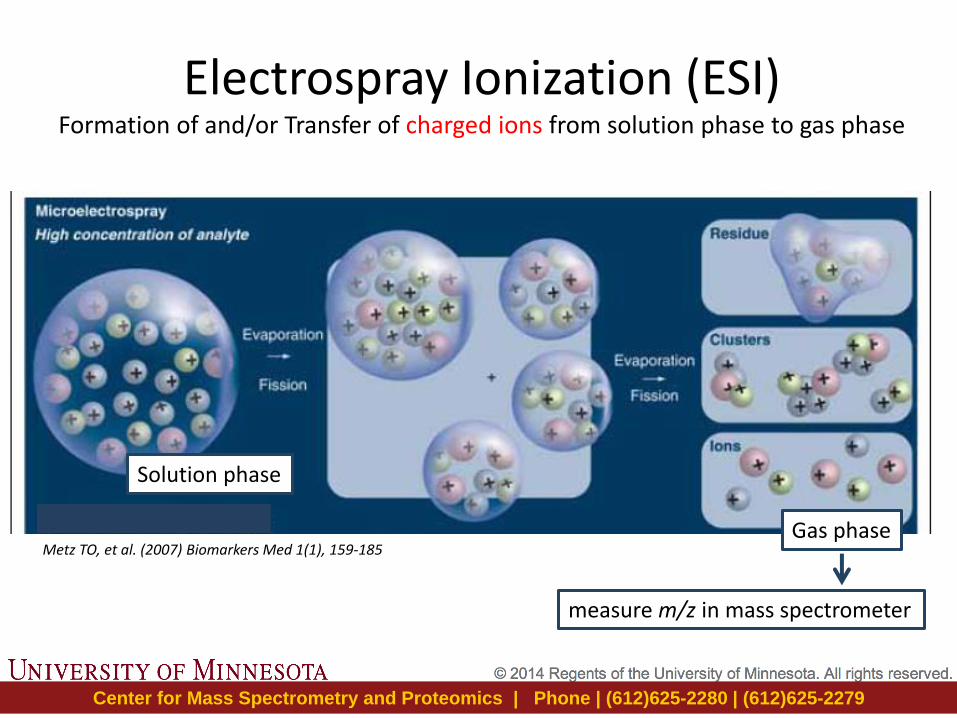
Electrospray Ionization (ESI) Formation of and/or Transfer of charged ions from solution phase to gas phase
Metz TO, et al. (2007) Biomarkers Med 1(1), 159-185
Solution phase
Gas phase
measure m/z in mass spectrometer
Center for Mass Spectrometry and Proteomics | Phone | (612)625-2280 | (612)625-2279
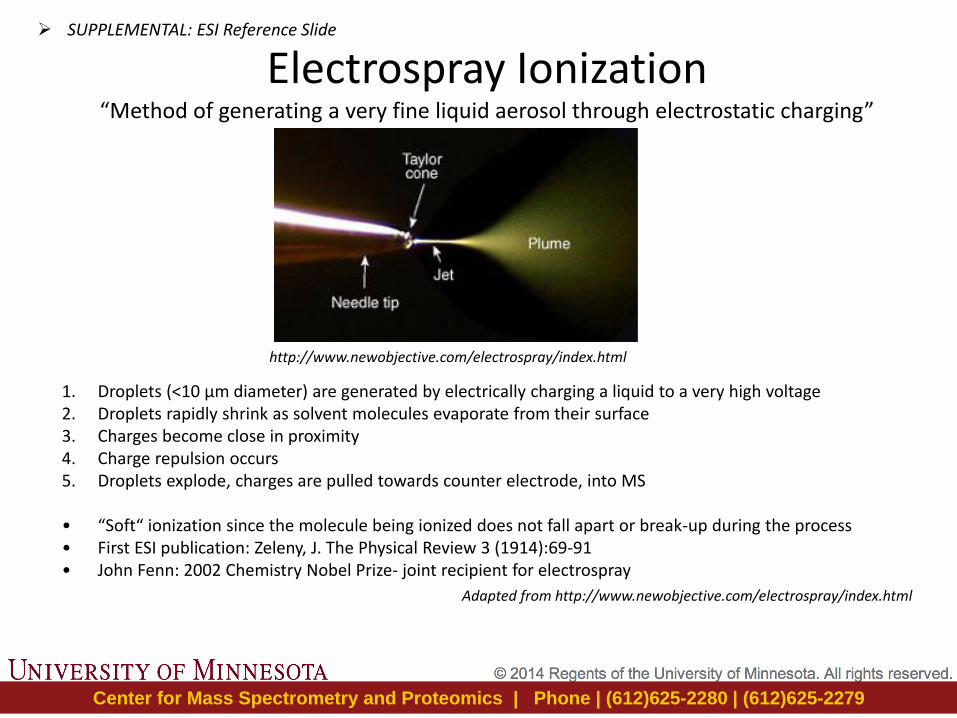
Electrospray Ionization “Method of generating a very fine liquid aerosol through electrostatic charging”
http://www.newobjective.com/electrospray/index.html
1. Droplets (<10 µm diameter) are generated by electrically charging a liquid to a very high voltage 2. Droplets rapidly shrink as solvent molecules evaporate from their surface 3. Charges become close in proximity 4. Charge repulsion occurs 5. Droplets explode, charges are pulled towards counter electrode, into MS
• “Soft“ ionization since the molecule being ionized does not fall apart or break-up during the process • First ESI publication: Zeleny, J. The Physical Review 3 (1914):69-91 • John Fenn: 2002 Chemistry Nobel Prize- joint recipient for electrospray
Adapted from http://www.newobjective.com/electrospray/index.html
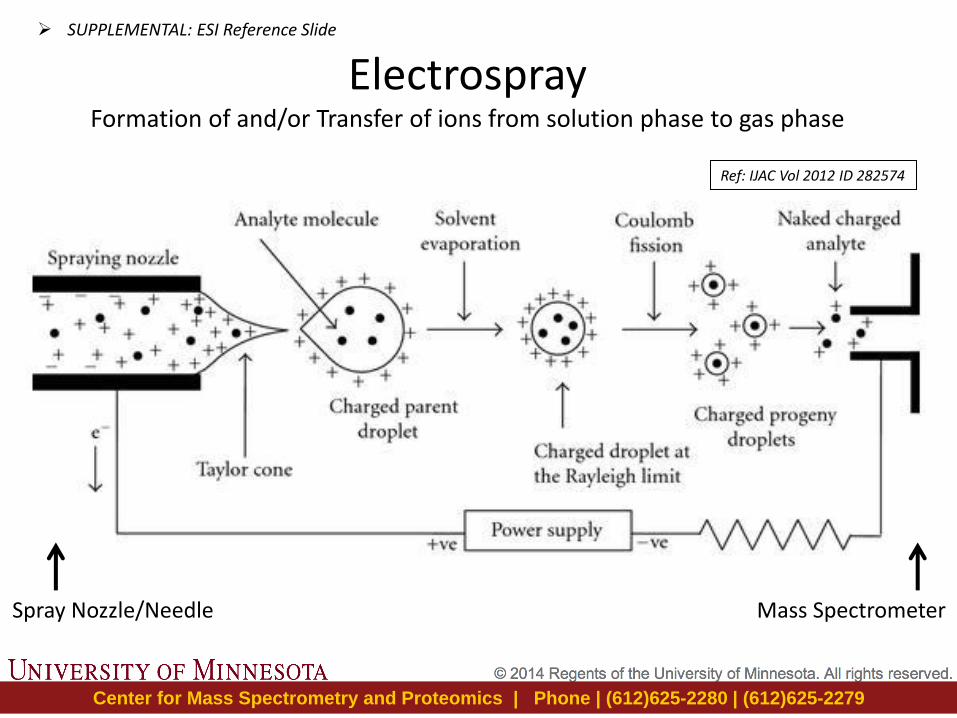
SUPPLEMENTAL: ESI Reference Slide
Center for Mass Spectrometry and Proteomics | Phone | (612)625-2280 | (612)625-2279
Electrospray Formation of and/or Transfer of ions from solution phase to gas phase
Ref: IJAC Vol 2012 ID 282574
Spray Nozzle/Needle Mass Spectrometer
SUPPLEMENTAL: ESI Reference Slide
Center for Mass Spectrometry and Proteomics | Phone | (612)625-2280 | (612)625-2279
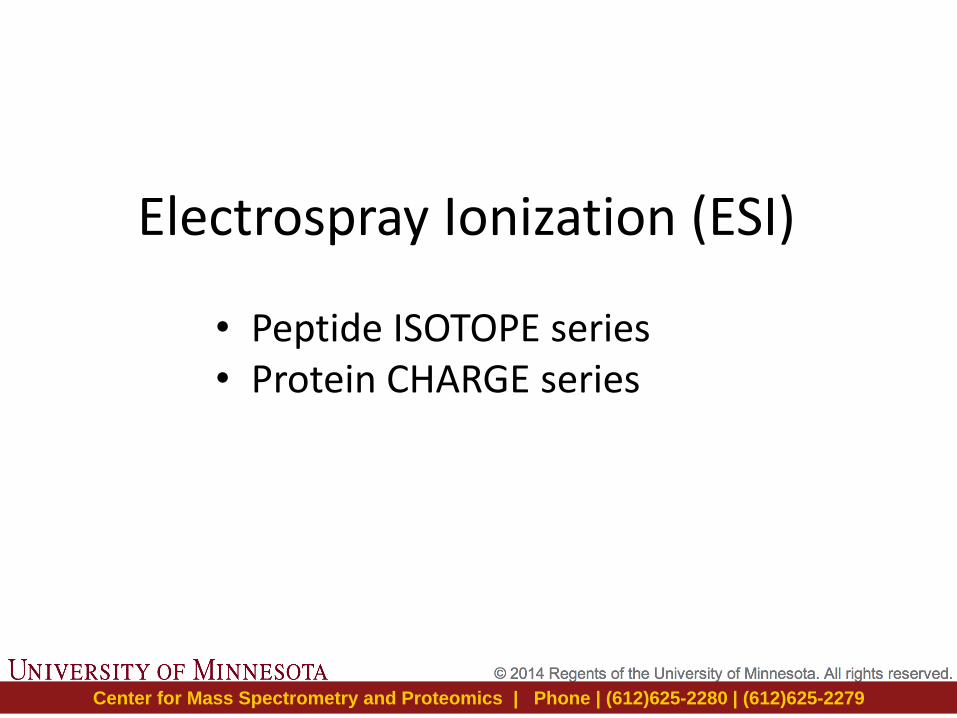
Electrospray Ionization (ESI)
• Peptide ISOTOPE series • Protein CHARGE series
Center for Mass Spectrometry and Proteomics | Phone | (612)625-2280 | (612)625-2279
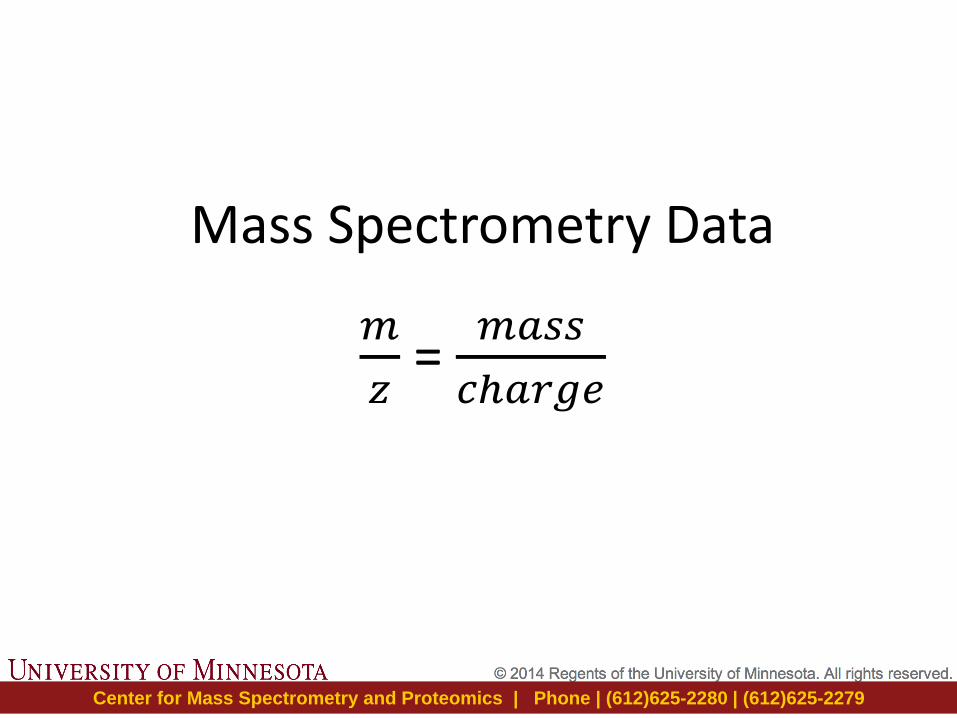
Mass Spectrometry Data
𝑚
𝑧 =
𝑚𝑎𝑠𝑠
𝑐ℎ𝑎𝑟𝑔𝑒
Center for Mass Spectrometry and Proteomics | Phone | (612)625-2280 | (612)625-2279
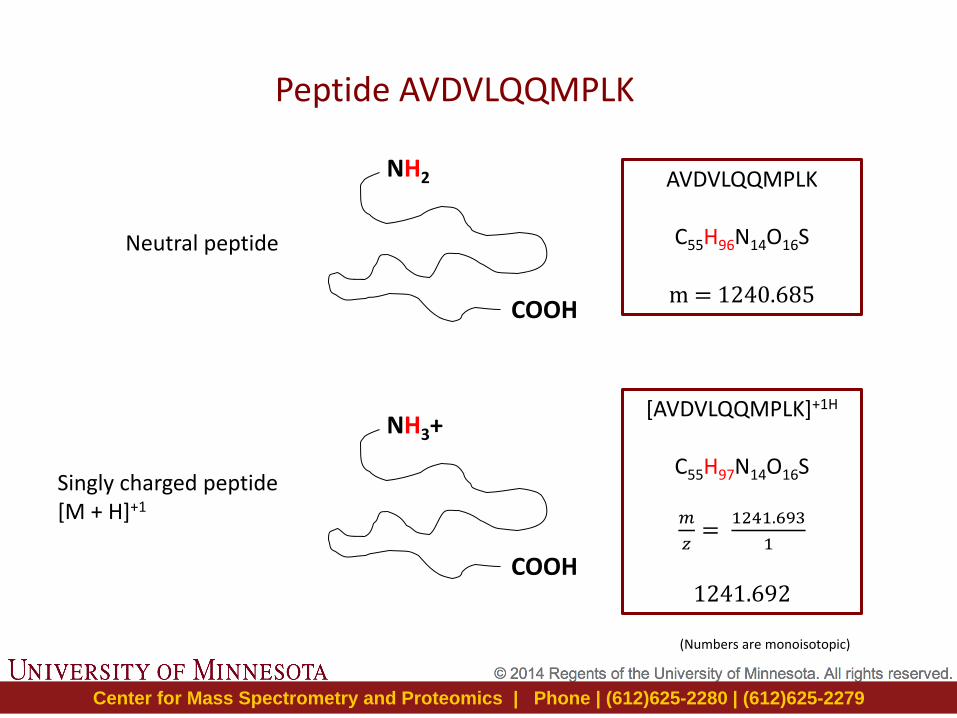
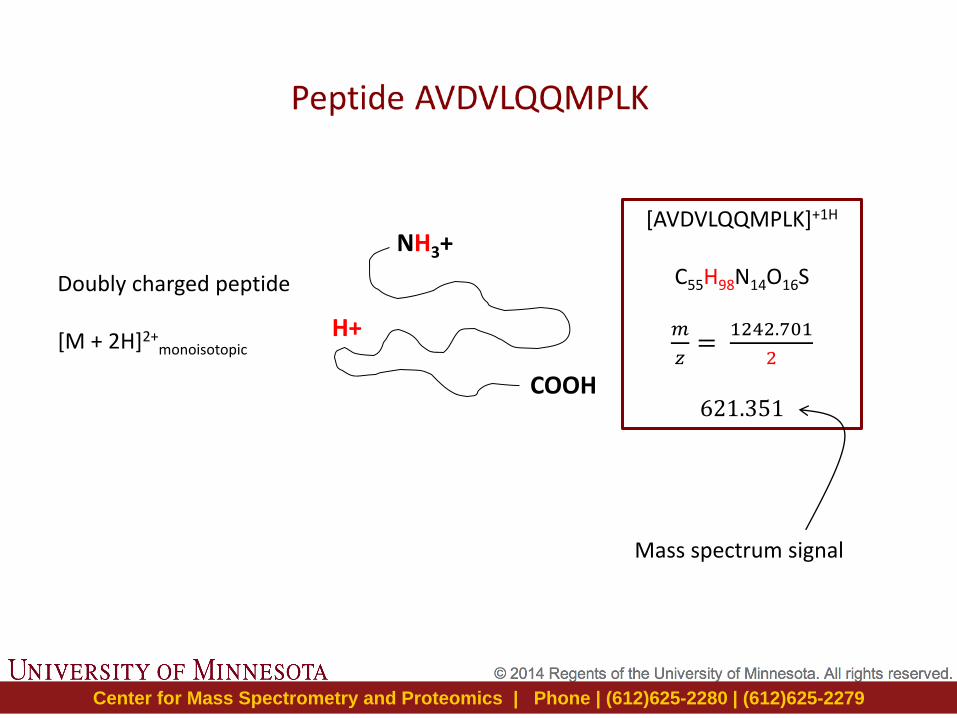
Peptide AVDVLQQMPLK
NH3+
COOH
[AVDVLQQMPLK]+1H
C55H97N14O16S
𝑚
𝑧=
1241.693
1
1241.692
AVDVLQQMPLK
C55H96N14O16S
m = 1240.685
Neutral peptide
Singly charged peptide [M + H]+1
NH2
COOH
(Numbers are monoisotopic)
Center for Mass Spectrometry and Proteomics | Phone | (612)625-2280 | (612)625-2279
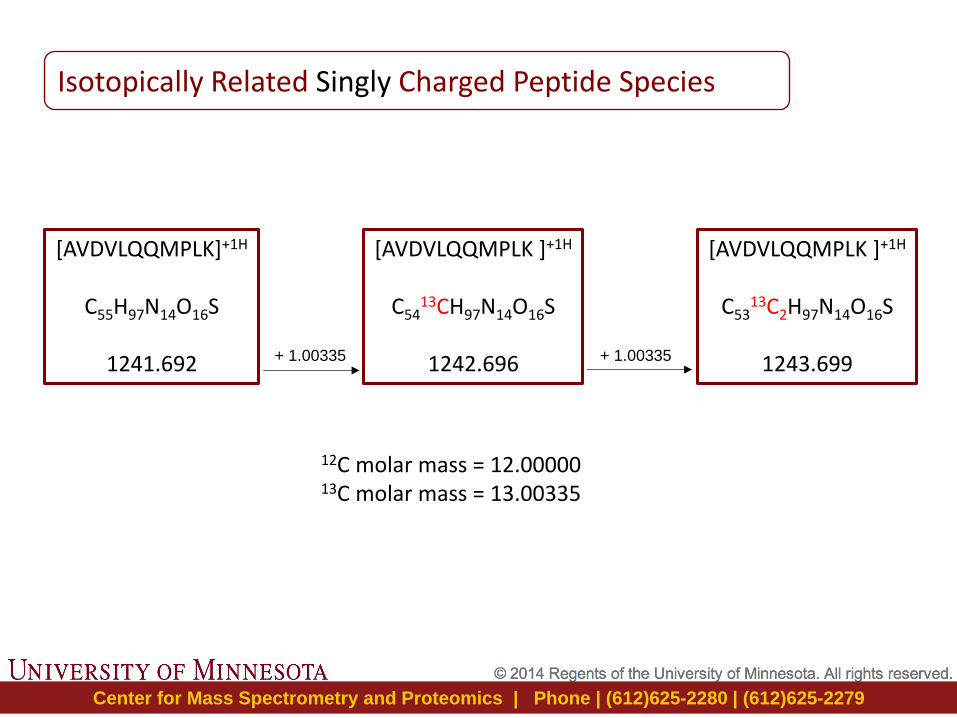
[AVDVLQQMPLK]+1H
C55H97N14O16S
1241.692
[AVDVLQQMPLK ]+1H
C5413CH97N14O16S
1242.696 + 1.00335
[AVDVLQQMPLK ]+1H
C5313C2H97N14O16S
1243.699 + 1.00335
12C molar mass = 12.00000 13C molar mass = 13.00335
Isotopically Related Singly Charged Peptide Species
Center for Mass Spectrometry and Proteomics | Phone | (612)625-2280 | (612)625-2279
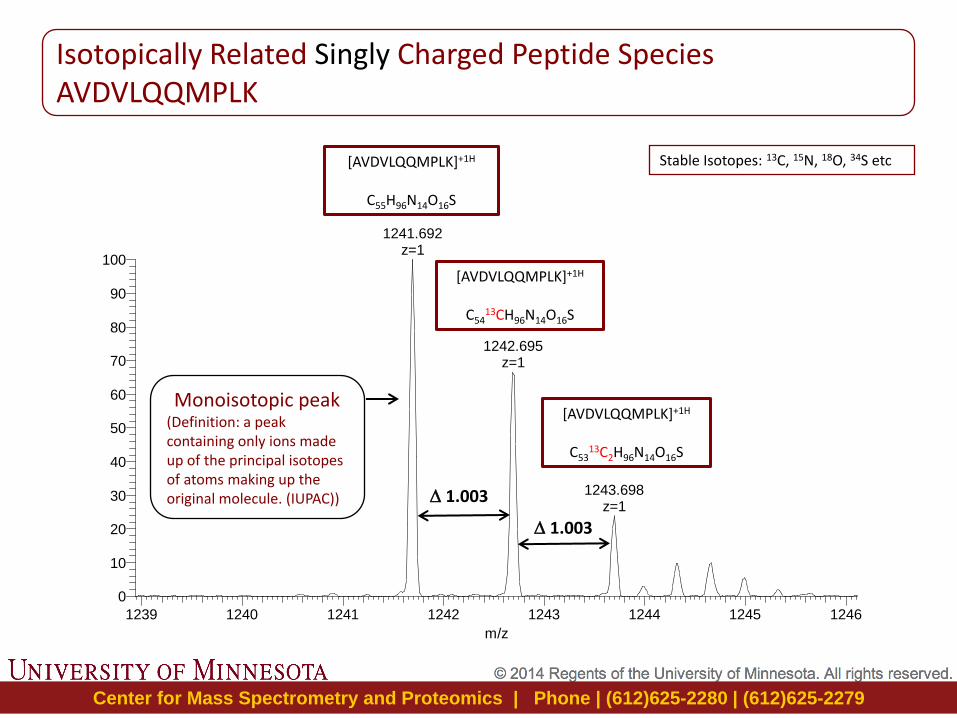
higgi022_20140703_13837_c_ellie_13to19_MS1_prof #10148-10248 RT: 75.89-76.64 AV: 101 NL: 1.03E5T: FTMS + p NSI Full ms [360.00-1800.00]
1239 1240 1241 1242 1243 1244 1245 1246
m/z
0
10
20
30
40
50
60
70
80
90
100
Re
lative A
bundance
1241.692z=1
1242.695z=1
1243.698z=1
1.003
1.003
Isotopically Related Singly Charged Peptide Species AVDVLQQMPLK
[AVDVLQQMPLK]+1H
C55H96N14O16S
[AVDVLQQMPLK]+1H
C5413CH96N14O16S
[AVDVLQQMPLK]+1H
C5313C2H96N14O16S
Monoisotopic peak (Definition: a peak containing only ions made up of the principal isotopes of atoms making up the original molecule. (IUPAC))
Stable Isotopes: 13C, 15N, 18O, 34S etc
Center for Mass Spectrometry and Proteomics | Phone | (612)625-2280 | (612)625-2279
NH3+
COOH
H+
[AVDVLQQMPLK]+1H
C55H98N14O16S
𝑚
𝑧=
1242.701
2
621.351
Doubly charged peptide [M + 2H]2+
monoisotopic
Mass spectrum signal
Center for Mass Spectrometry and Proteomics | Phone | (612)625-2280 | (612)625-2279
[AVDVLQQMPLK]+1H
C55H97N14O16S
1241.692
[AVDVLQQMPLK]+1H
C5413CH97N14O16S
1242.695
[AVDVLQQMPLK]+1H
C5313C2H97N14O16S
1243.699
Isotopically Related Singly Charged Peptide Species
[AVDVLQQMPLK]+2H
C55H98N14O16S
𝑚
𝑧=
1242.701
2
621.351
[AVDVLQQMPLK]+2H
C5413CH98N14O16S
𝑚
𝑧=
1243.704
2
621.852
0.5
Isotopically Related Doubly Charged Peptide Species
0.5
+ 1.00335 + 1.00335
[AVDVLQQMPLK]+2H
C5313C2H98N14O16S
𝑚
𝑧=
1244.707
2
622.354
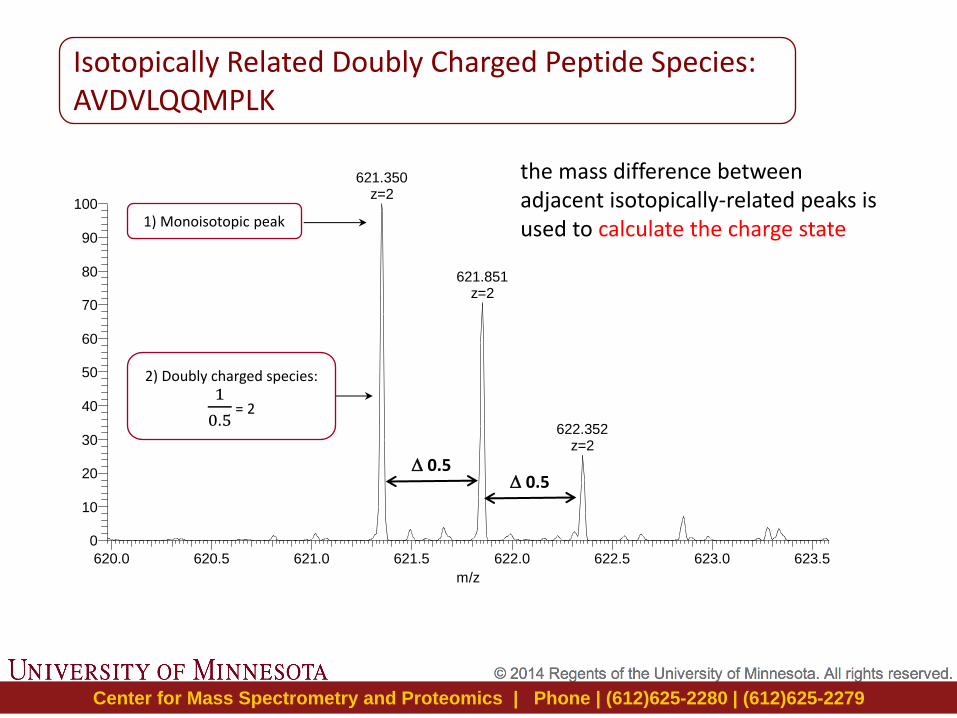
Center for Mass Spectrometry and Proteomics | Phone | (612)625-2280 | (612)625-2279
higgi022_20140703_13837_c_ellie_13to19_MS1_prof #10148-10248 RT: 75.89-76.64 AV: 101 NL: 1.70E6T: FTMS + p NSI Full ms [360.00-1800.00]
620.0 620.5 621.0 621.5 622.0 622.5 623.0 623.5
m/z
0
10
20
30
40
50
60
70
80
90
100
Re
lative A
bundance
621.350z=2
621.851z=2
622.352z=2
0.5 0.5
Isotopically Related Doubly Charged Peptide Species: AVDVLQQMPLK
1) Monoisotopic peak
2) Doubly charged species: 1
0.5 = 2
the mass difference between adjacent isotopically-related peaks is used to calculate the charge state
Center for Mass Spectrometry and Proteomics | Phone | (612)625-2280 | (612)625-2279
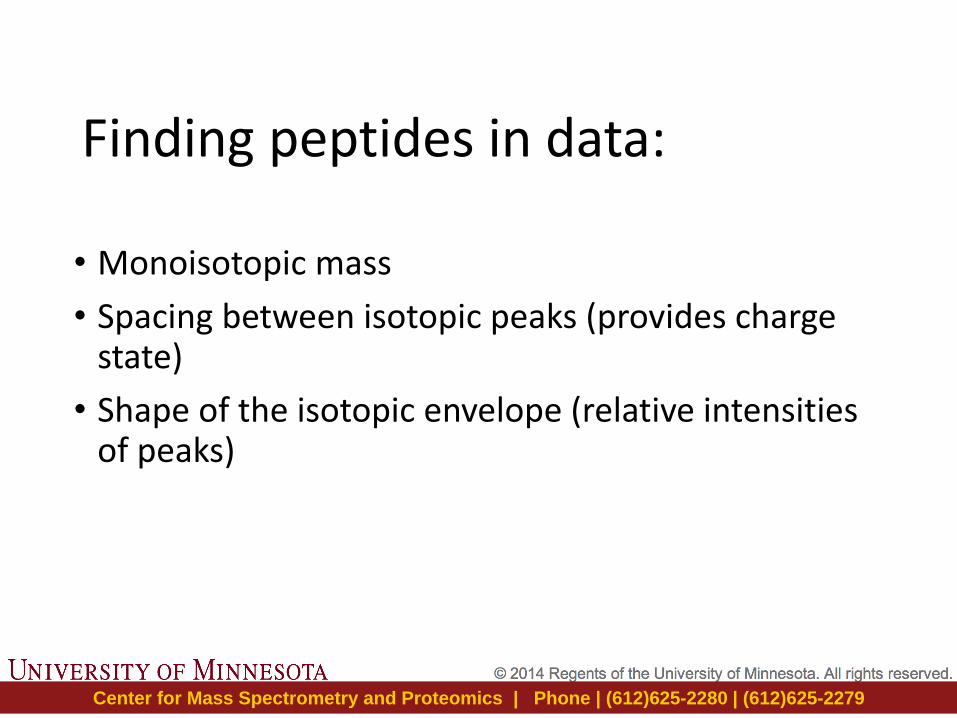
Finding peptides in data:
• Monoisotopic mass
• Spacing between isotopic peaks (provides charge state)
• Shape of the isotopic envelope (relative intensities of peaks)
Center for Mass Spectrometry and Proteomics | Phone | (612)625-2280 | (612)625-2279
Intact Protein Electrospray - Mass Spectrum
200 1000 2000 m/z
+7 1766.6
+8 1545.7
+9 1374.2
+10 1236.9
+11 1124.6
+12 1031.0
+13 951.8
+14 884.0
+15 825.0
+16 772.4
+17 727.5
0
50
100
Rel
ativ
e A
bu
nd
ance
PROTEIN CHARGE SERIES
10000
mass
12500 15000 0
50
100
Rel
ativ
e A
bu
nd
ance
12359 +/- 2
Mathematically deconvoluted Data Protein MW
Center for Mass Spectrometry and Proteomics | Phone | (612)625-2280 | (612)625-2279
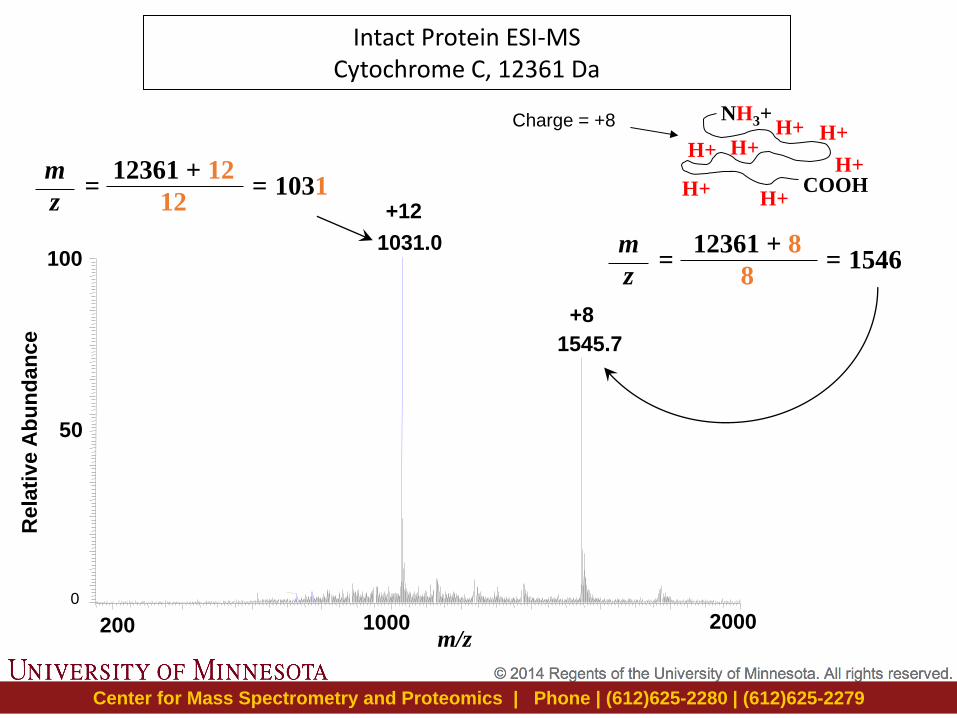
Intact Protein ESI-MS Cytochrome C, 12361 Da
m
z =
12361 + 8
8 = 1546
+8
m
z =
12361 + 12
12 = 1031
+12
1031.0
200 1000 2000 m/z
1545.7
0
50
100
Re
lati
ve A
bu
nd
an
ce
NH3+
COOH
H+
H+
H+ H+
H+ H+ H+
Charge = +8
Center for Mass Spectrometry and Proteomics | Phone | (612)625-2280 | (612)625-2279
Intact Protein Electrospray-MS Infusion of Solubilized Relatively Pure Protein
• Relatively pure sample • 20 – 50 M protein concentration • Detergent and salt free solution • Typical solvent: 50:50, acetonitrile:water, 0.1% formic
acid • Difficult (but possible) to achieve high quality data • Non-covalent interactions are retained with ESI (not
MALDI), usually with neutral/basic buffer system and a lot of trial and error
Center for Mass Spectrometry and Proteomics | Phone | (612)625-2280 | (612)625-2279
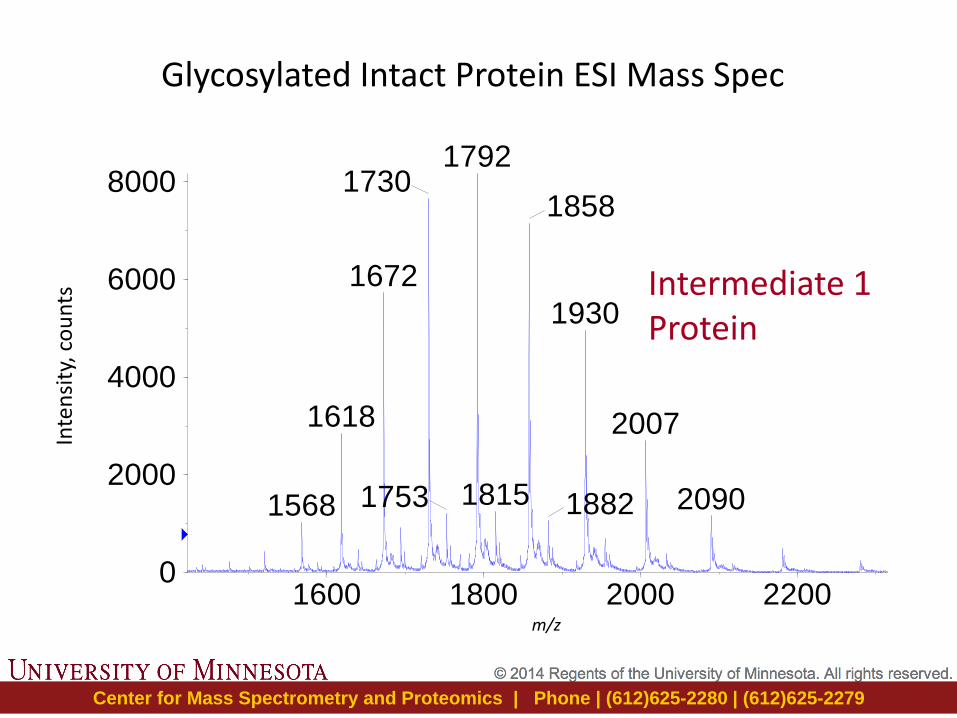
+TOF MS: 65 MCA scans fro...a=3.57017668630689880e-00...
Max. 8177.0 counts.
1600 1800 2000 2200m/z, amu
0
2000
4000
6000
8000
Inte
ns
ity
, c
ou
nts
17921730
1858
1672
1930
1618 2007
18151753 209018821568
m/z
Inte
nsi
ty, c
ou
nts
Intermediate 1 Protein
Glycosylated Intact Protein ESI Mass Spec
Center for Mass Spectrometry and Proteomics | Phone | (612)625-2280 | (612)625-2279
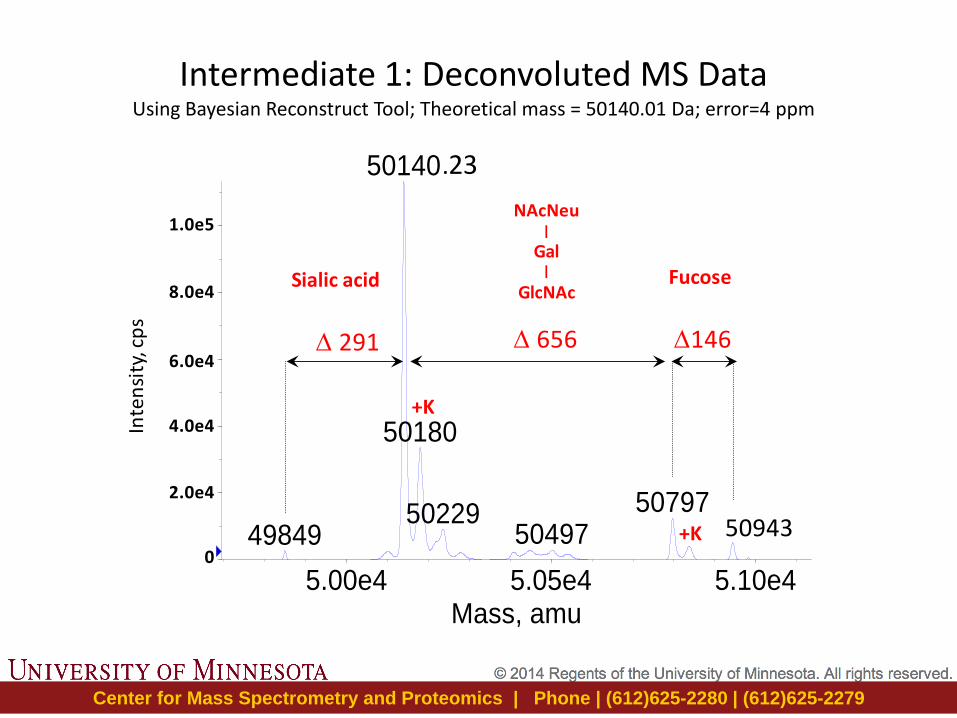
Intermediate 1: Deconvoluted MS Data Using Bayesian Reconstruct Tool; Theoretical mass = 50140.01 Da; error=4 ppm
Mass reconstruction of +TOF MS: ...a=3.57017668630689880e-004, t0...
Max. 1.1e5 cps.
5.00e4 5.05e4 5.10e4Mass, amu
0.00
2.00e4
4.00e4
6.00e4
8.00e4
1.00e5
1.13e5
Inte
ns
ity
, c
ps
50140
50180
50797502295049749849
Inte
nsi
ty, c
ps
1.0e5
8.0e4
6.0e4
4.0e4
2.0e4
0
50943
.23
656
+K
+K
Sialic acid
291
Fucose
146
NAcNeu|
Gal|
GlcNAc
Center for Mass Spectrometry and Proteomics | Phone | (612)625-2280 | (612)625-2279
Complex Samples Cannot be Infused Directly into the Mass Spectrometer
Mixtures are separated or partially separated before MS analysis with
Chromatographic Technologies
Center for Mass Spectrometry and Proteomics | Phone | (612)625-2280 | (612)625-2279
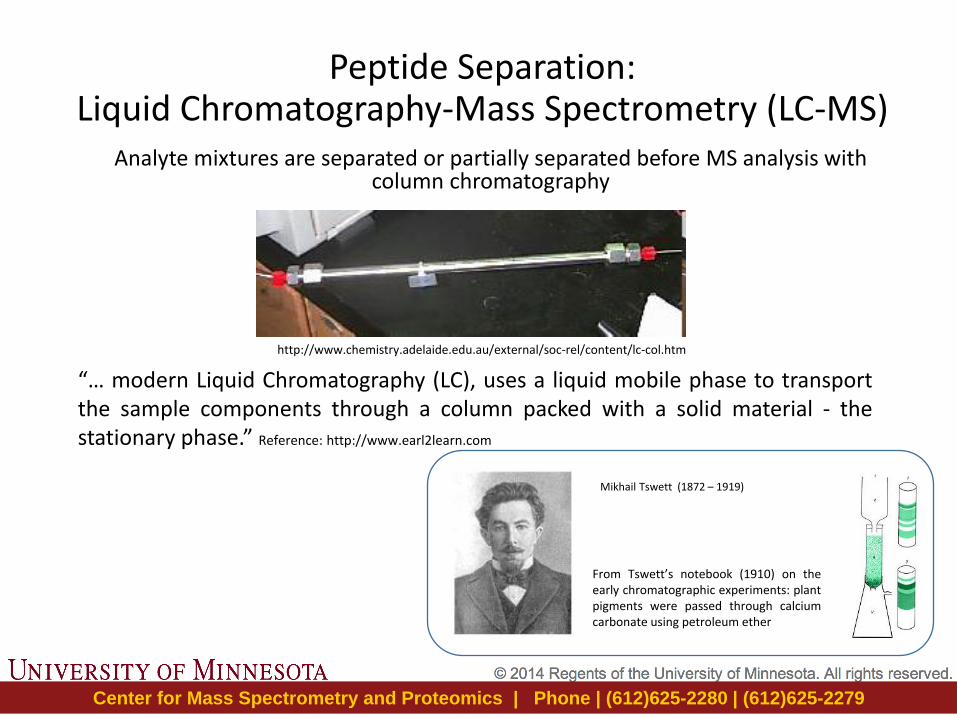
Peptide Separation:
Liquid Chromatography-Mass Spectrometry (LC-MS) Analyte mixtures are separated or partially separated before MS analysis with
column chromatography
http://www.chemistry.adelaide.edu.au/external/soc-rel/content/lc-col.htm
“… modern Liquid Chromatography (LC), uses a liquid mobile phase to transport the sample components through a column packed with a solid material - the stationary phase.” Reference: http://www.earl2learn.com
From Tswett’s notebook (1910) on the early chromatographic experiments: plant pigments were passed through calcium carbonate using petroleum ether
Mikhail Tswett (1872 – 1919)
Center for Mass Spectrometry and Proteomics | Phone | (612)625-2280 | (612)625-2279
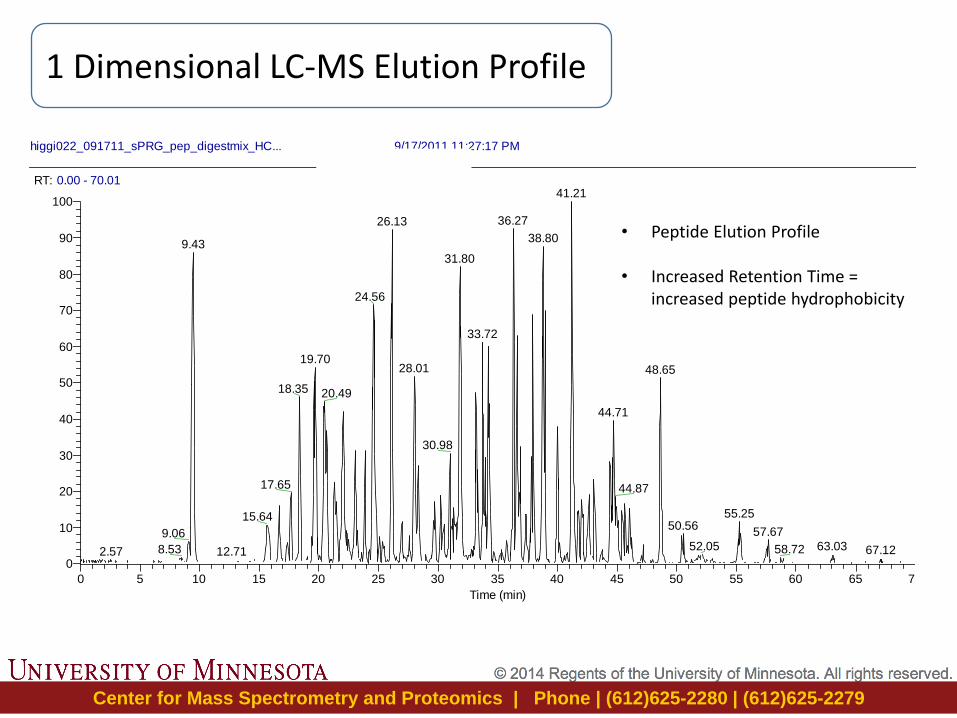
higgi022_091711_sPRG_pep_digestmix_HC... 9/17/2011 11:27:17 PM
RT: 0.00 - 70.01
0 5 10 15 20 25 30 35 40 45 50 55 60 65 70
Time (min)
0
10
20
30
40
50
60
70
80
90
100
Re
lative
Ab
un
da
nce
41.21
36.2726.13
38.809.43
31.80
24.56
33.72
19.7028.01 48.65
18.35 20.49
44.71
30.98
17.65 44.87
55.2515.6450.56
57.679.0663.0352.05 58.728.53 67.1212.712.57
NL: 1.63E8
Base Peak F: FTMS + c NSI Full ms [300.00-1800.00] MS higgi022_091711_sPRG_pep_digestmix_HCD_40_01
• Peptide Elution Profile
• Increased Retention Time = increased peptide hydrophobicity
1 Dimensional LC-MS Elution Profile
Center for Mass Spectrometry and Proteomics | Phone | (612)625-2280 | (612)625-2279
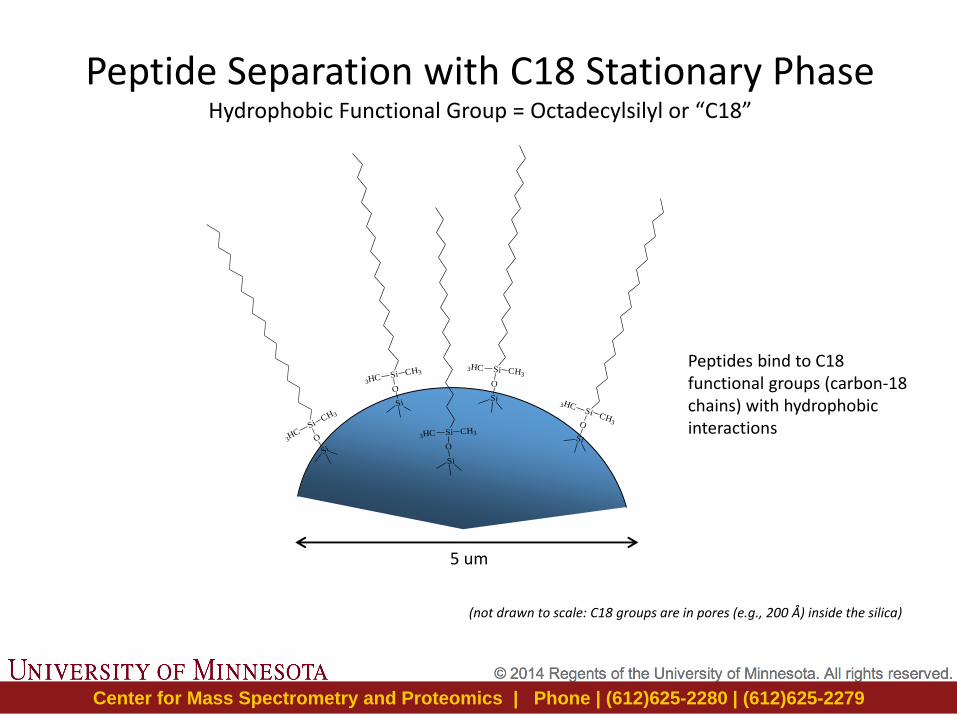
Peptide Separation with C18 Stationary Phase Hydrophobic Functional Group = Octadecylsilyl or “C18”
Si
O
SiCH3
3HC
Si
O
Si CH3
3HC
Si
O
Si CH33HC
Si
O
Si CH33HC
Si
O
Si CH3
3HC
Peptides bind to C18 functional groups (carbon-18 chains) with hydrophobic interactions
5 um
(not drawn to scale: C18 groups are in pores (e.g., 200 Å) inside the silica)
Center for Mass Spectrometry and Proteomics | Phone | (612)625-2280 | (612)625-2279
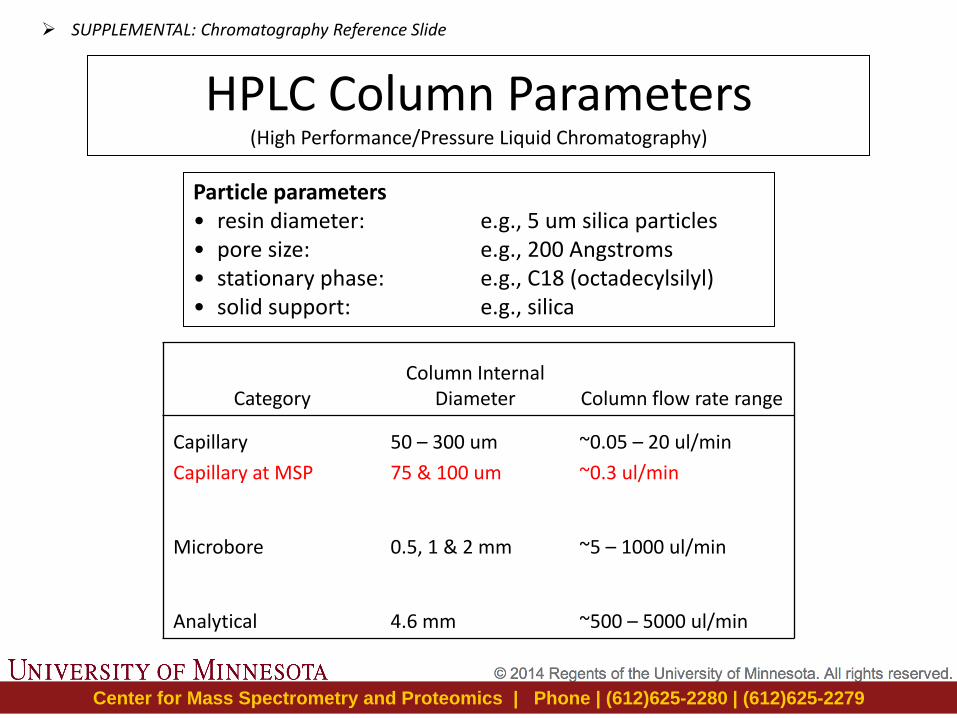
HPLC Column Parameters (High Performance/Pressure Liquid Chromatography)
Category Column Internal
Diameter Column flow rate range
Capillary
Capillary at MSP
50 – 300 um
75 & 100 um
~0.05 – 20 ul/min
~0.3 ul/min
Microbore 0.5, 1 & 2 mm ~5 – 1000 ul/min
Analytical 4.6 mm ~500 – 5000 ul/min
Particle parameters • resin diameter: e.g., 5 um silica particles • pore size: e.g., 200 Angstroms • stationary phase: e.g., C18 (octadecylsilyl) • solid support: e.g., silica
SUPPLEMENTAL: Chromatography Reference Slide
Center for Mass Spectrometry and Proteomics | Phone | (612)625-2280 | (612)625-2279
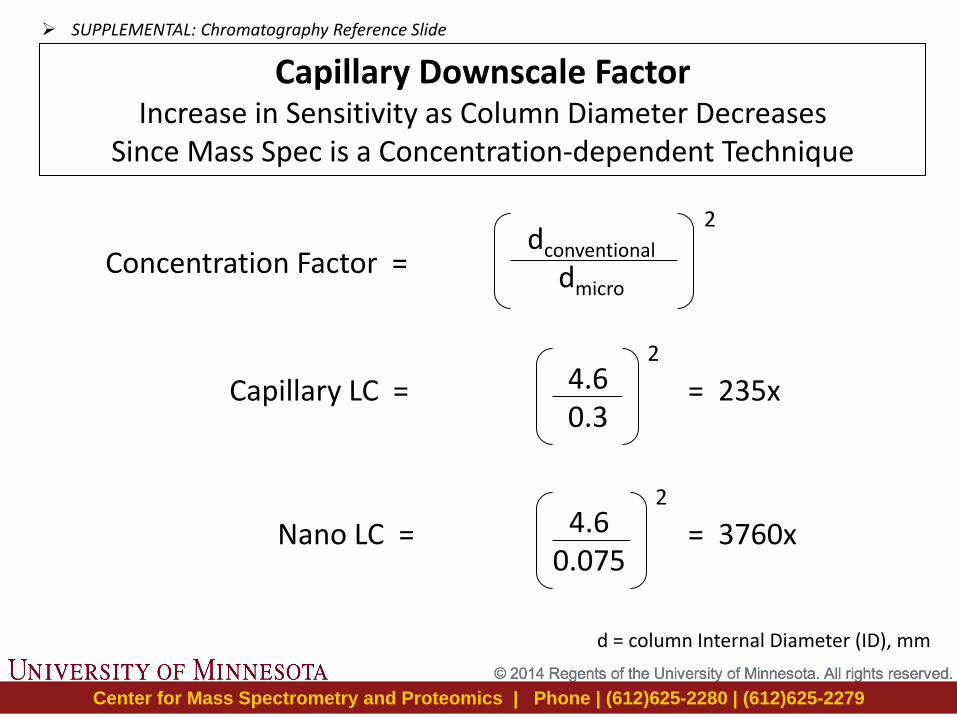
Capillary Downscale Factor Increase in Sensitivity as Column Diameter Decreases
Since Mass Spec is a Concentration-dependent Technique
Concentration Factor =
d = column Internal Diameter (ID), mm
dconventional
dmicro
2
Capillary LC =
Nano LC =
4.6
0.3
2
= 235x
4.6
0.075
2
= 3760x
SUPPLEMENTAL: Chromatography Reference Slide
Center for Mass Spectrometry and Proteomics | Phone | (612)625-2280 | (612)625-2279
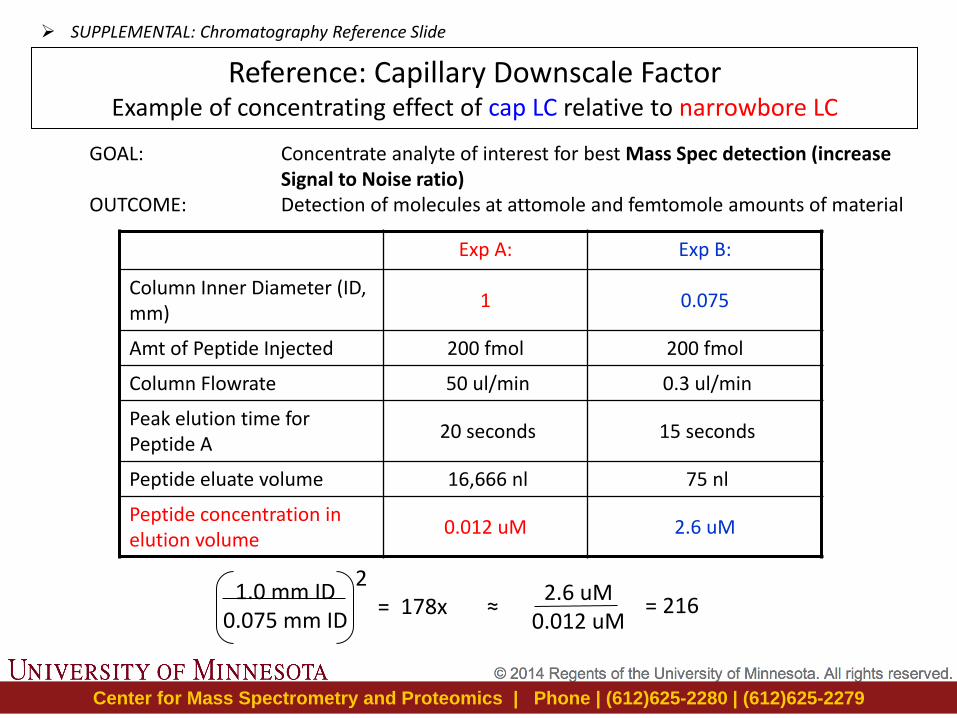
Reference: Capillary Downscale Factor Example of concentrating effect of cap LC relative to narrowbore LC
GOAL: Concentrate analyte of interest for best Mass Spec detection (increase Signal to Noise ratio)
OUTCOME: Detection of molecules at attomole and femtomole amounts of material
2 1.0 mm ID
0.075 mm ID = 178x
2.6 uM 0.012 uM
= 216 ≈
Exp A: Exp B:
Column Inner Diameter (ID, mm)
1 0.075
Amt of Peptide Injected 200 fmol 200 fmol
Column Flowrate 50 ul/min 0.3 ul/min
Peak elution time for Peptide A
20 seconds 15 seconds
Peptide eluate volume 16,666 nl 75 nl
Peptide concentration in elution volume
0.012 uM 2.6 uM
SUPPLEMENTAL: Chromatography Reference Slide
Center for Mass Spectrometry and Proteomics | Phone | (612)625-2280 | (612)625-2279
Minutes
0 10 20 30 40 50 60 70 80 90
mA
U
0
2
4
6
8
10
12
14
16
mA
U
0
2
4
6
8
10
12
14
16
UV2
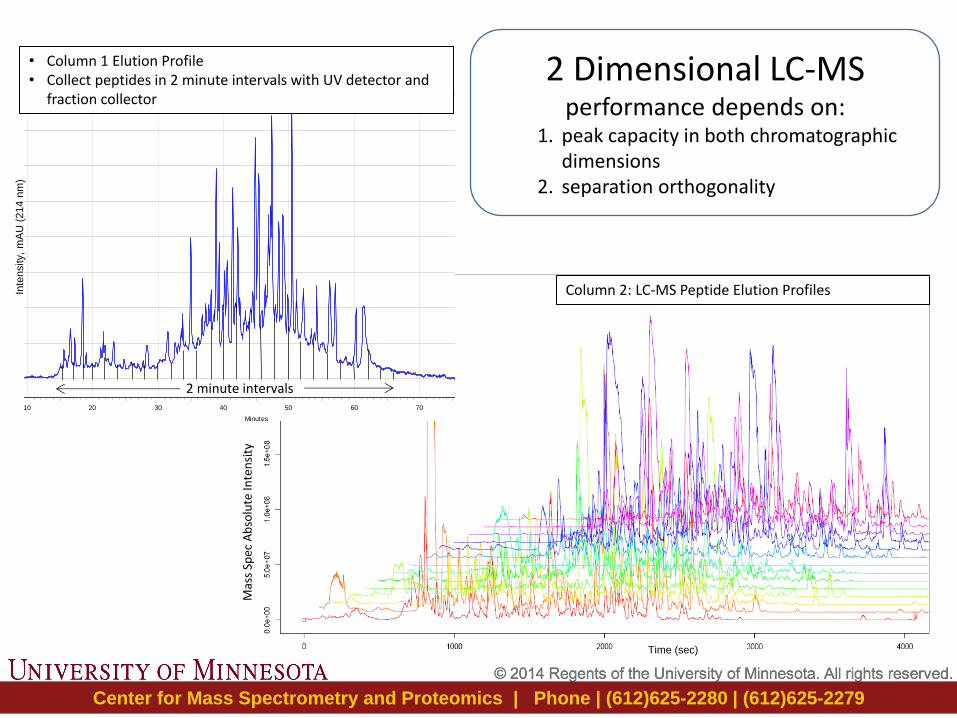
112311VivekMath_CtrlandCase_highPHc18stepGrad 2 Dimensional LC-MS performance depends on:
1. peak capacity in both chromatographic dimensions
2. separation orthogonality
• Column 1 Elution Profile • Collect peptides in 2 minute intervals with UV detector and
fraction collector
Column 2: LC-MS Peptide Elution Profiles
Mas
s Sp
ec A
bso
lute
Inte
nsi
ty
2 minute intervals
Time (sec)
Inte
nsity,
mA
U (
214 n
m)
Center for Mass Spectrometry and Proteomics | Phone | (612)625-2280 | (612)625-2279
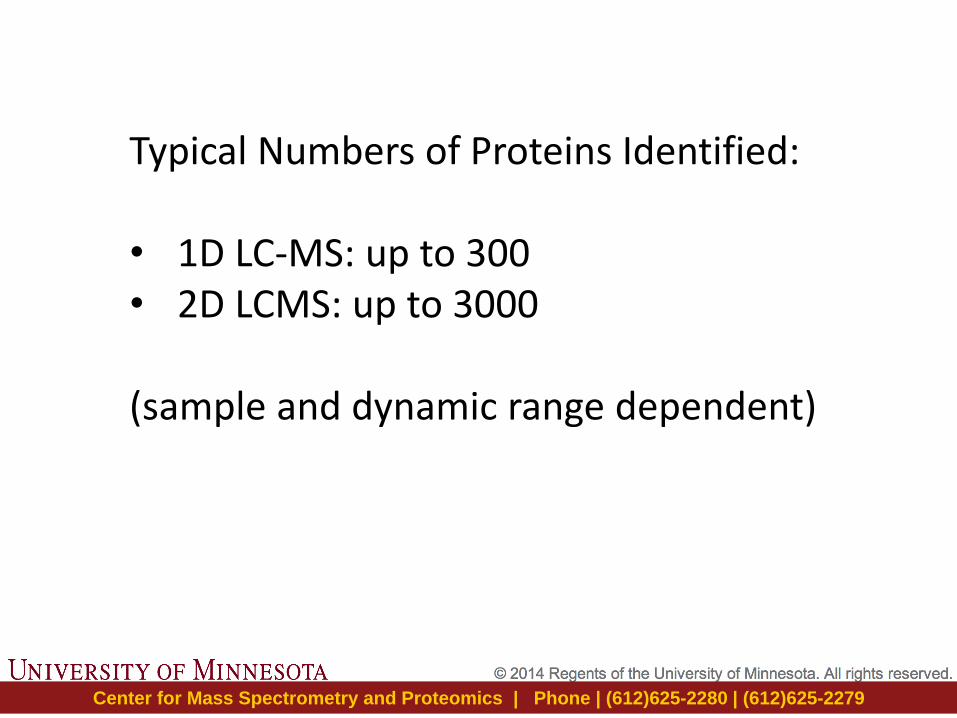
Typical Numbers of Proteins Identified: • 1D LC-MS: up to 300 • 2D LCMS: up to 3000 (sample and dynamic range dependent)
Center for Mass Spectrometry and Proteomics | Phone | (612)625-2280 | (612)625-2279
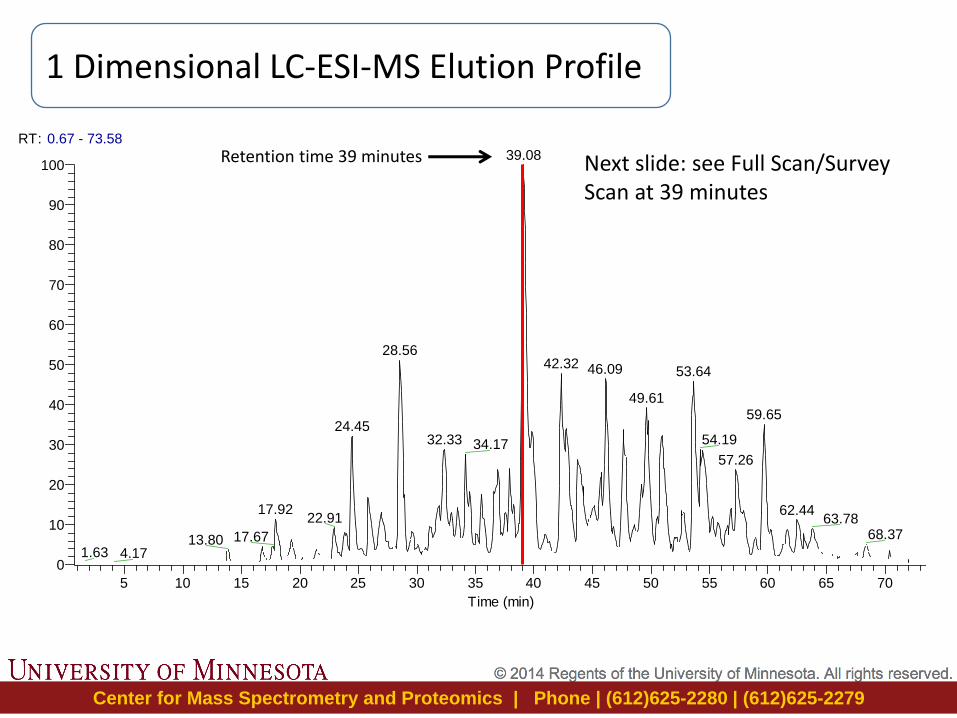
RT: 0.67 - 73.58
5 10 15 20 25 30 35 40 45 50 55 60 65 70
Time (min)
0
10
20
30
40
50
60
70
80
90
100
Re
lative
Ab
un
dan
ce
39.08
28.5642.32 46.09 53.64
49.6159.65
24.4532.33 54.1934.17
57.26
17.92 62.4422.91 63.78
68.3717.6713.801.63 4.17
NL: 8.15E8
TIC F: FTMS + c NSI Full ms [360.00-1800.00] MS georg_hamel_011713_12503_chymo_tubA_025dda
Next slide: see Full Scan/Survey Scan at 39 minutes
Retention time 39 minutes
1 Dimensional LC-ESI-MS Elution Profile
Center for Mass Spectrometry and Proteomics | Phone | (612)625-2280 | (612)625-2279
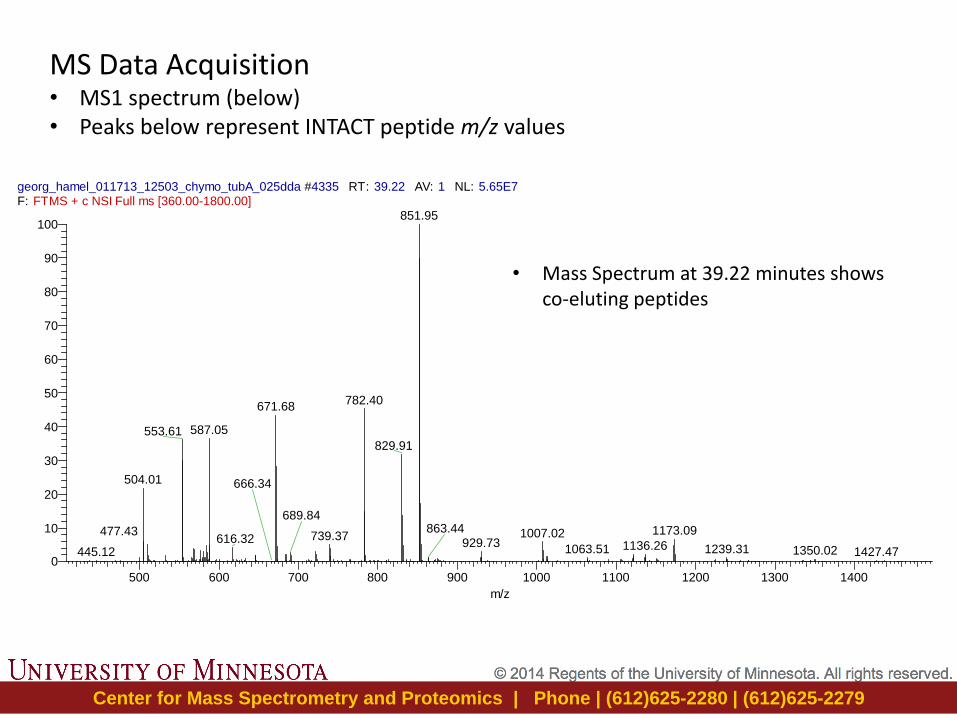
georg_hamel_011713_12503_chymo_tubA_025dda #4335 RT: 39.22 AV: 1 NL: 5.65E7F: FTMS + c NSI Full ms [360.00-1800.00]
500 600 700 800 900 1000 1100 1200 1300 1400
m/z
0
10
20
30
40
50
60
70
80
90
100
Rela
tive A
bundance
851.95
782.40671.68
587.05553.61829.91
504.01
1173.091007.02739.37616.32 929.73
689.84
1136.261063.51
863.44
1239.31 1350.02 1427.47445.12
666.34
477.43
• Mass Spectrum at 39.22 minutes shows co-eluting peptides
MS Data Acquisition • MS1 spectrum (below) • Peaks below represent INTACT peptide m/z values
Center for Mass Spectrometry and Proteomics | Phone | (612)625-2280 | (612)625-2279
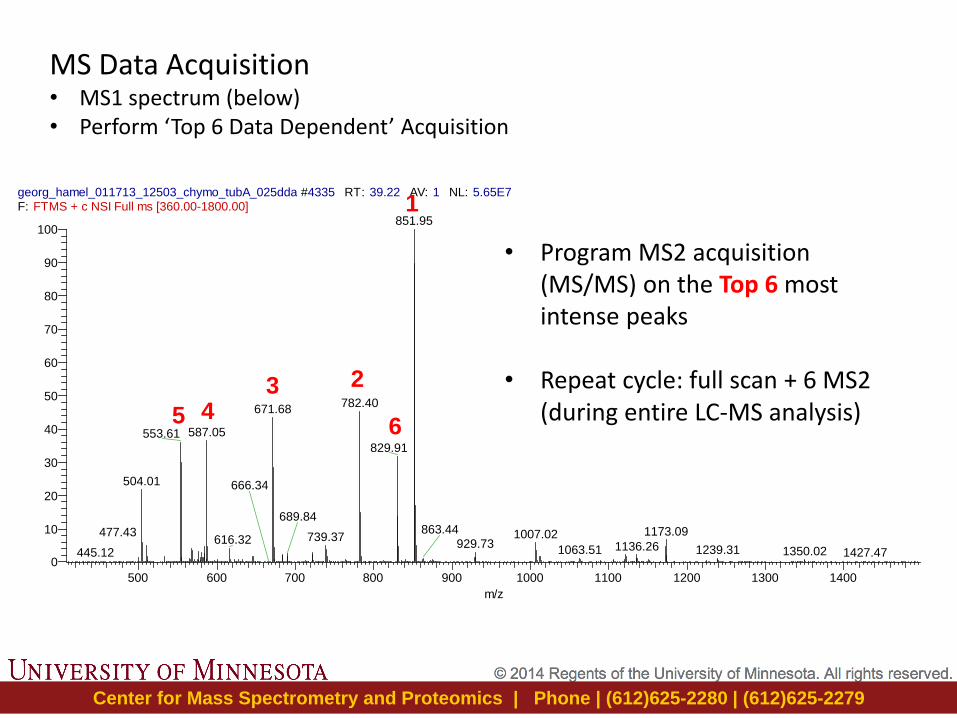
georg_hamel_011713_12503_chymo_tubA_025dda #4335 RT: 39.22 AV: 1 NL: 5.65E7F: FTMS + c NSI Full ms [360.00-1800.00]
500 600 700 800 900 1000 1100 1200 1300 1400
m/z
0
10
20
30
40
50
60
70
80
90
100
Re
lative
Ab
un
dan
ce
851.95
782.40671.68
587.05553.61829.91
504.01
1173.091007.02739.37616.32 929.73
689.84
1136.261063.51
863.44
1239.31 1350.02 1427.47445.12
666.34
477.43
1
2 3 4 5 6
• Program MS2 acquisition (MS/MS) on the Top 6 most intense peaks
• Repeat cycle: full scan + 6 MS2 (during entire LC-MS analysis)
MS Data Acquisition • MS1 spectrum (below) • Perform ‘Top 6 Data Dependent’ Acquisition
Center for Mass Spectrometry and Proteomics | Phone | (612)625-2280 | (612)625-2279
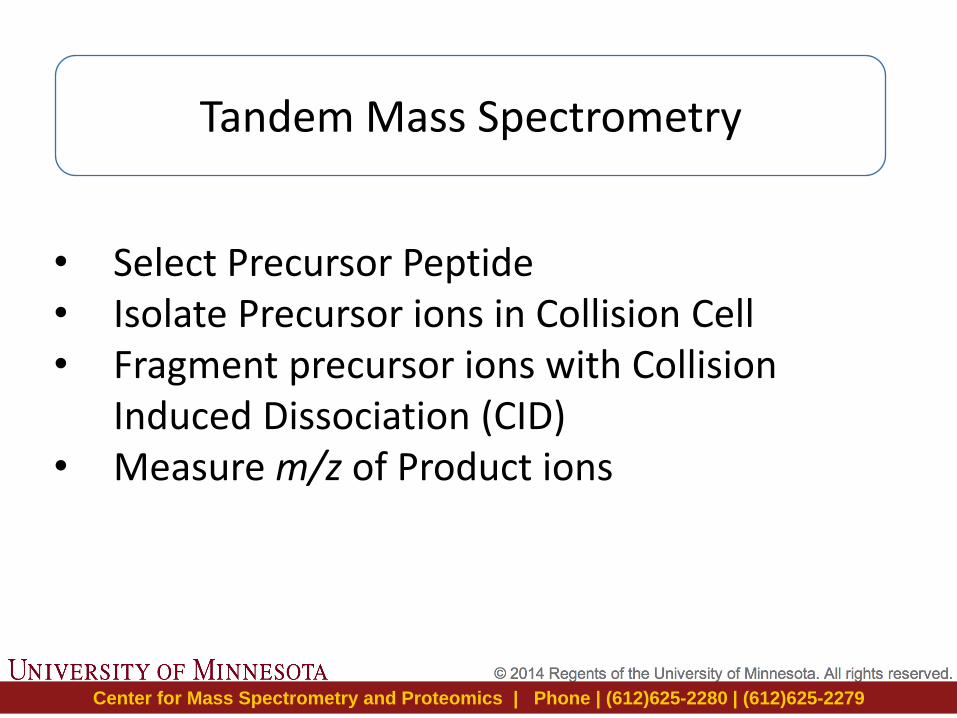
• Select Precursor Peptide • Isolate Precursor ions in Collision Cell • Fragment precursor ions with Collision
Induced Dissociation (CID) • Measure m/z of Product ions
Tandem Mass Spectrometry
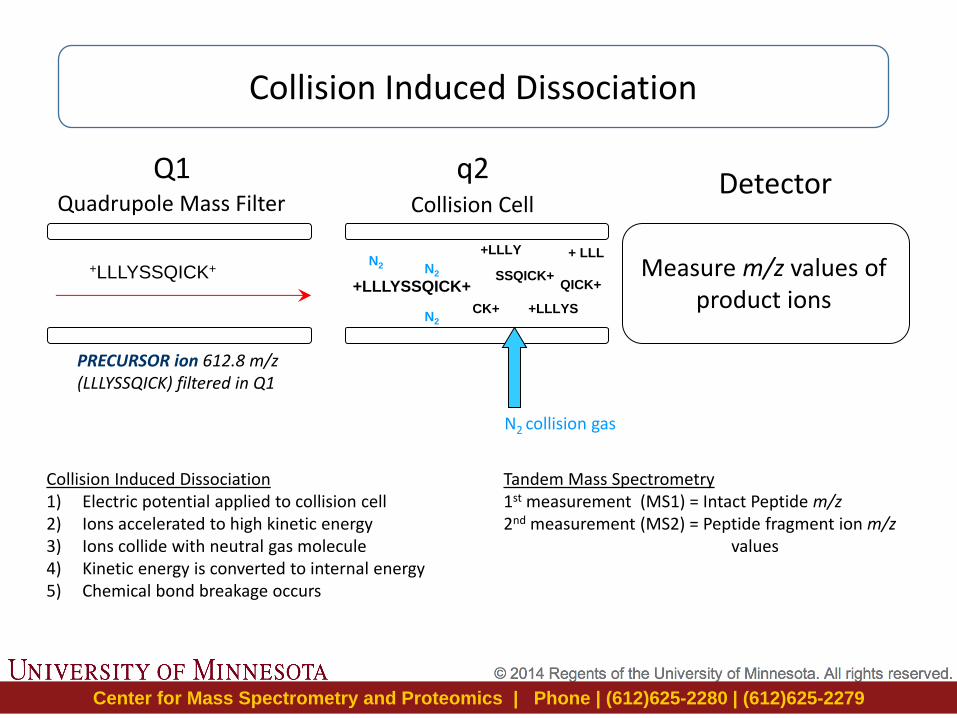
Center for Mass Spectrometry and Proteomics | Phone | (612)625-2280 | (612)625-2279
+LLLYSSQICK+
Collision Cell Quadrupole Mass Filter
+ LLL +LLLY
+LLLYS CK+
QICK+ SSQICK+
Collision Induced Dissociation 1) Electric potential applied to collision cell 2) Ions accelerated to high kinetic energy 3) Ions collide with neutral gas molecule 4) Kinetic energy is converted to internal energy 5) Chemical bond breakage occurs
Measure m/z values of product ions
+LLLYSSQICK+
N2 collision gas
N2
N2 N2
Tandem Mass Spectrometry 1st measurement (MS1) = Intact Peptide m/z 2nd measurement (MS2) = Peptide fragment ion m/z
values
PRECURSOR ion 612.8 m/z (LLLYSSQICK) filtered in Q1
Q1 q2 Detector
Collision Induced Dissociation
Center for Mass Spectrometry and Proteomics | Phone | (612)625-2280 | (612)625-2279
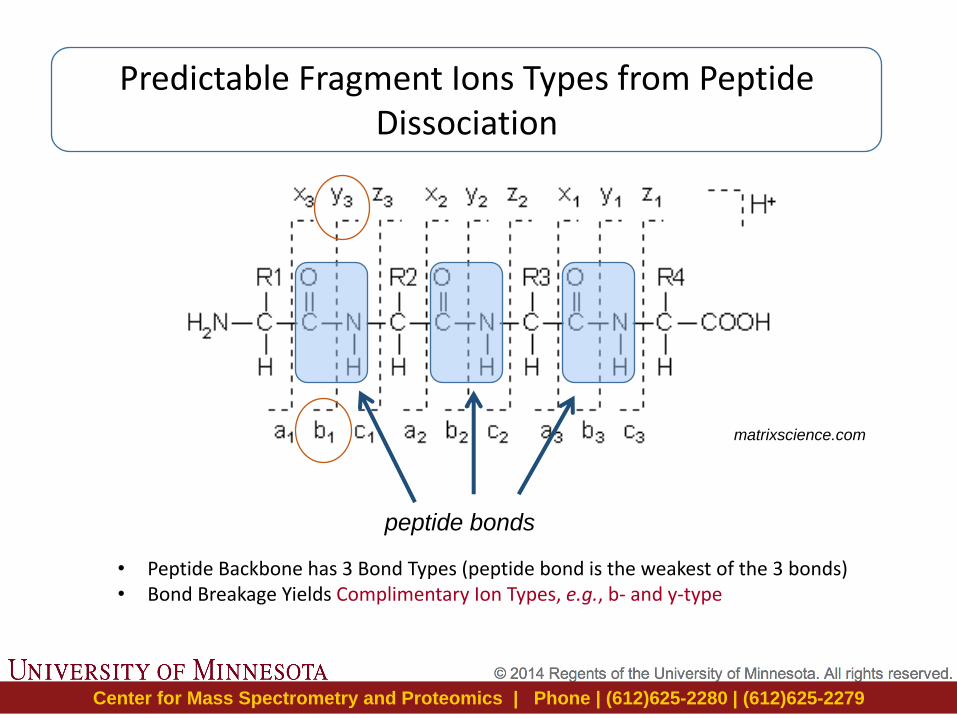
matrixscience.com
peptide bonds
• Peptide Backbone has 3 Bond Types (peptide bond is the weakest of the 3 bonds) • Bond Breakage Yields Complimentary Ion Types, e.g., b- and y-type
Predictable Fragment Ions Types from Peptide Dissociation
Center for Mass Spectrometry and Proteomics | Phone | (612)625-2280 | (612)625-2279
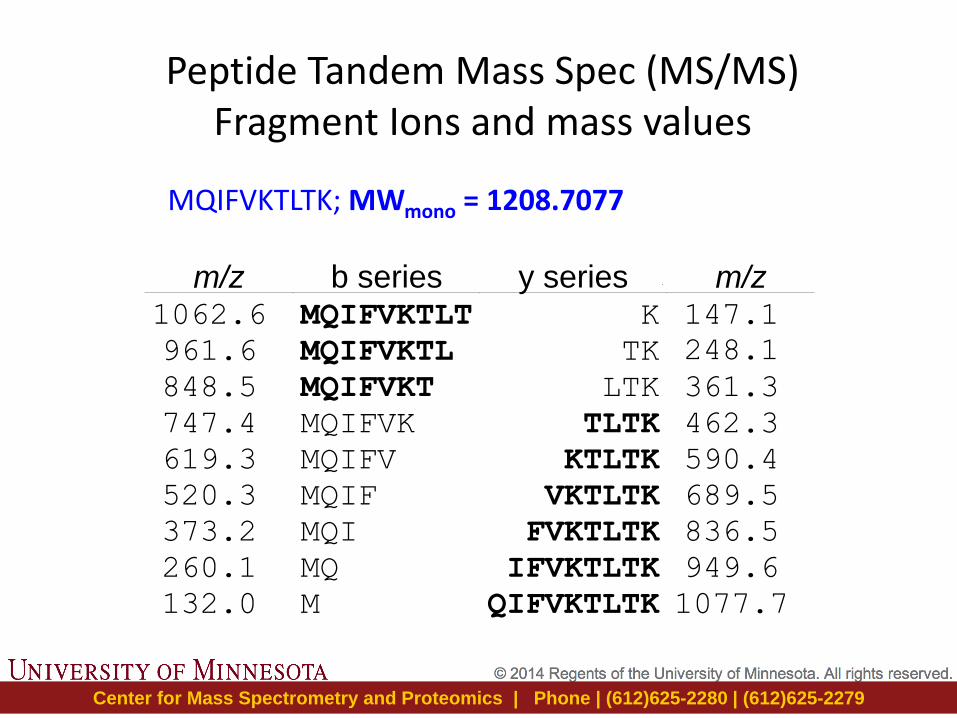
MQIFVKTLTK; MWmono = 1208.7077
m/z b series y series m/z 1062.6 MQIFVKTLT K 147.1 961.6 MQIFVKTL TK 248.1 848.5 MQIFVKT LTK 361.3 747.4 MQIFVK TLTK 462.3 619.3 MQIFV KTLTK 590.4 520.3 MQIF VKTLTK 689.5 373.2 MQI FVKTLTK 836.5 260.1 MQ IFVKTLTK 949.6 132.0 M QIFVKTLTK 1077.7
Peptide Tandem Mass Spec (MS/MS) Fragment Ions and mass values
Center for Mass Spectrometry and Proteomics | Phone | (612)625-2280 | (612)625-2279
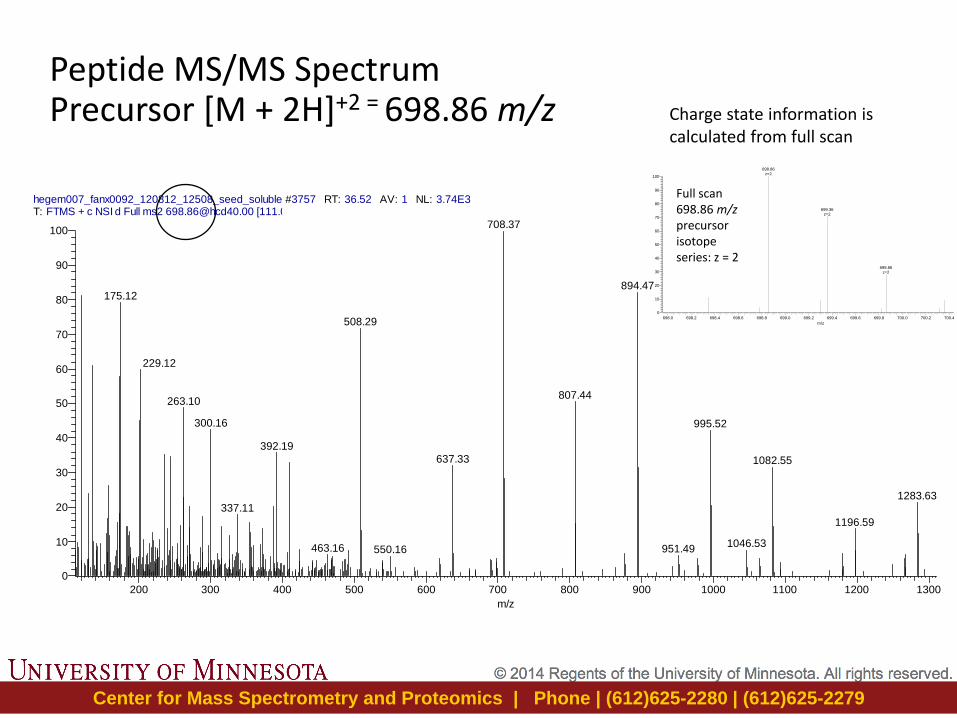
Peptide MS/MS Spectrum Precursor [M + 2H]+2 = 698.86 m/z
hegem007_fanx0092_120812_12508_seed_soluble #3757 RT: 36.52 AV: 1 NL: 3.74E3T: FTMS + c NSI d Full ms2 [email protected] [111.00-1410.00]
200 300 400 500 600 700 800 900 1000 1100 1200 1300
m/z
0
10
20
30
40
50
60
70
80
90
100
Re
lative
Ab
un
da
nce
708.37
894.47175.12
508.29
807.44263.10
300.16 995.52
392.19
637.33 1082.55
1283.63337.11
1196.59
229.12
1046.53463.16 951.49550.16
hegem007_fanx0092_120812_12508_seed_soluble #3755 RT: 36.50 AV: 1 NL: 1.11E5T: FTMS + c NSI Full ms [360.00-1800.00]
698.0 698.2 698.4 698.6 698.8 699.0 699.2 699.4 699.6 699.8 700.0 700.2 700.4 700.6
m/z
0
10
20
30
40
50
60
70
80
90
100
Rela
tive A
bundance
698.86z=2
699.36z=2
699.86z=2
Full scan 698.86 m/z precursor isotope series: z = 2
Charge state information is calculated from full scan
Center for Mass Spectrometry and Proteomics | Phone | (612)625-2280 | (612)625-2279
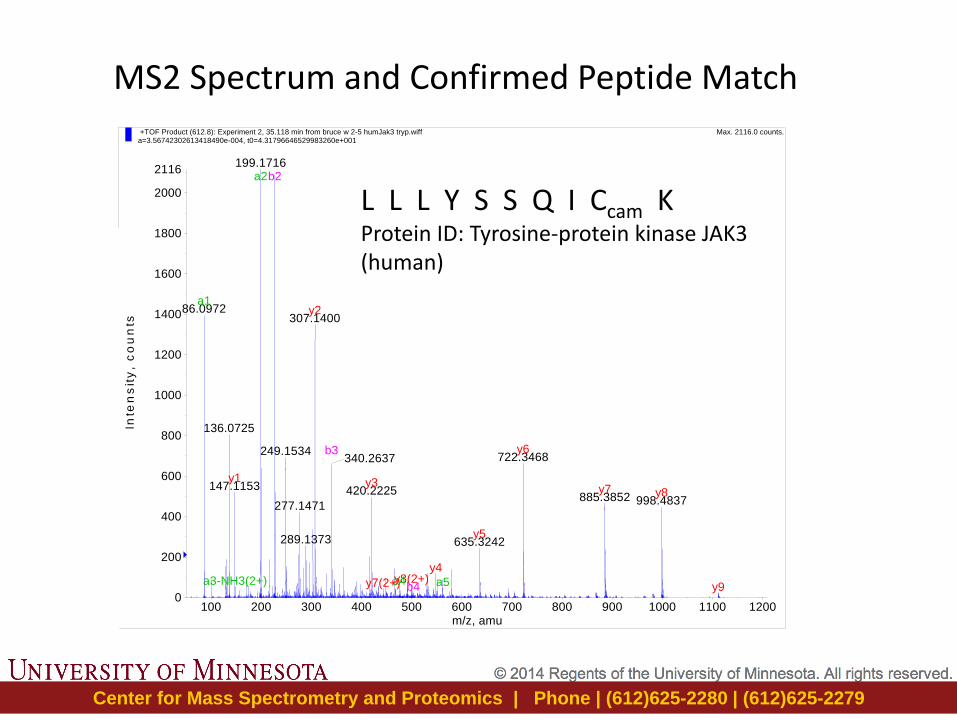
MS2 Spectrum and Confirmed Peptide Match +TOF Product (612.8): Experiment 2, 35.118 min from bruce w 2-5 humJak3 tryp.wiffa=3.56742302613418490e-004, t0=4.31796646529983260e+001
Max. 2116.0 counts.
100 200 300 400 500 600 700 800 900 1000 1100 1200m/z, amu
0
200
400
600
800
1000
1200
1400
1600
1800
2000
2116
Inte
ns
ity
, c
ou
nts
199.1716
86.0972307.1400
136.0725
249.1534722.3468340.2637
147.1153 420.2225885.3852 998.4837277.1471
289.1373 635.3242
a1
a2
y8(2+)
b2
y9
b3
y8
a4b4
y7
a5
y6
y5
y4
y3
y2
a3-NH3(2+) y7(2+)
y1
L L L Y S S Q I Ccam K Protein ID: Tyrosine-protein kinase JAK3 (human)
Center for Mass Spectrometry and Proteomics | Phone | (612)625-2280 | (612)625-2279
Peptide Tandem MS can provide Unambiguous Evidence for Location of
Amino Acid Modifications
Rule: Experimental data must contain fragment ions that
provide site localization evidence
Center for Mass Spectrometry and Proteomics | Phone | (612)625-2280 | (612)625-2279
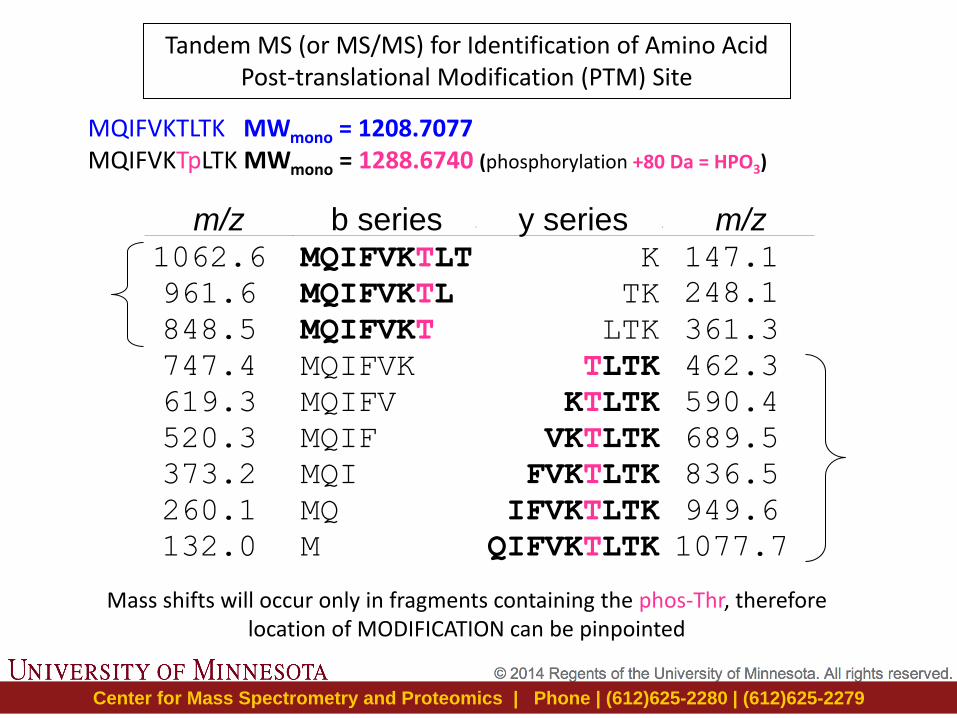
MQIFVKTLTK MWmono = 1208.7077 MQIFVKTpLTK MWmono = 1288.6740 (phosphorylation +80 Da = HPO3)
Mass shifts will occur only in fragments containing the phos-Thr, therefore location of MODIFICATION can be pinpointed
m/z b series y series m/z 1062.6 MQIFVKTLT K 147.1 961.6 MQIFVKTL TK 248.1 848.5 MQIFVKT LTK 361.3 747.4 MQIFVK TLTK 462.3 619.3 MQIFV KTLTK 590.4 520.3 MQIF VKTLTK 689.5 373.2 MQI FVKTLTK 836.5 260.1 MQ IFVKTLTK 949.6 132.0 M QIFVKTLTK 1077.7
Tandem MS (or MS/MS) for Identification of Amino Acid Post-translational Modification (PTM) Site
Center for Mass Spectrometry and Proteomics | Phone | (612)625-2280 | (612)625-2279
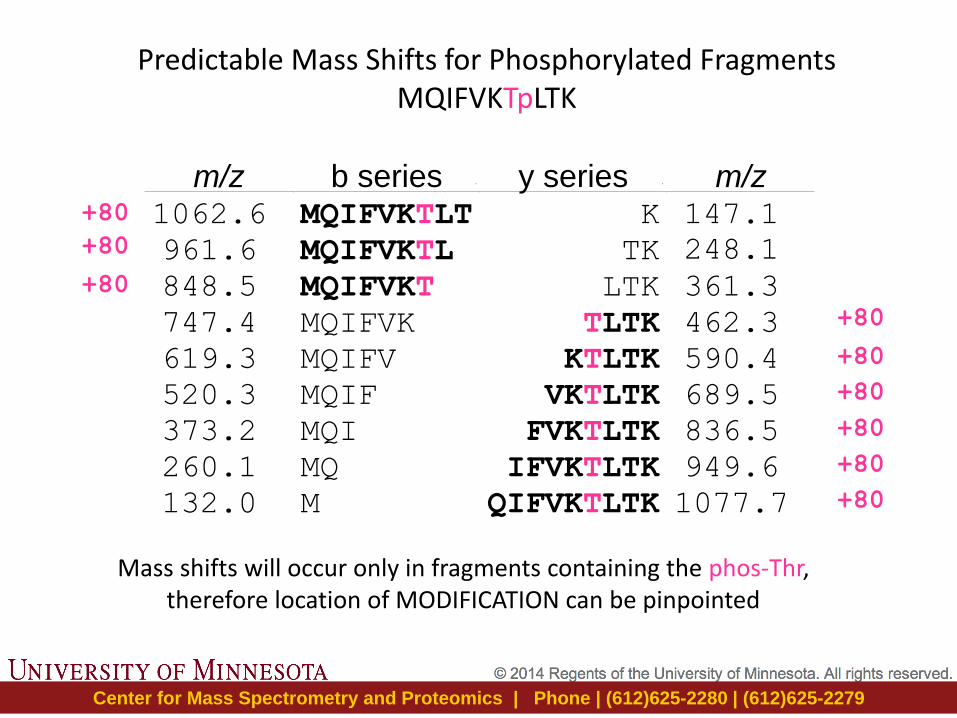
+80
+80
+80
+80
+80
+80
+80
+80
+80
m/z b series y series m/z 1062.6 MQIFVKTLT K 147.1 961.6 MQIFVKTL TK 248.1 848.5 MQIFVKT LTK 361.3 747.4 MQIFVK TLTK 462.3 619.3 MQIFV KTLTK 590.4 520.3 MQIF VKTLTK 689.5 373.2 MQI FVKTLTK 836.5 260.1 MQ IFVKTLTK 949.6 132.0 M QIFVKTLTK 1077.7
Mass shifts will occur only in fragments containing the phos-Thr, therefore location of MODIFICATION can be pinpointed
Predictable Mass Shifts for Phosphorylated Fragments MQIFVKTpLTK
Center for Mass Spectrometry and Proteomics | Phone | (612)625-2280 | (612)625-2279
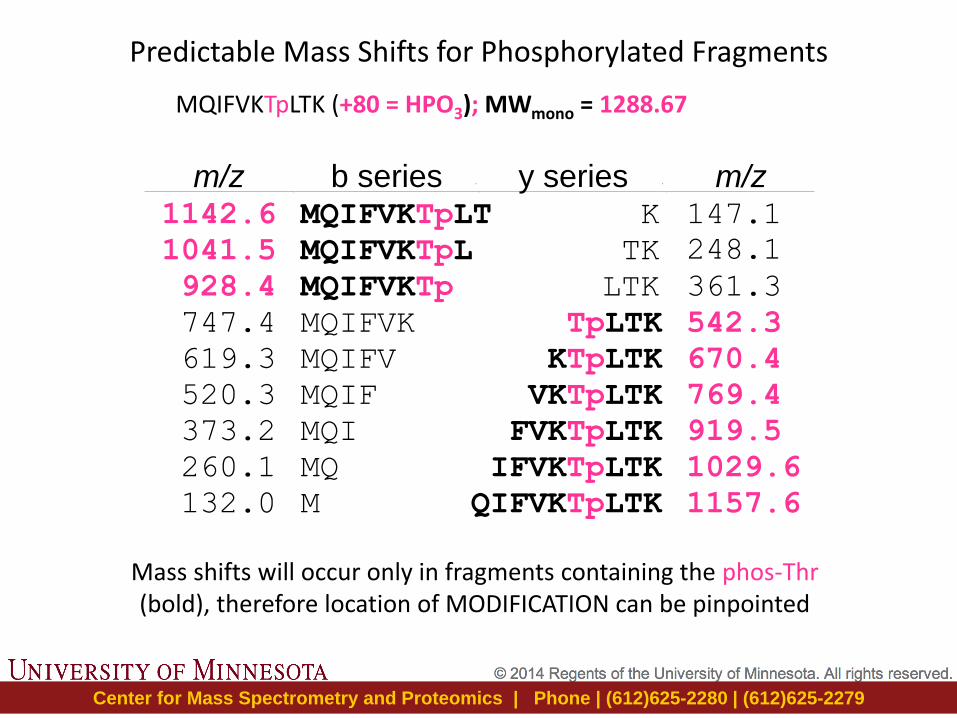
m/z b series y series m/z 1142.6 MQIFVKTpLT K 147.1 1041.5 MQIFVKTpL TK 248.1 928.4 MQIFVKTp LTK 361.3 747.4 MQIFVK TpLTK 542.3 619.3 MQIFV KTpLTK 670.4 520.3 MQIF VKTpLTK 769.4 373.2 MQI FVKTpLTK 919.5 260.1 MQ IFVKTpLTK 1029.6 132.0 M QIFVKTpLTK 1157.6
MQIFVKTpLTK (+80 = HPO3); MWmono = 1288.67
Mass shifts will occur only in fragments containing the phos-Thr (bold), therefore location of MODIFICATION can be pinpointed
Predictable Mass Shifts for Phosphorylated Fragments