Embed Size (px)
Citation preview
Outlook for Economic
Activity and Prices
January 2018
Not to be released until 2:00 p.m.
Japan Standard Time on Wednesday, January 24, 2018.
(English translation prepared by the Bank's staff based on the Japanese original)

Please contact the Bank of Japan at the address below in advance to request
permission when reproducing or copying the content of this document for
commercial purposes.
Secretariat of the Policy Board, Bank of Japan
P.O. Box 30, Nihonbashi, Tokyo 103-8660, Japan
Please credit the source when quoting, reproducing, or copying the content of this
document.
1
Outlook for Economic Activity and Prices (January 2018)
The Bank's View1
Summary
Japan's economy is likely to continue expanding on the back of highly accommodative
financial conditions and underpinnings through the government's past stimulus measures,
with overseas economies continuing to grow at a moderate pace, and maintain growth at a
pace above its potential mainly through fiscal 2018. In fiscal 2019, the economy is
expected to continue expanding, although the growth pace is projected to decelerate due
to a cyclical slowdown in business fixed investment and the effects of the scheduled
consumption tax hike.2
The consumer price index (CPI, all items less fresh food) has continued to show relatively
weak developments, excluding the effects of a rise in energy prices, mainly against the
background that firms' wage- and price-setting stance has remained cautious.
Nonetheless, medium- to long-term inflation expectations are projected to rise as firms'
stance gradually shifts toward raising wages and prices with an improvement in the output
gap continuing. As a consequence, the year-on-year rate of change in the CPI is likely to
continue on an uptrend and increase toward 2 percent.
Comparing the current projections with the previous ones, both the projected growth rates
and the projected rates of increase in the CPI are more or less unchanged.
With regard to the risk balance, upside and downside risks to economic activity are
generally balanced, and risks to prices are skewed to the downside. On the price front, the
momentum toward achieving the price stability target of 2 percent is maintained as the
output gap is expected to continue improving and medium- to long-term inflation
expectations are projected to rise gradually; however, the momentum is not yet sufficiently
firm, and thus developments in prices continue to warrant careful attention.
As for the conduct of monetary policy, the Bank will continue with "Quantitative and
Qualitative Monetary Easing (QQE) with Yield Curve Control," aiming to achieve the price
stability target of 2 percent, as long as it is necessary for maintaining that target in a stable
manner. It will continue expanding the monetary base until the year-on-year rate of
increase in the observed CPI (all items less fresh food) exceeds 2 percent and stays
above the target in a stable manner. The Bank will make policy adjustments as
appropriate, taking account of developments in economic activity and prices as well as
financial conditions, with a view to maintaining the momentum toward achieving the price
stability target.
1 The text of "The Bank's View" was decided by the Policy Board at the Monetary Policy Meeting held on
January 22 and 23, 2018.
2 The January 2018 Outlook for Economic Activity and Prices (Outlook Report) assumes that the
consumption tax will be raised to 10 percent in October 2019 and that a reduced tax rate will be applied to
food and beverages -- excluding alcohol and dining-out -- and newspapers.
2
I. The Current Situation of Economic Activity and Prices in Japan
Japan's economy is expanding moderately, with a virtuous cycle from income to spending
operating. Overseas economies have continued to grow at a moderate pace on the whole.
In this situation, exports have been on an increasing trend. On the domestic demand side,
business fixed investment has continued on an increasing trend with corporate profits and
business sentiment improving. Private consumption has been increasing moderately,
albeit with fluctuations, against the background of steady improvement in the employment
and income situation. Housing investment has been more or less flat. Meanwhile, public
investment has been more or less flat, remaining at a relatively high level. Reflecting
these increases in demand both at home and abroad, industrial production has been on
an increasing trend, and labor market conditions have continued to tighten steadily.
Financial conditions are highly accommodative. On the price front, the year-on-year rate
of change in the CPI (all items less fresh food, and the same hereafter) is around 1
percent. Inflation expectations have been more or less unchanged.
II. Baseline Scenario of the Outlook for Economic Activity and Prices in Japan
A. Baseline Scenario of the Outlook for Economic Activity
With regard to the outlook, Japan's economy is likely to continue its moderate expansion.
Through fiscal 2018, domestic demand is likely to follow an uptrend, with a virtuous cycle
from income to spending being maintained in both the corporate and household sectors,
on the back of highly accommodative financial conditions and underpinnings through the
government's past stimulus measures. Business fixed investment is likely to continue
increasing, supported by accommodative financial conditions, heightened growth
expectations, and increases in Olympic Games-related investment, as well as in
labor-saving investment to address the labor shortage. Private consumption is also
expected to follow a moderate increasing trend as the employment and income situation
continues to improve. Public investment is expected to remain at a relatively high level,
mainly reflecting Olympic Games-related demand, although the positive effects resulting
from the past stimulus measures are likely to diminish moderately. Meanwhile, overseas
economies are expected to continue growing at a moderate pace as advanced economies
keep growing steadily and a recovery in emerging economies takes hold on the back of
the steady growth in advanced economies and the effects of policy measures taken by
emerging economies. Exports are expected to continue their moderate increasing trend
on the back of such growth in overseas economies.
In fiscal 2019, Japan's economy is expected to continue expanding, supported by external
demand, although the growth pace is projected to decelerate due to a slowdown in
domestic demand. Specifically, business fixed investment is likely to decelerate, mainly
3
reflecting cyclical adjustments in capital stock after the prolonged economic expansion, as
well as Olympic Games-related demand peaking out; household spending is likely to turn
to a decline in the second half of the fiscal year due to the effects of the scheduled
consumption tax hike.3 Nevertheless, the increase in exports on the back of the growth in
overseas economies is expected to underpin the economy.
Reflecting this outlook, Japan's economy is likely to continue growing at a pace above its
potential, mainly through fiscal 2018.4 Comparing the current projections with the
previous ones, the projected growth rates are more or less unchanged.
Looking at the financial conditions assumed in the above outlook, short- and long-term
real interest rates are expected to be in negative territory throughout the projection period
as the Bank pursues "QQE with Yield Curve Control."5 Financial institutions' proactive
lending attitudes as well as favorable conditions for corporate bonds and CP issuance are
both likely to be maintained and support firms' and households' activities from the financial
side. Thus, financial conditions are likely to remain highly accommodative.
The potential growth rate is expected to follow a moderate uptrend throughout the
projection period against the backdrop of the following: progress in implementation of the
government's growth strategy, including regulatory and institutional reforms; an increase
in labor participation by women and seniors under such strategy; and firms' continued
efforts toward improving productivity. Along with this, the natural rate of interest is
projected to rise, thereby enhancing monetary easing effects.
3 The consumption tax hike scheduled to take place in October 2019 will affect the GDP growth rates
through the following two channels: (1) the front-loaded increase and subsequent decline in demand prior
to and after the consumption tax hike and (2) the effects of a decline in real income. The negative impact
on the projected growth rate for fiscal 2019 is expected to be smaller than that on the rate for fiscal 2014,
when the last consumption tax hike took place. However, it should be noted that the impact of the
consumption tax hike is highly uncertain and varies depending, for example, on the income situation and
price developments.
4 Under a specific methodology, Japan's potential growth rate is estimated to be in the range of 0.5-1.0
percent. However, the estimate of the potential growth rate varies depending on the methodologies
employed and could be revised as the sample period becomes longer over time. Thus, it should be
regarded as being subject to a considerable margin of error.
5 Individual Policy Board members make their forecasts taking into account the effects of past policy
decisions and with reference to views incorporated in financial markets regarding future policy.
Specifically, each Policy Board member makes an assumption about the future path of short- and
long-term interest rates based on their market rates, bearing in mind the difference in the outlook for
prices between that presented in the Outlook Report and that of market participants.
4
B. Baseline Scenario of the Outlook for Prices
Since the previous Outlook Report, although the year-on-year rate of increase in the CPI
has been accelerating, it has continued to show relatively weak developments, remaining
slightly positive excluding the effects of energy prices.
This is attributable to the fact that the mindset and behavior based on the assumption that
wages and prices will not increase easily have been deeply entrenched among firms and
households, as well as to temporary factors such as a reduction in charges for mobile
phone services. Firms have been making efforts to absorb a rise in labor costs by
increasing labor-saving investment and streamlining their business process, while limiting
wage increases -- which correspond to the labor shortage -- mainly to part-time
employees. As suggested by these developments, firms' wage- and price-setting stance
has remained cautious despite the steady tightening of labor market conditions and the
high levels of corporate profits. However, the upward pressure on prices stemming from
the rise in firms' costs has been increasing steadily, partly due to a continued clear
uptrend in hourly scheduled cash earnings of part-time employees and a rise in input
prices resulting from the past yen depreciation.
With regard to the outlook, the year-on-year rate of change in the CPI is likely to continue
on an uptrend and increase toward 2 percent, mainly on the back of the improvement in
the output gap and the rise in medium- to long-term inflation expectations.
Comparing the current projections with the previous ones, the projected rates of increase
in the CPI are more or less unchanged. The timing of the year-on-year rate of change in
the CPI reaching around 2 percent will likely be around fiscal 2019.6
The mechanism through which the year-on-year rate of change in the CPI increases
toward 2 percent can be explained by the following three factors that determine inflation
rates. First, the output gap -- which shows the utilization of labor and capital -- has
widened steadily within positive territory on the back of the steady tightening of labor
market conditions and a rise in capital utilization rates. Going forward, as the economy
continues its moderate expansion, the output gap is expected to widen further within
positive territory through fiscal 2018 and remain substantially positive in fiscal 2019.
Second, medium- to long-term inflation expectations have been more or less unchanged
recently, after having remained in a weakening phase since summer 2015. As for the
outlook, such expectations are likely to follow an increasing trend and gradually converge
6 By assuming that the rise in the consumption tax will be fully passed on to taxable items excluding those
to which a reduced tax rate will be applied, the effects of the October 2019 consumption tax hike on the
year-on-year rate of change in the CPI (all items less fresh food) for October 2019 onward is estimated to
be 1.0 percentage point; the effect for fiscal 2019 is thus estimated to be half that, at 0.5 percentage point.
5
to around 2 percent on the back of the following: (1) in terms of the adaptive component,
with the improvement in the output gap, firms' stance is likely to gradually shift toward
raising wages and prices and the observed inflation rate is expected to rise steadily, and
(2) in terms of the forward-looking component, the Bank will pursue monetary easing
through its strong commitment to achieving the price stability target.7
Third, regarding import prices, a pick-up in crude oil prices since spring 2016 has pushed
up energy prices in the CPI, but this effect is likely to wane moderately. On the other hand,
as for the impact of foreign exchange rates on consumer prices through import prices, the
yen's depreciation since autumn 2016 is likely to increase upward pressure on prices for
the time being.
III. Upside and Downside Risks to Economic Activity and Prices
A. Upside and Downside Risks to Economic Activity
The following three factors are upside and downside risks to the Bank's baseline scenario
regarding the economy.
The first is developments in overseas economies. Specifically, the following are
considered as risks: the U.S. economic policies and their impact on global financial
markets; developments in emerging and commodity-exporting economies; negotiations
on the United Kingdom's exit from the European Union (EU) and their effects; and
geopolitical risks.
Second, firms' and households' medium- to long-term growth expectations may be either
raised or lowered depending on the following: efforts to address medium- to long-term
issues such as the aging population; developments in regulatory and institutional reforms,
particularly in the labor market; innovation in the corporate sector; and the employment
and income situation.
Third, in the event that confidence in fiscal sustainability in the medium to long term
declines, the economy may deviate downward from the baseline scenario through
increasing concerns regarding the future and the rises in long-term interest rates
associated with them. On the other hand, there is also a possibility that the economy will
deviate upward from the baseline scenario if confidence in the path toward fiscal
consolidation strengthens and concerns regarding the future are alleviated.
7 Medium- to long-term inflation expectations can be regarded as consisting of two components: a
forward-looking component, in which inflation expectations converge to the price stability target set by the
central bank, and a backward-looking, or adaptive, component that reflects the observed inflation rate.
For details, see the Bank's Comprehensive Assessment: Developments in Economic Activity and Prices
as well as Policy Effects since the Introduction of Quantitative and Qualitative Monetary Easing (QQE)
released in September 2016.
6
B. Upside and Downside Risks to Prices
Other than risks to economic activity, the specific factors that could exert upside and
downside risks to prices are as follows. The first factor is developments in firms' and
households' medium- to long-term inflation expectations. Although inflation expectations
are likely to follow an increasing trend, there is a risk that a rise in inflation expectations
will lag behind if it takes time for firms' stance to shift toward raising wages and prices and
inflation consequently remains relatively sluggish.
The second factor is the fact that there are items for which prices are not particularly
responsive to the output gap. There is concern about the continued dull responses of
administered prices, some services prices, and housing rent, which may continue to
constrain the acceleration of CPI inflation. In addition, with regard to goods and services
that are difficult to differentiate, their prices may also constrain the acceleration of CPI
inflation if competition among firms intensifies further, due mainly to changes in the
distribution system and deregulation.
Third, developments in foreign exchange rates and international commodity prices going
forward, as well as the extent to which such developments will spread to import prices and
domestic prices, may lead prices to deviate either upward or downward from the baseline
scenario.
IV. Conduct of Monetary Policy
In the context of the price stability target, the Bank assesses the aforementioned
economic and price situation from two perspectives and then outlines its thinking on the
future conduct of monetary policy.8
The first perspective concerns an examination of the baseline scenario for the outlook.
The year-on-year rate of change in the CPI is likely to increase toward 2 percent. Although
it is necessary to carefully examine the fact that firms' wage- and price-setting stance has
remained cautious, the momentum toward achieving the price stability target of 2 percent
appears to be maintained. This is because (1) firms' stance is likely to gradually shift
toward raising wages and prices with the steady improvement in the output gap, and (2)
medium- to long-term inflation expectations have been more or less unchanged recently
and such expectations are projected to rise steadily as further price rises come to be
observed widely.
The second perspective involves an examination of the risks considered most relevant to
8 As for the examination from two perspectives in the context of the price stability target, see the Bank's
statement released on January 22, 2013, entitled "The 'Price Stability Target' under the Framework for the
Conduct of Monetary Policy."
7
the conduct of monetary policy. With regard to the outlook for economic activity, upside
and downside risks are generally balanced. Regarding the outlook for prices, risks are
skewed to the downside, especially concerning developments in medium- to long-term
inflation expectations. Examining financial imbalances from a longer-term perspective,
there is no sign so far of excessively bullish expectations in asset markets or in the
activities of financial institutions. Furthermore, prolonged downward pressure on financial
institutions' profits under the continued low interest rate environment could create risks of
a gradual pullback in financial intermediation and of destabilizing the financial system.
However, at this point, these risks are judged as not significant, mainly because financial
institutions have sufficient capital bases.
As for the conduct of monetary policy, the Bank will continue with "QQE with Yield Curve
Control," aiming to achieve the price stability target of 2 percent, as long as it is necessary
for maintaining that target in a stable manner. It will continue expanding the monetary
base until the year-on-year rate of increase in the observed CPI (all items less fresh food)
exceeds 2 percent and stays above the target in a stable manner. The Bank will make
policy adjustments as appropriate, taking account of developments in economic activity
and prices as well as financial conditions, with a view to maintaining the momentum
toward achieving the price stability target.
8
(Appendix)
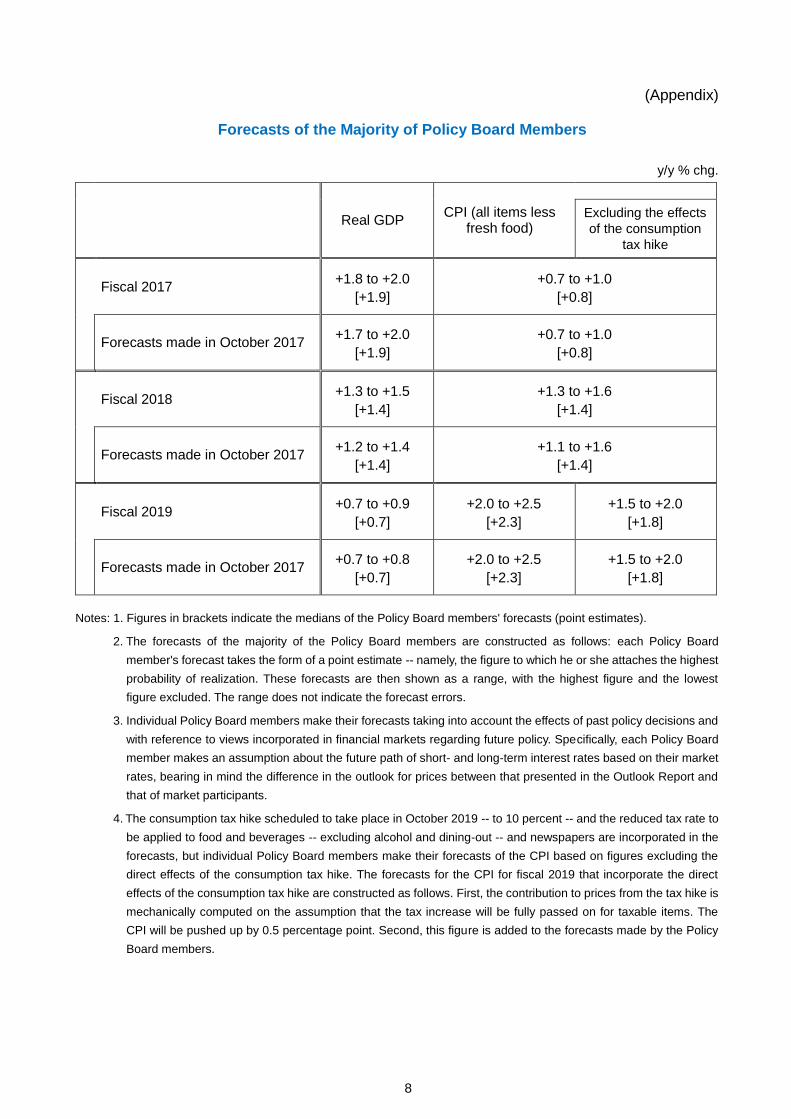
Forecasts of the Majority of Policy Board Members
y/y % chg.
Real GDP CPI (all items less
fresh food)
Excluding the effects
of the consumption
tax hike
Fiscal 2017 +1.8 to +2.0
[+1.9]
+0.7 to +1.0
[+0.8]
Forecasts made in October 2017 +1.7 to +2.0
[+1.9]
+0.7 to +1.0
[+0.8]
Fiscal 2018 +1.3 to +1.5
[+1.4]
+1.3 to +1.6
[+1.4]
Forecasts made in October 2017 +1.2 to +1.4
[+1.4]
+1.1 to +1.6
[+1.4]
Fiscal 2019 +0.7 to +0.9
[+0.7]
+2.0 to +2.5
[+2.3]
+1.5 to +2.0
[+1.8]
Forecasts made in October 2017 +0.7 to +0.8
[+0.7]
+2.0 to +2.5
[+2.3]
+1.5 to +2.0
[+1.8]
Notes: 1. Figures in brackets indicate the medians of the Policy Board members' forecasts (point estimates).
2. The forecasts of the majority of the Policy Board members are constructed as follows: each Policy Board
member's forecast takes the form of a point estimate -- namely, the figure to which he or she attaches the highest
probability of realization. These forecasts are then shown as a range, with the highest figure and the lowest
figure excluded. The range does not indicate the forecast errors.
3. Individual Policy Board members make their forecasts taking into account the effects of past policy decisions and
with reference to views incorporated in financial markets regarding future policy. Specifically, each Policy Board
member makes an assumption about the future path of short- and long-term interest rates based on their market
rates, bearing in mind the difference in the outlook for prices between that presented in the Outlook Report and
that of market participants.
4. The consumption tax hike scheduled to take place in October 2019 -- to 10 percent -- and the reduced tax rate to
be applied to food and beverages -- excluding alcohol and dining-out -- and newspapers are incorporated in the
forecasts, but individual Policy Board members make their forecasts of the CPI based on figures excluding the
direct effects of the consumption tax hike. The forecasts for the CPI for fiscal 2019 that incorporate the direct
effects of the consumption tax hike are constructed as follows. First, the contribution to prices from the tax hike is
mechanically computed on the assumption that the tax increase will be fully passed on for taxable items. The
CPI will be pushed up by 0.5 percentage point. Second, this figure is added to the forecasts made by the Policy
Board members.
9
-1.5
-1.0
-0.5
0.0
0.5
1.0
1.5
2.0
2.5
3.0
-1.5
-1.0
-0.5
0.0
0.5
1.0
1.5
2.0
2.5
3.0
2011 2012 2013 2014 2015 2016 2017 2018 2019 2020
y/y % chg. y/y % chg.
FY
-1.0
-0.5
0.0
0.5
1.0
1.5
2.0
2.5
3.0
3.5
-1.0
-0.5
0.0
0.5
1.0
1.5
2.0
2.5
3.0
3.5
2011 2012 2013 2014 2015 2016 2017 2018 2019 2020
y/y % chg. y/y % chg.
FY
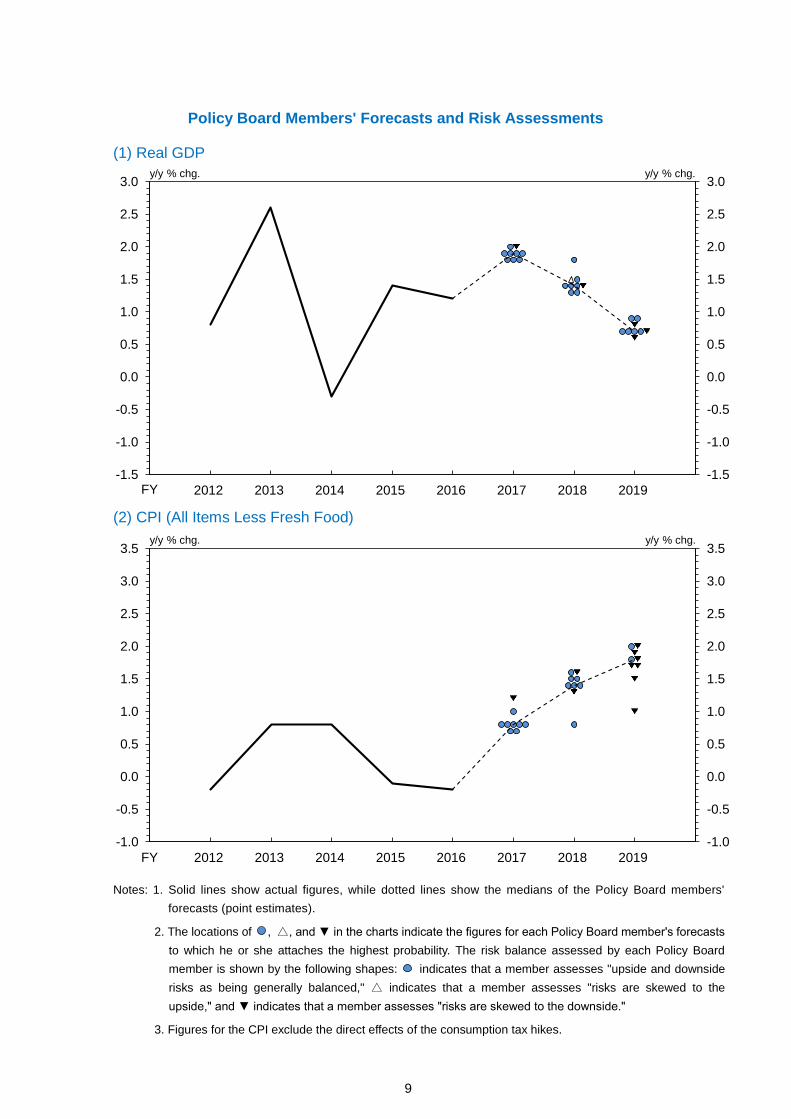
Policy Board Members' Forecasts and Risk Assessments
(1) Real GDP
(2) CPI (All Items Less Fresh Food)
Notes: 1. Solid lines show actual figures, while dotted lines show the medians of the Policy Board members'
forecasts (point estimates).
2. The locations of , △, and ▼ in the charts indicate the figures for each Policy Board member's forecasts
to which he or she attaches the highest probability. The risk balance assessed by each Policy Board
member is shown by the following shapes: indicates that a member assesses "upside and downside
risks as being generally balanced," △ indicates that a member assesses "risks are skewed to the
upside," and ▼ indicates that a member assesses "risks are skewed to the downside."
3. Figures for the CPI exclude the direct effects of the consumption tax hikes.
10
The Background9
I. The Current Situation of Economic
Activity and Its Outlook
A. Economic Developments
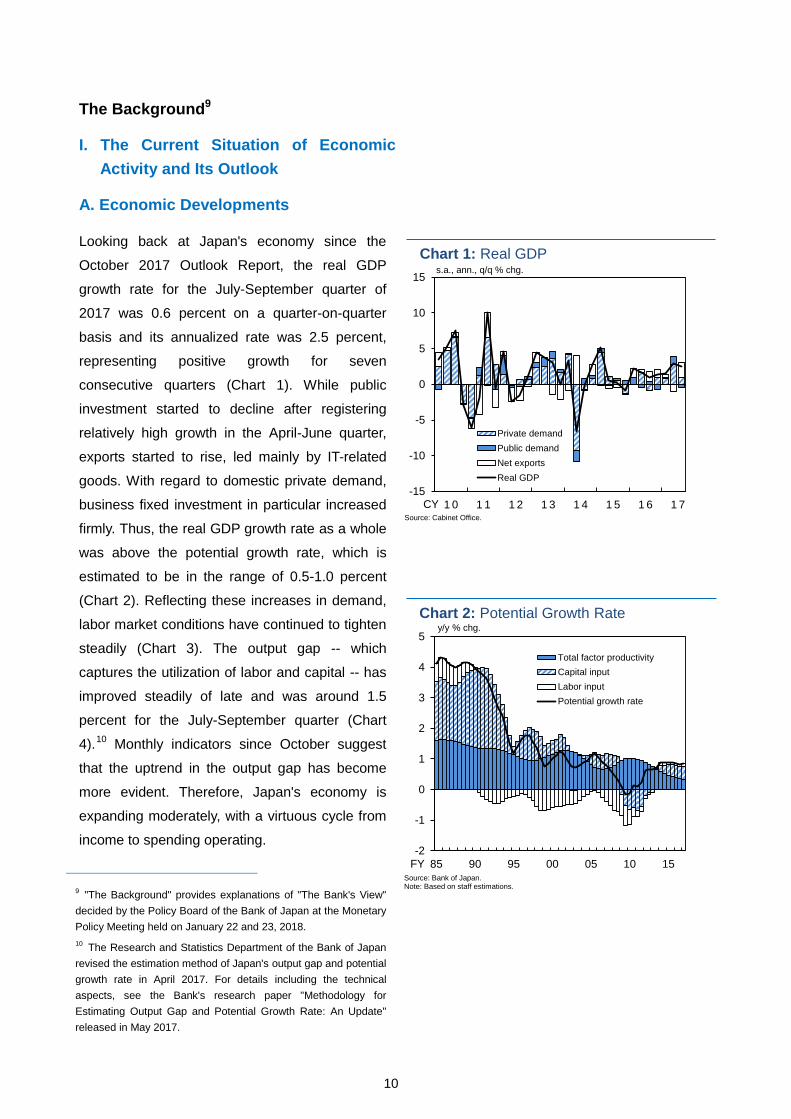
Looking back at Japan's economy since the
October 2017 Outlook Report, the real GDP
growth rate for the July-September quarter of
2017 was 0.6 percent on a quarter-on-quarter
basis and its annualized rate was 2.5 percent,
representing positive growth for seven
consecutive quarters (Chart 1). While public
investment started to decline after registering
relatively high growth in the April-June quarter,
exports started to rise, led mainly by IT-related
goods. With regard to domestic private demand,
business fixed investment in particular increased
firmly. Thus, the real GDP growth rate as a whole
was above the potential growth rate, which is
estimated to be in the range of 0.5-1.0 percent
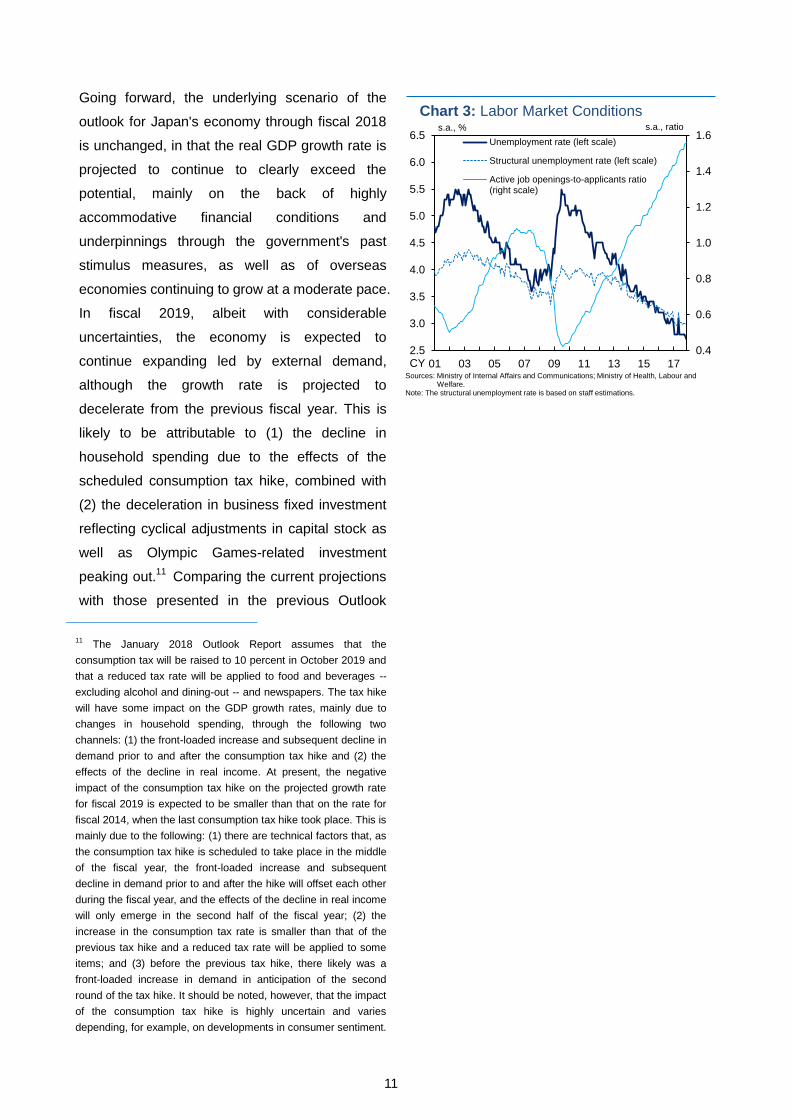
(Chart 2). Reflecting these increases in demand,
labor market conditions have continued to tighten
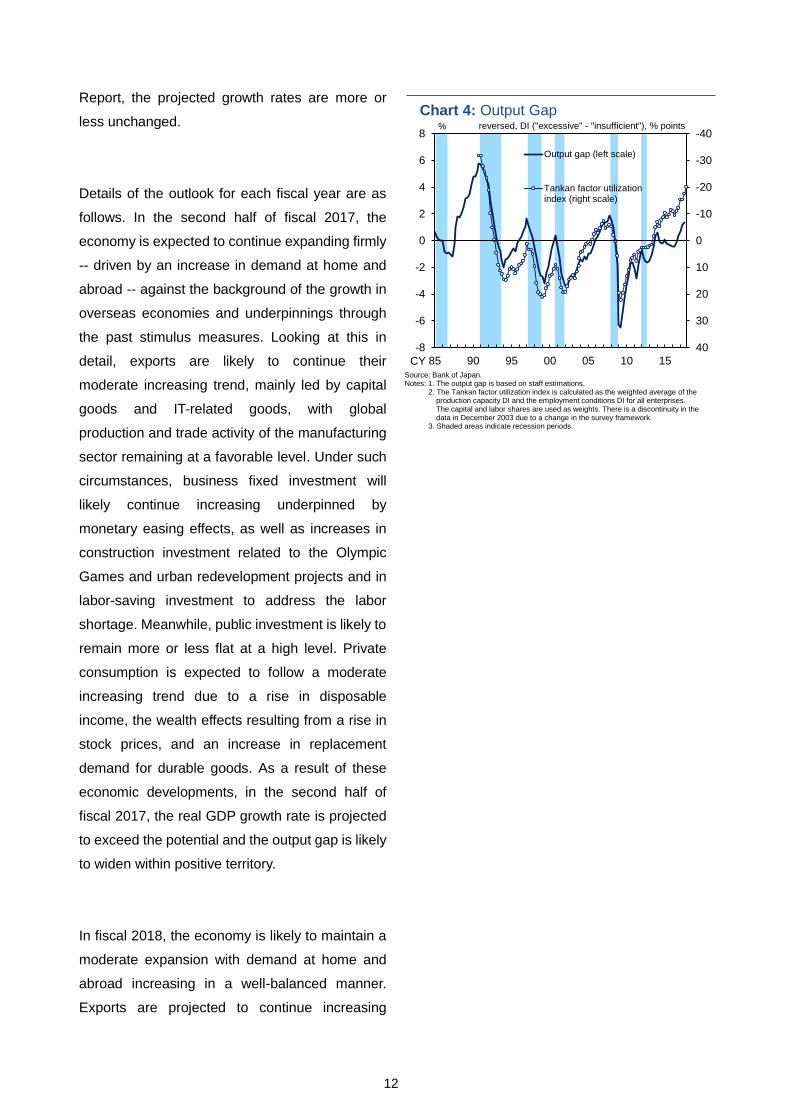
steadily (Chart 3). The output gap -- which
captures the utilization of labor and capital -- has
improved steadily of late and was around 1.5
percent for the July-September quarter (Chart
4).10
Monthly indicators since October suggest
that the uptrend in the output gap has become
more evident. Therefore, Japan's economy is
expanding moderately, with a virtuous cycle from
income to spending operating.
9 "The Background" provides explanations of "The Bank's View"
decided by the Policy Board of the Bank of Japan at the Monetary
Policy Meeting held on January 22 and 23, 2018.
10 The Research and Statistics Department of the Bank of Japan
revised the estimation method of Japan's output gap and potential
growth rate in April 2017. For details including the technical
aspects, see the Bank's research paper "Methodology for
Estimating Output Gap and Potential Growth Rate: An Update"
released in May 2017.
-2
-1
0
1
2
3
4
5
85 90 95 00 05 10 15
Total factor productivity
Capital input
Labor input
Potential growth rate
Chart 2: Potential Growth Ratey/y % chg.
FYSource: Bank of Japan.Note: Based on staff estimations.
-15
-10
-5
0
5
10
15
1 0 1 1 1 2 1 3 1 4 1 5 1 6 1 7
Private demand
Public demand
Net exports
Real GDP
s.a., ann., q/q % chg.
Chart 1: Real GDP
Source: Cabinet Office.
CY
11
Going forward, the underlying scenario of the
outlook for Japan's economy through fiscal 2018
is unchanged, in that the real GDP growth rate is
projected to continue to clearly exceed the
potential, mainly on the back of highly
accommodative financial conditions and
underpinnings through the government's past
stimulus measures, as well as of overseas
economies continuing to grow at a moderate pace.
In fiscal 2019, albeit with considerable
uncertainties, the economy is expected to
continue expanding led by external demand,
although the growth rate is projected to
decelerate from the previous fiscal year. This is
likely to be attributable to (1) the decline in
household spending due to the effects of the
scheduled consumption tax hike, combined with
(2) the deceleration in business fixed investment
reflecting cyclical adjustments in capital stock as
well as Olympic Games-related investment
peaking out.11
Comparing the current projections
with those presented in the previous Outlook
11 The January 2018 Outlook Report assumes that the
consumption tax will be raised to 10 percent in October 2019 and
that a reduced tax rate will be applied to food and beverages --
excluding alcohol and dining-out -- and newspapers. The tax hike
will have some impact on the GDP growth rates, mainly due to
changes in household spending, through the following two
channels: (1) the front-loaded increase and subsequent decline in
demand prior to and after the consumption tax hike and (2) the
effects of the decline in real income. At present, the negative
impact of the consumption tax hike on the projected growth rate
for fiscal 2019 is expected to be smaller than that on the rate for
fiscal 2014, when the last consumption tax hike took place. This is
mainly due to the following: (1) there are technical factors that, as
the consumption tax hike is scheduled to take place in the middle
of the fiscal year, the front-loaded increase and subsequent
decline in demand prior to and after the hike will offset each other
during the fiscal year, and the effects of the decline in real income
will only emerge in the second half of the fiscal year; (2) the
increase in the consumption tax rate is smaller than that of the
previous tax hike and a reduced tax rate will be applied to some
items; and (3) before the previous tax hike, there likely was a
front-loaded increase in demand in anticipation of the second
round of the tax hike. It should be noted, however, that the impact
of the consumption tax hike is highly uncertain and varies
depending, for example, on developments in consumer sentiment.
0.4
0.6
0.8
1.0
1.2
1.4
1.6
2.5
3.0
3.5
4.0
4.5
5.0
5.5
6.0
6.5
01 03 05 07 09 11 13 15 17
Unemployment rate (left scale)
Structural unemployment rate (left scale)
Active job openings-to-applicants ratio(right scale)
Chart 3: Labor Market Conditionss.a., %
CYSources: Ministry of Internal Affairs and Communications; Ministry of Health, Labour and
Welfare.Note: The structural unemployment rate is based on staff estimations.
s.a., ratio
12
Report, the projected growth rates are more or
less unchanged.
Details of the outlook for each fiscal year are as
follows. In the second half of fiscal 2017, the
economy is expected to continue expanding firmly
-- driven by an increase in demand at home and
abroad -- against the background of the growth in
overseas economies and underpinnings through
the past stimulus measures. Looking at this in
detail, exports are likely to continue their
moderate increasing trend, mainly led by capital
goods and IT-related goods, with global
production and trade activity of the manufacturing
sector remaining at a favorable level. Under such
circumstances, business fixed investment will
likely continue increasing underpinned by
monetary easing effects, as well as increases in
construction investment related to the Olympic
Games and urban redevelopment projects and in
labor-saving investment to address the labor
shortage. Meanwhile, public investment is likely to
remain more or less flat at a high level. Private
consumption is expected to follow a moderate
increasing trend due to a rise in disposable
income, the wealth effects resulting from a rise in
stock prices, and an increase in replacement
demand for durable goods. As a result of these
economic developments, in the second half of
fiscal 2017, the real GDP growth rate is projected
to exceed the potential and the output gap is likely
to widen within positive territory.
In fiscal 2018, the economy is likely to maintain a
moderate expansion with demand at home and
abroad increasing in a well-balanced manner.
Exports are projected to continue increasing
-40
-30
-20
-10
0
10
20
30
40-8
-6
-4
-2
0
2
4
6
8
85 90 95 00 05 10 15
Output gap (left scale)
Tankan factor utilizationindex (right scale)
% reversed, DI ("excessive" - "insufficient"), % points
Chart 4: Output Gap
Source: Bank of Japan.Notes: 1. The output gap is based on staff estimations.
2. The Tankan factor utilization index is calculated as the weighted average of theproduction capacity DI and the employment conditions DI for all enterprises.The capital and labor shares are used as weights. There is a discontinuity in the data in December 2003 due to a change in the survey framework.
3. Shaded areas indicate recession periods.
CY
13
moderately, reflecting the growth in overseas
economies. Business fixed investment is also
expected to continue to see a steady increase, on
the back of accommodative financial conditions
and increases in Olympic Games-related demand
and in needs for labor-saving equipment
stemming from the labor shortage. Private
consumption will likely maintain its momentum,
supported by the rise in disposable income
resulting from increases in base pay rises.
Meanwhile, public investment is likely to start
declining, because the positive effects resulting
from the past stimulus measures will diminish, but
is projected to remain at a high level, mainly
underpinned by Olympic Games-related demand.
On this basis, the real GDP growth rate for fiscal
2018 is projected to continue exceeding the
potential, although decelerate compared to the
previous fiscal year, and the output gap is likely to
continue improving.
In fiscal 2019, the growth pace is projected to
decelerate, mainly due to a slowdown in domestic
demand. Private consumption is expected to
increase its momentum in the first half of the fiscal
year, reflecting the front-loaded increase in
demand prior to the scheduled consumption tax
hike, and then start declining in the second half of
the fiscal year, pushed down by the subsequent
decline in demand following the tax hike and the
effects of the decline in real income. Business
fixed investment will likely decelerate under
cyclical downward pressure resulting from capital
stock adjustments, combined with the effects of
Olympic Games-related investment peaking out.
However, exports are projected to maintain their
increasing trend on the back of steady growth in
overseas economies, and thereby underpin the

14
economy. As a result of these developments, the
economy is expected to continue expanding,
although the growth rate is projected to
decelerate from the previous fiscal year.
15
B. Developments in Major Expenditure
Items and Their Background
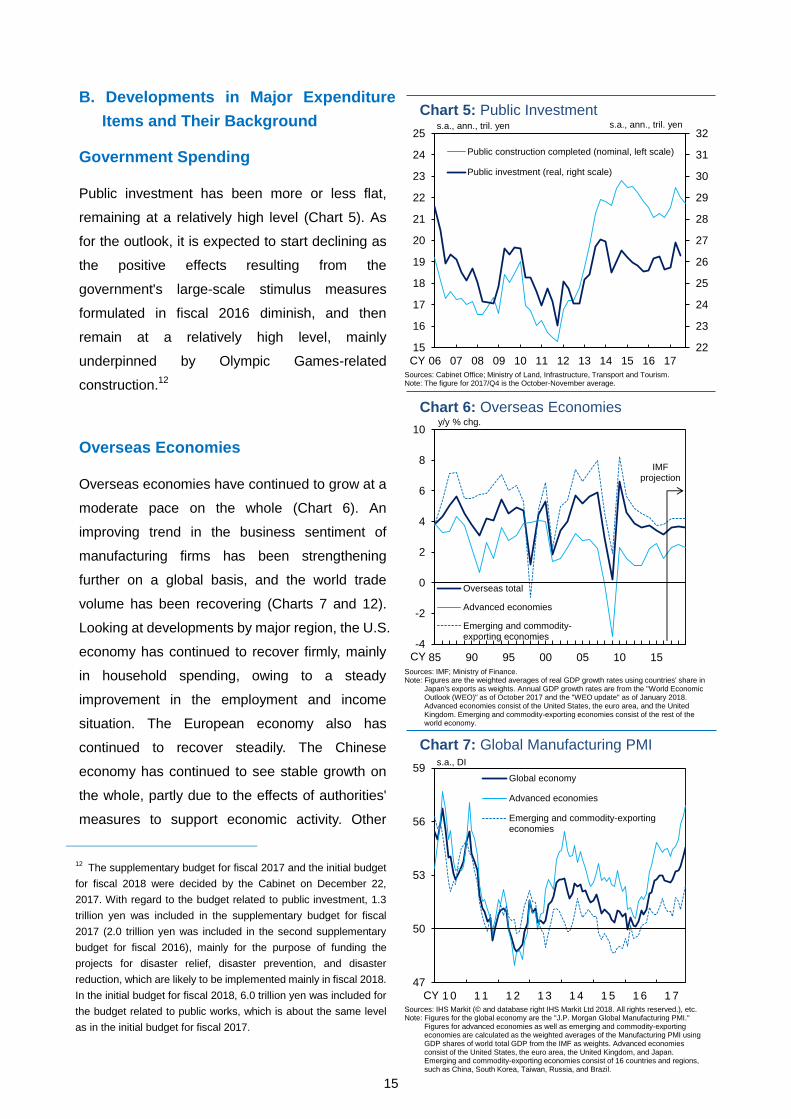
Government Spending
Public investment has been more or less flat,
remaining at a relatively high level (Chart 5). As
for the outlook, it is expected to start declining as
the positive effects resulting from the
government's large-scale stimulus measures
formulated in fiscal 2016 diminish, and then
remain at a relatively high level, mainly
underpinned by Olympic Games-related
construction.12
Overseas Economies
Overseas economies have continued to grow at a
moderate pace on the whole (Chart 6). An
improving trend in the business sentiment of
manufacturing firms has been strengthening
further on a global basis, and the world trade
volume has been recovering (Charts 7 and 12).
Looking at developments by major region, the U.S.
economy has continued to recover firmly, mainly
in household spending, owing to a steady
improvement in the employment and income
situation. The European economy also has
continued to recover steadily. The Chinese
economy has continued to see stable growth on
the whole, partly due to the effects of authorities'
measures to support economic activity. Other
12 The supplementary budget for fiscal 2017 and the initial budget
for fiscal 2018 were decided by the Cabinet on December 22,
2017. With regard to the budget related to public investment, 1.3
trillion yen was included in the supplementary budget for fiscal
2017 (2.0 trillion yen was included in the second supplementary
budget for fiscal 2016), mainly for the purpose of funding the
projects for disaster relief, disaster prevention, and disaster
reduction, which are likely to be implemented mainly in fiscal 2018.
In the initial budget for fiscal 2018, 6.0 trillion yen was included for
the budget related to public works, which is about the same level
as in the initial budget for fiscal 2017.
22
23
24
25
26
27
28
29
30
31
32
15
16
17
18
19
20
21
22
23
24
25
06 07 08 09 10 11 12 13 14 15 16 17
Public construction completed (nominal, left scale)
Public investment (real, right scale)
Chart 5: Public Investments.a., ann., tril. yen s.a., ann., tril. yen
Sources: Cabinet Office; Ministry of Land, Infrastructure, Transport and Tourism.Note: The figure for 2017/Q4 is the October-November average.
CY
47
50
53
56
59
1 0 1 1 1 2 1 3 1 4 1 5 1 6 1 7
Global economy
Advanced economies
Emerging and commodity-exportingeconomies
Chart 7: Global Manufacturing PMIs.a., DI
Sources: IHS Markit (© and database right IHS Markit Ltd 2018. All rights reserved.), etc.Note: Figures for the global economy are the "J.P. Morgan Global Manufacturing PMI."
Figures for advanced economies as well as emerging and commodity-exporting economies are calculated as the weighted averages of the Manufacturing PMI using GDP shares of world total GDP from the IMF as weights. Advanced economies consist of the United States, the euro area, the United Kingdom, and Japan. Emerging and commodity-exporting economies consist of 16 countries and regions, such as China, South Korea, Taiwan, Russia, and Brazil.
CY
-4
-2
0
2
4
6
8
10
85 90 95 00 05 10 15
Overseas total
Advanced economies
Emerging and commodity-exporting economies
Chart 6: Overseas Economiesy/y % chg.
Sources: IMF; Ministry of Finance.Note: Figures are the weighted averages of real GDP growth rates using countries' share in
Japan's exports as weights. Annual GDP growth rates are from the "World Economic Outlook (WEO)" as of October 2017 and the "WEO update" as of January 2018. Advanced economies consist of the United States, the euro area, and the United Kingdom. Emerging and commodity-exporting economies consist of the rest of the world economy.
CY
IMFprojection
16
emerging economies and commodity-exporting
economies have been recovering moderately on
the whole, reflecting in particular an increase in
exports and the effects of those economies'
economic stimulus measures.
In terms of the outlook, overseas economies are
expected to continue growing at a moderate pace
as advanced economies keep growing steadily
and a recovery in emerging economies takes hold
on the back of the steady growth in advanced
economies and the effects of policy measures
taken by emerging economies.
By major region, the U.S. economy is expected to
continue to see firm growth driven by domestic
private demand. The European economy will
likely continue its moderate recovery, while
uncertainty including over negotiations on the
United Kingdom's exit from the EU is likely to
weigh on economic activity. The Chinese
economy is likely to broadly follow a stable growth
path as authorities conduct fiscal and monetary
policy in a timely manner. The growth rates of
other emerging economies and
commodity-exporting economies are likely to
increase gradually, due mainly to the effects of the
economic stimulus measures and the spread of
the effects of steady growth in advanced
economies.
20
40
60
80
100
120
140
160
80 85 90 95 00 05 10 15
Real effective exchange rate
Nominal effective exchange rate
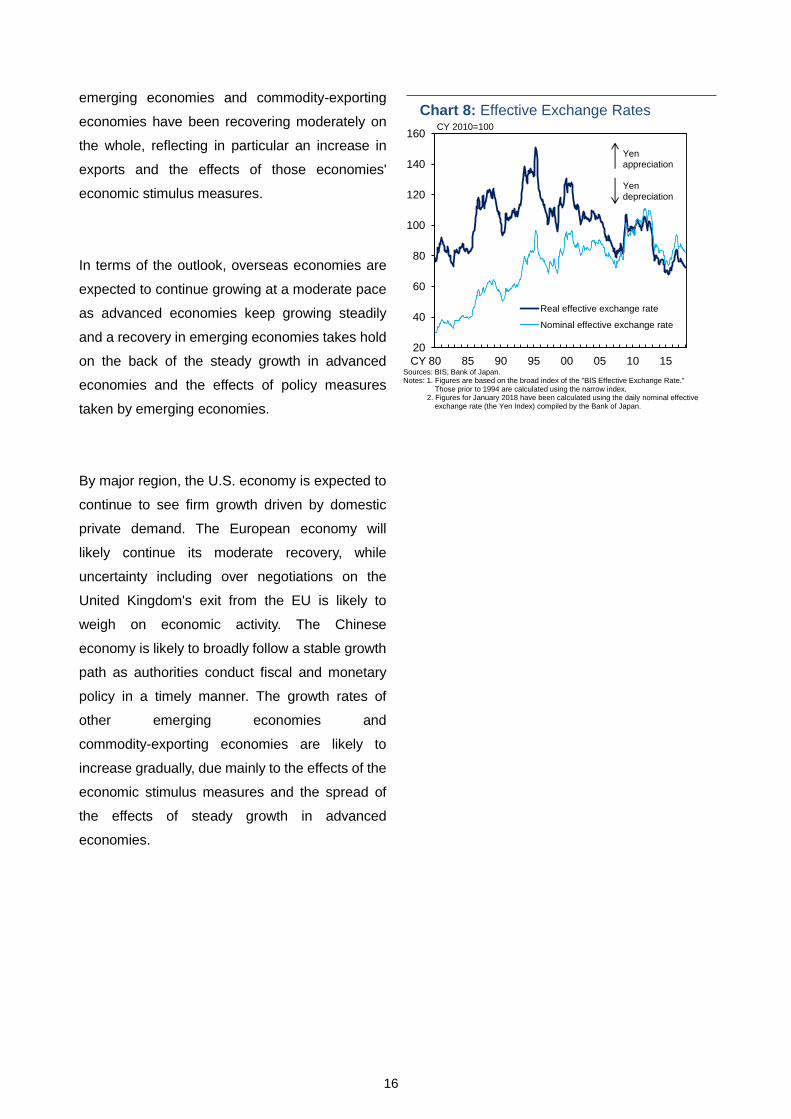
Sources: BIS; Bank of Japan.Notes: 1. Figures are based on the broad index of the "BIS Effective Exchange Rate."
Those prior to 1994 are calculated using the narrow index.2. Figures for January 2018 have been calculated using the daily nominal effective
exchange rate (the Yen Index) compiled by the Bank of Japan.
Chart 8: Effective Exchange RatesCY 2010=100
Yenappreciation
Yendepreciation
CY
17
Exports and Imports
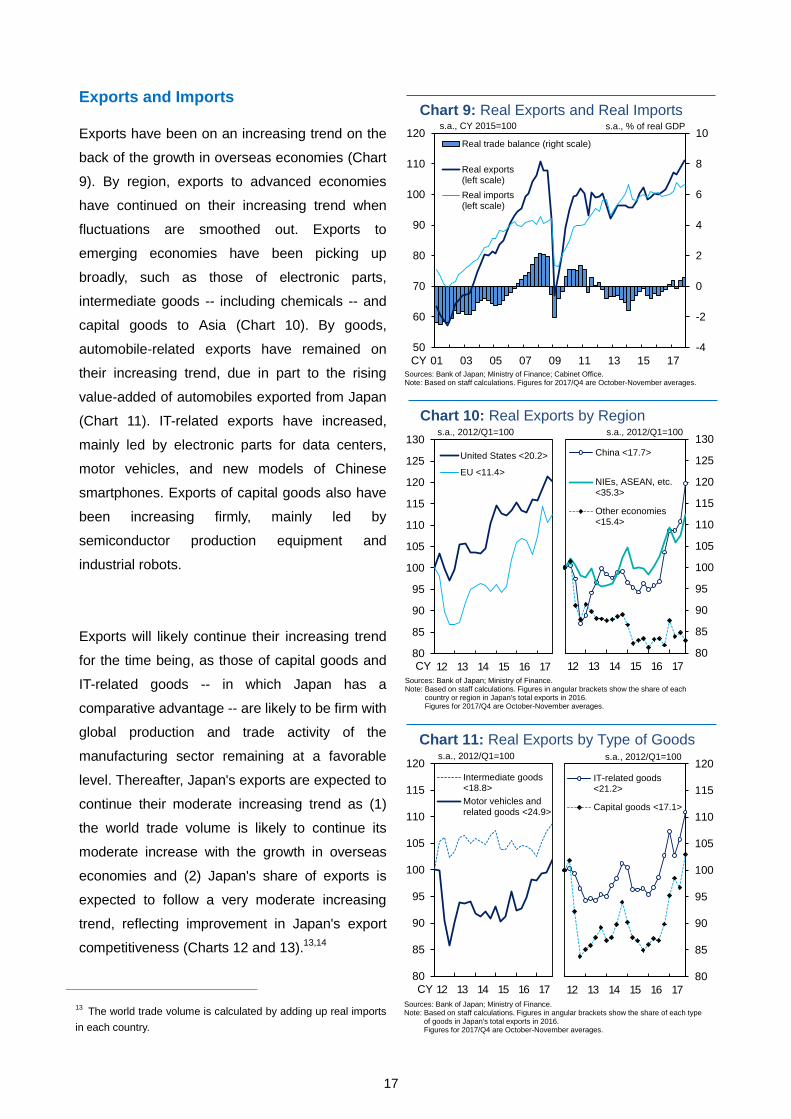
Exports have been on an increasing trend on the
back of the growth in overseas economies (Chart
9). By region, exports to advanced economies
have continued on their increasing trend when
fluctuations are smoothed out. Exports to
emerging economies have been picking up
broadly, such as those of electronic parts,
intermediate goods -- including chemicals -- and
capital goods to Asia (Chart 10). By goods,
automobile-related exports have remained on
their increasing trend, due in part to the rising
value-added of automobiles exported from Japan
(Chart 11). IT-related exports have increased,
mainly led by electronic parts for data centers,
motor vehicles, and new models of Chinese
smartphones. Exports of capital goods also have
been increasing firmly, mainly led by
semiconductor production equipment and
industrial robots.
Exports will likely continue their increasing trend
for the time being, as those of capital goods and
IT-related goods -- in which Japan has a
comparative advantage -- are likely to be firm with
global production and trade activity of the
manufacturing sector remaining at a favorable
level. Thereafter, Japan's exports are expected to
continue their moderate increasing trend as (1)
the world trade volume is likely to continue its
moderate increase with the growth in overseas
economies and (2) Japan's share of exports is
expected to follow a very moderate increasing
trend, reflecting improvement in Japan's export
competitiveness (Charts 12 and 13).13,14
13 The world trade volume is calculated by adding up real imports
in each country.
-4
-2
0
2
4
6
8
10
50
60
70
80
90
100
110
120
01 03 05 07 09 11 13 15 17
Real trade balance (right scale)
Real exports(left scale)
Real imports(left scale)
Chart 9: Real Exports and Real Importss.a., CY 2015=100
CYSources: Bank of Japan; Ministry of Finance; Cabinet Office.Note: Based on staff calculations. Figures for 2017/Q4 are October-November averages.
s.a., % of real GDP
80
85
90
95
100
105
110
115
120
125
130
12 13 14 15 16 17
China <17.7>
NIEs, ASEAN, etc.<35.3>
Other economies<15.4>
s.a., 2012/Q1=100
80
85
90
95
100
105
110
115
120
125
130
12 13 14 15 16 17
United States <20.2>
EU <11.4>
Chart 10: Real Exports by Regions.a., 2012/Q1=100
CY
Sources: Bank of Japan; Ministry of Finance.Note: Based on staff calculations. Figures in angular brackets show the share of each
country or region in Japan's total exports in 2016. Figures for 2017/Q4 are October-November averages.
80
85
90
95
100
105
110
115
120
12 13 14 15 16 17
Intermediate goods<18.8>
Motor vehicles andrelated goods <24.9>
Sources: Bank of Japan; Ministry of Finance.Note: Based on staff calculations. Figures in angular brackets show the share of each type
of goods in Japan's total exports in 2016.Figures for 2017/Q4 are October-November averages.
Chart 11: Real Exports by Type of Goodss.a., 2012/Q1=100
CY80
85
90
95
100
105
110
115
120
12 13 14 15 16 17
IT-related goods<21.2>
Capital goods <17.1>
s.a., 2012/Q1=100
18
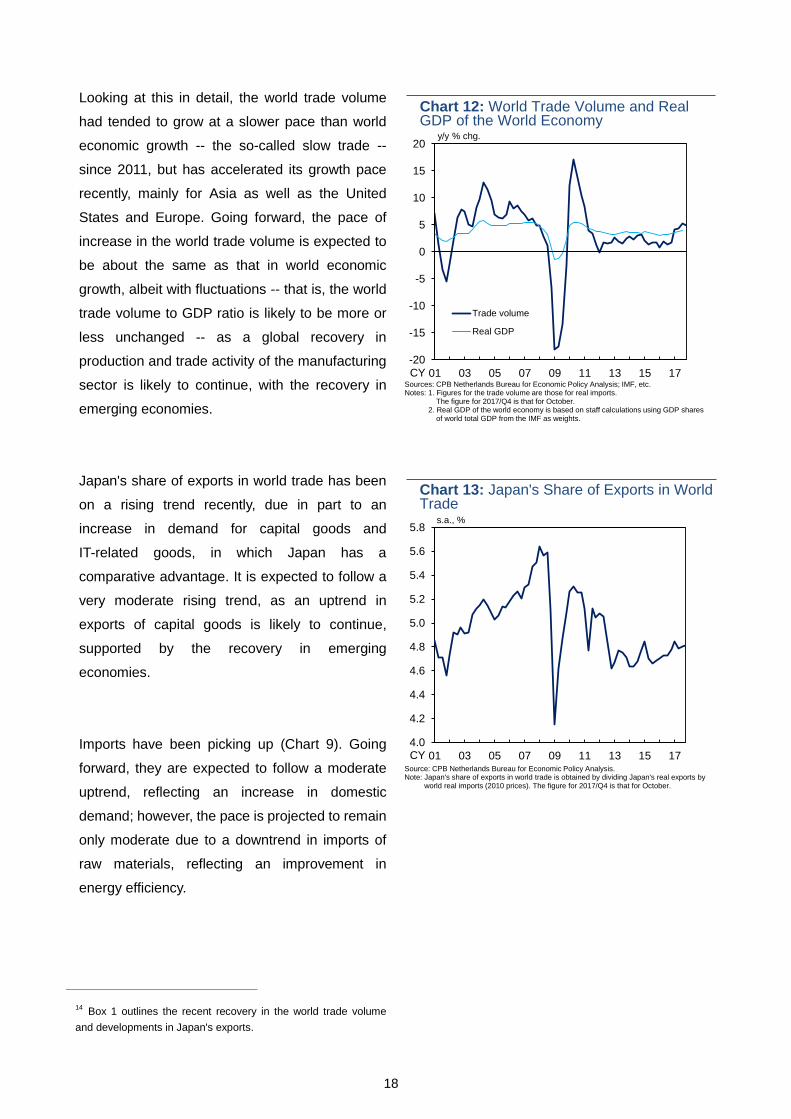
Looking at this in detail, the world trade volume
had tended to grow at a slower pace than world
economic growth -- the so-called slow trade --
since 2011, but has accelerated its growth pace
recently, mainly for Asia as well as the United
States and Europe. Going forward, the pace of
increase in the world trade volume is expected to
be about the same as that in world economic
growth, albeit with fluctuations -- that is, the world
trade volume to GDP ratio is likely to be more or
less unchanged -- as a global recovery in
production and trade activity of the manufacturing
sector is likely to continue, with the recovery in
emerging economies.
Japan's share of exports in world trade has been
on a rising trend recently, due in part to an
increase in demand for capital goods and
IT-related goods, in which Japan has a
comparative advantage. It is expected to follow a
very moderate rising trend, as an uptrend in
exports of capital goods is likely to continue,
supported by the recovery in emerging
economies.
Imports have been picking up (Chart 9). Going
forward, they are expected to follow a moderate
uptrend, reflecting an increase in domestic
demand; however, the pace is projected to remain
only moderate due to a downtrend in imports of
raw materials, reflecting an improvement in
energy efficiency.
14 Box 1 outlines the recent recovery in the world trade volume
and developments in Japan's exports.
4.0
4.2
4.4
4.6
4.8
5.0
5.2
5.4
5.6
5.8
01 03 05 07 09 11 13 15 17
Chart 13: Japan's Share of Exports in World Trade
s.a., %
Source: CPB Netherlands Bureau for Economic Policy Analysis.Note: Japan's share of exports in world trade is obtained by dividing Japan's real exports by
world real imports (2010 prices). The figure for 2017/Q4 is that for October.
CY
-20
-15
-10
-5
0
5
10
15
20
01 03 05 07 09 11 13 15 17
Trade volume
Real GDP
Chart 12: World Trade Volume and Real GDP of the World Economy
y/y % chg.
Sources: CPB Netherlands Bureau for Economic Policy Analysis; IMF, etc.Notes: 1. Figures for the trade volume are those for real imports.
The figure for 2017/Q4 is that for October.2. Real GDP of the world economy is based on staff calculations using GDP shares
of world total GDP from the IMF as weights.
CY
19
External Balance
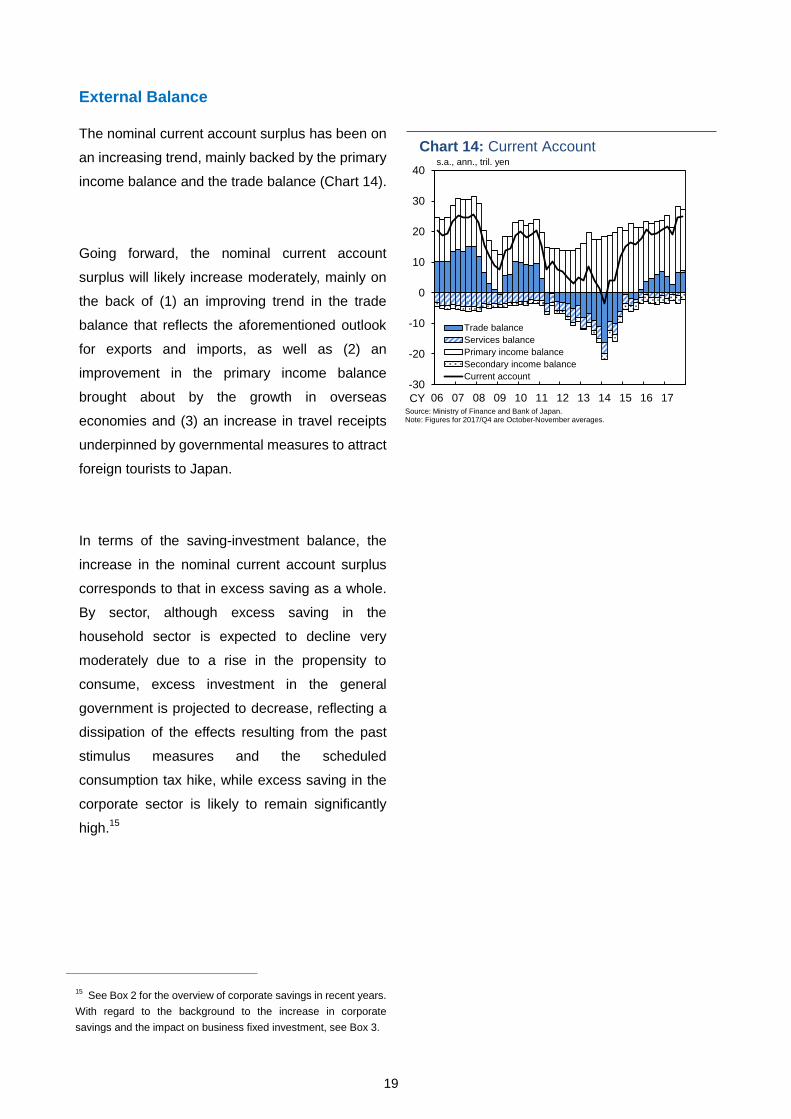
The nominal current account surplus has been on
an increasing trend, mainly backed by the primary
income balance and the trade balance (Chart 14).
Going forward, the nominal current account
surplus will likely increase moderately, mainly on
the back of (1) an improving trend in the trade
balance that reflects the aforementioned outlook
for exports and imports, as well as (2) an
improvement in the primary income balance
brought about by the growth in overseas
economies and (3) an increase in travel receipts
underpinned by governmental measures to attract
foreign tourists to Japan.
In terms of the saving-investment balance, the
increase in the nominal current account surplus
corresponds to that in excess saving as a whole.
By sector, although excess saving in the
household sector is expected to decline very
moderately due to a rise in the propensity to
consume, excess investment in the general
government is projected to decrease, reflecting a
dissipation of the effects resulting from the past
stimulus measures and the scheduled
consumption tax hike, while excess saving in the
corporate sector is likely to remain significantly
high.15
15 See Box 2 for the overview of corporate savings in recent years.
With regard to the background to the increase in corporate
savings and the impact on business fixed investment, see Box 3.
-30
-20
-10
0
10
20
30
40
06 07 08 09 10 11 12 13 14 15 16 17
Trade balance
Services balance
Primary income balance
Secondary income balance
Current account
s.a., ann., tril. yen
Chart 14: Current Account
Source: Ministry of Finance and Bank of Japan.Note: Figures for 2017/Q4 are October-November averages.
CY
20
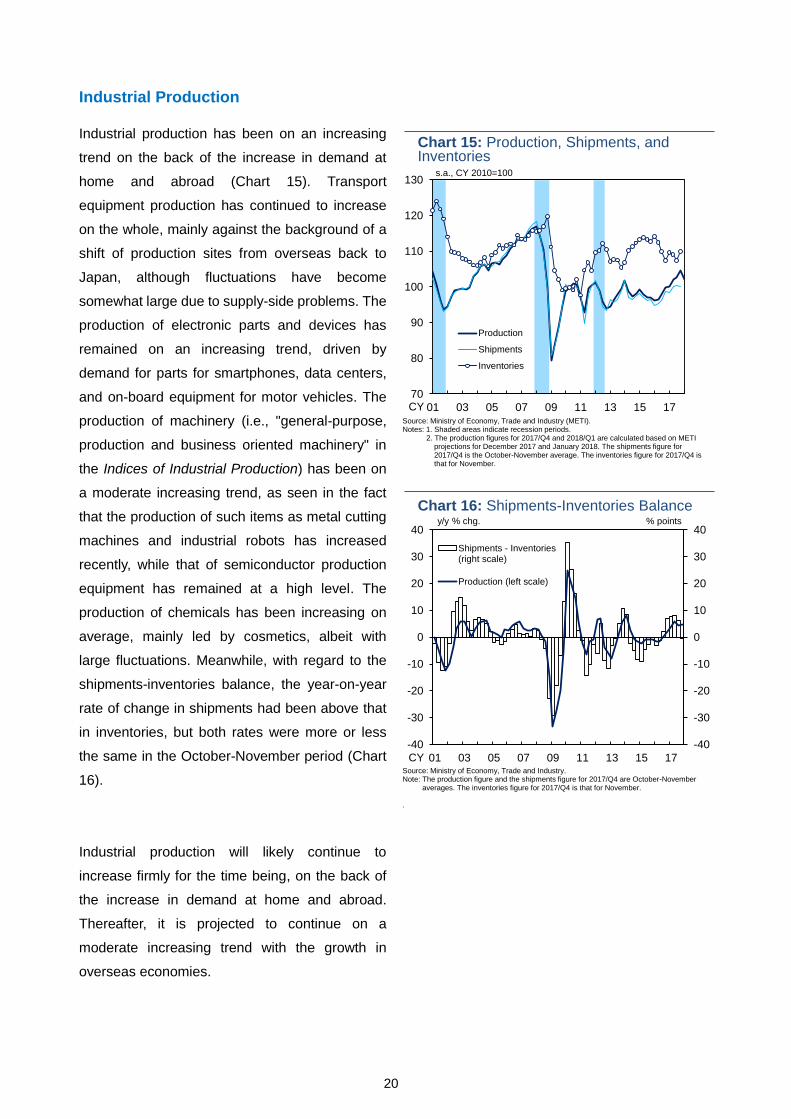
Industrial Production
Industrial production has been on an increasing
trend on the back of the increase in demand at
home and abroad (Chart 15). Transport
equipment production has continued to increase
on the whole, mainly against the background of a
shift of production sites from overseas back to
Japan, although fluctuations have become
somewhat large due to supply-side problems. The
production of electronic parts and devices has
remained on an increasing trend, driven by
demand for parts for smartphones, data centers,
and on-board equipment for motor vehicles. The
production of machinery (i.e., "general-purpose,
production and business oriented machinery" in
the Indices of Industrial Production) has been on
a moderate increasing trend, as seen in the fact
that the production of such items as metal cutting
machines and industrial robots has increased
recently, while that of semiconductor production
equipment has remained at a high level. The
production of chemicals has been increasing on
average, mainly led by cosmetics, albeit with
large fluctuations. Meanwhile, with regard to the
shipments-inventories balance, the year-on-year
rate of change in shipments had been above that
in inventories, but both rates were more or less
the same in the October-November period (Chart
16).
Industrial production will likely continue to
increase firmly for the time being, on the back of
the increase in demand at home and abroad.
Thereafter, it is projected to continue on a
moderate increasing trend with the growth in
overseas economies.
70
80
90
100
110
120
130
01 03 05 07 09 11 13 15 17
Production
Shipments
Inventories
Chart 15: Production, Shipments, and Inventories
s.a., CY 2010=100
Source: Ministry of Economy, Trade and Industry (METI).Notes: 1. Shaded areas indicate recession periods.
2. The production figures for 2017/Q4 and 2018/Q1 are calculated based on METI projections for December 2017 and January 2018. The shipments figure for 2017/Q4 is the October-November average. The inventories figure for 2017/Q4 is that for November.
CY
-40
-30
-20
-10
0
10
20
30
40
-40
-30
-20
-10
0
10
20
30
40
01 03 05 07 09 11 13 15 17
Shipments - Inventories(right scale)
Production (left scale)
Chart 16: Shipments-Inventories Balancey/y % chg. % points
CYSource: Ministry of Economy, Trade and Industry.Note: The production figure and the shipments figure for 2017/Q4 are October-November
averages. The inventories figure for 2017/Q4 is that for November.
.
21
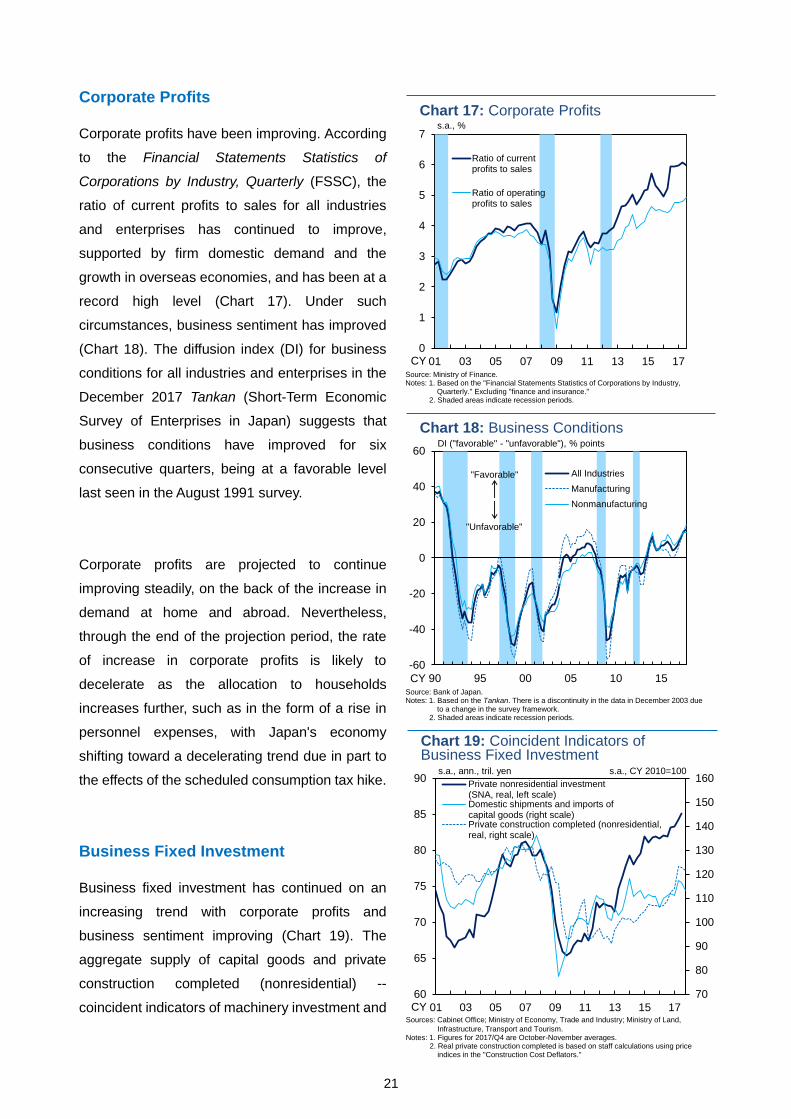
Corporate Profits
Corporate profits have been improving. According
to the Financial Statements Statistics of
Corporations by Industry, Quarterly (FSSC), the
ratio of current profits to sales for all industries
and enterprises has continued to improve,
supported by firm domestic demand and the
growth in overseas economies, and has been at a
record high level (Chart 17). Under such
circumstances, business sentiment has improved
(Chart 18). The diffusion index (DI) for business
conditions for all industries and enterprises in the
December 2017 Tankan (Short-Term Economic
Survey of Enterprises in Japan) suggests that
business conditions have improved for six
consecutive quarters, being at a favorable level
last seen in the August 1991 survey.
Corporate profits are projected to continue
improving steadily, on the back of the increase in
demand at home and abroad. Nevertheless,
through the end of the projection period, the rate
of increase in corporate profits is likely to
decelerate as the allocation to households
increases further, such as in the form of a rise in
personnel expenses, with Japan's economy
shifting toward a decelerating trend due in part to
the effects of the scheduled consumption tax hike.
Business Fixed Investment
Business fixed investment has continued on an
increasing trend with corporate profits and
business sentiment improving (Chart 19). The
aggregate supply of capital goods and private
construction completed (nonresidential) --
coincident indicators of machinery investment and
0
1
2
3
4
5
6
7
01 03 05 07 09 11 13 15 17
Ratio of currentprofits to sales
Ratio of operatingprofits to sales
Chart 17: Corporate Profitss.a., %
CYSource: Ministry of Finance.Notes: 1. Based on the "Financial Statements Statistics of Corporations by Industry,
Quarterly." Excluding "finance and insurance."2. Shaded areas indicate recession periods.
-60
-40
-20
0
20
40
60
90 95 00 05 10 15
All Industries
Manufacturing
Nonmanufacturing
Chart 18: Business ConditionsDI ("favorable" - "unfavorable"), % points
"Favorable"
"Unfavorable"
CYSource: Bank of Japan.Notes: 1. Based on the Tankan. There is a discontinuity in the data in December 2003 due
to a change in the survey framework.2. Shaded areas indicate recession periods.
70
80
90
100
110
120
130
140
150
160
60
65
70
75
80
85
90
01 03 05 07 09 11 13 15 17
Private nonresidential investment(SNA, real, left scale)Domestic shipments and imports ofcapital goods (right scale)Private construction completed (nonresidential,real, right scale)
Chart 19: Coincident Indicators ofBusiness Fixed Investment
s.a., ann., tril. yen s.a., CY 2010=100
CYSources: Cabinet Office; Ministry of Economy, Trade and Industry; Ministry of Land,
Infrastructure, Transport and Tourism.Notes: 1. Figures for 2017/Q4 are October-November averages.
2. Real private construction completed is based on staff calculations using price indices in the "Construction Cost Deflators."
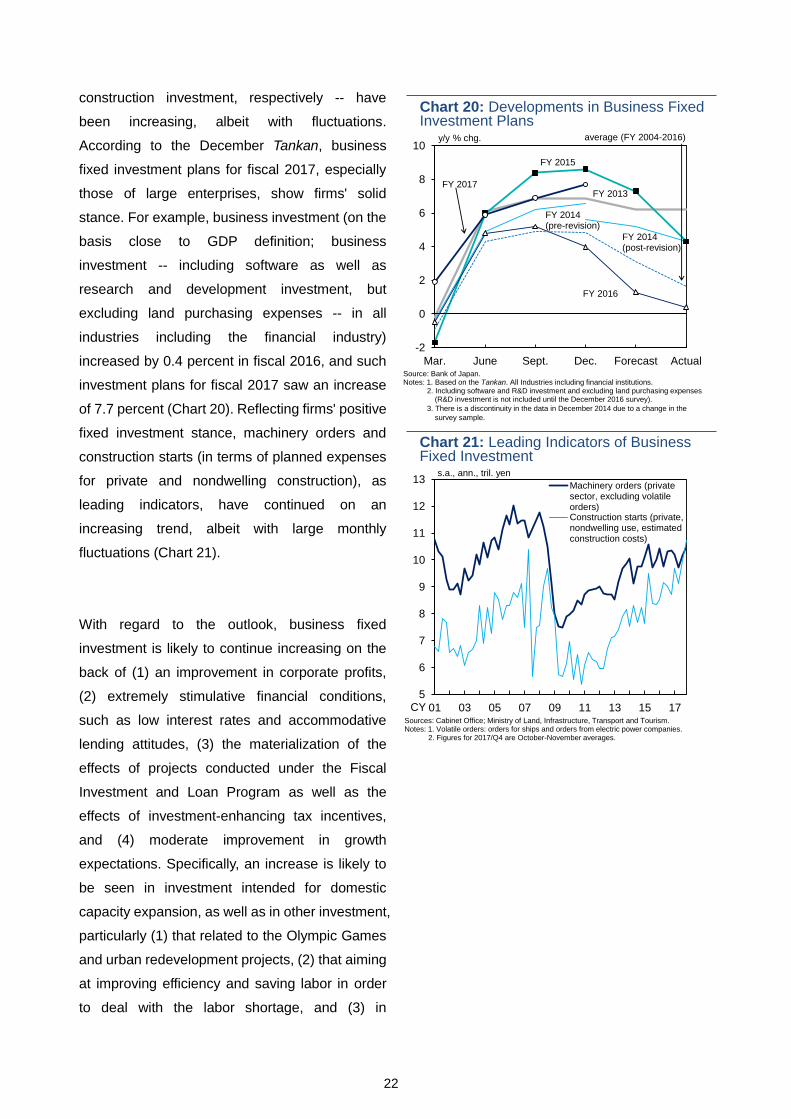
22
construction investment, respectively -- have
been increasing, albeit with fluctuations.
According to the December Tankan, business
fixed investment plans for fiscal 2017, especially
those of large enterprises, show firms' solid
stance. For example, business investment (on the
basis close to GDP definition; business
investment -- including software as well as
research and development investment, but
excluding land purchasing expenses -- in all
industries including the financial industry)
increased by 0.4 percent in fiscal 2016, and such
investment plans for fiscal 2017 saw an increase
of 7.7 percent (Chart 20). Reflecting firms' positive
fixed investment stance, machinery orders and
construction starts (in terms of planned expenses
for private and nondwelling construction), as
leading indicators, have continued on an
increasing trend, albeit with large monthly
fluctuations (Chart 21).
With regard to the outlook, business fixed
investment is likely to continue increasing on the
back of (1) an improvement in corporate profits,
(2) extremely stimulative financial conditions,
such as low interest rates and accommodative
lending attitudes, (3) the materialization of the
effects of projects conducted under the Fiscal
Investment and Loan Program as well as the
effects of investment-enhancing tax incentives,
and (4) moderate improvement in growth
expectations. Specifically, an increase is likely to
be seen in investment intended for domestic
capacity expansion, as well as in other investment,
particularly (1) that related to the Olympic Games
and urban redevelopment projects, (2) that aiming
at improving efficiency and saving labor in order
to deal with the labor shortage, and (3) in
5
6
7
8
9
10
11
12
13
01 03 05 07 09 11 13 15 17
Machinery orders (privatesector, excluding volatileorders)Construction starts (private,nondwelling use, estimatedconstruction costs)
Chart 21: Leading Indicators of BusinessFixed Investment
s.a., ann., tril. yen
CYSources: Cabinet Office; Ministry of Land, Infrastructure, Transport and Tourism.Notes: 1. Volatile orders: orders for ships and orders from electric power companies.
2. Figures for 2017/Q4 are October-November averages.
FY 2013
FY 2015
FY 2016
FY 2017
-2
0
2
4
6
8
10
Mar. June Sept. Dec. Forecast ActualSource: Bank of Japan. Notes: 1. Based on the Tankan. All Industries including financial institutions.
2. Including software and R&D investment and excluding land purchasing expenses (R&D investment is not included until the December 2016 survey).
3. There is a discontinuity in the data in December 2014 due to a change in the
survey sample.
Chart 20: Developments in Business FixedInvestment Plans
y/y % chg. average (FY 2004-2016)
FY 2014(pre-revision)
FY 2014(post-revision)
23
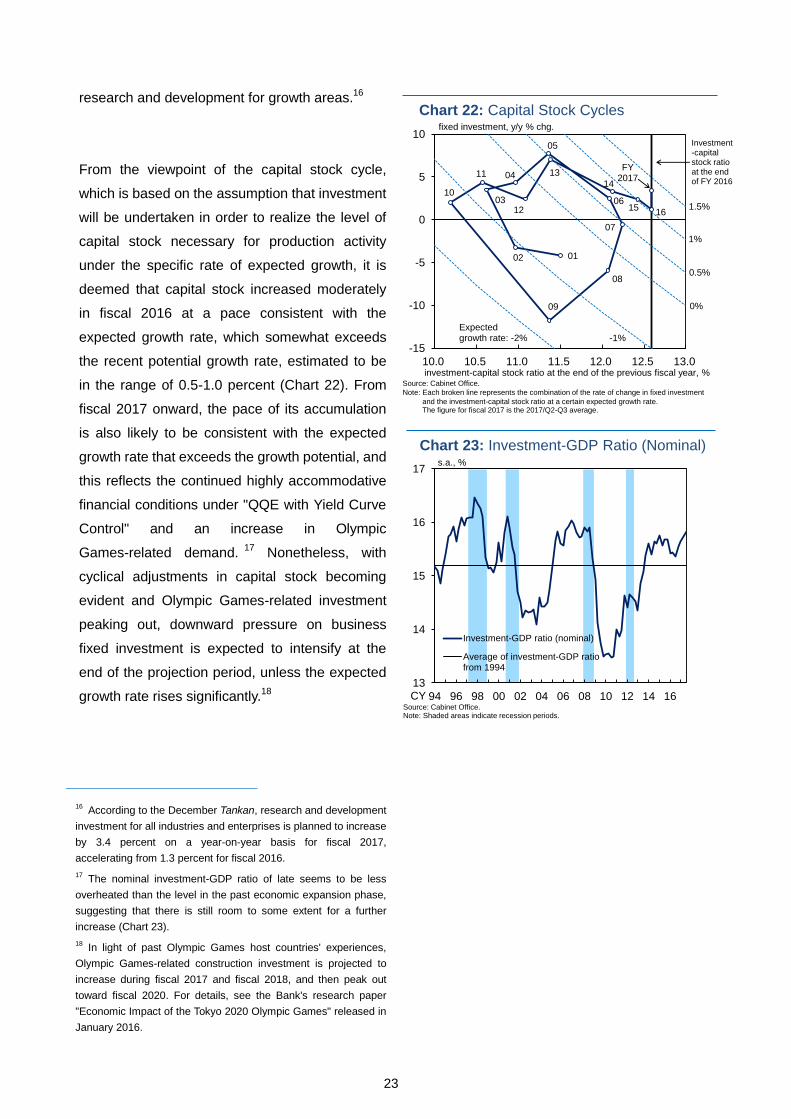
research and development for growth areas.16
From the viewpoint of the capital stock cycle,
which is based on the assumption that investment
will be undertaken in order to realize the level of
capital stock necessary for production activity
under the specific rate of expected growth, it is
deemed that capital stock increased moderately
in fiscal 2016 at a pace consistent with the
expected growth rate, which somewhat exceeds
the recent potential growth rate, estimated to be
in the range of 0.5-1.0 percent (Chart 22). From
fiscal 2017 onward, the pace of its accumulation
is also likely to be consistent with the expected
growth rate that exceeds the growth potential, and
this reflects the continued highly accommodative
financial conditions under "QQE with Yield Curve
Control" and an increase in Olympic
Games-related demand.17
Nonetheless, with
cyclical adjustments in capital stock becoming
evident and Olympic Games-related investment
peaking out, downward pressure on business
fixed investment is expected to intensify at the
end of the projection period, unless the expected
growth rate rises significantly.18
16 According to the December Tankan, research and development
investment for all industries and enterprises is planned to increase
by 3.4 percent on a year-on-year basis for fiscal 2017,
accelerating from 1.3 percent for fiscal 2016.
17 The nominal investment-GDP ratio of late seems to be less
overheated than the level in the past economic expansion phase,
suggesting that there is still room to some extent for a further
increase (Chart 23).
18 In light of past Olympic Games host countries' experiences,
Olympic Games-related construction investment is projected to
increase during fiscal 2017 and fiscal 2018, and then peak out
toward fiscal 2020. For details, see the Bank's research paper
"Economic Impact of the Tokyo 2020 Olympic Games" released in
January 2016.
0102
03
04
05
14
07
08
09
10
11
12
13
0615
16
FY 2017
-15
-10
-5
0
5
10
10.0 10.5 11.0 11.5 12.0 12.5 13.0
Source: Cabinet Office.
Note: Each broken line represents the combination of the rate of change in fixed investment
and the investment-capital stock ratio at a certain expected growth rate.The figure for fiscal 2017 is the 2017/Q2-Q3 average.
Chart 22: Capital Stock Cycles
investment-capital stock ratio at the end of the previous fiscal year, %
fixed investment, y/y % chg.
Investment-capital stock ratio at the end of FY 2016
1%
0.5%
Expectedgrowth rate: -2% -1%
0%
1.5%
13
14
15
16
17
94 96 98 00 02 04 06 08 10 12 14 16
Investment-GDP ratio (nominal)
Average of investment-GDP ratiofrom 1994
Source: Cabinet Office.Note: Shaded areas indicate recession periods.
Chart 23: Investment-GDP Ratio (Nominal)s.a., %
CY
24
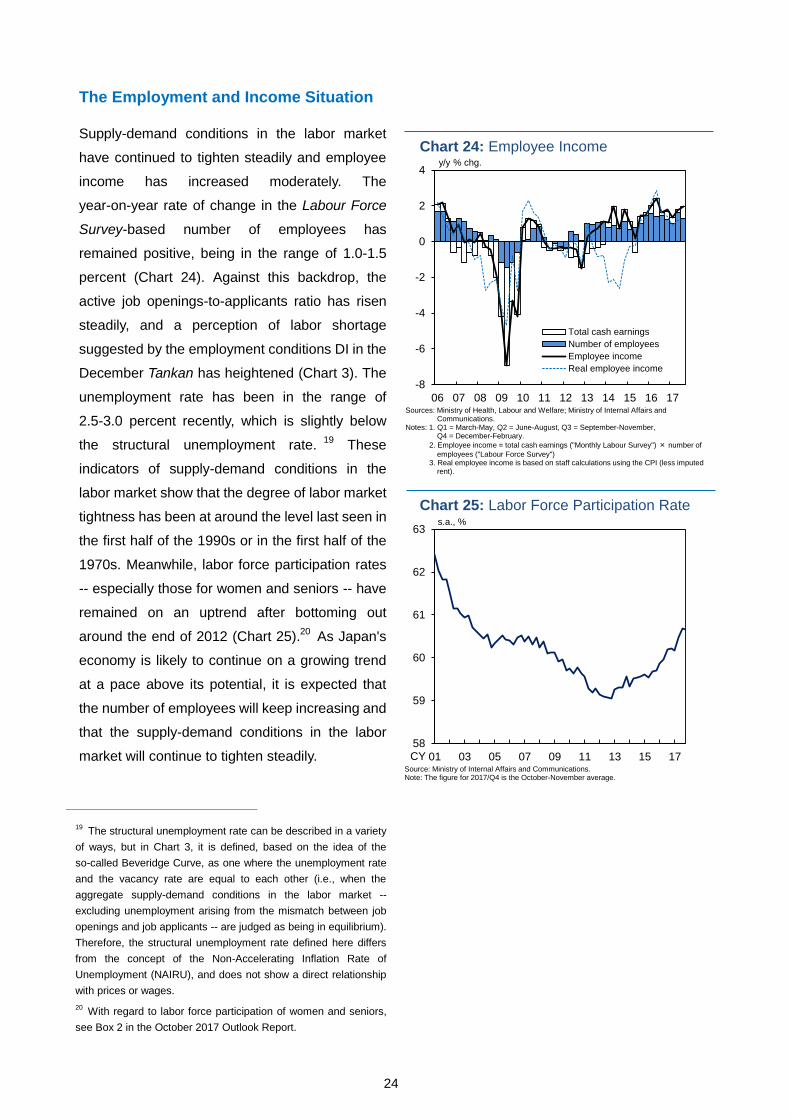
The Employment and Income Situation
Supply-demand conditions in the labor market
have continued to tighten steadily and employee
income has increased moderately. The
year-on-year rate of change in the Labour Force
Survey-based number of employees has
remained positive, being in the range of 1.0-1.5
percent (Chart 24). Against this backdrop, the
active job openings-to-applicants ratio has risen
steadily, and a perception of labor shortage
suggested by the employment conditions DI in the
December Tankan has heightened (Chart 3). The
unemployment rate has been in the range of
2.5-3.0 percent recently, which is slightly below
the structural unemployment rate.19
These
indicators of supply-demand conditions in the
labor market show that the degree of labor market
tightness has been at around the level last seen in
the first half of the 1990s or in the first half of the
1970s. Meanwhile, labor force participation rates
-- especially those for women and seniors -- have
remained on an uptrend after bottoming out
around the end of 2012 (Chart 25).20
As Japan's
economy is likely to continue on a growing trend
at a pace above its potential, it is expected that
the number of employees will keep increasing and
that the supply-demand conditions in the labor
market will continue to tighten steadily.
19 The structural unemployment rate can be described in a variety
of ways, but in Chart 3, it is defined, based on the idea of the
so-called Beveridge Curve, as one where the unemployment rate
and the vacancy rate are equal to each other (i.e., when the
aggregate supply-demand conditions in the labor market --
excluding unemployment arising from the mismatch between job
openings and job applicants -- are judged as being in equilibrium).
Therefore, the structural unemployment rate defined here differs
from the concept of the Non-Accelerating Inflation Rate of
Unemployment (NAIRU), and does not show a direct relationship
with prices or wages.
20 With regard to labor force participation of women and seniors,
see Box 2 in the October 2017 Outlook Report.
-8
-6
-4
-2
0
2
4
06 07 08 09 10 11 12 13 14 15 16 17
Total cash earnings
Number of employees
Employee income
Real employee income
Chart 24: Employee Incomey/y % chg.
Sources: Ministry of Health, Labour and Welfare; Ministry of Internal Affairs and Communications.
Notes: 1. Q1 = March-May, Q2 = June-August, Q3 = September-November,Q4 = December-February.
2. Employee income = total cash earnings ("Monthly Labour Survey") × number of
employees ("Labour Force Survey")3. Real employee income is based on staff calculations using the CPI (less imputed
rent).
58
59
60
61
62
63
01 03 05 07 09 11 13 15 17
Chart 25: Labor Force Participation Rates.a., %
Source: Ministry of Internal Affairs and Communications.Note: The figure for 2017/Q4 is the October-November average.
CY
25
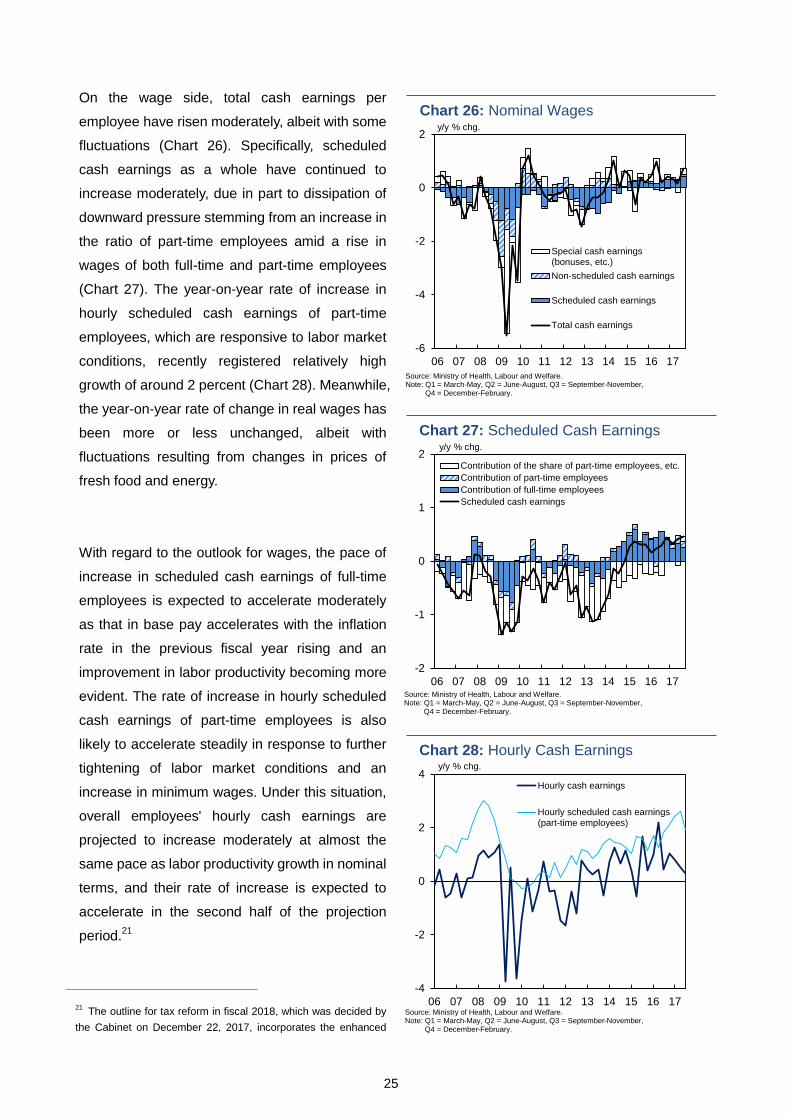
On the wage side, total cash earnings per
employee have risen moderately, albeit with some
fluctuations (Chart 26). Specifically, scheduled
cash earnings as a whole have continued to
increase moderately, due in part to dissipation of
downward pressure stemming from an increase in
the ratio of part-time employees amid a rise in
wages of both full-time and part-time employees
(Chart 27). The year-on-year rate of increase in
hourly scheduled cash earnings of part-time
employees, which are responsive to labor market
conditions, recently registered relatively high
growth of around 2 percent (Chart 28). Meanwhile,
the year-on-year rate of change in real wages has
been more or less unchanged, albeit with
fluctuations resulting from changes in prices of
fresh food and energy.
With regard to the outlook for wages, the pace of
increase in scheduled cash earnings of full-time
employees is expected to accelerate moderately
as that in base pay accelerates with the inflation
rate in the previous fiscal year rising and an
improvement in labor productivity becoming more
evident. The rate of increase in hourly scheduled
cash earnings of part-time employees is also
likely to accelerate steadily in response to further
tightening of labor market conditions and an
increase in minimum wages. Under this situation,
overall employees' hourly cash earnings are
projected to increase moderately at almost the
same pace as labor productivity growth in nominal
terms, and their rate of increase is expected to
accelerate in the second half of the projection
period.21
21 The outline for tax reform in fiscal 2018, which was decided by
the Cabinet on December 22, 2017, incorporates the enhanced
-6
-4
-2
0
2
06 07 08 09 10 11 12 13 14 15 16 17
Special cash earnings(bonuses, etc.)
Non-scheduled cash earnings
Scheduled cash earnings
Total cash earnings
Chart 26: Nominal Wagesy/y % chg.
Source: Ministry of Health, Labour and Welfare.Note: Q1 = March-May, Q2 = June-August, Q3 = September-November,
Q4 = December-February.
-2
-1
0
1
2
06 07 08 09 10 11 12 13 14 15 16 17
Contribution of the share of part-time employees, etc.
Contribution of part-time employees
Contribution of full-time employees
Scheduled cash earnings
Chart 27: Scheduled Cash Earningsy/y % chg.
Source: Ministry of Health, Labour and Welfare.Note: Q1 = March-May, Q2 = June-August, Q3 = September-November,
Q4 = December-February.
-4
-2
0
2
4
06 07 08 09 10 11 12 13 14 15 16 17
Hourly cash earnings
Hourly scheduled cash earnings(part-time employees)
Chart 28: Hourly Cash Earningsy/y % chg.
Source: Ministry of Health, Labour and Welfare.Note: Q1 = March-May, Q2 = June-August, Q3 = September-November,
Q4 = December-February.
26
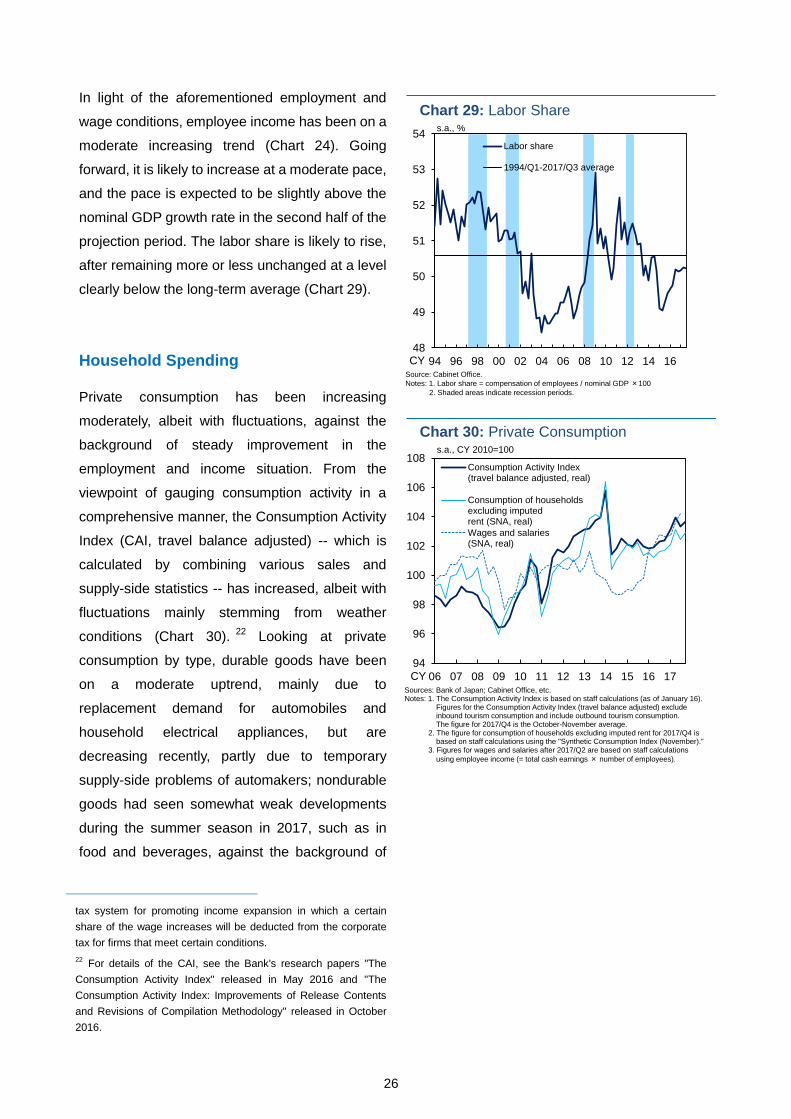
In light of the aforementioned employment and
wage conditions, employee income has been on a
moderate increasing trend (Chart 24). Going
forward, it is likely to increase at a moderate pace,
and the pace is expected to be slightly above the
nominal GDP growth rate in the second half of the
projection period. The labor share is likely to rise,
after remaining more or less unchanged at a level
clearly below the long-term average (Chart 29).
Household Spending
Private consumption has been increasing
moderately, albeit with fluctuations, against the
background of steady improvement in the
employment and income situation. From the
viewpoint of gauging consumption activity in a
comprehensive manner, the Consumption Activity
Index (CAI, travel balance adjusted) -- which is
calculated by combining various sales and
supply-side statistics -- has increased, albeit with
fluctuations mainly stemming from weather
conditions (Chart 30).22
Looking at private
consumption by type, durable goods have been
on a moderate uptrend, mainly due to
replacement demand for automobiles and
household electrical appliances, but are
decreasing recently, partly due to temporary
supply-side problems of automakers; nondurable
goods had seen somewhat weak developments
during the summer season in 2017, such as in
food and beverages, against the background of
tax system for promoting income expansion in which a certain
share of the wage increases will be deducted from the corporate
tax for firms that meet certain conditions. 22
For details of the CAI, see the Bank's research papers "The
Consumption Activity Index" released in May 2016 and "The
Consumption Activity Index: Improvements of Release Contents
and Revisions of Compilation Methodology" released in October
2016.
94
96
98
100
102
104
106
108
06 07 08 09 10 11 12 13 14 15 16 17
Consumption Activity Index(travel balance adjusted, real)
Consumption of householdsexcluding imputedrent (SNA, real)
Wages and salaries(SNA, real)
Chart 30: Private Consumptions.a., CY 2010=100
Sources: Bank of Japan; Cabinet Office, etc.Notes: 1. The Consumption Activity Index is based on staff calculations (as of January 16).
Figures for the Consumption Activity Index (travel balance adjusted) exclude inbound tourism consumption and include outbound tourism consumption.The figure for 2017/Q4 is the October-November average.
2. The figure for consumption of households excluding imputed rent for 2017/Q4 is based on staff calculations using the "Synthetic Consumption Index (November)."
3. Figures for wages and salaries after 2017/Q2 are based on staff calculations
using employee income (= total cash earnings × number of employees).
CY
48
49
50
51
52
53
54
94 96 98 00 02 04 06 08 10 12 14 16
Labor share
1994/Q1-2017/Q3 average
Chart 29: Labor Shares.a., %
CYSource: Cabinet Office.
Notes: 1. Labor share = compensation of employees / nominal GDP ×100
2. Shaded areas indicate recession periods.
27
irregular weather, but they have been picking up
recently. Meanwhile, services consumption has
maintained its moderate increasing trend, albeit
with fluctuations, reflecting a trend rise in
communications charges as well as medical,
health care and welfare fees.
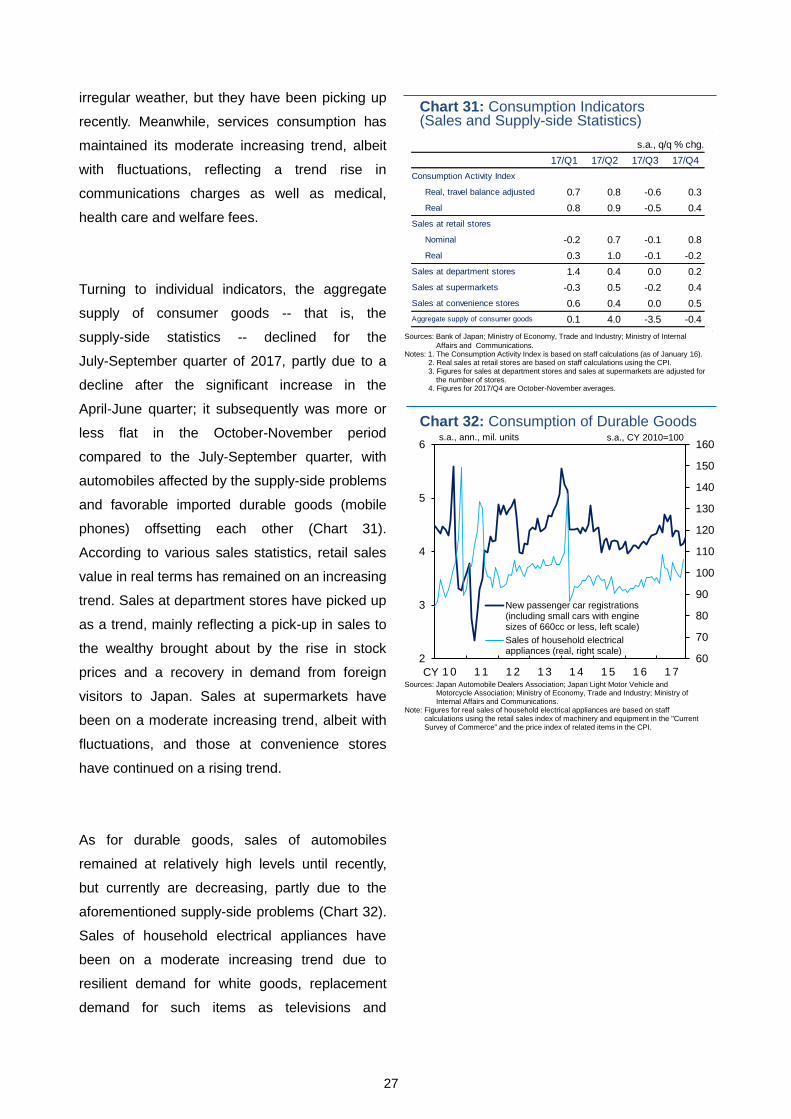
Turning to individual indicators, the aggregate
supply of consumer goods -- that is, the
supply-side statistics -- declined for the
July-September quarter of 2017, partly due to a
decline after the significant increase in the
April-June quarter; it subsequently was more or
less flat in the October-November period
compared to the July-September quarter, with
automobiles affected by the supply-side problems
and favorable imported durable goods (mobile
phones) offsetting each other (Chart 31).
According to various sales statistics, retail sales
value in real terms has remained on an increasing
trend. Sales at department stores have picked up
as a trend, mainly reflecting a pick-up in sales to
the wealthy brought about by the rise in stock
prices and a recovery in demand from foreign
visitors to Japan. Sales at supermarkets have
been on a moderate increasing trend, albeit with
fluctuations, and those at convenience stores
have continued on a rising trend.
As for durable goods, sales of automobiles
remained at relatively high levels until recently,
but currently are decreasing, partly due to the
aforementioned supply-side problems (Chart 32).
Sales of household electrical appliances have
been on a moderate increasing trend due to
resilient demand for white goods, replacement
demand for such items as televisions and
Chart 31: Consumption Indicators(Sales and Supply-side Statistics)
Sources: Bank of Japan; Ministry of Economy, Trade and Industry; Ministry of Internal
Affairs and Communications.Notes: 1. The Consumption Activity Index is based on staff calculations (as of January 16).
2. Real sales at retail stores are based on staff calculations using the CPI.3. Figures for sales at department stores and sales at supermarkets are adjusted for
the number of stores.4. Figures for 2017/Q4 are October-November averages.
(季節調整済、前期比、%) s.a., q/q % chg.
17/Q1 17/Q2 17/Q3 17/Q4
Real, travel balance adjusted 0.7 0.8 -0.6 0.3
Real 0.8 0.9 -0.5 0.4
Nominal -0.2 0.7 -0.1 0.8
Real 0.3 1.0 -0.1 -0.2
1.4 0.4 0.0 0.2
-0.3 0.5 -0.2 0.4
0.6 0.4 0.0 0.5
0.1 4.0 -3.5 -0.4 Aggregate supply of consumer goods
Sales at department stores
Sales at supermarkets
Sales at convenience stores
Consumption Activity Index
Sales at retail stores
60
70
80
90
100
110
120
130
140
150
160
2
3
4
5
6
1 0 1 1 1 2 1 3 1 4 1 5 1 6 1 7
New passenger car registrations(including small cars with enginesizes of 660cc or less, left scale)
Sales of household electricalappliances (real, right scale)
Chart 32: Consumption of Durable Goodss.a., ann., mil. units s.a., CY 2010=100
Sources: Japan Automobile Dealers Association; Japan Light Motor Vehicle and Motorcycle Association; Ministry of Economy, Trade and Industry; Ministry of Internal Affairs and Communications.
Note: Figures for real sales of household electrical appliances are based on staff calculations using the retail sales index of machinery and equipment in the "Current Survey of Commerce" and the price index of related items in the CPI.
CY
28
personal computers, and favorable sales of
mobile phones.
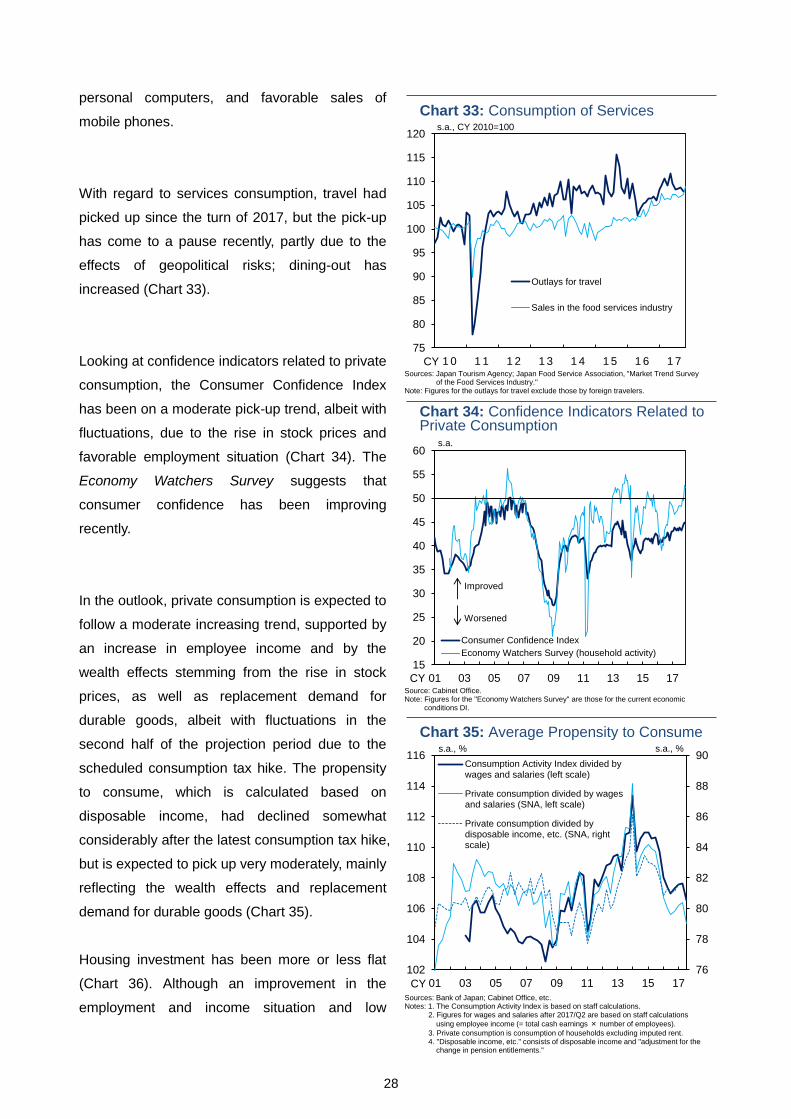
With regard to services consumption, travel had
picked up since the turn of 2017, but the pick-up
has come to a pause recently, partly due to the
effects of geopolitical risks; dining-out has
increased (Chart 33).
Looking at confidence indicators related to private
consumption, the Consumer Confidence Index
has been on a moderate pick-up trend, albeit with
fluctuations, due to the rise in stock prices and
favorable employment situation (Chart 34). The
Economy Watchers Survey suggests that
consumer confidence has been improving
recently.
In the outlook, private consumption is expected to
follow a moderate increasing trend, supported by
an increase in employee income and by the
wealth effects stemming from the rise in stock
prices, as well as replacement demand for
durable goods, albeit with fluctuations in the
second half of the projection period due to the
scheduled consumption tax hike. The propensity
to consume, which is calculated based on
disposable income, had declined somewhat
considerably after the latest consumption tax hike,
but is expected to pick up very moderately, mainly
reflecting the wealth effects and replacement
demand for durable goods (Chart 35).
Housing investment has been more or less flat
(Chart 36). Although an improvement in the
employment and income situation and low
75
80
85
90
95
100
105
110
115
120
1 0 1 1 1 2 1 3 1 4 1 5 1 6 1 7
Outlays for travel
Sales in the food services industry
Chart 33: Consumption of Servicess.a., CY 2010=100
Sources: Japan Tourism Agency; Japan Food Service Association, "Market Trend Survey of the Food Services Industry."
Note: Figures for the outlays for travel exclude those by foreign travelers.
CY
15
20
25
30
35
40
45
50
55
60
01 03 05 07 09 11 13 15 17
Consumer Confidence Index
Economy Watchers Survey (household activity)
Chart 34: Confidence Indicators Related to Private Consumption
s.a.
Source: Cabinet Office.Note: Figures for the "Economy Watchers Survey" are those for the current economic
conditions DI.
CY
Improved
Worsened
76
78
80
82
84
86
88
90
102
104
106
108
110
112
114
116
01 03 05 07 09 11 13 15 17
Consumption Activity Index divided bywages and salaries (left scale)
Private consumption divided by wagesand salaries (SNA, left scale)
Private consumption divided bydisposable income, etc. (SNA, rightscale)
Chart 35: Average Propensity to Consumes.a., % s.a., %
Sources: Bank of Japan; Cabinet Office, etc.Notes: 1. The Consumption Activity Index is based on staff calculations.
2. Figures for wages and salaries after 2017/Q2 are based on staff calculations
using employee income (= total cash earnings × number of employees).
3. Private consumption is consumption of households excluding imputed rent.4. "Disposable income, etc." consists of disposable income and "adjustment for the
change in pension entitlements."
CY
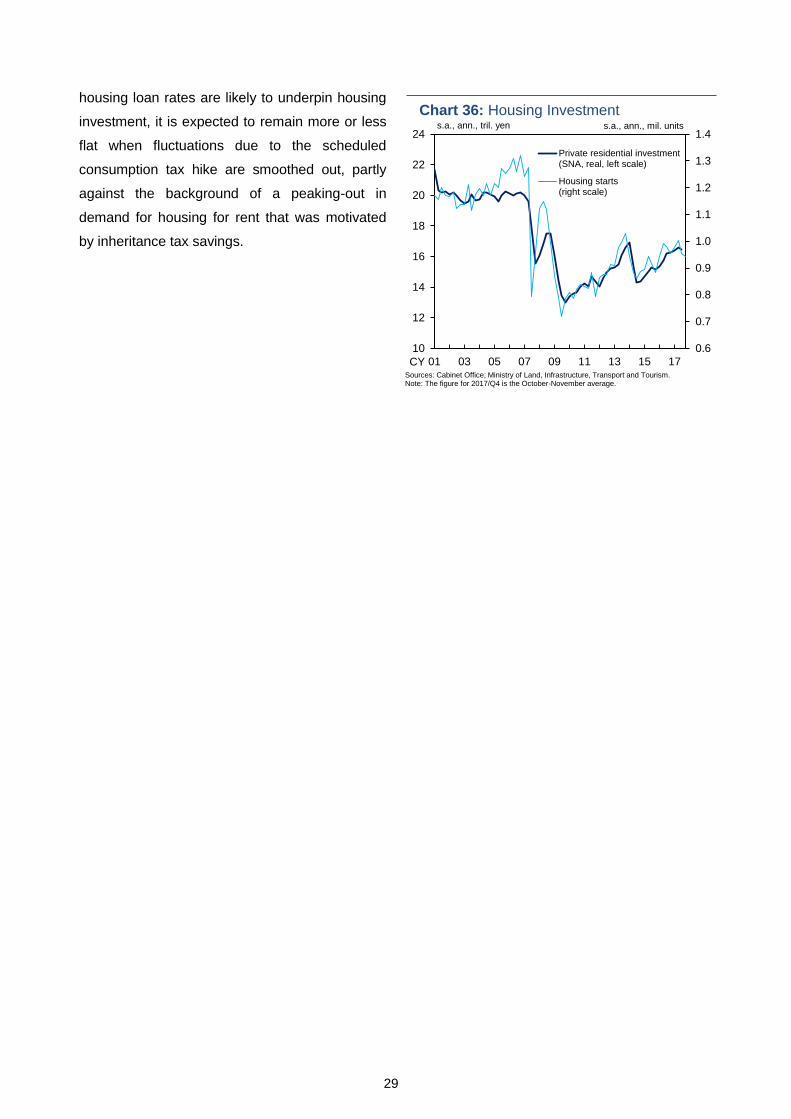
29
housing loan rates are likely to underpin housing
investment, it is expected to remain more or less
flat when fluctuations due to the scheduled
consumption tax hike are smoothed out, partly
against the background of a peaking-out in
demand for housing for rent that was motivated
by inheritance tax savings.
0.6
0.7
0.8
0.9
1.0
1.1
1.2
1.3
1.4
10
12
14
16
18
20
22
24
01 03 05 07 09 11 13 15 17
Private residential investment(SNA, real, left scale)
Housing starts(right scale)
Chart 36: Housing Investments.a., ann., tril. yen
CYSources: Cabinet Office; Ministry of Land, Infrastructure, Transport and Tourism.Note: The figure for 2017/Q4 is the October-November average.
s.a., ann., mil. units
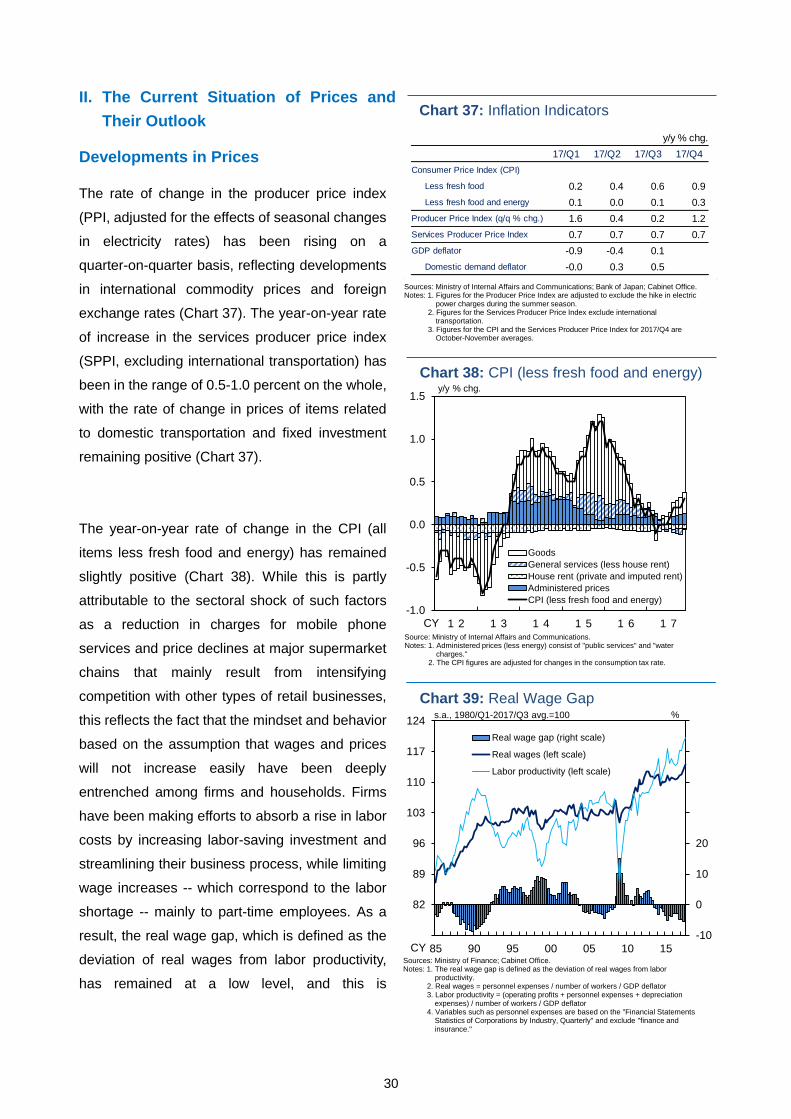
30
II. The Current Situation of Prices and
Their Outlook
Developments in Prices
The rate of change in the producer price index
(PPI, adjusted for the effects of seasonal changes
in electricity rates) has been rising on a
quarter-on-quarter basis, reflecting developments
in international commodity prices and foreign
exchange rates (Chart 37). The year-on-year rate
of increase in the services producer price index
(SPPI, excluding international transportation) has
been in the range of 0.5-1.0 percent on the whole,
with the rate of change in prices of items related
to domestic transportation and fixed investment
remaining positive (Chart 37).
The year-on-year rate of change in the CPI (all
items less fresh food and energy) has remained
slightly positive (Chart 38). While this is partly
attributable to the sectoral shock of such factors
as a reduction in charges for mobile phone
services and price declines at major supermarket
chains that mainly result from intensifying
competition with other types of retail businesses,
this reflects the fact that the mindset and behavior
based on the assumption that wages and prices
will not increase easily have been deeply
entrenched among firms and households. Firms
have been making efforts to absorb a rise in labor
costs by increasing labor-saving investment and
streamlining their business process, while limiting
wage increases -- which correspond to the labor
shortage -- mainly to part-time employees. As a
result, the real wage gap, which is defined as the
deviation of real wages from labor productivity,
has remained at a low level, and this is
Chart 37: Inflation Indicators
Sources: Ministry of Internal Affairs and Communications; Bank of Japan; Cabinet Office.Notes: 1. Figures for the Producer Price Index are adjusted to exclude the hike in electric
power charges during the summer season. 2. Figures for the Services Producer Price Index exclude international
transportation.3. Figures for the CPI and the Services Producer Price Index for 2017/Q4 are
October-November averages.
y/y % chg.
17/Q1 17/Q2 17/Q3 17/Q4
Less fresh food 0.2 0.4 0.6 0.9
Less fresh food and energy 0.1 0.0 0.1 0.3
1.6 0.4 0.2 1.2
0.7 0.7 0.7 0.7
-0.9 -0.4 0.1
Domestic demand deflator -0.0 0.3 0.5
Services Producer Price Index
GDP deflator
Consumer Price Index (CPI)
Producer Price Index (q/q % chg.)
-1.0
-0.5
0.0
0.5
1.0
1.5
1 2 1 3 1 4 1 5 1 6 1 7
Goods
General services (less house rent)
House rent (private and imputed rent)
Administered prices
CPI (less fresh food and energy)
Chart 38: CPI (less fresh food and energy)y/y % chg.
Source: Ministry of Internal Affairs and Communications.Notes: 1. Administered prices (less energy) consist of "public services" and "water
charges."2. The CPI figures are adjusted for changes in the consumption tax rate.
CY
-10
0
10
20
82
89
96
103
110
117
124
85 90 95 00 05 10 15
Real wage gap (right scale)
Real wages (left scale)
Labor productivity (left scale)
Sources: Ministry of Finance; Cabinet Office. Notes: 1. The real wage gap is defined as the deviation of real wages from labor
productivity.2. Real wages = personnel expenses / number of workers / GDP deflator3. Labor productivity = (operating profits + personnel expenses + depreciation
expenses) / number of workers / GDP deflator4. Variables such as personnel expenses are based on the "Financial Statements
Statistics of Corporations by Industry, Quarterly" and exclude "finance and insurance."
Chart 39: Real Wage Gap
CY
s.a., 1980/Q1-2017/Q3 avg.=100 %
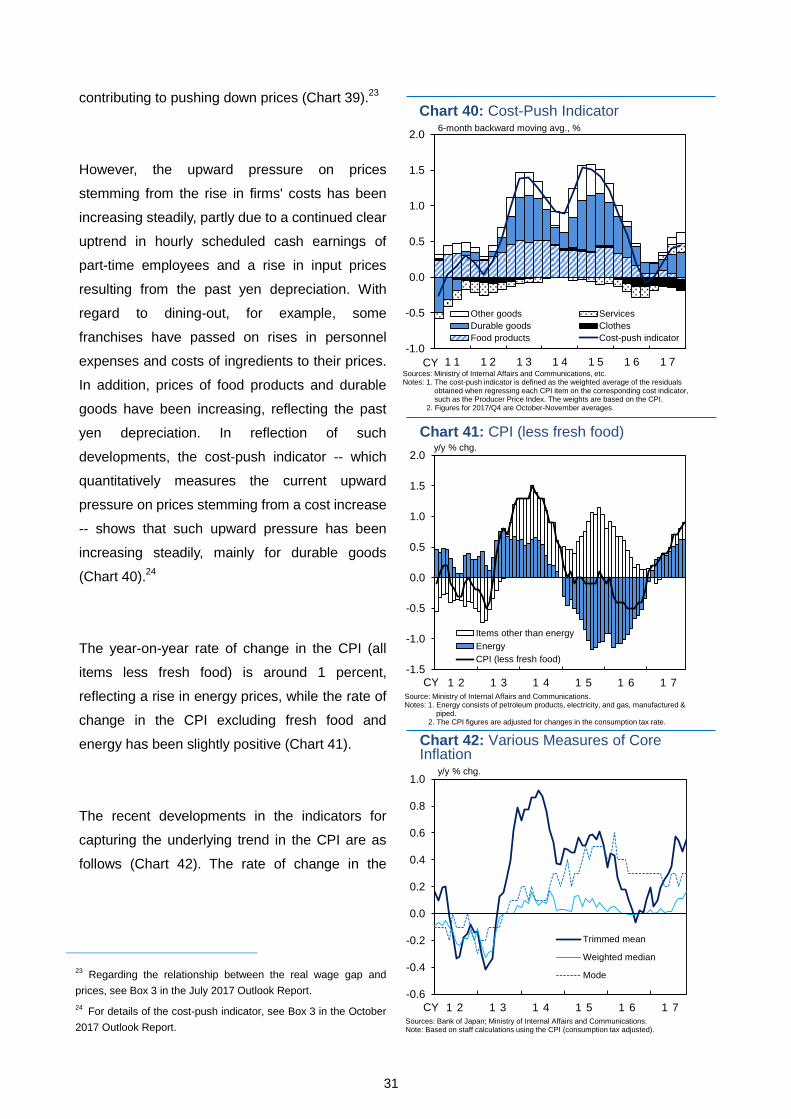
31
contributing to pushing down prices (Chart 39).23
However, the upward pressure on prices
stemming from the rise in firms' costs has been
increasing steadily, partly due to a continued clear
uptrend in hourly scheduled cash earnings of
part-time employees and a rise in input prices
resulting from the past yen depreciation. With
regard to dining-out, for example, some
franchises have passed on rises in personnel
expenses and costs of ingredients to their prices.
In addition, prices of food products and durable
goods have been increasing, reflecting the past
yen depreciation. In reflection of such
developments, the cost-push indicator -- which
quantitatively measures the current upward
pressure on prices stemming from a cost increase
-- shows that such upward pressure has been
increasing steadily, mainly for durable goods
(Chart 40).24
The year-on-year rate of change in the CPI (all
items less fresh food) is around 1 percent,
reflecting a rise in energy prices, while the rate of
change in the CPI excluding fresh food and
energy has been slightly positive (Chart 41).
The recent developments in the indicators for
capturing the underlying trend in the CPI are as
follows (Chart 42). The rate of change in the
23 Regarding the relationship between the real wage gap and
prices, see Box 3 in the July 2017 Outlook Report.
24 For details of the cost-push indicator, see Box 3 in the October
2017 Outlook Report.
-1.0
-0.5
0.0
0.5
1.0
1.5
2.0
1 1 1 2 1 3 1 4 1 5 1 6 1 7
Other goods Services
Durable goods Clothes
Food products Cost-push indicator
Sources: Ministry of Internal Affairs and Communications, etc.Notes: 1. The cost-push indicator is defined as the weighted average of the residuals
obtained when regressing each CPI item on the corresponding cost indicator, such as the Producer Price Index. The weights are based on the CPI.
2. Figures for 2017/Q4 are October-November averages.
Chart 40: Cost-Push Indicator6-month backward moving avg., %
CY
-1.5
-1.0
-0.5
0.0
0.5
1.0
1.5
2.0
1 2 1 3 1 4 1 5 1 6 1 7
Items other than energy
Energy
CPI (less fresh food)
Chart 41: CPI (less fresh food)y/y % chg.
Source: Ministry of Internal Affairs and Communications.Notes: 1. Energy consists of petroleum products, electricity, and gas, manufactured &
piped.2. The CPI figures are adjusted for changes in the consumption tax rate.
CY
-0.6
-0.4
-0.2
0.0
0.2
0.4
0.6
0.8
1.0
1 2 1 3 1 4 1 5 1 6 1 7
Trimmed mean
Weighted median
Mode
Chart 42: Various Measures of Core Inflation
y/y % chg.
Sources: Bank of Japan; Ministry of Internal Affairs and Communications.Note: Based on staff calculations using the CPI (consumption tax adjusted).
CY
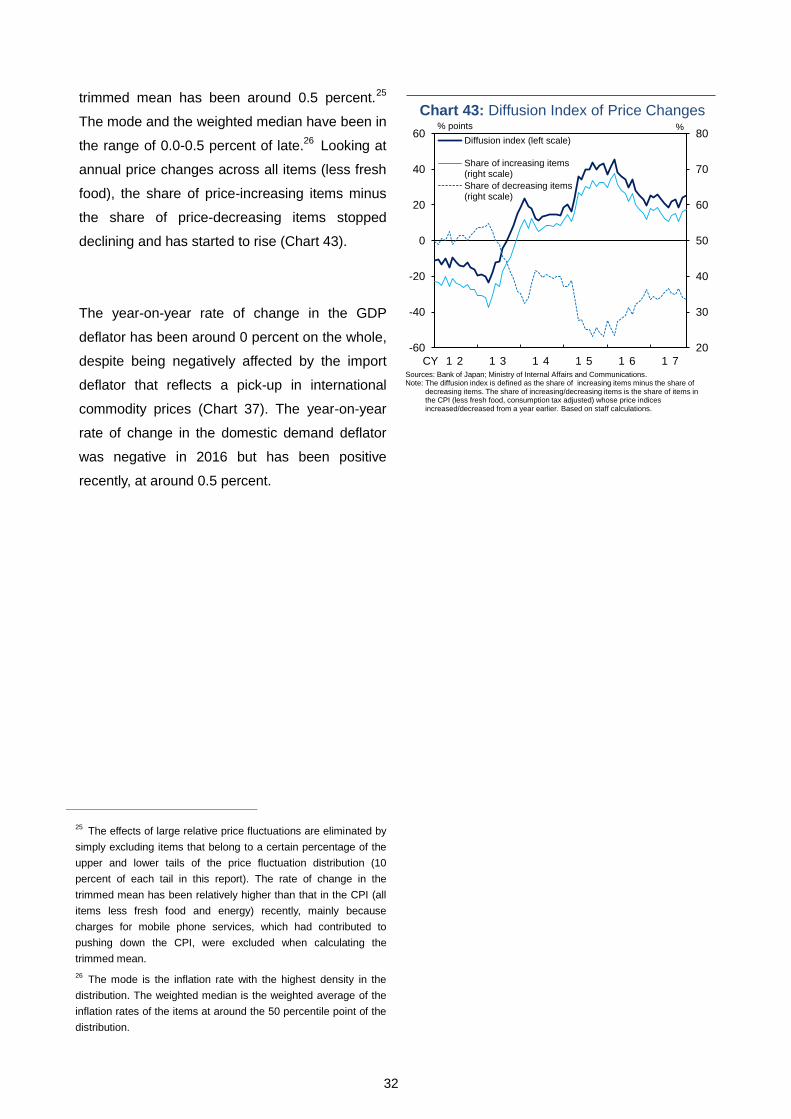
32
trimmed mean has been around 0.5 percent.25
The mode and the weighted median have been in
the range of 0.0-0.5 percent of late.26
Looking at
annual price changes across all items (less fresh
food), the share of price-increasing items minus
the share of price-decreasing items stopped
declining and has started to rise (Chart 43).
The year-on-year rate of change in the GDP
deflator has been around 0 percent on the whole,
despite being negatively affected by the import
deflator that reflects a pick-up in international
commodity prices (Chart 37). The year-on-year
rate of change in the domestic demand deflator
was negative in 2016 but has been positive
recently, at around 0.5 percent.
25 The effects of large relative price fluctuations are eliminated by
simply excluding items that belong to a certain percentage of the
upper and lower tails of the price fluctuation distribution (10
percent of each tail in this report). The rate of change in the
trimmed mean has been relatively higher than that in the CPI (all
items less fresh food and energy) recently, mainly because
charges for mobile phone services, which had contributed to
pushing down the CPI, were excluded when calculating the
trimmed mean.
26 The mode is the inflation rate with the highest density in the
distribution. The weighted median is the weighted average of the
inflation rates of the items at around the 50 percentile point of the
distribution.
20
30
40
50
60
70
80
-60
-40
-20
0
20
40
60
1 2 1 3 1 4 1 5 1 6 1 7
Diffusion index (left scale)
Share of increasing items(right scale)
Share of decreasing items(right scale)
Chart 43: Diffusion Index of Price Changes% points %
Sources: Bank of Japan; Ministry of Internal Affairs and Communications.Note: The diffusion index is defined as the share of increasing items minus the share of
decreasing items. The share of increasing/decreasing items is the share of items in the CPI (less fresh food, consumption tax adjusted) whose price indices increased/decreased from a year earlier. Based on staff calculations.
CY
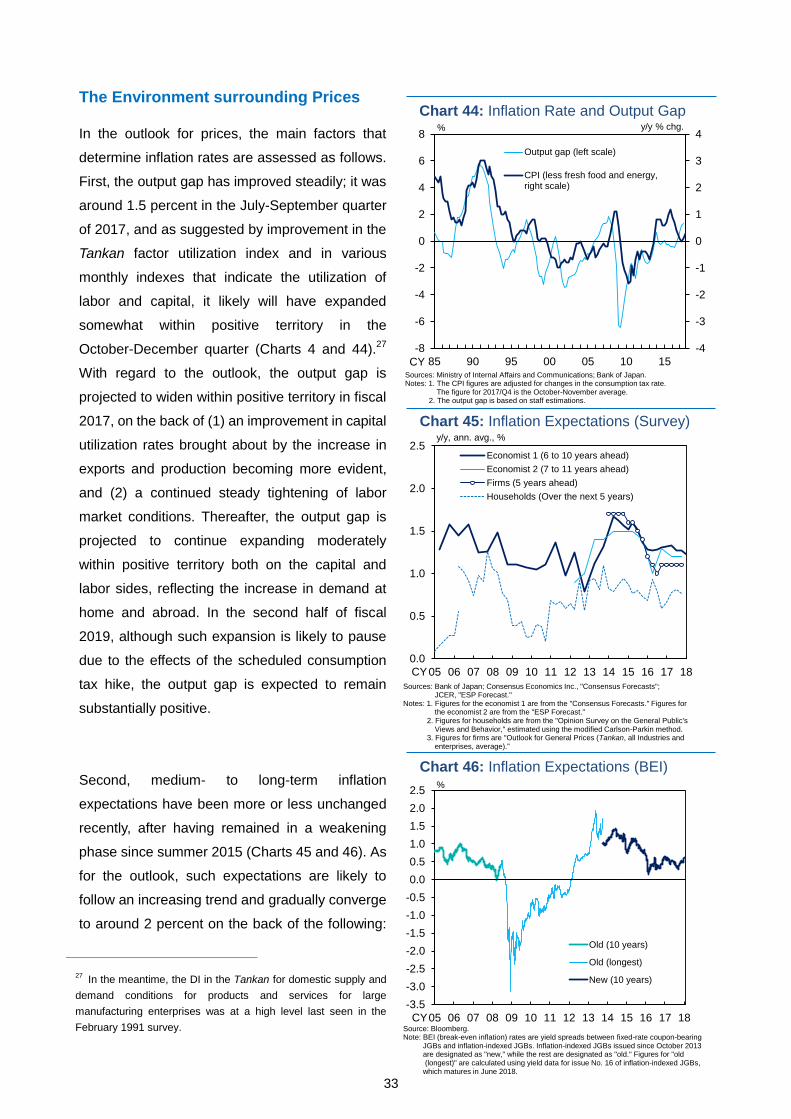
33
The Environment surrounding Prices
In the outlook for prices, the main factors that
determine inflation rates are assessed as follows.
First, the output gap has improved steadily; it was
around 1.5 percent in the July-September quarter
of 2017, and as suggested by improvement in the
Tankan factor utilization index and in various
monthly indexes that indicate the utilization of
labor and capital, it likely will have expanded
somewhat within positive territory in the
October-December quarter (Charts 4 and 44).27
With regard to the outlook, the output gap is
projected to widen within positive territory in fiscal
2017, on the back of (1) an improvement in capital
utilization rates brought about by the increase in
exports and production becoming more evident,
and (2) a continued steady tightening of labor
market conditions. Thereafter, the output gap is
projected to continue expanding moderately
within positive territory both on the capital and
labor sides, reflecting the increase in demand at
home and abroad. In the second half of fiscal
2019, although such expansion is likely to pause
due to the effects of the scheduled consumption
tax hike, the output gap is expected to remain
substantially positive.
Second, medium- to long-term inflation
expectations have been more or less unchanged
recently, after having remained in a weakening
phase since summer 2015 (Charts 45 and 46). As
for the outlook, such expectations are likely to
follow an increasing trend and gradually converge
to around 2 percent on the back of the following:
27 In the meantime, the DI in the Tankan for domestic supply and
demand conditions for products and services for large
manufacturing enterprises was at a high level last seen in the
February 1991 survey.
-4
-3
-2
-1
0
1
2
3
4
-8
-6
-4
-2
0
2
4
6
8
85 90 95 00 05 10 15
Output gap (left scale)
CPI (less fresh food and energy,right scale)
Chart 44: Inflation Rate and Output Gapy/y % chg.%
Sources: Ministry of Internal Affairs and Communications; Bank of Japan.Notes: 1. The CPI figures are adjusted for changes in the consumption tax rate.
The figure for 2017/Q4 is the October-November average.2. The output gap is based on staff estimations.
CY
0.0
0.5
1.0
1.5
2.0
2.5
05 06 07 08 09 10 11 12 13 14 15 16 17 18
Economist 1 (6 to 10 years ahead)
Economist 2 (7 to 11 years ahead)
Firms (5 years ahead)
Households (Over the next 5 years)
Sources: Bank of Japan; Consensus Economics Inc., "Consensus Forecasts"; JCER, "ESP Forecast."
Notes: 1. Figures for the economist 1 are from the "Consensus Forecasts." Figures for the economist 2 are from the "ESP Forecast."
2. Figures for households are from the "Opinion Survey on the General Public's Views and Behavior," estimated using the modified Carlson-Parkin method.
3. Figures for firms are "Outlook for General Prices (Tankan, all Industries and enterprises, average)."
Chart 45: Inflation Expectations (Survey) y/y, ann. avg., %
CY
-3.5
-3.0
-2.5
-2.0
-1.5
-1.0
-0.5
0.0
0.5
1.0
1.5
2.0
2.5
05 06 07 08 09 10 11 12 13 14 15 16 17 18
Old (10 years)
Old (longest)
New (10 years)
Source: Bloomberg.Note: BEI (break-even inflation) rates are yield spreads between fixed-rate coupon-bearing
JGBs and inflation-indexed JGBs. Inflation-indexed JGBs issued since October 2013are designated as "new," while the rest are designated as "old." Figures for "old(longest)" are calculated using yield data for issue No. 16 of inflation-indexed JGBs,
which matures in June 2018.
Chart 46: Inflation Expectations (BEI)
CY
%
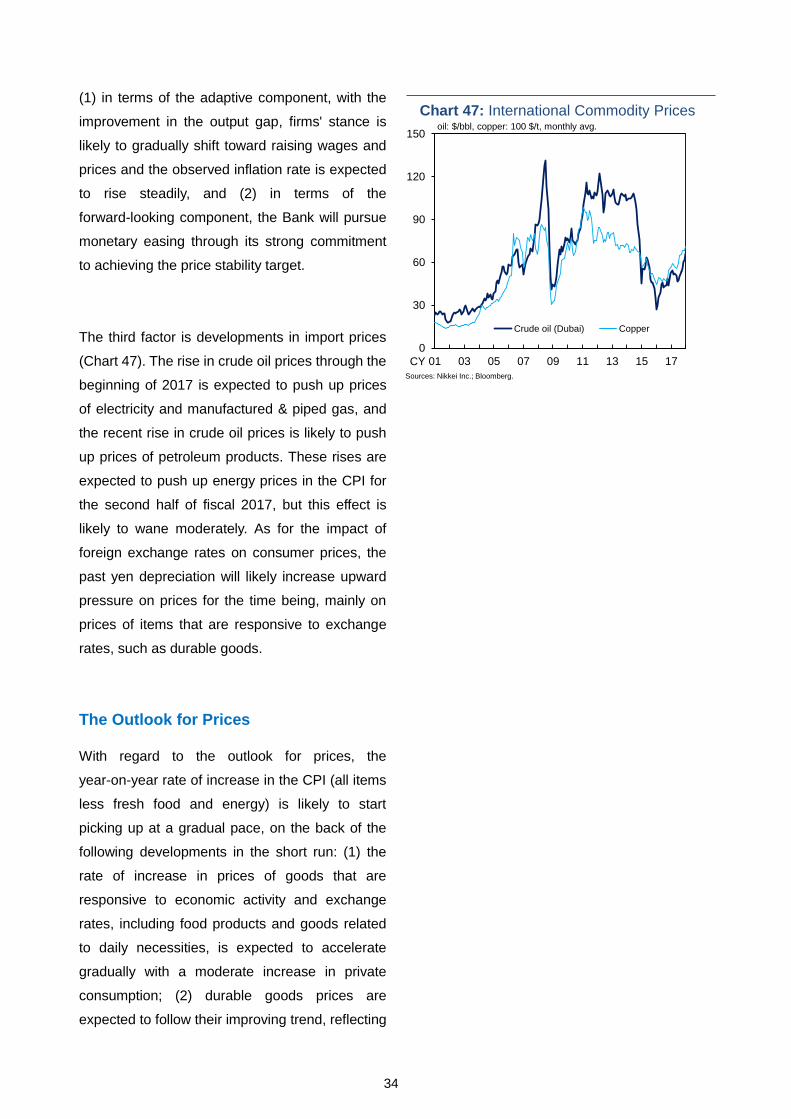
34
(1) in terms of the adaptive component, with the
improvement in the output gap, firms' stance is
likely to gradually shift toward raising wages and
prices and the observed inflation rate is expected
to rise steadily, and (2) in terms of the
forward-looking component, the Bank will pursue
monetary easing through its strong commitment
to achieving the price stability target.
The third factor is developments in import prices
(Chart 47). The rise in crude oil prices through the
beginning of 2017 is expected to push up prices
of electricity and manufactured & piped gas, and
the recent rise in crude oil prices is likely to push
up prices of petroleum products. These rises are
expected to push up energy prices in the CPI for
the second half of fiscal 2017, but this effect is
likely to wane moderately. As for the impact of
foreign exchange rates on consumer prices, the
past yen depreciation will likely increase upward
pressure on prices for the time being, mainly on
prices of items that are responsive to exchange
rates, such as durable goods.
The Outlook for Prices
With regard to the outlook for prices, the
year-on-year rate of increase in the CPI (all items
less fresh food and energy) is likely to start
picking up at a gradual pace, on the back of the
following developments in the short run: (1) the
rate of increase in prices of goods that are
responsive to economic activity and exchange
rates, including food products and goods related
to daily necessities, is expected to accelerate
gradually with a moderate increase in private
consumption; (2) durable goods prices are
expected to follow their improving trend, reflecting
0
30
60
90
120
150
01 03 05 07 09 11 13 15 17
Crude oil (Dubai) Copper
Chart 47: International Commodity Pricesoil: $/bbl, copper: 100 $/t, monthly avg.
CY
Sources: Nikkei Inc.; Bloomberg.
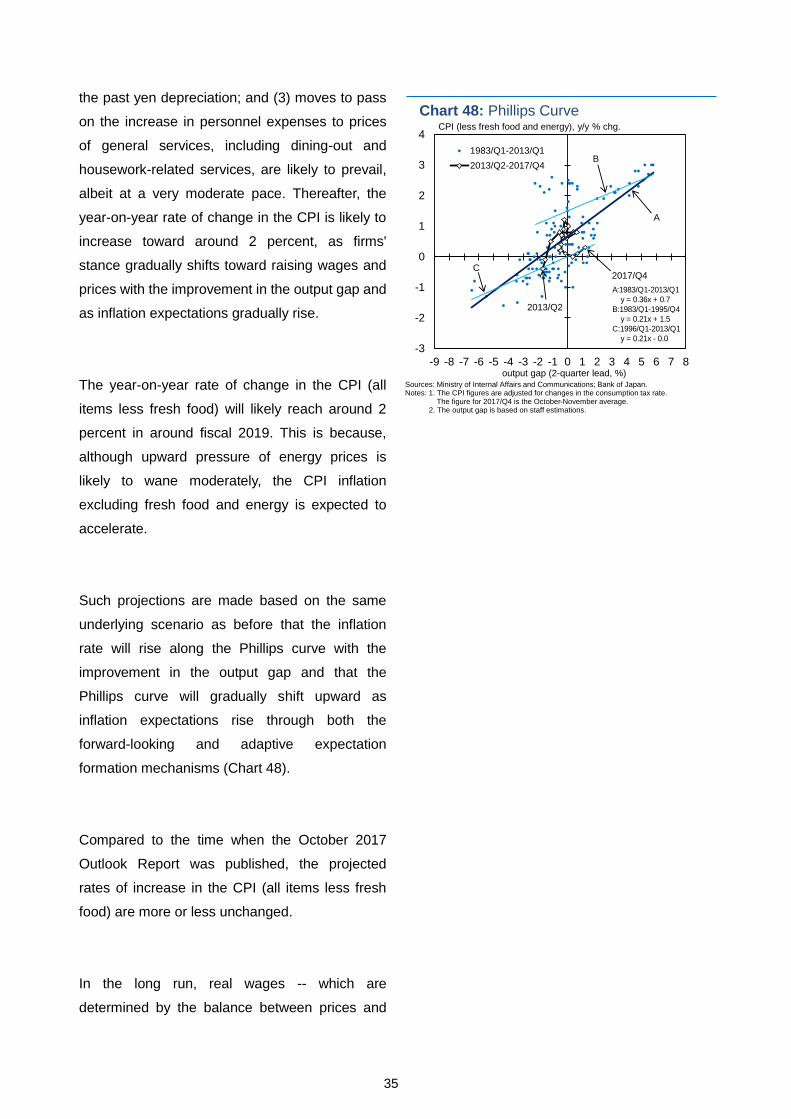
35
the past yen depreciation; and (3) moves to pass
on the increase in personnel expenses to prices
of general services, including dining-out and
housework-related services, are likely to prevail,
albeit at a very moderate pace. Thereafter, the
year-on-year rate of change in the CPI is likely to
increase toward around 2 percent, as firms'
stance gradually shifts toward raising wages and
prices with the improvement in the output gap and
as inflation expectations gradually rise.
The year-on-year rate of change in the CPI (all
items less fresh food) will likely reach around 2
percent in around fiscal 2019. This is because,
although upward pressure of energy prices is
likely to wane moderately, the CPI inflation
excluding fresh food and energy is expected to
accelerate.
Such projections are made based on the same
underlying scenario as before that the inflation
rate will rise along the Phillips curve with the
improvement in the output gap and that the
Phillips curve will gradually shift upward as
inflation expectations rise through both the
forward-looking and adaptive expectation
formation mechanisms (Chart 48).
Compared to the time when the October 2017
Outlook Report was published, the projected
rates of increase in the CPI (all items less fresh
food) are more or less unchanged.
In the long run, real wages -- which are
determined by the balance between prices and
-3
-2
-1
0
1
2
3
4
-9 -8 -7 -6 -5 -4 -3 -2 -1 0 1 2 3 4 5 6 7 8
1983/Q1-2013/Q1
2013/Q2-2017/Q4
A:1983/Q1-2013/Q1
y = 0.36x + 0.7
B:1983/Q1-1995/Q4
y = 0.21x + 1.5
C:1996/Q1-2013/Q1
y = 0.21x - 0.0
Chart 48: Phillips CurveCPI (less fresh food and energy), y/y % chg.
output gap (2-quarter lead, %)
A
B
C
2013/Q2
2017/Q4
Sources: Ministry of Internal Affairs and Communications; Bank of Japan.Notes: 1. The CPI figures are adjusted for changes in the consumption tax rate.
The figure for 2017/Q4 is the October-November average.2. The output gap is based on staff estimations.
36
nominal wages -- will be consistent with labor
productivity (Chart 39). Under the baseline
scenario, the rate of increase in real wages is
expected to accelerate gradually, catching up with
the improvement in labor productivity. That is, with
corporate profits at record high levels, the rate of
increase in nominal wages is projected to outpace
that in the CPI, reflecting tight labor market
conditions. Such a rise in real wages is likely to
increase consumption through an improvement in
household income, which will contribute to a rise
in the CPI.
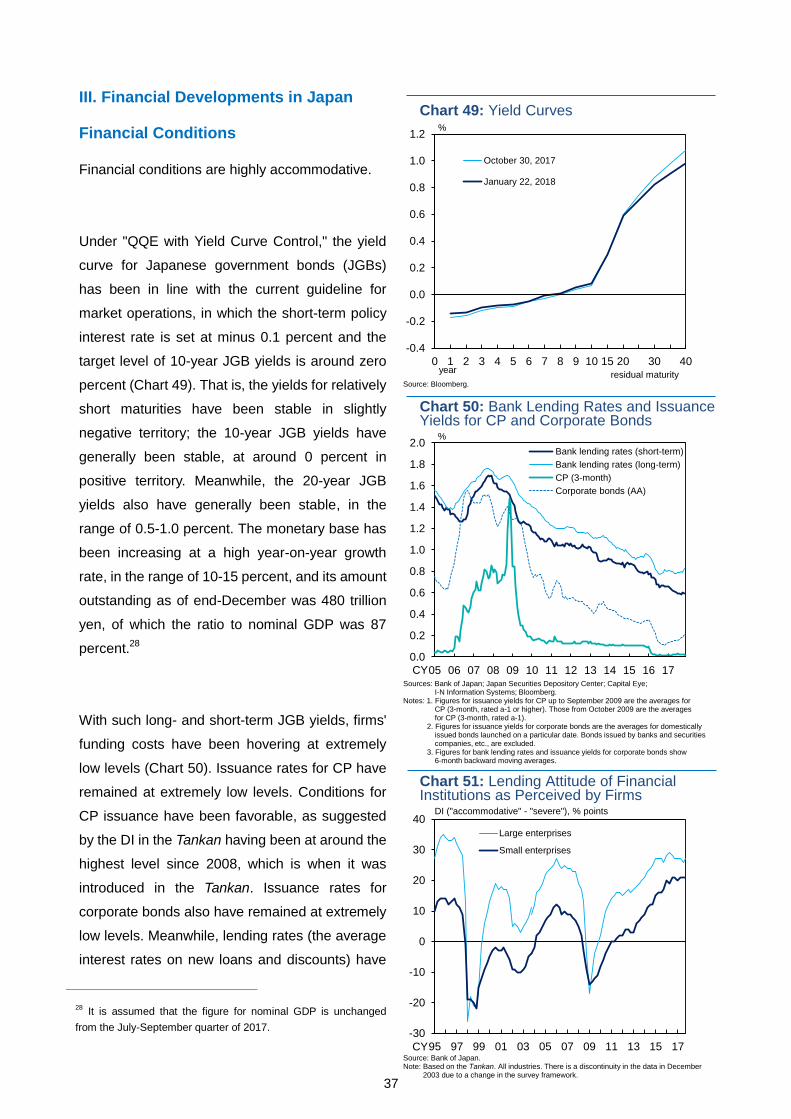
37
III. Financial Developments in Japan
Financial Conditions
Financial conditions are highly accommodative.
Under "QQE with Yield Curve Control," the yield
curve for Japanese government bonds (JGBs)
has been in line with the current guideline for
market operations, in which the short-term policy
interest rate is set at minus 0.1 percent and the
target level of 10-year JGB yields is around zero
percent (Chart 49). That is, the yields for relatively
short maturities have been stable in slightly
negative territory; the 10-year JGB yields have
generally been stable, at around 0 percent in
positive territory. Meanwhile, the 20-year JGB
yields also have generally been stable, in the
range of 0.5-1.0 percent. The monetary base has
been increasing at a high year-on-year growth
rate, in the range of 10-15 percent, and its amount
outstanding as of end-December was 480 trillion
yen, of which the ratio to nominal GDP was 87
percent.28
With such long- and short-term JGB yields, firms'
funding costs have been hovering at extremely
low levels (Chart 50). Issuance rates for CP have
remained at extremely low levels. Conditions for
CP issuance have been favorable, as suggested
by the DI in the Tankan having been at around the
highest level since 2008, which is when it was
introduced in the Tankan. Issuance rates for
corporate bonds also have remained at extremely
low levels. Meanwhile, lending rates (the average
interest rates on new loans and discounts) have
28 It is assumed that the figure for nominal GDP is unchanged
from the July-September quarter of 2017.
0.0
0.2
0.4
0.6
0.8
1.0
1.2
1.4
1.6
1.8
2.0
05 06 07 08 09 10 11 12 13 14 15 16 17
Bank lending rates (short-term)
Bank lending rates (long-term)
CP (3-month)
Corporate bonds (AA)
Chart 50: Bank Lending Rates and IssuanceYields for CP and Corporate Bonds
Sources: Bank of Japan; Japan Securities Depository Center; Capital Eye; I-N Information Systems; Bloomberg.
Notes: 1. Figures for issuance yields for CP up to September 2009 are the averages for CP (3-month, rated a-1 or higher). Those from October 2009 are the averages for CP (3-month, rated a-1).
2. Figures for issuance yields for corporate bonds are the averages for domestically issued bonds launched on a particular date. Bonds issued by banks and securitiescompanies, etc., are excluded.
3. Figures for bank lending rates and issuance yields for corporate bonds show6-month backward moving averages.
CY
%
-30
-20
-10
0
10
20
30
40
95 97 99 01 03 05 07 09 11 13 15 17
Large enterprises
Small enterprises
Source: Bank of Japan.Note: Based on the Tankan. All industries. There is a discontinuity in the data in December
2003 due to a change in the survey framework.
Chart 51: Lending Attitude of FinancialInstitutions as Perceived by Firms
DI ("accommodative" - "severe"), % points
CY
-0.4
-0.2
0.0
0.2
0.4
0.6
0.8
1.0
1.2
0 1 2 3 4 5 6 7 8 9 10 15 20 30 40
October 30, 2017
January 22, 2018
Source: Bloomberg.
Chart 49: Yield Curves
year
%
residual maturity
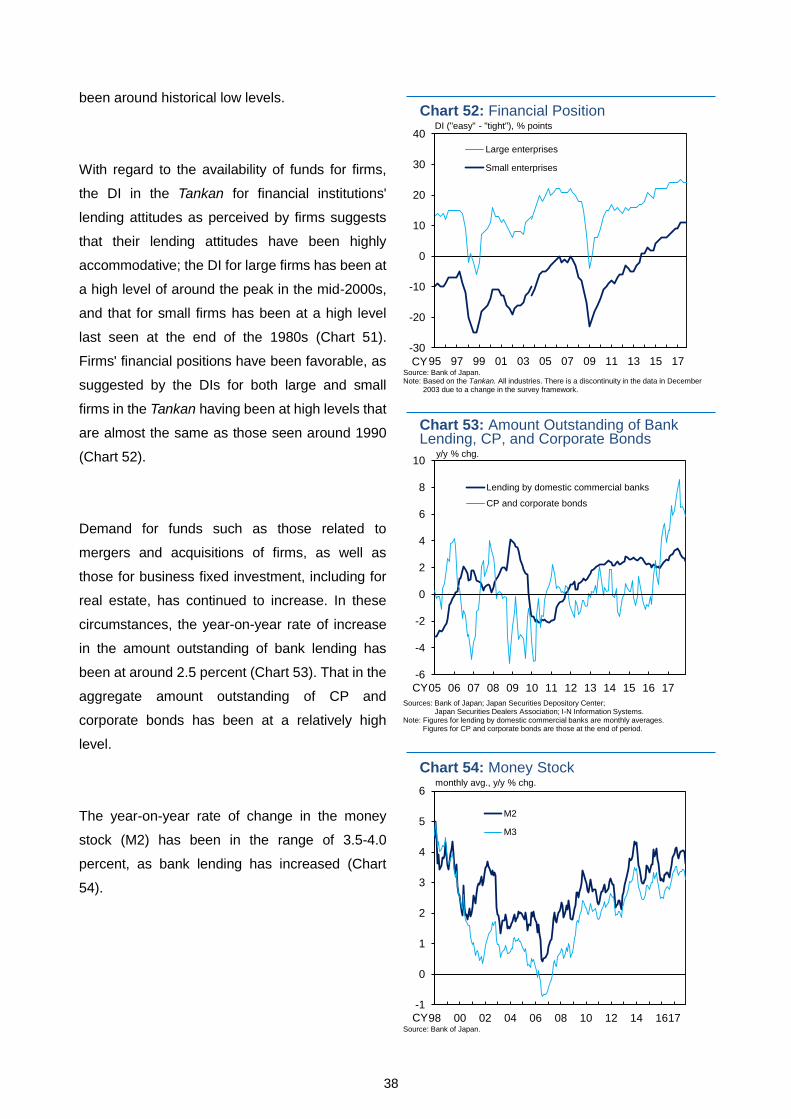
38
been around historical low levels.
With regard to the availability of funds for firms,
the DI in the Tankan for financial institutions'
lending attitudes as perceived by firms suggests
that their lending attitudes have been highly
accommodative; the DI for large firms has been at
a high level of around the peak in the mid-2000s,
and that for small firms has been at a high level
last seen at the end of the 1980s (Chart 51).
Firms' financial positions have been favorable, as
suggested by the DIs for both large and small
firms in the Tankan having been at high levels that
are almost the same as those seen around 1990
(Chart 52).
Demand for funds such as those related to
mergers and acquisitions of firms, as well as
those for business fixed investment, including for
real estate, has continued to increase. In these
circumstances, the year-on-year rate of increase
in the amount outstanding of bank lending has
been at around 2.5 percent (Chart 53). That in the
aggregate amount outstanding of CP and
corporate bonds has been at a relatively high
level.
The year-on-year rate of change in the money
stock (M2) has been in the range of 3.5-4.0
percent, as bank lending has increased (Chart
54).
-30
-20
-10
0
10
20
30
40
95 97 99 01 03 05 07 09 11 13 15 17
Large enterprises
Small enterprises
Source: Bank of Japan.Note: Based on the Tankan. All industries. There is a discontinuity in the data in December
2003 due to a change in the survey framework.
Chart 52: Financial Position DI ("easy" - "tight"), % points
CY
-6
-4
-2
0
2
4
6
8
10
05 06 07 08 09 10 11 12 13 14 15 16 17
Lending by domestic commercial banks
CP and corporate bonds
Chart 53: Amount Outstanding of BankLending, CP, and Corporate Bonds
Sources: Bank of Japan; Japan Securities Depository Center; Japan Securities Dealers Association; I-N Information Systems.
Note: Figures for lending by domestic commercial banks are monthly averages. Figures for CP and corporate bonds are those at the end of period.
CY
y/y % chg.
-1
0
1
2
3
4
5
6
98 00 02 04 06 08 10 12 14 1617
M2
M3
Source: Bank of Japan.
Chart 54: Money Stock
CY
monthly avg., y/y % chg.
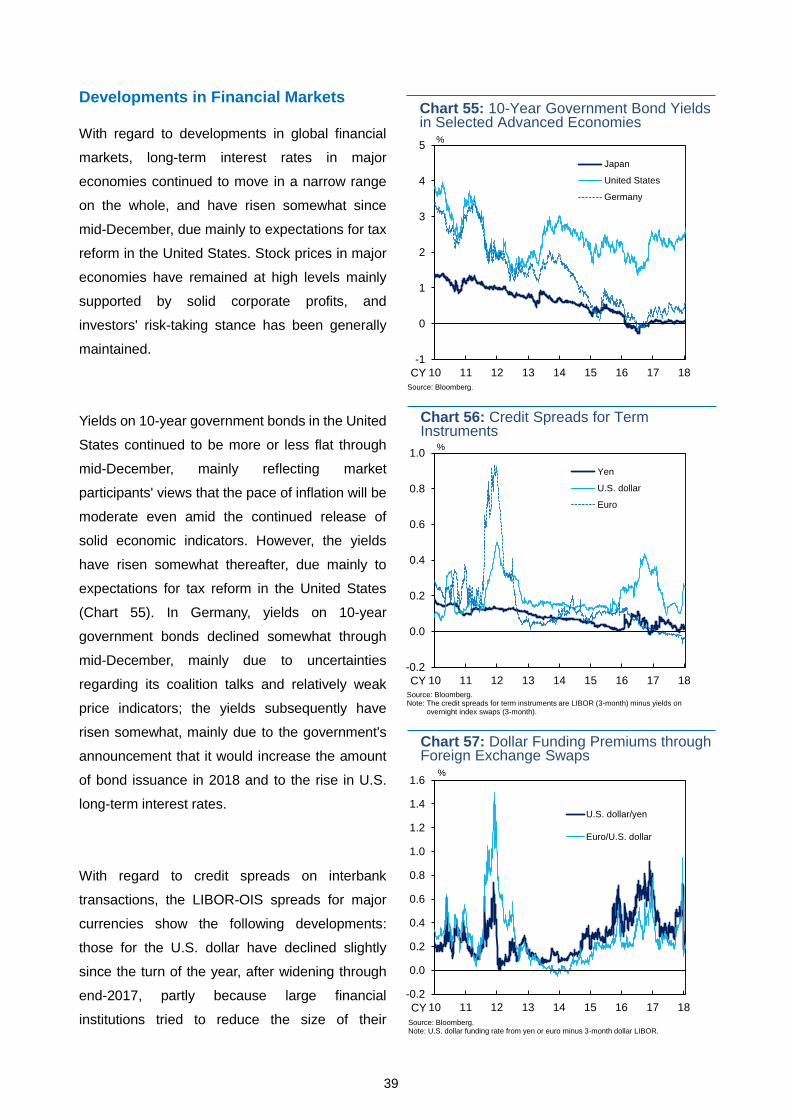
39
Developments in Financial Markets
With regard to developments in global financial
markets, long-term interest rates in major
economies continued to move in a narrow range
on the whole, and have risen somewhat since
mid-December, due mainly to expectations for tax
reform in the United States. Stock prices in major
economies have remained at high levels mainly
supported by solid corporate profits, and
investors' risk-taking stance has been generally
maintained.
Yields on 10-year government bonds in the United
States continued to be more or less flat through
mid-December, mainly reflecting market
participants' views that the pace of inflation will be
moderate even amid the continued release of
solid economic indicators. However, the yields
have risen somewhat thereafter, due mainly to
expectations for tax reform in the United States
(Chart 55). In Germany, yields on 10-year
government bonds declined somewhat through
mid-December, mainly due to uncertainties
regarding its coalition talks and relatively weak
price indicators; the yields subsequently have
risen somewhat, mainly due to the government's
announcement that it would increase the amount
of bond issuance in 2018 and to the rise in U.S.
long-term interest rates.
With regard to credit spreads on interbank
transactions, the LIBOR-OIS spreads for major
currencies show the following developments:
those for the U.S. dollar have declined slightly
since the turn of the year, after widening through
end-2017, partly because large financial
institutions tried to reduce the size of their
-1
0
1
2
3
4
5
10 11 12 13 14 15 16 17 18
Japan
United States
Germany
Source: Bloomberg.
%
CY
Chart 55: 10-Year Government Bond Yields in Selected Advanced Economies
-0.2
0.0
0.2
0.4
0.6
0.8
1.0
10 11 12 13 14 15 16 17 18
Yen
U.S. dollar
Euro
Source: Bloomberg.Note: The credit spreads for term instruments are LIBOR (3-month) minus yields on Ne: overnight index swaps (3-month).
Chart 56: Credit Spreads for Term Instruments
CY
%
-0.2
0.0
0.2
0.4
0.6
0.8
1.0
1.2
1.4
1.6
10 11 12 13 14 15 16 17 18
U.S. dollar/yen
Euro/U.S. dollar
Source: Bloomberg.Note: U.S. dollar funding rate from yen or euro minus 3-month dollar LIBOR.
Chart 57: Dollar Funding Premiums through Foreign Exchange Swaps
CY
%
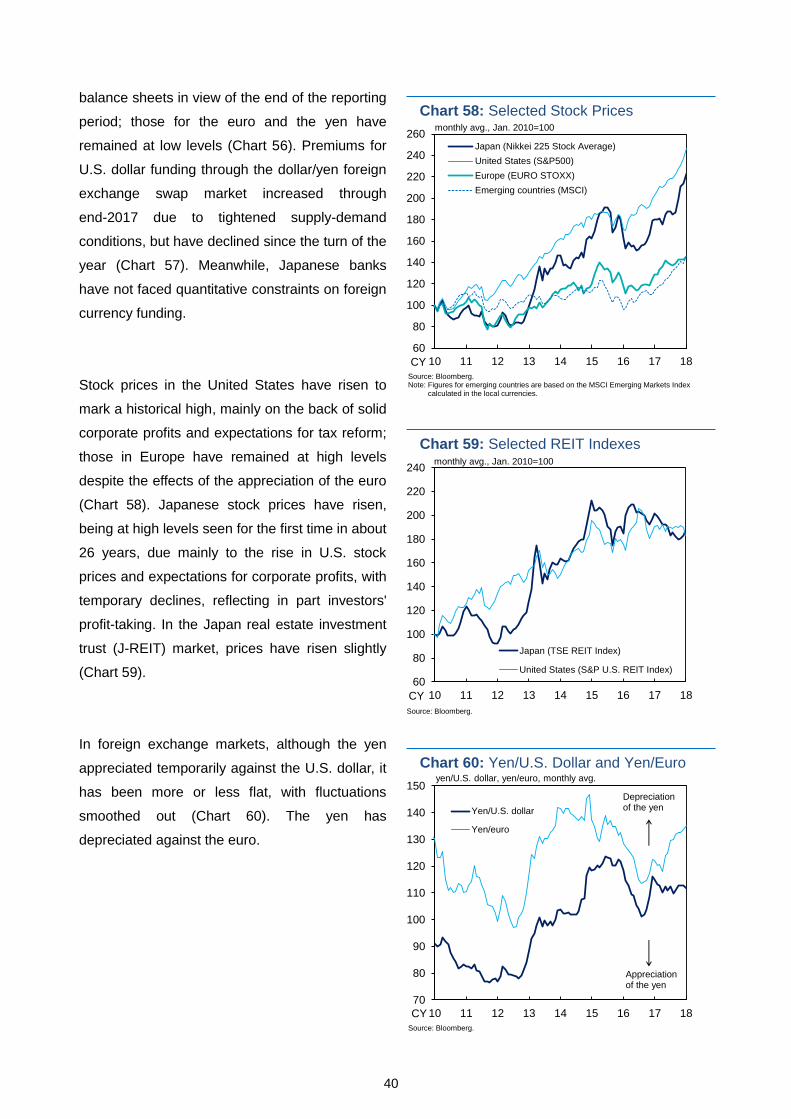
40
balance sheets in view of the end of the reporting
period; those for the euro and the yen have
remained at low levels (Chart 56). Premiums for
U.S. dollar funding through the dollar/yen foreign
exchange swap market increased through
end-2017 due to tightened supply-demand
conditions, but have declined since the turn of the
year (Chart 57). Meanwhile, Japanese banks
have not faced quantitative constraints on foreign
currency funding.
Stock prices in the United States have risen to
mark a historical high, mainly on the back of solid
corporate profits and expectations for tax reform;
those in Europe have remained at high levels
despite the effects of the appreciation of the euro
(Chart 58). Japanese stock prices have risen,
being at high levels seen for the first time in about
26 years, due mainly to the rise in U.S. stock
prices and expectations for corporate profits, with
temporary declines, reflecting in part investors'
profit-taking. In the Japan real estate investment
trust (J-REIT) market, prices have risen slightly
(Chart 59).
In foreign exchange markets, although the yen
appreciated temporarily against the U.S. dollar, it
has been more or less flat, with fluctuations
smoothed out (Chart 60). The yen has
depreciated against the euro.
60
80
100
120
140
160
180
200
220
240
260
10 11 12 13 14 15 16 17 18
Japan (Nikkei 225 Stock Average)
United States (S&P500)
Europe (EURO STOXX)
Emerging countries (MSCI)
Source: Bloomberg.Note: Figures for emerging countries are based on the MSCI Emerging Markets IndexNo t calculated in the local currencies.
Chart 58: Selected Stock Prices
CY
monthly avg., Jan. 2010=100
60
80
100
120
140
160
180
200
220
240
10 11 12 13 14 15 16 17 18
Japan (TSE REIT Index)
United States (S&P U.S. REIT Index)
Source: Bloomberg.
Chart 59: Selected REIT Indexes
CY
monthly avg., Jan. 2010=100
70
80
90
100
110
120
130
140
150
10 11 12 13 14 15 16 17 18
Yen/U.S. dollar
Yen/euro
Source: Bloomberg.
Chart 60: Yen/U.S. Dollar and Yen/Euro
Depreciationof the yen
Appreciationof the yen
yen/U.S. dollar, yen/euro, monthly avg.
CY
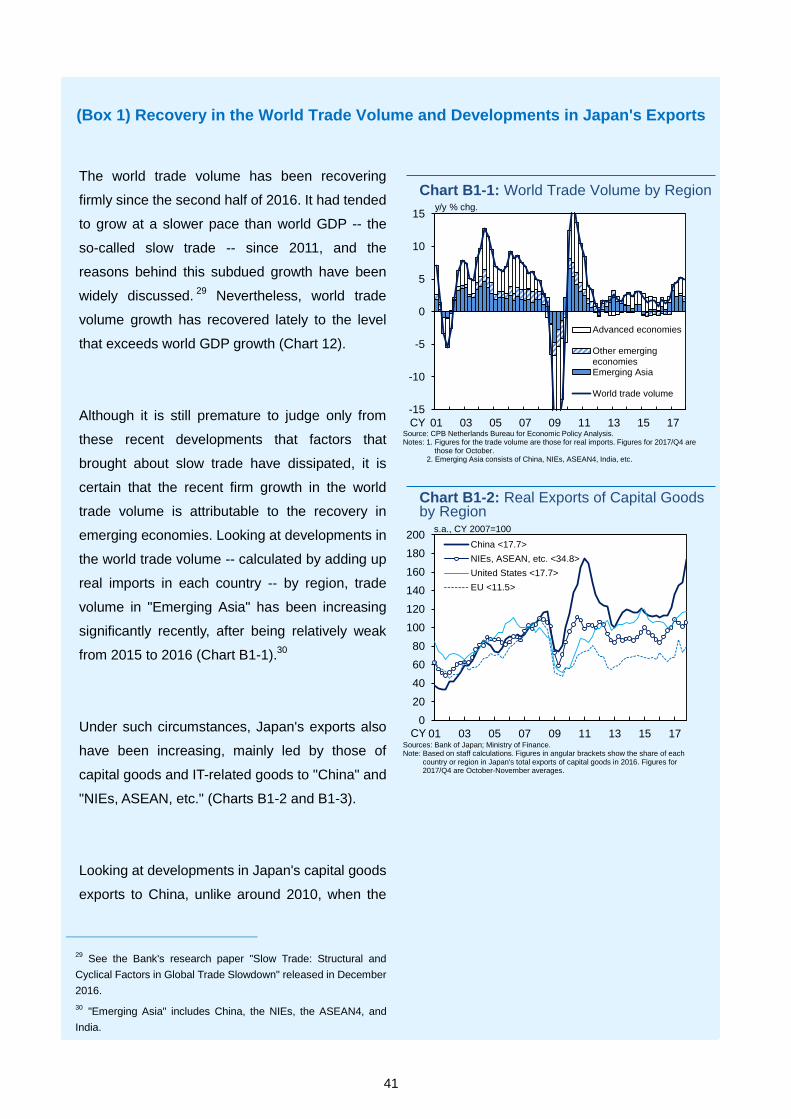
41
(Box 1) Recovery in the World Trade Volume and Developments in Japan's Exports
The world trade volume has been recovering
firmly since the second half of 2016. It had tended
to grow at a slower pace than world GDP -- the
so-called slow trade -- since 2011, and the
reasons behind this subdued growth have been
widely discussed.29
Nevertheless, world trade
volume growth has recovered lately to the level
that exceeds world GDP growth (Chart 12).
Although it is still premature to judge only from
these recent developments that factors that
brought about slow trade have dissipated, it is
certain that the recent firm growth in the world
trade volume is attributable to the recovery in
emerging economies. Looking at developments in
the world trade volume -- calculated by adding up
real imports in each country -- by region, trade
volume in "Emerging Asia" has been increasing
significantly recently, after being relatively weak
from 2015 to 2016 (Chart B1-1).30
Under such circumstances, Japan's exports also
have been increasing, mainly led by those of
capital goods and IT-related goods to "China" and
"NIEs, ASEAN, etc." (Charts B1-2 and B1-3).
Looking at developments in Japan's capital goods
exports to China, unlike around 2010, when the
29 See the Bank's research paper "Slow Trade: Structural and
Cyclical Factors in Global Trade Slowdown" released in December
2016.
30 "Emerging Asia" includes China, the NIEs, the ASEAN4, and
India.
0
20
40
60
80
100
120
140
160
180
200
01 03 05 07 09 11 13 15 17
China <17.7>
NIEs, ASEAN, etc. <34.8>
United States <17.7>
EU <11.5>
Sources: Bank of Japan; Ministry of Finance.Note: Based on staff calculations. Figures in angular brackets show the share of each
country or region in Japan's total exports of capital goods in 2016. Figures for 2017/Q4 are October-November averages.
Chart B1-2: Real Exports of Capital Goodsby Region
s.a., CY 2007=100
CY
-15
-10
-5
0
5
10
15
01 03 05 07 09 11 13 15 17
Advanced economies
Other emergingeconomiesEmerging Asia
World trade volume
Source: CPB Netherlands Bureau for Economic Policy Analysis.Notes: 1. Figures for the trade volume are those for real imports. Figures for 2017/Q4 are
those for October.2. Emerging Asia consists of China, NIEs, ASEAN4, India, etc.
Chart B1-1: World Trade Volume by Regiony/y % chg.
CY
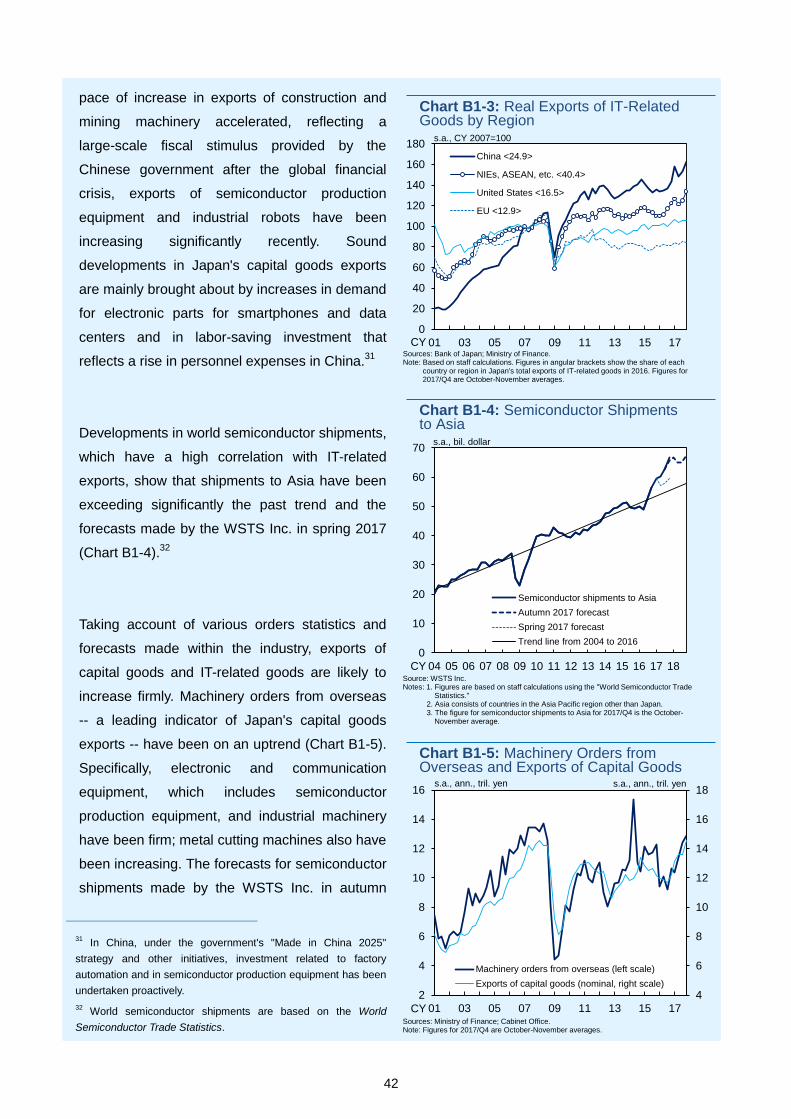
42
pace of increase in exports of construction and
mining machinery accelerated, reflecting a
large-scale fiscal stimulus provided by the
Chinese government after the global financial
crisis, exports of semiconductor production
equipment and industrial robots have been
increasing significantly recently. Sound
developments in Japan's capital goods exports
are mainly brought about by increases in demand
for electronic parts for smartphones and data
centers and in labor-saving investment that
reflects a rise in personnel expenses in China.31
Developments in world semiconductor shipments,
which have a high correlation with IT-related
exports, show that shipments to Asia have been
exceeding significantly the past trend and the
forecasts made by the WSTS Inc. in spring 2017
(Chart B1-4).32
Taking account of various orders statistics and
forecasts made within the industry, exports of
capital goods and IT-related goods are likely to
increase firmly. Machinery orders from overseas
-- a leading indicator of Japan's capital goods
exports -- have been on an uptrend (Chart B1-5).
Specifically, electronic and communication
equipment, which includes semiconductor
production equipment, and industrial machinery
have been firm; metal cutting machines also have
been increasing. The forecasts for semiconductor
shipments made by the WSTS Inc. in autumn
31 In China, under the government's "Made in China 2025"
strategy and other initiatives, investment related to factory
automation and in semiconductor production equipment has been
undertaken proactively.
32 World semiconductor shipments are based on the World
Semiconductor Trade Statistics.
0
20
40
60
80
100
120
140
160
180
01 03 05 07 09 11 13 15 17
China <24.9>
NIEs, ASEAN, etc. <40.4>
United States <16.5>
EU <12.9>
Sources: Bank of Japan; Ministry of Finance.Note: Based on staff calculations. Figures in angular brackets show the share of each
country or region in Japan's total exports of IT-related goods in 2016. Figures for 2017/Q4 are October-November averages.
Chart B1-3: Real Exports of IT-RelatedGoods by Region
s.a., CY 2007=100
CY
0
10
20
30
40
50
60
70
04 05 06 07 08 09 10 11 12 13 14 15 16 17 18
Semiconductor shipments to Asia
Autumn 2017 forecast
Spring 2017 forecast
Trend line from 2004 to 2016
Source: WSTS Inc.Notes: 1. Figures are based on staff calculations using the "World Semiconductor Trade
Statistics."2. Asia consists of countries in the Asia Pacific region other than Japan.3. The figure for semiconductor shipments to Asia for 2017/Q4 is the October-
November average.
Chart B1-4: Semiconductor Shipmentsto Asia
s.a., bil. dollar
CY
4
6
8
10
12
14
16
18
2
4
6
8
10
12
14
16
01 03 05 07 09 11 13 15 17
Machinery orders from overseas (left scale)
Exports of capital goods (nominal, right scale)
Sources: Ministry of Finance; Cabinet Office.Note: Figures for 2017/Q4 are October-November averages.
Chart B1-5: Machinery Orders fromOverseas and Exports of Capital Goods
s.a., ann., tril. yen
CY
s.a., ann., tril. yen

43
2017 indicate that the shipments are expected to
register a significant rise in 2017 and also a firm
increase in 2018 (Chart B1-4).
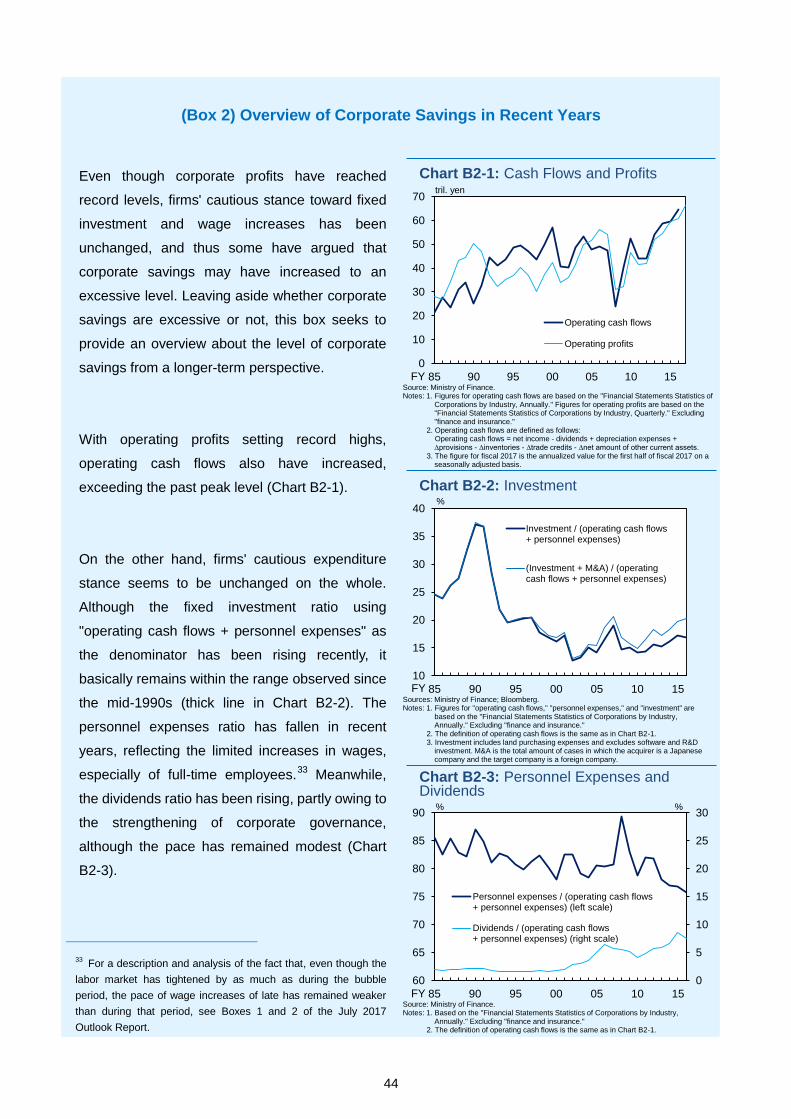
44
(Box 2) Overview of Corporate Savings in Recent Years
Even though corporate profits have reached
record levels, firms' cautious stance toward fixed
investment and wage increases has been
unchanged, and thus some have argued that
corporate savings may have increased to an
excessive level. Leaving aside whether corporate
savings are excessive or not, this box seeks to
provide an overview about the level of corporate
savings from a longer-term perspective.
With operating profits setting record highs,
operating cash flows also have increased,
exceeding the past peak level (Chart B2-1).
On the other hand, firms' cautious expenditure
stance seems to be unchanged on the whole.
Although the fixed investment ratio using
"operating cash flows + personnel expenses" as
the denominator has been rising recently, it
basically remains within the range observed since
the mid-1990s (thick line in Chart B2-2). The
personnel expenses ratio has fallen in recent
years, reflecting the limited increases in wages,
especially of full-time employees.33
Meanwhile,
the dividends ratio has been rising, partly owing to
the strengthening of corporate governance,
although the pace has remained modest (Chart
B2-3).
33 For a description and analysis of the fact that, even though the
labor market has tightened by as much as during the bubble
period, the pace of wage increases of late has remained weaker
than during that period, see Boxes 1 and 2 of the July 2017
Outlook Report.
0
10
20
30
40
50
60
70
85 90 95 00 05 10 15
Operating cash flows
Operating profits
Chart B2-1: Cash Flows and Profits
Source: Ministry of Finance.Notes: 1. Figures for operating cash flows are based on the "Financial Statements Statistics of
Corporations by Industry, Annually." Figures for operating profits are based on the"Financial Statements Statistics of Corporations by Industry, Quarterly." Excluding "finance and insurance."
2. Operating cash flows are defined as follows:Operating cash flows = net income - dividends + depreciation expenses + ∆provisions - ∆inventories - ∆trade credits - ∆net amount of other current assets.
3. The figure for fiscal 2017 is the annualized value for the first half of fiscal 2017 on a seasonally adjusted basis.
tril. yen
FY
10
15
20
25
30
35
40
85 90 95 00 05 10 15
Investment / (operating cash flows+ personnel expenses)
(Investment + M&A) / (operatingcash flows + personnel expenses)
Sources: Ministry of Finance; Bloomberg.Notes: 1. Figures for "operating cash flows," "personnel expenses," and "investment" are
based on the "Financial Statements Statistics of Corporations by Industry, Annually." Excluding "finance and insurance."
2. The definition of operating cash flows is the same as in Chart B2-1.3. Investment includes land purchasing expenses and excludes software and R&D
investment. M&A is the total amount of cases in which the acquirer is a Japanese company and the target company is a foreign company.
Chart B2-2: Investment%
FY
0
5
10
15
20
25
30
60
65
70
75
80
85
90
85 90 95 00 05 10 15
Personnel expenses / (operating cash flows+ personnel expenses) (left scale)
Dividends / (operating cash flows+ personnel expenses) (right scale)
Source: Ministry of Finance.Notes: 1. Based on the "Financial Statements Statistics of Corporations by Industry,
Annually." Excluding "finance and insurance."2. The definition of operating cash flows is the same as in Chart B2-1.
Chart B2-3: Personnel Expenses andDividends
%
FY
%
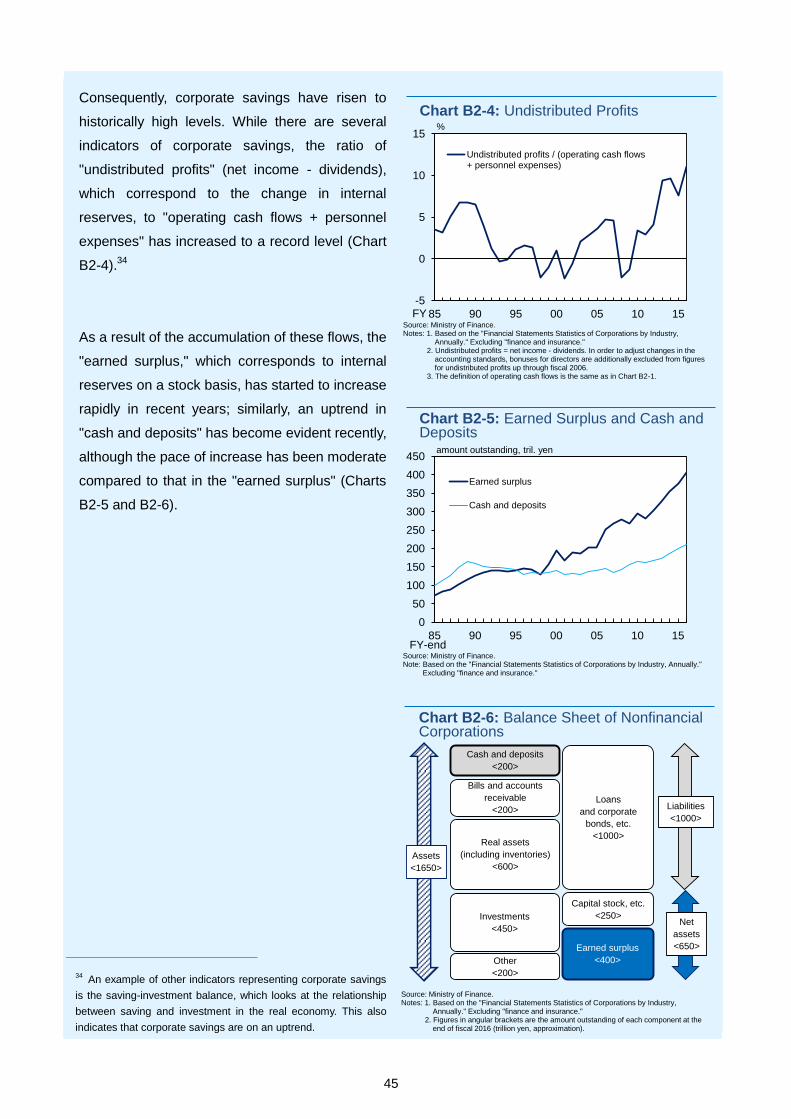
45
Consequently, corporate savings have risen to
historically high levels. While there are several
indicators of corporate savings, the ratio of
"undistributed profits" (net income - dividends),
which correspond to the change in internal
reserves, to "operating cash flows + personnel
expenses" has increased to a record level (Chart
B2-4).34
As a result of the accumulation of these flows, the
"earned surplus," which corresponds to internal
reserves on a stock basis, has started to increase
rapidly in recent years; similarly, an uptrend in
"cash and deposits" has become evident recently,
although the pace of increase has been moderate
compared to that in the "earned surplus" (Charts
B2-5 and B2-6).
34 An example of other indicators representing corporate savings
is the saving-investment balance, which looks at the relationship
between saving and investment in the real economy. This also
indicates that corporate savings are on an uptrend.
-5
0
5
10
15
85 90 95 00 05 10 15
Undistributed profits / (operating cash flows+ personnel expenses)
Chart B2-4: Undistributed Profits%
FYSource: Ministry of Finance.Notes: 1. Based on the "Financial Statements Statistics of Corporations by Industry,
Annually." Excluding "finance and insurance."2. Undistributed profits = net income - dividends. In order to adjust changes in the
accounting standards, bonuses for directors are additionally excluded from figures for undistributed profits up through fiscal 2006.
3. The definition of operating cash flows is the same as in Chart B2-1.
0
50
100
150
200
250
300
350
400
450
85 90 95 00 05 10 15
Earned surplus
Cash and deposits
Source: Ministry of Finance.Note: Based on the "Financial Statements Statistics of Corporations by Industry, Annually."
Excluding "finance and insurance."
Chart B2-5: Earned Surplus and Cash andDeposits
amount outstanding, tril. yen
FY-end
Investments
<450>
Other
<200>
Capital stock, etc.
<250>
Earned surplus
<400>
Cash and deposits
<200>
Real assets
(including inventories)
<600>Assets
<1650>
Net
assets
<650>
Liabilities
<1000>
Bills and accounts
receivable
<200>Loans
and corporate
bonds, etc.
<1000>
Source: Ministry of Finance.Notes: 1. Based on the "Financial Statements Statistics of Corporations by Industry,
Annually." Excluding "finance and insurance."2. Figures in angular brackets are the amount outstanding of each component at the
end of fiscal 2016 (trillion yen, approximation).
Chart B2-6: Balance Sheet of NonfinancialCorporations
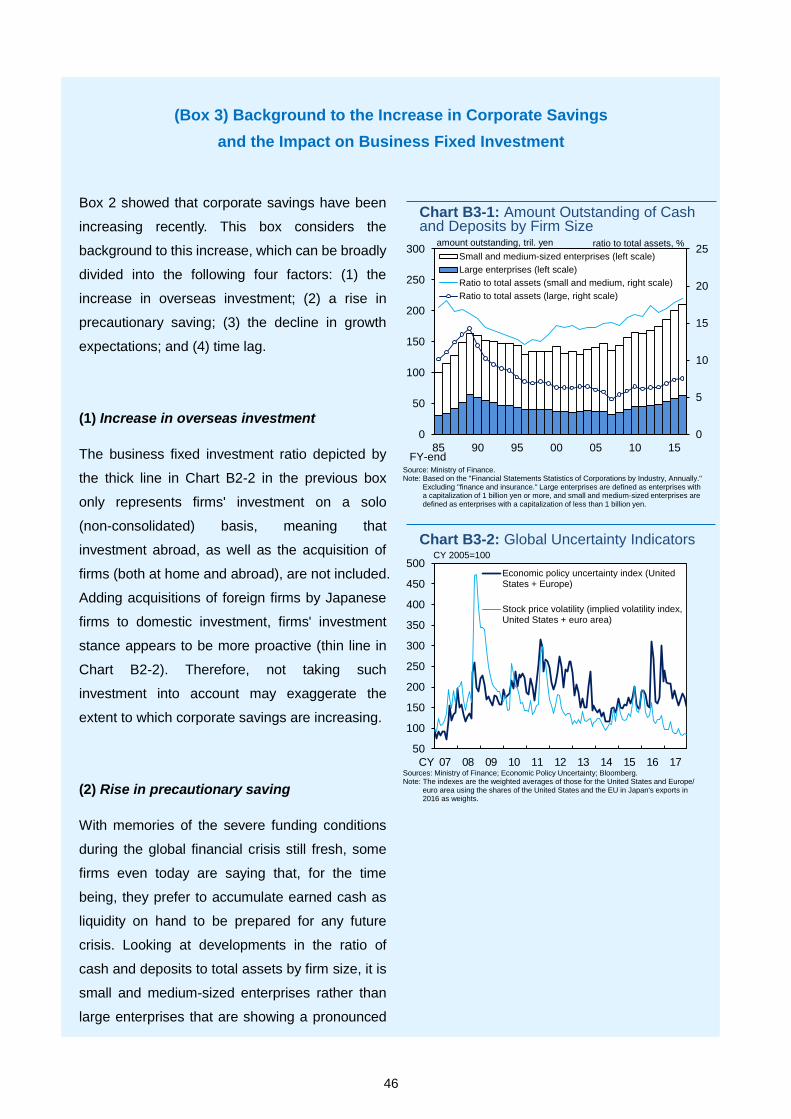
46
(Box 3) Background to the Increase in Corporate Savings
and the Impact on Business Fixed Investment
Box 2 showed that corporate savings have been
increasing recently. This box considers the
background to this increase, which can be broadly
divided into the following four factors: (1) the
increase in overseas investment; (2) a rise in
precautionary saving; (3) the decline in growth
expectations; and (4) time lag.
(1) Increase in overseas investment
The business fixed investment ratio depicted by
the thick line in Chart B2-2 in the previous box
only represents firms' investment on a solo
(non-consolidated) basis, meaning that
investment abroad, as well as the acquisition of
firms (both at home and abroad), are not included.
Adding acquisitions of foreign firms by Japanese
firms to domestic investment, firms' investment
stance appears to be more proactive (thin line in
Chart B2-2). Therefore, not taking such
investment into account may exaggerate the
extent to which corporate savings are increasing.
(2) Rise in precautionary saving
With memories of the severe funding conditions
during the global financial crisis still fresh, some
firms even today are saying that, for the time
being, they prefer to accumulate earned cash as
liquidity on hand to be prepared for any future
crisis. Looking at developments in the ratio of
cash and deposits to total assets by firm size, it is
small and medium-sized enterprises rather than
large enterprises that are showing a pronounced
0
5
10
15
20
25
0
50
100
150
200
250
300
85 90 95 00 05 10 15
Small and medium-sized enterprises (left scale)
Large enterprises (left scale)
Ratio to total assets (small and medium, right scale)
Ratio to total assets (large, right scale)
Source: Ministry of Finance.Note: Based on the "Financial Statements Statistics of Corporations by Industry, Annually."
Excluding "finance and insurance." Large enterprises are defined as enterprises with a capitalization of 1 billion yen or more, and small and medium-sized enterprises are defined as enterprises with a capitalization of less than 1 billion yen.
ratio to total assets, %
FY-end
amount outstanding, tril. yen
Chart B3-1: Amount Outstanding of Cash and Deposits by Firm Size
50
100
150
200
250
300
350
400
450
500
07 08 09 10 11 12 13 14 15 16 17
Economic policy uncertainty index (UnitedStates + Europe)
Stock price volatility (implied volatility index,United States + euro area)
Sources: Ministry of Finance; Economic Policy Uncertainty; Bloomberg.Note: The indexes are the weighted averages of those for the United States and Europe/
euro area using the shares of the United States and the EU in Japan's exports in 2016 as weights.
Chart B3-2: Global Uncertainty IndicatorsCY 2005=100
CY
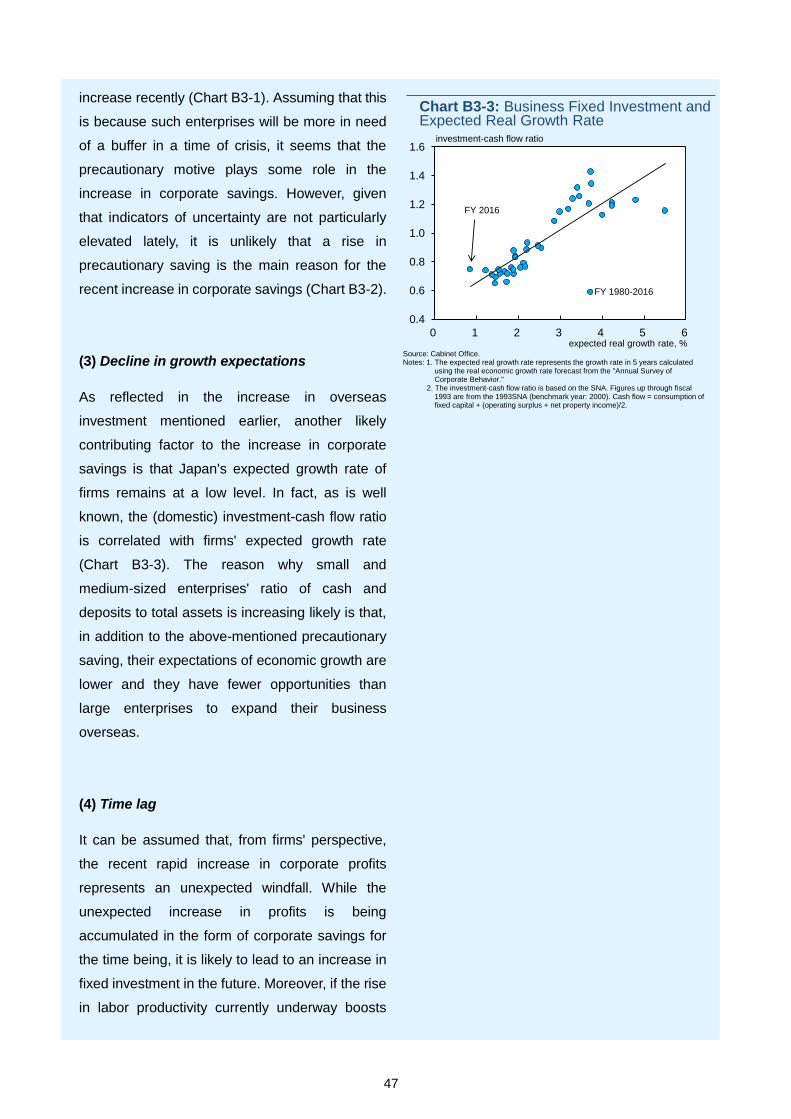
47
increase recently (Chart B3-1). Assuming that this
is because such enterprises will be more in need
of a buffer in a time of crisis, it seems that the
precautionary motive plays some role in the
increase in corporate savings. However, given
that indicators of uncertainty are not particularly
elevated lately, it is unlikely that a rise in
precautionary saving is the main reason for the
recent increase in corporate savings (Chart B3-2).
(3) Decline in growth expectations
As reflected in the increase in overseas
investment mentioned earlier, another likely
contributing factor to the increase in corporate
savings is that Japan's expected growth rate of
firms remains at a low level. In fact, as is well
known, the (domestic) investment-cash flow ratio
is correlated with firms' expected growth rate
(Chart B3-3). The reason why small and
medium-sized enterprises' ratio of cash and
deposits to total assets is increasing likely is that,
in addition to the above-mentioned precautionary
saving, their expectations of economic growth are
lower and they have fewer opportunities than
large enterprises to expand their business
overseas.
(4) Time lag
It can be assumed that, from firms' perspective,
the recent rapid increase in corporate profits
represents an unexpected windfall. While the
unexpected increase in profits is being
accumulated in the form of corporate savings for
the time being, it is likely to lead to an increase in
fixed investment in the future. Moreover, if the rise
in labor productivity currently underway boosts
0.4
0.6
0.8
1.0
1.2
1.4
1.6
0 1 2 3 4 5 6
FY 1980-2016
Source: Cabinet Office.Notes: 1. The expected real growth rate represents the growth rate in 5 years calculated
using the real economic growth rate forecast from the "Annual Survey of Corporate Behavior."
2. The investment-cash flow ratio is based on the SNA. Figures up through fiscal 1993 are from the 1993SNA (benchmark year: 2000). Cash flow = consumption of fixed capital + (operating surplus + net property income)/2.
investment-cash flow ratio
expected real growth rate, %
FY 2016
Chart B3-3: Business Fixed Investment and Expected Real Growth Rate
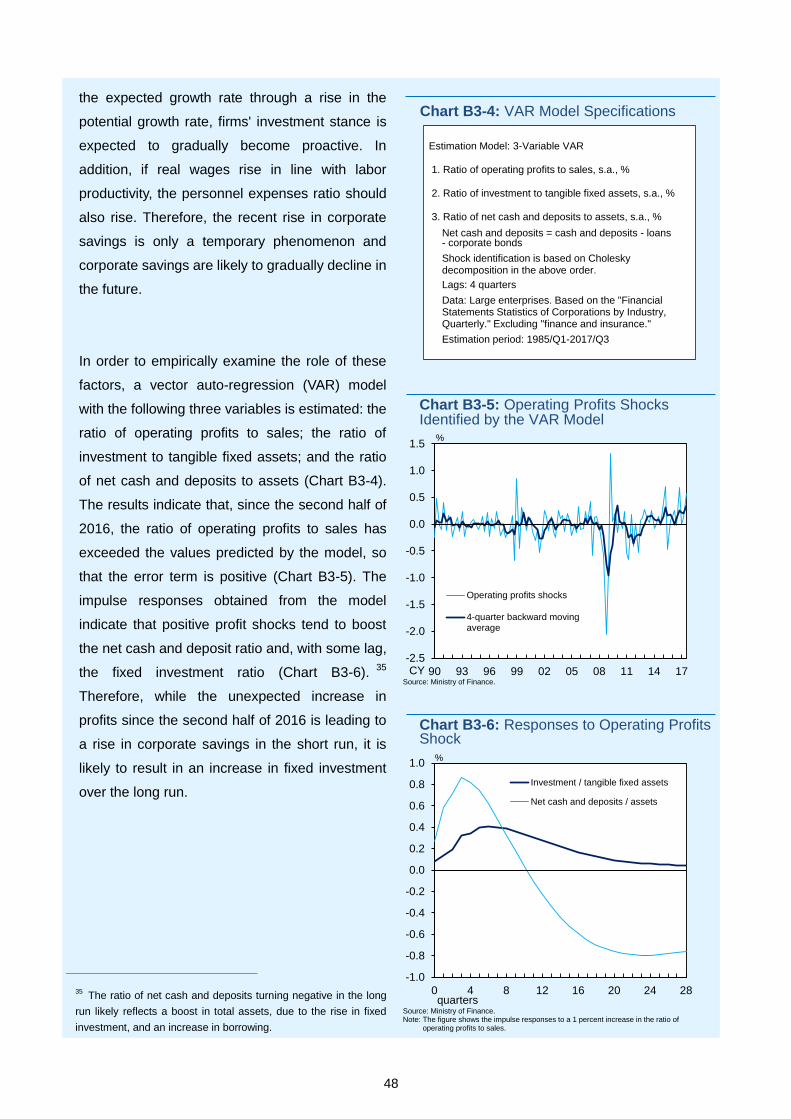
48
the expected growth rate through a rise in the
potential growth rate, firms' investment stance is
expected to gradually become proactive. In
addition, if real wages rise in line with labor
productivity, the personnel expenses ratio should
also rise. Therefore, the recent rise in corporate
savings is only a temporary phenomenon and
corporate savings are likely to gradually decline in
the future.
In order to empirically examine the role of these
factors, a vector auto-regression (VAR) model
with the following three variables is estimated: the
ratio of operating profits to sales; the ratio of
investment to tangible fixed assets; and the ratio
of net cash and deposits to assets (Chart B3-4).
The results indicate that, since the second half of
2016, the ratio of operating profits to sales has
exceeded the values predicted by the model, so
that the error term is positive (Chart B3-5). The
impulse responses obtained from the model
indicate that positive profit shocks tend to boost
the net cash and deposit ratio and, with some lag,
the fixed investment ratio (Chart B3-6).35
Therefore, while the unexpected increase in
profits since the second half of 2016 is leading to
a rise in corporate savings in the short run, it is
likely to result in an increase in fixed investment
over the long run.
35 The ratio of net cash and deposits turning negative in the long
run likely reflects a boost in total assets, due to the rise in fixed
investment, and an increase in borrowing.
Estimation Model: 3-Variable VAR
1. Ratio of operating profits to sales, s.a., %
2. Ratio of investment to tangible fixed assets, s.a., %
3. Ratio of net cash and deposits to assets, s.a., %
Net cash and deposits = cash and deposits - loans- corporate bonds
Shock identification is based on Choleskydecomposition in the above order.
Lags: 4 quarters
Data: Large enterprises. Based on the "Financial Statements Statistics of Corporations by Industry, Quarterly." Excluding "finance and insurance."
Estimation period: 1985/Q1-2017/Q3
Chart B3-4: VAR Model Specifications
-2.5
-2.0
-1.5
-1.0
-0.5
0.0
0.5
1.0
1.5
90 93 96 99 02 05 08 11 14 17
Operating profits shocks
4-quarter backward movingaverage
Source: Ministry of Finance.
Chart B3-5: Operating Profits Shocks Identified by the VAR Model
%
CY
-1.0
-0.8
-0.6
-0.4
-0.2
0.0
0.2
0.4
0.6
0.8
1.0
0 4 8 12 16 20 24 28
Investment / tangible fixed assets
Net cash and deposits / assets
Source: Ministry of Finance.Note: The figure shows the impulse responses to a 1 percent increase in the ratio of
operating profits to sales.
Chart B3-6: Responses to Operating Profits Shock
%
quarters