Embed Size (px)
Citation preview
News Release
Outlook for FY18-19 corporate earnings
Quarterly Update
4 June 2018
Equity Research Dept
Nomura Securities Co Ltd, Tokyo
Nomura | JPN Outlook for FY18-19 corporate earnings June 4, 2018
2
Contents
Summary and major assumptions ........................................................ 3
Contributions to recurring profit growth by sector ................................. 5
Revisions to recurring profit estimates (versus old estimates) ............. 7
Revision index for the Russell/Nomura Large Cap Index ..................... 9
Reference
Russell/Nomura Large Cap Index: earnings indicators ...................... 10
Recurring profits by sector ................................................................. 12
Percentage change in quarterly sales and profits .............................. 13
Valuation indicators ........................................................................... 14
What are the Russell/Nomura Japan Equity Indexes? ....................... 15
Nomura | JPN Outlook for FY18-19 corporate earnings June 4, 2018
3
Summary and major assumptions
Overview of FY17 corporate earnings
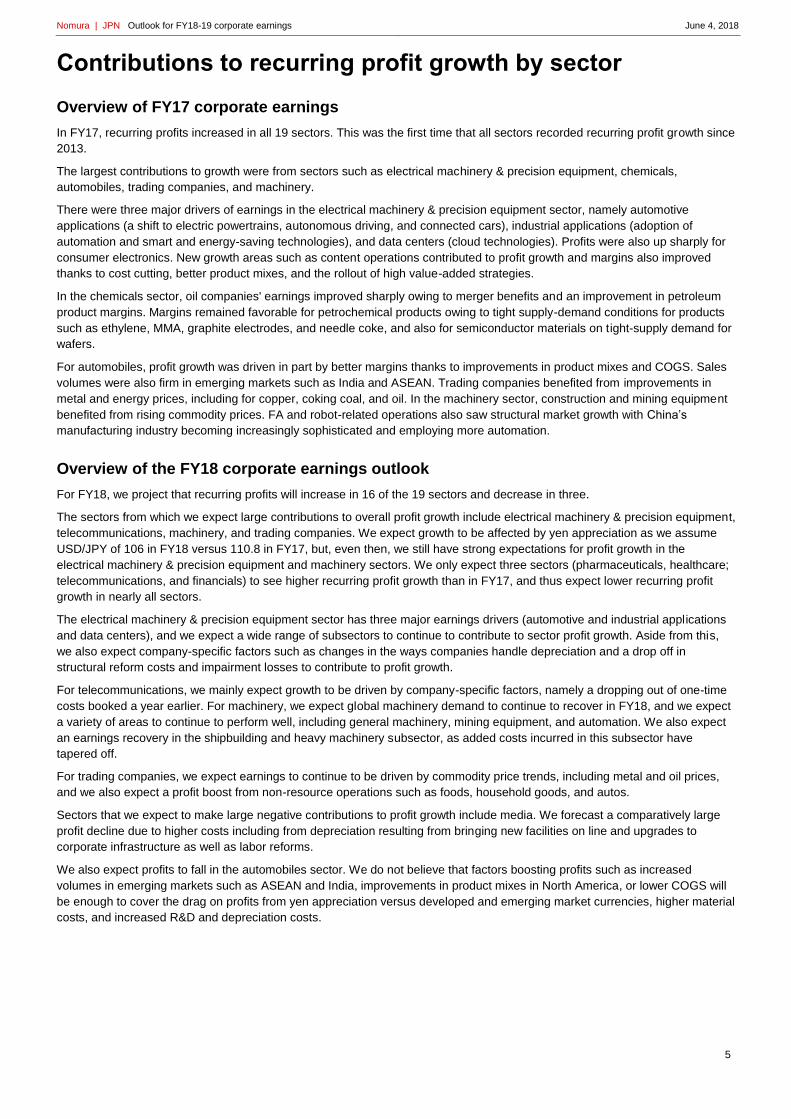
In this report, we collate and analyze earnings forecast data issued by our analysts.
In FY17, sales at companies in the Russell/Nomura Large Cap Index (ex financials) rose 8.2% y-y and recurring profits
increased 17.5%. Sales growth was 0.1ppt higher and recurring profit growth 1.2ppt lower than our estimates issued in March
2018 (based on data collated on 25 February 2018). This marks the sixth straight fiscal year that recurring profits were up y-y
(starting in FY12).
In FY17 Q4, recurring profits at companies in the Russell/Nomura Large Cap Index (ex financials) rose 0.1% y-y on a 5.6%
increase in sales. The rate of recurring profit growth was down fairly substantially from the 24.5% growth in Q2 and 23.4%
growth in Q3, but, when excluding Toshiba, recurring profits were up 17.1% in Q3 and 11.4% in Q4. The growth rate thus
peaked in FY17 Q2 and has been gradually declining.
FY17 after-tax profits for Russell/Nomura Large Cap companies were up 32.2%y-y owing to a substantial boost from US tax
reforms. ROE for Russell/Nomura Large Cap companies stood at 10.3%, above the previous peak of 10.1% recorded in FY05,
owing in part to the aforementioned boost. The FY17 ROE figure was the highest in 37 years, or more specifically, the highest
since the ROE of 12.1% reached in FY80.
Overview of the FY18 corporate earnings outlook
For FY18, our analysts look for sales growth of 3.0% y-y and recurring profit growth of 8.7% for companies in the
Russell/Nomura Large Cap Index (ex financials). Our forex assumptions for FY18 are USD/JPY of 106.0 (previously: 111.0) and
EUR/JPY of 131.0 (previously 135.0). Our WTI assumption is $70.0/bbl ($65.0/bbl).
These sales and recurring profit growth forecasts are each 0.3ppt lower than the last time we issued our FY18 outlook. Our
actual FY18 recurring profit forecast is ¥576bn (1.3%) lower than our previous forecast owing in part to our assumption of a
stronger yen, but FY17 recurring profits were also lower than we forecast, and as a result our FY18 recurring profit growth
forecast is only slightly lower than before. The y-y boost from the US tax reforms will drop off in FY18, and we therefore expect
after-tax profits for Russell/Nomura Large Cap companies to increase by just 2.6%, substantially less than the rate of growth we
forecast for recurring and other profits.
We expect global real GDP growth to accelerate slightly from 3.9% in 2017 to 4.0% in 2018 because of the US government's
aggressive fiscal policies. Japanese companies are also likely to benefit from this global economic growth, and we expect
recurring profits to grow for a seventh consecutive year in FY18, the first time this has happened since FY70.
Some observers are concerned about what kind of an impact rising labor costs, raw material prices, and capex will have on
corporate earnings. The recurring margin for Russell/Nomura Large Cap Index (ex financials) companies improved sharply from
7.6% in FY16 to 8.3% in FY17 with companies recording very strong sales growth. We expect the recurring margin to continue
to rise to 8.7% in FY18 and 9.4% in FY19, but we believe that it will be important to monitor corporate earnings to determine if
margins do in fact improve as the acceleration in the global economy tapers off a bit.
Nomura | JPN Outlook for FY18-19 corporate earnings June 4, 2018
4
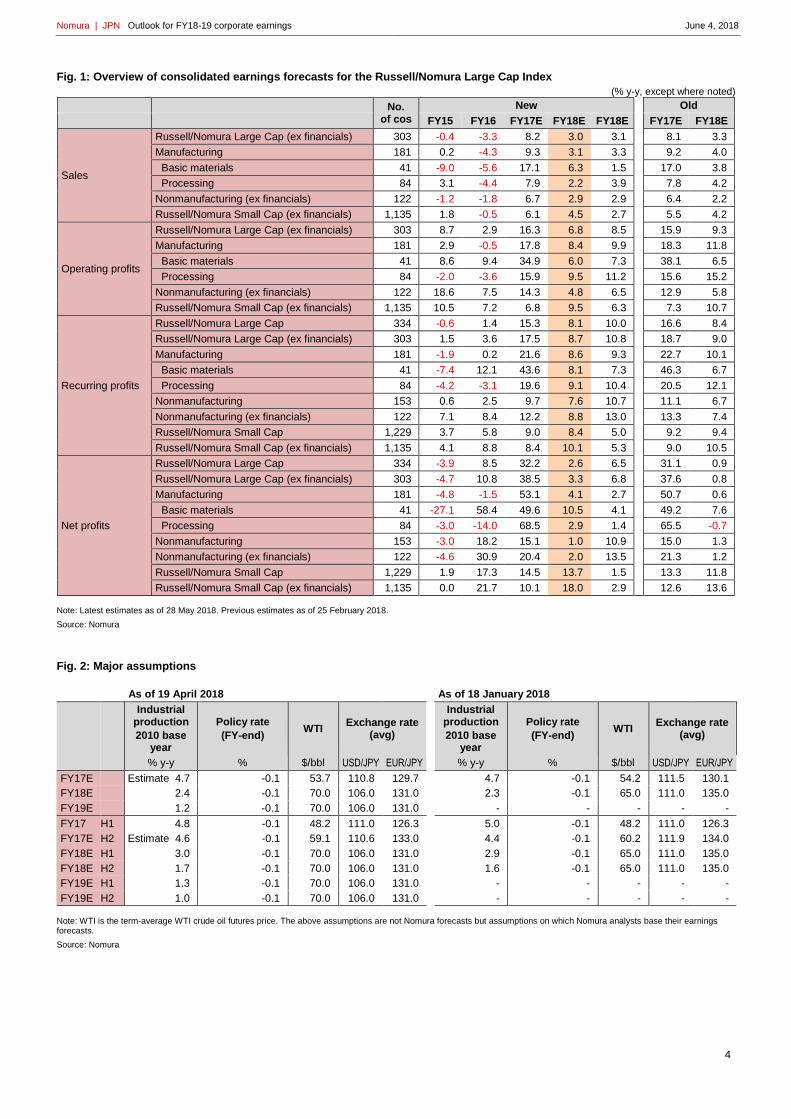
Fig. 1: Overview of consolidated earnings forecasts for the Russell/Nomura Large Cap Index
(% y-y, except where noted)
No. of cos
New
Old
FY15 FY16 FY17E FY18E FY18E
FY17E FY18E
Sales
Russell/Nomura Large Cap (ex financials) 303 -0.4 -3.3 8.2 3.0 3.1 8.1 3.3
Manufacturing 181 0.2 -4.3 9.3 3.1 3.3 9.2 4.0
Basic materials 41 -9.0 -5.6 17.1 6.3 1.5 17.0 3.8
Processing 84 3.1 -4.4 7.9 2.2 3.9 7.8 4.2
Nonmanufacturing (ex financials) 122 -1.2 -1.8 6.7 2.9 2.9 6.4 2.2
Russell/Nomura Small Cap (ex financials) 1,135 1.8 -0.5 6.1 4.5 2.7 5.5 4.2
Operating profits
Russell/Nomura Large Cap (ex financials) 303 8.7 2.9 16.3 6.8 8.5 15.9 9.3
Manufacturing 181 2.9 -0.5 17.8 8.4 9.9 18.3 11.8
Basic materials 41 8.6 9.4 34.9 6.0 7.3 38.1 6.5
Processing 84 -2.0 -3.6 15.9 9.5 11.2 15.6 15.2
Nonmanufacturing (ex financials) 122 18.6 7.5 14.3 4.8 6.5 12.9 5.8
Russell/Nomura Small Cap (ex financials) 1,135 10.5 7.2 6.8 9.5 6.3 7.3 10.7
Recurring profits
Russell/Nomura Large Cap 334 -0.6 1.4 15.3 8.1 10.0 16.6 8.4
Russell/Nomura Large Cap (ex financials) 303 1.5 3.6 17.5 8.7 10.8 18.7 9.0
Manufacturing 181 -1.9 0.2 21.6 8.6 9.3 22.7 10.1
Basic materials 41 -7.4 12.1 43.6 8.1 7.3 46.3 6.7
Processing 84 -4.2 -3.1 19.6 9.1 10.4 20.5 12.1
Nonmanufacturing 153 0.6 2.5 9.7 7.6 10.7 11.1 6.7
Nonmanufacturing (ex financials) 122 7.1 8.4 12.2 8.8 13.0 13.3 7.4
Russell/Nomura Small Cap 1,229 3.7 5.8 9.0 8.4 5.0 9.2 9.4
Russell/Nomura Small Cap (ex financials) 1,135 4.1 8.8 8.4 10.1 5.3 9.0 10.5
Net profits
Russell/Nomura Large Cap 334 -3.9 8.5 32.2 2.6 6.5 31.1 0.9
Russell/Nomura Large Cap (ex financials) 303 -4.7 10.8 38.5 3.3 6.8 37.6 0.8
Manufacturing 181 -4.8 -1.5 53.1 4.1 2.7 50.7 0.6
Basic materials 41 -27.1 58.4 49.6 10.5 4.1 49.2 7.6
Processing 84 -3.0 -14.0 68.5 2.9 1.4 65.5 -0.7
Nonmanufacturing 153 -3.0 18.2 15.1 1.0 10.9 15.0 1.3
Nonmanufacturing (ex financials) 122 -4.6 30.9 20.4 2.0 13.5 21.3 1.2
Russell/Nomura Small Cap 1,229 1.9 17.3 14.5 13.7 1.5 13.3 11.8
Russell/Nomura Small Cap (ex financials) 1,135 0.0 21.7 10.1 18.0 2.9 12.6 13.6
Note: Latest estimates as of 28 May 2018. Previous estimates as of 25 February 2018.
Source: Nomura
Fig. 2: Major assumptions
As of 19 April 2018
As of 18 January 2018
Industrial production
2010 base year
Policy rate
(FY-end) WTI
Exchange rate (avg)
Industrial production
2010 base year
Policy rate
(FY-end) WTI
Exchange rate (avg)
% y-y % $/bbl USD/JPY EUR/JPY
% y-y % $/bbl USD/JPY EUR/JPY
FY17E Estimate 4.7 -0.1 53.7 110.8 129.7 4.7 -0.1 54.2 111.5 130.1
FY18E 2.4 -0.1 70.0 106.0 131.0 2.3 -0.1 65.0 111.0 135.0
FY19E 1.2 -0.1 70.0 106.0 131.0 - - - - -
FY17 H1 4.8 -0.1 48.2 111.0 126.3 5.0 -0.1 48.2 111.0 126.3
FY17E H2 Estimate 4.6 -0.1 59.1 110.6 133.0 4.4 -0.1 60.2 111.9 134.0
FY18E H1 3.0 -0.1 70.0 106.0 131.0 2.9 -0.1 65.0 111.0 135.0
FY18E H2 1.7 -0.1 70.0 106.0 131.0 1.6 -0.1 65.0 111.0 135.0
FY19E H1 1.3 -0.1 70.0 106.0 131.0 - - - - -
FY19E H2 1.0 -0.1 70.0 106.0 131.0 - - - - -
Note: WTI is the term-average WTI crude oil futures price. The above assumptions are not Nomura forecasts but assumptions on which Nomura analysts base their earnings forecasts.
Source: Nomura
Nomura | JPN Outlook for FY18-19 corporate earnings June 4, 2018
5
Contributions to recurring profit growth by sector
Overview of FY17 corporate earnings
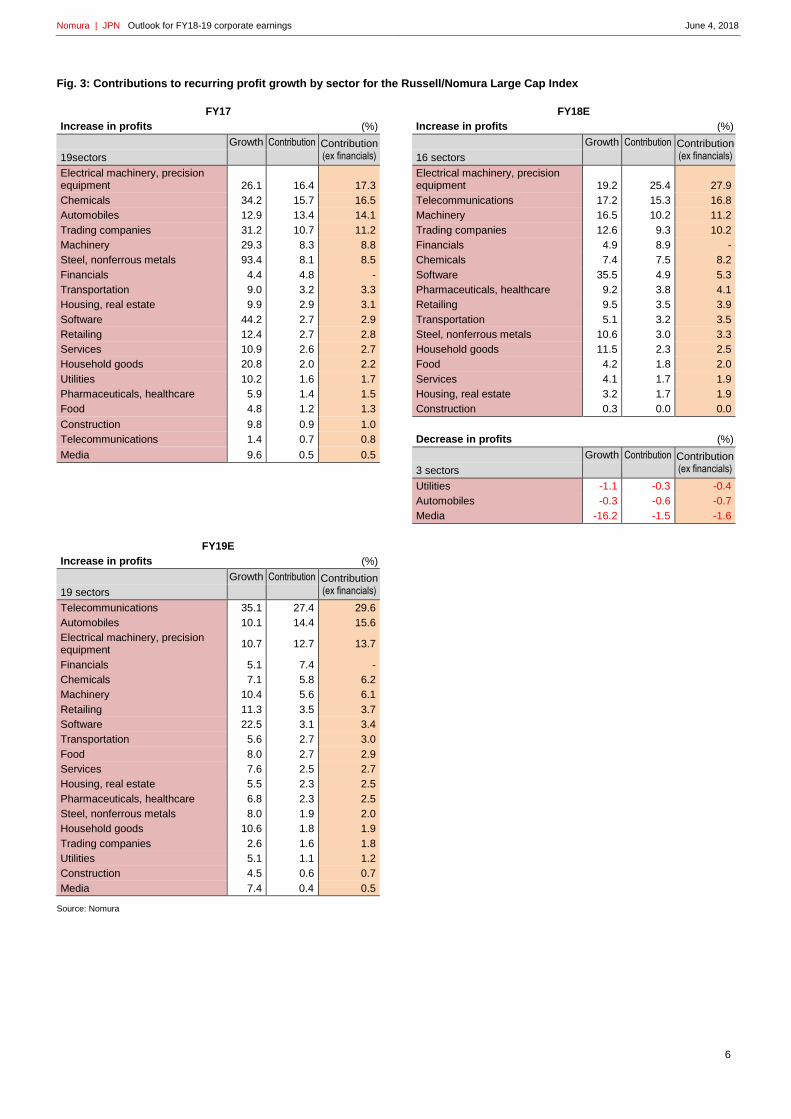
In FY17, recurring profits increased in all 19 sectors. This was the first time that all sectors recorded recurring profit growth since
2013.
The largest contributions to growth were from sectors such as electrical machinery & precision equipment, chemicals,
automobiles, trading companies, and machinery.
There were three major drivers of earnings in the electrical machinery & precision equipment sector, namely automotive
applications (a shift to electric powertrains, autonomous driving, and connected cars), industrial applications (adoption of
automation and smart and energy-saving technologies), and data centers (cloud technologies). Profits were also up sharply for
consumer electronics. New growth areas such as content operations contributed to profit growth and margins also improved
thanks to cost cutting, better product mixes, and the rollout of high value-added strategies.
In the chemicals sector, oil companies' earnings improved sharply owing to merger benefits and an improvement in petroleum
product margins. Margins remained favorable for petrochemical products owing to tight supply-demand conditions for products
such as ethylene, MMA, graphite electrodes, and needle coke, and also for semiconductor materials on tight-supply demand for
wafers.
For automobiles, profit growth was driven in part by better margins thanks to improvements in product mixes and COGS. Sales
volumes were also firm in emerging markets such as India and ASEAN. Trading companies benefited from improvements in
metal and energy prices, including for copper, coking coal, and oil. In the machinery sector, construction and mining equipment
benefited from rising commodity prices. FA and robot-related operations also saw structural market growth with China’s
manufacturing industry becoming increasingly sophisticated and employing more automation.
Overview of the FY18 corporate earnings outlook
For FY18, we project that recurring profits will increase in 16 of the 19 sectors and decrease in three.
The sectors from which we expect large contributions to overall profit growth include electrical machinery & precision equipment,
telecommunications, machinery, and trading companies. We expect growth to be affected by yen appreciation as we assume
USD/JPY of 106 in FY18 versus 110.8 in FY17, but, even then, we still have strong expectations for profit growth in the
electrical machinery & precision equipment and machinery sectors. We only expect three sectors (pharmaceuticals, healthcare;
telecommunications, and financials) to see higher recurring profit growth than in FY17, and thus expect lower recurring profit
growth in nearly all sectors.
The electrical machinery & precision equipment sector has three major earnings drivers (automotive and industrial applications
and data centers), and we expect a wide range of subsectors to continue to contribute to sector profit growth. Aside from this,
we also expect company-specific factors such as changes in the ways companies handle depreciation and a drop off in
structural reform costs and impairment losses to contribute to profit growth.
For telecommunications, we mainly expect growth to be driven by company-specific factors, namely a dropping out of one-time
costs booked a year earlier. For machinery, we expect global machinery demand to continue to recover in FY18, and we expect
a variety of areas to continue to perform well, including general machinery, mining equipment, and automation. We also expect
an earnings recovery in the shipbuilding and heavy machinery subsector, as added costs incurred in this subsector have
tapered off.
For trading companies, we expect earnings to continue to be driven by commodity price trends, including metal and oil prices,
and we also expect a profit boost from non-resource operations such as foods, household goods, and autos.
Sectors that we expect to make large negative contributions to profit growth include media. We forecast a comparatively large
profit decline due to higher costs including from depreciation resulting from bringing new facilities on line and upgrades to
corporate infrastructure as well as labor reforms.
We also expect profits to fall in the automobiles sector. We do not believe that factors boosting profits such as increased
volumes in emerging markets such as ASEAN and India, improvements in product mixes in North America, or lower COGS will
be enough to cover the drag on profits from yen appreciation versus developed and emerging market currencies, higher material
costs, and increased R&D and depreciation costs.
Nomura | JPN Outlook for FY18-19 corporate earnings June 4, 2018
6
Fig. 3: Contributions to recurring profit growth by sector for the Russell/Nomura Large Cap Index
FY17 FY18E
Increase in profits (%) Increase in profits (%)
Growth Contribution Contribution (ex financials)
Growth Contribution Contribution (ex financials) 19sectors 16 sectors
Electrical machinery, precision equipment 26.1 16.4 17.3
Electrical machinery, precision equipment 19.2 25.4 27.9
Chemicals 34.2 15.7 16.5 Telecommunications 17.2 15.3 16.8
Automobiles 12.9 13.4 14.1 Machinery 16.5 10.2 11.2
Trading companies 31.2 10.7 11.2 Trading companies 12.6 9.3 10.2
Machinery 29.3 8.3 8.8 Financials 4.9 8.9 -
Steel, nonferrous metals 93.4 8.1 8.5 Chemicals 7.4 7.5 8.2
Financials 4.4 4.8 - Software 35.5 4.9 5.3
Transportation 9.0 3.2 3.3 Pharmaceuticals, healthcare 9.2 3.8 4.1
Housing, real estate 9.9 2.9 3.1 Retailing 9.5 3.5 3.9
Software 44.2 2.7 2.9 Transportation 5.1 3.2 3.5
Retailing 12.4 2.7 2.8 Steel, nonferrous metals 10.6 3.0 3.3
Services 10.9 2.6 2.7 Household goods 11.5 2.3 2.5
Household goods 20.8 2.0 2.2 Food 4.2 1.8 2.0
Utilities 10.2 1.6 1.7 Services 4.1 1.7 1.9
Pharmaceuticals, healthcare 5.9 1.4 1.5 Housing, real estate 3.2 1.7 1.9
Food 4.8 1.2 1.3 Construction 0.3 0.0 0.0
Construction 9.8 0.9 1.0
Telecommunications 1.4 0.7 0.8 Decrease in profits (%)
Media 9.6 0.5 0.5 Growth Contribution Contribution (ex financials)
3 sectors
Utilities -1.1 -0.3 -0.4
Automobiles -0.3 -0.6 -0.7
Media -16.2 -1.5 -1.6
FY19E
Increase in profits
(%)
Growth Contribution Contribution (ex financials)
19 sectors
Telecommunications 35.1 27.4 29.6
Automobiles 10.1 14.4 15.6
Electrical machinery, precision equipment
10.7 12.7 13.7
Financials 5.1 7.4 -
Chemicals 7.1 5.8 6.2
Machinery 10.4 5.6 6.1
Retailing 11.3 3.5 3.7
Software 22.5 3.1 3.4
Transportation 5.6 2.7 3.0
Food 8.0 2.7 2.9
Services 7.6 2.5 2.7
Housing, real estate 5.5 2.3 2.5
Pharmaceuticals, healthcare 6.8 2.3 2.5
Steel, nonferrous metals 8.0 1.9 2.0
Household goods 10.6 1.8 1.9
Trading companies 2.6 1.6 1.8
Utilities 5.1 1.1 1.2
Construction 4.5 0.6 0.7
Media 7.4 0.4 0.5
Source: Nomura
Nomura | JPN Outlook for FY18-19 corporate earnings June 4, 2018
7
Revisions to recurring profit estimates (versus old estimates)
Overview of FY17 corporate earnings
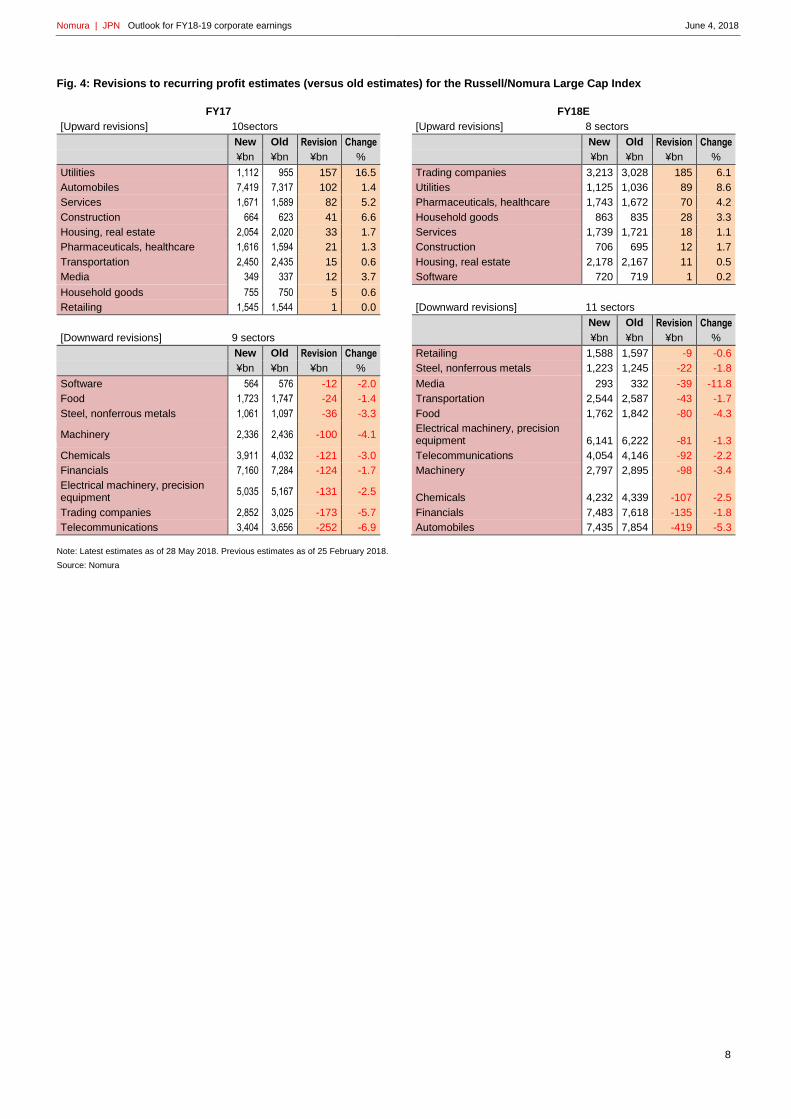
Recurring profits in FY17 came in ahead of our estimates in 10 of 19 sectors and below them in nine.
Results exceeded our forecasts the most in sectors such as utilities, automobiles, services, and construction.
The utilities sector saw a large boost from increased power demand due to the cold winter. Cost cutting at some companies was
also higher than we had expected. While profits in the automobiles sector took a major hit from yen appreciation and high
material costs, profits were significantly boosted by improved margins owing in part to less discounting, reductions in sales costs,
and an improved product mix on increased SUV sales in the US. Profits in the services sector were boosted substantially by
price hikes and increased volumes in postal service operations. The construction sector saw better-than-expected improvement
in gross margins on building construction and civil engineering projects owing to a boost from higher contract prices for
construction work, as typified by average building start prices. The risk of higher costs never materialized in FY17.
Sectors for which earnings came in well below our forecasts include telecommunications, trading companies, electrical
machinery & precision equipment, financials, and chemicals.
The shortfalls in many of these sectors look to have been mainly due to one-time factors. For instance, in the
telecommunications sector, some companies saw expanded derivative-related losses. In the trading companies sector,
operations such as fruit & vegetable and mineral & metal resource posted losses. In the electrical machinery & precision
equipment sector, companies booked structural reform costs, provisions for losses and impairment on goodwill and other assets.
In the chemicals sector, some companies booked impairment losses on copper mining operations, and in the financials sector,
nonlife insurers saw increased disaster losses and some regional banks saw an increase in credit costs. In addition, the
electrical machinery & precision equipment and chemicals sectors were impacted by rising input costs due to higher materials
costs, including for crude oil, and a sharp drop off in smartphone demand.
Overview of the FY18 corporate earnings outlook
We have raised our FY18 recurring profit forecasts for 8 of the 19 sectors and lowered them for 11. We revise our USD/JPY
assumption for FY18 from 111.0 to 106.0, as we expect the yen to gain strength.
The largest upward revisions were for our estimates for sectors such as trading companies, utilities, pharmaceuticals &
healthcare, and household goods.
We revise up our forecast for the trading companies sector to reflect rising prices for commodities such as crude oil and coking
coal. The upward revision to our forecast for the utilities sector is largely to reflect the restart of some nuclear reactors. In
pharmaceuticals & healthcare, the revisions reflect a drop off in costs, including for the sale of fixed assets, as well as a boost
from product mix improvements.
For household goods, we factor in an ongoing increase in sales to foreign tourists and Japanese nationals in Japan as well as
margin improvement on favorable sales of high-end cosmetics. We also forecast favorable increases in cosmetics sales
overseas.
The largest downward revisions were for the automobiles, financials, chemicals, and machinery sectors.
The downward revisions for the automobiles, chemicals, machinery segments stem in part from our assumption of a stronger
yen. In addition, for the automobiles sector, we expect a dropoff in sales in Europe owing to reduced supplies of diesel engines
that comply with new European emissions standards, and it also looks like costs for meeting new standards in Europe and North
America will be higher than previously expected. In the chemicals sector, we expect electronic materials to slump owing to weak
smartphone demand, as per FY17; deterioration in supply/demand conditions for certain products; and higher raw material
prices. We lower our forecasts for the financials sector to reflect a dropping out in one-time profits, weak earnings for asset
management and insurance underwriting, and a slump in earnings from investments. For machinery, we expect lower sales of
smartphone casing processing machinery on a contraction in smartphone demand.
Nomura | JPN Outlook for FY18-19 corporate earnings June 4, 2018
8
Fig. 4: Revisions to recurring profit estimates (versus old estimates) for the Russell/Nomura Large Cap Index
FY17
FY18E
[Upward revisions] 10sectors
[Upward revisions] 8 sectors
New Old Revision Change
New Old Revision Change
¥bn ¥bn ¥bn %
¥bn ¥bn ¥bn %
Utilities 1,112 955 157 16.5
Trading companies 3,213 3,028 185 6.1
Automobiles 7,419 7,317 102 1.4
Utilities 1,125 1,036 89 8.6
Services 1,671 1,589 82 5.2
Pharmaceuticals, healthcare 1,743 1,672 70 4.2
Construction 664 623 41 6.6
Household goods 863 835 28 3.3
Housing, real estate 2,054 2,020 33 1.7
Services 1,739 1,721 18 1.1
Pharmaceuticals, healthcare 1,616 1,594 21 1.3
Construction 706 695 12 1.7
Transportation 2,450 2,435 15 0.6
Housing, real estate 2,178 2,167 11 0.5
Media 349 337 12 3.7
Software 720 719 1 0.2
Household goods 755 750 5 0.6
Retailing 1,545 1,544 1 0.0
[Downward revisions] 11 sectors
New Old Revision Change
[Downward revisions] 9 sectors
¥bn ¥bn ¥bn %
New Old Revision Change
Retailing 1,588 1,597 -9 -0.6
¥bn ¥bn ¥bn %
Steel, nonferrous metals 1,223 1,245 -22 -1.8
Software 564 576 -12 -2.0
Media 293 332 -39 -11.8
Food 1,723 1,747 -24 -1.4
Transportation 2,544 2,587 -43 -1.7
Steel, nonferrous metals 1,061 1,097 -36 -3.3
Food 1,762 1,842 -80 -4.3
Machinery 2,336 2,436 -100 -4.1
Electrical machinery, precision equipment 6,141 6,222 -81 -1.3
Chemicals 3,911 4,032 -121 -3.0
Telecommunications 4,054 4,146 -92 -2.2
Financials 7,160 7,284 -124 -1.7
Machinery 2,797 2,895 -98 -3.4
Electrical machinery, precision equipment
5,035 5,167 -131 -2.5
Chemicals 4,232 4,339 -107 -2.5
Trading companies 2,852 3,025 -173 -5.7
Financials 7,483 7,618 -135 -1.8
Telecommunications 3,404 3,656 -252 -6.9
Automobiles 7,435 7,854 -419 -5.3
Note: Latest estimates as of 28 May 2018. Previous estimates as of 25 February 2018.
Source: Nomura
Nomura | JPN Outlook for FY18-19 corporate earnings June 4, 2018
9
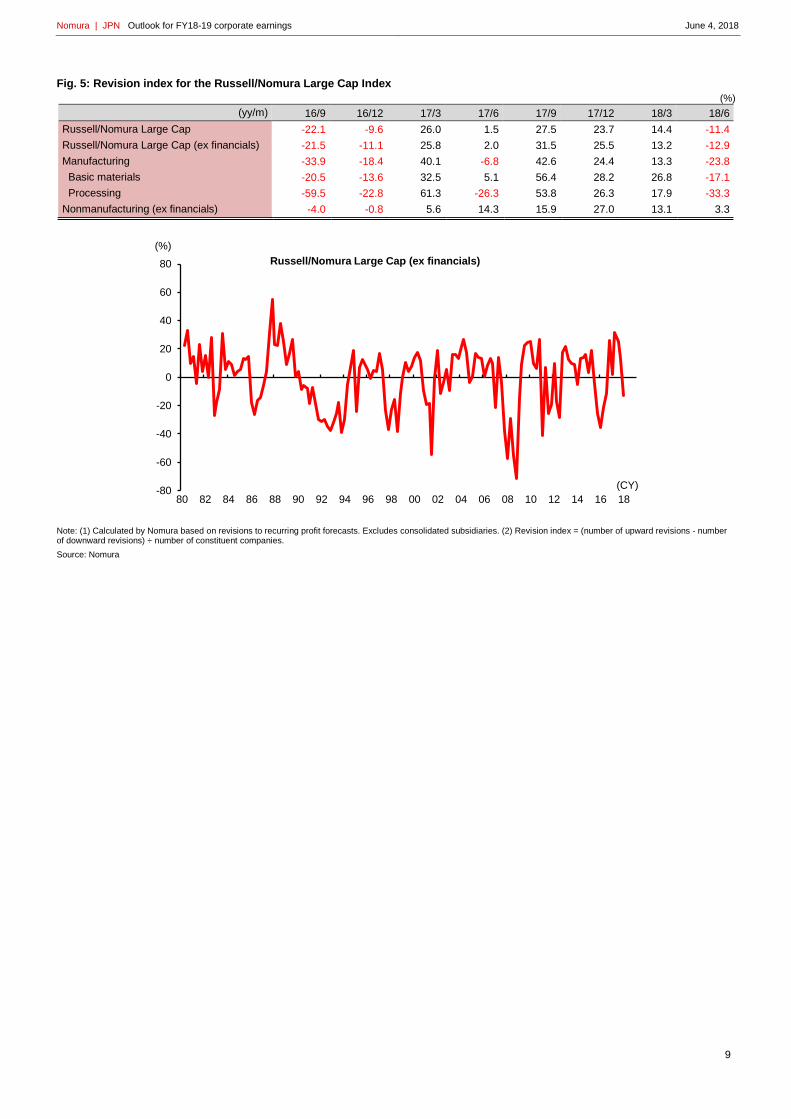
Fig. 5: Revision index for the Russell/Nomura Large Cap Index
(%)
(yy/m) 16/9 16/12 17/3 17/6 17/9 17/12 18/3 18/6
Russell/Nomura Large Cap -22.1 -9.6 26.0 1.5 27.5 23.7 14.4 -11.4
Russell/Nomura Large Cap (ex financials) -21.5 -11.1 25.8 2.0 31.5 25.5 13.2 -12.9
Manufacturing -33.9 -18.4 40.1 -6.8 42.6 24.4 13.3 -23.8
Basic materials -20.5 -13.6 32.5 5.1 56.4 28.2 26.8 -17.1
Processing -59.5 -22.8 61.3 -26.3 53.8 26.3 17.9 -33.3
Nonmanufacturing (ex financials) -4.0 -0.8 5.6 14.3 15.9 27.0 13.1 3.3
Note: (1) Calculated by Nomura based on revisions to recurring profit forecasts. Excludes consolidated subsidiaries. (2) Revision index = (number of upward revisions - number of downward revisions) ÷ number of constituent companies.
Source: Nomura
-80
-60
-40
-20
0
20
40
60
80
80 82 84 86 88 90 92 94 96 98 00 02 04 06 08 10 12 14 16 18
(%)
(CY)
Russell/Nomura Large Cap (ex financials)
Nomura | JPN Outlook for FY18-19 corporate earnings June 4, 2018
10
Russell/Nomura Large Cap Index: earnings indicators
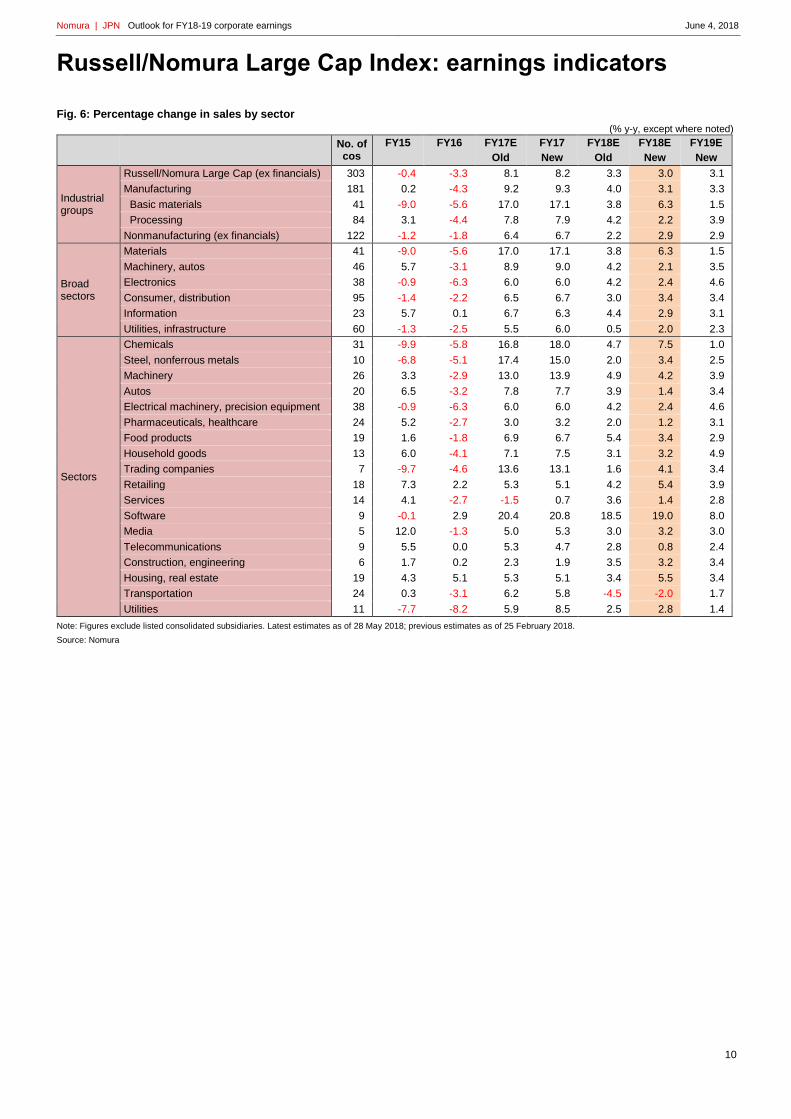
Fig. 6: Percentage change in sales by sector
(% y-y, except where noted)
No. of cos
FY15 FY16 FY17E FY17 FY18E FY18E FY19E
Old New Old New New
Industrial groups
Russell/Nomura Large Cap (ex financials) 303 -0.4 -3.3 8.1 8.2 3.3 3.0 3.1
Manufacturing 181 0.2 -4.3 9.2 9.3 4.0 3.1 3.3
Basic materials 41 -9.0 -5.6 17.0 17.1 3.8 6.3 1.5
Processing 84 3.1 -4.4 7.8 7.9 4.2 2.2 3.9
Nonmanufacturing (ex financials) 122 -1.2 -1.8 6.4 6.7 2.2 2.9 2.9
Broad sectors
Materials 41 -9.0 -5.6 17.0 17.1 3.8 6.3 1.5
Machinery, autos 46 5.7 -3.1 8.9 9.0 4.2 2.1 3.5
Electronics 38 -0.9 -6.3 6.0 6.0 4.2 2.4 4.6
Consumer, distribution 95 -1.4 -2.2 6.5 6.7 3.0 3.4 3.4
Information 23 5.7 0.1 6.7 6.3 4.4 2.9 3.1
Utilities, infrastructure 60 -1.3 -2.5 5.5 6.0 0.5 2.0 2.3
Sectors
Chemicals 31 -9.9 -5.8 16.8 18.0 4.7 7.5 1.0
Steel, nonferrous metals 10 -6.8 -5.1 17.4 15.0 2.0 3.4 2.5
Machinery 26 3.3 -2.9 13.0 13.9 4.9 4.2 3.9
Autos 20 6.5 -3.2 7.8 7.7 3.9 1.4 3.4
Electrical machinery, precision equipment 38 -0.9 -6.3 6.0 6.0 4.2 2.4 4.6
Pharmaceuticals, healthcare 24 5.2 -2.7 3.0 3.2 2.0 1.2 3.1
Food products 19 1.6 -1.8 6.9 6.7 5.4 3.4 2.9
Household goods 13 6.0 -4.1 7.1 7.5 3.1 3.2 4.9
Trading companies 7 -9.7 -4.6 13.6 13.1 1.6 4.1 3.4
Retailing 18 7.3 2.2 5.3 5.1 4.2 5.4 3.9
Services 14 4.1 -2.7 -1.5 0.7 3.6 1.4 2.8
Software 9 -0.1 2.9 20.4 20.8 18.5 19.0 8.0
Media 5 12.0 -1.3 5.0 5.3 3.0 3.2 3.0
Telecommunications 9 5.5 0.0 5.3 4.7 2.8 0.8 2.4
Construction, engineering 6 1.7 0.2 2.3 1.9 3.5 3.2 3.4
Housing, real estate 19 4.3 5.1 5.3 5.1 3.4 5.5 3.4
Transportation 24 0.3 -3.1 6.2 5.8 -4.5 -2.0 1.7
Utilities 11 -7.7 -8.2 5.9 8.5 2.5 2.8 1.4
Note: Figures exclude listed consolidated subsidiaries. Latest estimates as of 28 May 2018; previous estimates as of 25 February 2018.
Source: Nomura
Nomura | JPN Outlook for FY18-19 corporate earnings June 4, 2018
11
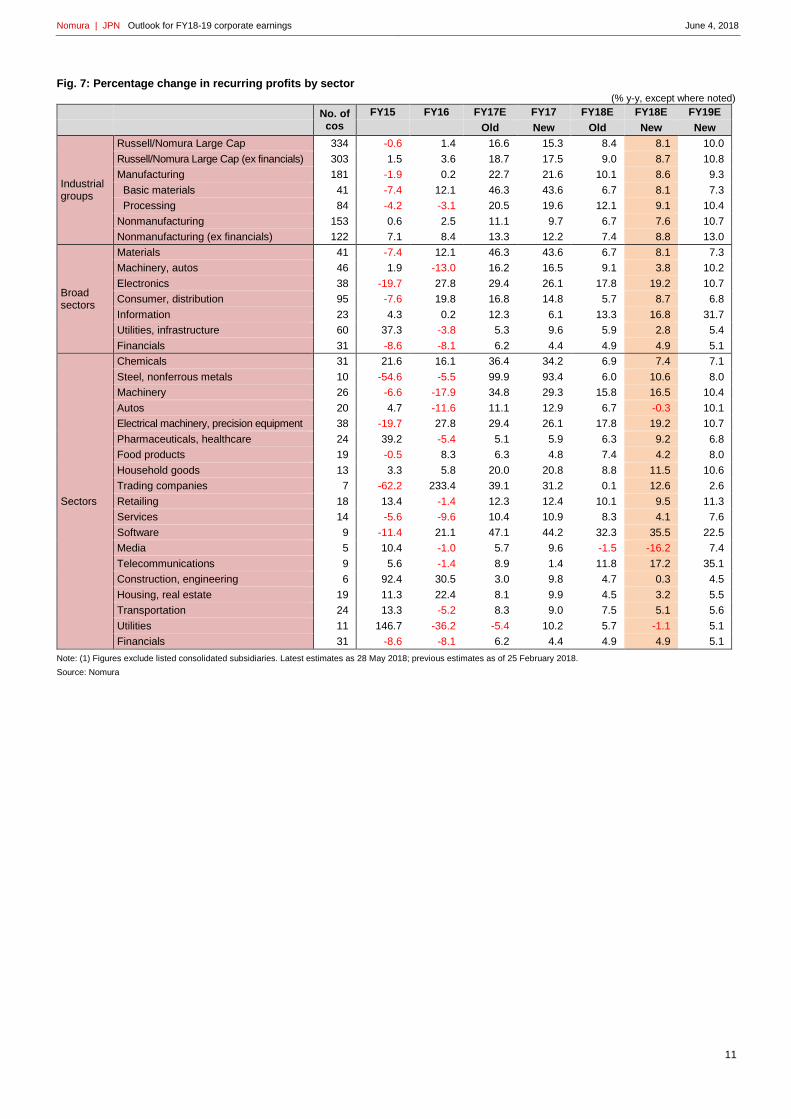
Fig. 7: Percentage change in recurring profits by sector
(% y-y, except where noted)
No. of cos
FY15 FY16 FY17E FY17 FY18E FY18E FY19E
Old New Old New New
Industrial groups
Russell/Nomura Large Cap 334 -0.6 1.4 16.6 15.3 8.4 8.1 10.0
Russell/Nomura Large Cap (ex financials) 303 1.5 3.6 18.7 17.5 9.0 8.7 10.8
Manufacturing 181 -1.9 0.2 22.7 21.6 10.1 8.6 9.3
Basic materials 41 -7.4 12.1 46.3 43.6 6.7 8.1 7.3
Processing 84 -4.2 -3.1 20.5 19.6 12.1 9.1 10.4
Nonmanufacturing 153 0.6 2.5 11.1 9.7 6.7 7.6 10.7
Nonmanufacturing (ex financials) 122 7.1 8.4 13.3 12.2 7.4 8.8 13.0
Broad sectors
Materials 41 -7.4 12.1 46.3 43.6 6.7 8.1 7.3
Machinery, autos 46 1.9 -13.0 16.2 16.5 9.1 3.8 10.2
Electronics 38 -19.7 27.8 29.4 26.1 17.8 19.2 10.7
Consumer, distribution 95 -7.6 19.8 16.8 14.8 5.7 8.7 6.8
Information 23 4.3 0.2 12.3 6.1 13.3 16.8 31.7
Utilities, infrastructure 60 37.3 -3.8 5.3 9.6 5.9 2.8 5.4
Financials 31 -8.6 -8.1 6.2 4.4 4.9 4.9 5.1
Sectors
Chemicals 31 21.6 16.1 36.4 34.2 6.9 7.4 7.1
Steel, nonferrous metals 10 -54.6 -5.5 99.9 93.4 6.0 10.6 8.0
Machinery 26 -6.6 -17.9 34.8 29.3 15.8 16.5 10.4
Autos 20 4.7 -11.6 11.1 12.9 6.7 -0.3 10.1
Electrical machinery, precision equipment 38 -19.7 27.8 29.4 26.1 17.8 19.2 10.7
Pharmaceuticals, healthcare 24 39.2 -5.4 5.1 5.9 6.3 9.2 6.8
Food products 19 -0.5 8.3 6.3 4.8 7.4 4.2 8.0
Household goods 13 3.3 5.8 20.0 20.8 8.8 11.5 10.6
Trading companies 7 -62.2 233.4 39.1 31.2 0.1 12.6 2.6
Retailing 18 13.4 -1.4 12.3 12.4 10.1 9.5 11.3
Services 14 -5.6 -9.6 10.4 10.9 8.3 4.1 7.6
Software 9 -11.4 21.1 47.1 44.2 32.3 35.5 22.5
Media 5 10.4 -1.0 5.7 9.6 -1.5 -16.2 7.4
Telecommunications 9 5.6 -1.4 8.9 1.4 11.8 17.2 35.1
Construction, engineering 6 92.4 30.5 3.0 9.8 4.7 0.3 4.5
Housing, real estate 19 11.3 22.4 8.1 9.9 4.5 3.2 5.5
Transportation 24 13.3 -5.2 8.3 9.0 7.5 5.1 5.6
Utilities 11 146.7 -36.2 -5.4 10.2 5.7 -1.1 5.1
Financials 31 -8.6 -8.1 6.2 4.4 4.9 4.9 5.1
Note: (1) Figures exclude listed consolidated subsidiaries. Latest estimates as 28 May 2018; previous estimates as of 25 February 2018.
Source: Nomura
Nomura | JPN Outlook for FY18-19 corporate earnings June 4, 2018
12
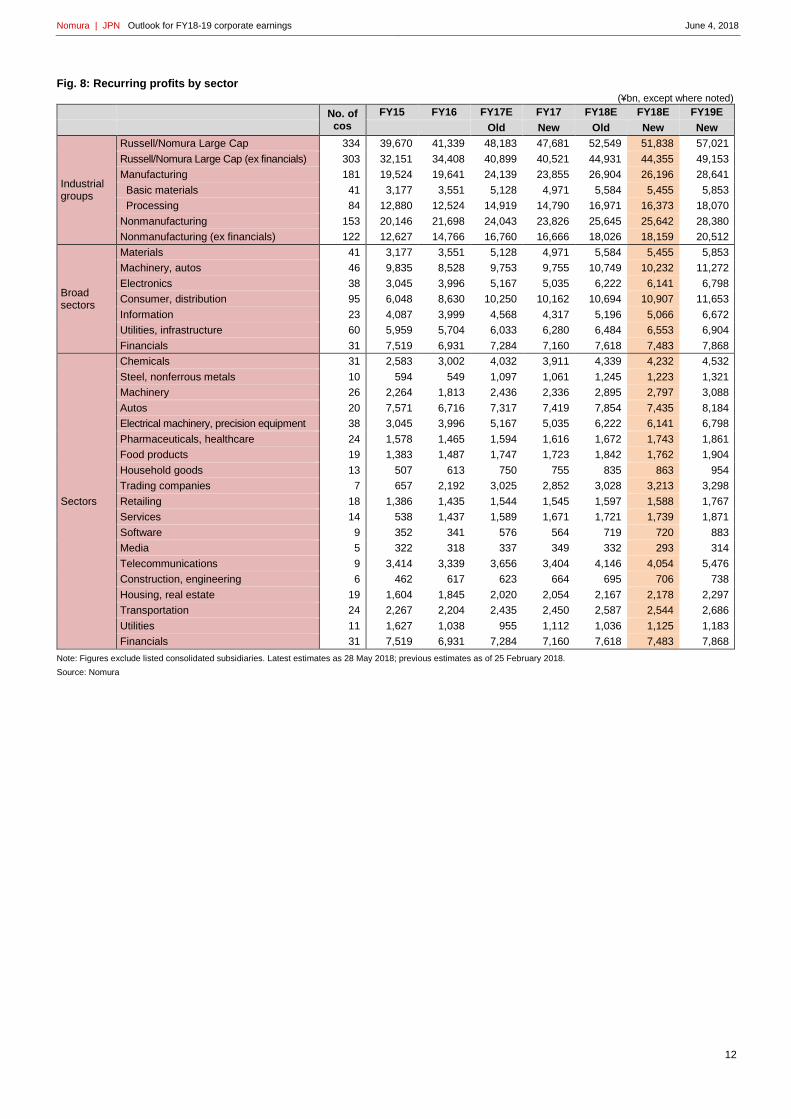
Fig. 8: Recurring profits by sector
(¥bn, except where noted)
No. of cos
FY15 FY16 FY17E FY17 FY18E FY18E FY19E
Old New Old New New
Industrial groups
Russell/Nomura Large Cap 334 39,670 41,339 48,183 47,681 52,549 51,838 57,021
Russell/Nomura Large Cap (ex financials) 303 32,151 34,408 40,899 40,521 44,931 44,355 49,153
Manufacturing 181 19,524 19,641 24,139 23,855 26,904 26,196 28,641
Basic materials 41 3,177 3,551 5,128 4,971 5,584 5,455 5,853
Processing 84 12,880 12,524 14,919 14,790 16,971 16,373 18,070
Nonmanufacturing 153 20,146 21,698 24,043 23,826 25,645 25,642 28,380
Nonmanufacturing (ex financials) 122 12,627 14,766 16,760 16,666 18,026 18,159 20,512
Broad sectors
Materials 41 3,177 3,551 5,128 4,971 5,584 5,455 5,853
Machinery, autos 46 9,835 8,528 9,753 9,755 10,749 10,232 11,272
Electronics 38 3,045 3,996 5,167 5,035 6,222 6,141 6,798
Consumer, distribution 95 6,048 8,630 10,250 10,162 10,694 10,907 11,653
Information 23 4,087 3,999 4,568 4,317 5,196 5,066 6,672
Utilities, infrastructure 60 5,959 5,704 6,033 6,280 6,484 6,553 6,904
Financials 31 7,519 6,931 7,284 7,160 7,618 7,483 7,868
Sectors
Chemicals 31 2,583 3,002 4,032 3,911 4,339 4,232 4,532
Steel, nonferrous metals 10 594 549 1,097 1,061 1,245 1,223 1,321
Machinery 26 2,264 1,813 2,436 2,336 2,895 2,797 3,088
Autos 20 7,571 6,716 7,317 7,419 7,854 7,435 8,184
Electrical machinery, precision equipment 38 3,045 3,996 5,167 5,035 6,222 6,141 6,798
Pharmaceuticals, healthcare 24 1,578 1,465 1,594 1,616 1,672 1,743 1,861
Food products 19 1,383 1,487 1,747 1,723 1,842 1,762 1,904
Household goods 13 507 613 750 755 835 863 954
Trading companies 7 657 2,192 3,025 2,852 3,028 3,213 3,298
Retailing 18 1,386 1,435 1,544 1,545 1,597 1,588 1,767
Services 14 538 1,437 1,589 1,671 1,721 1,739 1,871
Software 9 352 341 576 564 719 720 883
Media 5 322 318 337 349 332 293 314
Telecommunications 9 3,414 3,339 3,656 3,404 4,146 4,054 5,476
Construction, engineering 6 462 617 623 664 695 706 738
Housing, real estate 19 1,604 1,845 2,020 2,054 2,167 2,178 2,297
Transportation 24 2,267 2,204 2,435 2,450 2,587 2,544 2,686
Utilities 11 1,627 1,038 955 1,112 1,036 1,125 1,183
Financials 31 7,519 6,931 7,284 7,160 7,618 7,483 7,868
Note: Figures exclude listed consolidated subsidiaries. Latest estimates as 28 May 2018; previous estimates as of 25 February 2018.
Source: Nomura
Nomura | JPN Outlook for FY18-19 corporate earnings June 4, 2018
13
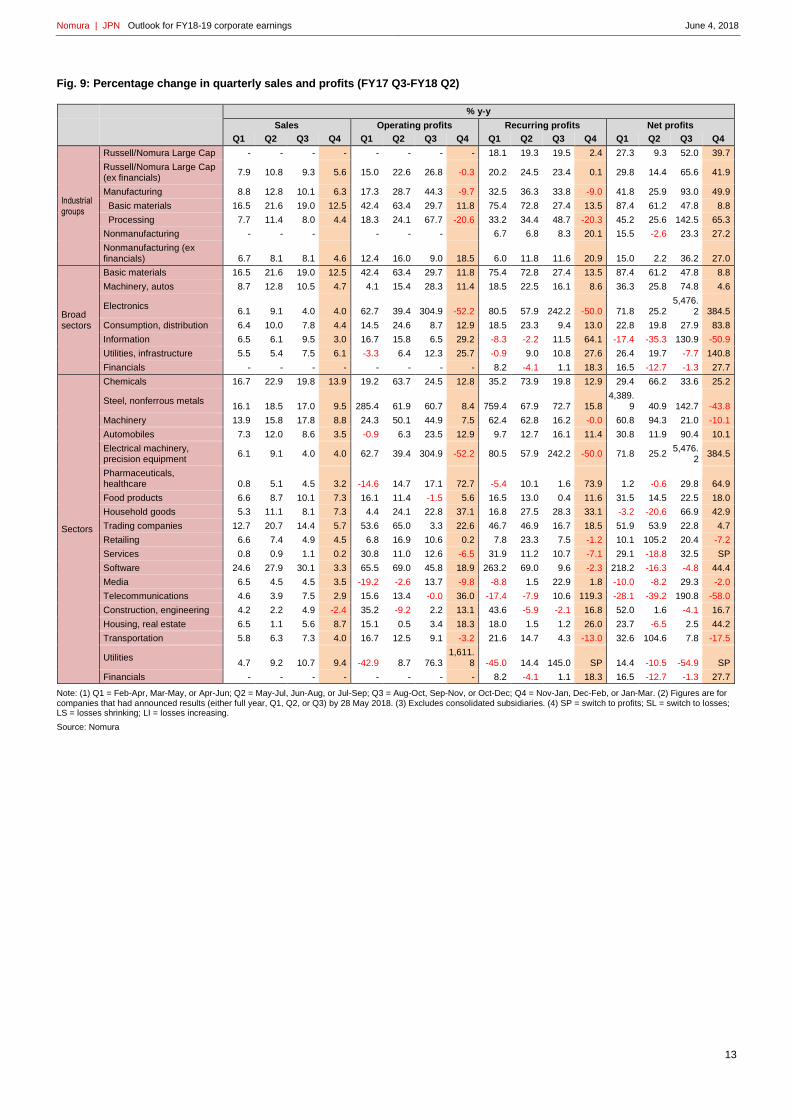
Fig. 9: Percentage change in quarterly sales and profits (FY17 Q3-FY18 Q2)
% y-y
Sales Operating profits Recurring profits Net profits
Q1 Q2 Q3 Q4 Q1 Q2 Q3 Q4 Q1 Q2 Q3 Q4 Q1 Q2 Q3 Q4
Industrial groups
Russell/Nomura Large Cap - - - - - - - - 18.1 19.3 19.5 2.4 27.3 9.3 52.0 39.7
Russell/Nomura Large Cap (ex financials)
7.9 10.8 9.3 5.6 15.0 22.6 26.8 -0.3 20.2 24.5 23.4 0.1 29.8 14.4 65.6 41.9
Manufacturing 8.8 12.8 10.1 6.3 17.3 28.7 44.3 -9.7 32.5 36.3 33.8 -9.0 41.8 25.9 93.0 49.9
Basic materials 16.5 21.6 19.0 12.5 42.4 63.4 29.7 11.8 75.4 72.8 27.4 13.5 87.4 61.2 47.8 8.8
Processing 7.7 11.4 8.0 4.4 18.3 24.1 67.7 -20.6 33.2 34.4 48.7 -20.3 45.2 25.6 142.5 65.3
Nonmanufacturing - - - - - - 6.7 6.8 8.3 20.1 15.5 -2.6 23.3 27.2
Nonmanufacturing (ex financials) 6.7 8.1 8.1 4.6 12.4 16.0 9.0 18.5 6.0 11.8 11.6 20.9 15.0 2.2 36.2 27.0
Broad sectors
Basic materials 16.5 21.6 19.0 12.5 42.4 63.4 29.7 11.8 75.4 72.8 27.4 13.5 87.4 61.2 47.8 8.8
Machinery, autos 8.7 12.8 10.5 4.7 4.1 15.4 28.3 11.4 18.5 22.5 16.1 8.6 36.3 25.8 74.8 4.6
Electronics 6.1 9.1 4.0 4.0 62.7 39.4 304.9 -52.2 80.5 57.9 242.2 -50.0 71.8 25.2
5,476.2 384.5
Consumption, distribution 6.4 10.0 7.8 4.4 14.5 24.6 8.7 12.9 18.5 23.3 9.4 13.0 22.8 19.8 27.9 83.8
Information 6.5 6.1 9.5 3.0 16.7 15.8 6.5 29.2 -8.3 -2.2 11.5 64.1 -17.4 -35.3 130.9 -50.9
Utilities, infrastructure 5.5 5.4 7.5 6.1 -3.3 6.4 12.3 25.7 -0.9 9.0 10.8 27.6 26.4 19.7 -7.7 140.8
Financials - - - - - - - - 8.2 -4.1 1.1 18.3 16.5 -12.7 -1.3 27.7
Sectors
Chemicals 16.7 22.9 19.8 13.9 19.2 63.7 24.5 12.8 35.2 73.9 19.8 12.9 29.4 66.2 33.6 25.2
Steel, nonferrous metals 16.1 18.5 17.0 9.5 285.4 61.9 60.7 8.4 759.4 67.9 72.7 15.8
4,389.9 40.9 142.7 -43.8
Machinery 13.9 15.8 17.8 8.8 24.3 50.1 44.9 7.5 62.4 62.8 16.2 -0.0 60.8 94.3 21.0 -10.1
Automobiles 7.3 12.0 8.6 3.5 -0.9 6.3 23.5 12.9 9.7 12.7 16.1 11.4 30.8 11.9 90.4 10.1
Electrical machinery, precision equipment
6.1 9.1 4.0 4.0 62.7 39.4 304.9 -52.2 80.5 57.9 242.2 -50.0 71.8 25.2 5,476.
2 384.5
Pharmaceuticals, healthcare 0.8 5.1 4.5 3.2 -14.6 14.7 17.1 72.7 -5.4 10.1 1.6 73.9 1.2 -0.6 29.8 64.9
Food products 6.6 8.7 10.1 7.3 16.1 11.4 -1.5 5.6 16.5 13.0 0.4 11.6 31.5 14.5 22.5 18.0
Household goods 5.3 11.1 8.1 7.3 4.4 24.1 22.8 37.1 16.8 27.5 28.3 33.1 -3.2 -20.6 66.9 42.9
Trading companies 12.7 20.7 14.4 5.7 53.6 65.0 3.3 22.6 46.7 46.9 16.7 18.5 51.9 53.9 22.8 4.7
Retailing 6.6 7.4 4.9 4.5 6.8 16.9 10.6 0.2 7.8 23.3 7.5 -1.2 10.1 105.2 20.4 -7.2
Services 0.8 0.9 1.1 0.2 30.8 11.0 12.6 -6.5 31.9 11.2 10.7 -7.1 29.1 -18.8 32.5 SP
Software 24.6 27.9 30.1 3.3 65.5 69.0 45.8 18.9 263.2 69.0 9.6 -2.3 218.2 -16.3 -4.8 44.4
Media 6.5 4.5 4.5 3.5 -19.2 -2.6 13.7 -9.8 -8.8 1.5 22.9 1.8 -10.0 -8.2 29.3 -2.0
Telecommunications 4.6 3.9 7.5 2.9 15.6 13.4 -0.0 36.0 -17.4 -7.9 10.6 119.3 -28.1 -39.2 190.8 -58.0
Construction, engineering 4.2 2.2 4.9 -2.4 35.2 -9.2 2.2 13.1 43.6 -5.9 -2.1 16.8 52.0 1.6 -4.1 16.7
Housing, real estate 6.5 1.1 5.6 8.7 15.1 0.5 3.4 18.3 18.0 1.5 1.2 26.0 23.7 -6.5 2.5 44.2
Transportation 5.8 6.3 7.3 4.0 16.7 12.5 9.1 -3.2 21.6 14.7 4.3 -13.0 32.6 104.6 7.8 -17.5
Utilities 4.7 9.2 10.7 9.4 -42.9 8.7 76.3
1,611.8 -45.0 14.4 145.0 SP 14.4 -10.5 -54.9 SP
Financials - - - - - - - - 8.2 -4.1 1.1 18.3 16.5 -12.7 -1.3 27.7
Note: (1) Q1 = Feb-Apr, Mar-May, or Apr-Jun; Q2 = May-Jul, Jun-Aug, or Jul-Sep; Q3 = Aug-Oct, Sep-Nov, or Oct-Dec; Q4 = Nov-Jan, Dec-Feb, or Jan-Mar. (2) Figures are for companies that had announced results (either full year, Q1, Q2, or Q3) by 28 May 2018. (3) Excludes consolidated subsidiaries. (4) SP = switch to profits; SL = switch to losses; LS = losses shrinking; LI = losses increasing.
Source: Nomura
Nomura | JPN Outlook for FY18-19 corporate earnings June 4, 2018
14
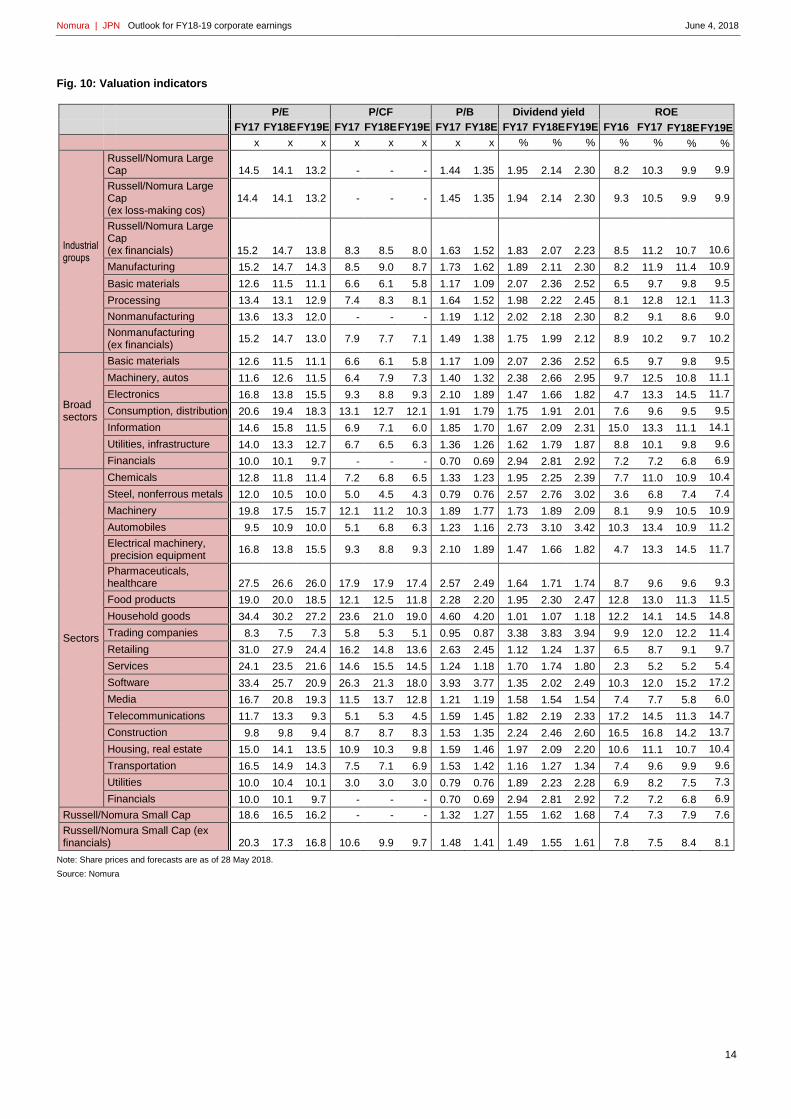
Fig. 10: Valuation indicators
P/E P/CF P/B Dividend yield ROE
FY17 FY18E FY19E FY17 FY18E FY19E FY17 FY18E FY17 FY18E FY19E FY16 FY17 FY18E FY19E
x x x x x x x x % % % % % % %
Industrial groups
Russell/Nomura Large Cap 14.5 14.1 13.2 - - - 1.44 1.35 1.95 2.14 2.30 8.2 10.3 9.9 9.9
Russell/Nomura Large Cap (ex loss-making cos)
14.4 14.1 13.2 - - - 1.45 1.35 1.94 2.14 2.30 9.3 10.5 9.9 9.9
Russell/Nomura Large Cap (ex financials) 15.2 14.7 13.8 8.3 8.5 8.0 1.63 1.52 1.83 2.07 2.23 8.5 11.2 10.7 10.6
Manufacturing 15.2 14.7 14.3 8.5 9.0 8.7 1.73 1.62 1.89 2.11 2.30 8.2 11.9 11.4 10.9
Basic materials 12.6 11.5 11.1 6.6 6.1 5.8 1.17 1.09 2.07 2.36 2.52 6.5 9.7 9.8 9.5
Processing 13.4 13.1 12.9 7.4 8.3 8.1 1.64 1.52 1.98 2.22 2.45 8.1 12.8 12.1 11.3
Nonmanufacturing 13.6 13.3 12.0 - - - 1.19 1.12 2.02 2.18 2.30 8.2 9.1 8.6 9.0
Nonmanufacturing (ex financials)
15.2 14.7 13.0 7.9 7.7 7.1 1.49 1.38 1.75 1.99 2.12 8.9 10.2 9.7 10.2
Broad sectors
Basic materials 12.6 11.5 11.1 6.6 6.1 5.8 1.17 1.09 2.07 2.36 2.52 6.5 9.7 9.8 9.5
Machinery, autos 11.6 12.6 11.5 6.4 7.9 7.3 1.40 1.32 2.38 2.66 2.95 9.7 12.5 10.8 11.1
Electronics 16.8 13.8 15.5 9.3 8.8 9.3 2.10 1.89 1.47 1.66 1.82 4.7 13.3 14.5 11.7
Consumption, distribution 20.6 19.4 18.3 13.1 12.7 12.1 1.91 1.79 1.75 1.91 2.01 7.6 9.6 9.5 9.5
Information 14.6 15.8 11.5 6.9 7.1 6.0 1.85 1.70 1.67 2.09 2.31 15.0 13.3 11.1 14.1
Utilities, infrastructure 14.0 13.3 12.7 6.7 6.5 6.3 1.36 1.26 1.62 1.79 1.87 8.8 10.1 9.8 9.6
Financials 10.0 10.1 9.7 - - - 0.70 0.69 2.94 2.81 2.92 7.2 7.2 6.8 6.9
Sectors
Chemicals 12.8 11.8 11.4 7.2 6.8 6.5 1.33 1.23 1.95 2.25 2.39 7.7 11.0 10.9 10.4
Steel, nonferrous metals 12.0 10.5 10.0 5.0 4.5 4.3 0.79 0.76 2.57 2.76 3.02 3.6 6.8 7.4 7.4
Machinery 19.8 17.5 15.7 12.1 11.2 10.3 1.89 1.77 1.73 1.89 2.09 8.1 9.9 10.5 10.9
Automobiles 9.5 10.9 10.0 5.1 6.8 6.3 1.23 1.16 2.73 3.10 3.42 10.3 13.4 10.9 11.2
Electrical machinery, precision equipment
16.8 13.8 15.5 9.3 8.8 9.3 2.10 1.89 1.47 1.66 1.82 4.7 13.3 14.5 11.7
Pharmaceuticals, healthcare 27.5 26.6 26.0 17.9 17.9 17.4 2.57 2.49 1.64 1.71 1.74 8.7 9.6 9.6 9.3
Food products 19.0 20.0 18.5 12.1 12.5 11.8 2.28 2.20 1.95 2.30 2.47 12.8 13.0 11.3 11.5
Household goods 34.4 30.2 27.2 23.6 21.0 19.0 4.60 4.20 1.01 1.07 1.18 12.2 14.1 14.5 14.8
Trading companies 8.3 7.5 7.3 5.8 5.3 5.1 0.95 0.87 3.38 3.83 3.94 9.9 12.0 12.2 11.4
Retailing 31.0 27.9 24.4 16.2 14.8 13.6 2.63 2.45 1.12 1.24 1.37 6.5 8.7 9.1 9.7
Services 24.1 23.5 21.6 14.6 15.5 14.5 1.24 1.18 1.70 1.74 1.80 2.3 5.2 5.2 5.4
Software 33.4 25.7 20.9 26.3 21.3 18.0 3.93 3.77 1.35 2.02 2.49 10.3 12.0 15.2 17.2
Media 16.7 20.8 19.3 11.5 13.7 12.8 1.21 1.19 1.58 1.54 1.54 7.4 7.7 5.8 6.0
Telecommunications 11.7 13.3 9.3 5.1 5.3 4.5 1.59 1.45 1.82 2.19 2.33 17.2 14.5 11.3 14.7
Construction 9.8 9.8 9.4 8.7 8.7 8.3 1.53 1.35 2.24 2.46 2.60 16.5 16.8 14.2 13.7
Housing, real estate 15.0 14.1 13.5 10.9 10.3 9.8 1.59 1.46 1.97 2.09 2.20 10.6 11.1 10.7 10.4
Transportation 16.5 14.9 14.3 7.5 7.1 6.9 1.53 1.42 1.16 1.27 1.34 7.4 9.6 9.9 9.6
Utilities 10.0 10.4 10.1 3.0 3.0 3.0 0.79 0.76 1.89 2.23 2.28 6.9 8.2 7.5 7.3
Financials 10.0 10.1 9.7 - - - 0.70 0.69 2.94 2.81 2.92 7.2 7.2 6.8 6.9
Russell/Nomura Small Cap 18.6 16.5 16.2 - - - 1.32 1.27 1.55 1.62 1.68 7.4 7.3 7.9 7.6
Russell/Nomura Small Cap (ex financials) 20.3 17.3 16.8 10.6 9.9 9.7 1.48 1.41 1.49 1.55 1.61 7.8 7.5 8.4 8.1
Note: Share prices and forecasts are as of 28 May 2018.
Source: Nomura
Nomura | JPN Outlook for FY18-19 corporate earnings June 4, 2018
15
What are the Russell/Nomura Japan Equity Indexes? The Russell/Nomura Japan Equity Indexes are Japanese equity indexes developed jointly by FTSE Russell Indexes and the
Global Research Division, Financial Engineering & Technology Research Center, Nomura Securities Co., Ltd.
Russell/Nomura Japan Equity Indexes should be useful in:
Determining investment strategies (strategic asset allocation)
Determining manager structures
Devising asset management benchmarks
Supporting portfolio management activities
Evaluating the performance of various investment styles
Managing risk
Russell/Nomura Japan Equity Indexes have the following characteristics:
They are share price indexes that are weighted by free-float-adjusted market capitalization and cover the top 98% of all
listed stocks in terms of float-adjusted market capitalization, thereby offering broad market coverage
In addition to stocks listed on the First Section of the Tokyo Stock Exchange (TSE-1), they include stocks listed on
other exchanges
Because the indexes take into consideration the stable shareholding ratio, they reflect the stocks that are actually
available for investment
There are style indexes for large and small companies and for value and growth stocks
The Prime Index consists of the top 1,000 stocks in the Total Market Index by market cap excluding stable
shareholdings
Stocks are selected quantitatively based on clearly defined criteria
The composition of each index is reviewed once a year.
Complete details of rules for the Russell/Nomura Japan Equity Index can be found in the Russell/Nomura Japan Equity Index
Rulebook.
The intellectual property right and any other rights, in Russell/Nomura Japan Equity Index belong to Nomura Securities Co., Ltd.
("Nomura") and Frank Russell Company ("Russell"). Nomura and Russell do not guarantee accuracy, completeness, reliability,
usefulness, marketability, merchantability or fitness of the Index, and do not account for business activities or services that any
index user and/or its affiliates undertakes with the use of the Index.
Nomura | JPN Outlook for FY18-19 corporate earnings June 4, 2018
16
Any Authors named on this report are Research Analysts unless otherwise indicated
Analyst Certification I, Japan Equity Research, hereby certify (1) that the views expressed in this Research report accurately reflect my personal views about any or all of the subject securities or issuers referred to in this Research report, (2) no part of my compensation was, is or will be directly or indirectly related to the specific recommendations or views expressed in this Research report and (3) no part of my compensation is tied to any specific investment banking transactions performed by Nomura Securities International, Inc., Nomura International plc or any other Nomura Group company.
Important Disclosures Online availability of research and conflict-of-interest disclosures Nomura Group research is available on www.nomuranow.com/research, Bloomberg, Capital IQ, Factset, Reuters and ThomsonOne. Important disclosures may be read at http://go.nomuranow.com/research/globalresearchportal/pages/disclosures/disclosures.aspx or requested from Nomura Securities International, Inc., or Instinet, LLC on 1-877-865-5752. If you have any difficulties with the website, please email [email protected] for help. The analysts responsible for preparing this report have received compensation based upon various factors including the firm's total revenues, a portion of which is generated by Investment Banking activities. Unless otherwise noted, the non-US analysts listed at the front of this report are not registered/qualified as research analysts under FINRA rules, may not be associated persons of NSI or ILLC, and may not be subject to FINRA Rule 2241 restrictions on communications with covered companies, public appearances, and trading securities held by a research analyst account.
Nomura Global Financial Products Inc. (“NGFP”) Nomura Derivative Products Inc. (“NDPI”) and Nomura International plc. (“NIplc”) are registered with the Commodities Futures Trading Commission and the National Futures Association (NFA) as swap dealers. NGFP, NDPI, and NIplc are generally engaged in the trading of swaps and other derivative products, any of which may be the subject of this report. Disclaimers This publication contains material that has been prepared by the Nomura Group entity identified on page 1 and, if applicable, with the contributions of one or more Nomura Group entities whose employees and their respective affiliations are specified on page 1 or identified elsewhere in the publication. The term "Nomura Group" used herein refers to Nomura Holdings, Inc. and its affiliates and subsidiaries including: Nomura Securities Co., Ltd. ('NSC') Tokyo, Japan; Nomura International plc ('NIplc'), UK; Nomura Securities International, Inc. ('NSI'), New York, US; Instinet, LLC ('ILLC'); Nomura International (Hong Kong) Ltd. (‘NIHK’), Hong Kong; Nomura Financial Investment (Korea) Co., Ltd. (‘NFIK’), Korea (Information on Nomura analysts registered with the Korea Financial Investment Association ('KOFIA') can be found on the KOFIA Intranet at http://dis.kofia.or.kr); Nomura Singapore Ltd. (‘NSL’), Singapore (Registration number 197201440E, regulated by the Monetary Authority of Singapore); Nomura Australia Ltd. (‘NAL’), Australia (ABN 48 003 032 513), regulated by the Australian Securities and Investment Commission ('ASIC') and holder of an Australian financial services licence number 246412; PT Nomura Sekuritas Indonesia (‘PTNSI’); Nomura Securities Malaysia Sdn. Bhd. (‘NSM’), Malaysia; NIHK, Taipei Branch (‘NITB’), Taiwan; Nomura Financial Advisory and Securities (India) Private Limited (‘NFASL’), Mumbai, India (Registered Address: Ceejay House, Level 11, Plot F, Shivsagar Estate, Dr. Annie Besant Road, Worli, Mumbai- 400 018, India; Tel: +91 22 4037 4037, Fax: +91 22 4037 4111; CIN No: U74140MH2007PTC169116, SEBI Registration No. for Stock Broking activities : BSE INB011299030, NSE INB231299034, INF231299034, INE 231299034, MCX: INE261299034; SEBI Registration No. for Merchant Banking : INM000011419; SEBI Registration No. for Research: INH000001014 and NIplc, Madrid Branch (‘NIplc, Madrid’). ‘CNS Thailand’ next to an analyst’s name on the front page of a research report indicates that the analyst is employed by Capital Nomura Securities Public Company Limited (‘CNS’) to provide research assistance services to NSL under an agreement between CNS and NSL. ‘NSFSPL’ next to an employee’s name on the front page of a research report indicates that the individual is employed by Nomura Structured Finance Services Private Limited to provide assistance to certain Nomura entities under inter-company agreements. The "BDO-NS" (which stands for "BDO Nomura Securities, Inc.") placed next to an analyst’s name on the front page of a research report indicates that the analyst is employed by BDO Unibank Inc. ("BDO Unibank") who has been seconded to BDO-NS, to provide research assistance services to NSL under an agreement between BDO Unibank, NSL and BDO-NS. BDO-NS is a Philippines securities dealer, which is a joint venture between BDO Unibank and the Nomura Group.
THIS MATERIAL IS: (I) FOR YOUR PRIVATE INFORMATION, AND WE ARE NOT SOLICITING ANY ACTION BASED UPON IT; (II) NOT TO BE CONSTRUED AS AN OFFER TO SELL OR A SOLICITATION OF AN OFFER TO BUY ANY SECURITY IN ANY JURISDICTION WHERE SUCH OFFER OR SOLICITATION WOULD BE ILLEGAL; AND (III) OTHER THAN DISCLOSURES RELATING TO THE NOMURA GROUP, BASED UPON INFORMATION FROM SOURCES THAT WE CONSIDER RELIABLE, BUT HAS NOT BEEN INDEPENDENTLY VERIFIED BY NOMURA GROUP. Other than disclosures relating to the Nomura Group, the Nomura Group does not warrant or represent that the document is accurate, complete, reliable, fit for any particular purpose or merchantable and does not accept liability for any act (or decision not to act) resulting from use of this document and related data. To the maximum extent permissible all warranties and other assurances by the Nomura Group are hereby excluded and the Nomura Group shall have no liability for the use, misuse, or distribution of this information. Opinions or estimates expressed are current opinions as of the original publication date appearing on this material and the information, including the opinions and estimates contained herein, are subject to change without notice. The Nomura Group is under no duty to update this document. Any comments or statements made herein are those of the author(s) and may differ from views held by other parties within Nomura Group. Clients should consider whether any advice or recommendation in this report is suitable for their particular circumstances and, if appropriate, seek professional advice, including tax advice. The Nomura Group does not provide tax advice. The Nomura Group, and/or its officers, directors and employees, may, to the extent permitted by applicable law and/or regulation, deal as principal, agent, or otherwise, or have long or short positions in, or buy or sell, the securities, commodities or instruments, or options or other derivative instruments based thereon, of issuers or securities mentioned herein. The Nomura Group companies may also act as market maker or liquidity provider (within the meaning of applicable regulations in the UK) in the financial instruments of the issuer. Where the activity of market maker is carried out in accordance with the definition given to it by specific laws and regulations of the US or other jurisdictions, this will be separately disclosed within the specific issuer disclosures. This document may contain information obtained from third parties, including ratings from credit ratings agencies such as Standard & Poor’s. Reproduction and distribution of third-party content in any form is prohibited except with the prior written permission of the related third-party. Third-party content providers do not guarantee the accuracy, completeness, timeliness or availability of any information, including ratings, and are not responsible for any errors or omissions (negligent or otherwise), regardless of the cause, or for the results obtained from the use of such content. Third-party content providers give no express or implied warranties, including, but not limited to, any warranties of merchantability or fitness for a particular purpose or use. Third-party content providers shall not be liable for any direct, indirect, incidental, exemplary,
Nomura | JPN Outlook for FY18-19 corporate earnings June 4, 2018
17
compensatory, punitive, special or consequential damages, costs, expenses, legal fees, or losses (including lost income or profits and opportunity costs) in connection with any use of their content, including ratings. Credit ratings are statements of opinions and are not statements of fact or recommendations to purchase hold or sell securities. They do not address the suitability of securities or the suitability of securities for investment purposes, and should not be relied on as investment advice. Any MSCI sourced information in this document is the exclusive property of MSCI Inc. (‘MSCI’). Without prior written permission of MSCI, this information and any other MSCI intellectual property may not be reproduced, re-disseminated or used to create any financial products, including any indices. This information is provided on an "as is" basis. The user assumes the entire risk of any use made of this information. MSCI, its affiliates and any third party involved in, or related to, computing or compiling the information hereby expressly disclaim all warranties of originality, accuracy, completeness, merchantability or fitness for a particular purpose with respect to any of this information. Without limiting any of the foregoing, in no event shall MSCI, any of its affiliates or any third party involved in, or related to, computing or compiling the information have any liability for any damages of any kind. MSCI and the MSCI indexes are services marks of MSCI and its affiliates. The intellectual property rights and any other rights, in Russell/Nomura Japan Equity Index belong to Nomura Securities Co., Ltd. ("Nomura") and Frank Russell Company ("Russell"). Nomura and Russell do not guarantee accuracy, completeness, reliability, usefulness, marketability, merchantability or fitness of the Index, and do not account for business activities or services that any index user and/or its affiliates undertakes with the use of the Index. Investors should consider this document as only a single factor in making their investment decision and, as such, the report should not be viewed as identifying or suggesting all risks, direct or indirect, that may be associated with any investment decision. Nomura Group produces a number of different types of research product including, among others, fundamental analysis and quantitative analysis; recommendations contained in one type of research product may differ from recommendations contained in other types of research product, whether as a result of differing time horizons, methodologies or otherwise. The Nomura Group publishes research product in a number of different ways including the posting of product on the Nomura Group portals and/or distribution directly to clients. Different groups of clients may receive different products and services from the research department depending on their individual requirements. Figures presented herein may refer to past performance or simulations based on past performance which are not reliable indicators of future performance. Where the information contains an indication of future performance, such forecasts may not be a reliable indicator of future performance. Moreover, simulations are based on models and simplifying assumptions which may oversimplify and not reflect the future distribution of returns. Any figure, strategy or index created and published for illustrative purposes within this document is not intended for “use” as a “benchmark” as defined by the European Benchmark Regulation. Certain securities are subject to fluctuations in exchange rates that could have an adverse effect on the value or price of, or income derived from, the investment. With respect to Fixed Income Research: Recommendations fall into two categories: tactical, which typically last up to three months; or strategic, which typically last from 6-12 months. However, trade recommendations may be reviewed at any time as circumstances change. ‘Stop loss’ levels for trades are also provided; which, if hit, closes the trade recommendation automatically. Prices and yields shown in recommendations are taken at the time of submission for publication and are based on either indicative Bloomberg, Reuters or Nomura prices and yields at that time. The prices and yields shown are not necessarily those at which the trade recommendation can be implemented. The securities described herein may not have been registered under the US Securities Act of 1933 (the ‘1933 Act’), and, in such case, may not be offered or sold in the US or to US persons unless they have been registered under the 1933 Act, or except in compliance with an exemption from the registration requirements of the 1933 Act. Unless governing law permits otherwise, any transaction should be executed via a Nomura entity in your home jurisdiction. This document has been approved for distribution in the UK and European Economic Area as investment research by NIplc. NIplc is authorised by the Prudential Regulation Authority and regulated by the Financial Conduct Authority and the Prudential Regulation Authority. NIplc is a member of the London Stock Exchange. This document does not constitute a personal recommendation within the meaning of applicable regulations in the UK, or take into account the particular investment objectives, financial situations, or needs of individual investors. This document is intended only for investors who are 'eligible counterparties' or 'professional clients' for the purposes of applicable regulations in the UK, and may not, therefore, be redistributed to persons who are 'retail clients' for such purposes. This document has been approved by NIHK, which is regulated by the Hong Kong Securities and Futures Commission, for distribution in Hong Kong by NIHK. This document has been approved for distribution in Australia by NAL, which is authorized and regulated in Australia by the ASIC. This document has also been approved for distribution in Malaysia by NSM. In Singapore, this document has been distributed by NSL. NSL accepts legal responsibility for the content of this document, where it concerns securities, futures and foreign exchange, issued by their foreign affiliates in respect of recipients who are not accredited, expert or institutional investors as defined by the Securities and Futures Act (Chapter 289). Recipients of this document in Singapore should contact NSL in respect of matters arising from, or in connection with, this document. Unless prohibited by the provisions of Regulation S of the 1933 Act, this material is distributed in the US, by NSI, a US-registered broker-dealer, which accepts responsibility for its contents in accordance with the provisions of Rule 15a-6, under the US Securities Exchange Act of 1934. The entity that prepared this document permits its separately operated affiliates within the Nomura Group to make copies of such documents available to their clients. This document has not been approved for distribution to persons other than ‘Authorised Persons’, ‘Exempt Persons’ or ‘Institutions’ (as defined by the Capital Markets Authority) in the Kingdom of Saudi Arabia (‘Saudi Arabia’) or 'professional clients' (as defined by the Dubai Financial Services Authority) in the United Arab Emirates (‘UAE’) or a ‘Market Counterparty’ or ‘Business Customers’ (as defined by the Qatar Financial Centre Regulatory Authority) in the State of Qatar (‘Qatar’) by Nomura Saudi Arabia, NIplc or any other member of the Nomura Group, as the case may be. Neither this document nor any copy thereof may be taken or transmitted or distributed, directly or indirectly, by any person other than those authorised to do so into Saudi Arabia or in the UAE or in Qatar or to any person other than ‘Authorised Persons’, ‘Exempt Persons’ or ‘Institutions’ located in Saudi Arabia or 'professional clients' in the UAE or a ‘Market Counterparty’ or ‘Business Customers’ in Qatar . By accepting to receive this document, you represent that you are not located in Saudi Arabia or that you are an ‘Authorised Person’, an ‘Exempt Person’ or an ‘Institution’ in Saudi Arabia or that you are a 'professional client' in the UAE or a ‘Market Counterparty’ or ‘Business Customers’ in Qatar and agree to comply with these restrictions. Any failure to comply with these restrictions may constitute a violation of the laws of the UAE or Saudi Arabia or Qatar. Notice to Canadian Investors: This research report is not a personal recommendation and does not take into account the investment objectives, financial situation or particular needs of any particular individual or account. It is made available to you in reliance on NI 31-103, section 8.25. For report with reference of TAIWAN public companies or authored by Taiwan based research analyst: THIS DOCUMENT IS SOLELY FOR REFERENCE ONLY. You should independently evaluate the investment risks and are solely responsible for your investment decisions. NO PORTION OF THE REPORT MAY BE REPRODUCED OR QUOTED BY THE PRESS OR ANY OTHER PERSON WITHOUT WRITTEN AUTHORIZATION FROM NOMURA GROUP. Pursuant to Operational Regulations Governing Securities Firms Recommending Trades in Securities to Customers and/or other applicable laws or regulations in Taiwan, you are prohibited to provide the reports to others (including but not limited to related parties, affiliated companies and any other third parties) or engage in any activities in connection with the reports which may involve conflicts of interests. INFORMATION ON SECURITIES / INSTRUMENTS NOT EXECUTABLE BY NOMURA INTERNATIONAL (HONG KONG) LTD., TAIPEI BRANCH IS FOR INFORMATIONAL PURPOSES ONLY AND IS NOT BE CONSTRUED AS A RECOMMENDATION OR A SOLICITATION TO TRADE IN SUCH SECURITIES / INSTRUMENTS. NO PART OF THIS MATERIAL MAY BE (I) COPIED, PHOTOCOPIED, OR DUPLICATED IN ANY FORM, BY ANY MEANS; OR (II) REDISTRIBUTED WITHOUT THE PRIOR WRITTEN CONSENT OF A MEMBER OF THE NOMURA GROUP. If this document has been
Nomura | JPN Outlook for FY18-19 corporate earnings June 4, 2018
18
distributed by electronic transmission, such as e-mail, then such transmission cannot be guaranteed to be secure or error-free as information could be intercepted, corrupted, lost, destroyed, arrive late or incomplete, or contain viruses. The sender therefore does not accept liability for any errors or omissions in the contents of this document, which may arise as a result of electronic transmission. If verification is required, please request a hard-copy version. ------ Disclaimers required in Japan Credit ratings in the text that are marked with an asterisk (*) are issued by a rating agency not registered under Japan’s Financial Instruments and Exchange Act (“Unregistered Ratings”). For details on Unregistered Ratings, please contact the Research Product Management Dept. of Nomura Securities Co., Ltd. Investors in the financial products offered by Nomura Securities may incur fees and commissions specific to those products (for example, transactions involving Japanese equities are subject to a sales commission (all figures on a tax-inclusive basis) of up to 1.404% of the transaction amount or a commission of ¥2,808 for transactions of ¥200,000 or less, while transactions involving investment trusts are subject to various fees, such as commissions at the time of purchase and asset management fees (trust fees), specific to each investment trust). In addition, all products carry the risk of losses owing to price fluctuations or other factors. Fees and risks vary by product. Please thoroughly read the written materials provided, such as documents delivered before making a contract, listed securities documents, or prospectuses. ------ Nomura Securities Co., Ltd. Financial instruments firm registered with the Kanto Local Finance Bureau (registration No. 142) Member associations: Japan Securities Dealers Association; Japan Investment Advisers Association; The Financial Futures Association of Japan; and Type II Financial Instruments Firms Association.
The Nomura Group manages conflicts with respect to the production of research through its compliance policies and procedures (including, but not limited to, Conflicts of Interest, Chinese Wall and Confidentiality policies) as well as through the maintenance of Chinese Walls and employee training. Additional information regarding the methodologies or models used in the production of any investment recommendations contained within this document is available upon request by contacting the Research Analysts listed on the front page. Disclosures information is available upon request and disclosure information is available at the Nomura Disclosure web page: http://go.nomuranow.com/research/globalresearchportal/pages/disclosures/disclosures.aspx Copyright © 2018 Nomura Securities Co., Ltd. All rights reserved.