Embed Size (px)
Citation preview

Q2 FY18
Earnings Results
April 5, 2018
2
FORWARD-LOOKING STATEMENTS
Historical financial and operating data in this presentation reflect the consolidated results of WD-40 Company, its subsidiaries and its legal entities. WD-40 Company markets maintenance products (“MP”) under the WD-40®, 3-IN-ONE® and GT85® brand names. Currently included in the WD-40 brand are the WD-40 Multi-Use Product and the WD-40 Specialist® and WD-40 BIKETM product lines. WD-40 Company markets the following homecare and cleaning (”HCCP”) brands: X-14® mildew stain remover and automatic toilet bowl cleaners, 2000 Flushes® automatic toilet bowl cleaners, Carpet Fresh® and no vac® rug and room deodorizers, Spot Shot® aerosol and liquid carpet stain removers, 1001® household cleaners and rug and room deodorizers and Lava® and Solvol® heavy-duty hand cleaners.
Except for the historical information contained herein, this presentation contains “forward-looking statements” within the meaning of the Private Securities Litigation Reform Act of 1995. Such statements reflect the Company’s current expectations with respect to currently available operating, financial and economic information. These forward-looking statements are subject to certain risks, uncertainties and assumptions that could cause actual results to differ materially from those anticipated in or implied by the forward-looking statements.
Our forward-looking statements include, but are not limited to, discussions about future financial and operating results, including: growth expectations for certain products; expected levels of promotional and advertising spending; plans for and success of product innovation, the impact of new product introductions on the growth of sales; anticipated results from product line extension sales; the impacts of the “Tax Cuts and Jobs Act”; and forecasted foreign currency exchange rates and commodity prices. Our forward-looking statements are generally identified with words such as “believe,” “expect,” “intend,” “plan,” “could,” “may,” “aim,” “anticipate,” “estimate” and similar expressions.
The Company's expectations, beliefs and forecasts are expressed in good faith and are believed by the Company to have a reasonable basis, but there can be no assurance that the Company's expectations, beliefs or forecasts will be achieved or accomplished.
Actual events or results may differ materially from those projected in forward-looking statements due to various factors, including, but not limited to, those identified in Part I―Item 1A, “Risk Factors,” in the Company’s Annual Report on Form 10-K for the fiscal year ended August 31, 2017 which the Company filed with the SEC on October 23, 2017 and in the Company’s Quarterly Report on Form 10-Q for the period ended February 28, 2018 which the Company expects to file with the SEC on April 6, 2018.
All forward-looking statements included in this presentation should be considered in the context of these risks. All forward-looking statements speak only as of April 5, 2018 and we undertake no obligation to update or revise any forward-looking statements, whether as a result of new information, future events or otherwise. Investors and prospective investors are cautioned not to place undue reliance on our forward-looking statements.

STRATEGIC
INITIATIVES

1. Grow WD-40 Multi-Use Product Maximize the product line through geographic expansion, increased market penetration and development of new and unique deliver systems. More places, more people, more uses, more frequently.
Grow WD-40 Multi-Use Product to $530 million in net sales by the end of 2025
2. Grow the WD-40 Specialist Product LineLeverage the WD-40 Specialist line to create growth through continued geographic expansion as well as by developing new products and product categories within identified platforms.
Grow WD-40 Specialist to $100 million in net sales by the end of 2025
3. Broaden Product and Revenue Base Leverage the recognized strengths of WD-40 Company to deriverevenue from existing brands as well as from new sources and products.
Continue to grow, nurture, develop or acquire products that fit well with our unique multi-channel distribution network and grow to $70 million in net sales by the end of 2025
4. Attract, Develop and Retain Outstanding Tribe MembersSucceed as a tribe while excelling as individuals. Grow employee engagement to greater than
95 percent
5. Operational ExcellenceContinuous improvement by optimizing resources, systems and processes as well as applying rigorous commitment to quality assurance, regulatory compliance, and intellectual property protection.
Execute the 55/30/25 business model while safeguarding the “Power of the Shield”
4
STRATEGIC INITIATIVES
Anticipated Target

5
2018 TRIBE MEMBER ENGAGEMENT SURVEY
Question ResultAverage of all questions 93.3I love to tell people that I work for WD-40 Company. 99.0
I feel my opinions and values are a good fit with the WD-40 Company culture. 98.1
I understand how my job contributes to achieving WD-40 Company’s goals. 97.9
I know what results are expected of me. 97.4
I am clear on the company’s goals. 97.2
I respect my coach. 96.4
WD-40 Company’s vision and mission motivates me to help the company succeed. 95.9
I feel like I am a valued member of my functional team. 94.5
I am excited about WD-40 Company’s future direction. 93.4
WD-40 Company encourages employees to continually improve in their job. 92.9
“WD-40 Company is full of people who inspire me and get me excited to go to work each morning. The sense of purpose we share, and pride for what we do, is unique and makes you feel that you’re a part of something special.”
- Nick Giordano, SEC Reporting Manager

$106M
$202M
6
LONG-TERM REVENUE GROWTH TARGETS
FY 2007Reported Revenue
$308M
Revenue Generated by Strategic Initiative #1
1) Anticipated targets for revenue are projected by the end of FY2025 and are based on the Company's expectations, beliefs and forecasts. They are expressed in good faith and are believed by the Company to have a reasonable basis, but there can be no assurance that they will be achieved or accomplished. Note: Historical revenue numbers reflect net sales as reported and have not been adjusted for changes in foreign currency exchange rates.
FY 2017Reported Revenue
$381M
FY 2025Anticipated Revenue Target
~$700M(1)
$292M
$63M$26M
~$530M
~$100M
~$70M
Revenue Generated by Strategic Initiative #2 Revenue Generated by Strategic Initiative #3
Q2 FY18
RESULTS

Q2 FY18 Q2 FY17 % Change
Net Sales $101.3 $96.5 5%
Gross Profit (%) 55.1% 56.4% -130 bp
Operating Income $19.4 $18.9 3%
Net Income $14.8 $12.4 20%
EPS (Diluted) $1.05 $0.87 21%
Q2 FY18 Results
• Changes in foreign currency exchange rates had a favorable impact on net sales in Q2 FY18. Translation of our foreign subsidiaries’ results from their functional currencies to U.S. dollars increased total net sales by approximately $4.3 million. Transaction-related impacts were insignificant in Q2 FY18.
• Net income and diluted earnings per share were positively impacted by changes in foreign currency exchange rates and the U.S. Tax Cuts and Jobs Act in Q2 FY18.
8
($ in millions; except EPS, gross profit and % change)

Functional currencyMain currency in which subsidiaries conduct
business; typically the same as that of the country in which the subsidiary is
headquartered
Transaction currencyCurrency in which sales,
costs, expenses are transacted; typically the
same as that of the country in which the sales transaction
takes place
Reporting currencyAs a U.S. based company the reporting currency of WD-40 Company is the
U.S. dollarConversion
from transaction currency to subsidiaries’
functional currency
Translation from
functional currency to
WD-40 Company’s reporting currency
Foreign Currency Impact
Translation Impact
Transaction Impact
Subsidiary (Functional Currency)
UK – GBPCANADA- CAD
AUSTRALIA- AUDCHINA- CNY
Subsidiary(Non-Functional Currency)
UK – USD & EUR
9

$97.0 $101.3
Q2 FY18 Net Sales at Transaction Translation Q2 FY18 Net SalesQ2 FY17 FX Rates Impact Impact As Reported
$4.3
Q2 FY18 Foreign Currency Exchange Impact
In total changes in FX rates
increased net sales by ~$4.3M
in Q2 FY18
Q2 FY18 Net Sales(In millions)
10
Insignificant in Q2 FY18

$39.5 $39.2
$5.5 $5.9
Q2 FY18 Q2 FY17
Americas Net Sales(in millions)
Maintenance Products Homecare and Cleaning Products
Americas Segment
Americas – Q2 FY18 vs. Q2 FY17
$45.0 $45.1• Total reported segment sales flat
• Segment makes up 44% of global sales• Maintenance product sales ▲ 1%• WD-40 Specialist sales ▲ 20%• HCCP sales ▼ 7%
• Maintenance Product (MP) sales: • U.S. MP sales ▲ 1%• Latin America MP sales ▲ 2%• Canadian MP sales ▼ 3%
11

$38.0 $35.0
$1.6$1.2
Q2 FY18 Q2 FY17
EMEA Net Sales(in millions)
Maintenance Products Homecare and Cleaning Products
EMEA Segment
EMEA – Q2 FY18 vs. Q2 FY17
$36.2$39.6
• Total reported segment sales ▲ 9%• Segment makes up 39% of global sales• Changes in foreign currency exchange rates
had favorable impact on sales• Maintenance product sales ▲ 9%• WD-40 Specialist sales ▲ 50%• HCCP sales ▲ 35%
• EMEA direct market sales ▲ 19%
• 70% of segment sales came from direct markets
• In GBP-based markets sales ▲ 20% in GBP• In EUR-based markets sales ▲ 1% in EUR
• EMEA distributor market sales ▼ 8%• 30% of segment sales came from distributor
markets
12
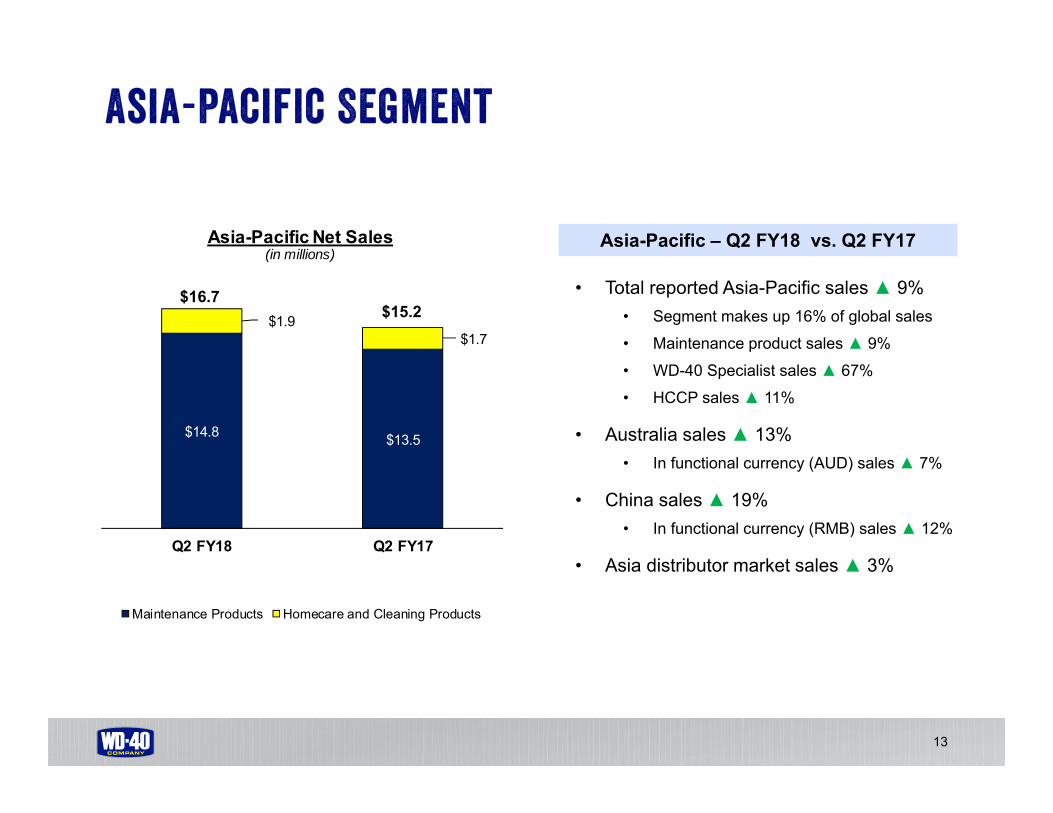
$14.8 $13.5
$1.9$1.7
Q2 FY18 Q2 FY17
Asia-Pacific Net Sales(in millions)
Maintenance Products Homecare and Cleaning Products
Asia-Pacific Segment
Asia-Pacific – Q2 FY18 vs. Q2 FY17
$15.2$16.7 • Total reported Asia-Pacific sales ▲ 9%
• Segment makes up 16% of global sales• Maintenance product sales ▲ 9%• WD-40 Specialist sales ▲ 67%• HCCP sales ▲ 11%
• Australia sales ▲ 13%• In functional currency (AUD) sales ▲ 7%
• China sales ▲ 19%• In functional currency (RMB) sales ▲ 12%
• Asia distributor market sales ▲ 3%
13

55/30/25
Business model
14

Q2 FY18 Gross Margin
Gross margin can be impacted positively and negatively by things not under the Company’s control like changes in foreign currency exchange rates and input costs
Gross Margin – 55.1% Q2 FY18 vs. 56.4% Q2 FY17 (-1.3pp)• Changes in petroleum-based specialty chemicals and
aerosol cans in all three segments (-1.2pp)• Sales mix changes and miscellaneous costs (-0.3pp)• Higher warehousing and in-bound freight costs (-0.2pp)• Price increases in EMEA and Asia-Pacific (+0.4pp)
15
51%52%
53%
56% 56%
FY13 FY14 FY15 FY16 FY17
5-Year Gross Margin Trend
55% Gross Margin Target

Q2 FY18 55/30/25 Results
* See appendix for descriptions and reconciliations of these non-GAAP measures.Note: Percentages may not aggregate to EBITDA percentage due to rounding and because amounts recorded in other income (expense), net on the Company’s consolidated statement of operations are not included as an adjustment to earnings in the Company’s EBITDA calculation.
16
55/30/25 Business Model Target Q2 FY18 Actuals
Q2 FY17 Actuals
Q2 FY16 Actuals
Gross Margin 55% 55% 56% 55%Cost of Doing Business 30% 34% 35% 35%EBITDA 25% 21% 21% 22%

Guidance
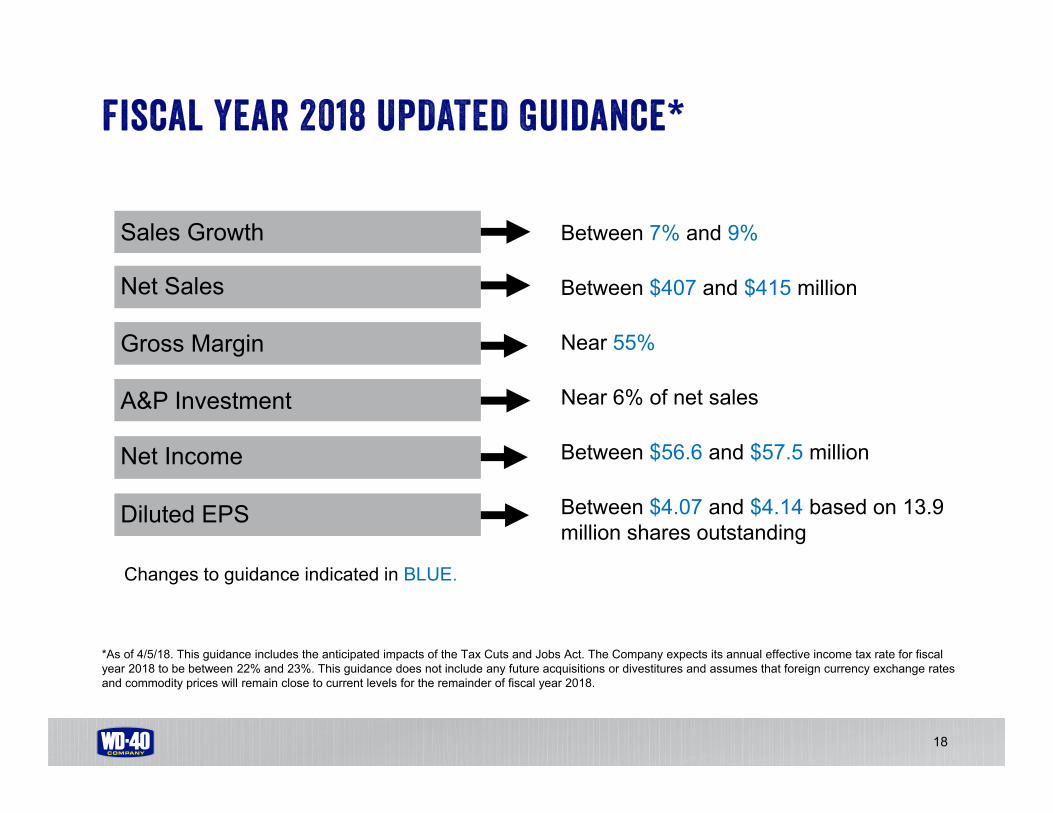
Diluted EPS
Net Income
A&P Investment
Gross Margin
Net Sales
Sales Growth
*As of 4/5/18. This guidance includes the anticipated impacts of the Tax Cuts and Jobs Act. The Company expects its annual effective income tax rate for fiscal year 2018 to be between 22% and 23%. This guidance does not include any future acquisitions or divestitures and assumes that foreign currency exchange rates and commodity prices will remain close to current levels for the remainder of fiscal year 2018.
Fiscal Year 2018 UPDATED Guidance*
18
Between 7% and 9%
Between $407 and $415 million
Near 55%
Near 6% of net sales
Between $56.6 and $57.5 million
Between $4.07 and $4.14 based on 13.9 million shares outstanding
Changes to guidance indicated in BLUE.

Appendix

Q2 FY18 CC* Q2 FY17 % Change
Net Sales $97.0 $96.5 1%
Operating Income $18.2 $18.9 -4%
Net Income $13.9 $12.4 12%
EPS (Diluted) $0.99 $0.87 14%
Q2 FY18 Q2 FY17 % Change
Net Sales $101.3 $96.5 5%
Gross Profit (%) 55.1% 56.4% -130 bp
Operating Income $19.4 $18.9 3%
Net Income $14.8 $12.4 20%
EPS (Diluted) $1.05 $0.87 21%
Foreign Currency Translation Impact or
“Constant Currency”
Financial ResultsAs reported
Financial ResultsConstant currency basis
*Q2 FY18 results translated at Q2 FY17 foreign currency exchange rates
($ in millions; except EPS, gross profit and % change)
20

(1) This presentation contains certain non-GAAP (accounting principles generally accepted in the United States of America) measures, that ourmanagement believes provide our stockholders with additional insights into WD-40 Company’s results of operations and how it runs its business. Ourmanagement uses these non-GAAP financial measures in order to establish financial goals and to gain an understanding of the comparative performanceof the Company from year to year or quarter to quarter. The non-GAAP measures referenced in this presentation, which include EBITDA (earnings beforeinterest, income taxes, depreciation and amortization) and the cost of doing business, are supplemental in nature and should not be considered in isolationor as alternatives to net income, income from operations or other financial information prepared in accordance with GAAP as indicators of the Company’sperformance or operations. Reconciliations of these non-GAAP financial measures to the WD-40 Company financials as prepared under GAAP are asfollows:
Non-GAAP Reconciliation
Note: Percentages may not aggregate to EBITDA percentage due to rounding and because amounts recorded in other income (expense), net on the Company’s consolidated statement of operations are not included as an adjustment to earnings in the Company’s EBITDA calculation.
21
Total operating expenses - GAAP $ 36,390 $ 35,600 Amortization of definite-lived intangible assets (741) (717) Depreciation (in operating departments) (935) (700)
Cost of doing business $ 34,714 $ 34,183 Net sales $ 101,256 $ 96,519 Cost of doing business as a percentage
of net sales - non-GAAP 34% 35%
EBITDA:
Net income - GAAP $ 14,818 $ 12,360 Provision for income taxes 3,398 6,046 Interest income (131) (133) Interest expense 1,002 598 Amortization of definite-lived intangible assets 741 717 Depreciation 1,228 961
EBITDA $ 21,056 $ 20,549 Net sales $ 101,256 $ 96,519 EBITDA as a percentage of net sales - non-GAAP 21% 21%
Three Months Ended February 28, 2018 2017
Three Months Ended February 28, 2018 2017


![FY18 2nd Quarter Financial Results [IFRS]...FY18 Q1-Q2 (Revenues and EBIT by Segment) (100 million yen) Electronic Device Systems Science & Medical Systems Industrial Systems Advanced](https://img.pdfslide.net/doc/110x75/5f0898957e708231d422ca54/fy18-2nd-quarter-financial-results-ifrs-fy18-q1-q2-revenues-and-ebit-by-segment.jpg)