Embed Size (px)
Citation preview
1© 2021 HSGHSGadvisors.com
Understanding Issues Caused by COVID-19 and Changes to the Medicare Physician Fee Schedule
OVERCOMING CHALLENGES IN PROVIDER COMPENSATION
SEPTEMBER 2021
WHITE PAPER
2© 2021 HSGHSGadvisors.com
About HSG
CONTACT THE AUTHOR
.
Eric Andreoli Director
(502) 814-1193
HSG builds high-performing
physician networks so health
systems can address complex
changes with confidence.
SERVICES
.
Driving a common strategic focus
with engaged physicians.
PHYSICIAN STRATEGY
Leveraging HSG Physician Network
Integrity Analytics® to create and
monitor patient acquisition and
retention strategies.
NETWORK INTEGRITY
Aligning physician compensation
with health systems and employed
network goals.
PHYSICIAN COMPENSATIONIdentifying and engaging strong
physician leaders is integral to
the network’s development and
success.
PHYSICIAN LEADERSHIP
Improving the performance of
employed physician networks.
PERFORMANCE IMPROVEMENT$
3© 2021 HSGHSGadvisors.com© 2021 HSG
3 HSGadvisors.com
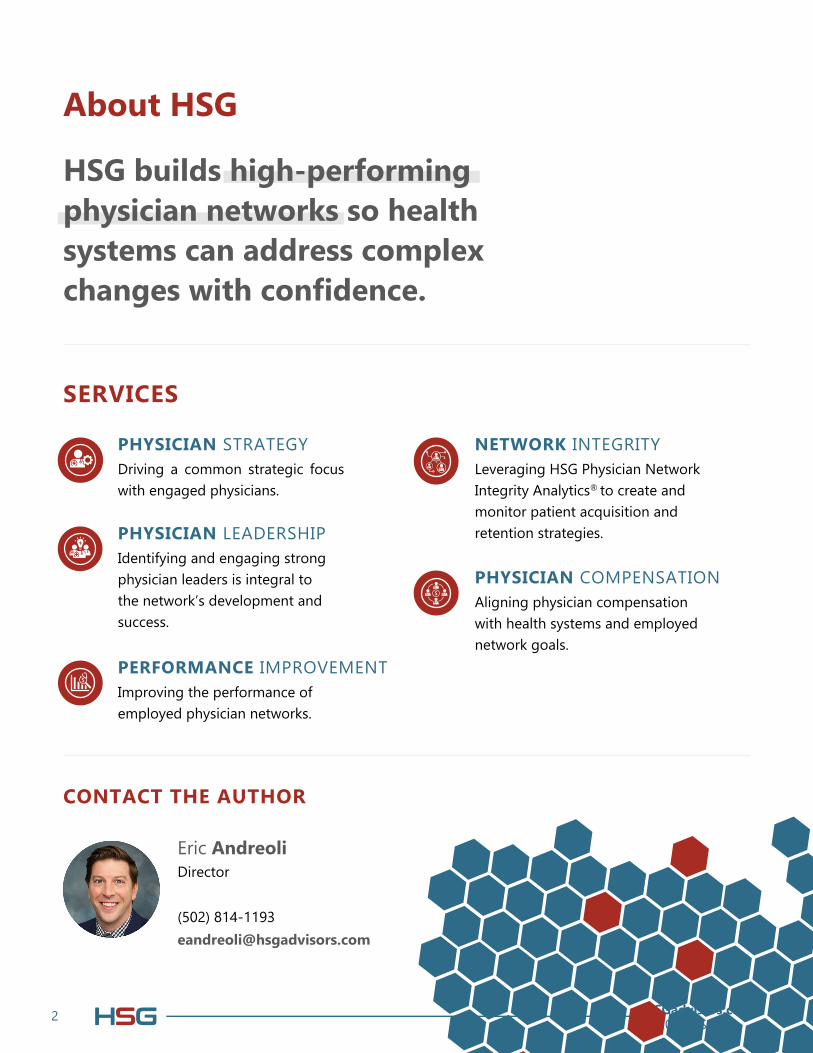
Introduction
Developing and maintaining strategies for employed provider compensation has never been easy. HSG
continually partners with clients on creating compensation plans that are specific to and evolve with an organization’s needs. This may involve focusing on alignment between productivity and compensation,
balancing market rates with organizational sustainability, and/or shifting compensation dollars towards
value.
Two acute issues will add additional challenges in the next few years:
Issue #1: Reduced volume during the COVID-19 pandemic will lead to artificially h igh p er wRVU compensation rates in surveys based on 2020 data.
Issue #2: For many specialties, changes to the 2021 Medicare Physician Fee Schedule (MPFS) will result
in wRVU production that is significantly higher than historic levels.
This whitepaper will provide in-depth analysis of these two issues and discuss strategies for avoiding
potential pitfalls.
4© 2021 HSGHSGadvisors.com
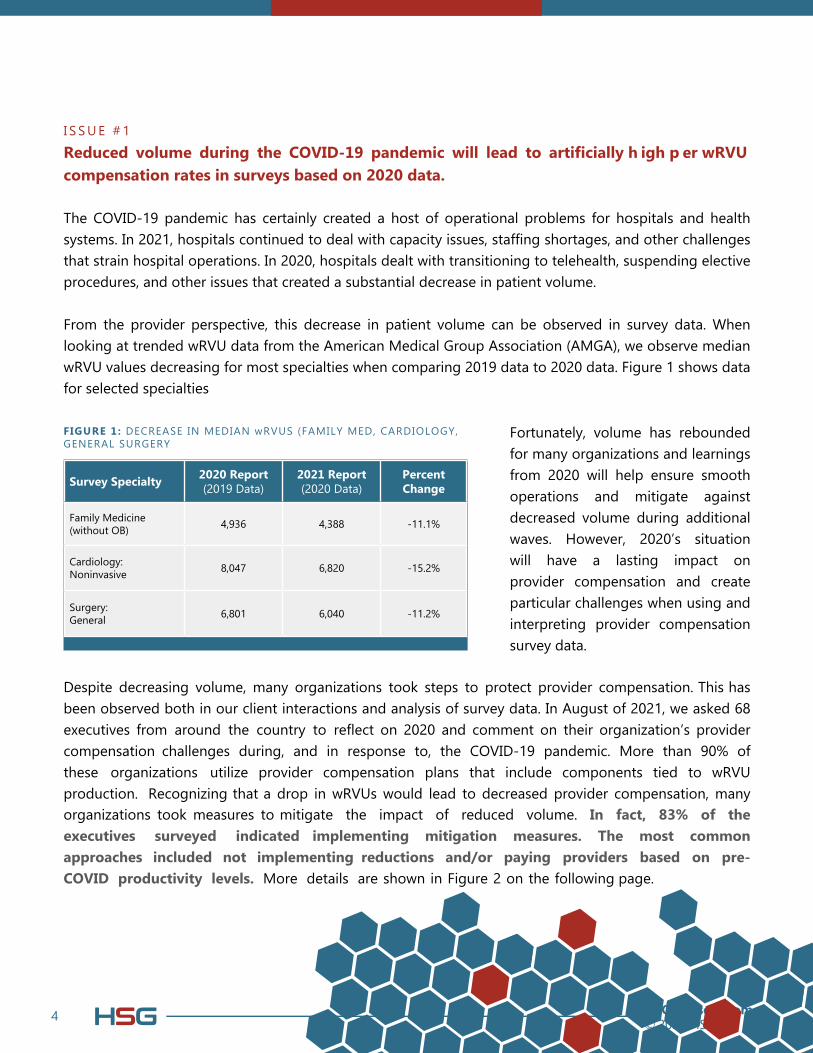
I S S U E # 1Reduced volume during the COVID-19 pandemic will lead to artificially h igh p er wRVU compensation rates in surveys based on 2020 data.
The COVID-19 pandemic has certainly created a host of operational problems for hospitals and health
systems. In 2021, hospitals continued to deal with capacity issues, staffing shortages, and other challenges that strain hospital operations. In 2020, hospitals dealt with transitioning to telehealth, suspending elective
procedures, and other issues that created a substantial decrease in patient volume.
From the provider perspective, this decrease in patient volume can be observed in survey data. When
looking at trended wRVU data from the American Medical Group Association (AMGA), we observe median wRVU values decreasing for most specialties when comparing 2019 data to 2020 data. Figure 1 shows data for selected specialties
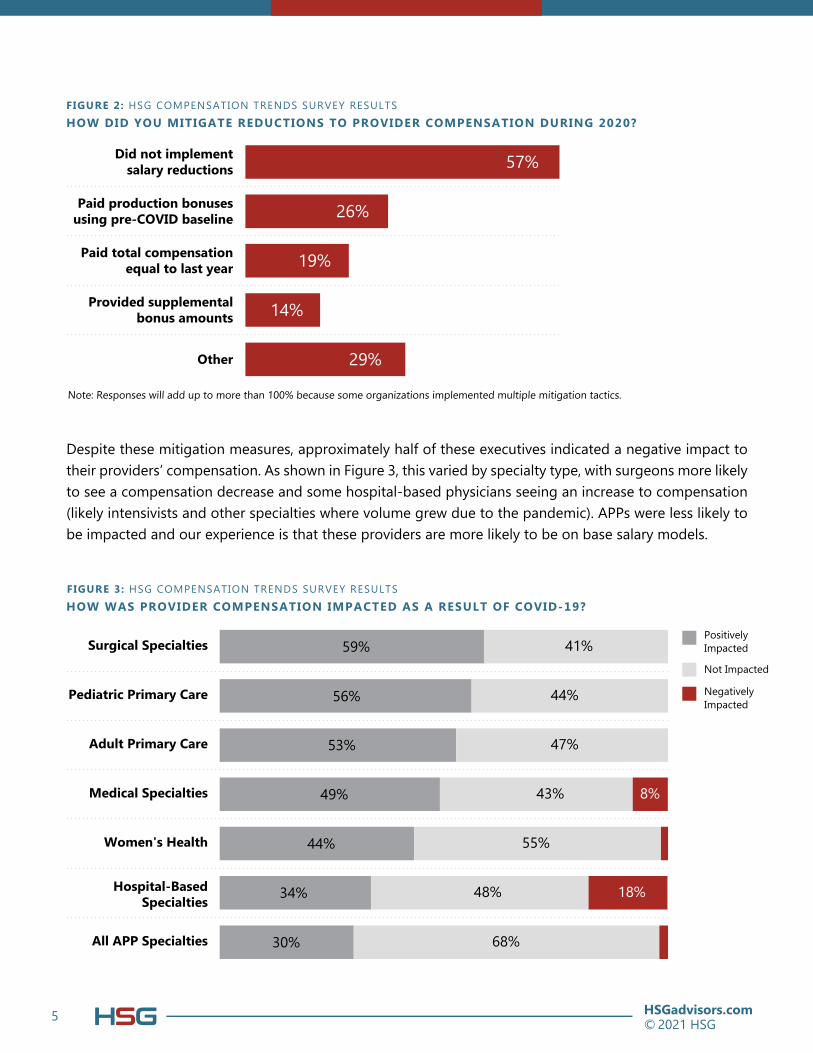
Despite decreasing volume, many organizations took steps to protect provider compensation. This has been observed both in our client interactions and analysis of survey data. In August of 2021, we asked 68 executives from around the country to reflect on 2020 and comment on their organization’s provider compensation challenges during, and in response to, the COVID-19 pandemic. More than 90% of
these organizations utilize provider compensation plans that include components tied to wRVU production. Recognizing that a drop in wRVUs would lead to decreased provider compensation, many organizations took measures to mitigate the impact of reduced volume. In fact, 83% of the
executives surveyed indicated implementing mitigation measures. The most common
approaches included not implementing reductions and/or paying providers based on pre-
COVID productivity levels. More details are shown in Figure 2 on the following page.
FIGURE 1: DECREASE IN MEDIAN wRVUS (FAMILY MED, CARDIOLOGY, GENERAL SURGERY
Survey Specialty2020 Report (2019 Data)
2021 Report (2020 Data)
Percent Change
Family Medicine (without OB)
4,936 4,388 -11.1%
Cardiology: Noninvasive
8,047 6,820 -15.2%
Surgery: General
6,801 6,040 -11.2%
Fortunately, volume has rebounded
for many organizations and learnings
from 2020 will help ensure smooth
operations and mitigate against
decreased volume during additional
waves. However, 2020’s situation
will have a lasting impact on
provider compensation and create
particular challenges when using and
interpreting provider compensation
survey data.
5© 2021 HSGHSGadvisors.com
Despite these mitigation measures, approximately half of these executives indicated a negative impact to
their providers’ compensation. As shown in Figure 3, this varied by specialty type, with surgeons more likely
to see a compensation decrease and some hospital-based physicians seeing an increase to compensation
(likely intensivists and other specialties where volume grew due to the pandemic). APPs were less likely to
be impacted and our experience is that these providers are more likely to be on base salary models.
HOW DID YOU MITIGATE REDUCTIONS TO PROVIDER COMPENSATION DURING 2020?
FIGURE 2: HSG COMPENSATION TRENDS SURVEY RESULTS
Note: Responses will add up to more than 100% because some organizations implemented multiple mitigation tactics.
Other 29%
Provided supplemental bonus amounts 14%
Paid total compensation equal to last year 19%
Paid production bonuses using pre-COVID baseline 26%
Did not implement salary reductions 57%
HOW WAS PROVIDER COMPENSATION IMPACTED AS A RESULT OF COVID-19?
FIGURE 3: HSG COMPENSATION TRENDS SURVEY RESULTS
Positively Impacted
Not Impacted
Negatively Impacted
Surgical Specialties 59% 41%
Pediatric Primary Care 56% 44%
Adult Primary Care 53% 47%
Medical Specialties 49% 43% 8%
Women's Health 44% 55%
Hospital-Based Specialties
34% 18%48%
All APP Specialties 30% 68%
6© 2021 HSGHSGadvisors.com
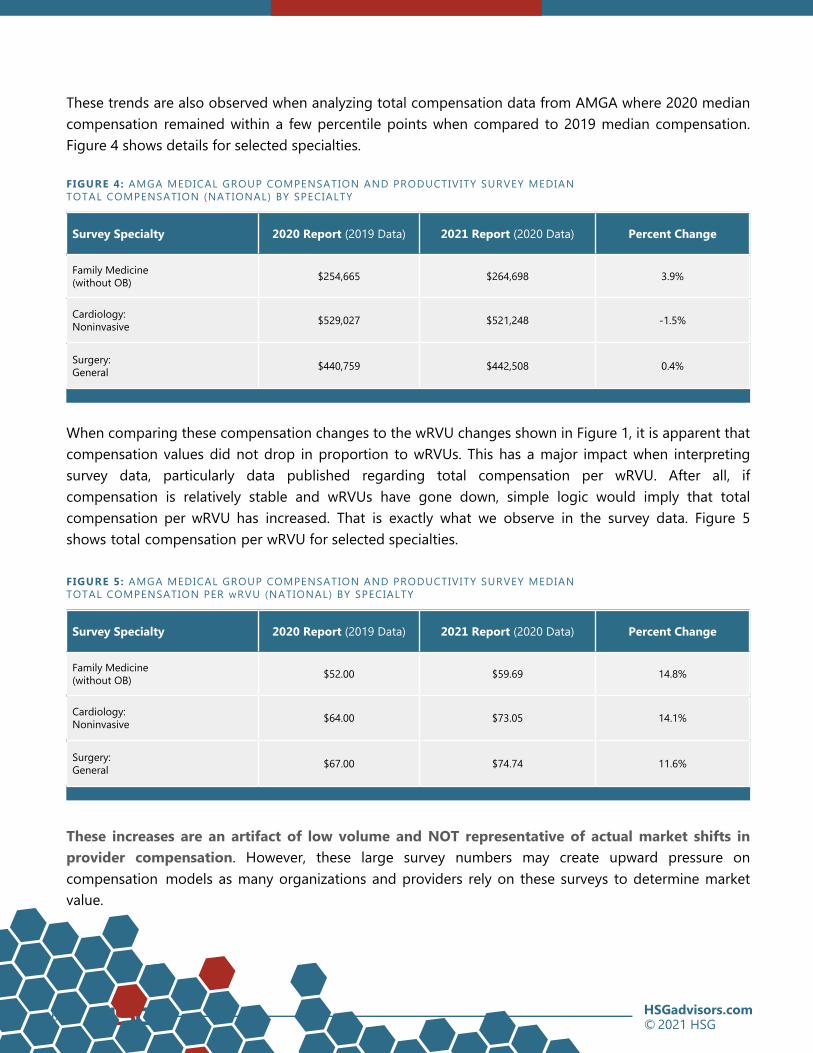
FIGURE 4: AMGA MEDICAL GROUP COMPENSATION AND PRODUCTIVITY SURVEY MEDIAN TOTAL COMPENSATION (NATIONAL) BY SPECIALTY
Survey Specialty 2020 Report (2019 Data) 2021 Report (2020 Data) Percent Change
Family Medicine (without OB)
$254,665 $264,698 3.9%
Cardiology: Noninvasive
$529,027 $521,248 -1.5%
Surgery: General
$440,759 $442,508 0.4%
FIGURE 5: AMGA MEDICAL GROUP COMPENSATION AND PRODUCTIVITY SURVEY MEDIAN TOTAL COMPENSATION PER wRVU (NATIONAL) BY SPECIALTY
Survey Specialty 2020 Report (2019 Data) 2021 Report (2020 Data) Percent Change
Family Medicine (without OB)
$52.00 $59.69 14.8%
Cardiology: Noninvasive
$64.00 $73.05 14.1%
Surgery: General
$67.00 $74.74 11.6%
These trends are also observed when analyzing total compensation data from AMGA where 2020 median compensation remained within a few percentile points when compared to 2019 median compensation.
Figure 4 shows details for selected specialties.
When comparing these compensation changes to the wRVU changes shown in Figure 1, it is apparent that compensation values did not drop in proportion to wRVUs. This has a major impact when interpreting survey data, particularly data published regarding total compensation per wRVU. After all, if compensation is relatively stable and wRVUs have gone down, simple logic would imply that total compensation per wRVU has increased. That is exactly what we observe in the survey data. Figure 5
shows total compensation per wRVU for selected specialties.
These increases are an artifact of low volume and NOT representative of actual market shifts in
provider compensation. However, these large survey numbers may create upward pressure on
compensation models as many organizations and providers rely on these surveys to determine market
value.
7© 2021 HSGHSGadvisors.com
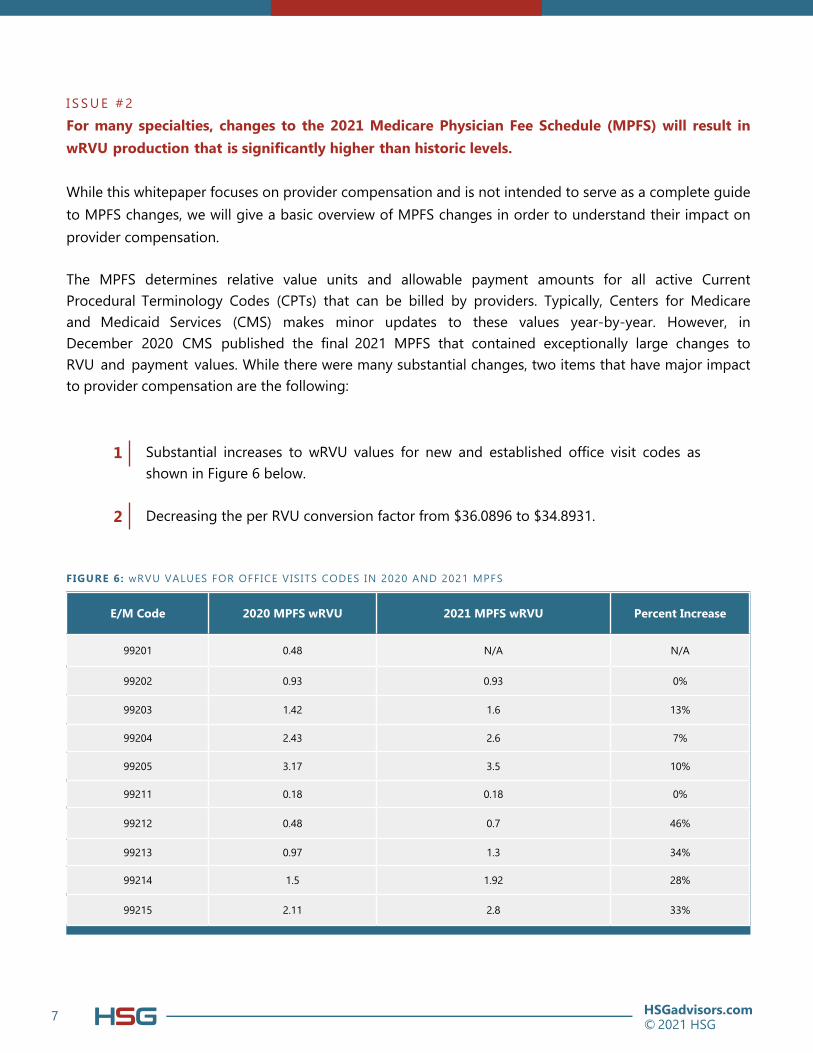
I S S U E # 2For many specialties, changes to the 2021 Medicare Physician Fee Schedule (MPFS) will result in
wRVU production that is significantly higher than historic levels.
While this whitepaper focuses on provider compensation and is not intended to serve as a complete guide
to MPFS changes, we will give a basic overview of MPFS changes in order to understand their impact on
provider compensation.
The MPFS determines relative value units and allowable payment amounts for all active Current
Procedural Terminology Codes (CPTs) that can be billed by providers. Typically, Centers for Medicare
and Medicaid Services (CMS) makes minor updates to these values year-by-year. However, in
December 2020 CMS published the final 2021 MPFS that contained exceptionally large changes to RVU and payment values. While there were many substantial changes, two items that have major impact
to provider compensation are the following:
Substantial increases to wRVU values for new and established office visit codes as shown in Figure 6 below.
Decreasing the per RVU conversion factor from $36.0896 to $34.8931.
1
2
FIGURE 6: wRVU VALUES FOR OFFICE VISITS CODES IN 2020 AND 2021 MPFS
E/M Code 2020 MPFS wRVU 2021 MPFS wRVU Percent Increase
99201 0.48 N/A N/A
99202 0.93 0.93 0%
99203 1.42 1.6 13%
99204 2.43 2.6 7%
99205 3.17 3.5 10%
99211 0.18 0.18 0%
99212 0.48 0.7 46%
99213 0.97 1.3 34%
99214 1.5 1.92 28%
99215 2.11 2.8 33%
8© 2021 HSGHSGadvisors.com
8
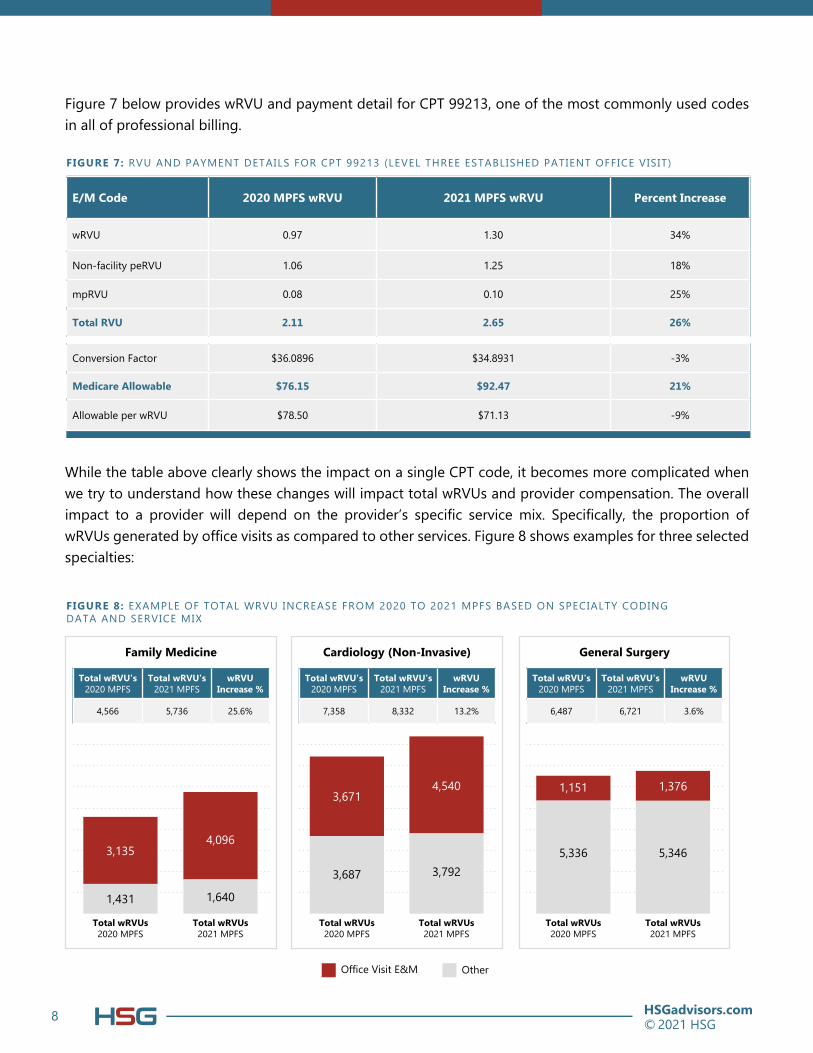
Figure 7 below provides wRVU and payment detail for CPT 99213, one of the most commonly used codes in all of professional billing.
While the table above clearly shows the impact on a single CPT code, it becomes more complicated when
we try to understand how these changes will impact total wRVUs and provider compensation. The overall impact to a provider will depend on the provider’s specific service mix. Specifically, the proportion of wRVUs generated by office visits as compared to other services. Figure 8 shows examples for three selected specialties:
FIGURE 7: RVU AND PAYMENT DETAILS FOR CPT 99213 (LEVEL THREE ESTABLISHED PATIENT OFFICE VISIT)
E/M Code 2020 MPFS wRVU 2021 MPFS wRVU Percent Increase
wRVU 0.97 1.30 34%
Non-facility peRVU 1.06 1.25 18%
mpRVU 0.08 0.10 25%
Total RVU 2.11 2.65 26%
Conversion Factor $36.0896 $34.8931 -3%
Medicare Allowable $76.15 $92.47 21%
Allowable per wRVU $78.50 $71.13 -9%
General Surgery
Total wRVU's 2020 MPFS
Total wRVU's 2021 MPFS
wRVU Increase %
6,487 6,721 3.6%
Cardiology (Non-Invasive)
Total wRVU's 2020 MPFS
Total wRVU's 2021 MPFS
wRVU Increase %
7,358 8,332 13.2%
Family Medicine
Total wRVU's 2020 MPFS
Total wRVU's 2021 MPFS
wRVU Increase %
4,566 5,736 25.6%
FIGURE 8: EXAMPLE OF TOTAL WRVU INCREASE FROM 2020 TO 2021 MPFS BASED ON SPECIALTY CODING DATA AND SERVICE MIX
Office Visit E&M Other
Total wRVUs 2020 MPFS
Total wRVUs 2021 MPFS
Total wRVUs 2020 MPFS
Total wRVUs 2020 MPFS
Total wRVUs 2021 MPFS
Total wRVUs 2021 MPFS
3,1354,096
3,6714,540 1,151 1,376
1,431 1,640
3,687 3,792
5,336 5,346
9© 2021 HSGHSGadvisors.com© 2021 HSG
9 HSGadvisors.com
Total wRVUs increase in each of the above examples. If compensation is based on wRVU productivity, this will result in a corresponding increase to compensation. Because of the decreases to the CMS per RVU conversion factor, there is not a corresponding increase to organizational revenue.
Given the above dynamics will harm the medical group’s bottom line, it is important to understand what
organizations are doing to mitigate this impact.
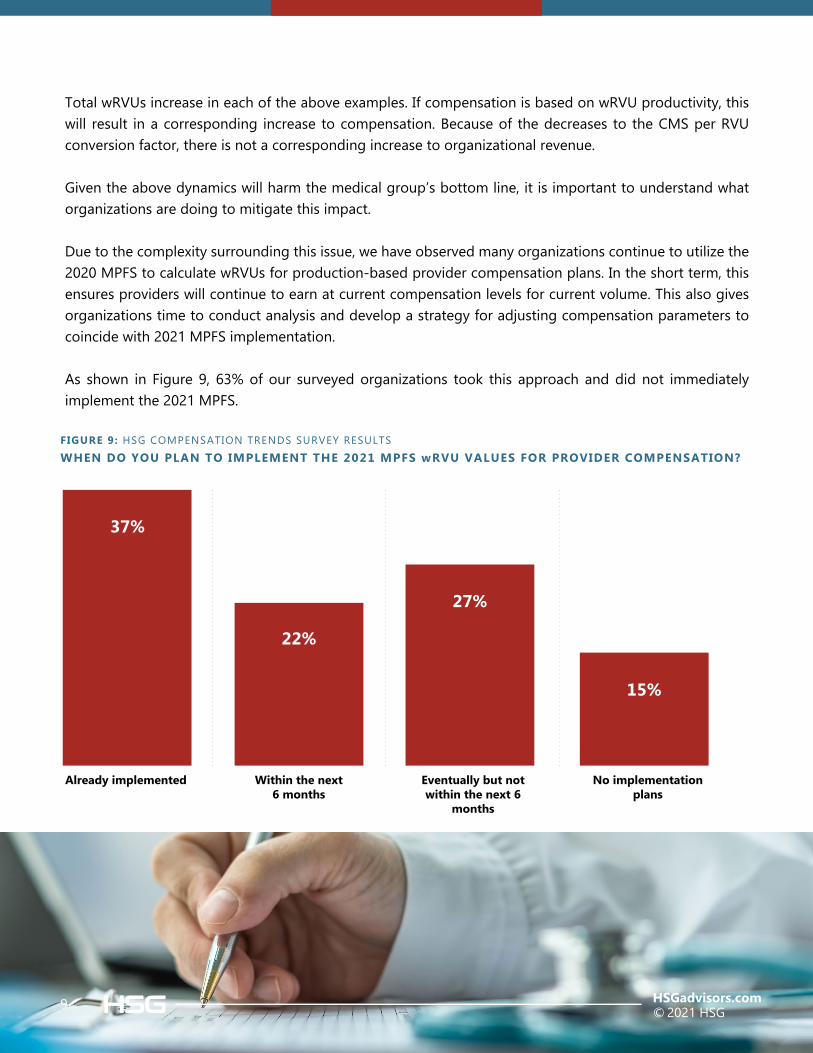
Due to the complexity surrounding this issue, we have observed many organizations continue to utilize the
2020 MPFS to calculate wRVUs for production-based provider compensation plans. In the short term, this ensures providers will continue to earn at current compensation levels for current volume. This also gives
organizations time to conduct analysis and develop a strategy for adjusting compensation parameters to coincide with 2021 MPFS implementation.
As shown in Figure 9, 63% of our surveyed organizations took this approach and did not immediately implement the 2021 MPFS.
WHEN DO YOU PLAN TO IMPLEMENT THE 2021 MPFS wRVU VALUES FOR PROVIDER COMPENSATION?
FIGURE 9: HSG COMPENSATION TRENDS SURVEY RESULTS
37%
Already implemented
22%
Within the next 6 months
27%
Eventually but not within the next 6
months
15%
No implementation plans
10© 2021 HSGHSGadvisors.com
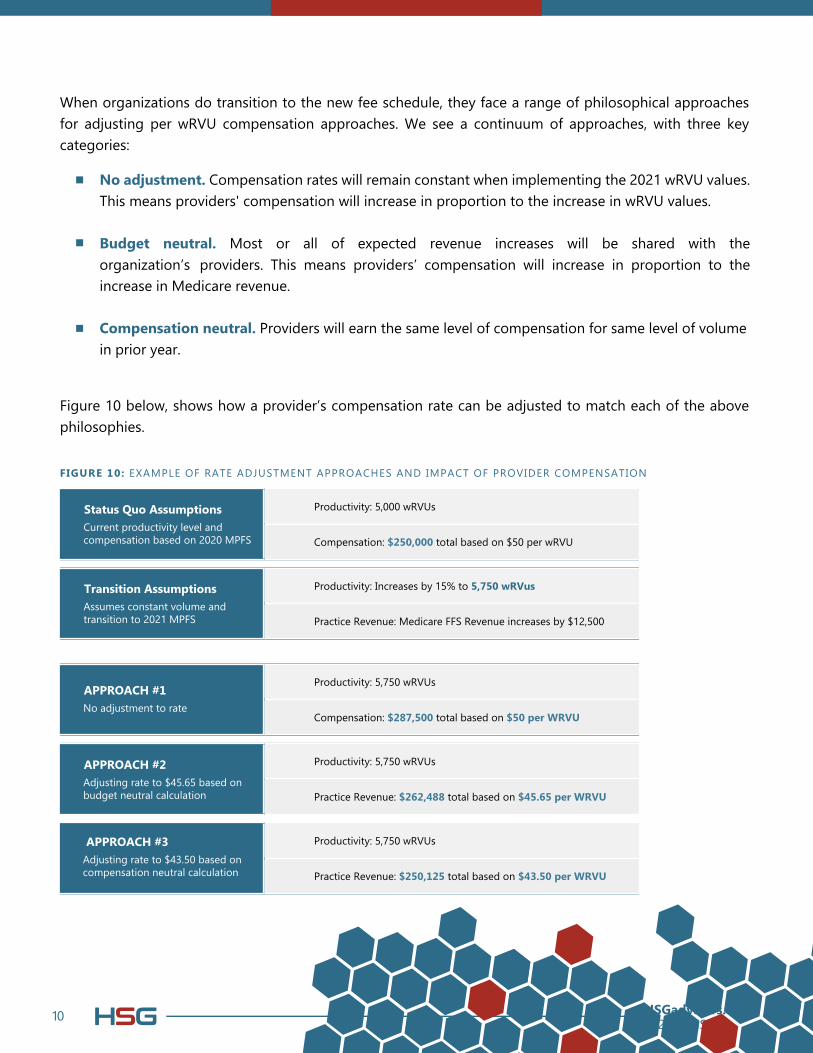
When organizations do transition to the new fee schedule, they face a range of philosophical approaches
for adjusting per wRVU compensation approaches. We see a continuum of approaches, with three key categories:
Figure 10 below, shows how a provider’s compensation rate can be adjusted to match each of the above philosophies.
No adjustment. Compensation rates will remain constant when implementing the 2021 wRVU values. This means providers' compensation will increase in proportion to the increase in wRVU values.
Budget neutral. Most or all of expected revenue increases will be shared with the
organization’s providers. This means providers’ compensation will increase in proportion to the
increase in Medicare revenue.
Compensation neutral. Providers will earn the same level of compensation for same level of volume in prior year.
FIGURE 10: EXAMPLE OF RATE ADJUSTMENT APPROACHES AND IMPACT OF PROVIDER COMPENSATION
Productivity: 5,000 wRVUs
Compensation: $250,000 total based on $50 per wRVU
Status Quo Assumptions
Current productivity level and compensation based on 2020 MPFS
Productivity: Increases by 15% to 5,750 wRVus
Practice Revenue: Medicare FFS Revenue increases by $12,500
Transition Assumptions
Assumes constant volume and transition to 2021 MPFS
Productivity: 5,750 wRVUs
Compensation: $287,500 total based on $50 per WRVU
APPROACH #1
No adjustment to rate
Productivity: 5,750 wRVUs
Practice Revenue: $262,488 total based on $45.65 per WRVU
APPROACH #2
Adjusting rate to $45.65 based on budget neutral calculation
Productivity: 5,750 wRVUs
Practice Revenue: $250,125 total based on $43.50 per WRVU
APPROACH #3Adjusting rate to $43.50 based on compensation neutral calculation
11© 2021 HSGHSGadvisors.com
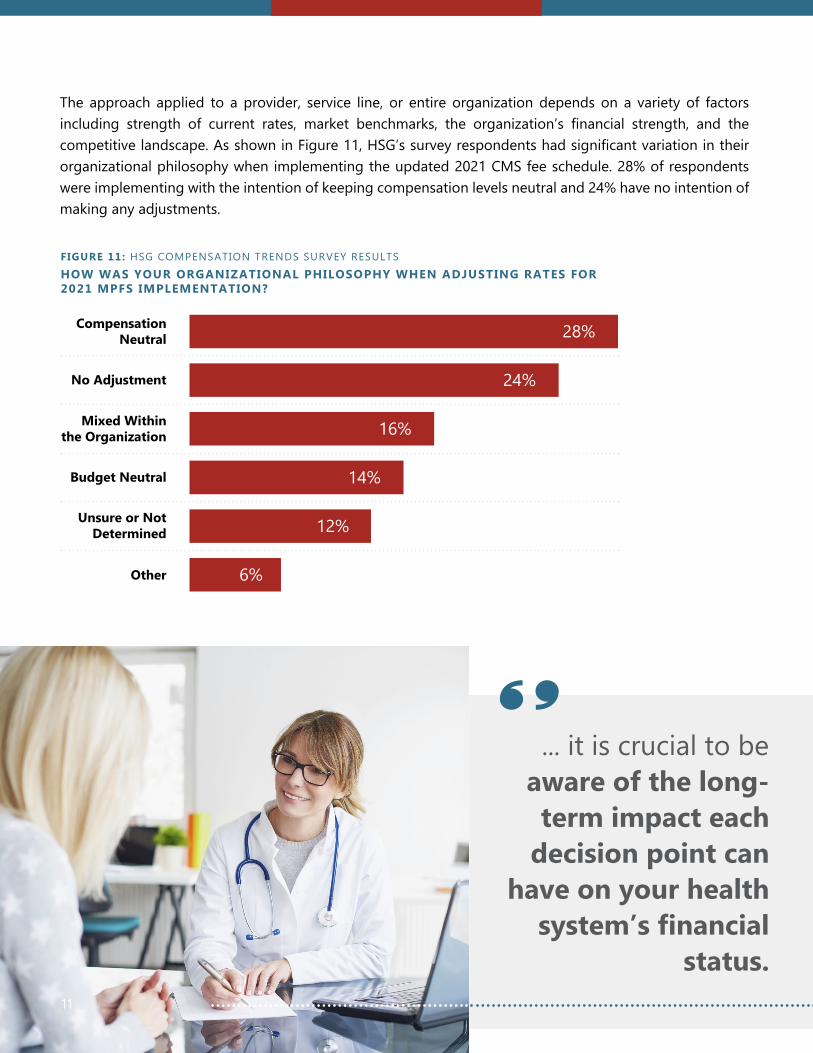
The approach applied to a provider, service line, or entire organization depends on a variety of factors
including strength of current rates, market benchmarks, the organization’s financial strength, and the competitive landscape. As shown in Figure 11, HSG’s survey respondents had significant variation in their organizational philosophy when implementing the updated 2021 CMS fee schedule. 28% of respondents
were implementing with the intention of keeping compensation levels neutral and 24% have no intention of
making any adjustments.
HOW WAS YOUR ORGANIZATIONAL PHILOSOPHY WHEN ADJUSTING RATES FOR 2021 MPFS IMPLEMENTATION?
FIGURE 11: HSG COMPENSATION TRENDS SURVEY RESULTS
11
... it is crucial to be
aware of the long-
term impact each
decision point can
have on your health
system’s financial status.
Compensation Neutral 28%
No Adjustment 24%
Mixed Within the Organization 16%
Budget Neutral 14%
Unsure or Not Determined 12%
Other 6%
12© 2021 HSGHSGadvisors.com
A medical group’s long-term success is dependent on having productive, engaged, and satisfied physicians and advanced practice providers.
Although there are many issues that affect providers, few a more impactful than compensation.
That is why the most successful provider organizations prioritize provider compensation strategy.
While provider compensation is never simple, the next few years will be increasingly complicated as
a result of the issues outlined in this whitepaper. Organizations must consider the lasting impacts of
COVID and the 2021 MPFS when designing or redesigning provider compensation plans. Failure to
do so could significantly threaten financial sustainability or provider satisfaction. Avoid this pitfalls by contacting HSG to learn about how we partner with health systems around the nation to develop
provider compensation strategies.
Conclusion

13© 2021 HSGHSGadvisors.comHSGadvisors.com | [email protected]