Embed Size (px)
Citation preview
EFA GlobalMonitoring Report
Educ
atio
n fo
r Al
l
Overcominginequality: whygovernancematters
0 0 92

Overcoming inequality:why governance matters
Overcoming inequality:why governance matters

90
02
Education f
or A
ll G
lobal M
onitorin
g R
eport
This Report is an independent publication commissioned by UNESCO
on behalf of the international community. It is the product of a collaborative
effort involving members of the Report Team and many other people,
agencies, institutions and governments.
The designations employed and the presentation of the material in
this publication do not imply the expression of any opinion whatsoever
on the part of UNESCO concerning the legal status of any country, territory,
city or area, or of its authorities, or concerning the delimitation of its
frontiers or boundaries.
The EFA Global Monitoring Report Team is responsible for the choice
and the presentation of the facts contained in this book and for the opinions
expressed therein, which are not necessarily those of UNESCO and do not
commit the Organization.
Great Clarendon Street, Oxford OX2 6DP
Oxford University Press is a department
of the University of Oxford.
It furthers the University’s objective of excellence
in research, scholarship, and education by publishing
worldwide in Oxford New York Auckland Cape Town
Dar es Salaam Hong Kong (China) Karachi Kuala Lumpur
Madrid Melbourne Mexico City Nairobi New Delhi
Shanghai Taipei Toronto With offices in Argentina Austria
Brazil Chile Czech Republic France Greece Guatemala
Hungary Italy Japan Poland Portugal Republic of Korea
Singapore Switzerland Thailand Turkey Ukraine Viet Nam
Oxford is a registered trade mark of Oxford University
Press in the UK and in certain other countries.
Published jointly by the United Nations Educational,
Scientific and Cultural Organization (UNESCO),
7, Place de Fontenoy, 75352 Paris 07 SP, France
and Oxford University Press, Great Clarendon Street,
Oxford OX2 6DP, United Kingdom.
© UNESCO, 2008
All rights reserved
First published 2008
Published in 2008 by the United Nations Educational,
Scientific and Cultural Organization
7, Place de Fontenoy, 75352 Paris 07 SP, France
Graphic design by Sylvaine Baeyens
Layout: Sylvaine Baeyens and Hélène Borel
Library of Congress Cataloging in Publication Data
Data available
Typeset by UNESCO
Printed on acid-free paper by Rotolito Lombarda SpA
OUP ISBN 978-0-19-954419-6
UNESCO ISBN 978-92-3-104089-4

F O R E W O R D
i
When a majority of the world’s countries committed at the turn of the new century to achieve Education
for All (EFA) by 2015, they did so with the confidence that the EFA goals would stand the test of time.
They are making a difference. Remarkable gains have been registered in many of the world’s poorest
countries towards universal primary education and gender parity. But we still have a long way to go.
Progress has been too slow and too uneven in many countries. There is now a clear and present danger
that some key goals will not be achieved. Averting that danger is vital, not just because education is a basic
human right, but also because it is crucial for improving child and maternal health, individual incomes,
environmental sustainability and economic growth, and for driving progress towards all the Millennium
Development Goals.
This seventh edition of the EFA Global Monitoring Report offers a warning to governments, donors and
the international community. On current trends universal primary education will not be achieved by 2015.
Too many children are receiving an education of such poor quality that they leave school without basic literacy
and numeracy skills. Finally, deep and persistent disparities based on wealth, gender, location, ethnicity
and other markers for disadvantage are acting as a major barrier to progress in education. If the world’s
governments are serious about Education for All, they must get more serious about tackling inequality.
This Report persuasively argues that equity must be at the centre of the EFA agenda, to offset rising
inequalities. Financing and governance reforms have an important role to play. Developing countries are
not spending enough on basic education and donors have not lived up to their commitments. Stagnating
aid to education is a serious concern for educational prospects in a large number of low-income countries.
This clearly has to change in order to achieve EFA. But increased financing without equity will not benefit
the most vulnerable and disadvantaged groups. A pro-poor approach to education policy is imperative
for the goals to have meaning for the world’s out-of-school children and 776 million adult illiterates.
The Report presents some of the public policy and governance reforms that can break the cycle
of disadvantage, improve access, raise quality, and enhance participation and accountability.
At the September 2008 United Nations High-Level Event on the Millennium Development Goals, world
leaders and a broad range of partners stressed the key role of education for achieving anti-poverty targets
and pledged additional resources. It is crucial that governments and donors do not renege on these
commitments if education is going to become a reality for all the world’s children.
This Report, which tracks progress annually towards the EFA goals, offers a comprehensive overview
of the state of education in the world today. It provides national and international policy-makers with
the analysis of complex issues, lessons learned and recommendations to provide equal chances in learning
for all children, youth and adults. We are now more than halfway to 2015. The diagnosis is clear; so are
the most effective strategies for addressing the most pressing educational challenges. By publishing this
authoritative annual report, UNESCO, as lead United Nations agency charged with coordinating efforts
towards EFA, aims to inform and to influence policy in order to steer the right course to 2015.
Koïchiro Matsuura
Foreword

90
02
Education f
or A
ll G
lobal M
onitorin
g R
eport
A C K N O W L E D G E M E N T S
i i
This report is the product of a cooperative effort. It has been researched and written by the Global
Monitoring Report team with the support of many people and organizations worldwide.
The team owes a special debt of gratitude to the members of the International Editorial Board
and its chair, Marcela Gajardo. Nicholas Burnett, the former director of the team and now Assistant
Director-General for Education at UNESCO, provided constant support and guidance.
The Report depends greatly on the work and expertise of the UNESCO Institute for Statistics (UIS).
We thank its director, Hendrik van der Pol, along with Claude Apkabie, Saïd Belkachla, Georges
Boade, Michael Bruneforth, Brian Buffet, Weixin Lu, Adriano Miele, Albert Motivans, Juan Cruz
Persua, José Pessoa, Pascale Ratovondrahona, Ioulia Sementchouk, Saïd Ould Voffal and Yanhong
Zhang. The UIS team made important contributions in many areas, particularly in the preparation of
Chapter 2 and the statistical tables. Thanks also to Amy Otchet for helping disseminate the findings
of the Report.
The analysis in the Report is informed by commissioned background papers from eminent
researchers. We thank all the authors who prepared background papers for this year’s Report:
Rashid Ahmed, Samer Al-Samarrai, Nadir Altinok, Massimo Amadio, Vaidyanatha Ayyar,
Masooda Bano, Elisabet Jané Camacho, Sergio Cardenas, Ketevan Chachakhiani, Luis A. Crouch,
Anton De Grauwe, Nader Fergany, Hanspeter Geisseler, Alec Ian Gershberg, Katharine Giffard-
Lindsay, Gabriele Göttelmann-Duret, Pablo González, Christine Harris-Van Keuren, Ken Harttgen,
Janine Huisman, Ulla Kahla, Jackie Kirk, Stephan Klasen, Karine Kruijff, Xin Ma, Athena Maikish,
Ben Mead, Mark Misselhorn, Mario Mouzinho, Karen Mundy, Juan-Enrique Opazo Marmentini,
Supote Prasertsri, Claude Sauvageot, Yusuf Sayed, Ai Shoraku, Iveta Silova, Jeroen Smits,
Devi Sridhar, Gita Steiner-Khamsi, Eszter Szucs, Tuomas Takala, Barbara Tournier and Paul Vachon.
Tragically, Jacqueline Kirk, one of our background paper authors, died in August 2008 during a
mission to Afghanistan. Jackie was a passionate advocate for education in conflict and post-conflict
situations, as well as a great scholar. Over the years she made important contributions to the Report
in many areas. Her courage, commitment and insights will be greatly missed.
Many colleagues at UNESCO supported the work of the Global Monitoring Report team.
We are indebted to numerous individuals within divisions and units of UNESCO’s Education Sector,
the International Institute for Educational Planning, the International Bureau of Education and
the UNESCO Institute for Lifelong Learning. UNESCO regional bureaux provided helpful advice
on country-level activities and helped facilitate commissioned studies.
We are grateful to the Education Policy and Data Center at the Academy for Educational
Development, and particularly to Karima Barrow, Ania Chaluda, Joseph Goodfriend, George Ingram,
HyeJin Kim, Sarah Oliver, Ben Sylla and Annababette Wills for their valuable contribution
and data for Chapter 2.
We are also grateful to Desmond Bermingham and Luc-Charles Gacougnolle of the Fast Track
Initiative Secretariat and to Julia Benn, Valérie Gaveau, Cecile Sangare and Simon Scott of
the Development Assistance Committee (DAC) of the Organisation for Economic Co-operation
and Development (OECD) for their continuing support and helpful advice on international cooperation
and aid data.
Acknowledgements

A C K N O W L E D G E M E N T S
i i i
Special thanks to Paul Bennell, Vittoria Cavicchioni, Louis Crouch, Rob Jenkins, Thomas Kellaghan,
Marlene Lockheed, Albert Motivans, Steve Packer and Abby Riddell, all of whom provided valuable
comments on draft chapters.
We would like to thank François Leclercq for his contribution to the development of the financing
section in Chapter 3.
The production of the Report benefited greatly from the editorial expertise of Rebecca Brite and
Wenda McNevin as well as from the support of Anaïs Loizillon, who assisted in developing graphic
material and the governance mapping Annex. We wish to acknowledge the work of Jan Worall, who
prepared the Report’s comprehensive index. We also thank our colleagues Fouzia Belhami, Lotfi Ben
Khelifa and Judith Roca of the UNESCO Education Knowledge Management Service for their help.
Nino Muñoz Gomez, Sue Williams and the staff of UNESCO’s Bureau of Public Information
have provided constant support in bringing the report to global media attention and giving advice
in matters relating to web, audiovisual and print publication.
For more information about the Report,please contact:The Director
EFA Global Monitoring Report Team
c/o UNESCO
7, place de Fontenoy, 75352 Paris 07 SP, France
e-mail: [email protected]
Tel.: +33 1 45 68 10 36
Fax: +33 1 45 68 56 41
www.efareport.unesco.org
Any errors or omissions found subsequent to printing will be corrected in the online version at www.efareport.unesco.org
Previous EFA Global Monitoring Reports2008. Education for All by 2015 – Will we make it?
2007. Strong foundations – Early childhood care and education
2006. Literacy for life
2005. Education for All – The quality imperative
2003/4. Gender and Education for All – The leap to equality
2002. Education for All – Is the world on track?
The EFA Global Monitoring Report Team
Director
Kevin Watkins
Samer Al-Samarrai, Nicole Bella, Aaron Benavot, Philip Marc Boua Liebnitz,
Mariela Buonomo, Fadila Caillaud, Alison Clayson, Cynthia Guttman, Anna Haas, Julia Heiss,
Keith Hinchliffe, Diederick de Jongh, Leila Loupis, Isabelle Merkoviç, Patrick Montjourides,
Claudine Mukizwa, Ulrika Peppler Barry, Paula Razquin, Pauline Rose, Suhad Varin.
90
02
Education f
or A
ll G
lobal M
onitorin
g R
eport
C O N T E N T S
i v
Foreword . . . . . . . . . . . . . . . . . . . . . . . . . . . . . . . . . . . . . . . . . . . . . . . . . . . . . . . . . . . . . . . . . . . . . . . . . . . . . . . . . . . . . . . . . . . . . . . . . . . . . . . . . . . . . . . . . . . . . . . . . . . . . . . . . . . . . . . . . . . . . . . . . . . . . . . . . . . . . . . . . . . . . . . . . . . . . . . . . . . . . . . . . . . . . i
Acknowledgements . . . . . . . . . . . . . . . . . . . . . . . . . . . . . . . . . . . . . . . . . . . . . . . . . . . . . . . . . . . . . . . . . . . . . . . . . . . . . . . . . . . . . . . . . . . . . . . . . . . . . . . . . . . . . . . . . . . . . . . . . . . . . . . . . . . . . . . . . . . . . . . . ii
List of figures, tables, text boxes and map . . . . . . . . . . . . . . . . . . . . . . . . . . . . . . . . . . . . . . . . . . . . . . . vi
Highlights of the Report . . . . . . . . . . . . . . . . . . . . . . . . . . . . . . . . . . . . . . . . . . . . . . . . . . . . . . . . . . . . . . . . . . . . . . . . . . . . . . . . . . . . . . . . . . . . . . . . . . . . . . . . . . . . . . . . . . . . . . . . . . . . 1
Overview . . . . . . . . . . . . . . . . . . . . . . . . . . . . . . . . . . . . . . . . . . . . . . . . . . . . . . . . . . . . . . . . . . . . . . . . . . . . . . . . . . . . . . . . . . . . . . . . . . . . . . . . . . . . . . . . . . . . . . . . . . . . . . . . . . . . . . . . . . . . . . . . . . . . . . . . . . . . . . . . . . . . . . . . . . . . . . . . . . . . . . . . . . . . . 6
Education for all: human right and catalyst for development . . . . . . . . . . . . . . . . . . . . . . . . . . . . . . . . . . . . . . . . . . . . . . . . . . . . . . . . . . . . . . . . . . . . . . . . . . . . . . . . . . . . . . . . . . . . . . . . . . . . . 23Introduction . . . . . . . . . . . . . . . . . . . . . . . . . . . . . . . . . . . . . . . . . . . . . . . . . . . . . . . . . . . . . . . . . . . . . . . . . . . . . . . . . . . . . . . . . . . . . . . . . . . . . . . . . . . . . . . . . . . . . . . . . . . . . . . . . . . . . . . . . . . . . . . . . . . . . . . . . . . . . . . . . . . . . . . . . . . . . . . . . . . . . . . . . . . . . . . 24
Educational opportunity: highly polarized . . . . . . . . . . . . . . . . . . . . . . . . . . . . . . . . . . . . . . . . . . . . . . . . . . . . . . . . . . . . . . . . . . . . . . . . . . . . . . . . . . . . . . . . . . . . . . . . . . . . . . . . . . . . 26
Unlocking the wider benefits of education . . . . . . . . . . . . . . . . . . . . . . . . . . . . . . . . . . . . . . . . . . . . . . . . . . . . . . . . . . . . . . . . . . . . . . . . . . . . . . . . . . . . . . . . . . . . . . . . . . . . . . . . . . . 29
Conclusion . . . . . . . . . . . . . . . . . . . . . . . . . . . . . . . . . . . . . . . . . . . . . . . . . . . . . . . . . . . . . . . . . . . . . . . . . . . . . . . . . . . . . . . . . . . . . . . . . . . . . . . . . . . . . . . . . . . . . . . . . . . . . . . . . . . . . . . . . . . . . . . . . . . . . . . . . . . . . . . . . . . . . . . . . . . . . . . . . . . . . . . . . . . . . . . . . . . 37
The Dakar goals: monitoring progress and inequality . . . . . . . . . . . . . . . . . . . . . . . . . . . . . . . . . . . . . . . . . . . . . . . . . . . . . . . . . . . . . . . . . . . . . . . . . . . . . . . . . . . . . . . . . . . . . . . . . . . . . . . . . . . . . . . . . . . . . . . . . . . . . . . 39Introduction . . . . . . . . . . . . . . . . . . . . . . . . . . . . . . . . . . . . . . . . . . . . . . . . . . . . . . . . . . . . . . . . . . . . . . . . . . . . . . . . . . . . . . . . . . . . . . . . . . . . . . . . . . . . . . . . . . . . . . . . . . . . . . . . . . . . . . . . . . . . . . . . . . . . . . . . . . . . . . . . . . . . . . . . . . . . . . . . . . . . . . . . . . . . . . . 40
Early childhood care and education: a long way to go . . . . . . . . . . . . . . . . . . . . . . . . . . . . . . . . . . . . . . . . . . . . . . . . . . . . . . . . . . . . . . . . . . . . . . . . . . . 42
Progress towards UPE: nations at the crossroads . . . . . . . . . . . . . . . . . . . . . . . . . . . . . . . . . . . . . . . . . . . . . . . . . . . . . . . . . . . . . . . . . . . . . . . . . . . . . . . . . . . . . . 56
Secondary education and beyond: some gains . . . . . . . . . . . . . . . . . . . . . . . . . . . . . . . . . . . . . . . . . . . . . . . . . . . . . . . . . . . . . . . . . . . . . . . . . . . . . . . . . . . . . . . . . . . . . . . 84
Meeting the lifelong learning needs of youth and adults . . . . . . . . . . . . . . . . . . . . . . . . . . . . . . . . . . . . . . . . . . . . . . . . . . . . . . . . . . . . . . . . . . . . 91
Adult literacy: still neglected . . . . . . . . . . . . . . . . . . . . . . . . . . . . . . . . . . . . . . . . . . . . . . . . . . . . . . . . . . . . . . . . . . . . . . . . . . . . . . . . . . . . . . . . . . . . . . . . . . . . . . . . . . . . . . . . . . . . . . . . . . . . . . . . . . . . . . . . . . . . . . . . 93
Assessing gender disparities and inequalities in education . . . . . . . . . . . . . . . . . . . . . . . . . . . . . . . . . . . . . . . . . . . . . . . . . . . . . . . . . . . . 97
Ensuring both equity and the quality of learning . . . . . . . . . . . . . . . . . . . . . . . . . . . . . . . . . . . . . . . . . . . . . . . . . . . . . . . . . . . . . . . . . . . . . . . . . . . . . . . . . . . . . . . . . 108
Education for All: measuring composite achievement . . . . . . . . . . . . . . . . . . . . . . . . . . . . . . . . . . . . . . . . . . . . . . . . . . . . . . . . . . . . . . . . . . . . . . . . . . . . 122
Raising quality and strengthening equity:why governance matters . . . . . . . . . . . . . . . . . . . . . . . . . . . . . . . . . . . . . . . . . . . . . . . . . . . . . . . . . . . . . . . . . . . . . . . . . . . . . . . . . . . . . . . . . . . . . . . . . . . . . . . . . . . . . . . . . . . . . . . . . 127Introduction . . . . . . . . . . . . . . . . . . . . . . . . . . . . . . . . . . . . . . . . . . . . . . . . . . . . . . . . . . . . . . . . . . . . . . . . . . . . . . . . . . . . . . . . . . . . . . . . . . . . . . . . . . . . . . . . . . . . . . . . . . . . . . . . . . . . . . . . . . . . . . . . . . . . . . . . . . . . . . . . . . . . . . . . . . . . . . . . . . . . . . . . . . . . . . . 128
Financing education for equity . . . . . . . . . . . . . . . . . . . . . . . . . . . . . . . . . . . . . . . . . . . . . . . . . . . . . . . . . . . . . . . . . . . . . . . . . . . . . . . . . . . . . . . . . . . . . . . . . . . . . . . . . . . . . . . . . . . . . . . . . . . . . . . . . . . . . . . . . . . 132
Choice, competition and voice: school governance reform and EFA . . . . . . . . . . . . . . . . . . . . . . . . . . . . . . . . . . . . . 152
Strengthening teacher governance and monitoring . . . . . . . . . . . . . . . . . . . . . . . . . . . . . . . . . . . . . . . . . . . . . . . . . . . . . . . . . . . . . . . . . . . . . . . . . . . . . . . . . 171
An integrated approach to education and poverty reduction: the missing link . . . . . . . . . . 185
Chapter 3
Chapter 2
Chapter 1
Contents

C O N T E N T S
v
Increasing aid and improving governance . . . . . . . . . . . . . . . . . . . . . . . . . . . . . . . . . . . . . . . . . . . . . . . . . 203Introduction . . . . . . . . . . . . . . . . . . . . . . . . . . . . . . . . . . . . . . . . . . . . . . . . . . . . . . . . . . . . . . . . . . . . . . . . . . . . . . . . . . . . . . . . . . . . . . . . . . . . . . . . . . . . . . . . . . . . . . . . . . . . . . . . . . . . . . . . . . . . . . . . . . . . . . . . . . . . . . . . . . . . . . . . . . . . . . . . . . . . . . . . . . . . . . . 204
Aid for education . . . . . . . . . . . . . . . . . . . . . . . . . . . . . . . . . . . . . . . . . . . . . . . . . . . . . . . . . . . . . . . . . . . . . . . . . . . . . . . . . . . . . . . . . . . . . . . . . . . . . . . . . . . . . . . . . . . . . . . . . . . . . . . . . . . . . . . . . . . . . . . . . . . . . . . . . . . . . . . . . . . . . . . . . . . . . . . . . 205
Governance and aid effectiveness . . . . . . . . . . . . . . . . . . . . . . . . . . . . . . . . . . . . . . . . . . . . . . . . . . . . . . . . . . . . . . . . . . . . . . . . . . . . . . . . . . . . . . . . . . . . . . . . . . . . . . . . . . . . . . . . . . . . . . . . . . . . . . . . . . 219
Policy conclusions and recommendations . . . . . . . . . . . . . . . . . . . . . . . . . . . . . . . . . . . . . . . . . . . . . . . . 235What governments can do . . . . . . . . . . . . . . . . . . . . . . . . . . . . . . . . . . . . . . . . . . . . . . . . . . . . . . . . . . . . . . . . . . . . . . . . . . . . . . . . . . . . . . . . . . . . . . . . . . . . . . . . . . . . . . . . . . . . . . . . . . . . . . . . . . . . . . . . . . . . . . . . . . . . . . . . 236
The role of aid donors . . . . . . . . . . . . . . . . . . . . . . . . . . . . . . . . . . . . . . . . . . . . . . . . . . . . . . . . . . . . . . . . . . . . . . . . . . . . . . . . . . . . . . . . . . . . . . . . . . . . . . . . . . . . . . . . . . . . . . . . . . . . . . . . . . . . . . . . . . . . . . . . . . . . . . . . . . . . . . . . . . . . 240
The role of non-government actors . . . . . . . . . . . . . . . . . . . . . . . . . . . . . . . . . . . . . . . . . . . . . . . . . . . . . . . . . . . . . . . . . . . . . . . . . . . . . . . . . . . . . . . . . . . . . . . . . . . . . . . . . . . . . . . . . . . . . . . . . . . . . . 241
Annex . . . . . . . . . . . . . . . . . . . . . . . . . . . . . . . . . . . . . . . . . . . . . . . . . . . . . . . . . . . . . . . . . . . . . . . . . . . . . . . . . . . . . . . . . . . . . . . . . . . . . . . . . . . . . . . . . . . . . . . . . . . . . . . . . . . . . . . . . . . . . . . . . . . . . . . . . . . . . . . . . . . . . . . . . . . . . . . . . . . . . . . . . . . . . . . . . . . . . . . . . . 243The Education for All Development Index . . . . . . . . . . . . . . . . . . . . . . . . . . . . . . . . . . . . . . . . . . . . . . . . . . . . . . . . . . . . . . . . . . . . . . . . . . . . . . . . . . . . . . . . . . . . . . . . . . . . . . . . . . . . . 244
Global and regional patterns in education decision-making . . . . . . . . . . . . . . . . . . . . . . . . . . . . . . . . . . . . . . . . . . . . . . . . . . . . . . . . . . . . 252
Statistical tables . . . . . . . . . . . . . . . . . . . . . . . . . . . . . . . . . . . . . . . . . . . . . . . . . . . . . . . . . . . . . . . . . . . . . . . . . . . . . . . . . . . . . . . . . . . . . . . . . . . . . . . . . . . . . . . . . . . . . . . . . . . . . . . . . . . . . . . . . . . . . . . . . . . . . . . . . . . . . . . . . . . . . . . . . . . . . . . . . . 256
Aid tables . . . . . . . . . . . . . . . . . . . . . . . . . . . . . . . . . . . . . . . . . . . . . . . . . . . . . . . . . . . . . . . . . . . . . . . . . . . . . . . . . . . . . . . . . . . . . . . . . . . . . . . . . . . . . . . . . . . . . . . . . . . . . . . . . . . . . . . . . . . . . . . . . . . . . . . . . . . . . . . . . . . . . . . . . . . . . . . . . . . . . . . . . . . . . . . . . . . . . . 389
Glossary . . . . . . . . . . . . . . . . . . . . . . . . . . . . . . . . . . . . . . . . . . . . . . . . . . . . . . . . . . . . . . . . . . . . . . . . . . . . . . . . . . . . . . . . . . . . . . . . . . . . . . . . . . . . . . . . . . . . . . . . . . . . . . . . . . . . . . . . . . . . . . . . . . . . . . . . . . . . . . . . . . . . . . . . . . . . . . . . . . . . . . . . . . . . . . . . . . . . . . . . . . 407
References . . . . . . . . . . . . . . . . . . . . . . . . . . . . . . . . . . . . . . . . . . . . . . . . . . . . . . . . . . . . . . . . . . . . . . . . . . . . . . . . . . . . . . . . . . . . . . . . . . . . . . . . . . . . . . . . . . . . . . . . . . . . . . . . . . . . . . . . . . . . . . . . . . . . . . . . . . . . . . . . . . . . . . . . . . . . . . . . . . . . . . . . . . . . . . . . . . . 414
Abbreviations . . . . . . . . . . . . . . . . . . . . . . . . . . . . . . . . . . . . . . . . . . . . . . . . . . . . . . . . . . . . . . . . . . . . . . . . . . . . . . . . . . . . . . . . . . . . . . . . . . . . . . . . . . . . . . . . . . . . . . . . . . . . . . . . . . . . . . . . . . . . . . . . . . . . . . . . . . . . . . . . . . . . . . . . . . . . . . . . . . . . . . . . . . . . 440
Index . . . . . . . . . . . . . . . . . . . . . . . . . . . . . . . . . . . . . . . . . . . . . . . . . . . . . . . . . . . . . . . . . . . . . . . . . . . . . . . . . . . . . . . . . . . . . . . . . . . . . . . . . . . . . . . . . . . . . . . . . . . . . . . . . . . . . . . . . . . . . . . . . . . . . . . . . . . . . . . . . . . . . . . . . . . . . . . . . . . . . . . . . . . . . . . . . . . . . . . . . . . . . . . . . . . 442
Chapter 5
Chapter 4

90
02
Education f
or A
ll G
lobal M
onitorin
g R
eport
C O N T E N T S
V I
Figures
1.1: Age-specific attendance rates by level in OECD countries and sub-Saharan Africa, 2000–2006 . . . . . . . . . . . . . . . . . . . . . . . . . . . . . . . . . . . . . . . . . . . . . . . 27
1.2: Grade attainment among 10- to 19-year-olds in Latin America and the Caribbean, South and West Asia,
and sub-Saharan Africa, 2000–2006 . . . . . . . . . . . . . . . . . . . . . . . . . . . . . . . . . . . . . . . . . . . . . . . . . . . . . . . . . . . . . . . . . . . . . . . . . . . . . . . . . . . . . . . . . . . . . . . . . . . . . . . . . . . . . . . . . . . . . . . . . . . . . . . . . . . . . . . . . . . . . . . . . . . . . . . . . . . . . . . . . . . . . 27
1.3: Under-5 mortality rate by mother’s level of education, selected countries, most recent year . . . . . . . . . . . . . . . . . . . . . . . . . . . . . . . . . . . . . . . . . . . . . . . . . 33
1.4: Child vaccination and mother’s level of education, selected countries, most recent year
(% of 1-year-olds having received selected vaccines by the time of the survey) . . . . . . . . . . . . . . . . . . . . . . . . . . . . . . . . . . . . . . . . . . . . . . . . . . . . . . . . . . . . . . . . . . . . . . . . . . . 33
1.5: Antenatal care by mother’s level of education, selected countries, most recent year . . . . . . . . . . . . . . . . . . . . . . . . . . . . . . . . . . . . . . . . . . . . . . . . . . . . . . . . . . . . . . . . . 34
1.6: Severe stunting among children under 3 by mother’s level of education, selected countries, most recent year . . . . . . . . . . . . 35
2.1: Rates of decline in under-5 mortality in 1990—2006 and required rates for 2007—2015 to meet the MDG . . . . . . . . . . . . . . . . . . . . . . . . . . . . 44
2.2: Under-5 mortality rates by location and income group, selected countries, most recent year . . . . . . . . . . . . . . . . . . . . . . . . . . . . . . . . . . . . . . . . . . . . . . . . 45
2.3: Ratio of under-5 mortality rates of the richest 20% compared with those of the poorest 20% of households,
selected countries, most recent year . . . . . . . . . . . . . . . . . . . . . . . . . . . . . . . . . . . . . . . . . . . . . . . . . . . . . . . . . . . . . . . . . . . . . . . . . . . . . . . . . . . . . . . . . . . . . . . . . . . . . . . . . . . . . . . . . . . . . . . . . . . . . . . . . . . . . . . . . . . . . . . . . . . . . . . . . . . . . . . . . . 45
2.4: Low birth weight and moderate and severe stunting worldwide . . . . . . . . . . . . . . . . . . . . . . . . . . . . . . . . . . . . . . . . . . . . . . . . . . . . . . . . . . . . . . . . . . . . . . . . . . . . . . . . . . . . . . . . . . . . . . . . . . . . . . . . . . . . 47
2.5: Change in pre-primary gross enrolment ratios between 1999 and 2006 in countries with GERs
below 90% in 2006 . . . . . . . . . . . . . . . . . . . . . . . . . . . . . . . . . . . . . . . . . . . . . . . . . . . . . . . . . . . . . . . . . . . . . . . . . . . . . . . . . . . . . . . . . . . . . . . . . . . . . . . . . . . . . . . . . . . . . . . . . . . . . . . . . . . . . . . . . . . . . . . . . . . . . . . . . . . . . . . . . . . . . . . . . . . . . . . . . . . . . . . . . . . . . . . . . . . . . . 52
2.6: Percentage of children aged 4 and 5 in Egypt attending kindergarten, by place of residence
and wealth quintile, 2005—2006 . . . . . . . . . . . . . . . . . . . . . . . . . . . . . . . . . . . . . . . . . . . . . . . . . . . . . . . . . . . . . . . . . . . . . . . . . . . . . . . . . . . . . . . . . . . . . . . . . . . . . . . . . . . . . . . . . . . . . . . . . . . . . . . . . . . . . . . . . . . . . . . . . . . . . . . . . . . . . . . . . . . . . . . . . . . . 53
2.7: Disparities in pre-school attendance of 3- and 4-year-olds, selected countries, most recent year . . . . . . . . . . . . . . . . . . . . . . . . . . . . . . . . . . . . . . . . 54
2.8: School-age population in 2006 and 2015 as a percentage of school-age population in 1995, by region . . . . . . . . . . . . . . . . . . . . . . . . . . . . . . . 57
2.9: Change in primary net enrolment ratios in countries with NERs below 97% in 1999 or 2006 . . . . . . . . . . . . . . . . . . . . . . . . . . . . . . . . . . . . . . . . . . . . . . . . . . . 60
2.10: Number of out-of-school children in selected countries, 1999 and 2006 . . . . . . . . . . . . . . . . . . . . . . . . . . . . . . . . . . . . . . . . . . . . . . . . . . . . . . . . . . . . . . . . . . . . . . . . . . . . . . . . . . . . . . . . . . . . 62
2.11: Distribution of out-of-school children by school exposure, by region, 2004 . . . . . . . . . . . . . . . . . . . . . . . . . . . . . . . . . . . . . . . . . . . . . . . . . . . . . . . . . . . . . . . . . . . . . . . . . . . . . . . . . . . . . 63
2.12: Percentage of out-of-school children unlikely to enrol, by gender, 2006 . . . . . . . . . . . . . . . . . . . . . . . . . . . . . . . . . . . . . . . . . . . . . . . . . . . . . . . . . . . . . . . . . . . . . . . . . . . . . . . . . . . . . . . . . . . 65
2.13: Primary school progression without repetition or dropout, selected countries, 2006 . . . . . . . . . . . . . . . . . . . . . . . . . . . . . . . . . . . . . . . . . . . . . . . . . . . . . . . . . . . . . . . . . 67
2.14: Percentage of pupils relative to the official primary-school age group, most recent year . . . . . . . . . . . . . . . . . . . . . . . . . . . . . . . . . . . . . . . . . . . . . . . . . . . . . . . . 68
2.15: Survival rates to grade 9 for three age groups: expected age for grade, one year over age
and two or more years over age, most recent year . . . . . . . . . . . . . . . . . . . . . . . . . . . . . . . . . . . . . . . . . . . . . . . . . . . . . . . . . . . . . . . . . . . . . . . . . . . . . . . . . . . . . . . . . . . . . . . . . . . . . . . . . . . . . . . . . . . . . . . . . . . . . . . . . . . . . . 69
2.16: Under-age pupils as a percentage of grade 1 enrolment, total repetition rate and under-age
repetition rate for grade 1, most recent year . . . . . . . . . . . . . . . . . . . . . . . . . . . . . . . . . . . . . . . . . . . . . . . . . . . . . . . . . . . . . . . . . . . . . . . . . . . . . . . . . . . . . . . . . . . . . . . . . . . . . . . . . . . . . . . . . . . . . . . . . . . . . . . . . . . . . . . . . . . . . . . . . . 69
2.17: Primary net enrolment ratios and survival rates to the last grade of primary education, 2005 and 2006 . . . . . . . . . . . . . . . . . . . . . . . . . 71
2.18: Changes in net enrolment ratios and survival rates in primary education, selected countries . . . . . . . . . . . . . . . . . . . . . . . . . . . . . . . . . . . . . . . . . . . . . . . 72
2.19: Opportunity gaps: population reaching tertiary education in OECD countries and chances
of primary school completion in developing countries . . . . . . . . . . . . . . . . . . . . . . . . . . . . . . . . . . . . . . . . . . . . . . . . . . . . . . . . . . . . . . . . . . . . . . . . . . . . . . . . . . . . . . . . . . . . . . . . . . . . . . . . . . . . . . . . . . . . . . . . . . . . . . . 73
2.20: Primary net attendance and primary attainment rates for poorest and richest, selected countries,
most recent year . . . . . . . . . . . . . . . . . . . . . . . . . . . . . . . . . . . . . . . . . . . . . . . . . . . . . . . . . . . . . . . . . . . . . . . . . . . . . . . . . . . . . . . . . . . . . . . . . . . . . . . . . . . . . . . . . . . . . . . . . . . . . . . . . . . . . . . . . . . . . . . . . . . . . . . . . . . . . . . . . . . . . . . . . . . . . . . . . . . . . . . . . . . . . . . . . . . . . . . . . . 74
2.21: Primary net attendance rates by wealth quintile, selected countries, most recent year . . . . . . . . . . . . . . . . . . . . . . . . . . . . . . . . . . . . . . . . . . . . . . . . . . . . . . . . . . . . 75
2.22: Grade survival in primary school for 10- to 19-year-olds, by wealth quintile, Cambodia and Senegal, 2005 . . . . . . . . . . . . . . . . . . . . . . . 77
List of figures, tables, text boxes and map

C O N T E N T S
V I I
2.23: Primary net attendance rates by location, wealth quintile and gender, selected countries, most recent year . . . . . . . . . . . . . . . . . 79
2.24: School attendance disadvantage for economically active children . . . . . . . . . . . . . . . . . . . . . . . . . . . . . . . . . . . . . . . . . . . . . . . . . . . . . . . . . . . . . . . . . . . . . . . . . . . . . . . . . . . . . . . . . . . . . . . . . . . . . . . 80
2.25: Proportion of children aged 6 to 11 with and without disabilities who are in school . . . . . . . . . . . . . . . . . . . . . . . . . . . . . . . . . . . . . . . . . . . . . . . . . . . . . . . . . . . . . . . . . . . . . 83
2.26: Secondary attainment rates among adults and youth, by region, circa 2000 . . . . . . . . . . . . . . . . . . . . . . . . . . . . . . . . . . . . . . . . . . . . . . . . . . . . . . . . . . . . . . . . . . . . . . . . . . . . . . . . . . 86
2.27: Survival rates to each grade of primary and secondary education, by gender, selected countries,
most recent year . . . . . . . . . . . . . . . . . . . . . . . . . . . . . . . . . . . . . . . . . . . . . . . . . . . . . . . . . . . . . . . . . . . . . . . . . . . . . . . . . . . . . . . . . . . . . . . . . . . . . . . . . . . . . . . . . . . . . . . . . . . . . . . . . . . . . . . . . . . . . . . . . . . . . . . . . . . . . . . . . . . . . . . . . . . . . . . . . . . . . . . . . . . . . . . . . . . . . . . . . . 87
2.28: Net attendance rates in secondary education, by wealth quintile, selected countries, most recent year . . . . . . . . . . . . . . . . . . . . . . . . . . . 88
2.29: Survival rates to each grade of primary and secondary education, by wealth quintile,
selected countries, most recent year . . . . . . . . . . . . . . . . . . . . . . . . . . . . . . . . . . . . . . . . . . . . . . . . . . . . . . . . . . . . . . . . . . . . . . . . . . . . . . . . . . . . . . . . . . . . . . . . . . . . . . . . . . . . . . . . . . . . . . . . . . . . . . . . . . . . . . . . . . . . . . . . . . . . . . . . . . . . . . . . . . 89
2.30: Countries with the greatest numbers of adult illiterates (age 15+) as of 2000–2006 . . . . . . . . . . . . . . . . . . . . . . . . . . . . . . . . . . . . . . . . . . . . . . . . . . . . . . . . . . . . . . . . . . . . 94
2.31: Changes in gender disparities in primary gross enrolment ratios between 1999 and 2006 . . . . . . . . . . . . . . . . . . . . . . . . . . . . . . . . . . . . . . . . . . . . . . . . . . . . . . . 99
2.32: Changes in gender disparities in access to primary education between 1999 and 2006, by region . . . . . . . . . . . . . . . . . . . . . . . . . . . . . . . . . . . . . . . 100
2.33: Change in gender disparities in secondary gross enrolment ratios between 1999 and 2006, by region . . . . . . . . . . . . . . . . . . . . . . . . . . . . . . 101
2.34: Changes in gender disparities in secondary gross enrolment ratios between 1999 and 2006 . . . . . . . . . . . . . . . . . . . . . . . . . . . . . . . . . . . . . . . . . . . . . . . . . . 102
2.35: Gender parity index of secondary school enrolment, Bangladesh . . . . . . . . . . . . . . . . . . . . . . . . . . . . . . . . . . . . . . . . . . . . . . . . . . . . . . . . . . . . . . . . . . . . . . . . . . . . . . . . . . . . . . . . . . . . . . . . . . . . . . . . . 103
2.36: Change in gender disparities in tertiary gross enrolment ratio by region between 1999 and 2006 . . . . . . . . . . . . . . . . . . . . . . . . . . . . . . . . . . . . . . . 103
2.37: Gender parity index of net attendance rates, by education level and wealth quintile,
selected countries, most recent year . . . . . . . . . . . . . . . . . . . . . . . . . . . . . . . . . . . . . . . . . . . . . . . . . . . . . . . . . . . . . . . . . . . . . . . . . . . . . . . . . . . . . . . . . . . . . . . . . . . . . . . . . . . . . . . . . . . . . . . . . . . . . . . . . . . . . . . . . . . . . . . . . . . . . . . . . . . . . . . . . . 104
2.38: Percentage of female teachers by level of education and by region, 2006 . . . . . . . . . . . . . . . . . . . . . . . . . . . . . . . . . . . . . . . . . . . . . . . . . . . . . . . . . . . . . . . . . . . . . . . . . . . . . . . . . . . . . . . 107
2.39: Percentage of low performing students (at or below level 1) in science literacy, PISA 2006 . . . . . . . . . . . . . . . . . . . . . . . . . . . . . . . . . . . . . . . . . . . . . . . . . . . . . 110
2.40: Disparities in mean learning achievement in primary education among developed countries,
developing countries and countries in transition, 1995–2006 . . . . . . . . . . . . . . . . . . . . . . . . . . . . . . . . . . . . . . . . . . . . . . . . . . . . . . . . . . . . . . . . . . . . . . . . . . . . . . . . . . . . . . . . . . . . . . . . . . . . . . . . . . . . . . . . . . 112
2.41: Comparison of PTRs with ratios of pupils to trained teachers in primary education, 2006 . . . . . . . . . . . . . . . . . . . . . . . . . . . . . . . . . . . . . . . . . . . . . . . . . . . . . . . . 119
2.42: Public-to-private sector disparities in primary PTRs, 2006 . . . . . . . . . . . . . . . . . . . . . . . . . . . . . . . . . . . . . . . . . . . . . . . . . . . . . . . . . . . . . . . . . . . . . . . . . . . . . . . . . . . . . . . . . . . . . . . . . . . . . . . . . . . . . . . . . . . . . . 120
2.43: EDI in 2006 and change since 1999 . . . . . . . . . . . . . . . . . . . . . . . . . . . . . . . . . . . . . . . . . . . . . . . . . . . . . . . . . . . . . . . . . . . . . . . . . . . . . . . . . . . . . . . . . . . . . . . . . . . . . . . . . . . . . . . . . . . . . . . . . . . . . . . . . . . . . . . . . . . . . . . . . . . . . . . . . . . . . . . . . . . . . . 124
2.44: EFA Inequality Index by wealth quintile, selected countries, most recent year . . . . . . . . . . . . . . . . . . . . . . . . . . . . . . . . . . . . . . . . . . . . . . . . . . . . . . . . . . . . . . . . . . . . . . . . . . . . . . . 125
3.1: Change in total public expenditure on education as a percentage of GNP between 1999 and 2006
(percentage points) . . . . . . . . . . . . . . . . . . . . . . . . . . . . . . . . . . . . . . . . . . . . . . . . . . . . . . . . . . . . . . . . . . . . . . . . . . . . . . . . . . . . . . . . . . . . . . . . . . . . . . . . . . . . . . . . . . . . . . . . . . . . . . . . . . . . . . . . . . . . . . . . . . . . . . . . . . . . . . . . . . . . . . . . . . . . . . . . . . . . . . . . . . . . . . . . . . . . . 134
3.2: Distribution of public current expenditure on education by level, sub-Saharan Africa, 2006 . . . . . . . . . . . . . . . . . . . . . . . . . . . . . . . . . . . . . . . . . . . . . . . . . . . 135
3.3: Inequality among countries in public expenditure per primary school pupil, 2006 . . . . . . . . . . . . . . . . . . . . . . . . . . . . . . . . . . . . . . . . . . . . . . . . . . . . . . . . . . . . . . . . . . . . . . . 136
3.4: Distribution of global public education expenditure by region, 2004 . . . . . . . . . . . . . . . . . . . . . . . . . . . . . . . . . . . . . . . . . . . . . . . . . . . . . . . . . . . . . . . . . . . . . . . . . . . . . . . . . . . . . . . . . . . . . . . . . . 137
3.5: Distribution of global public education expenditure by country, 2004 . . . . . . . . . . . . . . . . . . . . . . . . . . . . . . . . . . . . . . . . . . . . . . . . . . . . . . . . . . . . . . . . . . . . . . . . . . . . . . . . . . . . . . . . . . . . . . . . 137
3.6: Trends in primary net enrolment ratios in Ghana before and after introduction
of the Capitation Grant Scheme . . . . . . . . . . . . . . . . . . . . . . . . . . . . . . . . . . . . . . . . . . . . . . . . . . . . . . . . . . . . . . . . . . . . . . . . . . . . . . . . . . . . . . . . . . . . . . . . . . . . . . . . . . . . . . . . . . . . . . . . . . . . . . . . . . . . . . . . . . . . . . . . . . . . . . . . . . . . . . . . . . . . . . . . . . . . . 144
3.7: Gross enrolment ratios in Pakistan by location and gender, 2004/2005 . . . . . . . . . . . . . . . . . . . . . . . . . . . . . . . . . . . . . . . . . . . . . . . . . . . . . . . . . . . . . . . . . . . . . . . . . . . . . . . . . . . . . . . . . . . . . 169
3.8: Education equity-associated targets in eighteen PRSPs . . . . . . . . . . . . . . . . . . . . . . . . . . . . . . . . . . . . . . . . . . . . . . . . . . . . . . . . . . . . . . . . . . . . . . . . . . . . . . . . . . . . . . . . . . . . . . . . . . . . . . . . . . . . . . . . . . . . . . . . . . . . . 189
90
02
Education f
or A
ll G
lobal M
onitorin
g R
eport
C O N T E N T S
4.1: Total ODA net disbursements, 1999–2007 . . . . . . . . . . . . . . . . . . . . . . . . . . . . . . . . . . . . . . . . . . . . . . . . . . . . . . . . . . . . . . . . . . . . . . . . . . . . . . . . . . . . . . . . . . . . . . . . . . . . . . . . . . . . . . . . . . . . . . . . . . . . . . . . . . . . . . . . . . . . . . . . . . . . . . . . . . . 207
4.2: Aid as a percentage of GNI, net disbursements, 2005–2010 . . . . . . . . . . . . . . . . . . . . . . . . . . . . . . . . . . . . . . . . . . . . . . . . . . . . . . . . . . . . . . . . . . . . . . . . . . . . . . . . . . . . . . . . . . . . . . . . . . . . . . . . . . . . . . . . . . . . . . 207
4.3: Total aid commitments to education and basic education, 1999–2006 . . . . . . . . . . . . . . . . . . . . . . . . . . . . . . . . . . . . . . . . . . . . . . . . . . . . . . . . . . . . . . . . . . . . . . . . . . . . . . . . . . . . . . . . . . . . . . . . . 208
4.4: Components of aid to education and to basic education, 2006 . . . . . . . . . . . . . . . . . . . . . . . . . . . . . . . . . . . . . . . . . . . . . . . . . . . . . . . . . . . . . . . . . . . . . . . . . . . . . . . . . . . . . . . . . . . . . . . . . . . . . . . . . . . . . . 209
4.5: Share of social sectors in total aid commitments, 1999–2006 . . . . . . . . . . . . . . . . . . . . . . . . . . . . . . . . . . . . . . . . . . . . . . . . . . . . . . . . . . . . . . . . . . . . . . . . . . . . . . . . . . . . . . . . . . . . . . . . . . . . . . . . . . . . . . . . . . 210
4.6: Total aid disbursements to education and basic education, 2002–2006 . . . . . . . . . . . . . . . . . . . . . . . . . . . . . . . . . . . . . . . . . . . . . . . . . . . . . . . . . . . . . . . . . . . . . . . . . . . . . . . . . . . . . . . . . . . . . . 210
4.7: Aid to education and basic education by income group, commitments . . . . . . . . . . . . . . . . . . . . . . . . . . . . . . . . . . . . . . . . . . . . . . . . . . . . . . . . . . . . . . . . . . . . . . . . . . . . . . . . . . . . . . . . . . . . . . 211
4.8: Total aid to basic education (commitments) and out-of-school children of primary-school age,
1999–2000 and 2005–2006 . . . . . . . . . . . . . . . . . . . . . . . . . . . . . . . . . . . . . . . . . . . . . . . . . . . . . . . . . . . . . . . . . . . . . . . . . . . . . . . . . . . . . . . . . . . . . . . . . . . . . . . . . . . . . . . . . . . . . . . . . . . . . . . . . . . . . . . . . . . . . . . . . . . . . . . . . . . . . . . . . . . . . . . . . . . . . . . . . . . . . . . . 212
4.9: Aid to basic education (commitments) and progress towards UPE . . . . . . . . . . . . . . . . . . . . . . . . . . . . . . . . . . . . . . . . . . . . . . . . . . . . . . . . . . . . . . . . . . . . . . . . . . . . . . . . . . . . . . . . . . . . . . . . . . . . . . . . 213
4.10: Total aid to education and basic education (commitments), by donor, 2006 . . . . . . . . . . . . . . . . . . . . . . . . . . . . . . . . . . . . . . . . . . . . . . . . . . . . . . . . . . . . . . . . . . . . . . . . . . . . . . . . . . . . 214
4.11: Change in aid to education and basic education between 2005 and 2006, by donor, commitments . . . . . . . . . . . . . . . . . . . . . . . . . . . . . . . . . . . . . . 215
4.12: Non-concessional loans for education, 1999–2006, commitments . . . . . . . . . . . . . . . . . . . . . . . . . . . . . . . . . . . . . . . . . . . . . . . . . . . . . . . . . . . . . . . . . . . . . . . . . . . . . . . . . . . . . . . . . . . . . . . . . . . . . . . . . . 217
4.13: Donor priority to low income countries and to basic education, aid commitments, 2005–2006 annual average . . . . . . . . . . . . . 218
4.14: Distribution of aid to education by level, France and Germany, commitments, 2005–2006 annual average . . . . . . . . . . . . . . . . . . . . . . . 218
4.15: Categories of aid to basic education, 1999–2006, commitments . . . . . . . . . . . . . . . . . . . . . . . . . . . . . . . . . . . . . . . . . . . . . . . . . . . . . . . . . . . . . . . . . . . . . . . . . . . . . . . . . . . . . . . . . . . . . . . . . . . . . . . . . . . . . 222
4.16: Donor involvement in education sector programmes in five countries . . . . . . . . . . . . . . . . . . . . . . . . . . . . . . . . . . . . . . . . . . . . . . . . . . . . . . . . . . . . . . . . . . . . . . . . . . . . . . . . . . . . . . . . . . . . . . . 223
Tables
1.1: Average years of education for poorest and richest 20% of 17- to 22-year-olds, selected countries,
most recent year . . . . . . . . . . . . . . . . . . . . . . . . . . . . . . . . . . . . . . . . . . . . . . . . . . . . . . . . . . . . . . . . . . . . . . . . . . . . . . . . . . . . . . . . . . . . . . . . . . . . . . . . . . . . . . . . . . . . . . . . . . . . . . . . . . . . . . . . . . . . . . . . . . . . . . . . . . . . . . . . . . . . . . . . . . . . . . . . . . . . . . . . . . . . . . . . . . . . . . . . . . 28
2.1: Pre-primary enrolment and gross enrolment ratios by region, 1999 and 2006 . . . . . . . . . . . . . . . . . . . . . . . . . . . . . . . . . . . . . . . . . . . . . . . . . . . . . . . . . . . . . . . . . . . . . . . . . . . . . . . . 51
2.2: New entrants to grade 1 and gross intake rates by region, 1999 and 2006 . . . . . . . . . . . . . . . . . . . . . . . . . . . . . . . . . . . . . . . . . . . . . . . . . . . . . . . . . . . . . . . . . . . . . . . . . . . . . . . . . . . . . . . . 56
2.3: Primary enrolment by region, 1991, 1999 and 2006 . . . . . . . . . . . . . . . . . . . . . . . . . . . . . . . . . . . . . . . . . . . . . . . . . . . . . . . . . . . . . . . . . . . . . . . . . . . . . . . . . . . . . . . . . . . . . . . . . . . . . . . . . . . . . . . . . . . . . . . . . . . . . . . . . . . . . . . 57
2.4: Estimated number of out-of-school children by region, 1999 and 2006 . . . . . . . . . . . . . . . . . . . . . . . . . . . . . . . . . . . . . . . . . . . . . . . . . . . . . . . . . . . . . . . . . . . . . . . . . . . . . . . . . . . . . . . . . . . . . . 61
2.5: Projections of out-of-school populations in 2015 for countries with more than 500,000 children
out of school in 2006 . . . . . . . . . . . . . . . . . . . . . . . . . . . . . . . . . . . . . . . . . . . . . . . . . . . . . . . . . . . . . . . . . . . . . . . . . . . . . . . . . . . . . . . . . . . . . . . . . . . . . . . . . . . . . . . . . . . . . . . . . . . . . . . . . . . . . . . . . . . . . . . . . . . . . . . . . . . . . . . . . . . . . . . . . . . . . . . . . . . . . . . . . . . . . . . . . 66
2.6: Distribution across wealth quintiles of children not attending primary school . . . . . . . . . . . . . . . . . . . . . . . . . . . . . . . . . . . . . . . . . . . . . . . . . . . . . . . . . . . . . . . . . . . . . . . . . . . . . . . 76
2.7: Rates of transition to, and participation in, secondary education, 1999 and 2006, worldwide and by region . . . . . . . . . . . . . . . . . . . . 85
2.8: Percentage of technical and vocational education and training in secondary education, 1999 and 2006 . . . . . . . . . . . . . . . . . . . . . . . . . . . 85
2.9: Gross enrolment ratios in lower and upper secondary education, 1999 and 2006 . . . . . . . . . . . . . . . . . . . . . . . . . . . . . . . . . . . . . . . . . . . . . . . . . . . . . . . . . . . . . . . . . . . . . . . . . . 86
2.10: Change in tertiary gross enrolment ratios between 1999 and 2006 . . . . . . . . . . . . . . . . . . . . . . . . . . . . . . . . . . . . . . . . . . . . . . . . . . . . . . . . . . . . . . . . . . . . . . . . . . . . . . . . . . . . . . . . . . . . . . . . . . . . . . 90
2.11: Estimated number of adult illiterates (age 15+) in 1985–1994 and 2000–2006, with projections to 2015,
by region . . . . . . . . . . . . . . . . . . . . . . . . . . . . . . . . . . . . . . . . . . . . . . . . . . . . . . . . . . . . . . . . . . . . . . . . . . . . . . . . . . . . . . . . . . . . . . . . . . . . . . . . . . . . . . . . . . . . . . . . . . . . . . . . . . . . . . . . . . . . . . . . . . . . . . . . . . . . . . . . . . . . . . . . . . . . . . . . . . . . . . . . . . . . . . . . . . . . . . . . . . . . . . . . . . . . . . . . . . 93
2.12: Estimated adult literacy rates (age 15+) in 1985–1994 and 2000–2006, with projections to 2015, by region . . . . . . . . . . . . . . . . . . . . . . . . 95
2.13: Distribution of countries according to their distance from the gender parity goal in primary, secondary
and tertiary education, 2006 . . . . . . . . . . . . . . . . . . . . . . . . . . . . . . . . . . . . . . . . . . . . . . . . . . . . . . . . . . . . . . . . . . . . . . . . . . . . . . . . . . . . . . . . . . . . . . . . . . . . . . . . . . . . . . . . . . . . . . . . . . . . . . . . . . . . . . . . . . . . . . . . . . . . . . . . . . . . . . . . . . . . . . . . . . . . . . . . . . 98
2.14: Gender disparities in survival rates to last grade, 1999 and 2005 . . . . . . . . . . . . . . . . . . . . . . . . . . . . . . . . . . . . . . . . . . . . . . . . . . . . . . . . . . . . . . . . . . . . . . . . . . . . . . . . . . . . . . . . . . . . . . . . . . . . . . . . . 100
2.15: Percentage of Indian students in standards 3, 4 and 5 who successfully demonstrated basic skills . . . . . . . . . . . . . . . . . . . . . . . . . . . . . . . . . . . . . 109
2.16: Achievement among grade 4 students in Egypt, by cognitive level and content domain, 2006 . . . . . . . . . . . . . . . . . . . . . . . . . . . . . . . . . . . . . . . . . . . . . . . 110
V I I I

C O N T E N T S
2.17: Percentage of students in grade 10 in well-equipped schools, by parental socio-occupational status . . . . . . . . . . . . . . . . . . . . . . . . . . . . . . . . . 116
2.18: Teaching staff and pupil/teacher ratios in primary and secondary education, by region, 1999 and 2006 . . . . . . . . . . . . . . . . . . . . . . . . . . . 118
2.19: Distribution of countries by EDI scores and region, 2006 . . . . . . . . . . . . . . . . . . . . . . . . . . . . . . . . . . . . . . . . . . . . . . . . . . . . . . . . . . . . . . . . . . . . . . . . . . . . . . . . . . . . . . . . . . . . . . . . . . . . . . . . . . . . . . . . . . . . . . . . . . 123
3.1: Total public expenditure on education as a percentage of GNP, by region and income group, 2006 . . . . . . . . . . . . . . . . . . . . . . . . . . . . . . . . . . . . . 133
3.2: Total public expenditure on education as a percentage of total government expenditure,
by region and income group, 2006 . . . . . . . . . . . . . . . . . . . . . . . . . . . . . . . . . . . . . . . . . . . . . . . . . . . . . . . . . . . . . . . . . . . . . . . . . . . . . . . . . . . . . . . . . . . . . . . . . . . . . . . . . . . . . . . . . . . . . . . . . . . . . . . . . . . . . . . . . . . . . . . . . . . . . . . . . . . . . . . . . . . . . . . 134
3.3: Poverty and public education expenditure in Indonesia, 2004 . . . . . . . . . . . . . . . . . . . . . . . . . . . . . . . . . . . . . . . . . . . . . . . . . . . . . . . . . . . . . . . . . . . . . . . . . . . . . . . . . . . . . . . . . . . . . . . . . . . . . . . . . . . . . . . . 142
3.4: Ethnicity and public education expenditure in the former Yugoslav Republic of Macedonia, 2005 . . . . . . . . . . . . . . . . . . . . . . . . . . . . . . . . . . . . . . . . 143
3.5: Free textbooks distributed by governments in selected Central American countries,
percentage per income quintile, 2000–2004 . . . . . . . . . . . . . . . . . . . . . . . . . . . . . . . . . . . . . . . . . . . . . . . . . . . . . . . . . . . . . . . . . . . . . . . . . . . . . . . . . . . . . . . . . . . . . . . . . . . . . . . . . . . . . . . . . . . . . . . . . . . . . . . . . . . . . . . . . . . . . . . . . . . . 143
3.6: Inequality in per-student education expenditure in China following decentralization . . . . . . . . . . . . . . . . . . . . . . . . . . . . . . . . . . . . . . . . . . . . . . . . . . . . . . . . . . . . . . . . . 147
3.7: Ethiopia’s Southern Nations, Nationalities and Peoples Region: woreda-level spending
on education before and after decentralization . . . . . . . . . . . . . . . . . . . . . . . . . . . . . . . . . . . . . . . . . . . . . . . . . . . . . . . . . . . . . . . . . . . . . . . . . . . . . . . . . . . . . . . . . . . . . . . . . . . . . . . . . . . . . . . . . . . . . . . . . . . . . . . . . . . . . . . . . . . . 150
3.8: Functions transferred to schools in three Latin American programmes . . . . . . . . . . . . . . . . . . . . . . . . . . . . . . . . . . . . . . . . . . . . . . . . . . . . . . . . . . . . . . . . . . . . . . . . . . . . . . . . . . . . . . . . . . . . . 154
3.9: Responsibilities of the public and private sectors in provision and financing of education service delivery . . . . . . . . . . . . . . . . . . . . 159
3.10: Strategies to address education inequity in eighteen PRSPs . . . . . . . . . . . . . . . . . . . . . . . . . . . . . . . . . . . . . . . . . . . . . . . . . . . . . . . . . . . . . . . . . . . . . . . . . . . . . . . . . . . . . . . . . . . . . . . . . . . . . . . . . . . . . . . . . . . 200
4.1: Share of education and basic education in aid commitments, 2000–2006 . . . . . . . . . . . . . . . . . . . . . . . . . . . . . . . . . . . . . . . . . . . . . . . . . . . . . . . . . . . . . . . . . . . . . . . . . . . . . . . . . . . . . . . . . 209
4.2: Governance components of recent education projects and programmes supported by the World Bank . . . . . . . . . . . . . . . . . . . . . . . . . . . . . . 231
Text boxes
2.1: Malnutrition compromises India’s progress in primary school enrolment . . . . . . . . . . . . . . . . . . . . . . . . . . . . . . . . . . . . . . . . . . . . . . . . . . . . . . . . . . . . . . . . . . . . . . . . . . . . . . . . . . . . . . . . . 48
2.2: Country evidence: health and nutrition interventions can enhance cognitive development . . . . . . . . . . . . . . . . . . . . . . . . . . . . . . . . . . . . . . . . . . . . . . . . . . . . . 49
2.3: Pre-school benefits for equity and efficiency . . . . . . . . . . . . . . . . . . . . . . . . . . . . . . . . . . . . . . . . . . . . . . . . . . . . . . . . . . . . . . . . . . . . . . . . . . . . . . . . . . . . . . . . . . . . . . . . . . . . . . . . . . . . . . . . . . . . . . . . . . . . . . . . . . . . . . . . . . . . . . . . . 50
2.4: In Egypt, national progress but the poor are being left behind . . . . . . . . . . . . . . . . . . . . . . . . . . . . . . . . . . . . . . . . . . . . . . . . . . . . . . . . . . . . . . . . . . . . . . . . . . . . . . . . . . . . . . . . . . . . . . . . . . . . . . . . . . . . . . 53
2.5: The equity gap in early childhood provision in the United States . . . . . . . . . . . . . . . . . . . . . . . . . . . . . . . . . . . . . . . . . . . . . . . . . . . . . . . . . . . . . . . . . . . . . . . . . . . . . . . . . . . . . . . . . . . . . . . . . . . . . . . . . 55
2.6: Ethiopia — moving into the UPE fast lane . . . . . . . . . . . . . . . . . . . . . . . . . . . . . . . . . . . . . . . . . . . . . . . . . . . . . . . . . . . . . . . . . . . . . . . . . . . . . . . . . . . . . . . . . . . . . . . . . . . . . . . . . . . . . . . . . . . . . . . . . . . . . . . . . . . . . . . . . . . . . . . . . . . . . . . . . . 58
2.7: Nepal — also on fast-forward towards UPE . . . . . . . . . . . . . . . . . . . . . . . . . . . . . . . . . . . . . . . . . . . . . . . . . . . . . . . . . . . . . . . . . . . . . . . . . . . . . . . . . . . . . . . . . . . . . . . . . . . . . . . . . . . . . . . . . . . . . . . . . . . . . . . . . . . . . . . . . . . . . . . . . . . . . . . . 59
2.8: Nigeria off track — the price of weak governance . . . . . . . . . . . . . . . . . . . . . . . . . . . . . . . . . . . . . . . . . . . . . . . . . . . . . . . . . . . . . . . . . . . . . . . . . . . . . . . . . . . . . . . . . . . . . . . . . . . . . . . . . . . . . . . . . . . . . . . . . . . . . . . . . . . . . . . . . 62
2.9: United Republic of Tanzania — remarkable progress . . . . . . . . . . . . . . . . . . . . . . . . . . . . . . . . . . . . . . . . . . . . . . . . . . . . . . . . . . . . . . . . . . . . . . . . . . . . . . . . . . . . . . . . . . . . . . . . . . . . . . . . . . . . . . . . . . . . . . . . . . . . . . . . . . . . 63
2.10: Rebuilding statistical capacity in the Democratic Republic of the Congo . . . . . . . . . . . . . . . . . . . . . . . . . . . . . . . . . . . . . . . . . . . . . . . . . . . . . . . . . . . . . . . . . . . . . . . . . . . . . . . . . . . . . . . . . . 64
2.11: Achieving UPE — lessons from strong performers . . . . . . . . . . . . . . . . . . . . . . . . . . . . . . . . . . . . . . . . . . . . . . . . . . . . . . . . . . . . . . . . . . . . . . . . . . . . . . . . . . . . . . . . . . . . . . . . . . . . . . . . . . . . . . . . . . . . . . . . . . . . . . . . . . . . . . . . . 77
2.12: Uganda’s good example of integrating disabled students . . . . . . . . . . . . . . . . . . . . . . . . . . . . . . . . . . . . . . . . . . . . . . . . . . . . . . . . . . . . . . . . . . . . . . . . . . . . . . . . . . . . . . . . . . . . . . . . . . . . . . . . . . . . . . . . . . . . . . . . . 83
2.13: Bangladesh’s triumph: achieving gender parity by 2005 . . . . . . . . . . . . . . . . . . . . . . . . . . . . . . . . . . . . . . . . . . . . . . . . . . . . . . . . . . . . . . . . . . . . . . . . . . . . . . . . . . . . . . . . . . . . . . . . . . . . . . . . . . . . . . . . . . . . . . . . . . . . 103
2.14: How to measure quality in education? . . . . . . . . . . . . . . . . . . . . . . . . . . . . . . . . . . . . . . . . . . . . . . . . . . . . . . . . . . . . . . . . . . . . . . . . . . . . . . . . . . . . . . . . . . . . . . . . . . . . . . . . . . . . . . . . . . . . . . . . . . . . . . . . . . . . . . . . . . . . . . . . . . . . . . . . . . . . . . . 108
2.15: New international evidence on learning outcomes: what it reveals about quality . . . . . . . . . . . . . . . . . . . . . . . . . . . . . . . . . . . . . . . . . . . . . . . . . . . . . . . . . . . . . . . . . . . . . . . . . 111
2.16: Unequal learning time, unequal outcomes . . . . . . . . . . . . . . . . . . . . . . . . . . . . . . . . . . . . . . . . . . . . . . . . . . . . . . . . . . . . . . . . . . . . . . . . . . . . . . . . . . . . . . . . . . . . . . . . . . . . . . . . . . . . . . . . . . . . . . . . . . . . . . . . . . . . . . . . . . . . . . . . . . . . . . . 115
2.17: How many teachers are needed to achieve EFA? . . . . . . . . . . . . . . . . . . . . . . . . . . . . . . . . . . . . . . . . . . . . . . . . . . . . . . . . . . . . . . . . . . . . . . . . . . . . . . . . . . . . . . . . . . . . . . . . . . . . . . . . . . . . . . . . . . . . . . . . . . . . . . . . . . . . . . . . . . . 118
I X

90
02
Education f
or A
ll G
lobal M
onitorin
g R
eport
C O N T E N T S
3.1: Tracking public expenditure in Bangladesh . . . . . . . . . . . . . . . . . . . . . . . . . . . . . . . . . . . . . . . . . . . . . . . . . . . . . . . . . . . . . . . . . . . . . . . . . . . . . . . . . . . . . . . . . . . . . . . . . . . . . . . . . . . . . . . . . . . . . . . . . . . . . . . . . . . . . . . . . . . . . . . . . . . . . . 140
3.2: Public expenditure tracking, information campaigns and the fight against corruption in Uganda . . . . . . . . . . . . . . . . . . . . . . . . . . . . . . . . . . . . . . . . . 141
3.3: Supporting school fee abolition: school grants in Ghana . . . . . . . . . . . . . . . . . . . . . . . . . . . . . . . . . . . . . . . . . . . . . . . . . . . . . . . . . . . . . . . . . . . . . . . . . . . . . . . . . . . . . . . . . . . . . . . . . . . . . . . . . . . . . . . . . . . . . . . . . . 144
3.4: Fiscal decentralization in Nigeria — reinforcing regional disparities . . . . . . . . . . . . . . . . . . . . . . . . . . . . . . . . . . . . . . . . . . . . . . . . . . . . . . . . . . . . . . . . . . . . . . . . . . . . . . . . . . . . . . . . . . . . . . . . . . . . 149
3.5: Financial decentralization with equity in Ethiopia . . . . . . . . . . . . . . . . . . . . . . . . . . . . . . . . . . . . . . . . . . . . . . . . . . . . . . . . . . . . . . . . . . . . . . . . . . . . . . . . . . . . . . . . . . . . . . . . . . . . . . . . . . . . . . . . . . . . . . . . . . . . . . . . . . . . . . . . 150
3.6: Planning for strengthened school autonomy in Mexico . . . . . . . . . . . . . . . . . . . . . . . . . . . . . . . . . . . . . . . . . . . . . . . . . . . . . . . . . . . . . . . . . . . . . . . . . . . . . . . . . . . . . . . . . . . . . . . . . . . . . . . . . . . . . . . . . . . . . . . . . . . . . . 156
3.7: Community involvement in Uttar Pradesh . . . . . . . . . . . . . . . . . . . . . . . . . . . . . . . . . . . . . . . . . . . . . . . . . . . . . . . . . . . . . . . . . . . . . . . . . . . . . . . . . . . . . . . . . . . . . . . . . . . . . . . . . . . . . . . . . . . . . . . . . . . . . . . . . . . . . . . . . . . . . . . . . . . . . . . . . 158
3.8: Chile’s experience with choice and competition: no advertisement for the governance reform blueprint . . . . . . . . . . . . . . . . . . . . . . . . . 162
3.9: Swedish lessons in competition: not readily exportable . . . . . . . . . . . . . . . . . . . . . . . . . . . . . . . . . . . . . . . . . . . . . . . . . . . . . . . . . . . . . . . . . . . . . . . . . . . . . . . . . . . . . . . . . . . . . . . . . . . . . . . . . . . . . . . . . . . . . . . . . . . . 163
3.10: Why poor households choose low-fee schools in an Indian district . . . . . . . . . . . . . . . . . . . . . . . . . . . . . . . . . . . . . . . . . . . . . . . . . . . . . . . . . . . . . . . . . . . . . . . . . . . . . . . . . . . . . . . . . . . . . . . . . . . . . . 165
3.11: Government schools for the rich, private schools for the poor in Kenya’s slums . . . . . . . . . . . . . . . . . . . . . . . . . . . . . . . . . . . . . . . . . . . . . . . . . . . . . . . . . . . . . . . . . . . . . . . . . . . 167
3.12: In Pakistan, a questionable public-private partnership . . . . . . . . . . . . . . . . . . . . . . . . . . . . . . . . . . . . . . . . . . . . . . . . . . . . . . . . . . . . . . . . . . . . . . . . . . . . . . . . . . . . . . . . . . . . . . . . . . . . . . . . . . . . . . . . . . . . . . . . . . . . . . 169
3.13: Weighing the costs of lower teacher wages in Togo . . . . . . . . . . . . . . . . . . . . . . . . . . . . . . . . . . . . . . . . . . . . . . . . . . . . . . . . . . . . . . . . . . . . . . . . . . . . . . . . . . . . . . . . . . . . . . . . . . . . . . . . . . . . . . . . . . . . . . . . . . . . . . . . . . . . . 173
3.14: ‘Marginal and frustrated’: a contract teacher’s view from Cameroon . . . . . . . . . . . . . . . . . . . . . . . . . . . . . . . . . . . . . . . . . . . . . . . . . . . . . . . . . . . . . . . . . . . . . . . . . . . . . . . . . . . . . . . . . . . . . . . . . . . 174
3.15: Contract teaching in India: reaching the underserved . . . . . . . . . . . . . . . . . . . . . . . . . . . . . . . . . . . . . . . . . . . . . . . . . . . . . . . . . . . . . . . . . . . . . . . . . . . . . . . . . . . . . . . . . . . . . . . . . . . . . . . . . . . . . . . . . . . . . . . . . . . . . . . . 174
3.16: Recruiting ethnic minority teachers in the Lao People’s Democratic Republic and Cambodia . . . . . . . . . . . . . . . . . . . . . . . . . . . . . . . . . . . . . . . . . . . . . . . . . . 176
3.17: Teacher deployment in a fragile state: the experience of Afghanistan . . . . . . . . . . . . . . . . . . . . . . . . . . . . . . . . . . . . . . . . . . . . . . . . . . . . . . . . . . . . . . . . . . . . . . . . . . . . . . . . . . . . . . . . . . . . . . . . 177
3.18: Problems in Mongolia’s teacher bonus system . . . . . . . . . . . . . . . . . . . . . . . . . . . . . . . . . . . . . . . . . . . . . . . . . . . . . . . . . . . . . . . . . . . . . . . . . . . . . . . . . . . . . . . . . . . . . . . . . . . . . . . . . . . . . . . . . . . . . . . . . . . . . . . . . . . . . . . . . . . . . . . 178
3.19: Incentives to reduce absenteeism in India: a randomized experiment . . . . . . . . . . . . . . . . . . . . . . . . . . . . . . . . . . . . . . . . . . . . . . . . . . . . . . . . . . . . . . . . . . . . . . . . . . . . . . . . . . . . . . . . . . . . . . . . 179
3.20: No Child Left Behind in the United States: the jury is still out . . . . . . . . . . . . . . . . . . . . . . . . . . . . . . . . . . . . . . . . . . . . . . . . . . . . . . . . . . . . . . . . . . . . . . . . . . . . . . . . . . . . . . . . . . . . . . . . . . . . . . . . . . . . . . . . 181
3.21: Assessments inform teacher support in Uruguay’s schools . . . . . . . . . . . . . . . . . . . . . . . . . . . . . . . . . . . . . . . . . . . . . . . . . . . . . . . . . . . . . . . . . . . . . . . . . . . . . . . . . . . . . . . . . . . . . . . . . . . . . . . . . . . . . . . . . . . . . . 183
3.22: Reforming school supervision in Uganda . . . . . . . . . . . . . . . . . . . . . . . . . . . . . . . . . . . . . . . . . . . . . . . . . . . . . . . . . . . . . . . . . . . . . . . . . . . . . . . . . . . . . . . . . . . . . . . . . . . . . . . . . . . . . . . . . . . . . . . . . . . . . . . . . . . . . . . . . . . . . . . . . . . . . . . . . . 184
3.23: Strengthening equity through sector-wide approaches: Sri Lanka’s experience . . . . . . . . . . . . . . . . . . . . . . . . . . . . . . . . . . . . . . . . . . . . . . . . . . . . . . . . . . . . . . . . . . . . . . . . . . . . . 186
3.24: Building capacity for pro-poor reform in the United Republic of Tanzania . . . . . . . . . . . . . . . . . . . . . . . . . . . . . . . . . . . . . . . . . . . . . . . . . . . . . . . . . . . . . . . . . . . . . . . . . . . . . . . . . . . . . . . . 187
3.25: Decentralization in Nepal: a difficult journey . . . . . . . . . . . . . . . . . . . . . . . . . . . . . . . . . . . . . . . . . . . . . . . . . . . . . . . . . . . . . . . . . . . . . . . . . . . . . . . . . . . . . . . . . . . . . . . . . . . . . . . . . . . . . . . . . . . . . . . . . . . . . . . . . . . . . . . . . . . . . . . . . . 190
3.26: Intersectoral planning on HIV/AIDS and education in Cambodia . . . . . . . . . . . . . . . . . . . . . . . . . . . . . . . . . . . . . . . . . . . . . . . . . . . . . . . . . . . . . . . . . . . . . . . . . . . . . . . . . . . . . . . . . . . . . . . . . . . . . . . . . . . . . 192
3.27: Getting pastoralist concerns onto the PRSP agenda in Kenya . . . . . . . . . . . . . . . . . . . . . . . . . . . . . . . . . . . . . . . . . . . . . . . . . . . . . . . . . . . . . . . . . . . . . . . . . . . . . . . . . . . . . . . . . . . . . . . . . . . . . . . . . . . . . . . . . 193
3.28: New York City is learning lessons from Mexico’s Oportunidades programme . . . . . . . . . . . . . . . . . . . . . . . . . . . . . . . . . . . . . . . . . . . . . . . . . . . . . . . . . . . . . . . . . . . . . . . . . . . . . . . . . . . 196
3.29: Social protection in Pakistan’s poverty reduction strategy: the effects of fragmentation . . . . . . . . . . . . . . . . . . . . . . . . . . . . . . . . . . . . . . . . . . . . . . . . . . . . . . . . . 197
4.1: Aid supports the abolition of school fees in Kenya . . . . . . . . . . . . . . . . . . . . . . . . . . . . . . . . . . . . . . . . . . . . . . . . . . . . . . . . . . . . . . . . . . . . . . . . . . . . . . . . . . . . . . . . . . . . . . . . . . . . . . . . . . . . . . . . . . . . . . . . . . . . . . . . . . . . . . 206
4.2: Assessing the amount of total aid to the education sector . . . . . . . . . . . . . . . . . . . . . . . . . . . . . . . . . . . . . . . . . . . . . . . . . . . . . . . . . . . . . . . . . . . . . . . . . . . . . . . . . . . . . . . . . . . . . . . . . . . . . . . . . . . . . . . . . . . . . . 209
4.3: France and Germany focus on aid to post-secondary education . . . . . . . . . . . . . . . . . . . . . . . . . . . . . . . . . . . . . . . . . . . . . . . . . . . . . . . . . . . . . . . . . . . . . . . . . . . . . . . . . . . . . . . . . . . . . . . . . . . . . . . . . . . . 218
4.4: Aid effectiveness — falling short of the 2010 targets . . . . . . . . . . . . . . . . . . . . . . . . . . . . . . . . . . . . . . . . . . . . . . . . . . . . . . . . . . . . . . . . . . . . . . . . . . . . . . . . . . . . . . . . . . . . . . . . . . . . . . . . . . . . . . . . . . . . . . . . . . . . . . . . . . . 221
4.5: India’s education aid: standing firm in negotiations . . . . . . . . . . . . . . . . . . . . . . . . . . . . . . . . . . . . . . . . . . . . . . . . . . . . . . . . . . . . . . . . . . . . . . . . . . . . . . . . . . . . . . . . . . . . . . . . . . . . . . . . . . . . . . . . . . . . . . . . . . . . . . . . . . . . 224
4.6: Fragile states and the new aid agenda . . . . . . . . . . . . . . . . . . . . . . . . . . . . . . . . . . . . . . . . . . . . . . . . . . . . . . . . . . . . . . . . . . . . . . . . . . . . . . . . . . . . . . . . . . . . . . . . . . . . . . . . . . . . . . . . . . . . . . . . . . . . . . . . . . . . . . . . . . . . . . . . . . . . . . . . . . . . . . . 227
Map
3.1: Net attendance rates and education spending per primary school-age child, Nigeria, most recent year . . . . . . . . . . . . . . . . . . . . . . . . . . . . 149
X

H I G H L I G H T S O F T H E E FA R E P O R T 2 0 0 9
Progress on the six EFA goals
Goal 1 — Early childhood care and education
Child malnutrition is a global epidemic that affects
one in three children under the age of 5 and
undermines their ability to learn. Slow progress
in tackling child malnutrition and ill health –
especially in sub-Saharan Africa and South Asia –
is undermining progress towards universal primary
education.
Progress indicators for the well-being of children
in their pre-school years are a source for concern.
The development targets set in the Millennium
Development Goals for child mortality and nutrition
will be missed by wide margins if current trends
continue.
Major global disparities in provision continue to divide
the world’s richest and poorest children. In 2006,
pre-primary gross enrolment ratios averaged 79% in
developed countries and 36% in developing countries,
falling as low as 14% in sub-Saharan Africa.
Global disparities are mirrored in wide gaps within
countries, especially between the richest and poorest
children. In some countries, children from the
wealthiest 20% of households are five times more
likely to attend pre-school programmes than those
from the poorest 20%.
Goal 2 — Universal primary education
The average net enrolment ratios for developing
countries have continued to increase since Dakar.
Sub-Saharan Africa raised its average net enrolment
ratio from 54% to 70% between 1999 and 2006, for
an annual increase six times greater than during the
decade before Dakar. The increase in South and West
Asia was also impressive, rising from 75% to 86%.
In 2006, some 75 million children, 55% girls, were
not in school, almost half in sub-Saharan Africa. On
current trends, millions of children will still be out of
school in 2015 – the target date for universal primary
education. Projections for 134 countries accounting
for some two-thirds of out-of-school children in 2006
suggest that some 29 million children will be out
of school in 2015 in these countries alone.
1
Highlights of theEFA Report 2009
Headline messages
There has been remarkable progress towards some
of the EFA goals since the international community
made its commitments in Dakar in 2000. Some of
the world’s poorest countries have demonstrated
that political leadership and practical policies make
a difference. However, business as usual will leave
the world short of the Dakar goals. Far more has
to be done to get children into school, through
primary education and beyond. And more attention
has to be paid to the quality of education and
learning achievement.
Progress towards the EFA goals is being undermined
by a failure of governments to tackle persistent
inequalities based on income, gender, location,
ethnicity, language, disability and other markers
for disadvantage. Unless governments act to reduce
disparities through effective policy reforms, the EFA
promise will be broken.
Good governance could help to strengthen
accountability, enhance participation and break
down inequalities in education. However, current
approaches to governance reform are failing to
attach sufficient weight to equity.

90
02
Education f
or A
ll G
lobal M
onitorin
g R
eport
H I G H L I G H T S O F T H E E FA R E P O R T 2 0 0 9
Children from poor households, rural areas, slums
and other disadvantaged groups face major obstacles
in access to a good quality education. While children
from the wealthiest 20% of households have already
achieved universal primary school attendance in most
countries, those from the poorest 20% have a long
way to go.
Trends in primary education are susceptible to public
policy. Ethiopia and the United Republic of Tanzania
are making remarkable progress in increasing
enrolment and reaching the poor, thanks to policies
such as the abolition of school fees, the construction
of schools in underserved areas and increased
teacher recruitment. In Nigeria and Pakistan,
poor education governance is holding back progress
and keeping millions of children out of school.
In 2006, some 513 million students worldwide –
or 58% of the relevant school-age population –
were enrolled in secondary school, an increase of
nearly 76 million since 1999. Despite progress, access
remains limited for most of the world’s young people.
In sub-Saharan Africa, 75% of secondary-school-age
children are not enrolled in secondary school.
Goal 3 — Meeting the lifelong learning needs of youth and adults
Governments are not giving priority to youth and
adult learning needs in their education policies.
Meeting the lifelong needs of youth and adults needs
stronger political commitment and more public
funding. It will also require more clearly defined
concepts and better data for effective monitoring.
Goal 4 — Adult literacy
An estimated 776 million adults – or 16% of the
world’s adult population – lack basic literacy skills.
About two-thirds are women. Most countries have
made little progress in recent years. If current trends
continue, there will be over 700 million adults lacking
literacy skills in 2015.
Between 1985–1994 and 2000–2006, the global
adult literacy rate increased from 76% to 84%.
However, forty-five countries have adult literacy rates
below the developing country average of 79%, mostly
in sub-Saharan Africa, and South and West Asia.
Nearly all of them are off track to meet the adult
literacy target by 2015. Nineteen of these countries
have literacy rates of less than 55%.
Major disparities in literacy levels within countries
are often linked with poverty and other forms of
disadvantage. In seven sub-Saharan African countries
with low overall adult literacy rates, the literacy gap
between the poorest and wealthiest households
is more than forty percentage points.
Goal 5 — Gender
In 2006, of the 176 countries with data, 59 had
achieved gender parity in both primary and secondary
education – 20 countries more than in 1999. At the
primary level, about two-thirds of countries had
achieved parity. However, more than half the
countries in sub-Saharan Africa, South and West Asia
and the Arab States had not reached the target.
Only 37% of countries worldwide had achieved gender
parity at secondary level.
There is a confirmed trend towards more female
than male enrolments in tertiary education worldwide,
in particular in more developed regions and in the
Caribbean and Pacific.
Poverty and other forms of social disadvantage
magnify gender disparities. For example, in Mali
girls from poor households are four times less likely
to attend primary school than those from rich
households, rising to eight times at secondary level.
Once girls are in school, their progress is often
hampered by teacher attitudes and gender-biased
textbooks that reinforce negative gender stereotypes.
These school-based factors interact with wider social
and economic factors that influence school
performance along gender lines.
Goal 6 — Quality
International assessments highlight large
achievement gaps between students in rich and
poor countries. Within countries too, inequality
exists between regions, communities, schools
and classrooms. These disparities have important
implications not just in education but for the wider
distribution of opportunities in society.
In developing countries there are substantially
higher proportions of low learning achievement.
In a recent Southern and Eastern Africa Consortium
for Monitoring Educational Quality assessment
(SACMEC II) in sub-Saharan Africa, fewer than 25%
of grade 6 pupils reached a desirable level of reading
in four countries and only 10% in six others.
2

H I G H L I G H T S O F T H E E FA R E P O R T 2 0 0 9
Student background, the organization of the education
system and the school environment explain learning
disparities within each country. Many essential
resources taken for granted in developed countries
remain scarce in developing countries – including
basic infrastructure such as electricity, seats and
textbooks.
More than 27 million teachers work in the world’s
primary schools, 80% of them in developing countries.
Total primary school staff increased by 5% between
1999 and 2006. In sub-Saharan Africa alone,
1.6 million new teacher posts must be created
and teachers recruited by 2015 to achieve UPE, rising
to 3.8 million if retirement, resignations and losses
(due to HIV/AIDs, for example) are taken into account.
There are large national and regional disparities in
pupil/teacher ratios, with marked teacher shortages
in South and West Asia, and sub-Saharan Africa. But
it is within countries that the greatest disparities exist,
with teachers unevenly distributed across regions.
Financing education
National finance
In the majority of countries with data, national
spending on education has increased since Dakar.
In some countries, increased spending has been
associated with substantial progress on the EFA
goals. However, the share of national income devoted
to education decreased in 40 of the 105 countries
with data between 1999 and 2006.
Low-income countries are still spending significantly
less on education than are other countries. In sub-
Saharan Africa, eleven out of the twenty-one low-
income countries with data spend less than 4% of
their GNP. In South Asia, several high-population
countries continue to spend under or only just over
3% of their GNP on education. This appears to reflect
low political commitment to education.
Global wealth inequalities are mirrored by inequalities
in education spending. In 2004, North America and
Western Europe alone accounted for 55% of the
world’s spending on education but only 10% of the
population aged 5 to 25. Sub-Saharan Africa accounts
for 15% of 5- to 25–year-olds but just 2% of global
spending. South and West Asia represents over one-
quarter of the population and just 7% of spending.
International aid
Commitments to basic education are stagnating.
In 2006, for developing countries, they amounted
to US$5.1 billion, a little below the 2004 level.
Half of all commitments to basic education came
from just a handful of donors.
Total aid for basic education for low-income countries
in 2006 was US$3.8 billion. The amount will have
to be tripled to reach the estimated US$11 billion
required annually to finance a narrow range of goals
in low-income countries.
The Fast Track Initiative (FTI) is failing to galvanize
additional bilateral donor support for EFA. Current
commitments to its Catalytic Fund fall short of those
required to meet financing requests in the pipeline.
By 2010, countries with plans approved by the FTI
could be facing a financing shortfall of US$2.2 billion.
An ambitious new agenda governing aid hopes
to make aid more efficient and effective. To date
progress is mixed: though some donors are willing
to encourage national ownership, work through
national systems and cooperate with other donors,
others are more reticent.
Top policy recommendations
Meeting the EFA goals
Early childhood care and education
Strengthen the links between education planning
and child health provision, using cash transfer
programmes, targeted health interventions and
more equitable public spending in health sectors.
Prioritize early childhood education and carein planning for all children, with incentives provided
to include those who are vulnerable and
disadvantaged.
Strengthen wider anti-poverty commitmentsby tackling child malnutrition and improving public
health systems, using innovative social welfare
programmes which target poor households.
3

90
02
Education f
or A
ll G
lobal M
onitorin
g R
eport
H I G H L I G H T S O F T H E E FA R E P O R T 2 0 0 9
Universal primary education
Fix ambitious long-term goals supported by realistic
planning and sufficient medium- to long-term
budgetary allocations to ensure progress in access,
participation and completion in primary education.
Support equity for girls, disadvantaged groups
and underserved regions by setting clear targets
for reducing disparities, backed by practical strategies
for achieving more equitable outcomes.
Raise quality while expanding access by focusing
on smooth progression though school and better
learning outcomes, increasing textbook supply and
quality, strengthening teacher training and support,
and ensuring that class sizes are conducive to
learning.
Education quality
Strengthen policy commitments to quality education
and create effective learning environments for all
students, including adequate facilities, well-trained
teachers, relevant curricula and clearly identified
learning outcomes. A focus on teachers and learning
should be at the heart of this commitment.
Ensure that all children attending primary school for
at least four to five years acquire the basic literacyand numeracy skills that they need to develop their
potential.
Develop the capacity to measure, monitor and assesseducation quality, in areas that affect learning
conditions (infrastructure, textbooks, class sizes),
processes (language, instructional time) and
outcomes.
Revise existing policies and regulations to ensure that
children have sufficient instructional time and that all
schools minimize the gap between intended and
actual instructional time.
Participate in comparative regional and international
learning assessments and translate lessons learned
into national policy, and develop national assessments
that best reflect each country’s particular needs
and goals.
Overcoming inequality — lessons for national governance reforms
Commit to the reduction of disparities based on
wealth, location, ethnicity, gender and other indicators
for disadvantage. Governments should develop well-
defined targets for reducing disparities and monitor
progress towards their achievement.
Sustain political leadership to reach education
targets and tackle inequality through clear policy
objectives and improved coordination within
government through active engagement with civil
society, the private sector and marginalized groups.
Strengthen policies for reducing poverty and deep
social inequalities that hinder progress towards
education for all. Governments should integrate
education planning into wider poverty-reduction
strategies.
Raise quality standards in education and work to
ensure that disparities in learning achievement
between regions, communities and schools are
reduced.
Increase national education spending, especially
in developing countries that chronically underinvest
in education.
Put equity at the centre of financing strategies,
in order to reach disadvantaged children, with more
accurate estimates of the costs of reducing disparities
and the development of incentives for reaching the
most marginalized.
Ensure that decentralization has an inbuilt
commitment to equity through financing formulas
that link resources to levels of poverty and deprivation
in education.
Recognize that school competition and choice,and private-public partnerships have their limits.
If a public education system works poorly, the priority
must be to fix it.
Strengthen the recruitment, deployment andmotivation of teachers to ensure that there are
enough qualified teachers in all regions and schools,
especially in remote and underserved communities.
4
H I G H L I G H T S O F T H E E FA R E P O R T 2 0 0 9
Aid donors — delivering on commitments
Increase aid for basic education, especially
to low-income countries, by providing around
US$7 billion to cover current financing gaps
in priority EFA areas.
Enlarge the group of donor countries committed to
providing aid to basic education, in order to ensure
that the financial support for the EFA goals is
sustainable.
Commit to equity in aid for education by providing
more funds to basic education in low-income
countries. Several donors – including France and
Germany – should urgently review their current aid
allocations.
Get behind the Fast Track Initiative and close the
projected financing gap – estimated at US$2.2 billion
for 2010 – for countries with approved plans.
Improve aid effectiveness and reduce transaction
costs, as set out in the Paris Declaration, through
greater alignment of aid behind national priorities,
better coordination, increased use of national
financial management systems and greater
predictability in aid flows.
5

90
02
Education f
or A
ll G
lobal M
onitorin
g R
eport
OV E R V I E W
Eight years have passed since representatives
of more than 160 governments gathered at
the World Education Forum in Dakar, Senegal,
to adopt an ambitious Framework for Action
aimed at expanding learning opportunities
for children, youth and adults. At the heart of the
Framework is a pledge to achieve six Education for All
(EFA) goals. The Dakar promise extends from early
childhood care and education (ECCE) and universal
primary education (UPE) to gender equality, the spread
of adult literacy, the expansion of skills programmes
for youth and adults, and improvements in the quality
of education. Underpinning the Framework is a
commitment to inclusive and equitable education
provision and opportunity for all the world’s citizens.
This edition of the EFA Global Monitoring Report comes
at a critical moment. With the 2015 deadline for some
key goals just over the horizon, there are worrying signs
of a large-scale shortfall. Remarkable gains have been
registered in many of the world’s poorest countries,1
but the distance remaining is great. Governments and
aid donors have to act with a renewed sense of urgency
and shared commitment to deliver on the pledges they
made in 2000. These promises cannot wait and time
is running out.
The Report, titled Overcoming Inequality: Why
Governance Matters, identifies deep and persistent
disparities based on income, gender, location, ethnicity
and other markers for disadvantage as a major barrier
to progress in education. Inequity in education is linked
to wider disparities in the distribution of power, wealth
and opportunity. And it is perpetuated by policies that
either tolerate or actively exacerbate an unfair
distribution of life chances – policies that fuel the
transmission of poverty across generations.
Inequalities in education of the magnitude observed in
many countries are unacceptable. The circumstances
into which children are born, their gender, the wealth
of their parents, their language and the colour of their
skin should not define their educational opportunities.
Apart from being inequitable, large disparities in
education are inefficient: they hold back economic
growth and progress in other areas. Governments
and aid donors can do a great deal to equalize
opportunity in education, working with civil society
and local movements for change. The starting point is
to put equity squarely at the centre of the EFA agenda.
Extreme inequalities in education are linked to wider
disparities in society. Overcoming these inequalities
requires effective and committed government
leadership and a public sector with the human and
financial resources to break down disadvantage. More
than that, it requires good governance. In its broadest
sense, governance is about the processes, policies and
institutional arrangements that connect the many actors
in education. It defines the responsibilities of national
and subnational governments in areas such as finance,
management and regulation. Governance rules stipulate
who decides what, from the national finance or
education ministry down to the classroom and
community. Good governance practices can help
foster development of more inclusive, more responsive
education systems that address the real needs of
the marginalized. Bad governance practices have
the opposite effect.
Education has been at the forefront of a wider
governance reform agenda. Outcomes to date have not
been encouraging, especially when it comes to equity.
Approaches to financial decentralization, choice and
competition in school management, and the integration
of education planning with wider strategies for poverty
reduction have not given the required impetus to EFA.
One reason is that equity considerations have typically
been bolted onto governance reforms as an
afterthought.
Government responsibility for acting on the Dakar
Framework extends to international aid partnerships.
Having signed up for the Framework, donors in rich
countries have underperformed. Aid flows are falling far
short of the required levels, calling into question donors’
commitment to ensure that no developing country
would fail in its planning for EFA for want of finance.
Donors are also falling short of commitments to
increase aid by 2010. Besides keeping their promises
on aid, donors need to address governance problems
that are undermining the quality and effectiveness
of development assistance.
1. Throughout the Report, the word ‘countries’ should generally be understoodas meaning ‘countries and territories’.
6
Overview

OV E R V I E W
Chapter 1Education for all: human rightand catalyst for development
The EFA agenda is rooted in a commitment to human
rights and social justice. It recognizes that expanding
and equalizing opportunities for education are
development goals in their own right. But the Dakar
Framework for Action also defines a public policy
agenda linking education to wider development goals.
Progress towards equitable education can act as a
powerful catalyst for progress in other areas, including
public health, poverty reduction, gender equality,
participation and democratization.
The Millennium Development Goals (MDGs), also
adopted in 2000, are the world’s time-bound and
quantitative targets for addressing extreme human
deprivation in its many dimensions. The targets range
from halving extreme poverty to cutting child and
maternal death rates and reducing malnutrition.
Education is part of the MDG framework. However,
the MDG targets for education are far less ambitious
and more restrictive than the EFA agenda. The MDG
project is at a watershed. While there has been
progress in many areas, it has been uneven and
too slow to achieve the targets. In September 2008,
governments from around the world met at a United
Nations summit in New York to reaffirm their MDG
commitments – but reaffirmation alone does not
bring the targets within reach.
Accelerated progress in education could play an
important role in getting the world on track to achieve
the wider MDG goals. Recent research has reinforced
earlier evidence on the key role of education as a
catalyst for human development. The links run two
ways. Progress in education can unlock progress in
health, nutrition and poverty reduction, and vice versa.
This has important implications in areas where the
MDG outcomes are lagging far behind target levels:
Halving extreme poverty. Broad-based and equitable
economic growth is the key to cutting income poverty.
There is strong evidence linking education to higher
growth and productivity. The increasing importance
of knowledge for economic growth may be
strengthening the links. When educational
opportunities are broadly shared, with marginalized
groups participating, prospects for shared economic
growth are strengthened.
Child mortality and nutrition. In many countries,
having a mother with secondary or higher education
more than halves the risk of child mortality, relative
to mothers with no education. Controlling for other
factors, when a Bangladeshi mother has completed
primary education, it cuts the risk of child stunting
by 20%. These outcomes reflect the empowering
effects of education in expanding access to
information and to health service use. The case
for gender equality in education is important in its
own right. It is also true that no country can afford
the prohibitive human, social and economic costs
that come with gender inequality.
The potential benefits of the EFA agenda extend far
beyond the MDGs. Recent evidence from sub-Saharan
Africa points to the important role of education
in building support for multiparty democracy and
in challenging autocracy. As the latest learning
assessment by the Organisation for Economic
Co-operation and Development’s Programme for
International Student Assessment (OECD-PISA) shows,
education also equips children with the learning skills
they need to understand complex environmental
problems – including climate change – and to hold
political leaders to account for resolving them.
Chapter 2The Dakar goals: monitoringprogress and inequality
Monitoring of progress
towards the EFA goals
serves many purposes.
It provides global,
regional and national
measures of how close
the Dakar Framework
is to being fulfilled.
Effective monitoring
can also pick up early
warning signals,
alerting governments
7

90
02
Education f
or A
ll G
lobal M
onitorin
g R
eport
OV E R V I E W
and the international community to potential failures.
And it is an essential element for holding governments
to account for their actions and performance.
Building on the previous Report’s systematic midterm
assessment of progress towards EFA, the EFA Global
Monitoring Report 2009 draws on data for the school
year ending in 2006. It highlights the extraordinary
progress made in many areas, notably by some of the
poorest countries. That progress bears testimony to
the fact that the EFA goals are attainable. With strong
political commitment, the right public policies and
sufficient financial commitment, all countries have the
potential to move rapidly towards meeting the six goals.
The bad news is that the world is not on track for
achieving several key targets, including UPE by 2015.
Changing this picture requires urgent action. It takes
time to build classrooms, train teachers and put in place
policies to remove barriers facing the disadvantaged –
and time is running out.
Goal 1: Early childhood care and education
ECCE is the foundation of the EFA agenda. The health
and nutritional status of children, especially during
the first two years of life, has a profound influence on
their cognitive development and learning achievements
in school. Early childhood malnutrition affects
brain development and diminishes prospects for
success in school and beyond. Pre-primary education
and health provision can counter early childhood
disadvantage. Good-quality ECCE programmes have
a strong track record in
reducing dropout rates in
primary school, improving
learning achievements and
narrowing inequalities.
Childhood malnutrition
and poor health are two of
the greatest barriers to EFA.
Progress in both areas has
lagged far behind progress
in getting children into school.
The upshot is that millions
of children entering school
have had their brains, their
cognitive development and their education potential
permanently damaged by hunger and ill health.
This runs counter to the commitments made in the
Dakar Framework for Action: filling classrooms with
malnourished and sick children is not what UPE is
about. The facts of childhood deprivation make their
own case for a strengthened focus on early childhood:
Child mortality. Around 10 million children a year
die in developing countries before their fifth birthday.
Survival prospects are improving – but far too slowly.
Estimates for 2015 based on current trends show
that the gap between the MDG target of a two-thirds
reduction in child deaths and actual outcomes will
amount to 4.3 million deaths. Already significant
inequalities in child death rates between rich
and poor are widening in many countries.
Stunting and low birth weight. Around one in three
children under 5 – 193 million in total – suffer
moderate to severe stunting. The vast majority of
these children live in South Asia, where almost half
of all children are affected, and in sub-Saharan Africa.
Low birth weight is a risk factor for ill-health and
stunting and an indicator for poor maternal health.
Some 16% of children in developing countries were
delivered with low birth weight in 2006, rising to 29%
in South Asia.
Vitamin and mineral deficiencies. Millions of
children are affected by micronutrient deficiency.
Iron deficiency anaemia, which affects around half
of pre-school children in developing countries,
impairs cognitive development and increases
vulnerability to infectious diseases.
More rapid economic growth alone will not overcome
these deficits. Over the past two decades, India has
been among the world’s fastest-growing economies.
By contrast, child health and nutrition have been
improving very slowly. Rising food prices could
undermine international efforts to counteract
malnutrition in many countries, with damaging
consequences for the EFA goals.
The record on pre-school provision is discouraging.
Enrolments are increasing but the vast majority of
the world’s children continue to lack access to quality
pre-schools. Gross enrolment ratios (GERs) in 2006
averaged 79% in developed countries and 36% in
developing countries. Of the thirty-five countries in
sub-Saharan Africa for which data are available,
seventeen had coverage rates below 10%. Coverage
rates are lowest for precisely those children who stand
to gain the most: namely, the poor and disadvantaged.
Weak public policies in ECCE are holding back
accelerated progress towards wider EFA goals and
reinforcing education disparities. Evidence from several
countries demonstrates what can be achieved. Countries
such as Bangladesh, Ethiopia, Nepal and the United
Republic of Tanzania have made rapid progress in
8

OV E R V I E W
reducing child mortality and improving child health.
In the Philippines an integrated ECCE programme
has registered strong improvements in cognitive
development. In Mexico a conditional cash transfer
programme linked to early childhood health and
education has achieved tangible gains in primary school
progression and learning achievement.
It is not just developing countries that face problems
in ECCE. While most developed countries have high
levels of early childhood provision, this is not the case
in the United States, which has relatively low and highly
unequal levels of coverage. The evidence suggests
that inequalities in early childhood education are
an important source of disparities in primary and
secondary school.
Goal 2: Universal primary education
UPE is not just about getting children into school
at an appropriate age. It is also about ensuring that
they stay in school to complete a full cycle of quality
basic education. The report card is mixed.
Some impressive gains have been registered. The net
enrolment ratio (NER) for developing countries as a
group increased between 1999 and 2006 at twice the
rate of the 1990s. In sub-Saharan Africa, it increased
from 54% to 70%. This is six times the rate of the 1990s
– and it was achieved despite rapid population growth.
In South and West Asia the NER climbed from 75%
to 86%. Behind these regional figures are some
remarkable achievements:
Ethiopia more than doubled its NER to 71%.
The NERs for Benin and the United Republic of
Tanzania moved from around 50% to more than 80%.
In the midst of a civil conflict, Nepal increased its NER
from 65% to 79% (in 2004).
Among the Arab States, Djibouti, Mauritania, Morocco
and Yemen registered strong gains.
Post-Dakar progress is also reflected in a decline in the
number of children out of school. There were 28 million
fewer out-of-school children in 2006 than when
governments met in Dakar in 2000. In sub-Saharan
Africa, the number of primary-school-age children not
in school dropped by 10 million while the population
in that age group increased by 17 million. South and
West Asia more than halved its out-of-school population,
from 37 million to 18 million.
These figures can be traced to political leadership and
effective public policies. Increased public investment,
ambitious school construction programmes, the
abolition of school fees, measures to strengthen quality
and – critically – the targeting of disadvantaged groups
have all played a role. So have increased recruitment
and training of teachers.
The distance travelled towards the EFA goals since 1999
should not obscure the distance that remains. The
yardstick is not the record of the 1990s but the target
of UPE by 2015. On current trends, it will be missed:
In 2006 some 75 million children of primary school
age were not in school. This is 12% of the developing
world’s primary-school-age population. In sub-
Saharan Africa, nearly one-third of that age group is
out of school. At the start of the twenty-first century,
in an increasingly prosperous, knowledge-based
global economy, millions of children do not even
have a foot on the first rung of the EFA ladder.
Girls still account for the majority of the world’s out-
of-school children (55%). Importantly, out-of-school
girls are also more likely never to have been to school
than boys.
This Report provides a partial projection for the
out-of-school population in 2015. It is partial because,
for reasons of data limitation, it covers countries that
are home to just two-thirds of out-of-school children in
the relevant age group. Countries that are not covered
include Sudan and the Democratic Republic of the
Congo, both of which have large populations affected.
Even with the exemptions, a business-as-usual
trajectory suggests that there will still be 29 million
children out of school in 2015. Slow progress towards
UPE in Nigeria and Pakistan is pushing these countries
towards the top of the out-of-school league table.
By 2015, more than 10 million children could be
out of school in these two countries alone.
Out-of-school figures and projections capture just one
aspect of the challenge that has to be addressed to
bring UPE within reach by 2015. In many countries,
primary school students are locked into cycles of
repetition and early dropout. In Malawi, just over six
in ten children enter primary school at the official age –
and half of them either drop out or repeat grade 1.
Of the thirty-one countries in sub-Saharan Africa with
data, eleven have grade 1 and 2 repetition rates in
excess of 20%. The problem is also widespread in Latin
America. This year’s Report highlights the inefficiencies
and inequalities associated with grade repetition.
9

90
02
Education f
or A
ll G
lobal M
onitorin
g R
eport
OV E R V I E W
Combining data on enrolment and completion highlights
the scale of global inequality in education. Children
in Britain or France are more likely to enter tertiary
education than children in the Niger or Senegal are
to complete primary school. Such inequalities in the
international distribution of opportunity for education
have important implications for future patterns of
globalization. Today’s inequalities in education are
tomorrow’s inequalities in the distribution of wealth
and wider opportunities for human development.
Inequality as a barrier to progress
Inequalities within countries are also marked. When it
comes to primary school attendance, children from rich
and poor households move in different worlds. National
averages can obscure this point. If the richest 20% in
countries including Bangladesh, Bolivia, Ghana, India
and Nigeria were a country, they would almost have
achieved UPE. The poor have a long way to go.
Simple UPE arithmetic points to a strong case for
greater focus on equity. In countries with school
attendance rates above 80%, children from poor
households are heavily over-represented among out-
of-school children. They account for more than 40% of
the non-attending school population in countries from
Cameroon and Kenya to Indonesia and Nicaragua. Even
in countries with lower levels of attendance reported in
household surveys, such as Ghana, India, Mozambique,
Nigeria and Zambia, the poorest quintile accounts for
30% to 40% of the out-of-school population.
Income-based disparities intersect with wider
inequalities. Rural children in many developing countries
are less likely to attend school and more likely to drop
out. In Senegal, children in urban areas are twice as
likely as those in rural areas to be in school. Slum
dwellers face a distinctive set of challenges, with high
levels of poverty, ill health and limited provision
restricting access. Socio-cultural inequalities linked to
ethnicity and language are also important. Disadvantage
in each of these areas
is related to, and
compounded by,
poverty and income-
based inequalities – but
they are also important
in their own right.
Other barriers to UPE
also have to be
removed if the 2015
targets are to be
achieved. Child labour is one of the most formidable.
There are around 218 million child labourers in
developing countries, and numbers are coming down
slowly in sub-Saharan Africa and parts of Asia.
Ill health and malnutrition undermine school attendance
and learning capacity for millions of children. And
childhood disability is strongly associated with
inequalities in participation, reflecting a widespread
failure to implement policies for inclusive education.
Post-primary education
Increasing participation in secondary education is part
of the Dakar commitment. Progress in this area is vital.
Expanded access to secondary school is needed to
absorb the increase in numbers of children emerging
from primary schools, to create incentives for primary
school completion and to train teachers. Secondary
and post-secondary education is also important for
the development of skills needed in an increasingly
knowledge-based global economy.
There are large regional disparities in participation in
secondary schools. At one end of the spectrum, most
developed and transition economies are nearing universal
secondary education. At the other, the secondary NER
for sub-Saharan Africa is just 25%, implying that nearly
78 million children of the relevant age group are
not enrolled in secondary school. The transition point
from primary to secondary is marked by high levels
of dropout in many countries. As at primary level,
progression through the secondary school system is
characterized by rising inequalities. In Latin America,
88% of children from the wealthiest decile move steadily
through the secondary school system without repetition
or dropout – twice the share for the poorest decile.
Global disparities are strongly apparent at tertiary level.
The global tertiary GER is around 25%. Regional GERs,
however, range from 70% in North America and Western
Europe to 32% in Latin America and 5% in sub-Saharan
Africa. Beyond the quantitative gaps are large qualitative
disparities fuelled by differences in financing capacity.
In equivalent dollar terms, France spends sixteen times
as much per university student as Peru. In 2005, the top
American universities spent over twenty-five times as
much per student as Dar-es-Salaam University in the
United Republic of Tanzania.
Tertiary education is the point at which the cumulative
effects of disparities at the primary and secondary level
become apparent. In Brazil, the university participation
for black people is 6% – just under one-third of the rate
for white Brazilians.
1 0

OV E R V I E W
Goals 3 and 4: Lifelong learning and literacy
Achieving UPE would establish a basis for lifelong
learning and literacy for future generations. But there
is an immense backlog of unmet need. Millions of
teenagers have never attended primary school and
millions more leave without the skills they need. Limited
access to educational opportunities in the past has also
left 776 million adults –two-thirds of them women –
lacking basic literacy skills.
Many governments have paid insufficient attention to
youth and adult learning needs. Public funding remains
inadequate and provision highly unequal. The fact that
some of the goals in the Dakar Framework were vaguely
worded may have contributed to a lack of urgency.
The sixth International Conference on Adult Education,
scheduled for 2009, provides an important opportunity
to change this picture.
Illiteracy continues to receive inadequate attention from
policy-makers. Although there were 95 million fewer
illiterates worldwide in 2000–2006 than in 1985–1994,
absolute numbers have increased in sub-Saharan Africa
and the Arab States. On current trends there will still be
over 700 million adult illiterates in 2015.
Many factors contribute to low literacy levels, including
gender disparities, poverty, location and ethnicity.
The problem is not restricted to developing countries.
Many OECD countries also record high levels of literacy
problems: 1 million native Dutch speakers in the
Netherlands are classified as functionally illiterate,
for example. In metropolitan France, some 10% of the
population aged 18 to 65 – more than 3 million people –
lacks basic reading, writing, arithmetic and other
fundamental skills despite having attended French
schools.
Goal 5: Gender disparities and inequalities in education
The Dakar Framework sets out an ambitious two-part
agenda on gender equity. The first part aims at gender
parity in school participation and the second at wider
progress towards equality between girls and boys in
educational opportunities and outcomes.
The world has made sustained progress towards gender
parity, but deficits remain large. Of the 176 countries in
2006 with data, 59 had achieved gender parity in both
primary and secondary education. Over half the countries
of sub-Saharan Africa, South and West Asia, and the
Arab States have yet to achieve parity at primary level.
There are large regional variations in progress towards
gender parity. Advances in sub-Saharan Africa have
been slow and uneven. The regional gender parity index
(GPI), which measures the ratio of girls to boys primary
GER, rose from 0.85 in 1999 to 0.89 in 2006, though
several countries – including Ghana and the United
Republic of Tanzania – have achieved parity. The GPI for
South and West Asia rose from 0.84 to 0.95. However,
Pakistan still enrols only 80 girls for every 100 boys in
primary school.
Expansion of secondary school enrolment has led
to reductions in gender disparities in most regions.
However, gender disparities remain larger in secondary
education than in primary. In many countries in sub-
Saharan Africa, and South and West Asia, participation
rates for girls remain low and disparities high. One
major exception is Bangladesh, which has achieved
gender parity. Public policy, notably the creation of
financial incentives through stipend programmes, has
played a key role. Underparticipation by boys is marked
in many countries, especially in Latin America.
Gender disparities are unequally distributed across
societies. Being born into a household that is poor, rural
or indigenous, or speaks a minority language, reinforces
gender disadvantage in many countries. In Mali, the GPI
for the poorest 20% of households was 0.60 in 2001,
whereas many more girls in the richest 20% were
attending primary school. The secondary GPI is 0.50
for the poorest households and 0.96 for the wealthiest.
Such facts demonstrate how poverty often magnifies
the effects of gender disparities.
Gender equality is more difficult to measure than
parity. Learning achievements provide one benchmark.
Four broad themes emerge from international
assessments. First, girls often outperform boys in
reading and literacy. Second, boys outperform girls
in mathematics, though the gap is closing. Third, boys
maintain a small advantage in science. Fourth, at
the tertiary level women remain under-represented
in science and engineering and ‘over-represented’
in areas such as education and health.
Goal 6: Education quality and learning achievements
The ultimate goal of education is to equip children
with the knowledge, skills and opportunities they need
to realize their potential and to participate in social
and political life. Many education systems are failing
to achieve this goal.
1 1

90
02
Education f
or A
ll G
lobal M
onitorin
g R
eport
OV E R V I E W
Progress in quantitative headcount indicators has
masked problems in qualitative learning achievement.
In many developing countries, absolute levels of average
learning are exceptionally low. International learning
assessments draw attention to the very large disparities
between rich and poor countries. Within countries,
too, there are often large differences in test scores
based on socio-economic status, school performance
and other variables.
Getting children into school and through a full cycle of
basic education remains a major priority. But evidence
from many countries suggests that, once in school,
many children are acquiring only the most rudimentary
skills, as the following examples demonstrate:
One recent assessment in the Punjab province
of Pakistan found that over two-thirds of grade 3
students could not write a sentence in Urdu and
a similar proportion could not solve a simple
subtraction problem.
In India, a large-scale assessment found that 45% of
children in standard 3 could not read a text designed
for standard 1 students.
Results from the Southern and Eastern Africa
Consortium for Monitoring Educational Quality
(SACMEQ) II assessment in Africa indicated that
the share of grade 6 children reaching the ‘desirable’
level of literacy was less than 25% in Botswana,
Kenya and South Africa, and less than 10% in Malawi,
Mozambique, Uganda and Zambia.
A recent assessment in Peru found that as few as
30% of children in grade 1, and 50% in grade 2, could
read a simple passage from a grade 1 textbook.
These examples, which could be multiplied many times
over, draw attention to the sheer scale of the learning
achievement deficit in many countries.
International assessments reinforce this picture.
They draw attention to the low average level of learning
in many developing countries relative to developed
countries. To take one illustration from the PISA 2001
assessment, the median scores for students in Brazil,
Indonesia and Peru would be situated in the lowest 20%
of the distribution in France or the United States. PISA
2006 showed that over 60% of students from Brazil and
Indonesia scored at or below the lowest level in science,
compared with fewer than 10% in Canada or Finland.
Other international assessments confirm the scale
of global inequalities.
Real learning divides are larger than those captured
in international assessments. This is because
assessments measure learning outcomes among
children in school and do not include children who
are currently or permanently out of school. Given that
out-of-school children would be expected to score at
lower levels than children in school, the real national
averages may be well below those indicated.
Within-country inequalities in outcomes often mirror
global disparities in scale. In countries including
Morocco and South Africa, the top 5% of pupils covered
in the Progress in International Reading Literacy Survey
(PIRLS) assessment registered scores comparable to
those of the best pupils in high-achieving countries. But
the scores of the bottom 5% were less than one-fifth of
those for top performers. Research in the Indian states
of Rajasthan and Orissa also points to extremely large
learning disparities.
Many factors influence learning achievement levels.
Student characteristics play a significant role.
Socio-economic status, family size and composition,
immigrant status and home language are all important
variables. System-level variables, such as access to
early childhood provision, selection and the social
composition of schools, are also influential.
School-based factors have a strong effect on learning.
Insufficient instructional time is one source of
underachievement. A study in Bangladesh found that
10% of government schools provided fewer than
500 hours of instruction, compared with 860 hours at
the other end of the spectrum. In many cases, children
and teachers lack access to basic learning materials.
SACMEQ II found that over half of grade 6 pupils in many
countries – including Malawi, Mozambique, Uganda and
Zambia – did not have a single book. A poor learning
environment can exacerbate social disparities.
1 2
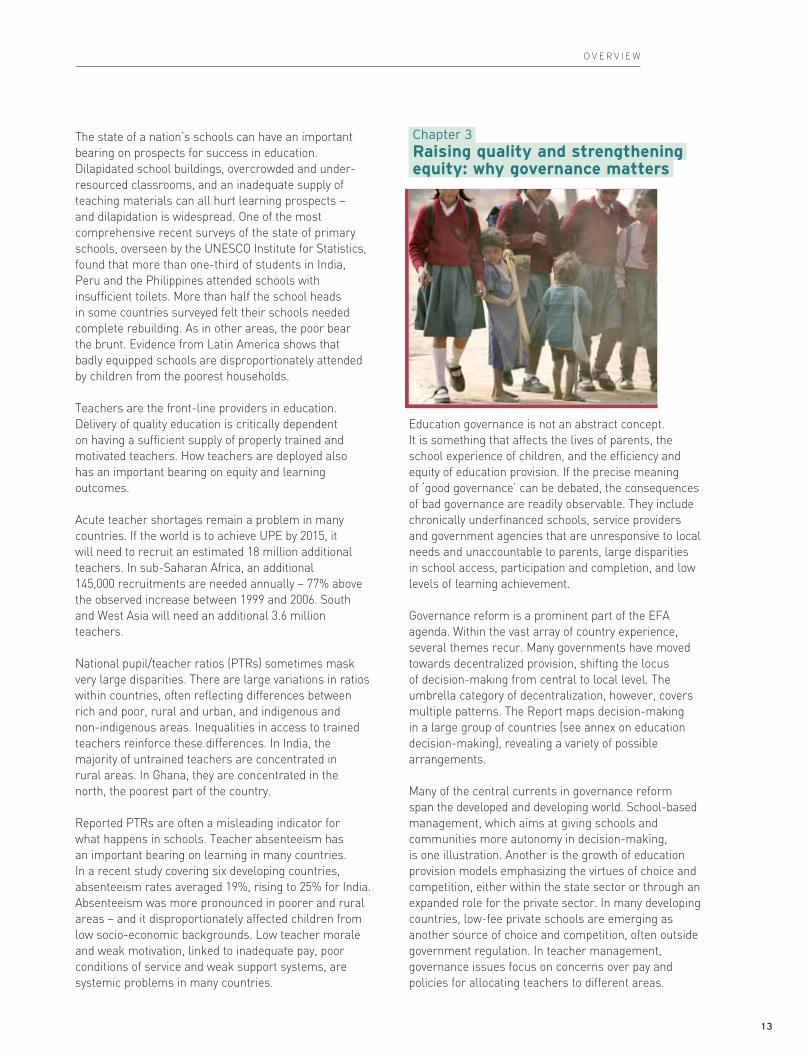
OV E R V I E W
The state of a nation’s schools can have an important
bearing on prospects for success in education.
Dilapidated school buildings, overcrowded and under-
resourced classrooms, and an inadequate supply of
teaching materials can all hurt learning prospects –
and dilapidation is widespread. One of the most
comprehensive recent surveys of the state of primary
schools, overseen by the UNESCO Institute for Statistics,
found that more than one-third of students in India,
Peru and the Philippines attended schools with
insufficient toilets. More than half the school heads
in some countries surveyed felt their schools needed
complete rebuilding. As in other areas, the poor bear
the brunt. Evidence from Latin America shows that
badly equipped schools are disproportionately attended
by children from the poorest households.
Teachers are the front-line providers in education.
Delivery of quality education is critically dependent
on having a sufficient supply of properly trained and
motivated teachers. How teachers are deployed also
has an important bearing on equity and learning
outcomes.
Acute teacher shortages remain a problem in many
countries. If the world is to achieve UPE by 2015, it
will need to recruit an estimated 18 million additional
teachers. In sub-Saharan Africa, an additional
145,000 recruitments are needed annually – 77% above
the observed increase between 1999 and 2006. South
and West Asia will need an additional 3.6 million
teachers.
National pupil/teacher ratios (PTRs) sometimes mask
very large disparities. There are large variations in ratios
within countries, often reflecting differences between
rich and poor, rural and urban, and indigenous and
non-indigenous areas. Inequalities in access to trained
teachers reinforce these differences. In India, the
majority of untrained teachers are concentrated in
rural areas. In Ghana, they are concentrated in the
north, the poorest part of the country.
Reported PTRs are often a misleading indicator for
what happens in schools. Teacher absenteeism has
an important bearing on learning in many countries.
In a recent study covering six developing countries,
absenteeism rates averaged 19%, rising to 25% for India.
Absenteeism was more pronounced in poorer and rural
areas – and it disproportionately affected children from
low socio-economic backgrounds. Low teacher morale
and weak motivation, linked to inadequate pay, poor
conditions of service and weak support systems, are
systemic problems in many countries.
Chapter 3Raising quality and strengtheningequity: why governance matters
Education governance is not an abstract concept.
It is something that affects the lives of parents, the
school experience of children, and the efficiency and
equity of education provision. If the precise meaning
of ‘good governance’ can be debated, the consequences
of bad governance are readily observable. They include
chronically underfinanced schools, service providers
and government agencies that are unresponsive to local
needs and unaccountable to parents, large disparities
in school access, participation and completion, and low
levels of learning achievement.
Governance reform is a prominent part of the EFA
agenda. Within the vast array of country experience,
several themes recur. Many governments have moved
towards decentralized provision, shifting the locus
of decision-making from central to local level. The
umbrella category of decentralization, however, covers
multiple patterns. The Report maps decision-making
in a large group of countries (see annex on education
decision-making), revealing a variety of possible
arrangements.
Many of the central currents in governance reform
span the developed and developing world. School-based
management, which aims at giving schools and
communities more autonomy in decision-making,
is one illustration. Another is the growth of education
provision models emphasizing the virtues of choice and
competition, either within the state sector or through an
expanded role for the private sector. In many developing
countries, low-fee private schools are emerging as
another source of choice and competition, often outside
government regulation. In teacher management,
governance issues focus on concerns over pay and
policies for allocating teachers to different areas.
1 3

90
02
Education f
or A
ll G
lobal M
onitorin
g R
eport
OV E R V I E W
Other governance issues have received less attention.
One striking example is the integration of education
planning with broader poverty reduction strategies.
This is a key issue for the Dakar Framework for Action.
Many of the most entrenched barriers to EFA are rooted
beyond the school in underlying structures of poverty
and social disadvantage. Effective education governance
can make some difference. But ultimately, sustained
progress towards EFA depends on the effective
integration of education planning in wider poverty
reduction strategies, for an obvious reason: poverty,
poor nutrition and ill health are formidable barriers
to success in education.
Governance reform has delivered highly variable results.
While the progress achieved in some countries has
to be acknowledged, overall outcomes have been
disappointing. One reason is that governance reforms
have often been designed with scant regard for their
impact on the most disadvantaged people and regions.
Choice and competition have their merits – but also their
limits, notably for the poor. Governance reform design
problems have sometimes been compounded by a
tendency to embrace fixed blueprints, many of them
originating in developed countries.
The Report explores four central themes in national
governance reform, principally as they relate to basic
education:
financing;
‘voice’, participation and choice;
governance of teachers and monitoring of learning;
integration of EFA and poverty reduction strategies.
Financing for basic education
It costs nothing to set ambitious goals in education.
However, achieving those goals requires financial
resources, along with policies that maximize efficiency
and equity in the management of those resources.
While many of the issues appear technical, financial
governance has a critical bearing on prospects for
achieving EFA.
Countries vary enormously in their capacity to finance
education. Increased public spending is not guaranteed
to improve access, equity or learning outcomes. But
chronic and sustained underfinancing is a sure route
to limited, poor-quality provision.
Most countries have increased the share of national
income allocated to education since 1999. In some
cases, such as those of Ethiopia, Kenya, Mozambique
and Senegal, the share has climbed sharply.
In others, as in India and Pakistan, it has stagnated
at a relatively low 3% of gross national product or less.
While cross-regional comparisons have to be treated
with caution, spending patterns in South and West Asia
would appear to indicate a limited public spending
commitment to education.
Global wealth inequalities are mirrored by inequalities
in education spending. In 2006, per-student expenditure
for primary school (expressed in constant dollars)
ranged from less than US$300 in much of sub-Saharan
Africa to over US$5,000 in most developed countries.
As a region sub-Saharan Africa accounts for 15% of
5- to 25-year-olds but just 2% of global spending on
their education. South and West Asia represent over
one-quarter of the population and 7% of spending.
As in any area of public financing, efficiency is an
important determinant of outcomes. Technical efficiency
provides a crude indicator of the cost associated with
turning finance into quantitative and qualitative
outcomes. In many countries, corruption is a major
source of both inefficiency and inequity – the former
because it means more public money provides fewer
inputs and the latter because the costs of corruption
invariably fall most heavily on the poor.
Public spending on education has the potential to
redress inequalities but often reinforces them instead.
Wealthier regions and advantaged groups often attract
more financing than poorer regions and disadvantaged
groups. Public spending is often not pro-poor.
Governments have developed various approaches aimed
at strengthening equity, including school grants and
formula funding linked to need – with mixed outcomes.
Financial decentralization has important implications
for equity. There is nothing intrinsically equitable or
inequitable about reforms in this area: outcomes depend
on the rules governing issues such as revenue raising
and resource transfer. One obvious danger is that, in the
absence of redistributive transfers from richer to poorer
areas, decentralization will widen financing gaps in
education, with damaging consequences for equity.
Another is that subnational governments will seek to
mobilize revenue through charges on local services,
including education.
Evidence from many countries highlights the risks
associated with financial decentralization. In China,
Indonesia and the Philippines, decentralization appears
to have exacerbated inequalities. In Nigeria, financial
decentralization has consolidated large disparities in
1 4
OV E R V I E W
education financing, often to the detriment of the states
facing the most serious problems. However, countries
including South Africa, Uganda and Viet Nam have
developed models aimed at greater equity, with rules on
financial decentralization geared towards the attainment
of national goals in education and other areas.
‘Voice’, participation and choice in school governance
Schools are on the front line of the campaign to bring
high-quality education to all children. They are also at
the centre of debates on education governance in which
choice, competition, participation and ‘voice’ are
buzzwords. Behind these terms are crucial questions
about the role of governments, parents, communities
and private providers in managing and financing schools.
Many countries with poorly performing education
systems suffer from institutional problems. The Dakar
Framework does not set out a blueprint for resolving
these problems. But it does call on governments to
‘develop responsive, participatory and accountable
systems of educational governance and management’.
Translating these widely shared objectives into practical
strategies that tackle institutional weaknesses, expand
access, raise quality and strengthen equity is far from
straightforward.
The Report focuses on three broad reform currents in
school governance. School-based management, the first
current, aspires to anchor education in the social fabric
of communities. Transferring authority to front-line
providers is presented as a vehicle for increasing
parental influence in decisions affecting children’s
education – and for ensuring that schools reflect local
priorities and values.
The second reform current focuses on choice and
competition. Expanding parental choice in the selection
of schools is widely viewed as a key to driving up
standards, with competition creating powerful incentives
for improved performance. In some countries, public-
private partnerships are seen as a route to enlarged
choice. Governments are using vouchers and other
instruments to facilitate transfers from public to private
providers, or contracting out the management of
government schools to private providers.
The locus for the third thematic area is outside the public
education system. Low-fee private schools have spread
rapidly in many countries. Some commentators see
these schools as a vehicle for improving access and
quality for poor households.
Proponents of all three approaches claim various
benefits from governance reform. These range from
gains in efficiency to increases in participation,
accountability and equity. There is a widely shared
underlying assumption that devolution of authority,
competition and the growth of low-fee private schools
will strengthen the voices of the poor and increase
their choices. Are the claims and assumptions backed
by evidence?
There are no simple answers to that question. In some
cases, school-based management reforms have
improved learning achievements and strengthened
equity. The EDUCO schools in El Salvador are an
example. More widely, though, there is limited evidence
either of systematic benefits in learning outcomes or of
changes in teaching practices. Effects on ‘voice’ are also
ambiguous. More localized decision-making may bring
authority closer to parents and communities, but it does
not follow that this will overcome wider disadvantages.
An obvious danger is that local power structures
associated with poverty and social inequality will limit
the real influence of the poor and marginalized.
Choice and competition are at the centre of sometimes
polarized debates in both developed and developing
countries. Underlying these debates are strongly held
views about the role and responsibilities of government.
The idea that increased parental choice leads to
improved learning outcomes and greater equity may
have intuitive appeal. But once again the evidence is
not clear cut. Evidence from PISA data does not point
to strong effects of school competition on learning
outcomes. In the United States, neither the still limited
recourse to voucher programmes nor the more
expansive development of charter schools has
unambiguously raised academic achievement standards
or tackled disparities.
Evidence from Chile is also instructive. Over more than
two decades, Chile has introduced education governance
reforms, aimed at increasing choice, that are broader
and deeper than in most countries. Yet private schools
with state subsidies do not register any advantage over
municipal schools once adjustments are made for
socio-economic status. Overall improvements in
education quality have been limited – as has progress
towards greater equity. While Chile is widely cited as
a model governance reformer, it is not clear from the
outcomes that it merits this description.
Others countries have a stronger claim to successful
governance reform. Sweden is a case in point. Since the
mid-1990s it has allowed parents to choose non-public
1 5
90
02
Education f
or A
ll G
lobal M
onitorin
g R
eport
OV E R V I E W
education providers and take state funding with them.
There is a broad consensus in Sweden behind the
reforms. However, the exportability of the Swedish
model is unproven. Increased competition in this case
was introduced against the backdrop of a public
education system that meets high achievement
standards, with relatively low inequality and a highly
developed institutional capacity for regulation. These
are not the prevailing conditions in most countries,
developed or developing.
Serious questions have to be asked about current
approaches to school-based management. Parental
participation is important and, under the right
conditions, choice and competition can help raise
standards and equalize opportunity. But the
overwhelming priority, especially in the poorest
countries, is to ensure that a properly financed public
education system is available to all citizens.
The rapid emergence of low-fee private schools raises
a different set of concerns. In many countries, these
schools are outside state auspices. There is no question
that low-fee private schools are catering for real
demand. Countries as diverse as Ghana, India, Kenya,
Nigeria and Pakistan have experienced increases in
enrolment in such schools. But to what extent have
they raised standards and enhanced equity?
While international evidence remains patchy, it offers
little cause for optimism. In many countries, parents
select private schools not as a positive choice but as
a negative response to perceived – and usually real –
failures of the public system. In the case of slum areas,
as in Nairobi, public schools often simply do not exist.
In India evidence does not suggest that poor parents are
more actively involved in decision-making in low-fee
schools, or that teachers are less likely to be absent.
While the fact that parents meet school charges may
be taken as evidence of willingness to pay, the costs
impose a considerable burden on household budgets.
Efforts to integrate low-fee private schools into
private-public partnerships through voucher-type
programmes, as advocated by some, do not appear
to offer a short cut to greater equity.
The rapid growth of low-fee private schools is in
large measure a symptom of state failure. Chronic
underfinancing, often combined with weak
accountability, low levels of responsiveness and poor
quality of provision, has led millions of poor households
to vote with their feet – and their income – to exit public
provision. This is not a prescription either for equity
or for accelerated progress towards EFA.
Basic education is a fundamental human right, not a
tradable commodity. It follows that provision must be
available to all, regardless of ability to pay. Moreover,
the public sector must govern provision, underwriting
finance, providing management and setting a clear
policy framework.
Public sector leadership does not mean that actors
such as non-government organizations and the private
sector have no role or responsibilities. In the right
conditions, properly regulated choice and competition
can strengthen standards, especially at secondary level.
However, there are acute dangers for equity. Where
government failure leads to creeping commercialization
through the low-fee private sector, it poses the risk
of rising inequity, and the fragmentation of services
and standards. The real challenge for governments
with basic education systems that are broken is to fix
the system.
Governance of teachers — improvingmotivation and monitoring
The effectiveness of any school is heavily influenced by
the quality of teaching, and the skills, motivation and
commitment of its teachers. Ensuring that children –
including the most disadvantaged – have access to
enough trained and motivated teachers is vital to
the delivery of good and equitable education. The
effectiveness and equity of school systems are also
linked to national monitoring of standards. Good
monitoring systems can help inform policy and so
raise quality and enhance equity. Weak systems have
the opposite effect.
The governance of teachers raises issues that go
far beyond administrative technicalities. One recent
assessment of teacher morale in sub-Saharan Africa
concludes that school systems catering for tens of
millions of children face a ‘teacher motivation crisis’
over issues ranging from employment conditions to
training and support. How teachers are distributed
within countries has profound implications for equity
and access: deployment patterns in many countries
reinforce disparities.
Teacher salaries are at the centre of polarized
exchanges in public policy debate. Some commentators
say salary levels in many countries are too high and
crowd out spending on other aspects of education.
Apart from cost factors, hiring teachers centrally on
permanent civil service contracts is also viewed as
a source of weak accountability and poor performance.
The problem with these perspectives is that they
1 6

OV E R V I E W
overlook wider issues. These include the low absolute
salary levels of many teachers. In Malawi, average
teacher salaries are too low to meet basic needs. There,
and in many other countries, teachers often have to
supplement their income with a second job, with
damaging consequences for the quality of their teaching.
Teacher recruitment to reduce PTRs and address
shortages confronts governments with tough choices.
Some governments have attempted to contain costs by
recruiting teachers on contract outside the civil service
pay structure. Hiring contract teachers can expand
access to basic education at lower cost, often benefiting
areas that might otherwise not have enough teachers,
as in parts of India.
On the other side of the coin are potential threats to
quality and equity. Seeking to reduce recruitment costs
through contract arrangements can weaken quality
by lowering the standard of new entrants or reducing
teacher morale. In Togo, expanded use of contract
teachers is associated with reduced learning
achievement. And if contract teachers are deployed
principally in poor and marginalized areas, it can also
weaken equity. There are no easy answers, but it is
important for governments to be aware of potentially
damaging trade-offs between lower-cost recruitment
and wider education goals with respect to equity
and quality.
Teacher deployment is often inequitable within
countries, which can exacerbate disparities. The rural-
urban divide is particularly marked. In Uganda, two-
thirds of urban teachers are qualified, compared with
40% in rural areas. Urban bias in deployment reflects
many teachers’ aversion to working in hard-to-reach,
remote, rural and sparsely populated areas, often for
both professional and personal reasons.
Public policies can overcome inequalities in deployment.
In Brazil, central government redistribution of financial
resources has been used to support teacher recruitment
and training in poor states. In Cambodia and the Lao
People’s Democratic Republic, institutional incentives
encourage the recruitment of teachers from
marginalized areas and groups; a lesson from their
experience is that very strong incentives may be needed.
One symptom of poor teacher motivation is
absenteeism. In many developing countries absenteeism
is endemic (see Chapter 2). Motivation is not always the
culprit: in parts of Africa HIV-related health problems
are heavily implicated. Some governments see
performance-related pay as a strategy to address
motivation problems and so raise quality. But there
is little evidence from cross-country experience that
performance-related pay produces positive results –
and some evidence that it creates perverse incentives
for teachers to focus on the best-performing students.
The importance of monitoring in raising quality
standards and addressing equity concerns is widely
overlooked. Information is one of the keys to improved
learning outcomes – and the flow of information is
increasing. Between 2000 and 2006, around half the
world’s countries conducted at least one national
learning assessment. Regional assessments have also
expanded: thirty-seven sub-Saharan African countries
and sixteen Latin American countries now participate
in major regional assessments.
While large gaps in coverage remain, many
governments have access to more national and
international learning assessment information than
their predecessors had in the 1990s. Many of these
assessments are ‘high stakes’ – so called because they
have direct consequences for student progression, and
sometimes for teachers and schools. Others are ‘low
stake’ exercises that provide information, with no direct
consequences for students, teachers or schools. The
value of ‘high stakes’ assessment as a vehicle for
holding schools and teachers to account is widely
contested. In the United States, the No Child Left Behind
Act offers a particularly high-profile example of high
stakes testing – and one with a mixed record in terms
of its effects on achievement.
How information is used is as important as the flow of
information. Education authorities in many developing
countries increasingly use assessments to inform policy
design. In Kenya, SACMEQ results were a basis for
benchmarks on minimum classroom facilities. In
Senegal, data from a PASEC assessment showed that
grade repetition imposed high costs on school systems
with no tangible benefits for learning outcomes – a
finding that prompted a prohibition on repetition for
some primary grades. Viet Nam has used learning
assessments to identify disparities in achievement and
guide the framing of regulations aimed at raising input
provision for disadvantaged groups and areas. Uruguay
has applied carefully designed national assessment
programmes to strengthen pedagogical management.
Learning outcomes improved in some grades by as
much as 30% in six years.
These positive examples are the exception rather than
the rule. In many cases, the findings from assessments
have no influence on resource allocation or teacher
1 7

90
02
Education f
or A
ll G
lobal M
onitorin
g R
eport
OV E R V I E W
support programmes. Even where good assessment
systems are in place, their effects are often limited.
The reason, in many cases, is weak institutional capacity.
Thus, Bolivia has a first-rate assessment system and
strong expertise, but they have had limited impact on
policy design or what happens in the classroom.
Integrated planning to advance EFA
Progress in education is contingent on wider social
conditions influencing inequalities based on income,
gender, ethnicity and location. The Dakar Framework
for Action calls for EFA policies to be promoted ‘within
a sustainable and well-integrated sector framework
clearly linked to poverty elimination and development
strategies’. While education planning has been
strengthened, a failure to join education strategies
to general poverty reduction strategies, along with
high levels of fragmentation and weak coordination,
continues to hamper progress.
Education planning within the framework of sector-wide
approaches (SWAps) has been instrumental in clarifying
priorities, broadening the EFA agenda and allowing
governments to develop longer-term planning horizons.
However, many education SWAps suffer from continued
weaknesses. Financial costing is often inadequate,
education targets are not reflected in national budgets
and there is a tendency to adopt blueprint models.
Even more serious is the widespread tendency to delink
education planning from wider strategies for overcoming
poverty and inequality. Poverty reduction strategy
papers (PRSPs) provide a vehicle for addressing this
problem. Fifty-four countries – just over half of them
in sub-Saharan Africa – have operational PRSPs.
While PRSPs are ‘nationally owned’ documents, they
also set out the terms of the aid partnership with
donors. PRSPs have brought poverty closer to the
centre of the development agenda but they are not yet
facilitating effective integration in education planning,
for at least four reasons:
Weak linkage to the EFA agenda. The point of
reference for PRSPs is the MDGs. One consequence
is an overwhelming emphasis on quantitative targets
related to primary education, often to the exclusion of
wider EFA goals. When wider goals are considered,
they are typically not linked to a broader poverty
reduction agenda. For example, in a review of
eighteen recent PRSPs the Report finds that ECCE
is regarded primarily as a mechanism for increasing
primary school enrolment rather than as a strategy
to improve the health and nutrition of young children.
Poor targeting and limited consideration of equity in target-setting. Targets rarely include the
narrowing of equity gaps, with the partial exception
of gender parity goals; they invariably address access
rather than learning achievement.
No link between education and broader governancereforms. PRSPs often incorporate national
commitments to wide-ranging governance reforms.
However, the implications of the reforms for equity
in education are seldom considered in any detail,
even where the reforms have potentially significant
consequences. Decentralization is one prominent
example. More generally, few PRSPs set out practical
strategies for ensuring that governance reforms
strengthen the link between education planning
and wider poverty reduction efforts.
Poor integration of cross-sectoral policies.As Chapter 2 notes, there are deep and persistent
inequalities in education linked to poverty, gender,
nutrition, health, disability and other forms of
marginalization. Addressing these inequalities
requires policies that extend far beyond the education
sector. Evidence from PRSPs suggests that education
strategies are often disconnected from such policies.
While PRSPs have thus far seldom provided an
integrated framework, there are positive experiences
to draw upon. Social protection programmes are making
a strong contribution to education by addressing
problems in health, nutrition and child labour. Targeted
cash transfers in Latin America have been particularly
successful – so much so that one has been adopted on
a pilot basis in New York City. There are strong grounds
for considering an increase in public investment and
aid for cross-sectoral programmes of this kind in
other contexts.
Planning is not just about technical documents. It is also
about the political process through which priorities are
set. Consultation processes are a central part of PRSPs.
They provide opportunities for civil society organizations
to participate in policy discussions. They also help
ensure that education figures in debates over national
poverty strategies. The challenge is to extend
participation to ensure that the voices of the poor and
vulnerable are heard. This in turn will help focus more
attention on ECCE, adult literacy and skills development.
It will also inform policy-makers about factors beyond
the education sector that are holding back progress
towards equitable education. Sustained political
commitment is crucial for priorities set out in
consultation processes to become reality.
1 8

OV E R V I E W
Chapter 4Increasing aid andimproving governance
The Dakar Framework for Action is based on an
international partnership. Developing countries pledged
to strengthen national education planning, tackle
inequalities and enhance accountability. Rich countries
also made an important commitment, pledging that no
credible national plan would be allowed to fail for want
of finance. Increased and more effective aid is vital to
achieving the goals and targets set at Dakar. Are donors
delivering on their promises?
Not in the area of financing. On a highly conservative
estimate, the aid financing required for a narrow range
of basic education goals in low-income countries is
around US$11 billion annually. In 2006, aid in support
of basic education to these countries was just one-third
of the estimated requirement, leaving a financing gap
of around US$7 billion.
These large aid deficits are holding back progress.
Debates over the achievements and effectiveness of
development assistance continue. Pessimists claim aid
has had a modest impact at best, and a negative effect
in many cases. Evidence in education does not support
this view. In the United Republic of Tanzania aid has
supported a national education strategy that has cut
the number of out-of-school children by 3 million since
1999. In Cambodia, Kenya, Mozambique and Zambia,
aid helped finance the abolition of school fees, extending
educational opportunities to previously excluded
children. In Bangladesh and Nepal, aid supported
national strategies providing incentives for girls and
disadvantaged groups. Development assistance is not
a panacea or a corrective for bad policy – but it makes
a difference.
Aid levels for education are linked to overall
development assistance flows. In 2005 donors made
a number of important commitments to increase aid
flows, notably at the Gleneagles summit of the Group
of Eight (G8) and at a European Council meeting. This
was a backdrop to the United Nations ‘Millennium +5’
summit. Delivery on these commitments would lead
to an increase of around US$50 billion in development
assistance by 2010 (at 2004 prices), with around half
going to sub-Saharan Africa.
Prospects for delivery, however, are not encouraging.
As a group, donors are not on track to meet their
commitments. Taking into account increased aid and
programmed commitments to 2010, there is a shortfall
of US$30 billion against the pledges made in 2005
(again in 2004 prices). The aid gap for sub-Saharan
Africa is US$14 billion – a financing shortfall that
has damaging implications for progress towards the
MDGs and EFA. Most individual donor countries are
not on track to meet their Gleneagles commitments
and two G8 countries – the United States and Japan –
continue to invest a very low share of gross national
income in development assistance.
Commitments to education have followed the
overall trend. The average annual aid commitments
in 2005–2006 were below the level for 2003–2004,
and there is a real danger that this will be reflected in
slower growth of disbursements, or even stagnation.
Donors have a mixed record on aid for basic education.
In 2006, half of all aid commitments for basic education
came from just three sources – the Netherlands, the
United Kingdom and the World Bank’s International
Development Association. These sources accounted for
85% of the overall increase in aid commitments to
basic education in 2006. However, the combined effort
of a few committed donors could not counteract an
overall fall in aid commitments from 2004.
The profile of donor aid commitments varies widely.
Some countries, such as Canada, the Netherlands and
the United Kingdom, allocate more than three-quarters
of their education aid to low income countries – and at
least half to basic education. By contrast, France and
Germany, both major donors to education, attach less
weight to basic education in the poorest countries.
Only 12% of French aid and 7% of German aid is
devoted to basic education in low income countries.
Both countries put greater priority on subsidizing
attendance at their universities by foreign students,
mostly from middle income developing countries,
than on supporting basic education in low income
countries. In France two-thirds of education aid is
absorbed by imputed costs for students studying at
French tertiary institutions.
1 9

90
02
Education f
or A
ll G
lobal M
onitorin
g R
eport
OV E R V I E W
The continued aid financing gap in education raises
important questions about the future of the Fast Track
Initiative (FTI). Established in 2002, the FTI was seen as
a multilateral mechanism to encourage broad donor
support for EFA and, through the Catalytic Fund begun
in 2003, an element of financing. Unfortunately, the FTI
has not developed a sufficiently deep donor base and
it faces an uncertain future. In mid-2008, the thirty-five
countries with endorsed FTI plans faced a financing gap
of US$640 million. Factoring in the eight countries with
plans in the pipeline would push that figure up to around
US$1 billion. By the end of 2009, the financing deficit for
countries with approved FTI plans could be as high as
US$2.2 billion. Assuming that the Catalytic Fund might
be expected to cover around 40% to 50% of the deficit,
around US$1 billion would still have to be mobilized.
Current aid financing trends do not augur well
for achieving the goals and targets in the Dakar
Framework. Yet there are some positive signs. In 2007,
the G8 reaffirmed its pledge that no national strategy
would fail for want of finance. It also promised to meet
shortfalls in FTI-endorsed plans. In June 2008, the
European Council also reaffirmed its support for EFA.
However, reaffirmations of long-standing commitments
do not put children into school or deliver a good-quality
education. If donors are serious about their pledges
to education, they cannot afford more years of
underperformance.
Increased aid is just part of the equation. Ultimately,
the case for increased commitments will be accepted
only if aid is perceived to deliver real results. Much
depends on governance in developing countries.
But the governance and management of aid are also
important. In 2005, donors and developing country
governments pledged to strengthen the effectiveness
of development assistance. That promise, in the Paris
Declaration, envisages the harmonization and
alignment of donor practices behind nationally owned
development strategies. The approach signals a shift
in emphasis away from project-based support and
towards programme support – a shift already strongly
evident in education. Targets were set for 2010 to
measure progress.
It is too early to fully assess the extent to which new aid
principles are being translated into practice. In terms
of financial commitment, there has been a strong push
away from projects towards programme-based support.
Best estimates suggest that just over half of all aid is
now delivered through education sector programmes –
up from around one-third in 1999–2000.
Preliminary assessment suggests that some Paris
Declaration targets will be hard to achieve. Monitoring
results for fifty-four countries accounting for half
of all aid are not entirely encouraging. Use of
national systems remains limited, with only 45%
of aid channelled through national public financial
management systems (the 2010 target is 80%). In some
cases, donors are not using national systems even when
they have been strengthened. Donor coordination is
often still rudimentary. In 2007, the fifty-four countries
received more than 14,000 donor missions, of which
only 20% were jointly coordinated.
Progress towards greater coordination has been more
evident in education than many other areas. Even so,
the rate of progress has been both erratic and uneven –
and far more needs to be done. In Cambodia, only 39%
of donor missions in education in 2007 were jointly
conducted, raising transaction costs for the host
government.
While all donors stress their commitment to the
alignment of aid with national priorities and the use
of national systems, outcomes have been variable.
Progress has proved far from straightforward, with
frustrations and concerns on both sides. Donors often
point to worries over corruption and weak capacity.
For their part, many aid recipients complain about what
they see as unrealistic donor demands and onerous
reporting requirements.
Emerging aid modalities have the potential to resolve
these problems. In the best cases, improved national
management systems, greater sector coherence, better
oversight and coordination of donor activity, and more
innovative approaches to finance are coming to the fore.
Important achievements have already been made in
some countries, including Burkina Faso, Cambodia,
India and Mozambique. Successful implementation of
the Paris agenda will require commitment and flexibility
on both sides, with donors avoiding the use of financial
support to leverage change.
2 0

OV E R V I E W
Chapter 5Conclusions andrecommendations
Delivering on the pledges set out in the Dakar
Framework for Action will require strong political
leadership, a sense of urgency and practical strategies.
The final chapter of this Report sets out some of
the key priorities. While avoiding blueprints, it identifies
principles for good practice, including the following:
Get serious about equity. Many governments have
not given sufficient weight to policies aimed at
overcoming inequalities in education. Setting time-
bound ‘equity targets’ aimed at reducing disparities
based on wealth, gender, language and other
markers for disadvantage, and carefully monitoring
progress, would help to focus political attention.
At the same time, education planning has to put far
higher priority on pro-poor public spending and the
development of incentives targeted at the poorest
and most disadvantaged.
Strengthen the links between education planningand poverty reduction strategies. Education policies
can make an important difference in equalizing
opportunity and reducing disadvantage. However,
progress in education depends critically on progress
in other areas, including poverty reduction, nutrition
and public health. While education sector planning
has become stronger, it remains weakly integrated
with wider poverty reduction strategies.
Reinforce the commitment to quality educationfor all. Progress on expanded access to schools is
outstripping improvements in quality. Policy-makers
should renew and strengthen the Dakar commitment
to quality in education and put in place the
infrastructure, teacher support and monitoring
programmes needed to deliver results.
Act on the commitment to equity in financing.
Many governments have failed to develop pro-poor
public spending patterns and decentralization reforms
have often exacerbated inequalities in education.
Looking to the future, it is important for governments
to develop approaches that avoid these outcomes.
Central government needs to retain its capacity
for redistribution from wealthier to poorer regions
and subnational bodies need to ensure that spending
plans reflect a national commitment to EFA.
Recognize the limits to choice and competition.
The development of quasi-markets in education
and the rapid emergence of low-fee private providers
are not resolving underlying problems in access,
equity or quality. While many actors have a role
to play in education provision, there is no substitute
for a properly financed and effectively managed state
education system, especially at primary level.
Deliver on aid commitments. The donor community
needs to recognize the wide-ranging benefits of
accelerated progress towards EFA and to close the
aid financing gap. At a conservative estimate, this
means increasing aid to basic education by around
US$7 billion annually and acting on the commitments
undertaken in 2005. Closing the projected 2010
financing gap of US$2.2 billion in countries with plans
approved by the Fast Track Initiative is another
priority. Strengthening the commitment of some
key donors to equity in aid allocations would help
to cut the financing deficits.
2 1

90
02
Education f
or A
ll G
lobal M
onitorin
g R
eport
2 2
Planting the seeds forsuccess: teaching youngchildren about healthyeating, in Zimbabwe
© G
iaco
mo
Pir
ozzi
/PAN
OS

2 3
9002Education for All Global Monitoring Report
Chapter 1
Education for all: human right and catalyst for development
The international community has adopted ambitious
targets for human development. Objectives set under
the Millennium Development Goals (MDGs) include the
halving of extreme poverty, a two-thirds reduction in
child mortality, universal primary education and greater
gender equality. The deadline for delivering results
is 2015. On current trends, most of the targets will
be missed. Accelerated progress towards Education
for All, with a strengthened focus on equity, could
change this picture. But governments must act with
a renewed sense of urgency and political commitment.
This chapter looks at the issues at stake.

Introduction .......................................................................................................... 24
Educational opportunity: highly polarized .................................................................................... 26
Unlocking the wider benefits of education .................................................... 29
Conclusion .................................................................................................................. 37
90
02
Education f
or A
ll G
lobal M
onitorin
g R
eport
C H A P T E R 1
Introduction
Almost two decades have passed since
governments gathered at the World Conference
on Education for All (EFA) in Jomtien, Thailand,
to reaffirm the human right to education. They
set bold targets – but outcomes fell far short of
ambition. In 2000, the 164 governments assembled
at the World Education Forum in Dakar, Senegal,
adopted another set of ambitious goals on
education. The Dakar Framework for Action
pledges to expand learning opportunities for every
child, youth and adult, and to meet targets in six
areas by 2015. With the deadline now just six years
away, will it be different this time around?
Accelerating progress towards education for all
is one of the defining development challenges of
the early twenty-first century. The right to education
is a basic human right. Like any human right, it
should be protected and extended as an end in
itself. But education is also a means to wider ends.
Prospects for reducing poverty, narrowing extreme
inequalities and improving public health are heavily
influenced by what happens in education. Progress
towards the equalization of opportunity in education
is one of the most important conditions for
overcoming social injustice and reducing social
disparities in any country. It is also a condition
for strengthening economic growth and efficiency:
no country can afford the inefficiencies that arise
when people are denied opportunities for education
because they are poor, female or members
of a particular social group. And what is true
at a national level also applies internationally.
Prospects for achieving more equitable patterns
of globalization are heavily influenced by
developments in education. In an increasingly
interconnected and knowledge-based world
economy, the distribution of opportunities for
education will inevitably have an important bearing
on future patterns of international wealth
distribution.
Some benefits of education are less tangible and
harder to quantify than others. Schools are not just
institutions for imparting information. They are
a place where children can acquire social skills
and self-confidence, where they learn about their
countries, their cultures and the world they live in,
and where they gain the tools they need to broaden
their horizons and ask questions. People denied
an opportunity for achieving literacy and wider
2 4

E D U C AT I O N F O R A L L : H U M A N R I G H T A N D C ATA LYS T F O R D E V E L O P M E N T
education skills are less equipped to participate
in societies and influence decisions that affect their
lives. That is why broad-based education is one
of the foundations for democracy and government
accountability, and why it is such a vital input for
informed public debate in areas – such as
environmental sustainability and climate change –
that will have a bearing on the well-being of future
generations.
The Dakar Framework is not the only pledge on
the international development agenda. At the
United Nations Millennium Summit, also in 2000,
world leaders adopted eight Millennium
Development Goals (MDGs). These wide-ranging
goals extend from the reduction of extreme poverty
and child mortality to improved access to water
and sanitation, progress in cutting infectious
diseases and strengthened gender equality.
The goals are linked to the achievement of specific
targets by 2015. In the area of education, the
MDGs offer a highly restricted version of the goals
adopted at Dakar. They include a commitment
to achieve universal primary school completion
and gender parity at all levels of schooling by 2015.
At one level the MDG framework is too narrow.
EFA means more than five or six years in primary
school and more than gender parity, vital as both
goals are. The quality of education and learning
achievement, access to secondary and post-
secondary opportunities, literacy and gender
equality, in a broader sense, are all important as
well. Yet the Dakar Framework targets and the
MDGs are complementary. Progress in education
depends on advances in other areas, including the
reduction of extreme poverty, the achievement of
gender equity and improvements in child health.
The links in this direction are obvious but often
forgotten. Children whose lives are blighted by
hunger, poverty and disease are clearly not
equipped to realize their potential in education.
Without advances across the broad front of MDG
targets, the ambition of education for all cannot
be realized. By the same token, progress towards
many of the MDG targets depends critically on
progress in education. Halving poverty or cutting
child mortality by two-thirds by 2015 is not a
serious proposition in a situation of slow and
unequal progress towards the policy objectives
set out at Dakar. The goals adopted by
the international community are mutually
interdependent – failure in any one area increases
the likelihood of failure in all areas.
The interdependence between the MDGs and the
Dakar Framework has taken on a new importance.
In 2008 the world entered the second half of the
commitment period for both undertakings. Now just
seven years remain before the 2015 deadline –
and the world is off track on many of the targets.
On current trends, the goal of universal primary
education (UPE) by 2015 will not be achieved and
the pledges made at Dakar will be broken. Using a
partial projection covering countries that account for
just two-thirds of the 75 million primary school age
children out of school today, this Report estimates
that the countries will still have 29 million out
of school in 2015. That number has consequences
for the children and countries most immediately
affected. But it also has consequences for the
entire MDG project. Bluntly stated, the targets
set for cutting child and maternal death, reversing
the spread of infectious disease and reducing
poverty will not be achieved unless governments act
decisively on education. Conversely, accelerated
progress on the wider MDGs would strengthen
prospects in education by lessening the poverty,
nutrition and health handicaps that millions
of children take with them into school.
In September 2008, governments from around the
world gathered at a United Nations summit in New
York to reaffirm their commitment to the MDGs.
The summit was prompted by a recognition that,
without fundamental change, the development goals
will not be achieved. Averting that outcome and
restoring the momentum behind international
partnerships for development will require more
than encouraging communiqués. What is needed
is a sense of urgency, political leadership and
practical strategies.
Strengthening the commitment to the education
goals set out in the Dakar Framework for Action is
one of the most pressing priorities. Much has been
achieved since 2000. Indeed, education has a strong
claim to being counted as an MDG success story.
Progress towards UPE and gender parity has been
far more rapid than advances in other areas, such
as nutrition or child and maternal mortality. One
of the problems for EFA identified in Chapter 2 is
precisely the failure of many countries to move
more rapidly towards the MDG targets in these
areas. But the relative success of education should
not deflect attention from the size of the potential
2015 shortfalls in UPE. Making up these shortfalls
would act as a powerful catalyst for accelerated
progress towards the MDGs.
Children whose
lives are blighted
by hunger, poverty
and disease
are clearly not
equipped to realize
their potential
in education
2 5
I n t r o d u c t i o n

90
02
Education f
or A
ll G
lobal M
onitorin
g R
eport
C H A P T E R 1
The backdrop for the September 2008 MDG
summit was an unprecedented crisis in
international financial markets. The fallout from
that crisis remains uncertain. Governments are
taking far-reaching measures to stabilize banking
systems. The scale and urgency of their actions
were guided by a recognition that, when financial
markets fail, the contagion effects can spread
rapidly across all aspects of society and the real
economy. Analogies with education system failure
are inexact but instructive. When education
systems fail to reach large sections of the
population, when children are denied opportunities
by virtue of their gender, the income of their
parents, their ethnicity or where they happen
to live, or when schools deliver chronically
substandard learning outcomes, there are also
contagion effects. Those effects are not reflected
in highly visible bank collapses, fluctuating share
prices or mortgage failures. But there are real
human, social and economic consequences.
Education system failures weaken the real
economy, holding back productivity and growth.
They undermine efforts to reduce child and
maternal mortality, contributing to loss of life
and increased health risks. And they contribute
to social polarization and the weakening of
democracy. Yet despite the high stakes and
the costs of inaction, few governments treat the
crisis in education as an urgent priority – in stark
contrast to their response to financial market
problems. This is an area in which national and
international leadership is needed to place
education firmly at the centre of the political
agenda.
The EFA Global Monitoring Report was first
published in 2002 to track progress towards the
six EFA goals enshrined in the Dakar Framework
for Action. Since its inception it has covered each
of the goals. This year the Report looks beyond the
goals to a range of issues in education governance,
finance and management. It focuses on the critical
importance of equity in educational opportunity
because equity should be an overarching public
policy goal – and because deep inequalities
in education threaten to undermine progress
towards both the EFA goals and the MDGs.
Educational opportunity:highly polarized
The distribution of educational opportunity plays a
key role in shaping human development prospects.
Within countries, governments and people
increasingly recognize that unequal opportunities
for education are linked to inequalities in income,
health and wider life chances. And what is true
within countries is true also between countries.
Large global disparities in education reinforce
the extreme divides between rich and poor nations
in income, health and other aspects of human
development.
The full extent of the gulf in opportunities for
education is not widely appreciated. Education
is a universal human right. However, enjoyment
of that right is heavily conditioned by the lottery
of birth and inherited circumstance. Opportunities
for education are heavily influenced by where one
is born and by other factors over which children
have no control, including parental income,
gender and ethnicity.
From a global perspective, being born in a
developing country is a strong indicator for reduced
opportunity. School attainment, measured in terms
of the average number of years or grade reached
in education, is one (admittedly limited) measure
of global inequality. While almost all member
countries of the Organisation for Economic
Co-operation and Development (OECD) have
achieved universal school attainment to grade 9,
most countries in developing regions are far from
this position. Age-specific school attendance
pyramids that plot the distribution of age and
grades graphically illustrate the contrast in average
life-chances for education associated with being
born in the OECD countries or in sub-Saharan
Africa (Figure 1.1). By age 7, almost all children
in the OECD countries are in primary school,
compared with 40% for sub-Saharan Africa.
At age 16, over 80% of the population of the OECD
countries is in secondary school while one-quarter
of sub-Saharan Africa’s population is still in primary
school. Four years later, at age 20, around 30%
of the OECD population is in post-secondary
education. The figure for sub-Saharan Africa is 2%.
Stark as they are, these figures tell only part
of the story. One way of thinking about unequal
opportunity is to consider the chance that a child
Few governments
treat the crisis in
education as an
urgent priority,
in stark contrast
to their response
to financial
market problems
2 6

E D U C AT I O N F O R A L L : H U M A N R I G H T A N D C ATA LYS T F O R D E V E L O P M E N T
born in one country has of achieving a given level of
education relative to a child born somewhere else.
Chapter 2 draws on international data to compare
educational opportunities across countries.
The results are striking. They show that children
in countries such as Mali and Mozambique have
less chance of completing a full primary cycle than
children in France or the United Kingdom have of
reaching tertiary education. The gulf in attainment
is not restricted to sub-Saharan Africa. Around
one in five pupils entering primary school in Latin
America and in South and West Asia does not
survive to the last primary grade.
Global inequalities in education mirror inequalities
in income. The association is not coincidental.
While the relationship between education and
wealth creation is complex, knowledge is an
important driver for economic growth and
productivity (see below). In an increasingly
knowledge-based international economy, disparities
in education are taking on more importance. There
is a growing sense in which today’s inequalities
in education can be seen as a predictor for
tomorrow’s inequalities in the global distribution
of wealth, and in opportunities for health and
employment. The fact that in half the countries
of sub-Saharan Africa the survival rate to
the last grade of primary school is 67% or less
is not irrelevant to prospects for overcoming the
region’s marginalization in the global economy.
Inequalities within countries create an even starker
picture of disparities in opportunity. Data on
national average life chances in education have the
effect of masking the distribution of life chances
across different groups in society. When within-
country distribution is superimposed on cross-
country disparity, the effect is to magnify the scale
of inequality.
To illustrate this point the EFA Global Monitoring
Report 2009 has created a composite regional
picture of the distribution of attainment across
income groups using national household survey
data. Figure 1.2 presents attainment curves at the
polar ends of the distribution for the richest and
poorest 20%. Once again the results are striking.
They show that only around half of the poorest 20%
in sub-Saharan Africa, and South and West Asia
progress to grade 5, compared with over 80% for
the wealthiest quintile. Being born into the poorest
20% of the wealth distribution in sub-Saharan
Africa, or in South and West Asia, more than halves
2 7
E d u c a t i o n a l o p p o r t u n i t y : h i g h l y p o l a r i z e d
age 24age 23age 22age 21age 20age 19age 18age 17age 16age 15age 14age 13age 12age 11age 10age 9age 8age 7age 6
age 24age 23age 22age 21age 20age 19age 18age 17age 16age 15age 14age 13age 12age 11age 10age 9age 8age 7age 6
0% 20% 40% 60% 80% 100%100% 80% 60% 40% 20%
OECD countries Sub-Saharan Africa
Proportion enrolled by age and level of education
Primary Secondary Post-secondary
Figure 1.1: Age-specific attendance rates by level in OECD countries
and sub-Saharan Africa, 2000–20061
1. Weighted averages. Data are for the most recent year available during the period.Sources: Calculations based on OECD (2008b); World Bank (2008b).
Sub-Saharan Africa, Q5
1 2 3 4 5 6 7 8 920
40
60
80
100
Grad
e at
tain
men
t (%
)
Latin America/Caribbean, average
Latin America/Caribbean, Q1
Latin America/Caribbean, Q5
South and West Asia, average
South and West Asia, Q1
South and West Asia, Q5
Sub-Saharan Africa, average
Sub-Saharan Africa, Q1
Grade
Figure 1.2: Grade attainment among 10- to 19-year-olds in Latin America
and the Caribbean, South and West Asia, and sub-Saharan Africa, 2000–20061
Note: Q1 is the poorest quintile, Q5 the richest.1. Weighted averages. Data are for the most recent year available during the period.Source: World Bank (2008b).

90
02
Education f
or A
ll G
lobal M
onitorin
g R
eport
C H A P T E R 1
the chance of school attendance at grade 9.
While the wealthiest 20% in Latin America achieve
attendance levels close to those in the OECD
countries at grade 9, the poorest 20% are closer
to the average for sub-Saharan Africa. These
income-based disparities are mirrored in
differences in average years of education attained
by the people aged 17 to 22. In Mozambique,
someone in the poorest 20% has on average
1.9 years of education, compared with 5 years for
someone from the richest 20%. In Peru, the gap
between rich and poor is 4.6 years of schooling,
rising to 6.7 years in India (Table 1.1).
Income-based disparities such as those charted
above are not the only type of disparity in education.
Inherited disadvantages linked to gender, ethnicity,
location and other factors are also important.
These disadvantages intersect with income-based
differences, restricting opportunity and transmitting
educational disadvantage and poverty across
generations. One of the central messages
of this Report is that national governments and
international development agencies need to
strengthen the focus on equity in order to achieve
the core goals in the Dakar Framework for Action.
Unequal distribution of education has wider
consequences. Income-based gaps in educational
opportunity reinforce income inequalities and
the social divisions that come with them. They
also mean the benefits associated with education
in areas such as public health, employment and
participation in society are unequally distributed.
The human costs of these inequalities are
cumulative and cross-generational. For example,
the fact that women account for the majority of
illiterate people in the world today is a reflection of
historical gender disparities in access to education.
But when women who have been denied an
education become mothers, their children also
inherit diminished life chances: they are less likely
to survive, more likely to experience ill health and
less likely to go to school than the children of
mothers who have education.
Quality counts
Some inequalities are easier to measure than
others. Headcount indicators covering the number
of children in school or completing grades allow
for relatively straightforward comparisons from
country to country. Learning achievement indicators
and comparisons pose more of a problem. Although
global and regional learning assessments are
expanding to cover more countries, information
remains sparse and insufficiently available
in forms that allow for straightforward global
comparisons. Put differently, quantity is easier
to measure than quality – yet in the last analysis,
it is quality that counts. Ultimately, what matters
is the degree to which schooling supports cognitive
development, facilitates skills acquisition and
enriches children’s lives.
Qualitative inequalities are probably narrowing
far more slowly than quantitative gaps. Large
though it remains, basic headcount inequality
is falling at the primary and secondary levels.
Convergence is the order of the day. Developing
countries are catching up on enrolment,
attendance and completion, albeit unevenly and
often from a low base. One reason for this is
obvious: rich countries cannot exceed universal
coverage at the primary and secondary levels,
so any gain by developing countries narrows
the gap. However, school attainment has to be
adjusted for the quality of education. When it
comes to learning achievements and outcomes,
an average school year in Zambia is clearly not the
same as an average school year in, say, Japan or
Finland. There is compelling international evidence
(discussed further in Chapter 2) that completing
six or even nine years of schooling in developing
countries does not assure the development of
The human costs
of economic,
social and
educational
inequalities
are cumulative
and cross-
generational
2 8
3.7 8.10.8 5.61.6 7.43.2 9.21.9 8.34.4 11.10.4 4.81.9 5.02.5 9.23.9 9.96.5 11.16.3 11.03.9 8.14.0 9.0
Bangladesh, 2004Burkina Faso, 2003Ethiopia, 2005Ghana, 2003Guatemala, 1999India, 2005Mali, 2001Mozambique, 2003Nicaragua, 2001Nigeria, 2003Peru, 2000Philippines, 2003U.R. Tanzania, 2004Zambia, 2001
Table 1.1: Average years of education for
poorest and richest 20% of 17- to 22-year-olds,
selected countries, most recent year
Source: Demographic and Health Surveys, calculations by Harttgen et al. (2008).
(years)
Poorest 20% Richest 20%

E D U C AT I O N F O R A L L : H U M A N R I G H T A N D C ATA LYS T F O R D E V E L O P M E N T
basic cognitive skills or even functional literacy and
numeracy (Filmer et al., 2006; Pritchett, 2004a).
International assessment tests provide a pointer
to the scale of global inequalities in learning
achievement. To take one example, the OECD
Programme for International Student Assessment
(PISA) survey of reading and literacy skills places
the median achievement in developing countries
such as Brazil and Peru in the lowest 20% of the
distribution for many OECD countries. One recent
study of basic educational achievement found very
high levels of functional illiteracy in mathematics
and science among secondary school students
in many developing countries. In Brazil, Ghana,
Morocco, Peru and South Africa, fewer than 60%
of children in school reached basic competency
thresholds (Hanushek and Wößmann, 2007).
Factoring in children out of school would be
expected to lower the average performance.
At primary level, recent surveys in Ghana and
Zambia have found that fewer than 60% of young
women who completed six years of primary school
could read a simple sentence in their own
language. Similarly, assessment exercises
in countries including India and Pakistan found
that over two-thirds of pupils at grade 3 level
were unable to write a simple sentence in Urdu.
Incorporating data on qualitative achievement
magnifies the inequalities associated with
quantitative attainment.
Education quality is important both in
understanding the distribution of life chances
in society and in charting the scale of global
inequality in education. The bottom line is that EFA
cannot be interpreted, as the MDGs sometimes
are, as a simple matter of getting all children
into school. It goes without saying that this is
important. But it is what children get out of school
that will shape their life chances.
Unlocking the wider benefits of education
There are many good reasons for governments
committed to the MDGs to renew their commitment
to the Dakar Framework for Action. First and
foremost, education is a human right and an
important goal in its own right. It is central to the
development of human capabilities – people’s
potential to choose lives that they value (Sen, 1999).
Beyond this intrinsic importance, there are strong
two-way links between education and progress in
areas where the world is off track on the MDG targets.
None of this is to imply that the links between
education and social or economic benefits are
automatic. The impact of education is strongly
conditioned by other factors, from macroeconomic
and labour market conditions to the state of public
health provision and levels of inequality based on
wealth, gender and other factors. The benefits of
education are likely to be greatest in contexts marked
by broad-based economic growth, a strong political
commitment to poverty reduction, high levels of
equity in access to basic services, and a commitment
to democratic and accountable governance.
Economic growth, poverty reduction and equity
The links between education and economic growth,
income distribution and poverty reduction are well
established. Education equips people with the
knowledge and skills they need to increase income
and expand opportunities for employment. This is
true for households and for national economies.
Levels of productivity, economic growth and patterns
of income distribution are intimately linked to the
state of education and the distribution of educational
opportunity. Increasing global economic
interdependence and the growing importance of
knowledge-based processes in economic growth
have raised both the premium on education and
the cost associated with education deficits.
All this has important implications for the
international development goal of halving extreme
poverty (MDG 1). The rate of poverty reduction is a
function of two variables: the overall rate of economic
growth and the share of any increment in growth
that is captured by the poor (Bourguignon, 2000).
Education has a bearing on both sides of the
equation. Improved access to good quality learning
It is what children
get out of school
that will shape
their life chances
2 9
U n l o c k i n g t h e w i d e r b e n e f i t s o f e d u c a t i o n

90
02
Education f
or A
ll G
lobal M
onitorin
g R
eport
C H A P T E R 1
opportunities can strengthen economic growth
by raising productivity, supporting innovation and
facilitating the adoption of new technology. And
broad-based access to good quality basic education
is one of the foundations for broad-based growth,
since it enables poor households to increase their
productivity and secure a greater stake in national
prosperity. Recent research, discussed in the
following subsections, confirms earlier findings
on the key role of education in poverty reduction
and highlights the critical importance of quality.
Economic growth
No country has ever reduced poverty over the medium
term without sustained economic growth. Education
plays a critical role in producing the learning and
skills needed to generate the productivity gains that
fuel growth. One recent research exercise draws
attention to the importance for economic growth
of both years in school and learning outcomes.
Modelling the impact of attainment in fifty countries
between 1960 and 2000, the study found that an
additional year of schooling lifted average annual
gross domestic product (GDP) growth by 0.37%. The
impact of improved cognitive skills was considerably
larger, with the combined effect adding, on average,
a full percentage point to GDP growth (Hanushek
et al., 2008; Hanushek and Wößmann, 2007). There
is also some evidence that the impact of gains in
education quality on cognitive skills may be larger
in developing than in developed countries.
Education quality has a significant impact on
economic returns for households as well. Research
in fifteen countries participating in the International
Adult Literacy Survey (IALS) found that a standard
deviation in literacy (an indicator for quality) had a
larger effect on wages than an additional year of
schooling – confirmation that it is outcomes which
count (Denny et al., 2003).
Individual earnings. A large body of evidence points
to high returns on investment in education. The
scale of these returns is a matter for debate. One
cross-country exercise found each additional year of
education increasing earnings by 10%, with variations
that reflect underlying conditions: returns are higher
for low-income countries, for lower levels of schooling
and for women (Psacharopolous and Patrinos, 2004).
Other research has generated different results both
overall and by level of education (Bennell, 1998).
As these differences indicate, findings on returns
to education are influenced both by methodological
factors, and by economic conditions. Broadly, as
countries move towards UPE, returns at the primary
level tend to fall as the national skills deficit shifts to
the secondary and tertiary levels – a phenomenon
widely observed in Latin America (Behrman et al.,
2003). In terms of public policy, there are limits to
relevance of rate of return analysis. The case for
investment in basic education is rooted in human
rights and ideas about citizenship, not in monetary
calculation. That said, there is compelling evidence
that private and public rates of return to education
at the primary and secondary levels are sufficiently
high to mark this out as a good investment for
society. In the agricultural sector, increases
in education are strongly associated with higher
wages, agricultural income and productivity –
all critical indicators for poverty reduction (Appleton
and Balihuta, 1996). In contrast to these potential
benefits, education inequalities based on gender
and other factors inflict real economic costs. In
Kenya it was found that increasing the education
and input levels of female farmers to those of male
farmers could increase yields by as much as 22%
(Quisumbing, 1996).
Income distribution. The distribution of educational
opportunity is strongly associated with income
distribution, though the underlying relationship
is highly variable and complex. This has important
implications for poverty reduction and the MDGs.
Economic growth matters because it raises average
income. The rate at which growth is converted into
poverty reduction depends on the share of any
increment to national income going to people living
in poverty. By raising the productivity of the poor,
more equitable education can increase overall
growth and the share of growth that accrues
to those below the poverty line.
Less equitable education can have an equal and
opposite effect. Evidence from the developed world
points towards inequality in education as a cause
of wider income inequalities. For example, over
the past three decades, growing wage differentials
between secondary school graduates and secondary
school dropouts has been a major source of rising
inequality and social polarization in the United
States (Heckman, 2008). With a greater proportion
of young Americans graduating from college and
a greater proportion dropping out of secondary
school, the skills gap is fuelling inequality.
Patterns of income inequality are conditioned by
private returns from different levels of education,
which in turn reflect developments in labour
Broad-based
access to good
quality basic
education
is one of the
foundations for
broad-based
growth
3 0

E D U C AT I O N F O R A L L : H U M A N R I G H T A N D C ATA LYS T F O R D E V E L O P M E N T
markets. Rapid increase in demand for people
with higher skills in countries with limited
secondary school completion and restricted access
to tertiary education can lead to pronounced
increases in inequality. In India, Indonesia, the
Philippines and Viet Nam rising wage inequalities
are closely linked to widening wage gaps between
people with tertiary education and those at lower
attainment levels (Asian Development Bank, 2007).
Similarly, evidence from Latin America suggests
that returns to secondary and tertiary education
are rising more rapidly than those to primary
education (Behrman et al., 2003).
Prevailing patterns of income distribution reinforce
the case for progress towards equalization of
educational opportunity. At global level, the poorest
40% of the world’s population, living on less than
US$2 a day, accounts for 5% of world income – and
the poorest 20% (living on less than US$1 a day) for
1.5% (Dikhanov, 2005). Even small shifts in the share
of global income going to the world’s poor could
have very significant effects for poverty reduction.
Measured in financial terms, it would take around
US$300 billion – less than 1% of world GDP –
to lift the billion people surviving on less than US$1
a day above the poverty line (UNDP, 2005).
Given the prevailing level of global inequality, this
would represent a modest degree of redistribution
for a large impact on poverty. Greater equity
in the distribution of educational opportunity could
facilitate that redistribution. What appears clear is
that more equitable patterns of global integration
cannot be built on the vast educational disparities
in evidence today.
The same broad conclusion holds true at the
national level. Over the past two decades there has
been a clear trend towards rising income inequality
within countries. Of the seventy-three countries
for which data are available, inequality has risen
in fifty-three, which account for 80% of the world
population. Many factors are involved, with
inequality in education linked to technological
change and wider forces. But the importance
of inequality in education as a driver of wider
inequality is increasingly recognized. When
education is broadly shared and reaches the poor,
women and marginalized groups, it holds out the
prospect that economic growth will be broadly
shared. Greater equity in education can help fuel a
virtuous cycle of increased growth and accelerated
poverty reduction, with benefits for the poor and
for society as a whole.
The relationship between education on the one
side and economic growth and poverty reduction
on the other illustrates the importance of context.
Schools and education systems are not guarantors
of faster growth or greater equity. Problems in
macroeconomic management and other policy
spheres may reduce the benefits of education.
In the Arab States, to take a case in point, regional
evidence points to a weak association between
the expansion of education and productivity (World
Bank, 2008d). Increasing the supply of skilled
labour in an economy marked by low productivity,
stagnation and rising unemployment markedly
diminishes the private returns to schooling.
It can also give rise to large populations of educated
unemployed youths and graduates. In Egypt,
adults with secondary education account for
42% of the population but 80% of the unemployed
(World Bank, 2008d).
Other labour market factors are also important.
Education can benefit individuals by facilitating
entry into higher-earning occupations and raising
earnings within an occupation. To the extent that
these two benefits accrue equally to women and
men, education can help promote gender equality
in earnings. However, discrimination and distortions
in the labour market based on gender can negate
the equalizing effects of education. In Pakistan,
women lag far behind men in labour force
participation, are concentrated in a much narrower
set of occupations, perform mostly unskilled jobs
and have substantially lower earnings. While
women’s earnings are lower than men’s at all
levels of education, the economic returns to
education and skills defined in terms of the
earnings increment from an extra year of schooling
are greater for Pakistani women than for men in all
occupations (except agriculture), so that education
is associated with reduced gender gaps in earnings.
But women’s participation in the labour market
increases only after ten years of education –
and only about 10% of Pakistani women have had
ten or more years of education (as of the early
2000s). Thus gender barriers to labour market
entry, the narrowness of female occupations and
limited opportunities for education are diluting
the equality-promoting benefits of education in
Pakistan (Aslam et al., forthcoming).
Many factors can weaken the relationship between
more education on the one side and faster,
broader-based growth on the other. An increase in
the average number of years in school is not always
Discrimination in
the labour market
based on gender
can negate the
equalizing effects
of education
3 1
U n l o c k i n g t h e w i d e r b e n e f i t s o f e d u c a t i o n

90
02
Education f
or A
ll G
lobal M
onitorin
g R
eport
C H A P T E R 1
a good proxy for human capital formation. Where
education quality is poor and levels of learning
achievement are low, the real skills base of the
economy may not increase. Rising enrolment and
school completion can have a marginal bearing on
human capital. Similarly, increases in the average
number of years spent in education will not result in
more equitable income distribution if large sections
of the population are left behind. What matters in
this context is the degree to which the poor are
catching up in education with the non-poor. The
bottom line is that average years in school is an
important indicator of human capital but not the
only indicator. Quality and equity are also critical.
It is important to recognize the limits to the current
state of knowledge on the emerging relationship
between education on the one side and economic
growth and poverty reduction on the other. Economic
modelling exercises can tell us something important
about this relationship on the basis of past evidence.
The future is always uncertain – but it will not look
like the past. Globalization and the increased weight
of knowledge-based factors in driving economic
growth have important consequences for wealth
distribution and poverty reduction nationally and
internationally. If knowledge is increasingly
recognized as the key to competitiveness,
employment and long-term growth prospects,
learning endowments become ever more important.
In the context of rapidly changing national
and international economic structures, there is a
premium on the acquisition of transferable skills
and knowledge.
Lifelong learning, a core EFA goal, is the critical
condition for adjustment to knowledge-based
economic life. People and countries need formal
education systems that give them opportunities to
build their learning skills. And they need opportunities
to continually renew their skills and competencies.
While literacy and numeracy remain the foundations
for all education systems, human development
and prosperity in the twenty-first century will rest
increasingly on the spread of secondary and
post-secondary learning opportunities.
Public health and child mortality: both linked to education
The links between education and public health are
well established. Improved education is associated
with lower levels of child mortality and better
nutrition and health, even when controlling for
factors such as income. The transmission
mechanisms from education to benefits in
these areas are often complex and imperfectly
understood. However, empowerment effects are
important. Education can equip people with the
skills to access and process information, and with
the confidence to demand entitlements and hold
service providers to account. Whatever the precise
channels of influence, there are compelling
grounds for placing EFA at the centre of strategies
for getting the world on track towards achieving
the health-related MDGs.
Child mortality. One of the international
development targets is to reduce the child mortality
rate by two-thirds (MDG 4). The developing world
is so far off track that very deep cuts in death rates
will be required to bring the 2015 goal within reach.
At current rates of progress, many countries in
sub-Saharan Africa and South Asia will not achieve
the target until 2050 or later. Failure to close the
gap between existing trends and the target will cost
lives: the projected gap for 2015 is equivalent to
4.7 million deaths (see Chapter 2). Overcoming
gender gaps and getting young girls into school,
an imperative in itself, is also one of the most
effective strategies for closing the gap.
The association between maternal education and
child mortality is irregular. Having a mother with
primary education reduces child death rates by
almost half in the Philippines and by around one-
third in Bolivia. In other countries, such as Ghana
and the Niger, primary education has more modest
effects. The strongest effects are at post-primary
level (Figure 1.3). Having a mother with secondary
education or higher dramatically reduces the risk
of child death in almost all countries, often far
more so than having a mother with just primary
schooling. This reinforces the argument for
education and gender equity goals that look beyond
the primary level. Leaving aside rights-based
arguments and the efficiency case for expanded
female access to secondary school, it is
increasingly clear that failure to expand opportunity
in this area will have grave consequences for public
health – and for progress towards the targets
identified in the MDGs.
What are the reasons behind lower death rates for
children of more educated women? Transmission
mechanisms vary by country, but they include
nutrition, birth spacing and the use of preventive
health interventions (Malhotra and Schuler, 2005).
To take one illustration, levels of education are
Improved
education is
associated with
lower levels of
child mortality
and better
nutrition
and health
3 2

E D U C AT I O N F O R A L L : H U M A N R I G H T A N D C ATA LYS T F O R D E V E L O P M E N T
positively associated in many countries with
vaccination levels among children (Figure 1.4).
Maternal mortality. Levels of education also
have an important bearing on maternal mortality.
Complications in pregnancy and childbirth are a
leading cause of death and disability among women
of productive age, claiming over 500,000 lives
a year. Trend analysis in maternal mortality
is problematic because of large margins of
uncertainty around the estimates. Nevertheless,
the best estimates for 1990–2005 show that
mortality rates are falling at a pace far below that
needed to achieve the target (MDG 5) of a 75%
reduction (WHO et al., 2007). Risk factors include
poor nutrition, anaemia and malaria.
The developing
world is off track
for cutting
child deaths
and maternal
mortality
3 3
U n l o c k i n g t h e w i d e r b e n e f i t s o f e d u c a t i o n
Jordan, 2002
Colombia, 2005
Honduras, 2005
Morocco, 2003/2004
Viet Nam, 2002
Egypt, 2005
Zimbabwe, 2005/2006
Dominican Rep., 2002
Indonesia, 2002/2003
Nepal, 2006
Philippines, 2003
India, 2005/2006
Bangladesh, 2004
Eritrea, 2002
Haiti, 2005
Ghana, 2003
Kenya, 2003
Cambodia, 2005
Ethiopia, 2005
Bolivia, 2003
Madagascar, 2003/2004
Senegal, 2005
U. R. Tanzania, 2004
Lesotho, 2004
Uganda, 2006
Malawi, 2004
Cameroon, 2004
Guinea, 2005
Zambia, 2001/2002
Burkina Faso, 2003
Mozambique, 2003
Congo, 2005
Rwanda, 2005
Niger, 2006
Nigeria, 2003
Under-5 mortality rate per 1,000 births
0 50 100 150 200 250 300
No education Primary Secondary or higher
Figure 1.3: Under-5 mortality rate by mother’s level
of education, selected countries, most recent year
Source: Macro International Inc. (2008).
Nigeria, 2003
Chad, 2004
Dominican Rep., 2002
Indonesia, 2002/2003
Ethiopia, 2005
Zimbabwe, 2005/2006
India, 2005/2006
Cameroon, 2004
Haiti, 2005
Viet Nam, 2002
Burkina Faso, 2003
Philippines, 2003
Bolivia, 2003
Mozambique, 2003
Lesotho, 2004
Cambodia, 2005
Malawi, 2004
U. R. Tanzania, 2004
Bangladesh, 2004
Nepal, 2006
Share of children with all vaccinations (%)
0 20 40 60 80 100
Primary Secondary or higherNo education
Figure 1.4: Child vaccination and mother’s level of education,
selected countries, most recent year (% of 1-year-olds having received
selected vaccines by the time of the survey)
Note: ‘All vaccinations’ = BCG (tuberculosis), measles and three doses of DPT and polio (excluding polio 0).Source: Macro International Inc. (2008).

90
02
Education f
or A
ll G
lobal M
onitorin
g R
eport
C H A P T E R 1
Good antenatal care can significantly reduce risk.
Apart from the direct benefits of pregnancy
monitoring, women who receive antenatal care are
more likely to use other health services, opt for
institutional delivery and seek professional advice for
post-delivery health complications (Ram and Singh,
2006). It should be emphasized that the relationship
between antenatal care and maternal welfare is
heavily influenced by the quality of the care, but
effective provision can sharply reduce both maternal
and infant mortality (Carolli et al., 2001; Osungbade
et al 2008). Education is important because it is
positively associated with recourse to antenatal
services. This is true for both primary and secondary
education, though once again some of the most
pronounced effects are to be found at secondary
level (Figure 1.5). The benefits of education are
transmitted through channels that range from
access to information to empowerment effects
and demand for entitlements. As in other areas,
the point to be stressed is not that improved access
to antenatal care justifies a strong public policy
emphasis on female education. The case for gender
equity is rooted in the fundamental human right
to education and not in incidental benefits. But any
country with a concern for accelerated progress
in child and maternal well-being should view the
evidence in Figure 1.5 as a useful measure of some
of the hidden costs of gender disparity in education.
Nutrition. Around one-third of children under 5
are stunted, with damaging consequences for
cognitive development and health, and often fatal
consequences for life (Chapter 2). Stunting is one
proxy for hunger, which the development goals
aim to halve by 2015 (MDG 1). Here, too, the world
is off track, and sub-Saharan Africa and South Asia,
the regions with the highest rates of stunting, have
made the least progress. Cross-country evidence
suggests education is powerful protection against
stunting. Recent research using household survey
data found that having a mother who had completed
primary education reduced the risk of stunting by
22% in Bangladesh and 26% in Indonesia (Semba
et al., 2008). This was after controlling for factors
such as household wealth, location and family size.
Higher levels of parental education in both countries
are associated with greater uptake of a range of
health inputs, including childhood immunization,
Vitamin A intake and use of iodized salt.
Other empowering effects mediating between
maternal education and the physical growth of
children have been observed. One potential pathway
involves the association between increased
maternal education and the decision-making
authority of mothers in claiming resources within
the household. In many contexts, mothers are more
likely than fathers to allocate household resources
in ways that promote child nutrition (Huq and
Around one-third
of children
under age 5
are stunted,
with damaging
consequences
for cognitive
development
and health
3 4
Ethiopia, 2005
Chad, 2004
Bangladesh, 2004
Nigeria, 2003
Niger, 2006
Viet Nam, 2002
Egypt, 2005
Morocco, 2003/2004
Cambodia, 2005
Cameroon, 2004
Bolivia, 2003
India, 2005/2006
Eritrea, 2002
Madagascar, 2003/2004
Nepal, 2006
Mali, 2006
Congo, 2005
Philippines, 2003
Burkina Faso, 2003
Kenya, 2003
Colombia, 2005
Haiti, 2005/2006
Mozambique, 2003
Lesotho, 2004
Honduras, 2005
Guinea, 2005
Benin, 2006
Indonesia, 2002/2003
Jordan, 2002
Children under 3 born without any antenatal care (%)
0 10 20 30 40 50 60 70 80
No education Primary Secondary or higher
Figure 1.5: Antenatal care by mother’s level of education,
selected countries, most recent year
Source: Macro International Inc. (2008).

E D U C AT I O N F O R A L L : H U M A N R I G H T A N D C ATA LYS T F O R D E V E L O P M E N T
Tasnin, 2008). As Figure 1.6 shows, the inverse
relationship between stunting and maternal
education holds across a large group of countries
and all developing regions.
HIV/AIDS. The development goals call for countries
to ‘halt and begin to reverse the spread of HIV/AIDS’
(MDG 6). There is strong evidence that primary
education has a significant positive impact on
knowledge of HIV prevention, with secondary
education having an even stronger impact (Herz
and Sperling, 2004). One study, covering thirty-two
countries, found that women with post-primary
education were five times more likely than illiterate
women to know about HIV/AIDS (Vandemoortele
and Delmonica, 2000). Education systems could
play a far more active and effective role in
combating HIV/AIDS through teaching and
awareness-raising about risky behaviour.
Each of the areas considered above illustrates
the potential for education to accelerate progress
towards the MDG targets. In important respects,
though, static pictures of the potential benefits hide
some of the dynamic gains over time. For example,
increased female access to education generates
cumulative benefits linked to cross-generational
effects because the level of maternal education
is one of the strongest determinants of whether
daughters enrol in school (Alderman and King,
1998; UN Millennium Project, 2005a). Unfortunately,
costs are also cumulative. Just as the world today
would have far lower levels of child mortality
and stunting had there been greater progress
in education during the 1990s, so the education
deficits of today will result in human costs in the
future. Improving educational opportunity,
especially for girls, is not only a priority in its own
right but also essential for improving educational
outcomes in the next generation – and for reaching
wider goals in public health and nutrition.
Democracy and citizenship — from local to global
Education is about much more than what happens
in schools. Through education, societies inculcate
their values and ideas, and equip their citizens
with skills. This year’s Report focuses on education
governance. Yet education itself is intimately linked
to wider governance issues in society – and to
the empowerment of people. As Nelson Mandela
has put it: ‘Education is the most powerful weapon
which you can use to change the world.’
The education
deficits of today
will result
in human costs
in the future
3 5
U n l o c k i n g t h e w i d e r b e n e f i t s o f e d u c a t i o n
% of severely stunted children1
Sub-Saharan Africa
Arab States
South and West Asia
Latin America and Caribbean
Senegal, 2005
Uganda, 2006
Ghana, 2003
U. R. Tanzania, 2004
Cameroon, 2004
Kenya, 2003
Mali, 2006
Eritrea, 2002
Burkina Faso, 2003
Benin, 2006
Congo, 2005
Mozambique, 2003
Rwanda, 2005
Ethiopia, 2005
Chad, 2004
Madagascar, 2003-2004
Malawi, 2004
Zambia, 2001/2002
Nigeria, 2003
Niger, 2006
Lesotho, 2004
Jordan, 2002
Morocco, 2003/2004
Egypt, 2005
Nepal, 2006
Bangladesh, 2004
India, 2005/2006
Dominican Rep., 2002
Colombia, 2005
Haiti, 2005/2006
Bolivia, 2003
Honduras, 2005
0 5 10 15 20 25 30
No education Primary Secondary or higher
Figure 1.6: Severe stunting among children under 3 by mother’s
level of education, selected countries, most recent year
1. Severe stunting is defined as a height-for-age score below minus 3 standard deviations from the reference median (see glossary).Source: Macro International Inc. (2008).

90
02
Education f
or A
ll G
lobal M
onitorin
g R
eport
C H A P T E R 1
Some of the most powerful effects of education
operate through the channels of democracy and
participation. History provides plenty of evidence
that the effects are neither universal nor
straightforward. There are numerous examples,
past and present, of societies with a well-educated
citizenry that might not be considered model
democracies. And there are countries with relatively
low levels of education, as measured by indicators
for literacy and average years in school, that have
a well-developed democratic tradition. India is an
example. Yet education is conducive to democracy.
It has the potential to equip people with the skills,
attitudes and norms needed to hold governments
to account, to challenge autocracy and to assess
policies that affect their lives (Glaeser et al., 2006).
At an individual level, education is a crucial
determinant of whether people have the capabilities
– the literacy, the confidence, the attitudes – that
they need to participate in society (Sen, 1999). As
a concrete example, when poor and marginalized
people are educated, they are often more likely
to participate in meetings of local political bodies
and devolved bodies managing education, health
and water resources (Alsop and Kurey, 2005).
It is not just education that matters for democracy.
Cross-country research has drawn attention to the
importance both of the average level of education
and the education attained by the majority of society
in creating the conditions for democracy (Castello-
Climent, 2006). Recent evidence from sub-Saharan
Africa is instructive. Analysis of national survey
data in Malawi found that even primary schooling
promotes citizen endorsement of democracy and
rejection of non-democratic alternatives (Evans and
Rose, 2007b). Research into relationships between
education and democratic attitudes in eighteen
countries of sub-Saharan Africa strongly reinforces
this finding (Evans and Rose, 2007a). Controlling
for a wide range of factors, including religion, age,
gender and political preference, schooling emerged
as by far the strongest social factor explaining
adherence to democratic attitudes. Moreover,
the education effects increase in a linear form with
the levels of education attained. People of voting
age with a primary education are 1.5 times more
likely to support democracy than people with no
education, rising to three times more likely for
someone with secondary education. Here, too,
the democratizing effects of education appear
to operate through the channels of participation
and information: more education is significantly
associated with increased political discussion,
political knowledge and access to political
information from the media.
Due caution has to be exercised in extrapolating
lessons from research in a group of countries in
one region and applying them to other regions.
There is no one model for democratic governance,
let alone a universal blueprint for the development
of democratic institutions. Even so, the evidence
for Africa strongly suggests that investment in
education of good quality may be among the most
effective antidotes to autocracy and unaccountable
governance.
Links between education and citizenship go beyond
public attitudes towards democracy. One reason
education is conducive to democracy is that it can
facilitate the development of informed judgements
about issues that have to be addressed through
national policies. In any country, public debate and
scrutiny can help strengthen policy-making. And
once again, what is true at national level applies
internationally as well. One feature of global
integration is that governments and populations
worldwide face problems – in finance, trade,
security, environmental sustainability – that do
not respect national borders. Education has a key
role to play in fostering national and international
support for the multilateral governance needed
to address such problems.
Climate change provides an illustration. The role
of science in developing the skills and technologies
on which productivity, employment and prosperity
increasingly depend is well known. Less attention
has been paid to the role of scientific education
in increasing children’s awareness of the great
environmental challenges their generation faces.
Climate change poses a particularly stark set of
threats for humanity, in general over the long term
and for the poor in particular over the medium
term. Understanding the causes of climate change
is difficult because of the complex processes that
influence the build-up of greenhouse gases in the
atmosphere. Evaluating the effects is even more
challenging because of the time horizon involved
and the uncertainties about when and where
effects will be felt and how ecosystems will
respond. Similarly, any evaluation of policy
responses at national or international level has
to grapple with issues that range from energy
policy to approaches to burden-sharing in any
multilateral agreement.
There are strong
links between
education,
citizenship
and informed
decision-making
3 6

E D U C AT I O N F O R A L L : H U M A N R I G H T A N D C ATA LYS T F O R D E V E L O P M E N T
Understanding the science behind climate change
is a vital first step in raising the awareness needed
to drive political solutions to the threat. This is true
both technically speaking and in terms of people
having a sufficient grasp of evidence to assess
the action – or inaction – of their governments.
The PISA 2006 assessment of scientific literacy
among 15-year-old students offers some important
lessons (OECD, 2007b). When the assessment was
published, international attention focused on the
ranking of countries. Less emphasis was placed
on an innovative survey of the relationship between
scientific literacy and global environmental
problems. The results of that survey point to:
A strong association between student levels
of environmental awareness and science
performance, in all participating countries.
On average, an increase of one unit on the PISA
composite index of environmental awareness
was associated with a performance difference
of forty-four score points.
A significant relationship between science
knowledge and environmental awareness
on the part of the general public. The majority
of citizens in countries with a mean score
in science below the basic literacy threshold
(of 450 score points) were less aware of
environmental issues.
An association, in all OECD countries surveyed,
between higher science performance and a
stronger sense of responsibility for sustainable
development. That is, students demonstrating
higher science knowledge reported feeling more
responsible for the environment.
These findings point to the potential for a double
dividend. Strong performance in science and
awareness of global environmental problems tend
to go hand in hand, and both are associated with
a sense of responsibility supporting sustainable
environmental management. Conversely, weak
performance in science is associated with lower
awareness of environmental problems. Failure
in scientific education will mean less widespread –
and less informed – public debate on issues such
as climate change and wider environmental
problems. This in turn will reduce the pressure
on governments to act. In facing up to the
challenge of global warming and wider problems,
EFA is a vital part of the toolkit for national and
international change.
Conclusion
Much has been achieved since governments
signed the Dakar Framework for Action. Perhaps
more than in any other area, progress in education
bears testimony to the fact that international
commitments can make a difference. That does
not diminish the case for a greater sense of urgency
and stronger political leadership. The bottom line
is that ‘business as usual’ will leave the world far
short of reaching the commitments made. And as
this chapter shows, shortfalls in education come
at a high price.
Breaking with business as usual will require change
at many levels. Equity has to be put at the centre
of the EFA agenda. As Chapter 2 demonstrates,
inequalities in opportunity for education represent
a formidable barrier to the achievement of the
Dakar goals. Removing that barrier will require
political leadership and practical strategies that
tackle the underlying causes of disadvantage.
Governance is a central concern. The aim of good
governance in education, as in other areas, is to
strengthen accountability and give people a voice in
decisions that affect their lives so as to enable the
delivery of good-quality services. Good governance
is also about social justice and fairness. Education
for all, as the term itself makes clear, is about all
citizens enjoying an equal right to quality education.
Translating good governance principles into practice
involves reforms in institutional arrangements that
link children and parents to schools, local education
bodies and national ministries. Unfortunately, the
design of governance reform is often guided by
blueprints that produce limited benefits, especially
from the perspective of the poor, the marginalized
and the disadvantaged.
Accelerated progress towards EFA and the goals
set in the Dakar Framework for Action is a condition
for accelerated progress towards the MDGs. More
than that, it is a condition for the development
of more equitable and more sustainable patterns
of globalization. But accelerated progress towards
EFA cannot take place without a far stronger
commitment on the part of national governments
and international donors to equity in education.
Inequality has to be brought to the centre of
the EFA agenda. This Report explores why equity
matters, and what can be done nationally and
internationally to overcome disparities.
Accelerated
progress towards
EFA requires
a stronger
commitment by
countries and
donors to equity
in education
3 7
C o n c l u s i o n

Support andencouragementfrom a primaryschool teacher,in Djibouti
Signing up for literacyclasses, in Honduras
A disabled child joins the game, inthe United Kingdom
A nutritious meal,in Lesotho
90
02
Education f
or A
ll G
lobal M
onitorin
g R
eport
3 8
© G
ideo
n M
ende
l/C
orbi
s©
Gia
com
o P
iroz
zi/P
ANO
S
© G
ideo
n M
ende
l/C
orbi
s©
Nei
l Coo
per/
PAN
OS

3 9
9002Education for All Global Monitoring Report
Chapter 2
The Dakar goals: monitoring progress and inequality
This chapter provides an overview of progress
towards the six Education for All (EFA) goals as
set out in the 2000 Dakar Framework for Action.
Using the most recent international data, it measures
performance against targets, compares the state
of education across countries and identifies trends.
Looking beyond national averages, the chapter
turns the spotlight on inequalities based on wealth,
gender, location and other markers for disadvantage.
Overcoming inequality would accelerate progress
towards the goals, unlocking wider benefits for
societies in the process.

Introduction .......................................................................................................... 40
Early childhood care andeducation: a long way to go ............... 42
Progress towards UPE: nations at the crossroads .......................... 56
Secondary education and beyond: some gains .................................... 84
Meeting the lifelong learning needs of youth and adults ....................... 91
Adult literacy: still neglected ............................................................................................... 93
Assessing gender disparities and inequalities in education ....... 97
Ensuring both equity and the quality of learning ..................... 108
Education for All: measuring composite achievement ....................................................................................................... 122
90
02
Education f
or A
ll G
lobal M
onitorin
g R
eport
C H A P T E R 2
Introduction
The maxim ‘to improve something, first measure it’
encapsulates the importance of monitoring
progress towards the EFA goals. Effective
measurement can serve as a guide to policy,
focusing attention on the targets, giving early
warning of failure, stimulating debate, informing
advocacy and strengthening accountability. At the
international level, cross-country monitoring can
help to identify areas of good practice and cases
of underperformance. Above all, EFA monitoring
is important because it charts progress towards
goals that are ultimately about improving the
quality of people’s lives, extending opportunity
and overcoming inequalities.
Monitoring has a special role to play when it
comes to international goals. Too often in the past
governments have convened high-level summits
on development, adopted bold sounding targets
and then failed to deliver. Education is no
exception to the rule. A decade before the Dakar
World Education Forum, the World Conference
on Education for All held in Jomtien, Thailand,
adopted the target of attaining universal primary
education (UPE) by 2000, along with a wider range
of similarly impressive goals. Results were less
impressive than the targets. National governments
and donors fell far short of their commitments,
but did so in the absence of intense scrutiny.
One of the differences between the commitments
made at Jomtien and those undertaken at Dakar
is that the latter have been subject to close
monitoring since 2002 by the EFA Global
Monitoring Report.
In this year’s Report we identify areas of progress
and offer an early warning of impending failure. As
the 2015 deadline for achieving some of the Dakar
goals draws nearer, the urgency of breaking with
business-as-usual approaches becomes starker.
One of the most important time-bound targets
in the Dakar Framework is the commitment to
achieve UPE by 2015 – a commitment restated
in the Millennium Development Goals (MDGs).
The present Report argues that progress towards
this goal has been hampered by a systematic
failure to place equity at the heart of the EFA
agenda and by problems in improving the quality
of education. The Report focuses on four areas
that are central to achieving EFA by 2015:
4 0

T H E D A K A R G O A L S : M O N I T O R I N G P R O G R E S S A N D I N E Q U A L I T Y
Early childhood care and education (ECCE).What happens in the years between birth and
primary school is crucial. In this area the Report
makes for bleak reading. Around one in three
children in developing countries enter primary
school with their cognitive development
damaged, often irreparably, by malnutrition
or disease. This is not a viable foundation for
UPE. Most governments are failing to act with
sufficient urgency to break the link between child
malnutrition and lost educational opportunity.
Progress towards high-quality pre-school
provision and care, a vital condition for lifelong
learning and enhanced equity, remains slow and
uneven. And those with most to gain from ECCE
programmes are the least likely to have access.
Universal primary enrolment and completion.Progress towards UPE has accelerated since
Dakar. Sub-Saharan Africa has made particularly
impressive strides, with many governments
increasing the priority attached to basic
education. Numbers of out-of-school children
are coming down. Ultimately, though, progress
has to be measured against the benchmark
established in Dakar of achieving UPE by 2015.
Under a business-as-usual scenario, that target
will be missed. The EFA Global Monitoring
Report 2008 has developed projections for
134 countries that accounted in 2006 for 64%
of out-of-school children of primary school age.
The results indicate that some 29 million will still
be out of school in 2015 in these countries alone.
Importantly, the projection does not cover
countries such as the Democratic Republic of the
Congo or the Sudan because of data limitations.
While trends can be changed, the current
trajectory is worrying. If the targets are to be
achieved, governments must attach greater
urgency to meeting the triple challenge of getting
all children into school, ensuring that they do
not drop out and providing the support needed
for them to complete the cycle. Several of the
world’s poorest countries have demonstrated
that rapid progress is possible. But deep-rooted
and persistent inequalities in opportunity,
based on wealth, gender, location, language
and other markers for disadvantage, constitute
a formidable barrier to UPE. For countries that
are close to UPE, going the final mile will require
practical strategies for reaching the most
marginalized. A strengthened focus on equity
will accelerate progress in all countries.
The quality imperative. The ultimate aim of EFA
is to ensure that children receive an education
that enriches their lives, expands their
opportunities and empowers them to participate
in society. Much of what currently passes for
education fails to meet these criteria. Despite
serious data constraints in cross-country
monitoring of education quality, the scale of
the problem is increasingly apparent. Absolute
learning levels are so low in many developing
countries that millions of children complete
primary school without acquiring basic literacy
and numeracy skills. International learning
assessments point to very large gaps between
developed and developing countries. These gaps
are mirrored by large within-country disparities
in learning achievements. Education quality
problems are often exacerbated by the
dilapidated physical state of schools in many
countries and by severe shortages of teachers.
Progress towards gender parity. There has
been impressive progress towards gender parity
at primary and secondary levels. Yet many
countries failed to achieve the goal of parity by
2005. Countries in South Asia and sub-Saharan
Africa feature strongly in this group. Gender
gaps in education are often reinforced by other
markers for disadvantage, such as poverty and
ethnicity, but country experience suggests that
parity can be achieved given strong national
commitment accompanied by policies targeting
the main constraints.
The decision to focus on four priority areas does
not detract from the importance of the larger EFA
package. Indeed, a defining feature of the EFA
agenda is that it treats the six goals as part of
a single comprehensive, integrated framework.
In this respect, the Dakar Framework is far
broader than the Millennium Development Goal
framework, which addresses only UPE and gender
parity – an unduly restrictive approach. This
chapter also looks at post-secondary education,
youth learning opportunities and adult literacy.
In addition, its final section updates the EFA
Development Index (EDI), a composite measure
of overall progress.
Partial projections
indicate that well
over 29 million
children of primary
school age will
still be out of
school in 2015
4 1
I n t r o d u c t i o n

90
02
Education f
or A
ll G
lobal M
onitorin
g R
eport
C H A P T E R 2
Early childhood care andeducation: a long way to go
Goal 1: Expanding and improving comprehensiveearly childhood care and education, especially forthe most vulnerable and disadvantaged children.
The path towards Education for All starts long
before primary school. Adequate nutrition, good
health and an emotionally secure, language-rich
home environment during the earliest years are vital
for later success in education and life. Yet millions
of children lack these advantages and are locked
at an early age into long-term cycles of deprivation.
Failure to deliver on the early childhood goal is
hampering overall progress towards the EFA targets
set in Dakar.
Well-designed early childhood care and education
policies are a powerful antidote to inherited
disadvantages. Monitoring evidence suggests,
however, that many governments are failing to
apply that antidote in two key areas.
The first is child health. One in three children
below the age of 6 in the developing world will start
primary school with their bodies, brains and long-
term learning prospects permanently damaged by
malnutrition and ill health. This has important but
widely ignored implications for education. Getting
children into primary school is an important part
of the Dakar promise. When so many of the children
entering school have had their lives blighted by
sickness and hunger, improved access alone is
not a secure foundation for education for all. That
is why governments urgently need to strengthen
the link between child health and education.
The second area of concern is pre-school provision.
While coverage rates are increasing worldwide,
early childhood services of good quality remain
inaccessible to the majority of the world’s children.
This is especially true for children in the poorest
countries – and for the most disadvantaged among
them. The upshot is a perverse outcome for equity:
those with the most to gain from ECCE are least
likely to participate.
This section builds on the comprehensive analysis
set out in the EFA Global Monitoring Report 2007
on ECCE. It is divided into three parts. After a
brief overview of childhood development stages,
the second subsection looks at child health and
nutrition, two foundations for early childhood
development and lifelong learning. Using the MDGs
as a benchmark for assessing performance, a stark
message emerges: governments are failing children
on an international scale. The third subsection
focuses on ECCE delivery and provision.
The crucial early years
Child development starts in the womb, where it
is affected by the state of the mother’s health and
nutrition. The period between birth and age 3 is one
of rapid cognitive, linguistic, emotional and motor
development, with explosive growth in vocabulary
starting around 15 to 18 months. Development from
age 3 is marked by the emergence of increasingly
complex social behaviour, problem-solving and
pre-literacy skills that build on earlier achievements
(Harvard University Center on the Developing Child,
2007; National Scientific Council on the Developing
Child, 2007). This is a critical period for acquisition
of the cognitive skills that will carry children
through school and influence their life chances
in adulthood.
Many factors affect cognitive development. Genetic
factors interact with social and environmental
influences in shaping the physiological processes
through which neurons in the brain form sensing
pathways which in turn shape cognitive development
and behaviour (Abadzi, 2006). Neurological research
continues to shed light on the processes at work.
Physiological factors are important. Malnutrition or
micronutrient deficiency in the first two years of life
can impair brain development and the functioning
of the central nervous system, with irreversible
consequences (Grantham-McGregor and Baker-
Henningham, 2005; The Lancet, 2008). Other
processes are linked to the quality of the home
environment, including care provision and cognitive
stimulation. Childhood poverty is one of the
most powerful negative influences on the home
environment (Farah et al., 2005; Noble et al., 2007).
Its impact is cumulative, with poor cognitive
development leading to weaker academic
outcomes and more limited life chances.
The simple message to emerge from the complex
field of neurocognitive research is that early
experience is critical. There are no rapid-rewind
buttons through which deprivation can be offset
and no quick fixes for the injury to cognitive
development. Early childhood cognitive damage
is for life.
Malnutrition or
micronutrient
deficiency in the
first two years
of life can
impair brain
development,
with irreversible
consequences
4 2

T H E D A K A R G O A L S : M O N I T O R I N G P R O G R E S S A N D I N E Q U A L I T Y
Damage prevention is better than cure for reasons
of both equity and efficiency. It is unfair for children
to be held back in life because of circumstances –
such as having poor parents – over which they
have no control. The efficiency argument for ECCE
is backed by evidence pointing to high private
and social returns: not just improved academic
performance, higher productivity and higher
income, but also improved health and reduced
crime. As the Nobel Prize-winning economist
James Heckman has put it: ‘Early interventions
in children from disadvantaged environments raise
no efficiency-equity trade-offs; they raise the
productivity of individuals, the workforce and
society at large, and reduce lifetime inequality
by helping to eliminate the accident of birth’
(Heckman and Masterov, 2004, p. 5).
Child health and nutrition: slow and uneven progress
Rapid progress towards UPE cannot be sustained
as long as progress in tackling child health
problems remains slow. High levels of child
mortality and malnutrition represent a formidable
development challenge in their own right. They are
also symptoms of wider problems that directly
affect education.
There is good news: most indicators for child
welfare are improving in most countries. In some
cases the rate of progress has been impressive:
Child survival: In 2006, there were 3 million fewer
deaths of children under age 5 than in 1990 –
a decline of one-quarter. In 1990, one South
Asian child in every eight died before their fifth
birthday. The figure is now one in twelve.
Bangladesh, Ethiopia, Mozambique and Nepal
are among countries having reduced under-5
mortality by 40% or more (UNICEF, 2007).
Vaccination: Increased immunization is saving
lives. World Health Organization projections
for 2007 indicated that 75% of children in the
seventy-three countries covered by the GAVI
Alliance (formerly the Global Alliance for
Vaccines and Immunisation) had been
immunized with three doses of the diphtheria,
pertussis and tetanus vaccine (DPT3) – up from
64% in 2000 (GAVI Alliance, 2008). Vaccination
against measles is estimated to have cut deaths
worldwide by 60% and in sub-Saharan Africa
by 75% (UNICEF, 2007).
HIV/AIDS. At the end of 2007, some 3 million
people in developing countries were receiving
antiretroviral therapy, up from 30,000 in 2002.
Improved access to drugs intended to prevent
mother-to-child transmission – a major cause
of the 370,000 annual new cases of HIV/AIDS
among children – is starting to have an impact
(UNAIDS, 2008).
In each of these areas strong national policies
backed by global initiatives are making a difference.
One example is the Global Fund to Fight AIDS,
Tuberculosis and Malaria, established in 2002.
As of mid-2008, it was providing 1.75 million people
with antiretroviral treatment (a 59% increase in
one year) and 59 million antimalarial bed nets
(doubling provision over the course of the year)
(Global Fund to Fight AIDS, Tuberculosis and
Malaria, 2008). While many targets have been
missed and insufficient attention has been paid
to strengthening national health systems, these
are real achievements.
The bad news is that current efforts fall far short
of what is required. Notwithstanding the ready
availability and affordability of interventions with
proven effectiveness, key targets set under the
MDGs for child health will be missed.
Child mortality: slow progress and large inequalities
Child mortality is one of the most sensitive
barometers of well-being for children under 5.
While the measure itself captures premature
death, it also provides an insight into the health
and nutritional condition of the next generation
of primary school-age children.
Each year around 10 million children die before
they reach the starting age for primary school
(UNICEF, 2007). The vast majority of these deaths
result from poverty-related infectious diseases
and inadequate access to basic services, such as
clean water and sanitation. Around 1.8 million
children die annually in developing countries for
want of these latter two commodities that people
in rich countries take for granted (UNDP, 2006).
Sub-Saharan Africa accounts for half of all under-5
deaths, and its share is growing. South Asia
accounts for one-third of such deaths.
Childhood mortality figures represent the tip of an
iceberg. The diseases that account for the bulk of
child deaths, such as pneumonia (19% of the total),
Around 1.8 million
children
die annually
in developing
countries for
want of basic
services, such
as clean water
and sanitation
4 3
E a r l y c h i l d h o o d c a r e a n d e d u c a t i o n : a l o n g wa y t o g o
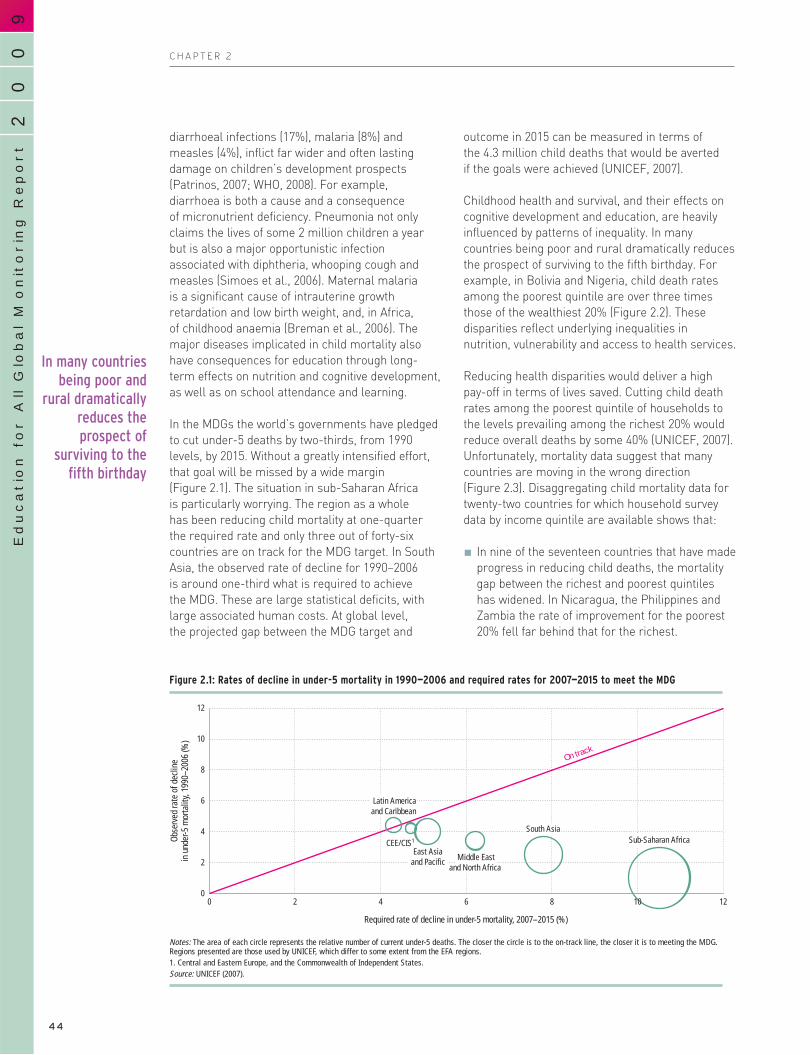
90
02
Education f
or A
ll G
lobal M
onitorin
g R
eport
C H A P T E R 2
diarrhoeal infections (17%), malaria (8%) and
measles (4%), inflict far wider and often lasting
damage on children’s development prospects
(Patrinos, 2007; WHO, 2008). For example,
diarrhoea is both a cause and a consequence
of micronutrient deficiency. Pneumonia not only
claims the lives of some 2 million children a year
but is also a major opportunistic infection
associated with diphtheria, whooping cough and
measles (Simoes et al., 2006). Maternal malaria
is a significant cause of intrauterine growth
retardation and low birth weight, and, in Africa,
of childhood anaemia (Breman et al., 2006). The
major diseases implicated in child mortality also
have consequences for education through long-
term effects on nutrition and cognitive development,
as well as on school attendance and learning.
In the MDGs the world’s governments have pledged
to cut under-5 deaths by two-thirds, from 1990
levels, by 2015. Without a greatly intensified effort,
that goal will be missed by a wide margin
(Figure 2.1). The situation in sub-Saharan Africa
is particularly worrying. The region as a whole
has been reducing child mortality at one-quarter
the required rate and only three out of forty-six
countries are on track for the MDG target. In South
Asia, the observed rate of decline for 1990–2006
is around one-third what is required to achieve
the MDG. These are large statistical deficits, with
large associated human costs. At global level,
the projected gap between the MDG target and
outcome in 2015 can be measured in terms of
the 4.3 million child deaths that would be averted
if the goals were achieved (UNICEF, 2007).
Childhood health and survival, and their effects on
cognitive development and education, are heavily
influenced by patterns of inequality. In many
countries being poor and rural dramatically reduces
the prospect of surviving to the fifth birthday. For
example, in Bolivia and Nigeria, child death rates
among the poorest quintile are over three times
those of the wealthiest 20% (Figure 2.2). These
disparities reflect underlying inequalities in
nutrition, vulnerability and access to health services.
Reducing health disparities would deliver a high
pay-off in terms of lives saved. Cutting child death
rates among the poorest quintile of households to
the levels prevailing among the richest 20% would
reduce overall deaths by some 40% (UNICEF, 2007).
Unfortunately, mortality data suggest that many
countries are moving in the wrong direction
(Figure 2.3). Disaggregating child mortality data for
twenty-two countries for which household survey
data by income quintile are available shows that:
In nine of the seventeen countries that have made
progress in reducing child deaths, the mortality
gap between the richest and poorest quintiles
has widened. In Nicaragua, the Philippines and
Zambia the rate of improvement for the poorest
20% fell far behind that for the richest.
In many countries
being poor and
rural dramatically
reduces the
prospect of
surviving to the
fifth birthday
4 4
Required rate of decline in under-5 mortality, 2007–2015 (%)
0 2 4 6 8 12
South Asia
CEE/CIS1
0
2
4
6
8
10
12
Obse
rved
rate
of d
eclin
ein
und
er-5
mor
talit
y, 19
90–2
006
(%)
10
Sub-Saharan AfricaEast Asia
and Pacific
Latin Americaand Caribbean
On track
Middle Eastand North Africa
Figure 2.1: Rates of decline in under-5 mortality in 1990—2006 and required rates for 2007—2015 to meet the MDG
Notes: The area of each circle represents the relative number of current under-5 deaths. The closer the circle is to the on-track line, the closer it is to meeting the MDG.Regions presented are those used by UNICEF, which differ to some extent from the EFA regions.1. Central and Eastern Europe, and the Commonwealth of Independent States.Source: UNICEF (2007).

T H E D A K A R G O A L S : M O N I T O R I N G P R O G R E S S A N D I N E Q U A L I T Y
Among the five countries in which child mortality
has increased, the gap between rich and poor
widened in Nigeria and Uganda.
The trends in child mortality point in a worrying
direction for education on two counts. First, there
is a widening disjuncture between the rapid
progress in primary school enrolment and the slow
progress on child mortality. The implication:
childhood diseases will corrode the potential
benefits of improved access to education. Second,
to the extent that child mortality disparities mirror
wider health status, there is a danger that child
health inequalities will reinforce the other
educational disadvantages facing children from
poor rural households once they enter school.
Child malnutrition undermines potentialand impedes progress
Malnutrition is the world’s most serious health
epidemic and one of the biggest barriers to UPE.
The epidemic affects one-third of children less than
5 years old. It also accounts for around one-third
of the global disease burden for the age group and
some 3.5 million child deaths annually (Black et al.,
2008). Yet its importance is understated – not least
in relation to education.
In 2006, around 193 million children under 5
suffered moderate to severe stunting. By the time
they enter primary school, malnutrition will have
damaged the brains and cognitive development
of many of these children. There is compelling
evidence that poor nutrition in early childhood
affects cognitive development, fine motor skills,
learning acquisition and behaviour. Even moderate
malnutrition results in altered behaviour, including
lower activity levels, greater apathy and less
enthusiasm for play and exploration (Grantham-
McGregor, 1995; Grantham-McGregor et al., 2007).
Of particular importance is the period between
birth and 24 months, during which nutritional
Even moderate
malnutrition
results in altered
behaviour,
including lower
activity levels,
greater apathy and
less enthusiasm
for play and
exploration
4 5
E a r l y c h i l d h o o d c a r e a n d e d u c a t i o n : a l o n g wa y t o g o
Colombia
Viet Nam
Philippines
Dominican Rep.
Nicaragua
Morocco
Indonesia
Namibia
Bolivia
Bangladesh
Nepal
Ghana
Kenya
U. R. Tanzania
Cameroon
Uganda
Benin
Zambia
Mozambique
Burkina Faso
Chad
Nigeria
Mali
Colombia
Viet Nam
Philippines
Dominican Rep.
Nicaragua
Morocco
Indonesia
Namibia
Bolivia
Bangladesh
Nepal
Ghana
Kenya
U. R. Tanzania
Cameroon
Uganda
Benin
Zambia
Mozambique
Burkina Faso
Chad
Nigeria
Mali
Colombia
Viet Nam
Philippines
Dominican Rep.
Nicaragua
Morocco
Indonesia
Namibia
Bolivia
Bangladesh
Nepal
Ghana
Kenya
U. R. Tanzania
Cameroon
Uganda
Benin
Zambia
Mozambique
Burkina Faso
Chad
Nigeria
Mali
0 50 100 150 200 250 300
Under-5 mortality rates (per 1 000 live births)
UrbanRural Richest 20%Poorest 20% Average
Figure 2.2: Under-5 mortality rates by location and income group,
selected countries, most recent year
Source: Demographic and Health Surveys, calculations by Gwatkin et al. (2007a).
Richest to poorest ratio in under-5 mortality rates
Countries where national under-5 mortality rate has increased
Countries where national under-5 mortality rate has decreased
0 1 2 3 4 5
UgandaNigeria
ChadKenya
Cameroon
U. R. TanzaniaZambia
NepalBenin
ColombiaNicaraguaPhilippines
Viet NamMorocco
Burkina FasoMali
MozambiqueBangladesh
GhanaDominican Rep.
IndonesiaBolivia
Post-Dakar (increase) Post-Dakar (decrease)Pre-Dakar Stable
Figure 2.3: Ratio of under-5 mortality rates
of the richest 20% compared with those of the poorest
20% of households, selected countries, most recent year
Source: Demographic and Health Surveys, calculations by Gwatkin et al. (2007a).

90
02
Education f
or A
ll G
lobal M
onitorin
g R
eport
C H A P T E R 2
deficits can have irreversible physical and
cognitive effects (The Lancet, 2008). Malnourished
children are less likely to start school at the
official age and less equipped to learn. Research
in the Philippines found that malnourished
children performed more poorly in school, partly
as a result of delayed entry and resultant loss
of learning time and partly because of diminished
learning capacity (Glewwe et al., 2001). The
impact of malnutrition persists into adult life.
In Guatemala early stunting is associated with
deficits in literacy, numeracy and educational
attainment at age 18 (Maluccio et al., 2006).
The scale of malnutrition can be captured
in three key indicators:
Low birth weight: The nutrition crisis starts in the
womb and is linked to the health status of women.
In much of sub-Saharan Africa and South Asia
women suffer poor nutrition before and during
pregnancy in near epidemic proportions. Low birth
weight is a proxy measure for this phenomenon.
In 2006, around 16% of children in developing
countries – some 19 million – were born
underweight and the share reached 29% in South
Asia. Such children are twenty times more likely
to die in infancy and those who survive are more
susceptible to infectious disease. Around 42%
of pregnant women in developing countries are
anaemic, a primary cause of low birth weight
(UNICEF, 2007).
Child stunting: Moderate and severe stunting
are indicators of persistent undernutrition.1
For all developing countries, around one child in
three suffers from moderate or severe stunting
(The Lancet, 2008). The vast majority of these
children live in South Asia and sub-Saharan
Africa. Almost half of all children in South Asia
and one-third in sub-Saharan Africa are affected
by stunting. These regional averages mask large
differences between countries. Over 40% of the
children living in Angola, Burundi, Chad, Ethiopia
and Malawi will reach primary school entry age
having suffered the debilitating effects of stunting
(Figure 2.4). Of the twenty-two countries with a
child stunting prevalence of 40% or more, thirteen
are in sub-Saharan Africa, six in Asia and two
in the Arab States. Many observational studies
have shown associations between child stunting
or low weight for age, and poor mental and motor
development later in life (Grantham-McGregor
and Baker-Henningham, 2005).
Micronutrient deficiency: Damage caused by
insufficient calorie intake is compounded by
nutrient deficiency. Micronutrients such as iodine,
iron and vitamin A have a profound effect on
a child’s development. For example, clinical
deficiency of iodine is the single greatest cause
of mental retardation. It restricts development of
the central nervous system, leading to an average
loss of around thirteen IQ points. Iron deficiency
anaemia, which affects 47% of pre-school children,
impairs concentration and increases vulnerability
to infectious disease (Black et al., 2008; Grantham-
McGregor et al., 2007).
Measured against internationally agreed
benchmarks, progress in reducing child
malnutrition has been limited. The MDG target
is to halve undernutrition (from 1990 levels) by 2015.
Fewer than one-quarter of the 143 countries for
which data are available, and only three of the
twenty countries that account for 80% of global
malnutrition, are on track (The Lancet, 2008).
In many countries the situation is deteriorating.
Malnutrition rates have increased in twenty-six
countries, half of them in sub-Saharan Africa.
By one estimate, the number of undernourished
people in the region increased from 169 million
to 206 million between 1990 and 2003 (World Bank,
2006b). Much of South Asia is also off track for the
MDG target, including countries with high rates of
economic growth. The experience of India, which
accounts for one in three malnourished children
in the world, is instructive and disconcerting in
equal measure. For two decades, the country has
been in the fast lane of globalization, registering
one of the world’s highest economic growth
rates. Yet this economic breakthrough has not
translated into similar progress in tackling child
malnutrition (Box 2.1).
The international food crisis could dramatically
worsen prospects for achieving the MDGs. In many
countries people living on less than US$1 a day
spend over 60% of their income on food, leaving
them highly vulnerable to even modest price
increases (Minot, 2008). Over the past year,
international price changes have been anything
but modest. Grain prices have doubled since 2006,
with prices of other staples increasing even more –
by a factor of three in the case of rice (Minot, 2008).
Vulnerable households are already suffering the
consequences. In Yemen, for instance, rising food
prices have reduced the real income of the poorest
20% of households by 12% (World Bank, 2008a).
India accounts
for one in three
malnourished
children
in the world
1. Children are classifiedas suffering from stuntingif their height for their age is between two andthree standard deviations(moderate stunting) or three or more standarddeviations (severestunting) below thereference median (see glossary).
4 6

T H E D A K A R G O A L S : M O N I T O R I N G P R O G R E S S A N D I N E Q U A L I T Y
On one estimate, food price inflation could push
105 million more people below the poverty line,
30 million of them in sub-Saharan Africa
(Wodon et al., 2008).
The slow progress on child well-being indicators
is difficult to justify. Priority interventions for child
health are well known, effective and affordable.
Detailed stategies drawn up by the African Union
suggest that additional financing of US$2-3 per
capita could cut child death by 30% and maternal
mortality by 15%. Expanded immunization,
treatment for diarrhoea and pneumonia, use
of anti-mosquito bed nets and preventive drugs
for malaria, distribution of key micronutrients
and measures to prevent mother-to-child HIV
transmission could dramatically cut child sickness
and death. In rural parts of the United Republic of
Tanzania, the incidence of underweight children
was reduced by 7% between 1999 and 2004 through
integrated maternal and child health interventions,
including improved water and sanitation provision,
mass immunization and malaria prevention
(Alderman et al., 2005). Ethiopia has embarked on
a major programme to extend antenatal care and
to ensure that essential drugs and vaccines are
Additional
financing of
US$2-3 per capita
could cut child
death by 30%
and maternal
mortality by 15%
in sub-Saharan
Africa
4 7
E a r l y c h i l d h o o d c a r e a n d e d u c a t i o n : a l o n g wa y t o g o
0 5 10 15 20 25 30 350
10
20
30
40
50
60
SingaporeUnited States
ArgentinaCuba
Costa Rica
Qatar
Palestinian A. T.Bahrain
Oman
China
Montenegro
UkraineBelarus
BrazilTunisia Colombia
Mexico Venezuela, B. R.Paraguay
Belize PanamaEl Salvador
GhanaSao Tome/Principe Botswana
KuwaitHonduras
Bolivia
Viet NamSwaziland Kenya
Djibouti
DPR KoreaU. R. Tanzania
Rwanda
JamaicaTrinidad/Tobago
Dominican Rep.
JordanSuriname
Mauritius
Guyana
Sri Lanka
SenegalU. A. Emirates
Turkey
Egypt Morocco
Saudi Arabia NicaraguaGabon Iraq
GambiaEcuador
Peru Togo Namibia
South AfricaMaldives
Congo
Zimbabwe
Tajikistan
Azerbaijan
Mongolia
Turkmenistan
Cameroon Philippines
Uganda Myanmar
Côte d‘IvoireGuinea Burkina Faso
Cambodia Pakistan
Somalia
D. R. CongoC. A. R.
EritreaBenin Mali
Equat. Guinea Bhutan Sierra LeoneMozambique Chad Guinea-Bissau
Lao PDRBangladesh
AngolaMalawi
EthiopiaMadagascar
NepalZambia Niger
Burundi
Comoros
Haiti
India
Sudan
Yemen
Low birth-weight rate (%)
Mod
erat
e an
d se
vere
stu
ntin
g ra
te (%
)
IranLibyan A. J.
LebanonAlgeria
Chile
ThailandUruguay
Syrian A. R.
Nigeria
Lesotho
Guatemala Timor-Leste
Low birth-weight rate (%)
Mod
erat
e an
d se
vere
stu
ntin
g ra
te (%
)
World Developing countries
Arab States
South AsiaLeast developedcountries
Latin America/Caribbean
Sub-Saharan Africa
CEE/CIS
East Asia/Pacific
10
40
20
20 30
Figure 2.4: Low birth weight and moderate and severe stunting worldwide1
Note: Regions shown are those used by UNICEF, which differ to some extent from the EFA regions. For example, UNICEF includes the Islamic Republic of Iran in the Arab States region, rather than South and West Asia. Data points for countries in Central and Eastern Europe are shown in green, in Central Asia in cyan and in South and West Asia in orange.1. Data are for the most recent year available.Sources: Annex, Statistical Table 3A; UNICEF (2007).

90
02
Education f
or A
ll G
lobal M
onitorin
g R
eport
C H A P T E R 2
available at primary health clinics. To underpin
the plan, the government is training and deploying
30,000 female health extension workers recruited
from the communities they will serve (UNICEF,
2007). Box 2.2 illustrates the case for such
interventions.
Unfortunately, decisive action is the exception
rather than the rule. Nutritional security seldom
figures among key development priorities and
is rarely well integrated into national poverty
reduction strategies. A review of malnutrition policy
carried out by the medical journal The Lancet
recently concluded that ‘leadership is absent,
resources are too few, capacity is fragile, and
emergency response systems are fragmentary’
(The Lancet, 2008, p. 179).
Good-quality ECCE provision: a foundation for equity
Two children are born in Ecuador on the same day.
One is born into a household in the top 20% of the
wealth distribution in the country, the other into the
bottom 20%. At age 3 both score at roughly equivalent
levels in tests of vocabulary recognition. By age 5
the child from the richest household is scoring
around 40% higher. When they enter primary
school, children from the poorest households are
so far behind that they are unlikely to ever catch up.
This story summarizes the findings of an important
study of cognitive development in Ecuador (Paxson
and Schady, 2005). It illustrates that what children
achieve in education is profoundly affected by what
happens to them before they even get to school.
Children’s
achievement
in school is
affected by what
happens to them
before they even
get to school
4 8
Box 2.1: Malnutrition compromises India’s progress in primary school enrolment
In recent years India has made impressive progress towards universal enrolment in primaryschool. Progress on child health indicators is lessimpressive. While India has sustained one of theworld’s highest economic growth rates for twodecades, social indicators for child mortality,nutrition and child health lag far behind:
Child mortality has been falling at around one-third the rate required for India to achieve theMDG target. Bangladesh and Nepal, with lowerlevels of income and economic growth, have bothoutperformed India on this key indicator of childwelfare. If India had reduced child mortality toBangladesh levels, it would have had 200,000fewer deaths in 2006.
Rising average income has done little to enhancechild nutrition. According to the 2005–2006National Family Health Survey, the prevalenceof underweight children was 46% in 2005,the same level as in 1998.
Micronutrient deficiencies are pervasive. Iodinedeficiency in pregnant women causes congenitalmental impairment in an estimated 6.6 millionchildren annually. One-third of all children in theworld born with mental damage related to iodinedeficiency live in India. In addition, around 75%of pre-school children in India suffer irondeficiency anaemia and 60% have subclinicalvitamin A deficiency.
Health provision is lacking in many areas. Morethan one-quarter of children with diarrhoea arenever treated. Around 45% of children do not
receive the full DPT3 vaccination, the same share as in 1998. Vaccination coverage hasdropped in ten states since 1998.
This marked disconnect between success in the economy and failure in child nutrition is theproduct of deep inequalities linked to income, caste,gender and state — and of wide-ranging publicpolicy failures. The Integrated Child DevelopmentServices (ICDS) programme is the institutionalspearhead of India’s efforts to combat childmalnutrition. However, its effectiveness isundermined by serious problems in targeting.The five states with the highest prevalence ofmalnutrition have the lowest level of coveragefrom the ICDS. In addition, older children (aged 3to 6) participate much more than younger ones,so the crucial window of opportunity for tacklingmalnutrition is being missed. Many children fromthe poorest households are not covered. And the programme fails to preferentially target girls,children from lower castes and the poor, all ofwhom face higher risks of malnutrition.
The Government of India’s publicly declaredaspiration is to create a world-class educationsystem that delivers good-quality schooling forall its children. Achieving that goal will requirestronger political leadership and practical policiesthat link the EFA agenda with policies to improvepublic health and enhance equity.
Sources: Deaton and Drèze (2008); Gragnolati et al. (2006);International Institute for Population Sciences and MacroInternational Inc. (2007).

T H E D A K A R G O A L S : M O N I T O R I N G P R O G R E S S A N D I N E Q U A L I T Y
Provision for under-3s: exploiting the window of opportunity
Institutional arrangements, capacity and quality
of service for children under the age of 3 vary
enormously. In most developed countries, provision
includes regular health visits, immunization,
nutritional advice and universal access to child care
services. However, there are important exceptions
to this rule – and poor children often have the most
limited access. In developing countries, interventions
are usually far more limited and poorly coordinated.
Households act as the frontline carer in developing
countries, although government agencies also have
child well-being remits. Maternal and child health
services typically fall under the authority of health
ministries or dedicated child development services.
In Latin America day care centres are widely used to
deliver nutritional support to vulnerable households.
Governments in the region have also expanded
social protection programmes with early childhood
components. Sometimes these programmes provide
conditional cash transfers: eligible households
receive payments if they meet conditions such as
presenting their children for growth monitoring and
vaccinations, and assuring their attendance in school.
The largest such programme is Oportunidades in
Mexico, which in 2007 had a budget of US$3.7 billion
and reached 5 million families (Fernald et al., 2008).
Other social protection programmes provide
unconditional cash transfers. An example is
Ecuador’s Bono de Desarrollo Humano, which
provides a cash transfer to women designated
as eligible solely on the basis of a composite
deprivation index (Paxson and Schady, 2007).
Research from a large group of countries points
to very high returns from investing in good quality
ECCE. Evaluations of the Bono de Desarrollo
Humano programme have identified a range of
positive effects on fine motor control, long-term
memory and physical well-being. Children of
participants in the poorest quartile measure 25%
higher in cognitive outcomes than the average for a
control group. For the poorest half of these families,
the transfer – amounting to US$15 per month –
Research from
a large group of
countries points
to very high
returns from
investing in good
quality ECCE
4 9
E a r l y c h i l d h o o d c a r e a n d e d u c a t i o n : a l o n g wa y t o g o
Box 2.2: Country evidence: health and nutrition interventions can enhance cognitive development
Exploiting the window of opportunity for combatingmalnutrition can deliver high returns. Programmesin many countries make a powerful case for earlyintervention. For example:
In the Philippines, a pilot child nutrition programmefocused investments on a wide range of nutrition and preventive health interventions. For childrenaged 2 to 3, exposure to the programme forseventeen months was associated with significantlyhigher expressive and receptive language skills (0.92 to 1.80 standard deviations higher), as well ashigher weight-for-height scores. Children under 4also recorded significant lowering of worm infestation and diarrhoea incidence.
Bolivia’s Integrated Project for Child Developmentprovides 70% of recommended nutrient inputs andsystematic learning environments for poor urbanchildren aged 6 months to 6 years. Controlledcomparisons point to large positive effects oncognitive development and language skills, as well as improved weight for height in children under 3.
The Oportunidades programme in Mexico providessome of the most compelling evidence for theeffectiveness of health interventions. Because theprogramme has been progressively implemented,
it has been possible to conduct a randomizedevaluation looking at a range of outcomes. Among the findings:
Reduced prevalence of stunting. At age 2, childrenin the programme had a 1-cm height advantageover non-participants.
Enhanced school attendance and progression.Those who participated between birth and6 months were more likely to enter school on time,progress steadily through the system and acquiremore years in school. Enrolment rates atsecondary level increased from 67% to 75%for girls and from 73% to around 78% for boys.
Strengthened cognitive development. A recentstudy using administrative data to look at thecumulative benefits of cash and nutrition transferson health, cognitive development and motor skillsfound that a doubling of cash transfers wasassociated with better height-for-age scoresand higher scores on three scales of cognitivedevelopment and receptive language. Two ofthe cognitive development domains positivelyassociated with cash transfers — short-termworking memory and language — are amongthe most sensitive to social and economic status.
Sources: Armecin et al. (2006); Behrman and Hoddinott (2005);Behrman et al. (2004); Fernald et al. (2008); Schady (2006).

90
02
Education f
or A
ll G
lobal M
onitorin
g R
eport
C H A P T E R 2
increases school enrolment from 75% to 85% and
reduces child labour by seventeen percentage points
(Oosterbeek et al., 2008; Schady and Aranjo, 2006).
Other evaluations demonstrate cumulative benefits
over time in the form of improved indicators for
achievement and learning.
Such experiences confirm that ECCE has the potential
to make a big difference. Cross-country research
suggests there are three conditions for unlocking that
potential (Armecin et al., 2006; Grantham-McGregor
and Baker-Henningham, 2005; Schady, 2006):
Start early. Effective exploitation of the narrow
window of opportunity up to the third birthday
diminishes vulnerability to stunting and enhances
cognitive development.
Operate long term. Intervention needs to be
continuous and to take a variety of forms deter-
mined by circumstances, with nutritional, health
and behavioural interventions all playing a role.
Undertake multiple actions. For example,
feeding programmes that incorporate cognitive
stimulation, as in Bolivia and the Philippines,
are more effective than either nutrition or
stimulation alone.
Formal pre-school access from age 3: uneven expansion, deep inequalities
Around thirty countries have laws making at least
one year of pre-school compulsory though few are
stringently enforced. In most cases, ministries of
education oversee national provision.
Good-quality ECCE provision can equip children
with cognitive, behavioural and social skills that
generate large benefits in terms of access to
primary school, progression through school and
learning outcomes (Box 2.3). There is no simple
template for determining what constitutes good
quality. International research points to the
importance of class or group size, the adult/child
ratio, the quality of teaching and the availability
of materials and curriculum. Interaction among
children, carers and teachers is probably the key
determinant of quality (Young and Richardson, 2007).
Worldwide access to pre-school facilities has been
steadily increasing. Some 139 million children were
in ECCE programmes in 2006, up from 112 million
in 1999. The global pre-primary gross enrolment
ratio (GER) in 2006 averaged 79% in developed
countries and 36% in developing countries
(Table 2.1). Coverage was lowest in sub-Saharan
Africa and the Arab States. Of the thirty-five
ECCE coverage
is lowest in
sub-Saharan
Africa and the
Arab States
5 0
Box 2.3: Pre-school benefits for equity and efficiency
Improved access to pre-school can enhance botheducation outcomes and equity. Much of the evidencecomes from extensively researched pilot programmes inthe United States, where outcomes included higher testscores, better secondary school graduation rates andincreased college enrolment. Two programmes thattargeted African-American children provide examples: the Perry Preschool Program was associated with 44%higher pre-school graduation and the Abecedarian Projectachieved an increase of one grade in reading andmathematics achievement.
Research from developing countries is more limited but no less compelling:
In Argentina pre-school attendance from age 3 to age 5increased performance in language and mathematics(by 0.23 to 0.33 standard deviation). Measured throughthird-grade test scores, the effect was twice as large for students from poor backgrounds.
In Uruguay, pre-school attendance had a positive effecton completed years of schooling, repetition rates andage-grade distortion. By age 10, children who had
attended pre-school had an advantage of about one-third of a year over children who had not attended.By age 16, they had accumulated 1.1 additional years ofschooling and were 27% more likely to be in school.
Household survey data in Cambodia showed that the availability of pre-school facilities increased theprobability of successful school completion from 43%to 54%. The strongest impact was found for remoterural areas and the two poorest income quintiles.Probability of cohort graduation at Grade 6 increasedby 13% for the poorest — almost double the increase for the richest cohort.
A programme in India’s Haryana state resultedin a 46% decline in dropout among lower-castechildren, though it did not significantly change thedropout rate for children from higher castes. Widerevidence from India covering eight states and based ontracking of cohorts found significantly higher rates ofretention for children who had been enrolled in ECCE.
Sources: Berlinski et al. (2006); Nores et al. (2005); Schweinhart et al.(2005); UNESCO (2006); Vegas and Petrow (2007).
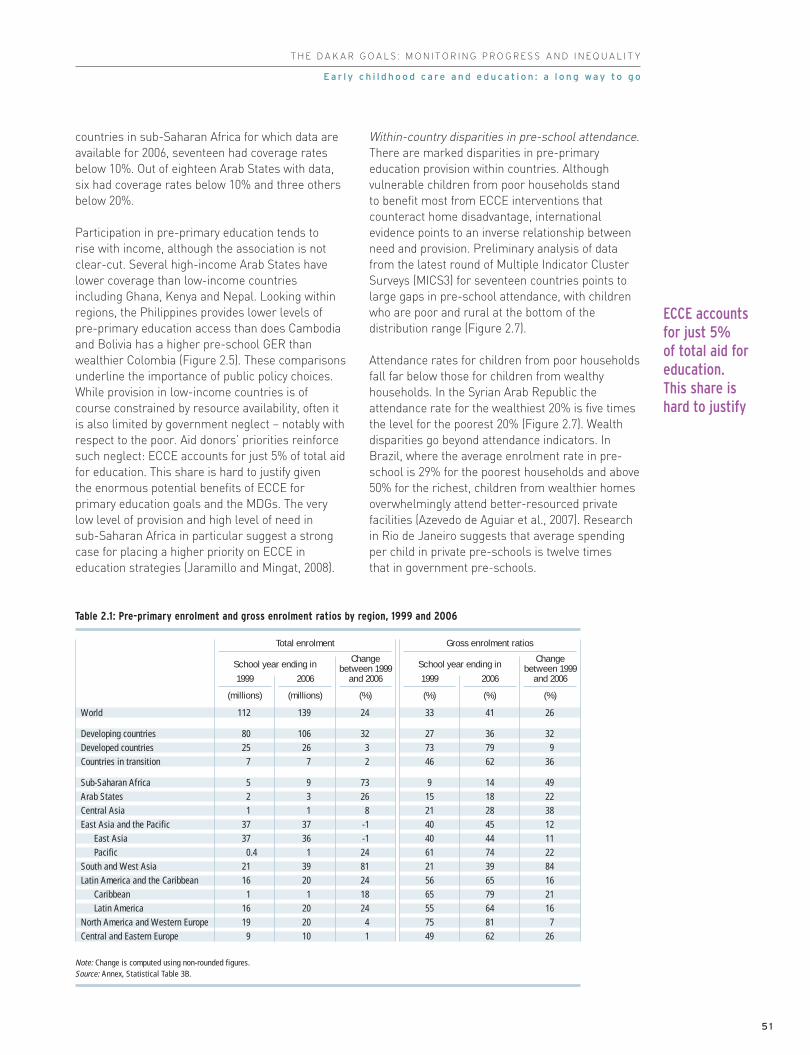
T H E D A K A R G O A L S : M O N I T O R I N G P R O G R E S S A N D I N E Q U A L I T Y
countries in sub-Saharan Africa for which data are
available for 2006, seventeen had coverage rates
below 10%. Out of eighteen Arab States with data,
six had coverage rates below 10% and three others
below 20%.
Participation in pre-primary education tends to
rise with income, although the association is not
clear-cut. Several high-income Arab States have
lower coverage than low-income countries
including Ghana, Kenya and Nepal. Looking within
regions, the Philippines provides lower levels of
pre-primary education access than does Cambodia
and Bolivia has a higher pre-school GER than
wealthier Colombia (Figure 2.5). These comparisons
underline the importance of public policy choices.
While provision in low-income countries is of
course constrained by resource availability, often it
is also limited by government neglect – notably with
respect to the poor. Aid donors’ priorities reinforce
such neglect: ECCE accounts for just 5% of total aid
for education. This share is hard to justify given
the enormous potential benefits of ECCE for
primary education goals and the MDGs. The very
low level of provision and high level of need in
sub-Saharan Africa in particular suggest a strong
case for placing a higher priority on ECCE in
education strategies (Jaramillo and Mingat, 2008).
Within-country disparities in pre-school attendance.
There are marked disparities in pre-primary
education provision within countries. Although
vulnerable children from poor households stand
to benefit most from ECCE interventions that
counteract home disadvantage, international
evidence points to an inverse relationship between
need and provision. Preliminary analysis of data
from the latest round of Multiple Indicator Cluster
Surveys (MICS3) for seventeen countries points to
large gaps in pre-school attendance, with children
who are poor and rural at the bottom of the
distribution range (Figure 2.7).
Attendance rates for children from poor households
fall far below those for children from wealthy
households. In the Syrian Arab Republic the
attendance rate for the wealthiest 20% is five times
the level for the poorest 20% (Figure 2.7). Wealth
disparities go beyond attendance indicators. In
Brazil, where the average enrolment rate in pre-
school is 29% for the poorest households and above
50% for the richest, children from wealthier homes
overwhelmingly attend better-resourced private
facilities (Azevedo de Aguiar et al., 2007). Research
in Rio de Janeiro suggests that average spending
per child in private pre-schools is twelve times
that in government pre-schools.
ECCE accounts
for just 5%
of total aid for
education.
This share is
hard to justify
5 1
E a r l y c h i l d h o o d c a r e a n d e d u c a t i o n : a l o n g wa y t o g o
School year ending in School year ending in
112 139 24 33 41 26
80 106 32 27 36 3225 26 3 73 79 9
7 7 2 46 62 36
5 9 73 9 14 492 3 26 15 18 221 1 8 21 28 38
37 37 -1 40 45 1237 36 -1 40 44 11
0.4 1 24 61 74 2221 39 81 21 39 8416 20 24 56 65 16
1 1 18 65 79 2116 20 24 55 64 1619 20 4 75 81 7
9 10 1 49 62 26
World
Developing countriesDeveloped countriesCountries in transition
Sub-Saharan AfricaArab StatesCentral AsiaEast Asia and the Pacific
East AsiaPacific
South and West AsiaLatin America and the Caribbean
CaribbeanLatin America
North America and Western EuropeCentral and Eastern Europe
Table 2.1: Pre-primary enrolment and gross enrolment ratios by region, 1999 and 2006
1999
(millions) (millions) (%) (%) (%) (%)
2006
Changebetween 1999
and 2006 1999 2006
Changebetween 1999
and 2006
Note: Change is computed using non-rounded figures.Source: Annex, Statistical Table 3B.
Total enrolment Gross enrolment ratios

90
02
Education f
or A
ll G
lobal M
onitorin
g R
eport
C H A P T E R 2
Rural-urban gaps and other geographic disparities
are also marked in many countries. For example, in
Côte d’Ivoire attendance rates range from less than
1% in the remote north-west to 19% in the capital
city, Abidjan. Viet Nam’s Red River delta region,
with the country’s highest average income, has a
pre-primary attendance rate of 80%, compared with
40% for the Mekong River delta region, which has
some of the worst social indicators. In Bangladesh,
slum dwellers are at the bottom end of the
distribution for access to ECCE (Figure 2.7).
Factors such as language, ethnicity and religious
associations play a part in shaping the distribution
as well. In several countries of the former Soviet
Union, attendance rates are higher for Russian
5 2
ChadC. A. R.Burundi
NigerBurkina Faso
TogoEthiopia
MaliComorosUganda
Côte d’IvoireSierra Leone
BeninGuinea
MadagascarCongo
SenegalNigeriaEritrea
BotswanaGambia
SwazilandLesotho
CameroonNamibia
U. R. TanzaniaS. Tome/Principe
South AfricaEquat. Guinea
KenyaCape Verde
Ghana
YemenDjibouti
MauritaniaIraq
OmanLibyan A. J.Syrian A. R.
Saudi ArabiaAlgeria
EgyptSudan
Palestinian A. T.Jordan
QatarBahrain
MoroccoLebanon
KuwaitU. A. Emirates
0 20 40 60 80 100
Gross enrolment ratios (%)
0
Tajikistan
Kyrgyzstan
Uzbekistan
Azerbaijan
Armenia
Kazakhstan
Mongolia
Georgia
Myanmar
Timor-Leste
Cambodia
Lao PDR
Fiji
Tonga
Vanuatu
Indonesia
China
Philippines
Marshall Is
Samoa
Brunei Daruss.
Palau
Kiribati
Japan
Macao, China
Nauru
Afghanistan
Bhutan
Bangladesh
Nepal
India
Pakistan
Iran, Isl. Rep.
Maldives
2
2
2
20 40 60 80 100
Gross enrolment ratios (%)
1999 2006 (increase since 1999) 2006 (decrease since 1999) Stable
Central Asia
East Asia and the Pacific
South and West Asia
Sub-Saharan Africa
Arab States
Figure 2.5: Change in pre-primary gross enrolment ratios between 1999 and 2006 in countries with GERs below 90% in 20061
Notes: The apparent decreasein the United Kingdom is dueto the reclassification intoprimary of some programmesformerly considered as pre-primary. See source table for detailed country notes.1. The GER is 90% or abovein forty-one countries orterritories: ten in LatinAmerica and the Caribbean,fourteen in Western Europe, nine in East Asia and thePacific, five in Central andEastern Europe and three in sub-Saharan Africa.2. Change in durationbetween 1999 and 2006.Compared to 1999, pre-primary duration is reportedto be one year shorter inMongolia, Nepal, Nicaraguaand Slovenia; one year longerin Chile, Costa Rica and the Marshall Islands and twoyears longer in Guatemala.Source: Annex, Statistical Table 3B.

T H E D A K A R G O A L S : M O N I T O R I N G P R O G R E S S A N D I N E Q U A L I T Y
speakers. Roma people living in Serbia have
participation levels less than one-sixth of those
for Serb nationals in pre-school programmes
(Figure 2.7).
Why are children from poor households less likely
to go to pre-school? The answer varies by country
(see Box 2.4 for one example). In some cases it is
because there are no local facilities. In others
it is because of cost, or because parents believe the
quality is inadequate. Detailed household surveys
from Egypt provide an insight into the barriers
facing disadvantaged households, highlighting
the importance of cost (see Box 2.4).
5 3
E a r l y c h i l d h o o d c a r e a n d e d u c a t i o n : a l o n g wa y t o g o
0
GuatemalaDominican Rep.
BelizeParaguayHondurasColombia
BoliviaEl SalvadorNicaragua
ChileVenezuela, B. R.
ArgentinaPanama
PeruSaint Lucia
BrazilCosta Rica
DominicaUruguayGrenada
SurinameTrinidad/Tobago
St Vincent/Grenad.Ecuador
FinlandUnited States
CyprusCanadaGreece
PortugalLuxembourg
United KingdomAustria
TurkeyTFYR Macedonia
AlbaniaCroatiaPolandSerbia
LithuaniaRep. Moldova
RomaniaSloveniaBulgariaHungary
Russian Fed.Latvia
2
2
2
2
2
20 40 60 80 100
Gross enrolment ratios (%)
Latin America and the Caribbean
North America and Western Europe
Central and Eastern Europe
Box 2.4: In Egypt, national progress but the poor
are being left behind
Egypt has embarked on an ambitious programme to expand pre-school provision, focusing on children aged 4 and 5. The increasein coverage has been impressive, but has not significantly reduced pre-school disparities that threaten to aggravate inequalities at theprimary level and beyond.
The GER for pre-primary education increased from 11% in 1999 to 17%in 2007. However, the 2005–2006 Egypt Household Education Surveyrevealed that only 4% of children from the poorest 40% of householdsever attended pre-school (Figure 2.6). By contrast, 43% of childrenfrom the richest quintile had completed two years in kindergarten.
Two factors stand out as barriers to enhanced and more equitableaccess. First, for parents in the poorest three quintiles, lack of access is the most commonly cited reason for not sending children to pre-school. Second, around one-third of parents in the poorest 40%cite affordability as a major problem.
Achieving greater equity will require public policy action on severalfronts. Providing kindergartens in the poorer districts of cities, smalltowns and rural areas is an urgent priority. Removing cost barriers willrequire either targeted transfers to poor households or free provision,or some combination of both. Free school meals could provide anotherincentive: only 10% of 4- and 5-year-olds in kindergarten receive freefood at school.
Source: El-Zanaty and Gorin (2007).
Richest 20%Q5
Q4Q3Poorest 40%Q1 and Q2
Urban Rural
Shar
e of
chi
ldre
n at
tend
ing
kind
erga
rten
(%)
0
5
10
15
20
25
30
35
40
45
50 By place of residence By wealth quintile
Figure 2.6: Percentage of children aged 4 and 5 in Egypt attending
kindergarten, by place of residence and wealth quintile, 2005—2006
Source: El-Zanaty and Gorin (2007).

90
02
Education f
or A
ll G
lobal M
onitorin
g R
eport
C H A P T E R 2
Rich countries have a mixed record on equity.
Developing countries are not the only ones
struggling to make ECCE more equitable.
There are large disparities in pre-school provision
among Organisation for Economic Co-operation
and Development (OECD) countries.
While France and Scandinavian countries (except
Finland) have achieved near-universal pre-school
enrolment, the pre-primary GER of the United
States is 61% (see annex, Statistical Table 3A).
And within the United States, the disadvantaged
lag behind the national average.
There are large
disparities in
pre-school
provision among
rich countries
5 4
Shar
e of
chi
ldre
n at
tend
ing
som
e fo
rm o
f org
anize
d ea
rly c
hild
hood
edu
catio
n pr
ogra
mm
e (%
)
0
10
20
30
40
50
60
70
80
90Cô
te d
’Ivoi
re
Bosn
ia/H
erze
g.
Syria
n A.
R.
Guin
ea-B
issa
u
TFYR
Mac
edon
ia
Sier
ra L
eone
Bang
lade
sh
Kaza
khst
an
Kyrg
yzst
an
Gam
bia
Uzbe
kist
an
Mon
tene
gro
Dom
inic
an R
ep.
Serb
ia
Mon
golia
Viet
Nam
Thai
land
Urban
Rural
Average
Richest 20%
Poorest 20%
1 2 2 1 2 3 3
Red River deltaNorth
South
Mekong River delta
Capital city
Capital city
Capital cityCapital city
Serbian
Montenegrin
Russian
Russian
Russian
Countryside
Roma
Bosnian/Muslim
Uzbek
Fula
FulaNorth-west
Jola
Tribal
Christian
Kyrgyz
Kazakh
Urban slumMuslim
Figure 2.7: Disparities in pre-school attendance of 3- and 4-year-olds, selected countries, most recent year
1. The Fula markers refer to the ethnic group.2. In Kazakhstan, Kyrgyzstan and Uzbekistan, all markers except capital city refer to languages.3. In Montenegro and Serbia, markers refer to ethnic groups. Sources: Bangladesh Bureau of Statistics and UNICEF (2007); Bosnia and Herzegovina Directorate for Economic Planning et al. (2007); Côte d’Ivoire National Institute of Statistics (2007);Dominican Republic Secretary of State for Economy, Planning and Development (2008); Gambia Bureau of Statistics (2007); Guinea-Bissau Ministry of Economy (2006); Kyrgyz RepublicNational Statistical Committee and UNICEF (2007); Macedonia State Statistical Office (2007); Mongolia National Statistical Office and UNICEF (2007); Montenegro Statistical Officeand Strategic Marketing Research Agency (2006); Serbia Statistical Office and Strategic Marketing Research Agency (2007); Sierra Leone Statistics and UNICEF (2007); Syrian Arab RepublicCentral Bureau of Statistics (2008); Thailand National Statistical Office (2006); UNICEF and Agency of the Republic of Kazakhstan on Statistics (2007); UNICEF and State Statistical Committeeof the Republic of Uzbekistan (2007); Viet Nam General Statistics Office (2006).

T H E D A K A R G O A L S : M O N I T O R I N G P R O G R E S S A N D I N E Q U A L I T Y
Unlike most rich countries, the United States has
no national standard or regulatory structure for
ECCE. Provision is left to individual states, and both
coverage and quality vary widely among and within
states. Federal programmes targeting the poor
have a mixed record. The largest such programme
is Head Start, begun in the mid-1960s under
President Johnson’s ‘War on Poverty’ legislation
as an effort to break the link between poverty and
educational disadvantage. Operated through local
agencies, with funds supplied directly by the federal
government, it reaches around 11% of children
aged 3 and 4. Eligibility is determined by poverty,
but not all eligible children take part, and quality
indicators are discouraging (Belfield, 2007).
Compared with other pre-school programmes,
Head Start is modest in terms of absolute size
and relative impact – a finding that points to its
low value added (Haskins, 2008). While many wider
factors drive education inequalities in the United
States, disparities in access to good-quality pre-
school provision contributes to a persistent school
readiness gap between disadvantaged and other
children. That gap widens as children progress
through the education system (Magnuson and
Waldfogel, 2005) (Box 2.5).
Unlike most
rich countries,
the United States
has no national
standard or
regulatory
structure for ECCE
5 5
E a r l y c h i l d h o o d c a r e a n d e d u c a t i o n : a l o n g wa y t o g o
Box 2.5: The equity gap in early childhood provision in the United States
Almost one in five American children lives in poverty — twice the OECD average.One in eight lives in overcrowded housing and one in ten in households lackinghealth insurance. This social backdrop is closely related to high levels ofinequality in educational outcomes.
Early childhood interventions have the potential to weaken the link betweensocial deprivation and education inequality. However, current programmes appearto be failing on several counts. Measured in terms of equity, they are often failingto reach those in greatest need. In 2008, the American Human DevelopmentReport examined inequalities in pre-school enrolment by social group, ethnicbackground, state and congressional district. It found a striking disparity betweenlevels of need as reflected in a human development index (HDI) (a compositeindicator for health, education and income) and provision:
Only 45% of 3- to 5-year-olds in low-income families are enrolled in pre-school, compared with 75% among high-income families.
There are marked ethnic disparities. The enrolment ratio for Hispanic and Latino children is 45%, compared with 62% for white children.
For the twenty congressional districts with the highest HDI scores, the averagepre-school enrolment rate was 76%, compared with 50% in the bottom twenty.
Of the top twenty HDI districts, only two had pre-school enrolment rates below 60%, while only three of the bottom twenty had rates above 60%.
The quality of ECCE programmes is also a cause for concern. In the absence of a well-defined federal framework and regulatory structure, management andquality control are highly variable. Another problem is the lack of coherenceacross programmes covering child poverty and social welfare. The Committee on Education and Labor of the House of Representatives has identifiedfragmentation in this area as a major problem in most states, counties and cities.Another concern is that the overall level of investment under Head Start is around one-third lower per pupil than in the best performing programmes.
Sources: Burd-Sharps et al. (2008); Haskins (2008); Maghnuson and Waldfogel (2005);UNICEF (2007).

90
02
Education f
or A
ll G
lobal M
onitorin
g R
eport
C H A P T E R 2
Progress towards UPE:nations at the crossroads
Goal 2: Ensuring that by 2015 all children,particularly girls, children in difficultcircumstances and those belonging to ethnicminorities, have access to and complete, free and compulsory primary education of good quality.
With only seven years to the target date, will
governments fulfil their pledge to achieve UPE by
2015? Not if they continue on a business-as-usual
trajectory. Some 75 million children of primary
school age are still out of school, and their
numbers are coming down too slowly and too
unevenly to achieve the 2015 target. The twin
challenge is to accelerate increases in access
and to strengthen retention so that all children
enter school and complete a full primary cycle.
Since its inception the EFA Global Monitoring
Report has charted progress towards UPE and
the wider goals adopted at Dakar. If there is one
central message to emerge from the reporting
set out below it is that this is a make-or-break
moment for the commitments to achieve UPE
by 2015. Without an urgent drive to get children into
school, increase survival and completion rates and
strengthen quality, the promise made at Dakar will
be broken.
Access and participation: increasing, but a long way to go
The numbers of children entering primary school
have climbed sharply since Dakar. In 2006, just over
135 million children stepped through a classroom
door for the first time – an increase of about
5 million over the level in 1999. The developing
country gross intake rate (GIR), which registers
the number of new entrants regardless of age, has
increased by just under eight percentage points
over the period, with the Arab States, South and
West Asia, and sub-Saharan Africa registering the
biggest increases (Table 2.2). Some regions have
seen their intake levels stagnate or even decline,
as in East Asia and the Pacific, Latin America, and
North America and Western Europe. This typically
reflects a combination of demographic change and
a better match between school starting age and
progression through the system in countries that
started with high GIRs.
More children
are entering
primary school,
but too many
fail to complete
the cycle
5 6
School year ending in School year ending in
130 195 135 340 4 104 111 7
113 366 120 589 6 105 112 812 380 11 575 -6 102 102 -0.2
4 449 3 175 -29 99 100 1
16 397 23 230 42 90 111 226 297 7 191 14 90 100 101 795 1 416 -21 101 102 1
37 045 31 830 -14 103 98 -536 513 31 288 -14 103 98 -5
533 542 2 102 101 -140 522 44 823 11 114 127 1313 176 13 142 -0.3 119 119 -0.1
565 585 4 156 157 112 612 12 557 -0.4 118 118 -0.2
9 328 8 932 -4 103 103 -0.25 635 4 370 -22 97 98 0.3
World
Developing countriesDeveloped countriesCountries in transition
Sub-Saharan AfricaArab StatesCentral AsiaEast Asia and the Pacific
East AsiaPacific
South and West AsiaLatin America and the Caribbean
CaribbeanLatin America
North America and Western EuropeCentral and Eastern Europe
Table 2.2: New entrants to grade 1 and gross intake rates by region, 1999 and 2006
1999
(000) (000) (%) (%) (%) (percentagepoints)
2006
Changebetween 1999
and 2006 1999 2006
Changebetween 1999
and 2006
Note: Changes are computed using non-rounded figures.Source: Annex, Statistical Table 4.
New entrants Gross intake rates

T H E D A K A R G O A L S : M O N I T O R I N G P R O G R E S S A N D I N E Q U A L I T Y
As intake rates have risen, so has overall enrolment.
Worldwide, some 40 million more children were
in primary school in 2006 than in 1999 (Table 2.3).
Sub-Saharan Africa, and South and West Asia
accounted for the bulk of the increase, with
enrolment in the former increasing by 42% and in
the latter by 22%. Elsewhere, total enrolment fell
slightly, owing in part to declining school age
populations.
Demographic trends: a key factor in education planning
For some regions, slower growth or even contraction
of the primary school-age cohort creates an oppor-
tunity to increase per capita financing. For others,
continued increases in the primary school-age
population mean incremental pressure on financial,
physical and human resources. East Asia and the
Pacific will have some 15 million fewer children of
primary school age in 2015; in sub-Saharan Africa
the cohort will grow by 26 million, and in the Arab
States by 4 million (Figure 2.8). One consequence
of such demographic pressure is that governments
have to work harder to maintain existing gains.
Sub-Saharan Africa, for example, has to expand
participation by over two percentage points a year
just to stand still in terms of enrolment ratios.
Where there
is demographic
pressure,
governments
have to work
harder
to maintain
existing gains
5 7
P r o g r e s s t o wa r d s U P E : n a t i o n s a t t h e c r o s s r o a d s
20062015
Base year (1995) = 100
Sub-Saharan Africa
Arab States
Central Asia
East Asia and the Pacific
South and West Asia
Latin America/Caribbean
N. America/W. Europe
Central and Eastern Europe
60 80 100 120 160140
School-age population as a % of the 1995 school-age population
126
85
153
8987
99108
93
108
7777
102104
109
7772
Figure 2.8: School-age population in 2006 and 2015
as a percentage of school-age population in 1995, by region
Source: UIS database.
School year ending inSchool year ending in School year ending in
598 648 688 1.0 0.8
508 561 609 1.3 1.073 70 66 -0.4 -0.718 16 13 -0.9 -2.8
63 82 116 3.3 4.531 35 40 1.9 1.6
5 7 6 3.1 -1.8207 218 192 0.6 -1.5204 214 189 0.6 -1.6
3 3 3 2.3 -0.1135 158 192 1.9 2.5
75 70 69 -0.9 -0.31 3 2 7.1 -0.4
74 68 66 -1.1 -0.350 53 51 0.7 -0.431 26 22 -2.3 -2.2
98 99 105 0.1 1.0
97 99 106 0.1 1.2102 102 101 0.0 -0.2
97 104 99 0.9 -0.9
72 78 95 0.7 2.984 90 97 0.8 1.390 98 100 1.1 0.3
118 112 109 -0.7 -0.5118 113 110 -0.7 -0.5
98 95 91 -0.4 -0.889 90 108 0.2 3.0
103 121 118 2.2 -0.670 112 108 5.3 -0.7
104 122 118 2.1 -0.6104 103 101 -0.1 -0.2
98 102 97 0.5 -0.9
81 82 86 0.2 0.6
78 81 85 0.3 0.796 97 95 0.1 -0.289 88 90 -0.1 0.3
54 56 70 0.3 2.073 78 84 0.6 0.984 87 89 0.3 0.397 96 93 -0.1 -0.397 96 94 -0.1 -0.391 90 84 0.0 -0.970 75 86 0.6 1.586 92 94 0.8 0.251 75 72 2.9 -0.487 93 95 0.8 0.396 97 95 0.0 -0.291 91 92 0.1 0.0
World
Developing countriesDeveloped countriesCountries in transition
Sub-Saharan AfricaArab StatesCentral AsiaEast Asia and the Pacific
East AsiaPacific
South and West AsiaLatin America/Caribbean
CaribbeanLatin America
N. America/W. EuropeCentral/Eastern Europe
Table 2.3: Primary enrolment by region, 1991, 1999 and 2006
(% per year)1(millions)
Changebetween1999 and
2006
Changebetween1991 and
1999200619991991
(percentage pointsper year)(%)(%)(%)
Changebetween1999 and
2006
Changebetween1991 and
1999200619991991
1. Average annual growth rate based on compound growth.Sources: Annex, Statistical Table 5; UIS database.
Total enrolment Gross enrolment ratios
(percentage pointsper year)(%)(%)(%)
Changebetween1999 and
2006
Changebetween1991 and
1999200619991991
Net enrolment ratios

90
02
Education f
or A
ll G
lobal M
onitorin
g R
eport
C H A P T E R 2
Net enrolment ratio: a benchmark for UPE
The net enrolment ratio (NER) is one of the most
robust instruments for measuring distance from
UPE. It captures the share of primary school age
children officially enrolled in school. Countries that
consistently register NERs of around 97% or more
have effectively achieved UPE since it means that
all children of the appropriate age are in primary
school and are likely to complete the cycle.
Post-Dakar progress on NERs has mirrored
advances in other areas (Table 2.3). The NER for
developing countries as a group has increased since
1999 at double the average annual rate registered
in the 1990s. This is a remarkable achievement.
Particularly remarkable by recent historical
standards has been the progress of sub-Saharan
Africa. During the 1990s the region’s NER increased
at an average of 0.3 percentage points a year to 56%
at the end of the decade. In 2006 it stood at 70% –
an average annual increase of two percentage
points, or six times the rate of the pre-Dakar decade.
South and West Asia also recorded an impressive
increase in NER, from 75% to 86%. The sharp rise
of enrolment rates despite rapid population growth
reflects the higher priority being attached to primary
education in many countries.
These achievements prove that rapid progress
towards UPE is possible, even under difficult
circumstances. Several countries in sub-Saharan
Africa have registered some particularly impressive
progress. For example, Benin, Madagascar, the
United Republic of Tanzania and Zambia have moved
since 1999 from NERs of between 50% and 70% to
levels in excess of 80%. Starting from an even lower
baseline, Ethiopia has doubled its NER, reaching
71% (Box 2.6). While the country still has a long way
Sub-Saharan
Africa has made
remarkable
advances
towards UPE
5 8
Box 2.6: Ethiopia — moving into the UPE fast lane
Ethiopia faces daunting development challenges, including highlevels of poverty, chronic malnutrition and recurrent drought.Yet the country has sustained an impressive push towards UPE.
The push started in 1997 with the adoption of the firstEducation Sector Development Plan (ESDP I), which prioritizedincreased access, greater equity and improved quality. Throughthe subsequent ESDP II and III, overall enrolment has increasedfrom 3.7 million to 12 million in 2007. Ethiopia has registeredone of the fastest NER increases in sub-Saharan Africa. It hascut the number of out-of-school children by over 3 million.Efforts to improve equity have also produced results. The GERin rural areas increased from 45% to 67% between 2000–2001and 2004–2005. Secondary education has expanded too withnumbers doubling since ESDP I.
What are the policy factors behind Ethiopia’s success?The priority attached to education in public spending hasincreased steadily since 1999: the education budget grew from3.6% of GNP to 6%. Within the education budget, more weighthas been attached to the primary sector. It accounts for 55%of spending under ESDP III compared with 46% under ESDP I.International aid accounts for around 17% of projectedspending to 2010.
A key target for increased public spending in education hasbeen rural school construction. Of the nearly 6,000 schoolsbuilt since 1997, 85% are in rural areas. This has reduceddistance to school and unlocked demand for education,especially for girls (distance being a significant barrier to girls’participation in education). Textbook distribution has improvedand contents revised to enhance quality and relevance:schoolbooks are now published in twenty-two local languages.
Much remains to be done if Ethiopia is to achieve the target ofUPE by 2015. Old problems persist — and success has broughtnew challenges. Regional variations in access remain wide. The two predominantly pastoral regions, Afar and Somali, have GERs of less than 20%. While gender disparities arefalling they remain large. And the country still has more than3 million children out of school.
The substantial expansion of enrolment has createdsystemwide pressures. Instead of going down as planned, theaverage pupil/teacher ratio (PTR) increased from 42:1 in 1997to 65:1 in 2006. A national learning assessment conducted in 2004 recorded no improvement in quality. Dropout ratesremain high, with nearly one in four students leaving schoolbefore grade 2. Households’ contributions to financing arehigh, both for school construction and recurrent costs, leading to concerns that this could further foster inequality.
Ambitious targets and strategies have been adopted to addressthese problems. Goals for 2010 include a GER of 109%, a GPI of the GER at 0.94 and a 64% primary school completion rate.Classroom construction is being scaled up, with an emphasison building near marginalized communities in areas with largeout-of-school populations. Financial incentives for girls’education are being strengthened, with targeted interventionsin areas where gender gaps are wide. Ethiopia envisagesrecruiting almost 300,000 teachers by 2010 to bring downPTRs while accelerating progress towards UPE.
Sources: Annex, Statistical Table 5; Ethiopia Ministry of Finance and Economic Development (2006, 2007).

T H E D A K A R G O A L S : M O N I T O R I N G P R O G R E S S A N D I N E Q U A L I T Y
to go to UPE, it has made dramatic advances in
improving access and tackling inequalities. One
important factor has been an ambitious school
construction programme in rural areas, which has
spurred demand by reducing the distance to school
and addressing security concerns for girls.
There are other striking success stories. Amidst
a destabilizing civil conflict, Nepal has increased
its NER from 65% to 79% since 1999. Governance
reforms involving transfer of resources and authority
to local communities and incentives aimed at
overcoming gender and caste inequalities played an
important role in improving access (Box 2.7). Among
the Arab States, Djibouti, Mauritania, Morocco and
Yemen, with the region’s four lowest NERs, have all
registered strong progress (Figure 2.9).
The policies behind increases in NER vary by country
but some consistent features emerge. While there
are no blueprints, there are some useful guides to
good practice. In several countries across sub-
Saharan Africa – including Ethiopia, Kenya, Lesotho,
the United Republic of Tanzania and Zambia – the
elimination of school fees has propelled enrolment
rates upwards. This was also a factor in Nepal.
Increased public spending and investment in
schools, teachers and teaching materials has been
critical. So has an increased focus on equity through
measures to remove barriers and create incentives
aimed at overcoming disadvantages based on
wealth, gender, social standing or caste.
International aid partnerships have played an
important role in some of the best performing
countries, including Ethiopia, Nepal and the United
Republic of Tanzania. Consistent and predictable
financial support for nationally-owned strategies
has made an important difference. The important
contribution that aid has made in many countries
casts into sharp relief the high costs associated with
the collective failure of donors to honour the pledges
undertaken at Dakar (see Chapter 4).
Out-of-school children: still a long way to go
In 2006 there were 28 million fewer out-of-school
children than when governments met in Dakar in
2000. Viewed against the backdrop of the 1990s,
when out of school numbers were rising in some
regions, progress has been dramatic. In sub-
Saharan Africa the number of primary school-age
Nepal has
succeeded
in increasing
enrolment
in the face
of civil conflict
5 9
P r o g r e s s t o wa r d s U P E : n a t i o n s a t t h e c r o s s r o a d s
Box 2.7: Nepal — also on fast-forward towards UPE
In recent years Nepal has registered rapid progress towardsUPE. The NER for 2004 stood at 79% — up from 65% in justfive years. Numbers of children out of school have fallenfrom 1 million to 700,000. And survival to grade 5 hasincreased from 58% to 79%. The fact that this progress was sustained during a civil conflict that ended only in 2006points to a remarkable achievement.
Nepal’s experience demonstrates that even the most deeply-rooted problems and inequalities are susceptible to public policies. Reforms in the following areas have been particularly important:
Strengthened local accountability. In 2001, reforms wereinitiated to increase school accountability and strengthencommunity management. Devolution of authority todistrict and community level insulated education from a general breakdown in centralized planning and serviceprovision, and from the impact of civil conflict. Around13% of public schools have been transferred to schoolmanagement committees. Each committee is providedwith a start-up grant. Schools receive salary grants to help them recruit teachers. A shift to financing linked to enrolment diluted political influence over resourceallocation.
Improved equity. Reforms have scaled up scholarshipprogrammes for girls, Dalits and disabled children atprimary and secondary level. The number of scholarshiprecipients increased to 1.7 million and the aim is to reach 7 million by 2009. Progress towards greater equity isreflected in a shrinking gender gap: the GPI of the primaryGER has increased from 0.77 in 1999 to 0.95 in 2006. And enrolment and survival rates for low-caste groups are increasing.
Infrastructure expansion and a focus on quality. Thecountry has embarked on an ambitious programme toincrease the number of schools and classrooms, expandteacher recruitment and improve the supply of textbooks.
Effective donor support. Nepal has been at the forefront of efforts to improve donor governance. Aid harmonization began in 1999, with five donors poolingresources to finance a primary education subsectorprogramme. Building on this, a sector-wide approach wasdeveloped to support the 2004–2009 Education for AllProgramme. Its success resulted in a steady increase in the share of pooled aid finance, reducing transactioncosts and enhancing predictability.
Sources: Annex, Statistical Tables 5 and 7; Nepal Ministry of Education and Sports (2006); World Bank (2007d).

90
02
Education f
or A
ll G
lobal M
onitorin
g R
eport
C H A P T E R 2
children not in school has fallen by 10 million since
1999, while the population in that age bracket has
increased by 17 million. Over the same time-frame,
South and West Asia almost halved its out-of-
school population, from 37 million to 18 million.
Encouraging as these trends may be there is a long
way to go. Some 75 million children of primary
school age are still not in school – and on current
trends the 2015 target will not be achieved.2
The circumstances and characteristics of out-of-
school children vary. Over four out of five live in
rural areas, mostly in South and West Asia, and
sub-Saharan Africa. The vast majority are poor and
many are the victims of a cross-generational
transfer of deprivation. Having a mother with no
education doubles the probability of a child’s being
out of school (UIS, 2005).
Measured in terms of scale and impact on life
chances, the out-of-school problem represents a
crucial human development challenge. More than
that, it represents an indictment of national and
international policy failures. In an increasingly
knowledge-based global economy, where national
and individual prosperity is linked more and more to
education, 12% of the developing world’s primary-
school-age population is not in school. In sub-
Saharan Africa the share is almost one in three.
2. The UNESCO Institutefor Statistics (UIS) hasrevised the out-of-schoolpopulation series usingmore up-to-datepopulation estimates from the United NationsPopulation Division. The revisions show that in 2005 there were 77 million children out of school.
6 0
Central Asia
East Asia and the Pacific
South and West Asia
Sub-Saharan Africa
Arab States
LiberiaNiger
EritreaBurkina Faso
MaliGambiaNigeria
SenegalEthiopia
GhanaGuinea
LesothoKenya
MozambiqueNamibia
SwazilandTogo
BeninBotswana
Zimbabwe Cape Verde
South AfricaMalawiZambia
MauritiusMadagascar
S. Tome/PrincipeU. R. Tanzania
DjiboutiOman
YemenPalestinian A. T.
MauritaniaLebanon
KuwaitU. A. Emirates
MoroccoIraq
JordanQatar
AlgeriaEgypt
TunisiaBahrain
20 40 60 80 100
Net enrolment ratios (%)
20
Azerbaijan
Kyrgyzstan
Georgia
Mongolia
Cook Islands
Lao PDR
Vanuatu
Cambodia
Samoa
Macao, China
Fiji
Philippines
Tonga
Australia
Rep. of Korea
Myanmar
Bhutan
Nepal
Bangladesh
Iran, Isl. Rep. 3
2
22
222
40 60 80 100
Net enrolment ratios (%)
1999 2006 (increase since 1999) 2006 (decrease since 1999) Stable
Figure 2.9: Change in primary net enrolment ratios in countries with NERs below 97% in 1999 or 20061
Note: See source table fordetailed country notes.1. The NER exceeded 97% inboth years in sixteen countries:nine in Western Europe, threein Latin America and theCaribbean, three in East Asiaand the Pacific, and one inSouth and West Asia.2. Countries where the durationof primary education changedbetween 1999 and 2006.3. The increase in the IslamicRepublic of Iran is due to therecent inclusion of literacyprogrammes.Source: Annex, Statistical Table 5.

T H E D A K A R G O A L S : M O N I T O R I N G P R O G R E S S A N D I N E Q U A L I T Y
These children are being deprived of the opportunity
to get their foot on the first rung of a ladder that
could give them the skills and knowledge to climb
out of poverty and break the transmission of
disadvantage across generations. While the initial
costs are borne most directly by those affected,
slow progress in getting children into school has
wider and longer-term consequences. The loss of
human potential behind the out-of-school numbers
undermines economic growth, deepens social
divisions, slows progress in public health, and
weakens the foundations for social participation and
democracy – and these are costs borne by society
as a whole.
The out-of-school population is heavily concentrated
geographically (Table 2.4). With around 19% of the
world’s primary school-age population, sub-Saharan
Africa accounts for 47% of out-of-school children
worldwide – a stark reminder of the scale of global
inequalities in the distribution of opportunities for
education. South and West Asia account for a
further one-quarter of the out-of-school population.
Within regions there is a heavy concentration by
country. Eight countries have more than 1 million
out-of-school children each – and four in ten children
not in school live in these countries (Figure 2.10).
The post-1999 record of countries with large out-
of-school populations is mixed. Some have failed
to make a dent in the numbers. This group includes
Nigeria – with more out-of-school than any other
country – along with Burkina Faso, Mali and the
Niger. Trends in Nigeria are cause for global
concern. The country accounts for around one in
nine of the world’s out-of-school children (Box 2.8).
And there is little evidence to suggest that, on
current policies, the country is set for an early
breakthrough.
In other countries with large out-of-school
populations in 1999, the picture is more
encouraging. For example, Bangladesh, Ethiopia,
Eight countries
have more
than 1 million
out-of-school
children each
6 1
P r o g r e s s t o wa r d s U P E : n a t i o n s a t t h e c r o s s r o a d s
Latin America and the Caribbean
North America and Western Europe
Central and Eastern Europe
20
DominicaDominican Rep.
Trinidad/TobagoBahamasColombia
NicaraguaJamaica
Venezuela, B. R.Brazil
GuatemalaBr. Virgin Is
BoliviaBarbados
PeruCuba
EcuadorBelize
SwitzerlandMalta
United StatesIreland
SwedenDenmark
FinlandIsrael
LuxembourgCyprusGreece
Rep. MoldovaHungary
LithuaniaLatvia
CroatiaTFYR Macedonia
BulgariaCzech Rep.
RomaniaAlbaniaEstonia
SloveniaPoland
40 60 80 100
Net enrolment ratios (%)
103 223 100 58 75 177 100 55
99 877 97 58 71 911 96 551 791 2 50 2 368 3 431 555 2 51 899 1 49
45 021 44 54 35 156 47 547 980 8 59 5 708 8 61
548 1 51 352 0.5 536 079 6 51 9 535 13 495 760 6 51 8 988 12 49
318 0.3 54 546 1 5236 618 35 64 18 203 24 59
3 522 3 54 2 631 3 47493 0.5 50 617 1 51
3 029 3 55 2 014 3 461 420 1 50 1 981 3 432 036 2 59 1 611 2 52
World
Developing countriesDeveloped countriesCountries in transition
Sub-Saharan AfricaArab StatesCentral AsiaEast Asia and the Pacific
East AsiaPacific
South and West AsiaLatin America/Caribbean
CaribbeanLatin America
N. America/W. EuropeCentral/Eastern Europe
Table 2.4: Estimated number of out-of-school children by region, 1999 and 2006
Total
(000)% by
region%
female
Note: The UIS has revised out-of-school numbers using new United Nations Population Division estimates. The revisions increased estimates of the number of out-of-school children, so figures for 1999 reported here are higher than those in the 2008 Report (UNESCO, 2007a).Source: Annex, Statistical Table 5.
1999 2006
Total
(000)% by
region%
female

90
02
Education f
or A
ll G
lobal M
onitorin
g R
eport
C H A P T E R 2
Ghana, Kenya, Nepal and the United Republic
of Tanzania have all been making rapid progress
towards UPE. The performance of the United
Republic of Tanzania is particularly striking. Since
1999 the country has reduced its out-of-school
population from over 3 million to less than 150,000
through policy interventions including the abolition
of primary school fees in 2001, increased public
investment and measures to enhance education
quality (Box 2.9).
This Report’s data on out-of-school children come
with some important caveats. In some countries
with large school-age populations (e.g. China,
the Sudan, Uganda), data are not available or
publishable for 2006. Estimates for these countries
are an approximation of the real picture. There are
also questions in some cases about the size
of the school-age population and the accuracy
of administrative data on enrolment.
6 2
Figure 2.10: Number of out-of-school children
in selected countries,1 1999 and 2006
Note: Estimates are for 2006 or the most recent year available. Data for India and Pakistan for 1999 are not available.1. Countries listed had more than 500,000 out-of-school children in 1999 or 2006.Source: Annex, Statistical Table 5.
Nigeria
India
Pakistan
Ethiopia
U. R. Tanzania
Bangladesh
Kenya
Iran, Isl. Rep.
Mozambique
Yemen
Ghana
Niger
Burkina Faso
Morocco
Nepal
Brazil
Philippines
Mali
Madagascar
Senegal
Guinea
Zambia
Iraq
Benin
Number of out-of-school children (000)
0 3 000 6 000 9 000
2006 (increase since 1999)1999 2006 (decrease since 1999)
Box 2.8: Nigeria off track —
the price of weak governance
Nigeria had 8 million children out of school in 2005 — 23% ofthe total for sub-Saharan Africa — and is not on track to achieveUPE by 2015. Its NER increased slowly between 1999 and 2005,from 58% to 63%, well below the regional average. To changethis picture the government will have to renew its commitmentto equity by addressing the following inequalities head-on:
Wide geographical differences in primary school enrolment.In the south-west, the average primary NER was 82% in 2006,compared with 42% in the poorer north-west.
Substantial gender gaps in primary school, particularly in the north. Only 40% of primary school-age girls areenrolled in some northern states, compared with 80% in the south-east.
Major income inequalities in school access. Children who havenever attended primary school come mainly from the pooresthouseholds. In Kaduna state, 48% of girls from the poorest20% of households have never attended, compared with 14%in the richest quintile.
Low enrolment and attendance rates among disadvantagedgroups have many causes. Cost is a significant barrier for many.Primary education in Nigeria is supposed to be free, but abouthalf of parents report paying formal or informal fees. Averageeducation-related costs represent about 12% of averagehousehold expenditure, a burden especially great on poorhouseholds. Other demand-side barriers are less tangible.Cultural attitudes, such as perceptions that girls’ education is of lesser value than that of boys, have a powerful bearing on the distribution of opportunity, especially in the north.Parents in northern states often prefer schools offering Islamiceducation, which do not all teach the core subjects of thenational curriculum.
Supply-side factors are also important. Serious quality deficits in education exist across Nigeria. An assessment of fifth-gradestudents in 2003 found that only 25% knew the answer to morethan a quarter of the test questions in core subjects. Averageclass size ranges from 145 pupils in the northern state of Bornoto 32 in the southern state of Lagos. The national ratio ofstudents to core textbooks is 2.3 to 1, the ratio of students totoilets 292 to 1. A significant proportion of teachers lack theminimum requirement of three years of post-secondaryeducation. Many have limited mastery of the subjects they teach.
The Nigerian Government has been forthright about the scale of the challenge it faces, calling for ‘nothing less than majorrenewal of all systems and institutions’ (World Bank, 2008e, p. 1).Top priorities include improved quality, intensified efforts torecruit and deploy teachers, strengthened budget managementand the development of financing mechanisms that can helpallocate resources more equitably. Rapid improvement alongthese lines will be needed if Nigeria is to achieve UPE by 2015.
Sources: Annex, Statistical Table 5; World Bank (2008e; 2008f).

T H E D A K A R G O A L S : M O N I T O R I N G P R O G R E S S A N D I N E Q U A L I T Y
Reporting systems themselves often provide an
imperfect measure of the out-of-school population.
This is especially true of countries marked by civil
conflict or going through post-conflict recovery
(Box 2.10) – as in the Democratic Republic of the
Congo. Acknowleging those limitations and
omissions, the Report brings together the best
of currently available data.
Characteristics of the ‘missing’ schoolchildren
‘Out-of-school children’ is a blanket category with
a complex underlying story. Not all children in the
category are in the same position.
Analysis of enrolment data by age suggests that
around 31% of the world’s out-of-school population
may eventually enrol as late entrants (Figure 2.11).
A further 24% were previously enrolled but dropped
out. This means that nearly half the children
currently out of school have never had any formal
education and are unlikely to enrol unless new
policies and additional incentives are put in place.
Here, too, the regional variations are wide. In sub-
Saharan Africa about two-thirds of the out-of-school
population is expected never to enrol. In South and
West Asia a similar share has enrolled but dropped
out. In Latin America and in East Asia, the
overwhelming majority of out-of-school children
have entered late or dropped out early. As these
contrasting experiences suggest, tackling the out-
of-school problem requires policy responses that
address specific structures of disadvantage.
Between 1999 and
2006 the number
of out-of-school
children fell
by over 3 million
in the United
Republic
of Tanzania
6 3
P r o g r e s s t o wa r d s U P E : n a t i o n s a t t h e c r o s s r o a d s
Box 2.9: United Republic of Tanzania — remarkable progress
A strong partnership of government, donors and civil society has been instrumental in the rapidimprovement in access to and completion of primaryeducation in the United Republic of Tanzania sinceDakar. In 2001 the government abolished primaryschool fees and launched a programme tosimultaneously improve access and quality at the primary level. The main components of theprogramme were:
Increased spending on education, with a focus on primary education. Public education spendingrose from 3% of GDP in 2000 to 4.5% in 2005.
School construction and rehabilitation throughschool development grants. Between 2002 and2004 some 30,000 new classrooms were built.
Introduction of double shifts. Splitting shifts made it possible to accommodate the large, rapid enrolment increases after fee abolition.
Recruitment of teachers and upgrading of currentstaff. An additional 32,000 primary school teacherswere recruited between 2002 and 2004.
Introduction of school capitation grants. At schoollevel, grants have paid for teaching and learningmaterials, including textbooks, to help defray schooloperating expenses and to support teachers’professional development.
Between 1999 and 2006 the number of out-of-schoolchildren of primary school age decreased dramatically,from over 3 million to under 150,000. The primaryNER went from 50% in 1999, before the programme,to 98% in 2006. Completion rates also improvedrapidly, partly due to improved teacher training andincreased availability of teaching and learningmaterials. With the introduction of school capitationgrants, non-salary spending at school level increasedfrom just 4% of the primary education budget to 27%in 2004. This significantly improved the availability of teaching and learning materials in schools, thoughpupil/textbook ratios remain high.
Sources: Annex, Statistical Table 5; HakiElimu (2005); UnitedRepublic of Tanzania Ministry of Education and Vocational Training(2007); United Republic of Tanzania Research and AnalysisWorking Group (2007); United Republic of Tanzania VicePresident’s Office (2005); World Bank (2005e).
% of total number of out-of-school children
0 20 40 60 80 100
World
Developing countries
Developed countries
Countries in transition
Sub-Saharan Africa
Arab States
Central Asia
East Asia and the Pacific
South and West Asia
Latin America/Caribbean
N. America/ W. Europe
Central/Eastern Europe
Expectednever to enrol
Enrolledbut dropped out
Expectedto enter late
Figure 2.11: Distribution of out-of-school children
by school exposure, by region, 2004
Source: Bruneforth (2008).

90
02
Education f
or A
ll G
lobal M
onitorin
g R
eport
C H A P T E R 2
Gender also has a bearing on the profile of out-of-
school children. In 2006, girls accounted for 55%
of the world’s out-of-school children. In addition,
they are far more likely than boys never to enrol.
Globally, 53% of out-of-school girls have never been
to school, compared with 36% of out-of-school
boys. Just over half the girls who were not enrolled
in school in 2006, in other words, had never been
enrolled and might never go to school without
additional incentives. On the other hand, 25% of
girls who are out of school may enter late – a lower
share than for boys (38%) – and 22% have dropped
out (26% for boys). Significant regional and national
differences characterize each of these areas:
Girls’ limited access to school is of particular
concern in sub-Saharan Africa, where 72% of
those not in school have never been enrolled,
compared with 55% for boys.
Dropout seems to be the main reason children
are not in school in South and West Asia, with
boys particularly affected: 79% of out-of-school
boys in the region have dropped out, compared
with 53% of girls.
In East Asia and in Latin America, most out-of-
school children, but particularly boys, may
eventually enrol late: 88% of boys in East Asia
and 76% in Latin America, compared with 67%
and 71% of girls, respectively.
Girls’ access to school remains a big issue in
India, Nigeria and Pakistan. These countries have
very wide gender gaps in the out-of-school
population profile. For example, in Nigeria 31%
of out-of school boys are unlikely ever to enrol,
compared with 69% of out-of-school girls
(Figure 2.12). Similar if somewhat smaller gender
differences (about twenty percentage points or
more) are found in Burundi, Guinea and Yemen.
If the goal of UPE is to be achieved by 2015, many
countries will have to strengthen their focus on
out-of-school children. There is more to UPE than
getting children into school: retention, completion
and learning outcomes are also critical. But
universal access is the first step. This is an area in
which a strengthened commitment to equity is vital.
Public investment has to be targeted and distributed
to bring education of good quality to marginalized
populations and rural areas. For the hardest to
reach, free education may not be enough, given the
large indirect costs often associated with school
attendance: paying for transport, uniforms, books
and other items may remain an obstacle. And
clearing the backlog of out-of-school children will
require more than education policies. The majority
of those out of school face disadvantages associated
with chronic poverty, gender, ethnicity and disability.
Overcoming these disadvantages will require
integrated policy approaches aimed at removing the
structural barriers that keep children out of school.
The gender profile of out-of-school children
highlights areas of great concern for UPE and the
2015 gender parity goals. The fact that out-of-school
girls are far more likely never to enrol underscores
the resilience of gender disadvantage. Given that the
social and economic background of out-of-school
girls and boys is broadly similar, it would appear
that the low social value ascribed to women’s
education is at the heart of the problem. If attitudes
are part of the problem, part of the solution has
to be changing attitudes – an area where political
leadership and public campaigning can make a
difference. That is a long-term project, but in the
meantime governments can lower other gender
barriers by providing incentives for girls’ education
and addressing parental fears for their daughters’
safety by building schools in local communities
(as the Ethiopian case above shows) and by
providing adequate sanitation.
Projections for 2015 — heading towards a broken promise
A year is a long time in politics and seven years
is a lifetime when it comes to assessing education
scenarios. Someone looking at the United Republic
Only integrated
approaches
can remove the
structural
barriers that
keep children
out of school
6 4
Box 2.10: Rebuilding statistical capacity
in the Democratic Republic of the Congo
After many years of conflict, the Democratic Republic of the Congohas begun an important process of political, social and economicreconstruction. Information on the education system was urgentlyneeded to help decision-makers in planning. With the help of theAfrican Development Bank, the country revitalized its educationmanagement information system so that reliable information can beregularly produced. After a pilot phase, data collection was extendedcountrywide in the 2006–2007 school year. Information wasgathered from about 90% of all education institutions and statisticalyearbooks were produced. Data collection and analysis continued in2007–2008. While progress has been impressive, a population censusis needed so that important education indicators such as enrolmentratios and completion rates can be computed more accurately.
Source: Sauvageot (2008).

T H E D A K A R G O A L S : M O N I T O R I N G P R O G R E S S A N D I N E Q U A L I T Y
of Tanzania in 1999 on the basis of education
performance since 1990 would have been justified in
acute pessimism. Projecting trends of that decade to
2015 would have led to the overwhelming conclusion
that millions of children would still be out of school
and that UPE was a Utopian dream. Re-running the
projection on the basis of data from 1999 would
produce a very different set of conclusions – and
UPE is now very much within reach. As the United
Republic of Tanzania has demonstrated,
governments have the option of altering their
course and choosing a different future.
Any projection to 2015 has to start by acknowledging
uncertainty and recognizing that change is possible.
Trend-based projections simply draw attention to
one possible outcome among many. They do not
define a country’s destiny. Changes in public policy
can dramatically change trends in education. Any
global projection is also highly sensitive to data
quality and coverage. Data constraints mean that
projections regarding children out of school can
provide only a partial picture.
With these caveats in mind, research updating trend
analysis carried out for the 2008 Report has been
used to develop an out-of-school projection. The
projection uses data from 1999 through to 2006 to
derive out-of-school populations for 2015 on the
basis of (i) predicted school-age populations and
(ii) total primary net enrolment ratios (TNERs)
derived from trend projections (Education Policy and
Data Center, 2008a). Data availability limited the
projection of out-of-school children to 134 countries.
While the list is partial, these countries were home
to 48 million children, or 64% of the out-of-school
population in 2006. It also includes all but one
of the countries in Figure 2.10 with out-of-school
populations in excess of 500,000 in 1999 or 2006.
However, countries not covered include the Sudan
and the Democratic Republic of the Congo.
The results point in a direction that should set
alarm bells ringing for all governments that signed
the Dakar Framework for Action (Table 2.5).
Projections for 2015 provide a clear early warning
sign of impending deficits. The main findings are:
Some 29 million children will be out of school
in the countries covered.
Nigeria will have the largest out-of-school
population (7.6 million), followed by Pakistan
(3.7 million), Burkina Faso (1.1 million),
Ethiopia (1.1 million), the Niger (0.9 million)
and Kenya (0.9 million).
Of these children, 20 million (71% of the total)
will be in the seventeen countries that had more
than 500,000 children out of school in 2006.
Just three of these seventeen countries –
Bangladesh, Brazil and India – are on track
to achieve TNERs in excess of 97% by 2015.
The projection highlights the very different trends
associated with current policies and outcomes
in this key country grouping, and the large gap
separating weak and strong performers.
The largest
projected
out-of-school
populations are in
Nigeria, followed
by Pakistan,
Burkina Faso,
Ethiopia, the Niger
and Kenya
6 5
P r o g r e s s t o wa r d s U P E : n a t i o n s a t t h e c r o s s r o a d s
0
Braz
il
Phili
ppin
es
Keny
a
Moz
ambi
que
Buru
ndi
Indi
a
Ghan
a
Paki
stan
Libe
ria
Cong
o
Leso
tho
Nig
eria
Yem
en
Tim
or-L
este
Guin
ea
Turk
ey
Gam
bia
Nig
er
Sene
gal
Burk
ina
Faso
Ethi
opia
Eritr
ea
Mal
i
C. A
. R.
Djib
outi
Nep
al
20
40
60
80
% o
f out
-of-s
choo
l chi
ldre
n un
likel
y to
enr
ol
100 MaleFemale
Figure 2.12: Percentage of out-of-school children unlikely to enrol, by gender, 2006
Note: Countries are sorted by the highest percentage, independent of gender.Source: Bruneforth (2008).

3. These figures areintended to demonstratethe likely magnitude of the out-of-schoolpopulation and are not as precise as those inTable 2.5. They arecalculated using GERs,which underestimate theout-of-school populationof primary school agebecause GERs includeenrolled children outsidethe official age range.
4. Primary grossenrolment ratiosincreased from 48% to 61% between 1999and 2003.
5. Between 1999 and 2006 the GER in theSudan rose from 49% to 66%. Estimates for 2015 are based on a linear projection of all GER information between 1999 and 2006.
90
02
Education f
or A
ll G
lobal M
onitorin
g R
eport
C H A P T E R 2
Another three of these seventeen countries –
Ethiopia, Mozambique and Yemen – also perform
strongly in terms of projected percentage
declines in out-of-school populations, with
annual declines of over 10%. However these
countries will not achieve the 2015 target without
increased effort.
The remaining eleven out of seventeen countries
reduce out-of-school numbers by less than 10%
annually and will miss the 2015 target.
What of countries not covered in the projection?
In terms of population, the major absent players
are China, the Democratic Republic of the Congo
and the Sudan. China is well placed to ensure that
all children are in school by 2015. Prospects for the
two others are less certain, but hardly encouraging.
The Democratic Republic of the Congo had about
10 million children of primary school age in 2005.
Using the latest information on primary school
enrolment, a conservative estimate would put the
number out of school at 3.5 million.3 The limited
data on enrolment expansion between 1999 and
2003 suggest that progress has been slow and the
country is unlikely to meet the 2015 goal.4 A similar
pattern emerges in the Sudan, which in 2005 had
around 6 million children of primary school age.
Extrapolation from GERs would suggest that about
2 million of these children were out of school.
While the Sudan has made steady progress since
1999 the country is not on course to enrol all
primary school aged children by 2015. Without
additional effort approximately 1.3 million children
would still be out of school by 2015.5 In both the
Democratic Republic of the Congo and the Sudan,
three of the most vital requirements for changing
the current trajectory are peace, stability and
reconstruction.
6 6
India 94 7 208 99 626 -24Bangladesh 92 1 371 98 322 -15Brazil 96 597 98 248 -9
Nigeria 65 8 097 73 7 605 -1Pakistan 66 6 821 81 3 707 -7Burkina Faso 48 1 215 64 1 062 -1Ethiopia 72 3 721 93 1 053 -13Philippines 92 953 93 919 -0.4Niger 44 1 245 72 873 -4Kenya 76 1 371 89 859 -5Ghana 65 967 81 712 -3Turkey 91 729 91 710 -0.3Mali 61 793 76 628 -3Mozambique 76 954 94 289 -12Yemen 75 906 94 265 -13Iraq 89 508 95 246 -8Senegal 72 513 90 228 -9
Subtotal – 37 969 – 20 352 –
Remaining 117 countriesincluded in projection – 10 387 – 8 341 –
Total – 48 356 – 28 693 –
Table 2.5: Projections of out-of-school populations in 2015 for countries
with more than 500,000 children out of school in 2006
TNER for latest year(2004–2007)
Children out-of-school in 2004–2007
(000)
ProjectedTNER(2015)
Estimated out-of-school children
in 2015(000)
Average annualchange in out-of-school population
(%)
Notes: Countries are included if available information indicates they had out-of-school populations of over 500,000 in 2006. Countries are ranked according to the size of their estimated out-of-school populations in 2015. See Annex, Statistical Table 5, for detailed country notes.Sources: TNER projections: Education Policy and Data Center (2008a); population projections: UIS database.
On track to achieve UPE in 2015
Not on track to achieve UPE in 2015

T H E D A K A R G O A L S : M O N I T O R I N G P R O G R E S S A N D I N E Q U A L I T Y
Out-of-school trends and the projections to 2015
highlight once again the importance of public
policies. On average, the percentage of children
out of school in developing countries is inversely
related to income: as wealth rises, the incidence
of children not in school declines. But income is
not an absolute constraint. Nigeria is far wealthier
than Ethiopia and has access to large revenue
flows from oil exports, yet Ethiopia is greatly
outperforming Nigeria in progress towards UPE
and reduction of out-of-school numbers. Similarly,
Pakistan is wealthier than the United Republic of
Tanzania or Nepal, yet its slow progress towards
UPE will leave it second only to Nigeria in terms
of projected out-of-school population in 2015.
While the underlying causes of variable
performance are complex, governance figures
prominently. Ethiopia, Nepal and the United
Republic of Tanzania have increased overall
investment in education and strengthened their
commitment to equity. Nigeria and Pakistan
combine weak governance with high levels of
inequity in finance and provision (see Chapter 3).
Progression through school: dropout,repetition and low survival rates
Getting children into school is a necessary condition
for achieving UPE, but not a sufficient one. What
counts is completion of a full cycle. Depending on
the length of the primary or basic education cycle,
this means all children must be in school by around
2009 at an appropriate age, and progress smoothly
through the system, to make the 2015 goal. Even
getting within range of this objective will require
rapid and far-reaching change.
In many developing countries smooth progression
through the primary school system is the exception
rather than the rule. Students are locked into cycles
of repetition and dropout. The cycles are mutually
reinforcing because repetition is often a prelude to
dropout. Tracking cohorts through primary school
serves to demonstrate the scale of the problem
(Figure 2.13). Take the case of Malawi. Just over
60% of children enter primary school at the official
age. Around half of these drop out or repeat grade 1
In many
developing
countries,
students are
locked into
cycles of
repetition
and dropout
6 7
P r o g r e s s t o wa r d s U P E : n a t i o n s a t t h e c r o s s r o a d sSh
are
of p
upils
from
a g
iven
coh
ort w
ho w
ill re
ach
each
gra
dew
ithou
t rep
etiti
on o
r dro
pout
(%)
100
Net intake rate Grade 1 Grade 2 Grade 3 Grade 4 Grade 5
20
0
40
60
80
94 Cuba
59 Pakistan 56 U. R. Tanzania
27 Dominican Rep. 24 Ethiopia 23 Cambodia 19 Benin 18 Lao PDR
10 Madagascar 8 Mali 7 Malawi
Figure 2.13: Primary school progression without repetition or dropout, selected countries, 2006
Notes: Primary school progression is calculated using net intake and grade-specific drop-out and repetition rates.Source: Annex, Statistical Tables 4, 6 and 7.
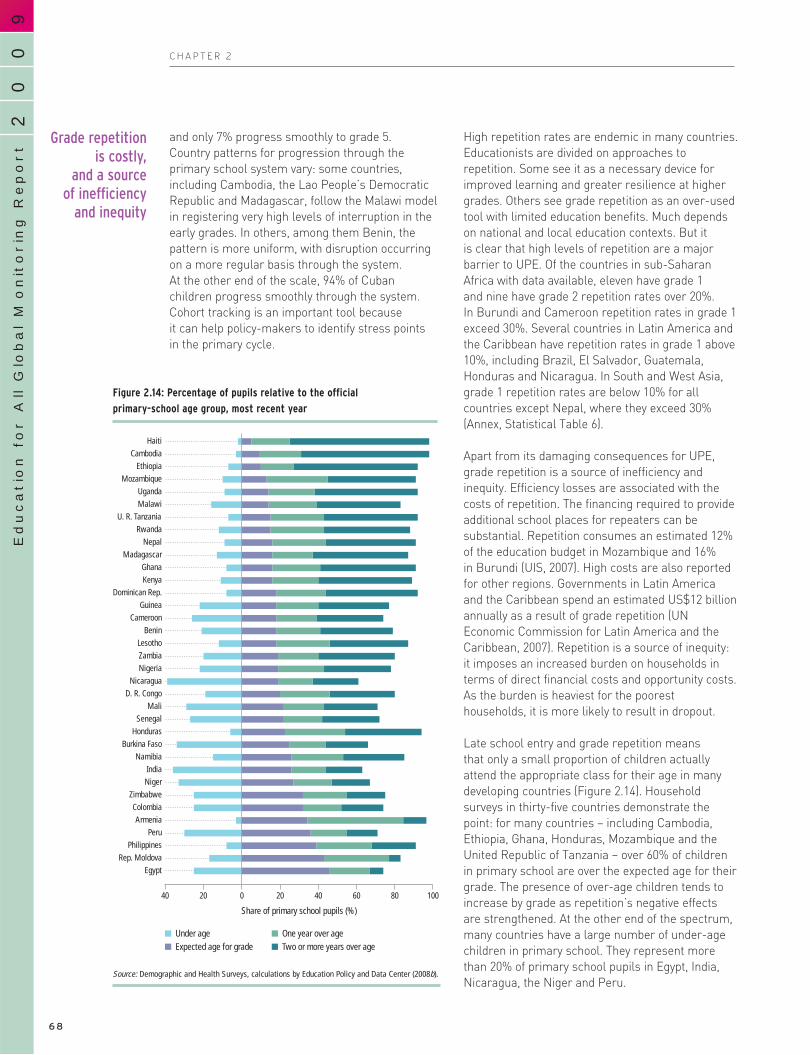
90
02
Education f
or A
ll G
lobal M
onitorin
g R
eport
C H A P T E R 2
and only 7% progress smoothly to grade 5.
Country patterns for progression through the
primary school system vary: some countries,
including Cambodia, the Lao People’s Democratic
Republic and Madagascar, follow the Malawi model
in registering very high levels of interruption in the
early grades. In others, among them Benin, the
pattern is more uniform, with disruption occurring
on a more regular basis through the system.
At the other end of the scale, 94% of Cuban
children progress smoothly through the system.
Cohort tracking is an important tool because
it can help policy-makers to identify stress points
in the primary cycle.
High repetition rates are endemic in many countries.
Educationists are divided on approaches to
repetition. Some see it as a necessary device for
improved learning and greater resilience at higher
grades. Others see grade repetition as an over-used
tool with limited education benefits. Much depends
on national and local education contexts. But it
is clear that high levels of repetition are a major
barrier to UPE. Of the countries in sub-Saharan
Africa with data available, eleven have grade 1
and nine have grade 2 repetition rates over 20%.
In Burundi and Cameroon repetition rates in grade 1
exceed 30%. Several countries in Latin America and
the Caribbean have repetition rates in grade 1 above
10%, including Brazil, El Salvador, Guatemala,
Honduras and Nicaragua. In South and West Asia,
grade 1 repetition rates are below 10% for all
countries except Nepal, where they exceed 30%
(Annex, Statistical Table 6).
Apart from its damaging consequences for UPE,
grade repetition is a source of inefficiency and
inequity. Efficiency losses are associated with the
costs of repetition. The financing required to provide
additional school places for repeaters can be
substantial. Repetition consumes an estimated 12%
of the education budget in Mozambique and 16%
in Burundi (UIS, 2007). High costs are also reported
for other regions. Governments in Latin America
and the Caribbean spend an estimated US$12 billion
annually as a result of grade repetition (UN
Economic Commission for Latin America and the
Caribbean, 2007). Repetition is a source of inequity:
it imposes an increased burden on households in
terms of direct financial costs and opportunity costs.
As the burden is heaviest for the poorest
households, it is more likely to result in dropout.
Late school entry and grade repetition means
that only a small proportion of children actually
attend the appropriate class for their age in many
developing countries (Figure 2.14). Household
surveys in thirty-five countries demonstrate the
point: for many countries – including Cambodia,
Ethiopia, Ghana, Honduras, Mozambique and the
United Republic of Tanzania – over 60% of children
in primary school are over the expected age for their
grade. The presence of over-age children tends to
increase by grade as repetition’s negative effects
are strengthened. At the other end of the spectrum,
many countries have a large number of under-age
children in primary school. They represent more
than 20% of primary school pupils in Egypt, India,
Nicaragua, the Niger and Peru.
Grade repetition
is costly,
and a source
of inefficiency
and inequity
6 8
Share of primary school pupils (%)
0 20 40 60 80 100
Under ageExpected age for grade
One year over ageTwo or more years over age
HaitiCambodia
EthiopiaMozambique
UgandaMalawi
U. R. TanzaniaRwanda
NepalMadagascar
GhanaKenya
Dominican Rep.Guinea
CameroonBenin
LesothoZambiaNigeria
NicaraguaD. R. Congo
MaliSenegal
HondurasBurkina Faso
NamibiaIndia
NigerZimbabweColombiaArmenia
PeruPhilippines
Rep. MoldovaEgypt
2040
Figure 2.14: Percentage of pupils relative to the official
primary-school age group, most recent year
Source: Demographic and Health Surveys, calculations by Education Policy and Data Center (2008b).

T H E D A K A R G O A L S : M O N I T O R I N G P R O G R E S S A N D I N E Q U A L I T Y
Why do age profiles for primary school matter?
Figure 2.15 provides part of the answer: it shows
that over-age children are far less likely to survive
through to grade 9. In countries such as India,
Mozambique, Peru and the Philippines, being two
years over age more than halves the chances of
survival. For the thirty-five countries examined, the
pattern confirms a well-established trend: over-age
children are far more likely to drop out, especially
in the later grades.
Less attention has been paid in policy debate to
under-age children. The survey evidence suggests
this may be a mistake. In many countries, under-
age children are far more likely to repeat early
grades – an outcome with important implications
for class size and education quality. In Cameroon
and Uganda, under-age pupils represent a large
share of grade 1 pupils and have high repetition
rates. Under-age pupils account for the bulk of
repeaters in countries with low repetition rates,
including India, the Niger and Nigeria (Figure 2.16).
The overall pattern to emerge from monitoring
evidence is that being over age strongly predisposes
children to drop out, while being under age makes
repetition more likely. The prevalence of under-age
children in many countries has important
implications for education planning. It suggests
that, in many countries, parents are using the first
primary grade to make up for inadequate
pre-school provision. Expanding pre-school
participation in such cases could reduce repetition
in the early primary grades, with important
efficiency and equity benefits.
Under-age children
tend to repeat,
while over-age
children tend
to drop out
6 9
P r o g r e s s t o wa r d s U P E : n a t i o n s a t t h e c r o s s r o a d s
0 20 40 60 80 100
Rep. MoldovaGhana
GuineaEgypt
NamibiaCambodia
Dominican Rep.D. R. Congo
NepalMadagascar
BeninMali
NigeriaPeru
CameroonPhilippines
SenegalHonduras
IndiaColombia
MozambiqueUgandaEthiopia
KenyaLesotho
ZimbabweNicaragua
ZambiaNiger
Expected age for grade One year over ageTwo or more years over age
Survival rate (%)
Figure 2.15: Survival rates to grade 9 for three age
groups: expected age for grade, one year over age
and two or more years over age, most recent year
Source: Demographic and Health Surveys, calculations by EducationPolicy and Data Center (2008b).
Peru
Colombia
Nicaragua
Zambia
Senegal
Burkina Faso
Zimbabwe
Guinea
Mali
Niger
Ghana
Benin
Dominican Rep.
D. R. Congo
Philippines
Ethiopia
Nigeria
India
U. R. Tanzania
Rwanda
Cameroon
Kenya
Malawi
Mozambique
Madagascar
Haiti
Uganda
Lesotho
Nepal
Cambodia
0 20 40 60 80
Under-age pupils as a % of grade 1 pupils
Under-age grade 1 repetition rate
Total grade 1 repetition rate
(%)
Figure 2.16: Under-age pupils as a percentage of grade 1 enrolment, total
repetition rate and under-age repetition rate for grade 1, most recent year
Source: Demographic and Health Surveys, calculations by Education Policy and Data Center (2008b).

90
02
Education f
or A
ll G
lobal M
onitorin
g R
eport
C H A P T E R 2
High dropout rates for over-age pupils point to
a wider set of policy problems. Some are linked
to education quality: dropout is more likely when
children fail grades. Non-school factors are also
important. In higher grades over-age pupils may
face growing pressure to get a job, to take over
household work or, in the case of girls, to marry.
To the extent that such pressure is linked to
poverty, social protection programmes and financial
incentives to keep children in school can make
a difference.
Mixed patterns of access and survival
The rate of progress to UPE is a function of
advances – or setbacks – on two fronts: enrolment
and completion. Enrolment matters for a very
obvious reason: being in school is a requirement for
receiving a primary education. But getting through
a full cycle of primary education is a necessary,
though far from sufficient, condition for achieving
the level of learning needed to equip children with
the skills they need.
The relationship between enrolment and
completion is not clear cut. Figure 2.17 illustrates
four broad patterns that can be identified using
international data. It locates countries on the basis
of their NER and survival rates to the last grade of
primary school.
1) Low enrolment, low survival: this group has the
furthest to travel to UPE. It comprises twenty
countries, all but three of them in sub-Saharan
Africa.
2) Low enrolment, high survival: only a small group
of countries fit into this category. This group
includes Kenya and the Palestinian Autonomous
Territories.
3) High enrolment, low survival: this category
covers twenty-one countries, from Malawi in
sub-Saharan Africa to Nicaragua and Guatemala
in Latin America and Cambodia and the
Philippines in East Asia.
4) High enrolment, high survival: this group
includes a diverse array of countries that have
achieved or are close to achieving UPE.
Countries in groups 1 and 3 face overlapping but
distinctive challenges. For group 1, the twin priority
is to increase enrolment rapidly while improving
retention levels. In Rwanda, one in five primary
school-age children were out of school in 2005.
Of those in school only around one-third make
it through to the last grade. To varying degrees,
countries in group 3 have succeeded in raising
NER levels but face problems in survival.
For example, Madagascar, Malawi and Nicaragua
have achieved NERs of 90% and above, but fewer
than half of those who enrol survive to the last
grade of primary school.
Experience since Dakar powerfully demonstrates
that past trends do not dictate destiny. Some
countries have moved a long way since 1999, as
the experiences of Burundi, Ethiopia, Mozambique
and the United Republic of Tanzania demonstrate
(Figure 2.18). Each has dramatically increased
primary net enrolment. Performance in improving
survival to the last grade has been more mixed,
with limited progress in Ethiopia and Mozambique
but more striking advances in Burundi and,
from a higher starting point, the United Republic
of Tanzania. The experience of Nepal is also
encouraging.
Unfortunately, experience since 1999 also
demonstrates that less favourable outcomes are
possible. As Figure 2.18 shows, Malawi rapidly
increased NER levels in the 1990s, then failed
to improve survival rates. The Philippines has
sustained high enrolment levels but experienced
a decline in survival. Madagascar has registered
dramatic progress towards universal enrolment
with an equally dramatic decline in survival to
the last grade.
In one important respect Figure 2.18 understates
the distance to UPE. Survival to the last grade is
not the same as completion of the last grade. Many
children reaching the final grade prove unable to
negotiate the last hurdle. In Burundi, Mauritania,
Nepal and Senegal, for instance, only about half
the children who survive to the last grade actually
complete it (see annex, Statistical Table 7). What
that means in Senegal is that only 30% of primary
school-age children complete the full primary cycle.
The global gulf in educationalopportunity
Progress towards UPE should not deflect attention
from the vast disparities in opportunity that divide
rich and poor nations. If UPE is a first rung on the
ladder, progression up the ladder is heavily influenced
not by innate ability but by where a child is born.
A full cycle
of primary
education is
essential for
equipping
children with the
skills they need
7 0
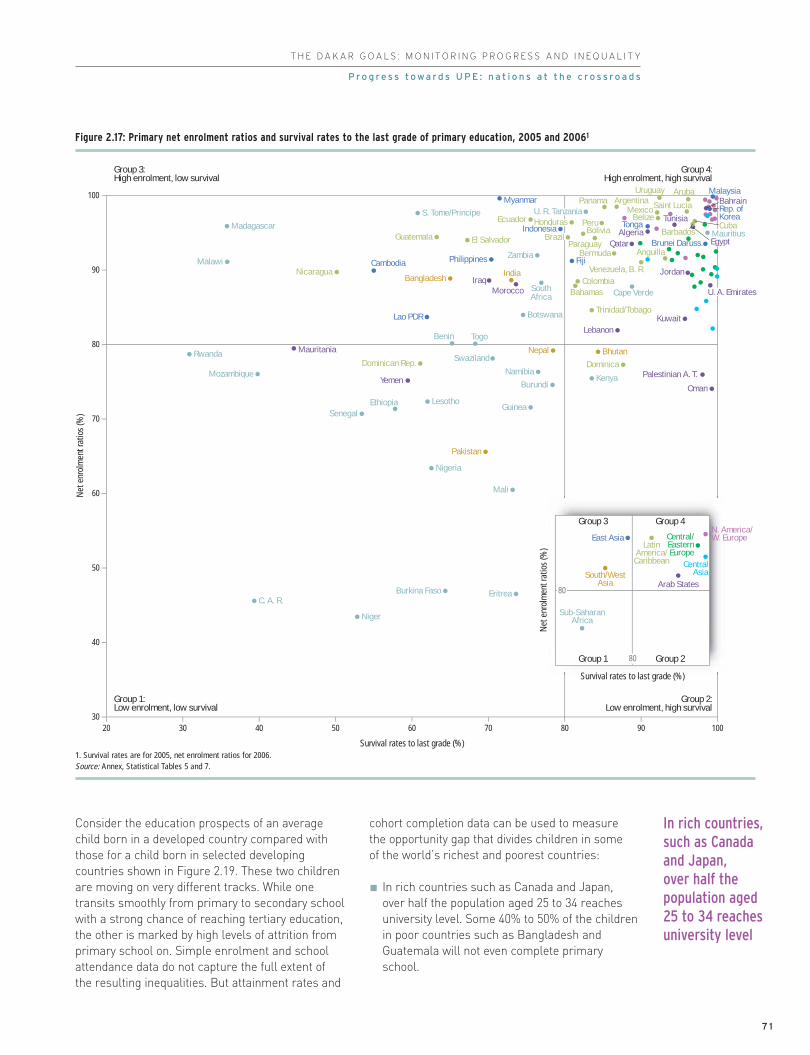
T H E D A K A R G O A L S : M O N I T O R I N G P R O G R E S S A N D I N E Q U A L I T Y
Consider the education prospects of an average
child born in a developed country compared with
those for a child born in selected developing
countries shown in Figure 2.19. These two children
are moving on very different tracks. While one
transits smoothly from primary to secondary school
with a strong chance of reaching tertiary education,
the other is marked by high levels of attrition from
primary school on. Simple enrolment and school
attendance data do not capture the full extent of
the resulting inequalities. But attainment rates and
cohort completion data can be used to measure
the opportunity gap that divides children in some
of the world’s richest and poorest countries:
In rich countries such as Canada and Japan,
over half the population aged 25 to 34 reaches
university level. Some 40% to 50% of the children
in poor countries such as Bangladesh and
Guatemala will not even complete primary
school.
In rich countries,
such as Canada
and Japan,
over half the
population aged
25 to 34 reaches
university level
7 1
P r o g r e s s t o wa r d s U P E : n a t i o n s a t t h e c r o s s r o a d s
Survival rates to last grade (%)
Net
enr
olm
ent r
atio
s (%
)
Algeria
Bahrain
IraqJordan
KuwaitLebanon
Mauritania
Morocco
Oman
Palestinian A. T.
Qatar
Tunisia
Yemen
Brunei Daruss.
Cambodia Fiji
Indonesia
Lao PDR
Bangladesh
MalaysiaMyanmar
Philippines
Rep. of Korea
Tonga
Anguilla
ArgentinaAruba
Bahamas
Barbados
Belize
Bermuda
BoliviaBrazil
Colombia
Cuba
DominicaDominican Rep.
Ecuador
El SalvadorGuatemala
HondurasMexico
Nicaragua
Panama
Paraguay
Peru
Saint Lucia
Trinidad/Tobago
Uruguay
Venezuela, B. R.
Bhutan
India
Nepal
Pakistan
Benin
Botswana
Burkina Faso
Burundi
Cape Verde
C. A. R.Eritrea
Ethiopia Guinea
Kenya
Lesotho
Madagascar
Malawi
Mali
Mauritius
Mozambique Namibia
Niger
Nigeria
Rwanda
S. Tome/Principe
Senegal
SouthAfrica
Swaziland
Togo
U. R. Tanzania
Zambia
30
40
50
60
70
80
90
100
20 30 40 50 60 70 80 90 100
Group 3:High enrolment, low survival
Group 1:Low enrolment, low survival
Group 4:High enrolment, high survival
Group 2:Low enrolment, high survival
Egypt
U. A. Emirates
Survival rates to last grade (%)
Net
enr
olm
ent r
atio
s (%
)Central/EasternEurope
East Asia
South/WestAsia
Sub-SaharanAfrica
CentralAsia
LatinAmerica/Caribbean
Arab States
Group 1 Group 2
Group 3 Group 4N. America/W. Europe
80
80
Figure 2.17: Primary net enrolment ratios and survival rates to the last grade of primary education, 2005 and 20061
1. Survival rates are for 2005, net enrolment ratios for 2006.Source: Annex, Statistical Tables 5 and 7.

90
02
Education f
or A
ll G
lobal M
onitorin
g R
eport
C H A P T E R 2
Children in France are twice as likely to enter
tertiary education as children in Benin or the
Niger are to complete primary school.
Children in the United Kingdom have a greater
probability of entering tertiary education than
their counterparts in countries such as
Mozambique, Senegal or Uganda have of
completing primary education.
There are limitations to the use of probability
indicators for measuring disparity. One limitation
is that they heavily understate the scale of the
problem, as they measure only quantitative gaps.
Introducing quality-adjusted indicators that factor
in the level of provision, state of infrastructure
and learning outcomes would reveal much larger
inequalities.
Disparities within countries: a barrier to EFA
Children do not select the wealth of the households
they are born into, or choose their race, language,
ethnic group or gender. Yet these predetermined
circumstances powerfully influence the distribution
of opportunity for education within countries.
In the Dakar Framework countries pledged to try
to reach the most disadvantaged and equalize
7 2
Survival rates to last grade (%)
Net
enr
olm
ent r
atio
s (%
)
30
40
50
60
70
80
90
100
20 30 40 50 60 70 80 90 100
Iraq
Mauritania
Indonesia
PhilippinesZambia
U. R. Tanzania
Nicaragua
Guatemala
Nepal
EritreaBurkina Faso
Ethiopia
Bhutan
Mozambique
Madagascar
Malawi Cambodia
End yearStart year
Burundi
Figure 2.18: Changes in net enrolment ratios and survival rates in primary education, selected countries1
1. The start year is 1999 for all countries except Burundi and the United Republic of Tanzania, where it is 2000. The end year is 2005 for survival rates and 2006 for net enrolment ratios.Source: Annex, Statistical Tables 5 and 7.
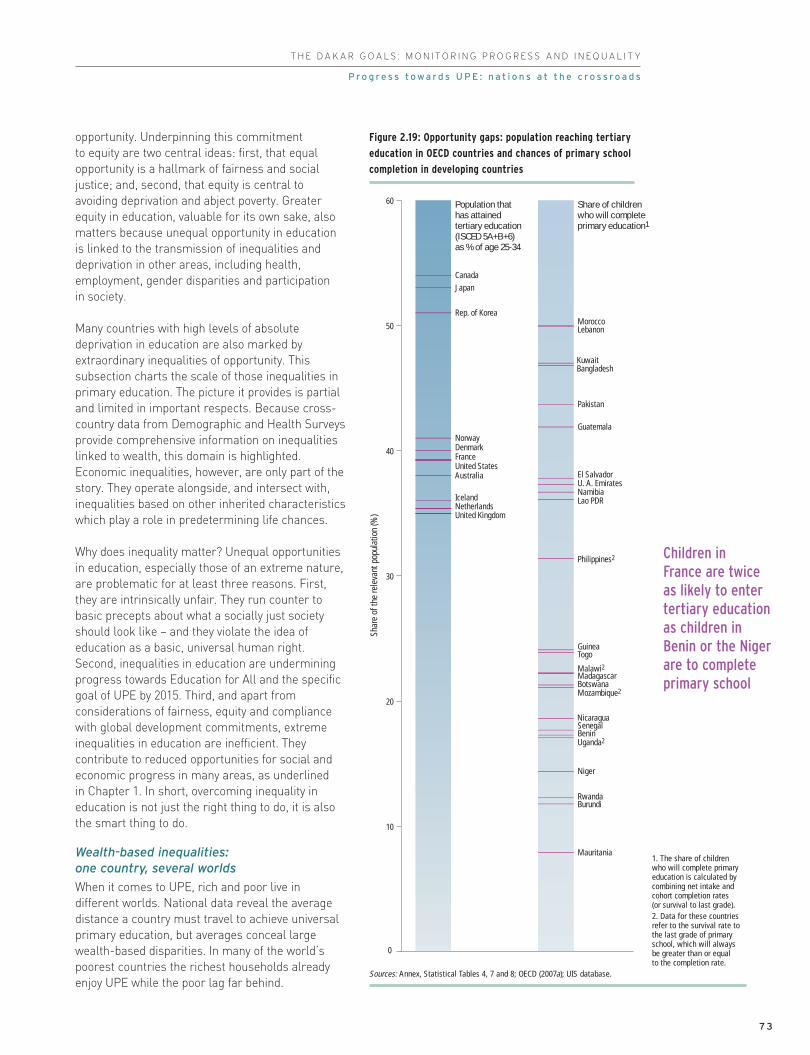
T H E D A K A R G O A L S : M O N I T O R I N G P R O G R E S S A N D I N E Q U A L I T Y
Children in
France are twice
as likely to enter
tertiary education
as children in
Benin or the Niger
are to complete
primary school
7 3
P r o g r e s s t o wa r d s U P E : n a t i o n s a t t h e c r o s s r o a d s
opportunity. Underpinning this commitment
to equity are two central ideas: first, that equal
opportunity is a hallmark of fairness and social
justice; and, second, that equity is central to
avoiding deprivation and abject poverty. Greater
equity in education, valuable for its own sake, also
matters because unequal opportunity in education
is linked to the transmission of inequalities and
deprivation in other areas, including health,
employment, gender disparities and participation
in society.
Many countries with high levels of absolute
deprivation in education are also marked by
extraordinary inequalities of opportunity. This
subsection charts the scale of those inequalities in
primary education. The picture it provides is partial
and limited in important respects. Because cross-
country data from Demographic and Health Surveys
provide comprehensive information on inequalities
linked to wealth, this domain is highlighted.
Economic inequalities, however, are only part of the
story. They operate alongside, and intersect with,
inequalities based on other inherited characteristics
which play a role in predetermining life chances.
Why does inequality matter? Unequal opportunities
in education, especially those of an extreme nature,
are problematic for at least three reasons. First,
they are intrinsically unfair. They run counter to
basic precepts about what a socially just society
should look like – and they violate the idea of
education as a basic, universal human right.
Second, inequalities in education are undermining
progress towards Education for All and the specific
goal of UPE by 2015. Third, and apart from
considerations of fairness, equity and compliance
with global development commitments, extreme
inequalities in education are inefficient. They
contribute to reduced opportunities for social and
economic progress in many areas, as underlined
in Chapter 1. In short, overcoming inequality in
education is not just the right thing to do, it is also
the smart thing to do.
Wealth-based inequalities: one country, several worlds
When it comes to UPE, rich and poor live in
different worlds. National data reveal the average
distance a country must travel to achieve universal
primary education, but averages conceal large
wealth-based disparities. In many of the world’s
poorest countries the richest households already
enjoy UPE while the poor lag far behind.
Shar
e of
the
rele
vant
pop
ulat
ion
(%)
0
10
20
30
40
50
60
CanadaJapan
Rep. of Korea
NorwayDenmarkFranceUnited StatesAustralia
Iceland
United KingdomNetherlands
MoroccoLebanon
KuwaitBangladesh
Guatemala
Pakistan
Lao PDR
El Salvador
NamibiaU. A. Emirates
Nicaragua
Philippines2
TogoGuinea
Malawi2MadagascarBotswanaMozambique2
Burundi
SenegalBenin
Niger
Uganda2
Rwanda
Mauritania
Population that has attained tertiary education (ISCED 5A+B+6) as % of age 25-34
Share of children who will complete primary education1
Figure 2.19: Opportunity gaps: population reaching tertiary
education in OECD countries and chances of primary school
completion in developing countries
1. The share of children who will complete primaryeducation is calculated bycombining net intake andcohort completion rates (or survival to last grade). 2. Data for these countriesrefer to the survival rate tothe last grade of primaryschool, which will alwaysbe greater than or equalto the completion rate.
Sources: Annex, Statistical Tables 4, 7 and 8; OECD (2007a); UIS database.

90
02
Education f
or A
ll G
lobal M
onitorin
g R
eport
C H A P T E R 2
Figure 2.20 traces the border separating the
worlds of rich and poor using household survey
data for primary school attendance.6 While their
nations may have a long way to go to UPE, the
wealthiest 20% in countries such as Bangladesh,
Ghana, India and Nigeria do not: most have already
arrived. The wealth gaps reflected in attendance
data are often very large. In Bolivia, Burkina Faso,
Chad, Ethiopia, Mali and the Niger, children from
the richest 20% are two to three times more likely
to attend school than children from the poorest
quintile. A striking feature to emerge from the data
is that, irrespective of the overall wealth position of
their country, children born into the richest quintile
in all of these countries have similar attendance
and attainment rates. For example, attendance
rates for the richest quintile in India and Nigeria
are the same, even though Nigeria’s average
attendance rate is far lower.
Patterns of inequality are conditioned by
attendance levels (Figure 2.21). Disparities tend
to be far larger in countries with low average
attendance rates, for statistical reasons.
As countries progress towards 100% attendance
at the top end of the distribution, any average
increase in attendance narrows inequalities
and produces convergence by definition.
Thus, attendance inequalities are far higher
in Côte d’Ivoire, for instance, than in Uganda.
However, the relationship is not uniform. There
are some marked differences between countries
at a considerable distance from UPE. To take
one example, Nigeria has far wider inequalities
in attendance than Senegal, despite having higher
average attendance rates. This is an outcome that
points to problems of extreme marginalization.
The poorest 20% in Nigeria have attendance
levels far below those that might be predicted
given the national average attendance rate –
an indication that some groups or regions are
being left far behind.
One word of caution has to be applied to wealth-
based cross-country comparisons. The poorest
20% denotes a position in the national distribution
and not a common level of income. The poorest
20% in, say, Viet Nam, have higher levels of
average income than the poorest 20% in Burkina
Faso. The incidence and depth of poverty within the
6. Attendance ratesrecorded in householdsurveys are used to lookat participation in school,and attainment levels tolook at levels of educationamong people likely tohave completed theireducation. Householdsare ranked using an indexof household assets, thengrouped into quintilesaccording to their levelof wealth.
7 4
Primary education attainment for ages 17 to 22 (%)
0 20 40 60 80 100
Net
atte
ndan
ce ra
te in
prim
ary
educ
atio
n (%
)
0
20
40
60
80
100
Benin
Burkina Faso
Ethiopia
Ghana
India
Indonesia
Madagascar
Malawi
Nicaraga
Niger
Nigeria
Rwanda
Bangladesh
BangladeshBenin
Burkina FasoEthiopia Ghana
India
IndonesiaMadagascar
Malawi
Niger
Nigeria
Nicaragua
Rwanda
Richest 20%Poorest 20%
Figure 2.20: Primary net attendance and primary attainment rates for poorest and richest, selected countries, most recent year
Source: Demographic and Health Surveys, calculations by Harttgen et al. (2008).

T H E D A K A R G O A L S : M O N I T O R I N G P R O G R E S S A N D I N E Q U A L I T Y
poorest 20% also varies with average income and
income distribution. Nevertheless, cross-country
comparison raises some important questions.
Why, for example, does Côte d’Ivoire have a lower
attendance rate and higher inequality in
attendance than Mozambique despite having a
higher average income and lower level of poverty?
At the other end of the scale, why does Viet Nam
(average income PPP$202) register higher
attendance and greater equity than the Philippines
(average income PPP$352)? The answers would
require detailed cross-country analysis. But
the disparities draw attention to the fact that
the national income does not dictate education
outcomes and that public policy plays a role
in shaping the distribution of opportunity.
The most immediate reason that inequality
matters for the Dakar target of achieving UPE
by 2015 is that the distribution of children not
attending school is skewed towards the poor.
Table 2.6 illustrates this point for thirty-five
countries. The corollary of a higher non-
attendance incidence among the poor is that,
other things being equal, progress in raising
school attendance among the poor has a greater
impact on national attendance than progress
among other groups.
The UPE arithmetic in favour of greater equity
is most starkly apparent for countries at higher
attendance levels. Table 2.6 includes data for
eighteen countries with average attendance equal
to or over 80%. For many of them – including
Cameroon, Colombia, Indonesia, Madagascar,
Kenya, Nepal, Nicaragua, the Philippines and
Uganda – the share of out-of-school children from
the poorest quintile is above 40%, rising to 51%
in Indonesia and 60% in Viet Nam. Reaching UPE
in these countries will require the development
of policies targeting the very poor. This is a
population that generally includes many hard-
to-reach households – in remote rural areas,
for instance, and urban slums – facing multiple
disadvantages, including chronic poverty, high
mortality, and poor health and nutritional status.
For countries that are further from universal
primary attendance, the concentration of
disadvantage is less marked – but still significant.
In all seventeen countries with average attendance
rates below 80%, the poorest quintile still accounts
for a disproportionate share of non-attendance.
Conversely, in none of these countries does the
richest quintile account for more than 10% of
non-attendance. In several countries with very high
non-attendance levels – including Burkina Faso,
Ethiopia and Mali – the problem is broadly
distributed across the four bottom quintiles.
However, this does not imply that equity is
unimportant. The poorest quintile accounts for 30%
to 40% of non-attendance in many countries with
low overall attendance, including Cambodia,
Ghana, India, Mozambique, Nigeria and Zambia.
The challenge here is to increase participation
across society but with a strengthened focus on
the poorest groups. This has potential implications
Both national
income and public
policy shape
the distribution
of education
opportunity
7 5
P r o g r e s s t o wa r d s U P E : n a t i o n s a t t h e c r o s s r o a d s
0 20 40 60 80 100
Net attendance rates in primary education (%)
Burkina Faso
Ethiopia
Mali
Chad
Niger
Côte d'Ivoire
Guinea
Ghana
Senegal
Mozambique
Benin
Zambia
Nigeria
Cambodia
U. R. Tanzania
India
Malawi
Madagascar
Nicaragua
Haiti
Namibia
Cameroon
Uganda
Bangladesh
Rwanda
Nepal
Kenya
Zimbabwe
Dominican Rep.
Philippines
Colombia
Indonesia
Peru
Viet Nam
Burkina Faso
Ethiopia
Mali
Chad
Niger
Côte d'Ivoire
Guinea
Ghana
Senegal
Mozambique
Benin
Zambia
Nigeria
Cambodia
U. R. Tanzania
India
Malawi
Madagascar
Nicaragua
Haiti
Namibia
Cameroon
Uganda
Bangladesh
Rwanda
Nepal
Kenya
Zimbabwe
Dominican Rep.
Philippines
Colombia
Indonesia
Peru
Viet Nam
Burkina Faso
Ethiopia
Mali
Chad
Niger
Côte d'Ivoire
Guinea
Ghana
Senegal
Mozambique
Benin
Zambia
Nigeria
Cambodia
U. R. Tanzania
India
Malawi
Madagascar
Nicaragua
Haiti
Namibia
Cameroon
Uganda
Bangladesh
Rwanda
Nepal
Kenya
Zimbabwe
Dominican Rep.
Philippines
Colombia
Indonesia
Peru
Viet Nam
AverageQ5 (richest)Q1 (poorest) Q2 Q3 Q4
Figure 2.21: Primary net attendance rates by wealth quintile,
selected countries, most recent year
Source: Demographic and Health Surveys, calculations by Harttgen et al. (2008).

90
02
Education f
or A
ll G
lobal M
onitorin
g R
eport
C H A P T E R 2
for financing and planning. It cannot be assumed
that the future marginal costs of reaching children
from the poorest households will reflect the past
average costs of getting children into school – nor
that business-as-usual policy design will suffice.
New incentive structures, and stronger integration
of education into wider strategies for reducing
poverty and inequality, may be required. Box 2.11
outlines key lessons learned from countries that
have moved strongly towards UPE.
Household wealth also has a marked bearing on
how far children progress in education. Grade
survival indicators provide insight into the ways
inequalities constrain progress towards UPE.
In looking at countries with low survival rates,
two broad patterns can be identified (Figure 2.22).
For those with low attendance such as Senegal,
gaps between wealth groups tend to remain
relatively constant as children progress through
the primary cycle. This implies that dropout rates
are not markedly widening inequalities. Countries
including Chad, Ethiopia, Mali and the Niger
7 6
2002 96 4 60 19 4 9 72000 95 5 43 28 16 8 52003 94 6 51 23 14 8 42005 94 6 42 21 15 13 102003 92 8 52 26 13 6 32002 91 9 37 23 17 13 102006 90 10 31 26 21 16 62003 87 13 53 25 10 6 52006 87 13 40 28 18 9 42005 86 14 27 22 22 19 102004 85 15 30 30 17 13 112006 84 16 47 20 16 14 42004 82 18 42 27 21 7 31999 82 18 41 26 20 9 42000 82 18 36 23 21 12 72005 80 20 47 27 16 6 42001 80 20 50 26 13 8 32004 80 20 45 29 19 6 3
2004 79 21 28 23 21 20 82005 77 23 40 25 17 11 72004 76 24 28 22 23 17 102005 73 27 35 26 20 13 62003 68 32 37 27 20 10 52001 67 33 30 24 19 18 82006 61 39 31 29 21 13 62003 59 41 30 29 24 12 52005 59 41 30 24 22 14 92003 58 42 33 27 19 13 82005 51 49 27 27 24 17 62004 50 50 30 23 22 17 82006 44 56 28 26 25 16 52004 41 59 30 26 20 15 92001 39 61 25 23 23 21 82005 37 63 27 26 25 18 42003 34 66 25 25 23 19 7
Viet Nam Peru Indonesia Colombia Philippines Dominican Rep.Zimbabwe Kenya Nepal Rwanda BangladeshUgandaCameroonGuatemalaNamibiaHaitiNicaraguaMadagascar
MalawiIndiaU. R. TanzaniaCambodiaNigeriaZambiaBeninMozambiqueSenegalGhanaGuineaCôte d’IvoireNigerChadMaliEthiopiaBurkina Faso
Table 2.6: Distribution across wealth quintiles of children not attending primary school
Survey yearCountry
Net attendance
rate (%)
% of primaryschool-agegroup notattending
Q1 poorest quintile
Q2 Q3 Q4 Q5 richest quintile
Source: Data for calculations from Harttgen et al. (2008). See Filmer and Pritchett (1999) for a similar analysis of attainment rates.
Distribution of those not attending primary school (%)
High primary school attendance (NAR greater than or equal to 80%)
Low primary school attendance (NAR less than 80%)

T H E D A K A R G O A L S : M O N I T O R I N G P R O G R E S S A N D I N E Q U A L I T Y
General principles
provide a
framework
that individual
countries must
adapt to their own
circumstances
7 7
P r o g r e s s t o wa r d s U P E : n a t i o n s a t t h e c r o s s r o a d s
Box 2.11: Achieving UPE — lessons from strong performers
There is no blueprint for accelerating progresstowards UPE. Countries have differing problems and constraints — and differing financial, institutionaland human resources. Blueprints in any case are no substitute for practical policies. Still, five broadthematic lessons can be drawn from the experience of strong performers.
Set ambitious targets — and back them with strong political commitment and effective planning.Political leadership is vital in placing educationsquarely at the centre of the national policy agendaand the international aid agenda. Successfulgovernments have fixed ambitious long-term goalssupported by clear medium-term ‘stepping stone’targets. They have underpinned the targets withstrengthened pubic spending commitments and a predictable budget framework. Realistic planningrequires targets to be reflected in resourceallocation decisions and linked to policies forclassroom construction, teacher recruitment,textbook provision and other factors.
Get serious about equity. Disparities in educationare holding back progress towards UPE. Ensuringthat all children participate in educationadvancement requires practical measures toovercome structural inequalities. Reducing the costof education for poor households by abolishing feesand wider charges is one strategy for enhancingequity. Another is creating financial incentives for the education of girls and children fromdisadvantaged backgrounds. More equitable publicspending patterns are also critical, to ensure thatschools, teachers and resources are skewed towardsthose with greatest need rather than those with the greatest wealth.
Raise quality while expanding access. Improvingthe quality of education is one of the most effectivestrategies for strengthening demand. Enhancedquality requires a focus on smooth progression and learning outcomes, rather than pupilheadcounts. Increasing textbook supply and quality,strengthening teacher training and support, andensuring that class size is conducive to learning and that children are taught in an appropriatelanguage are key elements in raising quality.
Strengthen wider anti-poverty commitments.More efficient and more equitable school systemscan only do so much if wider structures perpetuatedisadvantage. Eradicating child malnutrition andstrengthening public health systems are conditionsfor accelerated progress towards UPE. Socialwelfare programmes and cash transfers can shieldpoor households from economic pressures thatforce children out of school and into labourmarkets.
Develop an agenda for equitable governance.‘Good governance’ is an imperative that goesbeyond UPE. While developing more accountable,transparent and participative education systems isimportant in its own right, successful governmentshave also strengthened governance more generallyand addressed equity concerns. Ensuring thatdecentralization does not widen disparities infinance requires a commitment to redistributivepublic spending. It is now clear that devolvingauthority does not automatically strengthen equity or participation by the poor — and, in fact,can weaken them.
1 2 3 4 5 60
20
40
60
80
100
Grade
Shar
e of
pup
ils a
ged
10-1
9w
ho h
ave
atta
ined
eac
h gr
ade
(%)
Shar
e of
pup
ils a
ged
10-1
9w
ho h
ave
atta
ined
eac
h gr
ade
(%)
Cambodia
1 2 3 4 5 60
20
40
60
80
100
Grade
Senegal
Q1 (poorest) Q2 Q3 Q4 Q5 (richest)
Figure 2.22: Grade survival in primary school for 10- to 19-year-olds, by wealth quintile, Cambodia and Senegal, 2005
Source: World Bank (2008b).

90
02
Education f
or A
ll G
lobal M
onitorin
g R
eport
C H A P T E R 2
Socio-cultural inequalities. Cultural factors such
as religion and ethnicity can affect both the
demand for schooling and its supply. On the
demand side, households from various religious
backgrounds may attach differing weight to
education, or they may demand schools and
curricula different from those provided through
the formal education system. In north-western
Nigeria, some 15% of children aged between 6 and
16 were not in formal school because their parents
preferred them to attend Quranic schools
(Nigeria National Population Commission and ORC
Macro, 2004).
Language-based disparities. There are large
differences in school attendance and completion
among linguistic groups. Analysis of household
data for 22 countries and over 160 linguistic groups
has attempted to identify the weight of different
factors behind disparities. It is estimated that
socio-economic factors such as household wealth
and location account for less than half of observed
differences in education outcomes among
linguistic groups. So what factors account for
the balance of the disparities? The medium of
instruction had statistically significant effects:
if at least half of schools offer the opportunity to
learn in a home language, attendance rises by
approximately 10% (Smits et al., 2008). Children
living in rural areas were found to be at a
particular disadvantage if they did not have access
to school instruction in their mother tongue. These
results add further weight to the growing body of
evidence on the benefits of using the mother
tongue in schools, at least in the early years.
Household survey data make it possible to
observe and measure inequalities in education
as if they fit into neat compartments. In the real
world, disparities in educational opportunity and
other areas combine, interact and are reproduced
through dynamic political and socio-cultural
processes that involve complex and unequal
power relationships. Disadvantage spans many
dimensions. Being poor is a universal marker
for restricted opportunity in education. Being
rural and poor represents a double disadvantage
in many countries. Being poor, rural and female
is a triple barrier to equal opportunity. Figure 2.23
captures the multidimensional scale of
disadvantage by locating where groups stand
in the distribution of educational opportunity,
as measured by school attendance.
broadly conform to this pattern. The second
pattern emerges in countries with high
attendance, where children from poor households
are often almost as likely to start school as their
richer counterparts but far more likely to drop out.
Inequalities widen progressively as children
progress through the system, as in Cambodia.
While the extent of divergence differs, Benin, India,
Malawi, Myanmar and Togo broadly conform to
this pattern.
Wealth-based inequalities interact with wider disparities
Disparities based on wealth do not exist in
isolation. They interact with wider inequalities
and markers for disadvantage related to gender,
location, language and other factors. Breaking
down these inequalities is a key to accelerated
progress towards UPE.
Rural-urban inequalities. In many countries
living in a rural area carries a marked handicap
in terms of opportunities for education. Rural
children are less likely to attend school, and more
likely to drop out, than their urban counterparts.
In Senegal, children in urban areas are twice as
likely to be in school as their counterparts in rural
areas. Poverty provides part of the explanation:
some two-thirds of the rural population live
in poverty, compared to around half of urban
households (IMF, 2006). In addition, correlates
of poverty such as the prevalence of child labour
and malnutrition are often much higher in rural
areas. Demand for different types of schooling
may also vary between more traditional rural
areas and less traditional urban districts. In
Senegal, instruction in Arabic is important for
many rural communities, potentially limiting
demand for government schools, where the
medium of instruction is French (IMF, 2006).
Disparities faced by slum dwellers. Slums are
typically characterized by high levels of poverty,
poor child health status and limited participation
in education. UN-HABITAT recently analysed
primary school attendance rates for slums in
cities of eighteen countries (UN-HABITAT, 2006).
In Benin and Nigeria, children who live in slums
had attendance rates some twenty percentage
points lower than those of other city children.
In six countries, including Bangladesh and
Guatemala, attendance rates for the children
of slum dwellers were lower even than average
rates in rural areas.
There are
many benefits
to using the
child’s mother
tongue as the
medium of
instruction during
the early years
7 8

T H E D A K A R G O A L S : M O N I T O R I N G P R O G R E S S A N D I N E Q U A L I T Y
Three barriers to UPE: child labour, ill health and disability
Every country faces its own distinctive set of
challenges in achieving UPE, but high levels of
poverty and low average incomes are pervasive
in most of the countries furthest from the target.
So are the three barriers to UPE considered in this
subsection: child labour, ill health and disability.
Child labour
Progress towards universal enrolment and
completion of primary education is inextricably
bound up with the progressive elimination of child
labour. Not all economic activity carried out by
children is a barrier to education. But activity that
keeps children out of school, limits their mental
and physical development or exposes them to
hazardous conditions violates children’s right
to education, along with international conventions.
There were around 218 million child labourers in
2004, of whom 166 million were aged between 5
and 14. In this younger age group, around 74 million
were engaged in hazardous work (ILO, 2006).7
The reported number of child labourers globally
has fallen by 11% since 2000 – and by 33% in the
hazardous category. However, progress has been
uneven. It has been most rapid in Latin America
and the Caribbean and slowest in sub-Saharan
Africa. Around one-quarter of the region’s 5- to
14-year-olds are engaged in child labour. Because
population growth has increased faster than child
labour rates have fallen, there were some 1 million
more child labourers in 2004 than in 2000. In
absolute terms, most child labourers – 122 million
in total – live in Asia and the Pacific. Here, too,
progress towards elimination has been slow,
with a decline from 19.2% to 18.8% between
2000 and 2004 (ILO, 2006).
School attendance figures provide stark evidence
of the trade-off between child labour and UPE.
The Understanding Child Work programme has
used household survey data to examine school
attendance in some sixty countries (Guarcello et al.,
2006). Its findings indicate that working children
face an attendance disadvantage of at least 10%
7. The concept of ‘child labour’ is based on the ILO Minimum AgeConvention of 1973. It excludes children aged 12 and older who work a few hours a week in permitted light work, and those aged 15 or over whose work is not categorized as hazardous. ‘Economic activity’, a broader concept sometimes used in discussions of child labour, refers to any labour lasting more than one hour per day during a seven-day reference period.
7 9
P r o g r e s s t o wa r d s U P E : n a t i o n s a t t h e c r o s s r o a d s
Prim
ary
net a
ttend
ance
rate
s (%
)
0
10
20
30
40
50
60
70
80
90
100
Ethi
opia
Chad
U. R
. Tan
zani
a
Nig
eria
Boliv
ia
Nep
al
Nic
arag
ua
Bang
lade
sh
Indo
nesi
a
Mor
occo
Dom
inic
an R
ep.
Phili
ppin
es
Colo
mbi
aBoys urban richest 20%
Boys urban poorest 20%
Boys rural richest 20%
Average
Boys rural poorest 20% Girls rural poorest 20%
Girls rural richest 20%
Girls urban poorest 20%
Girls urban richest 20%
Figure 2.23: Primary net attendance rates by location, wealth quintile and gender,
selected countries, most recent year
Sources: Demographic and Health Surveys, calculations by Gwatkin et al. (2007a, 2007b, 2007c, 2007d, 2007e,2007f, 2007g, 2007h, 2007i, 2007j, 2007k, 2007l, 2007m, 2007n); Macro International Inc. (2008).

90
02
Education f
or A
ll G
lobal M
onitorin
g R
eport
C H A P T E R 2
in twenty-eight countries, at least 20% in fifteen
countries and at least 30% in nine countries
(Figure 2.24). Child labour is also associated with
delayed school entry. In Cambodia, for example, a
working child is 17% less likely to enter school at
the official age and thus runs a higher risk of dropout.
While the trade-off between child labour and
primary eduction is clear cut, there is wide cross-
country variation in the relationship. Moreover,
evidence of trade-offs says little about the direction
of influence: association is not causation.
Are children not attending school because they
are working, or are they working because they
are not in school? The answer varies among and
within countries. When schools are unavailable
or distant, when the cost of schooling is high and
the perceived quality low, disincentives to send
children to school may push them into work.
In other cases, household poverty and associated
labour demands ‘pull’ children into labour markets:
that is, they are not in school because they are
working. These ‘pull’ factors are often triggered
by inability to cope with a crisis, such as a drought.
Household survey evidence from Pakistan shows
that for around 10% of poor households,
withdrawing children from school is a deliberate
coping strategy in times of economic and
environmental shock (World Bank, 2007c).
How should governments tackle the trade-off
between school and work that is slowing progress
towards UPE? Practical measures are needed, first
to reduce the pressures that force poor households
to augment income or labour supply through child
work and, second, to strengthen incentives for
sending children to school. Removing formal and
informal fees and strengthening education quality
are first steps. In many countries, including
Cameroon, Ghana, Kenya and the United Republic
of Tanzania, abolishing school fees has helped
reduce child labour. Other interventions, such as
school meal programmes, financial incentives for
disadvantaged groups, social protection measures
to better enable vulnerable households to manage
risk, and conditional cash transfer programmes
can also play an important role (see Chapter 3).
Health barriers to UPE
The early childhood section of this chapter
highlights health handicaps that can affect children
from birth to age 5. Such handicaps do not
disappear after entry to primary school. Inadequate
nutrition and poor health continue to track children
Offering school
meals and
cash incentives
can tilt the
balance between
school and work
8 0
ZambiaUzbekistanCameroon
Guinea-BissauIraq
MexicoHonduras
PanamaNicaragua
GhanaMali
SwazilandEcuador
GuatemalaParaguay
Côte d’IvoireColombiaJamaicaRomania
TogoC. A. R.Gambia
BelizePhilippines
SenegalTurkeyYemen
Sierra LeoneEl Salvador
BoliviaLesotho
ArgentinaPeru
Sri LankaAngola
BrazilBurundi
ChileDominican Rep.
NamibiaPortugal
ChadCongo
GuyanaZimbabwe
U. R. TanzaniaComoros
KenyaMalawi
MongoliaTrinidad/Tobago
AzerbaijanBosnia/Herzeg.
Rep. MoldovaSouth Africa
RwandaViet Nam
Albania
School attendance disadvatange index
0.2 0.4 0.6 0.8 1.0 1.2
Figure 2.24: School attendance disadvantage
for economically active children
Note: The school attendance disadvantage index is the school attendance rateof economically active children expressed as a ratio of the school attendancerate of children who are not economically active. The smaller the index value,the higher the disadvantage.Source: Guarcello et al. (2006).

T H E D A K A R G O A L S : M O N I T O R I N G P R O G R E S S A N D I N E Q U A L I T Y
after they enter school, trapping them in a vicious
cycle of cumulative disadvantage. Reversing this
cycle requires public health interventions, some
of which can be initiated through schools.
Getting more children into school is an important
indicator for progress in education. In many
countries, though, it has to be deflated to take
into account the consequences of hunger,
micronutrient deficiency and infection. On one
estimate, as many as 60 million school-age
children have iodine deficiency, which limits
cognitive development. Some 200 million are
anaemic, which affects concentration levels
(Pridmore, 2007). Water-related infectious diseases
impose an enormous toll on health and learning,
costing an estimated 443 million school days per
year in absenteeism (UNDP, 2006). Almost half
these days are lost as a result of intestinal
helminths, such as roundworm, hookworm and
whipworm. Over 400 million children are infected
with parasitic worms that leave them anaemic,
listless and often unable to concentrate (Miguel
and Kremer, 2004). Observational studies in the
Philippines and the United Republic of Tanzania
found a strong negative association between
helminth infection and cognitive domains including
learning and memory (Ezeamama et al., 2005;
Jukes et al., 2002).
Schools can make a difference in all these areas.
Of course, they cannot fully compensate for
damage caused in early childhood, but they can
provide some level of protection. In India, school
meal programmes have been used in some states,
such as Tamil Nadu, to improve pupils’ nutritional
status (Sridhar, 2008). Public health programmes
can use schools to deliver vaccinations, vitamins
and treatment for infectious diseases. In Kenya,
a randomized evaluation of a school-based mass
treatment campaign for intestinal helminths
found marked reductions in infection rates
(Edward and Michael, 2004; Kremer and Miguel,
2007). The programme also reduced school
absenteeism by one-quarter. This meant children
who attended primary school and underwent
regular deworming every six months ended up
with the equivalent of an extra year of education.
School-based treatment costs were very low –
around US$0.50 per child – and returns very high:
for every dollar spent on deworming Kenya gained
an estimated US$30 through the higher income
associated with more education.
Linking health and education policies can yield
high returns. In the United Republic of Tanzania,
the rapid drive towards UPE has been supported
by a public health programme aimed at tackling
the debilitating effects of helminth infection among
schoolchildren. In an initiative launched in 2005, the
ministries of health and education undertook a joint
risk-mapping exercise, identifying eleven regions
as having the highest burden of infection. Teachers
from every school in selected districts were trained
to identify symptoms, advise parents on causes
of infection and deliver medicine with local health
workers. As part of the campaign, which is
supported by aid donors, free drugs are reaching
5 million children annually. In this example,
regional and district school health coordinators
have played a pivotal role in facilitating progress in
education (Schistosomiasis Control Initiative, 2008).
Investments in public health offer some of the
most cost-effective routes to increased school
participation. Conversely, failure to invest in health
can have large hidden costs for education. Malaria
provides a particularly striking example.
Exposure to malaria has grave implications for
achievement in school. After controlling for other
factors, researchers have found that endemically
intensive malaria cuts school completion rates
by around 29% and increases repetition by 9%
(Thuilliez, 2007). In Sri Lanka another research
exercise found that children aged 6 to 14 who had
more than five bouts of malaria in a year scored
15% lower in language tests than children who
had fewer than three, controlling for factors such
as income and location (Fernando et al., 2003).
Simple preventive measures in the form of
insecticide-treated bed nets and low-cost
treatment can dramatically reduce the incidence
of malaria. Yet coverage remains limited. Fewer
than one in ten children living in malarial areas
of sub-Saharan Africa have access to insecticide-
treated bed nets, for example. This is one area
in which scaled-up global initiatives and
strengthened national health systems have the
potential to deliver rapid results in education.
HIV/AIDS prevention is another. Previous Reports
have documented in detail the devastating impact
of the disease on education in areas ranging from
teacher attrition to child health. The pandemic
is stabilizing, but at very high levels, and progress
is uneven. Globally, an estimated 33 million people
live with the disease, two-thirds of them (and
Investing in public
health and using
schools to deliver
vaccinations,
vitamins and
treatment for
infectious diseases
is one of the most
cost-effective ways
to increase school
participation
8 1
P r o g r e s s t o wa r d s U P E : n a t i o n s a t t h e c r o s s r o a d s

90
02
Education f
or A
ll G
lobal M
onitorin
g R
eport
C H A P T E R 2
almost three-quarters of deaths) in sub-Saharan
Africa. Beyond the immediate human costs, the
HIV/AIDS crisis represents a formidable obstacle
to UPE. Around 1.9 million children under 15 in
sub-Saharan Africa live with HIV/AIDS and some
9% of the region’s children have lost one or both
parents to the disease. While the evidence is
mixed, there is evidence from several countries –
including Kenya, Rwanda and the United Republic
of Tanzania – that HIV/AIDS orphans enter school
later and are more likely to repeat grades (Bicego
et al., 2003; Siaens et al., 2003).8 In fifty-six
countries from which recent household survey data
are available, orphans who had lost both parents
were 12% less likely to be in school (UNAIDS, 2008)
More broadly, the grief, trauma, isolation and
depression that can accompany the death of
parents also have a destructive impact on
education (Kelly, 2004; Pridmore and Yates, 2005).
Progress in combating HIV/AIDS will have powerful
spin-off benefits for education. Beyond prevention,
the most immediate challenge is to improve
access to antiretroviral drugs. Household-level
research in western Kenya has documented
significant increases in weekly hours of school
attendance by children from households affected
by HIV/AIDS when the parents have access
to medicine. In the six months after treatment
is initiated, attendance increases by 20% with no
significant drop-off thereafter (Thirumurthy et al.,
2007). This is just one example, but it highlights the
costs associated with current treatment deficits.
While the number of people receiving antiretroviral
medicine has increased tenfold in the past six
years to 3 million, 30 million are still untreated.
Similarly, although mother-to-child transmission
rates are falling with an increase in antiretroviral
drug coverage, two-thirds of HIV-positive pregnant
women are not covered by antiretroviral
programmes (UNAIDS, 2008).
Links between public health and education
operate in both directions. Strengthened health
systems can enhance equity and opportunity in
education; progress in education can act as a
catalyst for gains in public health (see Chapter 1).
From a public policy perspective the important
lesson is that planning frameworks have to avoid
compartmentalized approaches and integrate
a wide range of interventions.
Disabled learners
The promise of EFA, as the phrase implies, applies
to all children. It does not differentiate between able-
bodied and disabled children. The Convention on the
Rights of Persons with Disabilities, adopted by the
United Nations General Assembly in December 2006
and in force since May 2008, is the latest legal tool
supporting integration of disabled people and the
most recent reaffirmation of the human rights of
disabled learners. It recognizes a clear link between
inclusive education and the right to education. Yet
children with disabilities are still among the most
marginalized and least likely to go to school.
Data constraints make cross-country comparison
of the impact of disability difficult. There is no
internationally agreed definition of ‘disability’,9
and few governments closely monitor the impact
of disability on school attendance. However,
evidence from household surveys indicates that
disabled children have lower rates of school
participation. Figure 2.25 shows the proportions
of children with and without disabilities at primary
school age (6 to 11) in thirteen countries. The
difference in primary school attendance rates
between children with disabilities and those with
none ranges from ten percentage points in India
to almost sixty in Indonesia.
The barriers for disabled children vary. Physical
distance to school, the layout and design of school
facilities, and shortages of trained teachers all play
Children with
disabilities are
among the most
marginalized
and least likely
to go to school
8. See Bennell (2005a) for a counterargument.
9. Although nosatisfactory internationalworking definition of‘disability’ exists, theconsensus is that anyeventual definition must (i) be broad, to encompassthe complexity of disabilityin all its visible and non-visible forms; (ii) be based on the WorldHealth Organization’sInternationalClassification ofFunctioning, Disabilityand Health; and (iii) reflect the social,rather than medical,model of disability.
8 2

T H E D A K A R G O A L S : M O N I T O R I N G P R O G R E S S A N D I N E Q U A L I T Y
a role. Among the most serious obstacles, however,
are negative attitudes towards the disabled, which
affect both the school participation and the self-
confidence of disabled children (Dutch Coalition
on Disability and Development, 2006).
Speeding up progress towards UPE will require
a far stronger focus on public policy facilitating
access for the disabled – and on political leadership
to change public attitudes (Box 2.12). The starting
point is that disabled children should be treated as
an integral part of the learning community rather
than as a ‘special’ group requiring separate
classes or institutions.
The 2006
Convention
on the Rights
of Persons
with Disabilities
recognizes
the disabled
learner’s right
to education
8 3
P r o g r e s s t o wa r d s U P E : n a t i o n s a t t h e c r o s s r o a d s
With disabilitiesWithout disabilities
Chad
Burundi
Mozambique
Mongolia
Zambia
Cambodia
India
Romania
Indonesia
Colombia
Bolivia
South Africa
Jamaica
0 20 40 60 80 100
Attendance rate (%)
Figure 2.25: Proportion of children aged 6 to 11
with and without disabilities who are in school
Source: Filmer (2008).
Box 2.12: Uganda’s good example
of integrating disabled students
In Uganda the human rights of disabled people areenshrined in the Constitution and sign language isrecognized as an official language. Deaf children attendtheir local schools, with appropriate support, such assign language interpreters, to enable them to learn(Rustemier, 2002).
The Uganda National Institute of Special Education hasbeen training teachers in inclusive and special needseducation since 1991. It received legal status andparliamentary recognition as an educational institutionin 1996. It is involved in research, community service,and development of educational materials and adaptivedevices for learners with special needs. It makes agraphic design/illustration and desktop publishingfacility available and offers distance learningopportunities, leading to a certificate or a diploma,open to teachers, parents, social workers, communitydevelopment personnel, health workers, caregivers andlaw enforcement personnel. Uganda has also employedmedia successfully to advocate for the needs of personswith disabilities and to spread awareness of educationalopportunities.
Source: The Communication Initiative Network (2002).

90
02
Education f
or A
ll G
lobal M
onitorin
g R
eport
C H A P T E R 2
Secondary education and beyond: some gains
Increasing participation in secondary education
is an explicit part of the Dakar commitment to EFA
and of the MDG on gender parity and equality.
Secondary education is also important for wider
reasons. Where opportunities for secondary
education are scarce, parents may see less reason
to ensure that their children complete primary
school, undermining progress towards UPE. There
is another link between primary and secondary
schools: namely, secondary school graduates
represent the primary school teachers of the
future. Secondary school is of value for personal
development and civic participation as well, and it
is a stepping stone to tertiary education. Expanded
access to both these levels is essential to equip
young people with the skills, know-how and
training they and their countries need to succeed
in an increasingly integrated and knowledge-based
global economy.
While participation in post-primary education is
expanding, access remains limited for most of the
world’s young people. Disparities in opportunity
reinforce persistent inequalities in society. And
problems go beyond access to school because
many post-primary programmes do not meet
real needs. Too often they are overly-academic,
selective, stratified and disconnected from social
and economic realities (World Bank, 2005c).
This section reports on recent developments
in secondary and tertiary education while
emphasizing global, regional and national
disparities at these levels.
Assuring the transition from primary to secondary education
Most governments today are committed to
providing universal access to basic education,
which includes lower secondary as well as primary
education.10 It follows that universal basic
education requires completion of primary school
and a successful transition to lower secondary.
Enforcement of compulsory schooling laws and
elimination of primary school-leaving examinations
are just two of the measures being taken to
improve transition rates. All developed countries,
some countries in transition and most countries
in Latin America and the Caribbean, and in East
Asia and the Pacific consider primary and lower
secondary education part of compulsory schooling
(UIS, 2006a).11
Prolonging compulsory schooling has increased
access to, and participation in, secondary
education. The median transition rate from primary
to secondary is above 90% in all regions except
South and West Asia, and sub-Saharan Africa.
Transition rates remain especially low (70% or
less) in twenty-two countries, nineteen of them in
sub-Saharan Africa (see annex, Statistical Table 8).
Expanding enrolment in secondary education
Enrolment in secondary education is rising. In
2006, some 513 million students worldwide were
enrolled in secondary school, an increase of nearly
76 million since 1999. However, enrolment ratios
vary enormously by region (Table 2.7). Worldwide,
the average net enrolment ratio (NER) in
secondary education increased from 52% in 1999
to 58% in 2006. Developed countries and most
transition countries are moving closer to universal
enrolment, but developing regions much less so.
In sub-Saharan Africa, for example, the secondary
NER was just 25% in 2006. This implies that nearly
78 million of the region’s secondary school-age
children are not enrolled in secondary school.
Regional figures conceal significant differences
between countries. In the Arab States, secondary
NERs ranged from less than 22% in Djibouti and
Mauritania to nearly 90% or more in Bahrain,
the Palestinian Autonomous Territories and Qatar
in 2006. In South and West Asia they ranged from
30% in Pakistan to 77% in the Islamic Republic
of Iran. Secondary NER levels in sub-Saharan
Africa were less than 20% in Burkina Faso,
Madagascar, Mozambique, the Niger and Uganda,
but over 80% in Mauritius and Seychelles
(see annex, Statistical Table 8).
Post-primary
education
is often too
academic and
removed from
social and
economic
realities
10. By international convention, primary and lower secondary educationare the first two stages of basic education (UNESCO, 1997). While mostcountries organize basic education according to the internationaldefinition, a significant number define it differently. In twenty-twocountries, basic education includes at least one year of pre-primaryeducation, in fifteen countries it consists exclusively of primary educationand in twelve countries it includes lower secondary and part of uppersecondary education (UNESCO, 2007a; UNESCO-IBE, 2007).
11. Some countries, including Bahrain, Malaysia, Mauritius, Oman andTokelau, have achieved near universal participation in lower secondaryeducation (GERs of at least 90%) even without compulsory school laws(see annex, Statistical Tables 4 and 8).
8 4

T H E D A K A R G O A L S : M O N I T O R I N G P R O G R E S S A N D I N E Q U A L I T Y
Between 1999 and 2006, secondary GERs
increased in 118 of the 148 countries with data
available. Fourteen of the countries that started
with enrolment ratios of less than 80% made
significant progress with increases of at least
fifteen percentage points.12 In many Western
European countries, GERs in secondary education
declined as systems became more age-
standardized, with fewer under- and over-age
students.
Technical and vocational education and training
(TVET) occupy an important position in secondary
education. Of the more than 513 million students
enrolled in secondary schools worldwide in 2006,
10% were in TVET programmes (Table 2.8), mainly
at upper secondary level (UNESCO-UNEVOC/UIS,
2006).13 The percentage had declined slightly
since 1999. The relative shares of secondary-level
TVET enrolment were highest in Central and
Eastern Europe, North America and Western
Europe, and the Pacific, and lowest in South and
West Asia, the Caribbean and sub-Saharan Africa.
12. Cambodia, Costa Rica,Cuba, Ethiopia, Guatemala,Guinea, Macao (China), theMaldives, Mexico, Mongolia,Morocco, Saint Lucia, theSyrian Arab Republic and the Bolivarian Republic ofVenezuela.
13. In some countries TVETprogrammes are post-secondary non-tertiaryeducation (ISCED level 4).
Secondary-school
enrolment has
risen by nearly
76 million
since 1999
8 5
S e c o n d a r y e d u c a t i o n a n d b e y o n d : s o m e g a i n s
School year ending in
93 92 94 60 66 52 58
88 93 83 52 60 45 5399 … … 100 101 88 91
100 100 99 90 89 83 82
62 66 57 24 32 18 2592 90 93 60 68 52 5999 99 99 83 91 78 83… … … 65 75 61 6991 … … 64 75 61 69… … … 111 107 70 6687 90 83 45 51 39 4593 … … 80 89 59 7094 … … 53 57 44 4092 92 92 81 91 59 7199 99 99 100 101 88 9198 98 99 87 88 80 81
World
Developing countriesDeveloped countriesCountries in transition
Sub-Saharan AfricaArab StatesCentral AsiaEast Asia and the Pacific
East AsiaPacific
South and West AsiaLatin America and the Caribbean
CaribbeanLatin America
North America and Western EuropeCentral and Eastern Europe
Table 2.7: Rates of transition to, and participation in, secondary education, 1999 and 2006, worldwide and by region
Total(%) (%) (%) (%) (%)
Male Female
1999
School year ending in
2005 2006
(%) (%)
1999 2006
Source: Annex, Statistical Table 8.
Transition rates from primary to secondary education (median)
Secondary education
Gross enrolment ratios Net enrolment ratios
School year ending in
11 10
9 918 16
9 12
6 615 12
6 1014 1314 1336 33
2 210 10
3 310 1015 1418 19
World
Developing countriesDeveloped countriesCountries in transition
Sub-Saharan AfricaArab StatesCentral AsiaEast Asia and the Pacific
East AsiaPacific
South and West AsiaLatin America and the Caribbean
CaribbeanLatin America
North America and Western EuropeCentral and Eastern Europe
Table 2.8: Percentage of technical and vocational education
and training in secondary education, 1999 and 2006
School year ending in1999 2006
Source: Annex, Statistical Table 8.
% of total secondary
Enrolment in technical and vocational education

Disparities in secondary education attainment
Household surveys help capture the scale of
international inequalities at the post-primary
level. They provide evidence that, while global
primary education disparities may be narrowing,
inequalities at the secondary level remain large
(Barro and Lee, 2000; Bloom, 2006).
Regional disparities are particularly marked.
The average secondary education attainment
rate15 in developed countries is 70% among
the population aged 25 or more, but just 40%
in East Asia and the Pacific and around 20%
in sub-Saharan Africa (Figure 2.26). Attainment
rates among the group aged 15 to 24 are higher,
pointing to improved access and reduced
inequality over time. The exception is sub-Saharan
Africa. This is the only region in which 15- to
24-year-olds were less likely to have attended
secondary school, indicating a need for urgent
action to close the gap with the rest of the world.
Detailed attainment figures broken down by
grade level help pinpoint where students face
critical transition hurdles. Several patterns
90
02
Education f
or A
ll G
lobal M
onitorin
g R
eport
C H A P T E R 2
Transition to upper secondary — a dropout point
Countries increasingly make the distinction
between lower secondary education (ISCED
level 2) and upper secondary education (ISCED
level 3) (UNESCO, 1997). The former is frequently
part of a compulsory basic education cycle,
whereas the onset of the latter typically marks
the end of compulsory schooling and consists
of diverse programmes and more specialized
instruction (UIS, 2006a).
The transition from lower to upper secondary
is a dropout point in many education systems.
At a global level, the average GER in 2006 was
much higher in lower secondary education (78%)
than in upper (53%) (Table 2.9). Differences in
the participation rates between the two levels
are especially prominent in East Asia,14 Latin
America and the Caribbean, the Arab States
and sub-Saharan Africa (where rates are relatively
low at both levels). By contrast, participation
levels in lower and upper secondary education
are quite similar in North America and Western
Europe, Central and Eastern Europe, and
Central Asia.
14. In the Pacificsubregion, however,the rates are uncertainbecause the smallpopulation base makesit difficult to estimatepopulation reliably.
15. The secondaryattainment rate is thepercentage of apopulation that hasparticipated in secondaryeducation though notnecessarily completeda full cycle.
8 6
73 78 46 53
67 75 37 46102 103 98 99
91 89 87 88
27 38 19 2473 81 47 5485 95 80 8480 92 46 5880 92 45 5792 89 146 13962 66 31 3996 102 62 7467 72 39 4397 103 63 76
102 103 98 9893 89 80 85
World
Developing countriesDeveloped countriesCountries in transition
Sub-Saharan AfricaArab StatesCentral AsiaEast Asia and the Pacific
East AsiaPacific
South and West AsiaLatin America and the Caribbean
CaribbeanLatin America
North America and Western EuropeCentral and Eastern Europe
Table 2.9: Gross enrolment ratios in lower and upper secondary education,
1999 and 2006
School year ending in School year ending in1999 2006 1999 2006
Source: Annex, Statistical Table 8.
Lower secondary Upper secondary
Gross enrolment ratios(%)
Aged 25 or older
World
Developed countries
Sub-Saharan Africa
Middle East and North Africa
East Asia and the Pacific
South Asia
Latin America/Caribbean
Eastern Europe/Central Asia
0 20 40 60 80 100
Share of adults and youth having attainedsecondary education (%)
Aged 15 to 24
Figure 2.26: Secondary attainment rates among adults
and youth, by region, circa 2000
Note: The regional classification in this figure follows that used by the WorldBank, which differs to some extent from the EFA classification used in this Report.Developed countries include OECD countries and other high income countries, such as Bahrain, Cyprus, Israel and Kuwait.Source: Barro and Lee (2000), as reported in Bloom (2006).

Patterns in low-income developing countries
look very different. Some countries register steep
declines at specific grades, as in the United
Republic of Tanzania (grade 7) and Ghana (grade 9).
In other cases, such as Malawi and Nicaragua,
survival rates decline more gradually, with
secondary education marking a broad continuation
of the pattern established at the primary level.
Finally, some countries, such as Mali, maintain
a consistent level of survival at a low level of
attainment. Grade-specific attendance data of this
T H E D A K A R G O A L S : M O N I T O R I N G P R O G R E S S A N D I N E Q U A L I T Y
emerge from comparing survival rates to
the end of secondary education (Figure 2.27).16
The profile for Armenia, where almost all
students complete eight years of schooling
(roughly the end of lower secondary education)
and only begin to drop out during the upper
secondary grades, is typical for most developed
and transition countries. For these countries,
inequalities in grade attainment become more
marked in the post-compulsory years.17
16. Survival rates by gradeportray pupils’ ability toprogress through the schoolsystem and reach highergrades, which is largelydetermined by cumulativedropout rates. The reportedsurvival rates werecalculated based onpromotion, repetition anddropout rates for primary-and secondary-age pupilswho were currently in school.They are different from the survival rates of cohortsof pupils who start school in a particular age group.
17. Using a differentmethodology, the WorldBank has constructednational profiles ofattainment by grade levelthat indicate the proportionof people aged 15 to 19 who successfully reach each grade of primary and secondary education.These profiles reflect similarpatterns to those discussedhere. (Both methods usedata from householdsurveys.) See the World BankEducational Attainment andEnrolment around the Worlddatabase (World Bank,2008b) and Pritchett (2004b).
Inequalities
at the secondary
level remain large
8 7
S e c o n d a r y e d u c a t i o n a n d b e y o n d : s o m e g a i n s
1 2 3 4 5 6 7 8 9 10 11 120
20
40
60
80
100
Grade
Surv
ival
to g
rade
(%)
United Republic of Tanzania
1 2 3 4 5 6 7 8 9 10 11 120
20
40
60
80
100
Grade
Surv
ival
to g
rade
(%)
Mali
Last yearof primary
Last yearof lower
secondaryLast yearof primary
Last yearof lower
secondary
FemaleMale
FemaleMale
1 2 3 4 5 6 7 8 9 10 11 120
20
40
60
80
100
Grade
Surv
ival
to g
rade
(%)
Ghana
1 2 3 4 5 6 7 8 9 10 11 120
20
40
60
80
100
Grade
Surv
ival
to g
rade
(%)
Malawi
Last yearof primary
Last yearof lower
secondary Last yearof primary
Last yearof lower
secondaryFemaleMale Female
Male
1 2 3 4 5 6 7 8 9 10 11 120
20
40
60
80
100
Grade
Surv
ival
to g
rade
(%)
Armenia
1 2 3 4 5 6 7 8 9 10 11 120
20
40
60
80
100
Grade
Surv
ival
to g
rade
(%)
Nicaragua
FemaleMaleLast year
of primaryLast yearof lower
secondary
Last yearof primary
Last yearof lower
secondary
FemaleMale
Figure 2.27: Survival rates to each grade of primary and secondary education, by gender,
selected countries, most recent year
Source: Demographic and Health Surveys, calculations by Education Policy and Data Center (2008b).
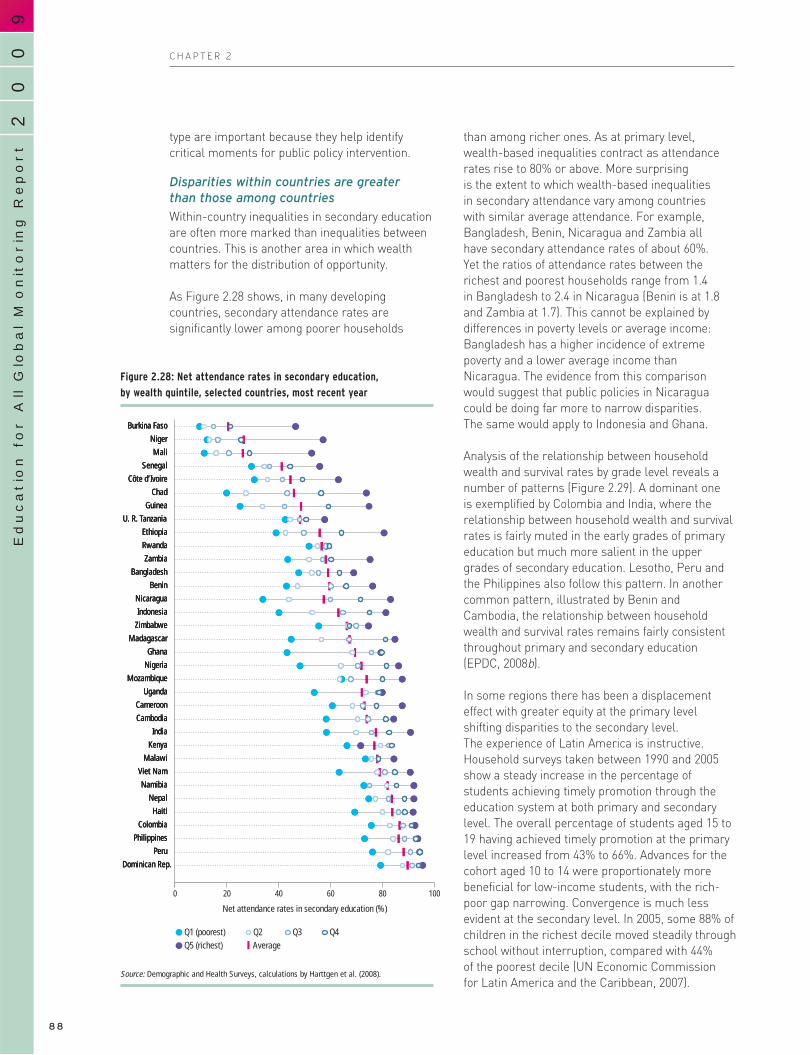
90
02
Education f
or A
ll G
lobal M
onitorin
g R
eport
C H A P T E R 2
type are important because they help identify
critical moments for public policy intervention.
Disparities within countries are greater than those among countries
Within-country inequalities in secondary education
are often more marked than inequalities between
countries. This is another area in which wealth
matters for the distribution of opportunity.
As Figure 2.28 shows, in many developing
countries, secondary attendance rates are
significantly lower among poorer households
than among richer ones. As at primary level,
wealth-based inequalities contract as attendance
rates rise to 80% or above. More surprising
is the extent to which wealth-based inequalities
in secondary attendance vary among countries
with similar average attendance. For example,
Bangladesh, Benin, Nicaragua and Zambia all
have secondary attendance rates of about 60%.
Yet the ratios of attendance rates between the
richest and poorest households range from 1.4
in Bangladesh to 2.4 in Nicaragua (Benin is at 1.8
and Zambia at 1.7). This cannot be explained by
differences in poverty levels or average income:
Bangladesh has a higher incidence of extreme
poverty and a lower average income than
Nicaragua. The evidence from this comparison
would suggest that public policies in Nicaragua
could be doing far more to narrow disparities.
The same would apply to Indonesia and Ghana.
Analysis of the relationship between household
wealth and survival rates by grade level reveals a
number of patterns (Figure 2.29). A dominant one
is exemplified by Colombia and India, where the
relationship between household wealth and survival
rates is fairly muted in the early grades of primary
education but much more salient in the upper
grades of secondary education. Lesotho, Peru and
the Philippines also follow this pattern. In another
common pattern, illustrated by Benin and
Cambodia, the relationship between household
wealth and survival rates remains fairly consistent
throughout primary and secondary education
(EPDC, 2008b).
In some regions there has been a displacement
effect with greater equity at the primary level
shifting disparities to the secondary level.
The experience of Latin America is instructive.
Household surveys taken between 1990 and 2005
show a steady increase in the percentage of
students achieving timely promotion through the
education system at both primary and secondary
level. The overall percentage of students aged 15 to
19 having achieved timely promotion at the primary
level increased from 43% to 66%. Advances for the
cohort aged 10 to 14 were proportionately more
beneficial for low-income students, with the rich-
poor gap narrowing. Convergence is much less
evident at the secondary level. In 2005, some 88% of
children in the richest decile moved steadily through
school without interruption, compared with 44%
of the poorest decile (UN Economic Commission
for Latin America and the Caribbean, 2007).
8 8
0 20 40 60 80 100
Net attendance rates in secondary education (%)
Burkina Faso
Niger
Mali
Senegal
Côte d’Ivoire
Chad
Guinea
U. R. Tanzania
Ethiopia
Rwanda
Zambia
Bangladesh
Benin
Nicaragua
Indonesia
Zimbabwe
Madagascar
Ghana
Nigeria
Mozambique
Uganda
Cameroon
Cambodia
India
Kenya
Malawi
Viet Nam
Namibia
Nepal
Haiti
Colombia
Philippines
Peru
Dominican Rep.
Burkina Faso
Niger
Mali
Senegal
Côte d’Ivoire
Chad
Guinea
U. R. Tanzania
Ethiopia
Rwanda
Zambia
Bangladesh
Benin
Nicaragua
Indonesia
Zimbabwe
Madagascar
Ghana
Nigeria
Mozambique
Uganda
Cameroon
Cambodia
India
Kenya
Malawi
Viet Nam
Namibia
Nepal
Haiti
Colombia
Philippines
Peru
Dominican Rep.
Burkina Faso
Niger
Mali
Senegal
Côte d’Ivoire
Chad
Guinea
U. R. Tanzania
Ethiopia
Rwanda
Zambia
Bangladesh
Benin
Nicaragua
Indonesia
Zimbabwe
Madagascar
Ghana
Nigeria
Mozambique
Uganda
Cameroon
Cambodia
India
Kenya
Malawi
Viet Nam
Namibia
Nepal
Haiti
Colombia
Philippines
Peru
Dominican Rep.
AverageQ5 (richest)Q1 (poorest) Q2 Q3 Q4
Figure 2.28: Net attendance rates in secondary education,
by wealth quintile, selected countries, most recent year
Source: Demographic and Health Surveys, calculations by Harttgen et al. (2008).

T H E D A K A R G O A L S : M O N I T O R I N G P R O G R E S S A N D I N E Q U A L I T Y
Disadvantages based on characteristics other
than household wealth also cross the divide
between primary and secondary school. Speaking
an indigenous or non-official language remains
a core marker for disadvantage. When home
language and official national language differ,
the chances of completing at least one grade
of secondary school are reduced. For example,
in Mozambique, 43% of people aged 16 to 49 who
speak Portuguese (the language of instruction)
have at least one grade of secondary schooling;
among speakers of Lomwe, Makhuwa, Sena
and Tsonga, the shares range from 6% to 16%.
In Bolivia, 68% of Spanish speakers aged 16 to
49 have completed some secondary education
while one-third or fewer of Aymara, Guaraní
and Quechua speakers have done so; in Turkey
the corresponding shares are 45% for Turkish
speakers and below 21% for Arabic and Kurdish
speakers (Smits et al., 2008).
Tertiary education: global patterns of inequality
Tertiary education has expanded rapidly since
the Dakar Forum. Worldwide, some 144 million
students were enrolled in tertiary education in 2006
– 51 million more than in 1999. Over the same
period, the global tertiary GER increased from 18%
to 25%. A large majority of the new places in
tertiary institutions were created in developing
countries, where the total number of tertiary
students rose from 47 million in 1999 to 85 million
in 2006 (see annex, Statistical Table 9).
Even with rapid growth in tertiary education in
developing countries, global disparities remain
large (Table 2.10). Tertiary GERs range from 70%
in North America and Western Europe to 32% in
Latin America, 22% in the Arab States and 5% in
sub-Saharan Africa. These disparities capture just
The relationship
between
household wealth
and survival rates
is most apparent
in the post-
primary years
8 9
S e c o n d a r y e d u c a t i o n a n d b e y o n d : s o m e g a i n s
1 2 3 4 5 6 7 8 9 10 11 12 13 130
20
40
60
80
100
Grade
Surv
ival
to g
rade
(%)
India
1 2 3 4 5 6 7 8 9 10 11 12 130
20
40
60
80
100
Grade
Surv
ival
to g
rade
(%)
Colombia
1 2 3 4 5 6 7 8 9 10 11 120
20
40
60
80
100
GradeSu
rviv
al to
gra
de (%
)
Benin
1 2 3 4 5 6 7 8 9 10 11 13120
20
40
60
80
100
Grade
Surv
ival
to g
rade
(%)
Cambodia
Q1 (poorest) Q2 Q3 Q4 Q5 (richest)
Last yearof primary
Last yearof lower
secondary
Last yearof primary
Last yearof lower
secondary
Last yearof primary
Last yearof lower
secondary
Last yearof primary
Last yearof lower
secondary
Figure 2.29: Survival rates to each grade of primary and secondary education,
by wealth quintile, selected countries, most recent year
Note: Survival rates for some quintiles and grades could not be calculated because too few observations were available.Source: Demographic and Health Survey, calculations by Education Policy and Data Center (2008b).

90
02
Education f
or A
ll G
lobal M
onitorin
g R
eport
C H A P T E R 2
the quantitative side of the equation. Qualitative
gaps are also important. In equivalent dollar terms,
France spent over sixteen times as much per
university student in 2004 as did Indonesia and
Peru. In 2005, top private universities in the United
States, such as Harvard, Princeton and Yale, spent
US$100,000 or more per student; the equivalent
figure for a student at Dar-es-Salaam University
was US$3,239 (Kapur and Crowley, 2008).
Of course, spending per student is not the only
indicator for quality at the tertiary level, any more
than it is at the primary level. But financing gaps
on this scale have implications for disparities
in learning opportunities and the provision of
teaching materials.
Global inequalities are often magnified at national
level. It is at the entry point to tertiary education,
that the compound effects of inequalities in access
to and completion of basic education, and
progression through secondary education, become
most visible. Brazil’s universities provide a
microcosm of a wider problem. The university
participation rate for black Brazilians aged 19 to 24
is 6%, compared with 19% for white Brazilians
(Paixão and Carvano, 2008). In other words, being
born with black skin in Brazil reduces your chance
of reaching university by a factor of three.
This is the culmination of disadvantage rooted
in poverty, social discrimination and the filtering
effect of inequality at lower levels of the
education system.
At global level
there are
huge gaps in
spending per
student and
in university
enrolment rates
9 0
18 25
11 1755 6739 57
4 519 2218 2514 2513 2447 52
7 1121 31
6 622 3261 7038 60
World
Developing countriesDeveloped countriesCountries in transition
Sub-Saharan AfricaArab StatesCentral AsiaEast Asia and the Pacific
East AsiaPacific
South and West AsiaLatin America and the Caribbean
CaribbeanLatin America
North America and Western EuropeCentral and Eastern Europe
Table 2.10: Change in tertiary gross enrolment ratios
between 1999 and 2006
Source: Annex, Statistical Table 9A.
Gross enrolment ratios in tertiary education
(%)
School year ending in
1999 2006

T H E D A K A R G O A L S : M O N I T O R I N G P R O G R E S S A N D I N E Q U A L I T Y
Meeting the lifelong learningneeds of youth and adults
Goal 3: Ensuring that the learning needs of all young people and adults are met throughequitable access to appropriate learning and life-skills programmes.
Goal 4: Achieving a 50 per cent improvementin levels of adult literacy by 2015, especiallyfor women, and equitable access to basic and continuing education for all adults.
Fixing early childhood provision, achieving UPE
and expanding post-primary education will create
the conditions under which future generations
can realize their potential. But what of people
who have been failed by current systems?
This Report highlights the fact that governments
across the world have to address an immense
backlog of unmet need. Millions of teenagers have
never attended primary school and many millions
more have left school lacking the skills they need
to earn a livelihood and participate fully in society.
To this constituency can be added about 776 million
adults who lack basic literacy skills and many
others without access to adult education or skills
training. To take one priority area, whole sections
of the adult population in some countries have
no access to the information and communication
technology that is pervasive in today’s knowledge
economy.
Systematic monitoring of EFA goal 3 and the latter
part of goal 4 has been stymied by problems of
definition and lack of data.18 There is little agreement
about how to define the notions of ‘adult learning’
and ‘life skills’, and which learning activities to
include (Ellis, 2006; Hargreaves and Shaw, 2006;
Hoffmann and Olson, 2006; King and Palmer, 2008;
Merle, 2004). ‘Life skills’ and ‘livelihood skills’, both
aspects of adult learning, have taken on different
meanings in different countries (Maurer, 2005).
At Dakar ‘livelihood skills’ was thought to be
subsumed within the broader concept of ‘life skills.’
Adult learning activities are found in a myriad of
formal, informal and non-formal programmes and
institutions. In some cases they involve programmes
aimed at youth or adults who wish to return to
school – that is, equivalency education or second-
chance programmes.
Many governments have given little if any priority
to youth’s and adults’ learning needs in their
education strategies and policies. Inadequate
public funding hampers provision and inadequate
monitoring obscures other problems (Hoppers,
2007; UNESCO, 2004). The fact that no clear
quantitative targets were established at Dakar,
apart from the main literacy target, may have
contributed to a lack of urgency. In addition,
the language of the commitment is ambiguous.
Some read goal 3 as calling for universal access
to learning and life-skills programmes, but others,
including the drafters of the Dakar Framework,
understand no such intent.19
The EFA Global Monitoring Report 2008 explored
a range of issues in non-formal education, where
much adult learning activity takes place.20 It found
evidence in several countries of significant
disparities in provision by location, age group
and socio-economic status (UNESCO, 2007). It
also found that national history heavily influenced
approaches to provision. While Mexico, Nepal and
Senegal, for instance, see non-formal provision
principally in terms of adult education, Bangladesh
and Indonesia take a broader view, stressing
flexibility and programme diversity to complement
formal education. Burkina Faso, Ghana, Kenya,
Nigeria, the Philippines, the United Republic
of Tanzania and Zambia, meanwhile, largely
conceive of non-formal education as any
structured learning activity outside the formal
education system.
There is a strong case to be made for clarifying
the purpose of lifelong learning provision,
improving data flows and, critically, strengthening
political commitment in this area. As a first step
towards more effective monitoring, improved
information is needed in the following areas:
National conceptions and commitment:How do government agencies understand
the learning needs of out-of-school youth and
adults? To what extent do authorities address
these needs by articulating a clear vision,
setting policy priorities, providing for resource
mobilization and allocation, and enabling
partnerships with non-government and
international organizations? How long do
various adult learning programmes last?
To what extent are specific lifelong learning
opportunities put in place?
18. A future EFA GlobalMonitoring Report willexamine these issues as partof an overarching theme.
19. Based on exchanges withSteve Packer and SheldonShaeffer, who helped draftthe EFA goals.
20. UNESCO’s workingdefinition of non-formaleducation states that it ‘maycover education programmesto impart adult literacy, basiceducation for out-of-schoolchildren, life skills, workskills and general culture’(UNESCO, 1997, p. 41).
Lifelong learning
needs are great,
but rarely
reflected in
national education
strategies and
policies
9 1
M e e t i n g t h e l i f e l o n g l e a r n i n g n e e d s o f y o u t h a n d a d u l t s

90
02
Education f
or A
ll G
lobal M
onitorin
g R
eport
C H A P T E R 2
Demand: What is the demand for youth and
adult learning programmes, which populations
are involved and how has demand changed
over time?
Nature of provision: What are the character
and focus of existing youth and adult learning
programmes? Do they include frameworks
oriented towards re-entry into formal education?
Basic literacy programmes (reading, writing
and numeracy)? Literacy programmes to
promote life skills or livelihood skills? Other
skills development programmes (especially
related to labour market participation)?
Rural development?
Target groups: Which groups do existing
youth and adult learning programmes target?
Which target groups do the biggest, most
established adult learning programmes serve?
To what extent does existing provision create
or worsen disparities based on age, gender,
educational attainment, wealth, residence,
ethnicity or language?
Flexibility and diversification: Are youth and
adult learning programmes highly standardized,
or do they incorporate flexibility so as to better
address the learning needs of diverse groups?
Sustainability: How long have youth and adult
learning programmes been in existence?
Which agencies and stakeholders provide
funding? Has funding been constant and/or
increasing over time? How long have educator/
facilitator training frameworks existed?
An important and potentially rich source of
information is the Sixth International Conference
on Adult Education (CONFINTEA VI), scheduled
for May 2009 in Belém, Brazil. Its overall aim is
‘to draw attention to the relation and contribution
of adult learning and education to sustainable
development, conceived comprehensively as
comprising a social, economic, ecological and
cultural dimension.’ Five regional preparatory
conferences will have examined policies, structures
and financing for adult learning and education;
inclusion and participation; the quality of adult
learning and education; literacy and other key
competencies; and poverty eradication.
Effective
monitoring of
lifelong learning
provision
requires better
information
9 2

T H E D A K A R G O A L S : M O N I T O R I N G P R O G R E S S A N D I N E Q U A L I T Y
Adult literacy: still neglected
Overcoming inequalitiesin literacy’s reach
Goal 4: Achieving a 50 per cent improvement in levels of adult literacy by 2015, especially for women, and equitable access to basic andcontinuing education for all adults.
Reading and writing are essential skills for today’s
world. Literacy expands people’s choices, gives
them more control over their lives, increases their
ability to participate in society and enhances self-
esteem. It is a key to education that also opens
the way to better health, improved employment
opportunities and lower child mortality. Despite
these advantages for individuals, and the wider
benefits in terms of broader social and economic
development, literacy remains a neglected goal.
As the EFA Global Monitoring Report 2008 noted:
‘Illiteracy is receiving minimal political attention
and remains a global disgrace, keeping one in
five adults (one in four women) on the margins
of society’ (UNESCO, 2007a, p.1).
Multiple barriers restrict the achievement of
widespread literacy. They include insufficient access
to quality education, weak support for young people
exiting the education system, poorly funded and
administratively fragmented literacy programmes,
and limited opportunities for adult learning. Many
of these barriers disproportionately affect marginal
and vulnerable groups, and exacerbate socio-
economic inequalities. In developing countries
in particular, lower literacy levels are commonly
associated with poverty, low socio-economic status,
gender discrimination, ill health, immigration,
cultural marginalization and disabilities (UNESCO,
2005). Even in highly literate and schooled societies
significant pockets of illiteracy and low literacy
remain, leaving those affected marginalized and
with diminished life chances.
Illiteracy in global perspective
An estimated 776 million adults – 16% of the
world’s adult population – are unable to read and/or
write, with understanding, a simple statement in a
national or official language (Table 2.11).21 Most live
in South and West Asia, East Asia and sub-Saharan
Africa, and nearly two in every three are women.
The global progress report on literacy is not
encouraging. Between 1985–1994 and 2000–2006,
the number of adults lacking literacy skills fell
by almost 100 million, primarily due to a marked
21. This figure is based onconventional approaches thatdefine and measure literacyin dichotomous terms usingindirect measurementmethods. Other approachesconceive of literacy asa multidimensionalphenomenon, embracing avariety of skill domains thatneed to be directly assessedusing wider scales. Ingeneral, direct assessmentsshow that conventionalapproaches understateactual literacy levels,especially in poor countries(UNESCO, 2005).
The global literacy
progress report is
not encouraging.
Some 776 million
adults — 16% of
the world’s adult
population —
are unable to
read or write with
understanding
9 3
A d u l t l i t e ra c y : s t i l l n e g l e c t e d
871 096 63 775 894 64 706 130 64 -11 -9
858 680 63 766 716 64 698 332 64 -11 -98 686 64 7 660 62 7 047 59 -12 -83 730 84 1 519 71 752 59 -59 -51
133 013 61 161 088 62 147 669 60 21 -855 311 63 57 798 67 53 339 69 4 -9
960 74 784 68 328 50 -18 -58229 172 69 112 637 71 81 398 71 -51 -28227 859 69 110 859 71 79 420 71 -51 -28
1 313 56 1 778 55 1 979 52 35 11394 719 61 392 725 63 380 256 63 -1 -3
39 575 55 36 946 55 31 225 54 -7 -152 870 50 2 803 48 2 749 45 -2 -2
36 705 55 34 142 56 28 476 55 -7 -176 400 63 5 682 61 5 115 59 -11 -10
11 945 78 8 235 80 6 801 79 -31 -17
World
Developing countriesDeveloped countriesCountries in transition
Sub-Saharan AfricaArab StatesCentral AsiaEast Asia and the Pacific
East AsiaPacific
South and West AsiaLatin America and the Caribbean
CaribbeanLatin America
North America and Western EuropeCentral and Eastern Europe
Table 2.11: Estimated number of adult illiterates (age 15+) in 1985–1994 and 2000–2006, with projections to 2015, by region
Total(000)
Female(%)
1985–19941
1. Data are for the most recent year available. See the web version of the introduction to the statistical tables in the annex for explanations of national literacy definitions, assessment methods, sources and years of data.Source: Annex, Statistical Table 2A.
Total(000)
Female(%)
2000–20061
Total(000)
Female(%)
2015
1985–1994to 2000–2006
2000–2006to 2015
Percentage change

90
02
Education f
or A
ll G
lobal M
onitorin
g R
eport
C H A P T E R 2
reduction in East Asia, especially China.22
The net effect obscures large regional variation.
In sub-Saharan Africa, the Arab States and the
Pacific, absolute numbers of illiterates increased,
reflecting continued population growth. Moreover,
global progress has slowed in recent years. The
upshot is that, on current trends, over 700 million
adults will still lack basic literacy skills in 2015.23
Changing this picture will require a renewed sense
of urgency, on the part of national governments
and the international community, particularly
in highly populous developing countries.
In terms of absolute numbers, adult illiteracy is
heavily concentrated in a relatively small group
of countries. Some 80% of those affected worldwide
live in twenty countries (Figure 2.30), with
Bangladesh, China, India and Pakistan accounting
for over half of the total. While significant
reductions have occurred in Algeria, China, Egypt,
India, Indonesia, the Islamic Republic of Iran
and Turkey since 1985–1994, progress elsewhere
has been less promising.
Adult literacy rates
Between 1985–1994 and 2000–2006, the global
adult literacy rate24 increased from 76% to 84%
(Table 2.12). Progress was especially marked in the
developing countries as a group, where the average
adult literacy rate increased from 68% to 79%.
During the period adult literacy levels improved in
almost all regions, though not sufficiently in some
to cut the number of those lacking literacy skills.
Regional adult literacy rates remained below the
world average in sub-Saharan Africa, South and
West Asia, the Arab States and the Caribbean.
In 45 countries out of 135, mostly in sub-Saharan
Africa, and South and West Asia, adult literacy rates
are below the developing country average of 79%
(see annex, Statistical Table 2A). The most populous
countries in this group include Bangladesh,
Ethiopia, India, Nigeria and Pakistan. Nineteen
countries in the group have very low literacy rates,
less than 55%;25 thirteen are low-income countries
in which severe poverty prevails – that is, where
75% or more of the population lives on less than
US$2 per day.26 Current projections indicate a large
proportion of countries in the group will not meet
the adult literacy goal by 2015.
Youth literacy
Adult illiteracy is the product of past exclusion from
educational opportunities. Tomorrow’s illiteracy
figures will reflect current patterns of access to
learning. With the continued expansion of formal
education, the global number of youth illiterates
(aged 15 to 24) declined from 167 million in
1985–1994 to 130 million in 2000–2006 (see annex,
Statistical Table 2A). Declines occurred in most
regions, but in sub-Saharan Africa the number of
youth lacking basic literacy skills increased by
7 million due to continuing high population growth
and low school participation and completion rates.
There were also relatively small increases in
Central Asia, the Pacific, and North America and
Western Europe, partly due to changing population
estimates.
The global youth literacy rate also improved during
the period, from 84% to 89%, most notably in South
and West Asia, sub-Saharan Africa, the Caribbean
and the Arab States. Low youth literacy rates
(under 80%) were recorded in sub-Saharan Africa,
and South and West Asia.
On current
trends, over
700 million adults
will still lack
basic literacy
skills in 2015
22. China experienceda dramatic increase innumbers of adult literatesbetween 1985–1994 and2000–2006 and its adultliteracy rate rose from78% to 93%, due to thecombined impact of massliteracy campaignsorganized in previousdecades, expansion ofprimary education andthe spread of text-ladenliterate environments(UNESCO, 2005).
23. The projection in thisReport of 706 millionilliterate adults in 2015is more optimistic thanthe estimate of 725million published in the2008 Report.
24. The number of literatepersons expressed as apercentage of the totalpopulation aged 15 andover.
25. Afghanistan,Bangladesh, Benin,Bhutan, Burkina Faso, theCentral African Republic,Chad, Côte d’Ivoire,Ethiopia, Guinea, Liberia,Mali, Morocco,Mozambique, Niger,Pakistan, Senegal, SierraLeone and Togo.
26. Bangladesh, Burundi,Cambodia, the CentralAfrican Republic, Ethiopia,Ghana, India, Madagascar,Niger, Nigeria, Rwanda,the United Republic ofTanzania and Zambia.
9 4
India
China
Bangladesh
Pakistan
Ethiopia
Nigeria
Indonesia
Brazil
Egypt
D. R. Congo
Afghanistan
Morocco
Sudan
Iran, Isl. Rep.
Nepal
Mozambique
Turkey
U. R. Tanzania
Mexico
Algeria
Rest of the world
Number of adult illiterates (millions)
0 25 50 75 100
73.2
48.4
47.1
28.9
23.5
14.8
14.2
14.2
10.5
9.9
9.8
8.7
8.1
7.6
6.6
6.3
6.2
6.0
6.0
270.1
155.9
Figure 2.30: Countries with the greatest numbers
of adult illiterates (age 15+) as of 2000–20061
Notes: See source table for detailed country notes.1. Data are for the most recent year available. See the web version of theintroduction to the statistical tables in the annex for explanations of nationalliteracy definitions, assessment methods, sources and years of data.Source: Annex, Statistical Table 2A.

T H E D A K A R G O A L S : M O N I T O R I N G P R O G R E S S A N D I N E Q U A L I T Y
Literacy, inequality and exclusion
National literacy rates conceal major disparities
in literacy levels within countries. These disparities
are linked to gender, poverty, place of residence,
ethnicity, language and disabilities. Age is another
important dimension: younger adults tend to have
higher literacy rates than older adults.27
Gender disparities in adult literacy are widespread,
especially in the countries facing the greatest
literacy challenge. Worldwide, women account
for 64% of the adults who cannot read and write,
with understanding, a simple statement from their
everyday life. This share is virtually unchanged from
the 63% recorded during 1985–1994 (Table 2.11).
The global literacy rate is lower for women than
men, as reflected in the global GPI of 0.89 in
2000–2006, up from 0.85 in the previous period.
Gender disparities to the disadvantage of women
are especially marked in South and West Asia,
the Arab States and sub-Saharan Africa. Gender
disparities in these regions improved between the
two periods (Table 2.12). Gender and poverty often
interact in relation to literacy: for example, in the
Gambia, literacy rates ranged from 12% among
extremely poor women to 53% for non-poor men
(Caillods and Hallak, 2004).
The close link between poverty and illiteracy is
observed not only from one country to another
but also among regions and households within
a country. In India, for example, literacy levels are
lower in the poorest states. Evidence from thirty
developing countries indicates that literacy levels
are substantially lower in the poorest households
than in the wealthiest (UNESCO, 2005). In seven
sub-Saharan African countries with particularly
low overall adult literacy rates, the literacy gap
between the poorest and wealthiest households
is more than forty percentage points.28
Literacy rates also vary by place of residence.
They are almost always lower in rural areas than
in urban areas. Countries where overall literacy
rates are comparatively low show large regional
disparities: Pakistan census figures report adult
literacy rates of 72% in the Islamabad Capital
Territory but 44% in rural Balochistan and Sindh
(Choudhry, 2005). In Ethiopia regional disparities
in literacy rates range from 83% in the Addis Ababa
region to 25% in the Amhara region (Shenkut,
2005). Pastoralists and nomads, who number in
the tens of millions across the African drylands,
the Middle East and parts of Asia, have lower
literacy levels than other rural populations
(UNESCO, 2005). In the Afar region of Ethiopia,
27. The relationship betweenage and literacy rates issometimes curvilinear;see UNESCO (2005).
28. The countries areCôte d’Ivoire, Guinea-Bissau,Rwanda, Senegal, SierraLeone, Sudan and Togo.
In seven countries
in sub-Saharan
Africa, the literacy
gap between
the poorest
and the wealthiest
households
is more than forty
percentage points
9 5
A d u l t l i t e ra c y : s t i l l n e g l e c t e d
76 0.85 84 0.89 87 0.92
68 0.77 79 0.85 84 0.9099 0.99 99 1.00 99 0.9998 0.98 99 1.00 100 1.00
53 0.71 62 0.75 72 0.8658 0.66 72 0.75 79 0.8198 0.98 99 0.99 99 1.0082 0.84 93 0.94 95 0.9682 0.84 93 0.94 96 0.9694 0.99 93 0.99 93 1.0048 0.57 64 0.71 71 0.7887 0.98 91 0.98 93 0.9966 1.02 74 1.05 78 1.0787 0.97 91 0.98 94 0.9999 0.99 99 1.00 99 1.0096 0.96 97 0.97 98 0.98
World
Developing countriesDeveloped countriesCountries in transition
Sub-Saharan AfricaArab StatesCentral AsiaEast Asia and the Pacific
East AsiaPacific
South and West AsiaLatin America and the Caribbean
CaribbeanLatin America
North America and Western EuropeCentral and Eastern Europe
Table 2.12: Estimated adult literacy rates (age 15+) in 1985–1994 and 2000–2006, with projections to 2015, by region
Total (F/M)
1985–19941
1. Data are for the most recent year available. See the introduction to the statistical tables in the annex for explanations of national literacy definitions, assessment methods, sources and years of data.Source: Annex, Statistical Tables 2A and 12.
Literacy rates(%) GPI
Total (F/M)
Literacy rates(%) GPI
Total (F/M)
Literacy rates(%) GPI
2000–20061 Projected 2015

90
02
Education f
or A
ll G
lobal M
onitorin
g R
eport
C H A P T E R 2
for example, the literacy rate for adults was 25%
in 1999, but in pastoralist areas it was only 8%.
Indigenous populations, many of them
characterized by proficiency in non-official
languages, tend to have lower literacy rates than
non-indigenous populations. The national literacy
rate in Ecuador, for example, was 91% in 2001 but
that of indigenous groups was 72%; in Viet Nam the
rates in 2000 were 87% nationally, 17% for ethnic
minorities and merely 5% for some indigenous
groups. Nepal’s Dalit population has a significantly
lower adult literacy rate than the rest of the
population. The Roma in Central Europe also
have lower literacy levels than those of majority
populations (UNESCO, 2005).
The household surveys and censuses used in
determining literacy rates often overlook otherexcluded groups and individuals (Carr-Hill, 2005).
People who are homeless, institutionalized in
prisons or care homes, or unregistered may not
figure. In developing countries, refugees or
internally displaced persons often go uncounted.
The same is true for street children. In all these
cases, official literacy figures are likely to
understate the scale of the problem.
Pockets of illiteracy and low literacyin developed countries
In highly schooled countries that achieved UPE
some time ago, illiteracy is considered a problem
of the past. Yet international and national literacy
surveys often reveal substantial pockets of illiteracy
and low literacy. International assessments show
that many OECD countries have large groups with
low levels on key literacy indicators:
An assessment in Canada (2003) established
that 9 million Canadians of working age (42% of
people aged 16 to 65) scored at level 2 or below
on the prose literacy scale, a figure that had
changed little since the previous assessment
in 1994 (Grenier et al., 2008).29
A 2004–2005 assessment in metropolitan
France found that 3.1 million French adults of
working age, some 59% of them men, faced
literacy problems. (National Agency to Fight
Illiteracy, 2007). Older French adults were more
affected than younger ones, with the rates of
low literacy being 14% among 46- to 65-year-
olds but about 5% for those aged 18 to 35.
In the Netherlands some 1.5 million adults,
of whom roughly 1 million are native Dutch
speakers, are classified as functionally
illiterate. One-quarter of these native Dutch
speakers are almost completely illiterate.
In addition, one in ten Dutch-speaking adults
functions at the lowest level of literacy. Among
employed people, 6%, or one in fifteen workers,
have great difficulty reading and writing
(Reading and Writing Foundation, 2008, drawing
on the 1998 International Adult Literacy Survey).
As these examples suggest, illiteracy and low
literacy are not confined to poor countries.
Incomplete formal education, high unemployment
or underemployment and lack of access to adult
education all contribute to a weakening
of literacy skills. While largely hidden, low literacy
affects sizable populations in rich countries,
acting as a barrier to greater social mobility
and equality.
Official literacy
figures generally
understate
the problem in
rich and poor
countries alike
29. The International AdultLiteracy and Skills Surveydefined levels 1 and 2 aslow proficiency and levels3, 4 and 5 as medium tohigh proficiency.
9 6

T H E D A K A R G O A L S : M O N I T O R I N G P R O G R E S S A N D I N E Q U A L I T Y
Assessing gender disparitiesand inequalities in education
Goal 5: Eliminating gender disparities in primaryand secondary education by 2005, and achieving gender equality in education by 2015,with a focus on ensuring girls’ full and equalaccess to and achievement in basic education of good quality.
The Dakar Framework for Action sets out an
ambitious two-part agenda on gender equity.
Achieving gender parity in school participation is
one part. The other is progress towards gender
equality in educational opportunities and outcomes.
The combination of the two makes the Dakar
Framework far broader in scope than other
international development targets, including
the MDGs (Colclough, 2007).
How is the world performing against these Dakar
benchmarks? The record is mixed. There has been
sustained progress towards parity as captured by
the gender parity index (GPI), the ratio of male to
female enrolment rates. However, the 2005 target
for eliminating gender disparities was missed in
many countries. Ensuring that the same fate does
not befall the 2015 targets will require renewed
urgency and commitment. Although progress
towards equality is inherently more difficult to
measure, clearly much remains to be done.
Gender disparities: still deeply entrenched
The world has made continued progress towards
gender parity but many countries still have a long
way to travel. In 2006, only 59 of the 176 countries
with data available had achieved gender parity
(defined as a GPI of GER ranging from 0.97 to 1.03)
in both primary and secondary education. That is
twenty more than in 1999. But the fact that over half
the countries have not achieved gender parity is
a source of concern.
About two-thirds of the countries with data
available had achieved gender parity at the primary
level by 2006. However, more than half the
countries in sub-Saharan Africa, South and West
Asia, and the Arab States had yet to achieve gender
parity. These three regions also account for most of
the countries furthest away from achieving the goal
(Table 2.13).
At the secondary level many more countries have
failed to achieve gender parity. In 2006, only 37%
of countries with data, mostly in North America
and Europe, had achieved parity. Gender gaps
in secondary schools existed in almost all the
countries in sub-Saharan Africa, and South and
West Asia, in three-quarters of the countries in
East Asia and the Pacific, and in half the countries
in Latin America and the Caribbean. Worldwide
there are about as many countries with gender
disparities at the expense of girls (fifty-eight) as at
the expense of boys (fifty-three). Countries in the
first group are mostly from less developed regions,
including sub-Saharan Africa, and South and West
Asia. Boys’ underparticipation, particularly in upper
secondary education, is increasingly marked in
Latin America and the Caribbean.
At the tertiary level only a handful of the countries
for which data are available have achieved gender
parity. In around two-thirds of countries, female
enrolment tended to be higher than male
enrolment, particularly in the more developed
regions (e.g. North America and Western Europe,
and Central and Eastern Europe) and in the
Caribbean and Pacific. In sub-Saharan Africa,
and South and West Asia, the majority of countries
have enrolment gaps favouring male students.
Primary education: substantialprogress but more effort needed to reach gender parity
Globally, most of the seventy-one countries with
data that had not achieved gender parity in primary
education by 2006 had nonetheless made progress
since 1999 (Figure 2.31). On a less positive note,
some countries were moving in the wrong
direction. For example, the Dominican Republic,
the Libyan Arab Jamahiriya, Mauritania, Niue and
Saint Lucia registered gender parity in 1999 but
not 2006. In the Congo, gender disparities
increased significantly.
Though some countries in South and West Asia
failed to meet the gender parity goal, there has
been significant progress since Dakar. The region’s
average GPI rose from 0.84 to 0.95 between 1999
and 2006. Bhutan, India and Nepal have all
achieved gender parity in primary education since
Dakar, or are close. However, Pakistan, with a
large overall school-age population (see the UPE
section) still enrols only eighty girls for every
hundred boys at primary level.
The 2005 target
for eliminating
gender disparities
was missed in
many countries
9 7
A s s e s s i n g g e n d e r d i s p a r i t i e s a n d i n e q u a l i t i e s i n e d u c a t i o n

90
02
Education f
or A
ll G
lobal M
onitorin
g R
eport
C H A P T E R 2
Progress towards gender parity in sub-Saharan
Africa has been slow and uneven. The mean
regional GPI rose from 0.85 in 1999 to 0.89 in 2006.
But the Central African Republic, Chad, Côte
d’Ivoire, Mali and the Niger had fewer than eighty
girls enrolled in primary school for every hundred
boys in 2006. On the other hand, parity has been
achieved in many other countries, including Ghana,
Kenya and the United Republic of Tanzania.30
These outcomes demonstrate that gender
differences in education can be overcome through
public policy action and changes in attitude.
Access to school: where gender disparities begin
Disparities at the entry point to formal education
run counter to the principles of human rights.
One of the characteristics of universal rights is that
they do not differentiate between children on the
basis of their gender – and education is a universal
right. Beyond the issues raised by basic rights
provision, gender disparities at school entry are
reflected in future disparities as children progress
through school.
Intake disparities and trends broadly mirror those
for total enrolment (Figure 2.32). Gaps are widest
in South and West Asia, and sub-Saharan Africa
30. The full list ofcountries having achievedgender parity in primaryeducation in the region:Botswana, Gabon, Ghana,Kenya, Lesotho, Mauritius,Namibia, Rwanda, SaoTome and Principe,Senegal, Seychelles,Uganda, the UnitedRepublic of Tanzania,Zambia and Zimbabwe.
9 8
5 16 3 15 1 1 411 6 2 9 1 19
2 5 1 86 4 19 1 30
2 3 3 1 94 5 25 2 1 37
1 23 242 17 19
8 32 22 116 5 2 2 187
15 11 3 1 4 1 353 3 2 3 2 5 18
1 1 4 1 1 82 5 7 4 8 262 4 2 1 9
2 1 16 4 12 2 371 2 15 3 3 241 2 15 1 19
22 28 8 65 16 34 3 176
20 2 2 4 285 1 3 6 152 1 2 3 84 2 1 3 5 155 1 1 7
2 1 4 15 221 1 8 13 23
1 4 13 18
37 9 0 4 2 29 55 136
Sub-Saharan AfricaArab StatesCentral AsiaEast Asia and the PacificSouth and West AsiaLatin America and the CaribbeanNorth America and Western EuropeCentral and Eastern Europe
Total
Sub-Saharan AfricaArab StatesCentral AsiaEast Asia and the PacificSouth and West AsiaLatin America and the CaribbeanNorth America and Western EuropeCentral and Eastern Europe
Total
Sub-Saharan AfricaArab StatesCentral AsiaEast Asia and the PacificSouth and West AsiaLatin America and the CaribbeanNorth America and Western EuropeCentral and Eastern Europe
Total
Table 2.13: Distribution of countries according to their distance from the gender parity goal in primary, secondary and tertiary education, 2006
Far fromthe goal:
GPI below0.80
Intermediateposition:
GPI between 0.80 and 0.94
Close to the goal:
GPI between 0.95 and 0.96
Goal achieved:
GPI between 0.97 and 1.03
Close to the goal:
GPI between 1.04 and 1.05
Intermediateposition:
GPI between1.06 and 1.25
Far from the goal:
GPI above1.25
Number of countries
in the sample
Source: Annex, Statistical Tables 9A and 12.
Disparities in favour of boys/men Parity Disparities in favour of girls/women
Primary education
Secondary education
Tertiary education

T H E D A K A R G O A L S : M O N I T O R I N G P R O G R E S S A N D I N E Q U A L I T Y
(average GPIs of 0.94 and 0.92, respectively,
in 2006). On a more positive note, in South and
West Asia the GPI registered an 11% gain between
1999 and 2006. Some countries in the region
reported spectacular progress. For example, the
GPI for Nepal increased by 30% and the country
achieved gender parity. While overall progress
in sub-Saharan Africa has been less marked,
Ethiopia and Liberia each achieved a 30% increase
in GPI. Burundi had attained gender parity in school
access by 2006 (see annex, Statistical Table 4).
School progression
In many countries, girls are less likely to repeat
grades, have a greater chance of reaching the final
grade and are more likely to complete the primary
school cycle.
Grade repetition. In 114 of the 146 countries
with data for 2006, girls repeated less than boys
(see annex, Statistical Table 6). However, lower
repetition rates for girls are not necessarily
related to progress in gender parity in enrolment.
GPIs for Ethiopia,
Liberia and
Nepal increased
by 30% between
1999 and 2006
9 9
A s s e s s i n g g e n d e r d i s p a r i t i e s a n d i n e q u a l i t i e s i n e d u c a t i o n
2006 (increase since 1999)1999
ChadC. A. R.
NigerCôte d’Ivoire
MaliEritrea
Burkina FasoBenin
NigeriaCameroon
GuineaTogo
MozambiqueEthiopia
ComorosCongo
Sierra LeoneLiberia
BurundiSwaziland
Cape VerdeEquat. Guinea
South AfricaMadagascar
KenyaZambia
SenegalGhana
LesothoUgandaRwandaMalawiGambia
YemenDjibouti
IraqSudan
MoroccoAlgeria
EgyptLibyan A. J.Syrian A. R.
LebanonTunisia
QatarOman
Mauritania
Sub-Saharan Africa
Arab States
0.50 0.60 0.70 0.80 0.90 1.00 1.10 1.20 1.30 1.40
GPI of GERs
Gender parity Tajikistan
MongoliaArmenia
Papua N. GuineaLao PDR
Timor-LesteCambodia
Macao, ChinaPalauTonga
NiueSolomon Is
IndonesiaCook Islands
Tokelau
AfghanistanPakistan
NepalIndia
BhutanIran, Isl. Rep.
BermudaGuatemalaSaint Lucia
BrazilDominican Rep.
ChileGrenada
El SalvadorBr. Virgin Is
ParaguayPanama
CubaDominica
Turks/Caicos IsSt Vincent/Grenad.
St Kitts/Nevis
Portugal
Turkey
Central Asia
East Asia/Pacific
South/West Asia
Latin America/Caribbean
Western Europe
Centr./East. Europe
0.50 0.60 0.70 0.80 0.90 1.00 1.10 1.20 1.30 1.40
GPI of GERs
Gender parity
1
2
2006 (decrease since 1999) Stable
Figure 2.31: Changes in gender disparities in primary gross enrolment ratios between 1999 and 2006
Notes: Excludes countries withGPI between 0.97 and 1.03 inboth years. See source tablefor detailed country notes.1. In 1999, the GPI forAfghanistan was 0.08.2. The high increase in femaleenrolment in the IslamicRepublic of Iran is due torecent inclusion in enrolmentstatistics of literacyprogrammes in which womenare overrepresented.Source: Annex, StatisticalTable 5.

90
02
Education f
or A
ll G
lobal M
onitorin
g R
eport
C H A P T E R 2
In Afghanistan, which had fewer than seventy girls
per hundred boys entering school in 2005, the
percentage of primary school repeaters was 14%
among girls but 18% for boys. Most of the small
number of countries where the percentage of
female primary-school repeaters was higher
were in sub-Saharan Africa. Their ranks included
Chad, Guinea, Liberia, Mali, the Niger, Nigeria and
Sierra Leone.
School retention. In 63 countries out of the 115 with
data, there was gender parity in survival rates to
the last grade of primary education in 2005 (again
defined as GPI between 0.97 and 1.03). In 36 of the
other 52 countries where gender disparities
remained, the GPI for the survival rate to the last
grade favoured girls – in some cases by a wide
margin (Table 2.14). On the other hand, girls’
survival rates to the last grade were much lower
than boys’ in the Central African Republic, Chad,
Iraq and Togo.
Gender disparities
narrowed in more
than half of
the 142 countries
with data
1 0 0
World
Developing countries
Developed countries
Countries in transition
Sub-Saharan Africa
Arab States
Central Asia
East Asia and the Pacific
South and West Asia
Latin America/Caribbean
N. America/W. Europe
Centr./East. Europe
0.800.70 0.90 1.00 1.10
Gender parity
GPI of GIRs
2006 (increase since 1999)19992006 (decrease since 1999) Stable
Figure 2.32: Changes in gender disparities in access
to primary education between 1999 and 2006, by region
Source: Annex, Statistical Table 4.
C. A. R. … 0.81Togo … 0.83Chad 0.82 0.85Niger … 0.90Eritrea 0.95 0.90Guinea … 0.92Zambia 0.88 0.93Mali 0.93 0.93Benin … 0.93Mozambique 0.82 0.96
Iraq 0.92 0.78Yemen … 0.93Mauritania … 0.93Morocco 1.01 0.95
Azerbaijan 1.02 0.94
Guatemala 1.08 0.96
Ethiopia 1.09 1.04Nigeria … 1.04Madagascar 1.02 1.05Burkina Faso 1.07 1.05U. R. Tanzania … 1.05South Africa 0.96 1.06Cape Verde … 1.06Comoros … 1.07Rwanda … 1.08Botswana 1.09 1.10Namibia 1.06 1.10Burundi … 1.12Swaziland 1.06 1.13S. Tome/Principe … 1.29Lesotho 1.32 1.32
Lebanon 1.07 1.09
Indonesia … 1.05Cambodia 0.87 1.06Philippines … 1.14Kiribati … 1.18
Table 2.14: Gender disparities in survival rates to last grade, 1999 and 2005
Higher survival for boys(16 countries)
GPI
1999 2005
Higher survival for girls (36 countries)
GPI GPI
1999 19992005 2005
Notes: Excludes countries with GPIs between 0.97 and 1.03 in 2005. Countries with the highest disparities (GPI below 0.90 and above 1.10 in 2005) are highlighted. See source table for detailed country notes.Source: Annex, Statistical Table 7.
Pakistan … 1.07Bangladesh 1.16 1.07Bhutan 1.10 1.08Nepal 1.10 1.10
El Salvador 0.99 1.07Uruguay … 1.04Argentina 1.01 1.04Paraguay 1.06 1.06Venezuela, B. R. 1.09 1.07Bahamas … 1.07Trinidad/Tobago … 1.09Honduras … 1.09Colombia 1.08 1.10Dominican Rep. 1.13 1.12Nicaragua 1.20 1.18
Luxembourg 1.11 1.04
Sub-Saharan Africa
Arab States
Central Asia
Latin America/Caribbean
Sub-Saharan Africa
Arab States
East Asia/Pacific
South/West Asia
Latin America/Caribbean
N. America/W. Europe

T H E D A K A R G O A L S : M O N I T O R I N G P R O G R E S S A N D I N E Q U A L I T Y
Gender disparities in secondaryeducation: different scales,different patterns
Figure 2.33 documents global progress on gender
parity at secondary level. Developed and transition
countries had generally achieved gender parity in
secondary education by 2006, while the average GPI
for developing countries was 0.94, below the world
average. Among the developing regions, the Arab
States, South and West Asia, and sub-Saharan
Africa combined low participation with low GPIs.
In several countries in these regions – including
Afghanistan, Benin, Eritrea, Ethiopia, Iraq, Mali,
the Niger and Yemen – the secondary GERs for girls
were less than 70% of those for boys (see annex,
Statistical Table 8). Conversely, in many countries
in Latin America and the Caribbean, more girls
were enrolled than boys at secondary level. Socio-
economic context, occupational practices and
gender identity in school all appear to play a role in
keeping boys away from school. Particularly among
disadvantaged and excluded groups, boys are more
likely to leave school early to earn a living, opting
for shorter and less academic secondary education
programmes that do not offer the chance to
continue to the tertiary level (UNESCO, 2007a).
Expansion of secondary school enrolment has led
to reductions in gender disparities in almost all
regions. Several countries in South and West Asia
have registered rapid progress. Many factors have
contributed, including increased primary enrolment
and completion for girls, rising average incomes
and falling poverty rates. Public policy has also
played a key role. In Bangladesh, which has
transformed patterns of gender disparity within
a decade or so, the creation of financial incentives
for girls’ education has been critical (Box 2.13).
The notable exception to the generally improving
situation with respect to gender parity is sub-
Saharan Africa, where the GPIs of secondary GERs
fell slightly in 2006 (Figure 2.33).
The overall positive trend towards gender parity
is also evident at country level. Gender disparities
narrowed in more than half of the 142 countries
with data (see annex, Statistical Table 8). Progress
was striking in many countries, particularly those
where gender disparities were still substantial in
1999 (Figure 2.34; see countries above the line).
GPIs rose by more than 20% in Benin, Cambodia,
Chad, the Gambia, Guinea, Nepal, Togo, Uganda
and Yemen. While girls’ secondary school
participation has worsened in several countries,31
gender disparities at the expense of boys have
increased in some, including Argentina,
El Salvador, Georgia, the Republic of Moldova
and Tunisia.
Gender disparities in tertiaryeducation: large differencesbetween regions
The world GPI of the tertiary GER rose from 0.96
in 1999 to 1.06 in 2006 (Figure 2.36). This shows
that more women than men are enrolled in tertiary
education worldwide. However, there are large
differences among regions. More women are
enrolled in developed and transition countries
(GPIs of 1.28 and 1.29, respectively, in 2006), while
on average men retain an advantage in developing
countries (0.93). The situation of developing regions
varies, with higher rates of female participation
in the Caribbean (1.69) and the Pacific (1.31),
and far fewer female students in tertiary education
in South and West Asia (0.76), and sub-Saharan
Africa (0.67). In some countries, including
Afghanistan, the Central African Republic, Chad,
Eritrea, the Gambia, Guinea and the Niger, fewer
than thirty women were enrolled for every hundred
men in 2006.
31. Azerbaijan, Cameroon,the Comoros, Djibouti,Eritrea, Kenya, Mozambique,Nigeria, Oman, Rwanda andTajikistan.
The Arab States,
South and
West Asia, and
sub-Saharan Africa
combined low
participation
with low GPIs
1 0 1
A s s e s s i n g g e n d e r d i s p a r i t i e s a n d i n e q u a l i t i e s i n e d u c a t i o n
World
Developing countries
Developed countries
Countries in transition
Sub-Saharan Africa
Arab States
Central Asia
East Asia and the Pacific
South and West Asia
Latin America/Caribbean
N. America/W. Europe
Centr./East. Europe
0.70 0.80 0.90 1.00 1.10
Genderparity
GPI of GERs
2006 (increase since 1999)19992006 (decrease since 1999) Stable
Figure 2.33: Change in gender disparities in secondary gross
enrolment ratios between 1999 and 2006, by region
Source: Annex, Statistical Table 8.

90
02
Education f
or A
ll G
lobal M
onitorin
g R
eport
C H A P T E R 2
Gender disparities within countries
Global and regional data provide an insight into
the position of the average girl or woman.
But, as in other areas highlighted in this chapter,
averages can conceal as much as they reveal.
Within countries, some girls face greater
disadvantage than others. Being born into a poor
household, living in a rural area or being a
member of a particular ethnic or language group
can multiply and reinforce disadvantages that
come with gender.
Gender parity and poverty
Cross-national research using household survey
data carried out for this Report underlines the
strong association between poverty and gender
inequalities in education (Harttgen et al., 2008).
Children in poor households are less likely to
attend school than their wealthier counterparts,
irrespective of whether they are boys or girls.
Cutting across the wealth divide is an important
gender dynamic. Gender disparities are inversely
related to wealth: they rise for girls born into the
poorest households. This disadvantage also tends
to be greater at the secondary level than at the
There is a strong
association
between poverty
and gender
inequalities
in education
1 0 2
Disparitiesin favour of girls
widened
Disparitiesin favour of girls
narrowed
Disparitiesin favour of boys
narrowed
Disparitiesin favour of boys
widened
0.0
0.2
0.4
0.6
0.8
1.0
1.2
1.4
0.0 0.2 0.4 0.6 0.8 1.0 1.2 1.4
GPIs
in 2
006
Gender parity
Genderparity
GPIs in 1999
Developing countries Countries in transition Line indicating no change between 1999 and 2006Developed countries
Figure 2.34: Changes in gender disparities in secondary gross enrolment ratios between 1999 and 2006
Source: Annex, Statistical Table 8.
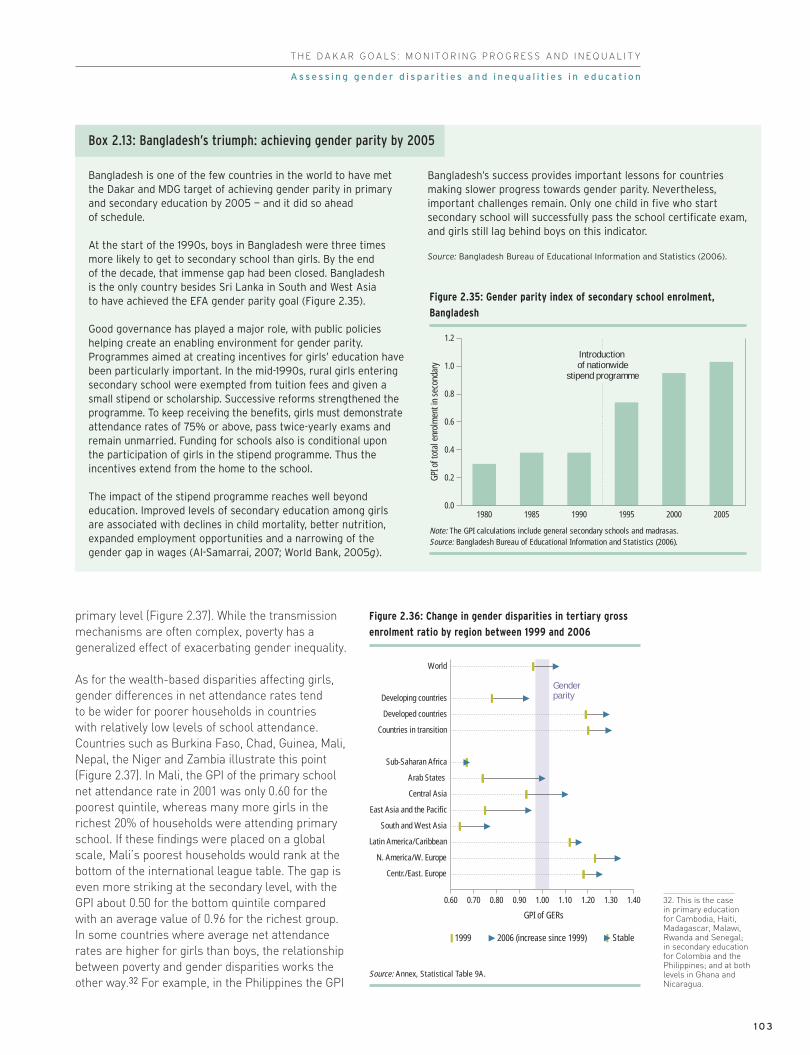
T H E D A K A R G O A L S : M O N I T O R I N G P R O G R E S S A N D I N E Q U A L I T Y
primary level (Figure 2.37). While the transmission
mechanisms are often complex, poverty has a
generalized effect of exacerbating gender inequality.
As for the wealth-based disparities affecting girls,
gender differences in net attendance rates tend
to be wider for poorer households in countries
with relatively low levels of school attendance.
Countries such as Burkina Faso, Chad, Guinea, Mali,
Nepal, the Niger and Zambia illustrate this point
(Figure 2.37). In Mali, the GPI of the primary school
net attendance rate in 2001 was only 0.60 for the
poorest quintile, whereas many more girls in the
richest 20% of households were attending primary
school. If these findings were placed on a global
scale, Mali’s poorest households would rank at the
bottom of the international league table. The gap is
even more striking at the secondary level, with the
GPI about 0.50 for the bottom quintile compared
with an average value of 0.96 for the richest group.
In some countries where average net attendance
rates are higher for girls than boys, the relationship
between poverty and gender disparities works the
other way.32 For example, in the Philippines the GPI
32. This is the case in primary education for Cambodia, Haiti,Madagascar, Malawi,Rwanda and Senegal; in secondary education for Colombia and thePhilippines; and at bothlevels in Ghana andNicaragua.
1 0 3
A s s e s s i n g g e n d e r d i s p a r i t i e s a n d i n e q u a l i t i e s i n e d u c a t i o n
World
Developing countries
Developed countries
Countries in transition
Sub-Saharan Africa
Arab States
Central Asia
East Asia and the Pacific
South and West Asia
Latin America/Caribbean
N. America/W. Europe
Centr./East. Europe
0.60 0.70 0.80 0.90 1.00 1.10 1.20 1.30 1.40
GPI of GERs
Gender parity
2006 (increase since 1999)1999 Stable
Figure 2.36: Change in gender disparities in tertiary gross
enrolment ratio by region between 1999 and 2006
Source: Annex, Statistical Table 9A.
Box 2.13: Bangladesh’s triumph: achieving gender parity by 2005
Bangladesh is one of the few countries in the world to have metthe Dakar and MDG target of achieving gender parity in primaryand secondary education by 2005 — and it did so aheadof schedule.
At the start of the 1990s, boys in Bangladesh were three timesmore likely to get to secondary school than girls. By the end of the decade, that immense gap had been closed. Bangladesh is the only country besides Sri Lanka in South and West Asia to have achieved the EFA gender parity goal (Figure 2.35).
Good governance has played a major role, with public policieshelping create an enabling environment for gender parity.Programmes aimed at creating incentives for girls’ education havebeen particularly important. In the mid-1990s, rural girls enteringsecondary school were exempted from tuition fees and given asmall stipend or scholarship. Successive reforms strengthened theprogramme. To keep receiving the benefits, girls must demonstrateattendance rates of 75% or above, pass twice-yearly exams andremain unmarried. Funding for schools also is conditional upon the participation of girls in the stipend programme. Thus theincentives extend from the home to the school.
The impact of the stipend programme reaches well beyondeducation. Improved levels of secondary education among girls are associated with declines in child mortality, better nutrition,expanded employment opportunities and a narrowing of thegender gap in wages (Al-Samarrai, 2007; World Bank, 2005g).
Bangladesh’s success provides important lessons for countriesmaking slower progress towards gender parity. Nevertheless,important challenges remain. Only one child in five who startsecondary school will successfully pass the school certificate exam,and girls still lag behind boys on this indicator.
Source: Bangladesh Bureau of Educational Information and Statistics (2006).
GPI o
f tot
al e
nrol
men
t in
seco
ndar
y
Introduction of nationwide
stipend programme
0.0
0.2
0.4
0.6
0.8
1.0
1.2
1980 1985 1990 1995 2000 2005
Figure 2.35: Gender parity index of secondary school enrolment,
Bangladesh
Note: The GPI calculations include general secondary schools and madrasas.Source: Bangladesh Bureau of Educational Information and Statistics (2006).

90
02
Education f
or A
ll G
lobal M
onitorin
g R
eport
C H A P T E R 2
of the secondary school net attendance rate for
the poorest quintile was 1.24 compared with 0.98
for the richest.
When it comes to school attendance, poverty
weighs more heavily on girls than boys. In some
cases it weighs far more heavily. The attendance
disparity ratios of the richest to poorest quintile are
significantly higher for girls than for boys in Burkina
Faso, Chad, Guinea, Mali and the Niger. These
ratios say something important about the unequal
distribution of opportunity. For example, in Mali
girls from the richest households are four times
more likely to be attending primary school than
the poorest girls, an advantage rising to eight times
at the secondary level.
Other drivers of gender disadvantages
Wealth disparities interact with wider social,
economic and cultural factors to disadvantage girls.
As an important cross-country research exercise
shows, being born into a group that is indigenous,
a linguistic minority, low caste or geographically
isolated can magnify disadvantage (Lewis and
Lockheed, 2008):
Indigenous girls in Guatemala are less likely
to be enrolled than other demographic groups
(Hallman et al., 2007). At age 7, only 54% of
indigenous girls are in school, compared with
71% of indigenous boys and 75% of non-
indigenous girls. By age 16, only one-quarter
of indigenous girls are enrolled, compared with
School
proximity
has a positive
effect on
attendance,
especially
for girls
1 0 4
MaliChadNiger
Burkina FasoGuinea
BeninMozambique
NigeriaCôte d'Ivoire
KenyaIndia
CameroonNepal
EthiopiaZambiaUganda
PeruViet Nam
U. R. TanzaniaIndonesiaNamibia
ColombiaZimbabwe
BangladeshGhana
PhilippinesDominican Rep.
RwandaCambodia
SenegalHaiti
MalawiMadagascar
Nicaragua
MaliChadNigerBurkina FasoGuineaBeninMozambiqueNigeriaCôte d'IvoireKenyaIndiaCameroonNepalEthiopiaZambiaUgandaPeruViet NamU. R. TanzaniaIndonesiaNamibiaColombiaZimbabweBangladeshGhanaPhilippinesDominican Rep.RwandaCambodiaSenegalHaitiMalawiMadagascarNicaragua
0.2 0.4 0.6 0.8 1.0 1.2 1.40.2 0.4 0.6 0.8 1.0 1.2 1.4
Primary education Secondary education
GPI of NARsGPI of NARs
Gender parity
Genderparity
Poorest 20% Richest 20%
Figure 2.37: Gender parity index of net attendance rates, by education level and wealth quintile,
selected countries, most recent year
Source: Demographic and Health Surveys, calculations by Harttgen et al. (2008).
T H E D A K A R G O A L S : M O N I T O R I N G P R O G R E S S A N D I N E Q U A L I T Y
45% of boys. Poverty has a magnifying effect,
with only 4% of ‘extremely poor’ indigenous girls
aged 16 attending school, compared with 45% of
their ‘non-poor’ counterparts.
India’s caste system has a major effect on
participation, with 37% of girls aged 7 to 14
belonging to scheduled castes or tribes not
attending school, compared with 26% of girls
from the majority Hindu group (Lewis and
Lockheed, 2006).
Poor rural girls in Pakistan are among the most
deprived in the country. Girls in urban areas and
from the highest income group are almost as
likely as their male counterparts to attend school
or complete the five primary grades (Lloyd et al.,
2007). By contrast, one girl for every three boys
attends school among the poorest rural
households.
In the Lao People’s Democratic Republic, poor
rural non-Lao-Tai girls aged between 6 and 12
have the lowest attendance rate of any group.
In 2002/2003 their attendance rate was 46%,
compared with 55% for poor non-Lao-Tai boys
and 70% among poor rural Lao-Tai girls. Poverty
and the need to work seem to be the main
reasons children do not go to school or drop out
early (King and van de Walle, 2007).
Cultural attitudes and practices that promote early
marriage, enforce seclusion of young girls or attach
more value to boys’ education can form a powerful
set of barriers to gender parity. In Nepal, 40% of
girls are married by age 15 – a barrier to school
completion. Norms that keep girls at home during
the menses reduce their time in school and lower
their school performance (Lewis and Lockheed,
2006). Distance from school is also associated with
strong gender disparity effects, especially in rural
areas (UN Millennium Project, 2005b). In the Lao
People’s Democratic Republic, distance to school is
negatively related to enrolment (King and van de
Walle, 2007). Similarly, research in Pakistan reports
that having a state school in a village has a strong
positive effect on the probability that girls aged 10
to 14 will be enrolled (Lloyd et al., 2007).
Public policy and governance initiatives can help
overcome gender inequalities. Removing fees and
providing incentives for girls to be in school can
counteract financial pressures on households.
Building schools close to rural communities and
recruiting local teachers can help narrow gender
disparities in rural areas. Removing cultural
barriers to equity is more difficult. It requires
long-term public education, committed political
leadership and legislation enforcing the equal
rights of girls.
Gender equality in education: more difficult to achieve
In addition to the target of eliminating gender
disparities in primary and secondary education
by 2005, the EFA gender goal calls for achieving
gender equality in education by 2015, with a focus
on ensuring girls full and equal access to and
achievement in basic education of good quality.
That part of the goal is more challenging, as this
Report’s monitoring of learning outcomes and
school practices reveals.
Learning outcomes and subject choice:gender differences persist
Girls and boys achieve very different outcomes
in school, not just in overall performance but also
by subject. Features of education systems and
classroom practices partly explain these
differences, but such school-based factors interact
with wider social, cultural and economic forces
that structure expectations, aspirations and
performance along gender lines.
Student assessment results show wide-ranging
gender differences. While the disparities vary,
four distinctive patterns emerge:
Girls continue to outperform boys in readingliteracy and language arts. This effect holds
across a diverse group of countries, including
those with significant gender disparities in school
participation, such as Burkina Faso in sub-
Saharan Africa and Morocco in the Arab States
(UNESCO, 2007a). In one of the most recent
international student assessments, the 2006
Progress in International Reading Literacy Study
(PIRLS), average scores on the combined reading
literacy scale were significantly higher for girls
than for boys in forty-three of the forty-five
countries participating (Mullis et al., 2007). Girls’
average score across all forty-five countries was
seventeen points higher than that for boys,
although variations by country were wide.
Elsewhere, the 2006 Segundo Estudio Regional
Comparativo y Explicativo (SERCE) conducted in
Latin America found that girls did significantly
Student
assessment
results show
large gender
differences
1 0 5
A s s e s s i n g g e n d e r d i s p a r i t i e s a n d i n e q u a l i t i e s i n e d u c a t i o n
90
02
Education f
or A
ll G
lobal M
onitorin
g R
eport
C H A P T E R 2
better than boys in reading achievement in
grades 3 and 6 in half of the sixteen countries
participating (UNESCO-OREALC, 2008).33
Historically, boys have outperformed girls in mathematics in all grades of primary and secondary education – but that picture is changing. Girls increasingly perform at levels
equal to or better than those of boys (Ma, 2007).
For example, in Francophone Africa, among
students tested in the Programme d’analyse des
systèmes éducatifs de la CONFEMEN (PASEC),
there were no appreciable gender differences in
mathematics achievement at second-grade level;
in the fifth grade, small gender differences in
favour of boys were reported in half of the eight
participating countries (Michaelowa, 2004b).34
Among sixth graders tested in fourteen countries
or territories by the Southern and Eastern Africa
Consortium for Monitoring Educational Quality
(in SACMEQ II, 2000–2003), significant male
advantages in mathematics were present in
Kenya, Mozambique, the United Republic of
Tanzania, Zambia and Zanzibar. In the recent
SERCE assessment, eight countries35
demonstrated gender differences, most of them
small, in favour of boys in grade 3 (UNESCO-
OREALC, 2008). Moreover, girls are
outperforming boys in mathematics in a growing
number of countries, including Seychelles
(SACMEQ II); Cuba (2006 SERCE); Armenia,
the Philippines and the Republic of Moldova
(grade 4, in the 2003 Trends in International
Mathematics and Science Study, or TIMSS);
Bahrain and Jordan (eighth grade, TIMSS, 2003);
and Iceland (2003, in the OECD-sponsored
Programme for International Student
Assessment, or PISA). In TIMSS 2003, as many
countries showed gender differences in favour
of girls as in favour of boys (Ma, 2007).
The science gap is often small, though boys tend to maintain an advantage. Recent science
assessments continue to report cases in which
boys hold an advantage over girls, but more often
than not the difference is statistically insignificant
(Ma, 2007). In Latin America, sixth-grade boys
outperformed girls in science in Colombia,
El Salvador and Peru. In the remaining countries
(Argentina, Cuba, the Dominican Republic,
Panama, Paraguay and Uruguay) gender
differences were mixed and not statistically
significant (UNESCO-OREALC, 2008). In TIMSS
2003 boys outperformed girls in some countries
while the reverse was true of a smaller group
of countries. The evidence indicates a slightly
greater male advantage in the higher grade
levels: boys outperformed girls in proportionally
more countries in grade 8 than in grade 4. In
PISA 2006, which tested reading, mathematics
and science, gender differences in science were
the smallest among the three (OECD, 2007b).
Subject choice in tertiary education is stillmarked by strong gender selection effects.Despite the increase in female participation,
some subject areas remain male domains.
Globally, women’s median share of tertiary
science enrolment in 2006 was 29% and their
share in engineering was lower still at 16%.
On the other hand, in half the countries with the
relevant data women accounted for more than
two-thirds of students in fields long considered
‘feminine’, such as education, health and welfare
(see annex, Statistical Table 9B). Social scientists
have long sought to understand the forces
underlying women’s under-representation
in scientific fields. Recent studies indicate
socialization processes may influence girls’
orientation to specific disciplines; examples
include poor career counselling, lack of role
models, negative attitudes from families, fear
of mathematics and fear of being in the minority
(Morley, 2005). Course and stream selection in
upper secondary is also important.
Why do girls perform differently in achievement tests?
The scope and magnitude of the differences point
to a conditioning environment that extends from
school policies and classroom practices to ascribed
gender roles and perceptions in society
(UNESCO, 2007a).
Social conditioning and gender stereotyping can
limit ambition and create self-fulfilling expectations
of disparities in outcomes. Recent research
underlines a strong association between the degree
of gender equality in society at large and the size
of gender gaps in mathematics achievement (Guiso
et al., 2008). How children are taught is important
not just in relaying knowledge, but also in moulding
expectations and building self-confidence. Teacher
attitudes and practices that translate into different
treatment of boys and girls can affect cognitive
development and reinforce gender stereotyping
(Carr et al., 1999; Tiedemann, 2000). So can
textbooks. Content analyses of textbooks in many
Girls are
outperforming
boys in
mathematics in a
growing number
of countries
33. The eight countriesconcerned wereArgentina, Brazil, Cuba,the Dominican Republic,Mexico, Panama,Paraguay and Uruguay.In addition there was astatistically significantfemale advantage amongsixth graders in Chile.
34. This was the case in Burkina Faso, Mali, the Niger and Senegal.The four other countriesparticipating wereCameroon, Chad, Côted’Ivoire and Madagascar.
35. Brazil, Chile,Colombia, Costa Rica,El Salvador, Guatemala,Nicaragua and Peru.
1 0 6

T H E D A K A R G O A L S : M O N I T O R I N G P R O G R E S S A N D I N E Q U A L I T Y
countries continue to reveal gender biases,
with girls and women under-represented. Despite
the general movement towards gender equality,
both sexes continue to be shown in highly
stereotyped household and occupational roles, with
stereotyped actions, attitudes and traits (UNESCO,
2007a). Progress towards eliminating gender bias
in textbooks seems very slow. While unrefined
examples of sexism have largely disappeared,
unbalanced and inappropriate learning material
remains prevalent (Blumberg, 2007).
Female teachers can serve as role models
for young girls, potentially countering gender
stereotypes. Globally, female teachers are
overrepresented in lower levels of education while
the reverse is true at higher levels (Figure 2.38).
In many countries, particularly in the developing
world, female teachers tend to be clustered in
urban schools. A recent survey in eleven middle-
income countries shows that pupils in rural primary
schools are more likely than urban pupils to be
taught by male teachers. This is particularly the
case in India, Paraguay, Peru and Tunisia (Zhang
et al., 2008; see the section on quality below for
further survey results and the full list of countries).
Rural girls thus have less chance of contact with
female role models who might raise their
expectations and self-confidence.
The presence of female teachers may also help
increase girls’ access to school in countries where
high gender disparities prevail. Yet it does not
always guarantee gender equality in socialization
and learning processes (UNESCO, 2007a).
Teachers of either sex may discriminate informally,
reinforcing gender disparities and undermining
learning outcomes for disadvantaged groups.
Such behaviour can affect learning opportunities if,
for example, girls or minority students are seated
far from the teacher, do not receive textbooks or
are not called on in class. In Yemen, researchers
observed that primary school girls were typically
seated at the rear of the classroom – an
arrangement not conducive to effective participation
(Lewis and Lockheed, 2006, pp. 70-1; World Bank,
2003). Greater attention to gender training for
teachers would help, but in many countries the
gender dimension in teacher training takes a back
seat to the teaching of reading and mathematics
when it comes to efforts to improve classroom
and teacher practices (UNESCO, 2007a).
Progress towards
eliminating
gender bias in
textbooks is slow
1 0 7
A s s e s s i n g g e n d e r d i s p a r i t i e s a n d i n e q u a l i t i e s i n e d u c a t i o n
Sub-Saharan Africa
Arab States
Central Asia
East Asia and the Pacific
South and West Asia
Latin America/Caribbean
N. America/W. Europe
Centr./East. Europe
0 20 40 60 80 100
Female teachers (%)
TertiarySecondaryPrimaryPre-primary
Figure 2.38: Percentage of female teachers by level
of education and by region, 2006
Source: Annex, Statistical Tables 10A and 10B.

quality in education – as manifested by the design,
scope and depth of learning experiences children
encounter in school – is vital, going to the heart
of what constitutes good governance in education.
National ‘average’ learning levels and global disparities
A primary education of good quality should enable
children to acquire at a minimum basic skills
in language and mathematics, and to aspire
to continued learning (Box 2.14). But what level
of knowledge and skills do children actually attain
in school?
While international assessments consistently spark
intense political debate, less attention is paid to the
absolute level of learning, especially in developing
countries. Recent studies, many based on national
assessments, point to deep deficits in student
knowledge in many developing countries.
What do learners learn?
In many countries children are acquiring only
the most rudimentary skills in school. A recent
90
02
Education f
or A
ll G
lobal M
onitorin
g R
eport
C H A P T E R 2
Ensuring both equity and the quality of learning
Getting all children through a full basic education
cycle and into secondary school is an important
goal. But the ultimate purpose of schooling is to
provide children with an education that equips them
with the skills, knowledge and wider perspectives
they need to participate fully in the social, economic
and political lives of their countries. Education
quality is harder to measure than quantitative
indicators – but quality and learning is what counts.
Evidence from many developing countries paints
a worrying picture on learning achievement.
Recent progress in quantitative indicators of school
participation has distracted attention from the
glaring need to improve education quality at the
same time. Many children attend primary school,
and even graduate, without ever acquiring a
minimum toolkit of literacy and numeracy skills.
It would be a Pyrrhic victory for EFA if countries
achieved UPE but failed to give children real
opportunities to learn. Clearly, then, assuring
Many children
graduate from
primary school
without acquiring
minimum
literacy and
numeracy skills
1 0 8
Box 2.14: How to measure quality in education?
Measuring quality in education is fraught withdifficulty. While indicators exist to measureenrolment, grade attainment and school completion,there is no ready-made yardstick for quality and noglobally agreed benchmark for measuring progress.
Participants at the Dakar Forum identified severalelements as necessary for quality in education,among them: well-nourished, motivated students;well-trained teachers using active learningtechniques; adequate facilities and materials; a relevant, local language curriculum that builds onteachers’ and learners’ knowledge and experience; a welcoming, gender-sensitive, healthy, safeenvironment that encourages learning; and a cleardefinition and accurate assessment of learningoutcomes (UNESCO, 2000).
Until recently, monitoring of quality primarily meanttracking input measures, such as educationalexpenditure, and teacher supply and qualifications.Now, however, with the growth of learningassessments, monitoring increasingly focuses onlearning outcomes.1 Still, as measures of observedteaching and learning remain few and are rarelyexamined,2 the bias towards measuring inputscontinues (Alexander, 2008).
Another measurement issue concerns equity.Improved quality is typically equated with higheraverage achievement levels. Student knowledge and competencies are ranked in content domains(e.g. language, mathematics, sciences) based onreported country mean scores on standardized tests.Information about the uneven dispersion of learningacross regions, households, ethnic groups and, mostimportantly, schools and classrooms often goesunder-reported.3
1. In theory, learning outcomes include subject-based knowledge,broader skills and competencies, social attitudes, moral valuesand behaviours. In practice, student learning is mainly assessedin terms of either cognitive understanding or skills andcompetencies. In the past, most international assessmentsinvolved high-income countries and a few middle-income ones.Since Dakar more middle- and low-income countries haveparticipated in international and regional assessments. At thesame time more national assessments are being conducted, in all regions (Benavot and Tanner, 2007).
2. Studies based on teacher self-reports of teaching processesare more common than those based on classroom observation.See, for example, Anderson et al. (1989).
3. Gender disparities are the exception, having receivedconsiderable attention. Disparities based on poverty, ethnicity,language, race, caste, residence and religion are less examined.

T H E D A K A R G O A L S : M O N I T O R I N G P R O G R E S S A N D I N E Q U A L I T Y
assessment in Punjab, Pakistan, demonstrates
the point: more than two-thirds of grade 3 students
could not form a sentence in Urdu and a similar
percentage was unable to subtract three-digit
numbers (Das et al., 2006). While most children
could recognize and write the English alphabet,
large percentages found it difficult to place a word
like ‘ball’ near a picture of a ball. Complicated
words and sentences were beyond the reach
of the vast majority.
South Asia’s problems in education achievement
are not confined to Pakistan. Learning assessments
in India also point to low levels of literacy and
numeracy. Since 2005 a large-scale, non-
government initiative has carried out household
surveys of rural Indian children to determine their
school enrolment status and assess their abilities
in reading, arithmetic and English (Pratham
Resource Center, 2008). The most recent survey
(2007) found that fewer than half the children in
standard 3 could read a text designed for standard
1 students, and only about 45% of standard 4
students could read simple words or sentences in
English.36 Just 58% of the students in standard 3
and 38% in standard 4 could subtract or divide.
Another recent school-based assessment in India
involving over 20,000 students in the states of
Andhra Pradesh, Madhya Pradesh, Orissa,
Rajasthan and Tamil Nadu confirmed the low level
of learning in many primary schools. Many students
in standards 3, 4 and 5 were found to lack basic
reading, writing and arithmetic skills (Table 2.15).37
Assessment exercises elsewhere in the developing
world suggest that the situation in Pakistan and
India may be less the exception than the rule.
Research indicates many countries face an
immense challenge in helping children acquire
minimum language skills:
In Cambodia a grade 3 assessment of the Khmer
language involving almost 7,000 students found
that 60% had ‘poor’ or ‘very poor’ skills in
reading (e.g. as regards pronunciation and word
recall) and writing (e.g. punctuation and sentence
structure) (Cambodia Education Sector Support
Project, 2006).
In the Dominican Republic, Ecuador and
Guatemala half or more of grade 3 students were
found to have very low reading levels: they could
not recognize the addressee of a family letter or
decipher the meaning of a simple text in Spanish
(UNESCO-OREALC, 2008).
A recent assessment in Peru found that as few
as 30% of children in grade 1 and only about half
in grade 2 could read simple passages from a
grade 1 textbook (Crouch, 2006).
Results from SACMEQ II indicate that fewer than
25% of grade 6 children reached the ‘desirable’
level of reading literacy in Botswana, Kenya,
South Africa and Swaziland, and fewer than 10%
in Lesotho, Malawi, Mozambique, Namibia,
Uganda and Zambia.
These examples draw attention to the sheer scale
of the quality challenge in education. Millions of
children in the developing world attend primary
schools, many for several years, without mastering
basic skills. Assessments of more complex
abilities, such as conceptualizing, critical thinking
and problem-solving, are equally disturbing.
For example, in Egypt close to 10,000 fourth grade
students in seven governorates were assessed
in Arabic, mathematics and science. In all three
subjects only one-quarter to one-fifth of students
demonstrated an ability to answer questions
involving critical thinking and problem-solving
(Table 2.16).
Overall, deep learning deficits are too common
among schooled children in many developing
countries. The policy challenge is clear: creating
school systems in which a significant segment
of each school-age cohort reaches a minimal
learning threshold (Filmer et al., 2006).
36. Standards 1 through 5are equivalent to primarygrades 1 through 5. The 2007assessment indicated aslight improvement overearlier tests in reading andno change in mathematics.English is introduced bystandard 3 in all statesexcept Gujarat; it is themedium of instruction inJammu and Kashmir State,and Nagaland State.
37. The Children’sCompetency Assessmenttested students in standards 2 through 5.
The sheer scale
of the quality
challenge
in education
is daunting
1 0 9
E n s u r i n g b o t h e q u i t y a n d t h e q u a l i t y o f l e a r n i n g
Table 2.15: Percentage of Indian students in standards 3,
4 and 5 who successfully demonstrated basic skills
59 62 71
47 47 60
52 53 67
45 47 59
30 40 54
12 28 41
Read
Write
Add
Subtract
Multiply
Divide
Note: In reading, children were expected to read ten short, simple sentences atstandard 2 level. In writing, they were expected to write ten words and five short,simple sentences of standard 2 difficulty. In arithmetic, they were given fiveproblems each in addition, subtraction, multiplication and division and weredefined as competent if they received a score of seventy or above.Source: Aide et Action (2008).
Standard 3 Standard 4 Standard 5% of students who can:

90
02
Education f
or A
ll G
lobal M
onitorin
g R
eport
C H A P T E R 2
The international divide in learning outcomes
Beyond the concern about low learning levels based
on national surveys, international assessments
show most developing countries still far behind
developed countries. In an increasingly integrated,
knowledge-based world economy, these disparities
have important implications for development
prospects – and for future patterns of globalization.
With more developing countries participating in
international assessments over the past twenty
years, two consistent findings have emerged.
First, there are glaring gaps in achievement
between developed and developing country students
at similar levels of schooling. Second, the gaps
are only partially associated with differences
in per capita income.38 Other differences – linked
to school quality, teaching policies and system-wide
governance – are also significant.
International assessments illustrate the extent of
low learning levels among ‘average’ students in
participating countries. Results from PISA, which
tests 15-year-old students in several competencies,
are instructive because they include many non-
OECD countries. They highlight striking disparities.
The median PISA 2001 scores of Brazilian,
Indonesian and Peruvian students, placed on a
scale alongside those of students from Denmark,
France and the United States, are situated in the
lowest 20% of the latter countries’ distribution
(Filmer et al., 2006). PISA 2006 science results
show students from developing countries being
much more likely to figure in the lowest
achievement levels (Figure 2.39). Over 60% of
students from Brazil, Indonesia and Tunisia, but
fewer than 10% in Canada and Finland, scored at or
below level 1, the lowest level in the PISA science
ranking. And fewer than 2% to 3% of students from
developing countries attained proficiency levels 5
and 6, whereas 15% or more did so in several
OECD countries.
Other international assessments point in a similar
direction. In the 2003 TIMSS, half of all grade 8
students achieved the intermediate benchmark
(475), but only 17% from the nine participating Arab
States39 did so (UNDP Arab TIMSS Regional Office,
2003). The 2006 PIRLS, testing fourth graders in
reading, revealed large disparities between
There are
glaring gaps
in student
achievement
between
developed and
developing
country students
38. The association isstronger at the lower end of the income scalethan at the upper end. In TIMSS 1999, theassociation between percapita GNP and scores inmathematics and sciencewas about 0.60 (Barber,2006).
39. Bahrain, Egypt,Jordan, Lebanon,Morocco, the PalestinianAutonomous Territories,Saudi Arabia, the SyrianArab Republic andTunisia.
1 1 0
KyrgyzstanQatar
AzerbaijanTunisia
IndonesiaBrazil
ColombiaArgentina
MexicoMontenegro
RomaniaTurkey
ThailandJordan
BulgariaUruguay
ChileSerbiaIsraelItaly
PortugalUnited States
GreeceRussian Fed.Luxembourg
FranceNorwayIceland
LithuaniaSlovakia
SpainDenmark
LatviaBelgium
PolandCroatia
United KingdomSwedenAustria
SwitzerlandCzech Rep.
IrelandGermanyHungarySlovenia
New ZealandNetherlands
AustraliaJapan
Rep. of KoreaMacao, China
CanadaEstoniaFinland
Share of students (%)
0 20 40 60 80 100
At or below level 1 Levels 2 to 4 At or above level 5
Figure 2.39: Percentage of low performing students
(at or below level 1) in science literacy, PISA 2006
Source: OECD (2007c).
Table 2.16: Achievement among grade 4 students in Egypt,
by cognitive level and content domain, 2006
50 36 60
43 31 34
21 17 27
Factual knowledge
Conceptual understanding
Critical thinking and problem-solving
Source: Egypt Ministry of Education (2006).
Arabic Mathematics Science% of students who correctlyanswered items assessing:

T H E D A K A R G O A L S : M O N I T O R I N G P R O G R E S S A N D I N E Q U A L I T Y
developed and developing countries. The five
middle- and low-income countries outside
Europe40 achieved a mean score of 377 – almost
125 achievement points below the international
mean (500).41 Box 2.15 discusses more findings.
While the number of developing countries
participating in international assessments has
increased, many gaps remain, limiting the scope
for cross-country comparison. Exploratory research
for this Report attempts to address the problem by
standardizing national achievement data in primary
education from different assessments to place
countries on a single international scale.42 The
exercise shows the achievement scores of many
developing countries clustered far below those of
developed and transition countries (Figure 2.40).43
It also suggests that the learning gaps tend to be
more pronounced in science than in mathematics
and reading (Altinok, 2008).
International assessments can understate
the divide between developed and developing
countries since they assess learning outcomes
only among children in school. They do not
include similarly aged children who are
currently – or permanently – out of school.
Especially in countries where school participation
rates are low and dropout rates high, exclusion
of out-of-school children can distort national
learning profiles. In rural India, for example, when
out-of-school children were tested they were half
as likely as in-school children to listen to and
answer a subtraction problem (Pratham Resource
Center, 2008). Similarly, in Ghana, Indonesia
and Mexico, tests of language and mathematics
among out-of-school youth found lower
achievement levels than among enrolled students
(Filmer et al., 2006).
40. Indonesia, the IslamicRepublic of Iran, Morocco,South Africa, and Trinidadand Tobago.
41. In addition, two high-income Arab States, Kuwaitand Qatar, scored below 350.
42. Another study of this typeis Hanushek et al. (2008).
43. Achievement scores for some countries in sub-Saharan Africa, and Southand West Asia were excludeddue to data limitations.
Within-country
differences
in achievement
by location
and gender are
often marked
1 1 1
E n s u r i n g b o t h e q u i t y a n d t h e q u a l i t y o f l e a r n i n g
Box 2.15: New international evidence on learning outcomes: what it reveals about quality
Since the release of the EFA Global Monitoring Report2008 (UNESCO, 2007a), results from three majorinternational assessments have been published. Theyprovide important insights on a range of qualitativeindicators of education performance.
PIRLS 2006 measured grade 4 reading skills. Thepercentage of students demonstrating basic readingability — i.e. reaching level 1, the lowest internationalbenchmark — varied from 22% in South Africa and26% in Morocco to more than 95% in most of NorthAmerica and Western Europe. The share of studentsperforming at or above the intermediate benchmark,level 2, was over 75% in most OECD countries but lessthan 20% in developing countries including Indonesia,Morocco and South Africa (Mullis et al., 2007).1
PISA 2006 tested 15-year-olds in science, mathematicsand reading (OECD, 2007b). Twenty of the thirtyparticipating OECD countries had science scores within twenty-five points of the OECD average of 500. Among countries scoring significantly below the OECDaverage, the variation was considerably greater, from a low of 322 in Kyrgyzstan to a high of 493 in Croatia.PISA 2006 results can be compared with those from2000 in reading and from 2003 in science andmathematics. For most countries with comparabledata, average scores changed relatively little — despiteincreases in national investment in education(OECD, 2007b).
In Latin America the 2006 Segundo Estudio RegionalComparativo y Explicativo (SERCE) assessed readingand mathematics in grade 3, and reading, mathematicsand science in grade 6 (UNESCO-OREALC, 2008).2
Overall, countries fell into four categories: 1) Cubanstudents outperformed those from other countries in almost all subjects and grade levels; 2) a smallgroup of other consistently high performing countriesincluded Chile, Costa Rica and Uruguay; 3) a largegroup of relatively poor performing countries includedthe Dominican Republic, Ecuador, El Salvador,Guatemala, Nicaragua, Panama, Paraguay and Peru;and 4) in countries in the middle — Argentina, Brazil,Colombia and Mexico — pupil achievements varied bysubject and grade. For the last three groups, within-country differences in achievement by location andgender were often marked. For example, among poor-performing countries, rural-urban differenceswere considerably more pronounced in El Salvador,Guatemala and Peru than in the Dominican Republic,Nicaragua and Panama.
1. Of the twenty-seven countries and territories with readingachievement data for both PIRLS 2001 and 2006, eight showedsignificant gains: Germany, Hong Kong (China), Hungary, Italy, theRussian Federation, Singapore, Slovenia and Slovakia. In Germany,the Russian Federation and Slovakia, improvements in readingachievement were at the expense of equity: gains were madeamong higher-performing students but not lower-performing ones.Average reading levels declined over time in England (UnitedKingdom), Lithuania, Morocco, the Netherlands, Romania andSweden.
2. Sixteen Latin American countries took part in SERCE. Thenumber of countries participating in learning assessments varies:there were forty countries in PIRLS 2006, fifty-seven countriesand territories in PISA 2006.

90
02
Education f
or A
ll G
lobal M
onitorin
g R
eport
C H A P T E R 2
Beyond national averages — huge inequalities in achievement
Unequal learning outcomes, typically related
to socio-economic status and other indicators
for disadvantage, are most pronounced within
countries. They exist at every level: between
regions, communities, schools and classrooms.
Such unequal outcomes are a source of intense
political debate. Parents, policy-makers and often
children themselves perceive such disparities as
evidence of an unfair and inequitable education
system. Improving and equalizing the provision
of education of good quality is at the core of the
wider EFA governance challenge.
Among the huge within-country differences that
learning assessments continue to document:
Reading scores of fourth graders from
developing countries varied widely in PIRLS 2006.
The gap between the top 5% and bottom 5% was
454 scale points (562 minus 108) in South Africa,
359 points in Morocco and 340 points in Trinidad
and Tobago. In all three, high-scoring pupils
reached reading levels comparable to some
of the best pupils in high-achieving countries
(Mullis et al., 2007).
In SERCE, third-grade reading scores varied
extensively in both high- and low-performing
countries. In Cuba the point difference between
students in the top 10% and bottom 10% of the
distribution was 295 scale points (779 minus 484).
Most other countries in the region had smaller
differences, among them Argentina (236 points),
Costa Rica (231), El Salvador (219) and Paraguay
(241) (UNESCO-OREALC, 2008).
Using items based on the 2005 TIMSS, tests
were administered to 6,000 ninth-grade students
in the Indian states of Rajasthan and Orissa.
Not only were average scores very low, with 30%
to 40% of the children unable to reach a low
international benchmark, but the score
distribution was highly unequal: the difference
between the top 5% and bottom 5% was among
the highest in the world. Students in the top 5%
scored higher than the top students in other
low-performing countries, and higher than the
median students in all but the best-performing
countries (Das and Zajonc, 2008; Wu et al., 2007).
Unequal learning
outcomes are
most pronounced
within countries
1 1 2
Composite achievement score based on pupil performance in international learning assesments
Developed countries
Developing countries and countries in transition
TFYR
Mac
edon
ia
20 25 30 35 40 45
Turk
ey
Trin
idad
/Tob
ago
Iran,
Isl.
Rep.
Colo
mbi
aAr
gent
ina
Indo
nesi
a
Kuw
ait
Phili
ppin
es
Vene
zuel
a, B
. R.
Tuni
sia
Mor
occo
Sout
h Af
rica
Figure 2.40: Disparities in mean learning achievement in primary education among developed countries, developing countries and countries
Note: The composite achievement score is the arithmetic mean of all scores of a given country on international assessments between 1995 and 2006. Standardized with a mean of 50 and a standard deviation of 10, it ranges from 0 to 100. Achievement data are only compiled from international and regional assessments, and not from national assessments.Source: Altinok (2008).

T H E D A K A R G O A L S : M O N I T O R I N G P R O G R E S S A N D I N E Q U A L I T Y
The underlying causes of inequality in learning
outcomes are enormously varied. However,
research drawing on data from international,
regional and national assessments identifies three
sets of key factors influencing within-country
disparities: student background, school context
and system-level characteristics.44
Student-related factors
What students bring with them to school influences
how well they perform. Some student endowments,
such as ability, are inherent and randomly
distributed. Others are the product of social,
economic and cultural circumstances, such as
parents’ education, occupation and income; gender
(see previous section); home language; and other
family characteristics.
Socio-economic-related gaps in achievement
are a dominant, recurring theme in national and
international research. Students of lower socio-
economic status generally score lower than
students from more advantaged backgrounds.
The level and slope of the socio-economic gradient
of learning vary considerably among countries – a
key fact, as it shows the influence of public policies
in this area (Ma, 2008; Willms, 2006). Interestingly,
recent assessments suggest that larger
performance gaps linked to socio-economic status
exist in Central and Eastern Europe and in North
America and Western Europe than in developing
countries (Ma, 2008).45 Research for this Report
attempted to clarify the degrees to which
occupation, parents’ education, family income/
household wealth and ‘home literacy’ were each
associated with pupil achievement in various
countries (Ma, 2008). Occupation was found
to be the most important socio-economic status
component in North America and Europe, while
household wealth (family possessions) was the
most important in East Asia and the Pacific, and
in Latin America and the Caribbean.46 Parental
education, while significant, was found to have
less impact. ‘Home literacy’, defined as the
possession of over ten books, had strong positive
effects on learning outcomes in most middle-
and low-income countries.
Family size and composition also influence
learning achievement. Recent research confirms
that children with fewer siblings tend to outperform
those with more siblings (Dronkers and Robert,
44. See, for example,Fuller (1987), Fuller andClarke (1994), Keeves (1995),Lockheed and Verspoor(1991), Michaelowa (2004a),Mullis et al. (2000), Mulliset al. (2003), Postlethwaite(2004), Riddell (2008),Scheerens (2004) andWößmann (2003).
45. PISA, employing an indexof economic, social andcultural status, found fewdifferences in its effectsamong the different subjectdomains: reading,mathematics and science.
46. The author argues that,when it comes to studentlearning outcomes, in moredeveloped regions socialcapital at home outweighsmaterial resources at home,whereas in less developedregions the opposite is the case.
1 1 3
E n s u r i n g b o t h e q u i t y a n d t h e q u a l i t y o f l e a r n i n g
Composite achievement score based on pupil performance in international learning assesments
Developed countries
Developing countries and countries in transition
Italy
Switz
erla
nd
Rom
ania
Nor
way
Fran
ce
Cana
daGe
rman
yDe
nmar
kHu
ngar
yLi
thua
nia
Aust
ralia
Luxe
mbo
urg
Portu
gal
Icel
and
Gree
ceBe
lgiu
m (F
r)
Spai
n
Pola
ndSl
ovak
ia
New
Zea
land
Slov
enia
Latv
iaIre
land
Bulg
aria
Unite
d Ki
ngdo
mSw
eden
Czec
h Re
publ
icUn
ited
Stat
es
Net
herla
nds
Belg
ium
(Fl)
Aust
ria
Japa
n
45 50 55 60 65 70
Rep.
of K
orea
Sing
apor
e
Russ
ian
Fed.
Rep.
Mol
dova
Isra
el
Thai
land
Arm
enia
Geor
gia
in transition, 1995–2006
90
02
Education f
or A
ll G
lobal M
onitorin
g R
eport
C H A P T E R 2
2008; Park, 2008).47 Rapid changes in family
structure due to divorce, separation, parental death
or migration are equally influential. The PISA 2003
mathematics assessment found that in twenty
countries with relevant information, students from
two-parent homes performed best, on average –
a result that held even after controlling for socio-
economic status (Hampden-Thompson and
Johnston, 2006).48
Immigrant status influences learning in many
countries. Results from PISA 2003 indicated that
first-generation immigrant students (those born
abroad) and second-generation students (those
whose parents were born abroad) scored lower in
reading, mathematics and science than their native
counterparts, except in Canada (OECD, 2006b).49
As language proficiencies in the host country
improve, achievement disparities among second-
generation immigrants decline (Schnepf, 2008).
Characteristics of immigrant children’s countries
of origin and destination also influence achievement
(de Heus et al., 2008; Levels et al., 2007).
First-generation children from countries where
compulsory education lasted longer performed
better in science (OECD, 2007a) than other, similar
children (de Heus et al., 2008). With migration flows
increasing worldwide, closing immigration-related
inequalities is important not just for achieving
equity in education, but also for addressing
concerns over social cohesion (International
Organization for Migration, 2005; OECD, 2006b).
Home language is related to classroom success.
In eighteen of the twenty OECD countries
participating in PISA 2003, students whose home
language differed from the language of instruction
had significantly lower scores in mathematics than
those who spoke the test language at home
(Hampden-Thompson and Johnston, 2006).50
In many Latin American countries, including Bolivia,
Chile, Ecuador, Guatemala, Mexico and Peru,
children from households where indigenous
languages were spoken scored significantly lower
in reading and mathematics than those from
non-indigenous households (Flores-Crespo, 2007;
Lewis and Lockheed, 2006; McEwan, 2004;
McEwan, forthcoming; McEwan and Trowbridge,
2007).51 In most studies the impact of language
remained after adjusting for factors such as
poverty, location and other home background
indicators.
System-level factors
The way an education system is organized can
have a significant bearing on learning outcomes.
Rules on promotion between grades, school-
leaving exams, institutional differentiation
(between different types of school) and
instructional differentiation (through ability
grouping, streaming, multigrade teaching) all have
an impact on learning outcomes. While the impact
varies by context, some broad findings emerge
from international research (Fuchs and Wößmann,
forthcoming; OECD, 2007a):
Sorting students into non-equivalent tracks or
streams is associated with reduced equity
(unequal learning outcomes) and sometimes
lower learning levels. Education systems with
very selective academic streams are associated
with larger gender gaps in mathematics and
science at both primary and secondary level
(Bedard and Cho, 2007).
Extensive early childhood education (of longer
duration and higher enrolment coverage)
increases equity in education for children from
dissimilar family backgrounds (Schütz
et al., 2005).
Public policies and attitudes towards
immigration, residency, gender and language
are associated with differences in educational
opportunities. Where measures encouraging
gender equality have been taken, gender gaps
in mathematics tend to be smaller (Baker and
Jones, 1993; Guiso et al., 2008; Marks, 2008).
Extensive early
childhood
education boosts
equity and
helps overcome
disadvantage
47. See also results from national assessments in Cambodia, Ethiopia,Madagascar and Mongolia (Cambodia Education Sector Support Project,2006; Academy for Education Development and USAID Ethiopia, 2004;Madagascar Ministry of National Education & Scientific Research andUNESCO, 2004; Mongolia Ministry of Education, Culture and Science and UNICEF, 2008).
48. See also Bradshaw and Finch (2002), Downey (1994), Duncan andBrooks-Gunn (1997), Hampden-Thompson and Pong (2005), Haveman et al. (1991), McLanahan and Sandefur (1994) and Pong et al. (2003).
49. This study focused on seventeen countries or territories with largeimmigrant populations: Australia, Austria, Belgium, Canada, Denmark,France, Germany, Luxembourg, the Netherlands, New Zealand, Norway,Sweden, Switzerland and the United States, among OECD countries, andthree non-OECD PISA participants: the Russian Federation, Hong Kong(China) and Macao (China).
50. More recently, poor language achievement by third- and sixth-gradechildren in the Dominican Republic, Ecuador, Guatemala, Nicaragua,Panama, Paraguay and Peru was reported in SERCE, further illustratingthe influence of home language (UNESCO-OREALC, 2008).
51. The ‘effect size’ of belonging to an indigenous household was, onaverage, over one-third of a standard deviation; i.e. indigenous children’sscores were one-third of a standard deviation lower in Spanish andmathematics than those of non-indigenous children. The indigenousdisadvantage was higher for language scores than in mathematics.
1 1 4

T H E D A K A R G O A L S : M O N I T O R I N G P R O G R E S S A N D I N E Q U A L I T Y
School-based factors
Properly resourced schools, effective teachers and
dynamic classrooms are crucial for learning. Even
after adjustments for student background and other
factors, international research consistently points
to large school-based differences in learning
outcomes (Willms, 2006). Inequalities in school
context and quality are especially pronounced
in developing countries and typically account for
considerable variation in learning outcomes
(Baker et al., 2002; Heyneman and Loxley, 1983).
What makes for an effective learning environment?
Dynamic processes are important. Professional
leadership, shared vision and goals, teachers who
motivate students, and the use of monitoring and
evaluation to improve performance are considered
key ingredients of ‘effective’ schools (Creemers,
1997; Reynolds et al., 2002).52 Sufficient
instructional time is also vital (Box 2.16).
Dilapidated buildings, overcrowded and under-
resourced classrooms, and inadequate supplies
of textbooks and workbooks are not conducive to
learning. More students from rich families attend
well-equipped schools (Table 2.17). The poor state
of the school environment in many countries is
52. Alexander (2008) argues,on the other hand, that the‘effective school’ approachaggregates findings fromstudies conducted bydiffering methods, atdifferent times and places;inadequately addressesdeeper cultural differenceshaving to do with the aimsand purposes of eacheducation system; presentsteaching as value-neutral,content-free and entirelydevoid of the dilemmas ofideal and circumstance; and employs rather arbitraryvariables to describe effectiveschools.
Learning gaps
in many countries
are linked
to inadequate
and unequal
provision of
instructional time
1 1 5
E n s u r i n g b o t h e q u i t y a n d t h e q u a l i t y o f l e a r n i n g
Box 2.16: Unequal learning time, unequal outcomes
Learning gaps in many countries are linked toinadequate and unequal provision of instructionaltime. While almost all countries set official guidelinesand rules on the amount of time children should be in school, actual time varies enormously within andamong countries (Abadzi, 2007).*
Many factors influence the delivery of instructionaltime. Armed conflict, ethnic violence, natural disastersand inclement weather can affect the number of daysschools are open in some regions and communitiesand not others (Abadzi, 2007; O’Malley, 2007).Teacher absenteeism and lateness significantly reducetime available for teaching and learning (Abadzi,2007). The PASEC and SACMEQ surveys report thatteacher turnover and late teacher postings leavemany African schools unable to follow the officialschool year (Bonnet, 2007).
Significant disparities in instructional time betweenschools are reported. An in-depth study ofBangladesh’s government primary schools andregistered non-government primary schools foundlarge disparities in annual lesson time (FinancialManagement Reform Programme, 2006b). The
bottom 10% of government schools provided fewerthan 500 lesson hours per year in classes 3, 4 and 5whereas the top 10% provided more than 860; the equivalent range at the non-government schoolswas 470 to 700 hours.
In several developing countries school heads reportthat village schools operate fewer days a year thantown/city schools. Similarly, despite uniformcountrywide guidelines, grade 4 teachers in villageschools in Paraguay, the Philippines and, to a lesserextent, Brazil, Malaysia and Tunisia report teachingsignificantly fewer annual hours of mathematics andreading than teachers in city/town schools. In somecountries the most instructed 10% of pupils receive50% more instructional time per year than the leastinstructed 10% (Zhang et al., 2008). In PIRLS 2006grade 4 teachers also report considerable in-countrydifferences in weekly hours spent on reading (Mullis et al., 2007).
* International agencies recommend 850 to 1,000 hours per year,or about 200 days on a five-day school week (Lockheed andVerspoor, 1991; UNESCO, 2004; World Bank, 2004). In manycountries even the official instructional time falls short of this(UNESCO, 2007a). Use of double, triple or split shifts significantlyreduces yearly instructional time (Abadzi, 2007).
Policies governing the group composition
of schools significantly affect learning. The
mix of students attending a school – in terms
of socio-economic status, ethnicity or race –
affects learning not only independently but
also indirectly through managerial, pedagogical
and psycho-social processes (Dumay and
Dupriez, 2007).
Systems with more privately funded and
academically selective schools tend to attain
higher learning outcomes, but the achievement
advantages tend to be reduced once student
background factors are taken into account
(OECD, 2007a).
In some assessments, learning outcomes
are related to the extent to which schools
in a system have autonomy over teacher
appointments, budget formulation and
allocation, and/or instructional content
(see Chapter 3). Evidence from PISA 2006
indicates that learning outcomes tend to be
higher in countries that encourage public
posting of student performance.

90
02
Education f
or A
ll G
lobal M
onitorin
g R
eport
C H A P T E R 2
linked to insufficient financing. Of course, increased
spending does not automatically lead to enhanced
quality (Hanushek and Luque, 2003).
Research in developing countries in recent
years underlines the importance of the school
environment. Learning assessments in Madagascar
and the Niger found that having electricity in the
school significantly improved outcomes (Fomba,
2006; Madagascar Ministry of National Education
& Scientific Research and UNESCO, 2004). In
Guinea, access to books was shown to significantly
improve learning (Blondiaux et al., 2006).
The parlous state of the education infrastructure,
documented in past Reports (UNESCO, 2004;
UNESCO, 2007a), is still of concern. For example,
poor and unequal provision of school resources
is endemic in sub-Saharan Africa:
SACMEQ II found that over half the grade 6
students in Kenya, Malawi, Mozambique, Uganda,
the United Republic of Tanzania and Zambia
attended classrooms that did not have a single
book (UNESCO, 2005).
In these and other countries, 25% to 40% of
teachers did not possess a manual in the
subjects they taught (Bonnet, 2007).
Significant percentages of Nigerian students in
grades 4 and 6 reported lacking textbooks: 30%
in English, 50% in mathematics, 65% in social
studies and 75% in science (Nigeria Federal
Ministry of Education et al., 2005).
Under such circumstances teachers spend
much class time writing lessons and problems
on the board while students copy them into exercise
books – if they have any.
Poor school infrastructure is also widespread in
Latin America. Ecuador, Guatemala, Nicaragua,
Panama, Paraguay and Peru have many primary
schools lacking several or all of the following:
sufficient toilets, potable water, libraries, books and
computer rooms (UNESCO- OREALC, 2008). Poorly
equipped schools tend to be attended by children
from poorer households, exacerbating underlying
inequalities in opportunity.
Recent monitoring work underlines the appalling
and unequal state of education infrastructure and
quality in eleven developing countries (Zhang et al.,
2008).53 Chile, Malaysia and Uruguay were found
to have the best-resourced schools, and India,
Peru and Sri Lanka the worst. Among key findings:
School resources are unequally distributed
within countries. Schools in cities and towns
have significantly more resources (from a list
of thirty-one items) than schools in villages and
rural areas. Schools attended by more socially
advantaged students also have greater resources
and private primary schools are better resourced
than public sector schools.
Many schools and classrooms are in a state of
disrepair. In Peru, the Philippines and Sri Lanka,
half or more of school heads say that the ‘school
needs complete rebuilding’ or ‘some classrooms
need major repairs’. In all countries except
Malaysia, village schools are reported to be in
greater need of repair than city/town schools.
In India, Peru, the Philippines, Sri Lanka and
Tunisia, one-third or more of students attend
schools with insufficient toilets.
Distance and student well-being are serious
problems. In the Philippines, Sri Lanka and
Tunisia, teachers report that one in seven
children has to walk more than 5 kilometres
to attend school. Teachers in all countries report
that at least 9% of children come to school with
an empty stomach, and in some countries the
share is as high as 18%.
Many schools
lack sufficient
toilets, drinking
water, desks
and books
53. Argentina, Brazil, Chile, India (in the states of Assam, Madya Pradesh,Rajasthan and Tamil Nadu), Malaysia, Paraguay, Peru, the Philippines,Sri Lanka, Tunisia and Uruguay. The response rate in parts of Sri Lankawas low because of armed conflicts and the 2004 tsunami, so resultsshould be interpreted with caution.
1 1 6
Table 2.17: Percentage of students in grade 10 in well-equipped schools,
by parental socio-occupational status1
61 25
64 38
64 38
47 23
39 10
59 32
65 58
Argentina
Brazil
Chile
Mexico
Peru
Latin American countries
OECD countries2
1. Schools were divided into two groups on the basis of how well they were equipped with libraries,multimedia tools, computer laboratories, chemistry laboratories, etc.2. Data are for twenty-seven OECD countries, not including Mexico. Regional totals are weighted.Source: UN Economic Commission for Latin America and the Caribbean (2007).
% of students from highest quartile who attend
well-equipped schools
% of students fromlowest quartile who attend
well-equipped schools
T H E D A K A R G O A L S : M O N I T O R I N G P R O G R E S S A N D I N E Q U A L I T Y
Many countries and schools lack fundamental
resources for learning. India, Peru, the
Philippines and Sri Lanka suffer an acute
shortage of seating. Nearly half of students in
Paraguay, the Philippines, Sri Lanka and Tunisia
attend schools with no libraries; in Argentina,
Chile, Malaysia and Uruguay the share is down
to 20% or less. Pupil access to a classroom
book corner varies considerably within
countries.
Textbook provision and content remain
problems. About 15% to 20% of grade 4 pupils
do not have a textbook or have to share one.
In Argentina, Paraguay and the Philippines the
percentage is higher. Schools in Asian countries
and Tunisia rely on materials focusing on basic
decoding skills, though most schools in Latin
America use more challenging continuous texts
(e.g. fables), and imaginary and real-life
narrative texts. In general the difficulty and
appropriateness of grade 4 texts, and the
frequency of their use, varied greatly within
and among countries.
Overall, such student, school and system
characteristics affect learning outcomes in all
countries, with the relative weight of each category
varying according to context. New multilevel
analyses of student achievement that mostly
involve developed and transition countries
underscore the overriding importance of student-
level factors, followed by school- and system-
related factors (Riddell, 2008). Analyses of learning
outcomes in developing countries emphasize
school resources and teacher-related factors.
Clearly governance decisions concerning school
infrastructure, classroom processes, and the
recruitment, deployment and effectiveness of
teachers, as well as the student composition
of schools, matter a great deal for learning.
Teacher supply and quality
Delivery of good-quality education is ultimately
contingent on what happens in the classroom, and
teachers are in the front line of service. To improve
student outcomes, having enough teachers and
reasonable pupil/teacher ratios (PTRs) is not
sufficient: the teachers need to be well trained
and motivated. The profile of teachers, and the
governance systems through which they are
recruited, trained and deployed, have a critical
bearing on learning outcomes and on equity.
Numbers and needs worldwide
Good-quality education depends in part on
reasonable class sizes. Pupils in large classes have
fewer opportunities for participation and interaction
with teachers, and generally less access to
instructional materials.
More than 27 million teachers were working in
primary education institutions worldwide in 2006,
80% of them in developing countries (Table 2.18
and annex, Statistical Table 10A).54 Total primary
teaching staff increased by 5% between 1999
and 2006. The largest increases occurred in sub-
Saharan Africa. Teacher numbers also increased
in Latin America and the Caribbean. The number
of secondary school teachers increased by 5 million
over the period, to 29 million. While these increases
are impressive, achieving EFA will still require vast
efforts in terms of teacher recruitment (Box 2.17).
PTRs are a more useful benchmark for measuring
teacher provision than global and regional numbers.
There is a broad consensus that a PTR of 40:1 is an
approximate ceiling for a primary school learning
environment of good quality.55 Very low ratios point
to inefficient allocation of teachers. As secondary
education is often organized by subject units,
more teachers are needed than in primary school,
so global benchmarks are less easily established
and compared for this level.
Regional and national PTRs show marked variation
and little change. There are large regional and
national disparities in PTRs, with marked teacher
shortages in South and West Asia, and sub-Saharan
Africa (see annex, Statistical Table 10A). In
Afghanistan, Chad, Mozambique and Rwanda,
national primary PTRs exceed 60:1. In sub-Saharan
Africa, and South and West Asia, the supply of new
teachers has failed to keep pace with increases
in primary school enrolment. Particularly sharp
increases in PTRs are evident in some countries,
including Afghanistan, Kenya, Rwanda and the
United Republic of Tanzania. By contrast, PTRs
in Latin America and the Caribbean, and in North
America and Western Europe have declined as
enrolment decreased and/or teacher numbers
increased. In secondary education, the highest
PTRs are again observed in sub-Saharan Africa,
and South and West Asia. Eritrea, Nigeria and
Pakistan, for instance, have ratios above 40:1
(see annex, Statistical Table 10B). As in primary
education, there has been no discernible shift
in secondary PTRs since 1999.
54. More than a third ofteachers worldwide are inEast Asia and the Pacific(mostly in China) and afurther fourth are in the mostpopulous countries in otherregions: Bangladesh, Brazil,Egypt, India, the IslamicRepublic of Iran, Mexico,Nigeria, Pakistan, theRussian Federation and the United States.
55. The PTR is a roughmeasure of class sizebecause it is calculated bytaking the total number ofteachers (including somewho may not be inclassrooms) and dividing it by the total number of pupilsenrolled, including those not attending classes. As theindicator is based on teacherheadcounts, it does notreflect part-time teaching or double-shifting.
The most acute
teacher shortages
are in South and
West Asia, and
sub-Saharan Africa
1 1 7
E n s u r i n g b o t h e q u i t y a n d t h e q u a l i t y o f l e a r n i n g

90
02
Education f
or A
ll G
lobal M
onitorin
g R
eport
C H A P T E R 2
1 1 8
School year ending in
25 795 27 192 5 25 25 1 24 180 28 906 20 18 18 -2
20 466 21 811 7 27 28 2 15 109 19 637 30 21 20 -44 485 4 633 3 16 14 -9 6 286 6 595 5 13 13 -5
843 748 -11 20 18 -10 2 785 2 674 -4 11 10 -10
2 004 2 581 29 41 45 10 872 1 238 42 24 27 131 554 1 832 18 23 22 -4 1 387 1 776 28 16 16 -3
332 319 -4 21 19 -10 873 923 6 11 12 1110 094 9 671 -4 22 20 -8 7 702 9 415 22 17 17 -1
9 938 9 502 -4 22 20 -8 7 476 9 166 23 17 17 -1156 169 8 20 19 -8 226 249 10 14 14 -3
4 301 4 859 13 37 40 8 2 956 4 138 40 33 30 -102 684 3 016 12 26 23 -13 2 746 3 594 31 19 16 -15
104 111 7 24 22 -10 53 66 26 22 19 -122 580 2 905 13 26 23 -13 2 693 3 527 31 19 16 -153 443 3 687 7 15 14 -9 4 487 4 851 8 14 13 -41 384 1 226 -11 19 18 -6 3 158 2 971 -6 13 11 -10
World
Developing countriesDeveloped countriesCountries in transition
Sub-Saharan AfricaArab StatesCentral AsiaEast Asia and the Pacific
East AsiaPacific
South and West AsiaLatin America/Caribbean
CaribbeanLatin America
N. America/W. EuropeCentral/Eastern Europe
Table 2.18: Teaching staff and pupil/teacher ratios in primary and secondary education, by region, 1999 and 2006
Teaching staff
Primary education
Changebetween1999 and
2006(%)(000) (000) (000) (000)
1. Based on headcounts of pupils and teachers.Source: Annex, Statistical Tables 10A and 10B.
1999 2006School year ending in
Pupil/teacher ratio1Change
between1999 and
2006(%)
1999 2006School year ending in
Teaching staff
Secondary education
Changebetween1999 and
2006(%)
1999 2006School year ending in
Pupil/teacher ratio1Change
between1999 and
2006(%)
1999 2006
Box 2.17: How many teachers are needed to achieve EFA?
The 2008 Report (UNESCO, 2007a) emphasized thatnational governments had to recruit and train teachers on a vast scale to achieve the EFA goals. It is estimated that the world will need approximately 18 million additionalprimary teachers by 2015.1
The most pressing need is in sub-Saharan Africa, where an estimated 1.6 million additional posts must be createdand teachers recruited by 2015 (on the basis of 2004 data)if UPE is to be achieved. Taking teacher retirement,resignations and losses into account pushes that figure up to 3.8 million. This represents about 145,500 posts and teachers annually, 77% higher than the annual increaseobserved between 1999 and 2006. In Ethiopia and Nigeriathe annual requirement for new posts is more than 11,000.Burkina Faso, the Congo, Chad, Mali and the Niger all needto increase posts and teachers by more than 10% a year.
East Asia and the Pacific will need an estimated 4 millionteachers by 2015 and South and West Asia 3.6 million, withthe largest increases required in China, India and Indonesia.Teacher needs in these regions, however, are mostly to fillposts left by retiring or otherwise departing teachers.
These estimates do not take account of additionalinvestments (e.g. for teacher training) required to ensurethat teaching is effective. Moreover, comprehensiveestimates of teacher needs are available only at primarylevel. Factoring in the number of teachers and other staffneeded to meet all the EFA goals increases still further the scale of necessary investment in teacher recruitmentand training:
A study for Senegal, for example, shows that non-formaleducation will need an additional 1,900 instructors yearlybetween 2008 and 2010, nearly as many additional postsas are required at primary level.
Projections in Ghana, Kenya, Malawi, Senegal, Uganda and Zambia2 show that 321,561 new lower-secondaryteachers would be needed between 2006 and 2015 toreduce student dropout and repetition at all levels by25% and increase primary to lower-secondary transitionrates by 25%. Kenya and Malawi, for example, would haveto double teacher numbers to meet these goals.
1. Estimated on the basis of 2004 teacher supply and PTRs.
2. Based on constant PTRs at 2006 levels, not disaggregated by subject.
Sources: Diagne (2008); Schuh Moore et al. (2008); UIS (2006b).

T H E D A K A R G O A L S : M O N I T O R I N G P R O G R E S S A N D I N E Q U A L I T Y
Trained teachers are in short supply in many
countries. While differences in teacher training limit
the scope for simple cross-country comparisons,56
large regional variations are apparent. In primary
education, the median shares of trained teachers
in the total teaching force range from 68% in South
and West Asia to 100% in the Arab States (see
annex, Statistical Table 10A). Variations by country
are also marked. In Lebanon, for example, just 13%
are trained, for an average of one trained teacher
per 110 students (Figure 2.41). In Mozambique the
percentage of trained teachers is higher (65%) but
because the total number is insufficient the ratio of
pupils to trained teachers is very high, 104:1. Nearly
half the forty countries with data for both 1999 and
2006 increased the presence of trained teachers
(see annex, Statistical Table 10A), in some cases
by considerable margins. The Bahamas, Myanmar,
Namibia and Rwanda raised the proportion of
trained primary school teachers by more than
50%.57 However, more than a third of countries,
including Bangladesh, Nepal and the Niger, moved
in the opposite direction, with percentages of
trained primary school teachers declining.
Excessive PTRs, shortages of trained teachers
and questions about teachers’ skills point to
wide-ranging problems in governance. Teacher
shortages often result from inadequate investment
in education and questionable incentive structures
for teacher recruitment and retention. At the
primary level in particular, teacher training is
often fragmented and incomplete – in some cases
non-existent. Many countries have had trouble
increasing the number of primary education
teachers because they have not yet expanded
secondary education sufficiently to produce enough
candidates for teacher-training programmes.
Within-country disparities
The total number of teachers and the national PTR
shed some light on the state of a given education
system, but they can obscure disparities in teacher
assignment associated with location, income and
school type. These disparities affect the extent to
which a country truly gives everyone the opportunity
to receive an education of good quality. In many
countries teachers are unevenly distributed,
resulting in major disparities in PTRs. In Nepal in
2005, the PTR in the Dhanusa district, in the central
region, was 82:1 – double the national average
(Sherman and Poirier, 2007). Among the country’s
seventy-five districts, nearly half had ratios at or
above 40:1 while the rest were well staffed,
providing very small class sizes in some cases.
Similarly, PTRs in the Nigerian state of Bayelsa
were five times higher than in Lagos. Large
variations in PTRs can exist even within local
administrative areas: a 2004 survey of 10 of the
493 upazilas (subdistricts) in Bangladesh found
56. Wide variations exist in the institutional quality of pre-service education,programme selectivity andprofessional developmentopportunities andrequirements.
57. Myanmar’s BasicEducation Long-termDevelopment Plan(2001/02–2030/31) focusedfor the first five years onreducing the number ofuncertified teachers andexpanding teacher-trainingcolleges. It introduced two-year pre-service trainingprogrammes and increasedthe intake of primary andlower secondary teachers to in-service teacher trainingin twenty education colleges.Also during this periodMyanmar’s two Institutes of Education, in Yangon and Sagaing, provided more teacher-trainingprogrammes for the uppersecondary level.
Many countries
have had trouble
increasing the
number of primary
education teachers
because they have
not yet expanded
secondary
education
sufficiently
1 1 9
E n s u r i n g b o t h e q u i t y a n d t h e q u a l i t y o f l e a r n i n g
BermudaCuba
KuwaitAndorra
QatarCayman IsAzerbaijan
Brunei Daruss.Lebanon
OmanBr. Virgin Is
BahamasBelarus
Cook IslandsMaldives
MontserratAnguillaUkraine
DominicaAruba
UzbekistanCosta RicaViet Nam
Macao, ChinaMauritiusTajikistan
Dominican Rep.Ecuador
BelizeSaint LuciaKyrgyzstan
AlgeriaPanama
Cape VerdeBhutan
MyanmarLao PDR
NicaraguaDjibouti
SudanGambia
GhanaPakistan
NigerEl Salvador
LesothoMauritania
BeninGuinea
CameroonBurkina Faso
EritreaCambodia
U. R. TanzaniaCongo
RwandaMozambique
Ratio
0 20 40 60 80 120100
Pupil/teacher Pupil/trained teacher
Figure 2.41: Comparison of PTRs with ratios of pupils
to trained teachers in primary education, 2006
Source: UIS database.

90
02
Education f
or A
ll G
lobal M
onitorin
g R
eport
C H A P T E R 2
ratios ranging from 36:1 to 93:1 (Ahmed et al.,
2007). Geographic disparities in teacher distribution
often coincide with socio-economic variation in the
populations served. Compared with poorer pupils,
wealthier children often attend schools with better
PTRs and larger shares of trained teachers.
While urban PTRs tend to be higher than in rural
areas, untrained teachers are often concentrated in
poor rural areas. Lower PTRs in rural areas reflect
many factors, from population dispersal to lower
demand for education. They do not necessarily
indicate greater equity, as a more detailed look
at the composition of the teaching force shows:
In Bolivia many teachers are interinos, hired on
contract. They need not have a teaching degree
or even any teaching experience. Interinos make
up 19% of the total teaching force but 56% of all
teachers in rural areas (World Bank, 2006a).
In Ghana untrained teachers are concentrated
in the Northern region, which has the lowest
economic development and the most out-of-
school children. In 2004–2005, the percentage
of trained teachers was a third lower in the forty
most deprived districts of the country than in
other districts (Akyeampong et al., 2007).
In India the majority of untrained or undertrained
teachers are concentrated in rural areas and
cater to the poorest and most deprived children
(Govinda and Bandyopadhyay, 2008).
PTRs also depend on whether schools are publicly
funded. Many countries show a marked gap
between government and non-government
providers. In Bangladesh average ratios are 64:1 in
government schools, 40:1 in non-government ones.
Public sector school teachers in Djibouti and
Rwanda work in classes that on average are more
than two and a half times the size of classes in
private schools (Figure 2.42). Because children
from poorer households are more likely to attend
government schools, unequal PTRs both reflect
and reinforce wider inequalities.
The PTR offers an important, if deceptive,
headcount indicator showing teacher distribution
countrywide. For children in the classroom,
however, other factors also affect the quality
of teaching and learning. Thus, even favourable
headcount indicators can obscure wider problems.
Other factors affecting the quality of teaching and learning
Teacher absenteeism. Teacher counts in
employment statistics do not guarantee their
presence in the classroom. In a recent study of
six countries, teacher absenteeism rates in primary
schools averaged 19% and ran as high as 25% in
India and 27% in Uganda (Chaudhury et al., 2006).
Schools attended
by wealthier
children tend to
have smaller
classes and more
trained teachers
than those
attended by
poorer children
1 2 0
Swed
enKu
wai
tHu
ngar
yAn
dorra
Gree
ceIta
lyEs
toni
aPo
rtuga
lQa
tar
Pola
ndBe
lgiu
mLa
tvia
Caym
an Is
Aust
riaBr
unei
Dar
uss.
Spai
nLi
thua
nia
Unite
d St
ates
Leba
non
Germ
any
Oman
Br. V
irgin
IsBa
ham
asU.
A. E
mira
tes
Czec
h Re
p.N
ew Z
eala
ndSu
rinam
eM
aldi
ves
Cypr
usRo
man
iaCr
oatia
Slov
akia
Irela
ndDo
min
ica
Tuni
sia
Iran,
Isl.
Rep.
Cost
a Ri
caM
acao
, Chi
naM
aurit
ius
Peru
Dom
inic
an R
ep.
Ecua
dor
Sain
t Luc
iaKy
rgyz
stan
Pana
ma
Cape
Ver
deCh
ileRe
p. o
f Kor
eaM
oroc
coHo
ndur
asM
exic
oCo
lom
bia
Bhut
anGu
atem
ala
0
10
20
30
40
50
60
70
80
Pupi
l/tea
cher
ratio
AveragePublic sectorPrivate sector
1Figure 2.42: Public-to-private sector disparities in primary PTRs, 2006
1. Data are for the school year ending in 2007.Source: UIS database.

T H E D A K A R G O A L S : M O N I T O R I N G P R O G R E S S A N D I N E Q U A L I T Y
Data for Ghana, India, South Africa and the
United Republic of Tanzania suggest that teacher
absenteeism is more pronounced in public sector
schools, in schools with poorer infrastructure, in
rural areas, in poorer states and in schools serving
children from lower socio-economic backgrounds
(Kremer et al., 2005; Sumra, 2006; van der Berg
and Louw, 2007; World Bank, 2004). High levels
of teacher absenteeism directly affect learning
time and outcomes as well as national education
costs and spending. In countries participating in
SACMEQ II, teacher absenteeism was shown to
have significant negative effects on mathematics
tests (van der Berg and Louw, 2007). In Peru the
economic costs of teacher absenteeism represent
10% of current expenditure in primary education;
in Uganda the figure is 24%. A recent study put the
cost of absenteeism in India at around US$2 billion
per year (Patrinos and Kagia, 2007).
HIV/AIDS. Although teacher mortality rates due to
HIV/AIDS are decreasing or are reasonably stable
(Bennell, 2006), the epidemic continues to damage
lives and education systems. In South Africa,
HIV prevalence among teachers was 13% in 2004;
projections show it declining slightly by 2015
(Bennell, 2005b). In Kenya, where 14,500 teachers
are estimated to be HIV positive, between four and
six teachers die each day due to AIDS (Bennell,
2005b; UNESCO, 2007b). In Mozambique, HIV/AIDS
kills 1,000 teachers a year: it is estimated that
19,200 teachers and 100 education officials will
have died during the current decade (Reuters,
2007). Teachers suffering from HIV/AIDS are more
likely to be absent or transferred (particularly
in rural areas further from medical facilities)
as a result of opportunistic infections.
Poor morale and weak motivation undermineteacher effectiveness. Teacher retention and
absenteeism and the quality of teaching are heavily
influenced by whether teachers are motivated and
their level of job satisfaction. Evidence suggests
many countries face a crisis in teacher morale
that is mostly related to poor salaries, working
conditions and limited opportunities for professional
development (Bennell and Akyeampong, 2007; DFID
and VSO, 2008). The surveys in eleven developing
countries discussed above (see pp. 116-7) found
professional satisfaction among grade 4 teachers
to be low. In some cases, salary concerns were
paramount: in Argentina, Brazil, Peru, the
Philippines and Uruguay, for example, fewer than
a third of fourth graders had teachers who thought
their pay was adequate (Zhang et al., 2008).
Motivation tends to be lower among teachers
with large classes and in schools that are poorly
resourced or attended by disadvantaged pupils.
Issues raised in this section are at the heart
of education governement challenges. The
recruitment, training, allocation and motivation of
teachers are issues that we turn to in Chapter 3.
In Mozambique,
HIV/AIDS kills
1,000 teachers
a year
1 2 1
E n s u r i n g b o t h e q u i t y a n d t h e q u a l i t y o f l e a r n i n gLa
o PD
RPa
lest
inia
n A.
T.N
icar
agua
Djib
outi
Phili
ppin
esGh
ana
Togo
Paki
stan
Nig
erLe
soth
oM
aurit
ania
Beni
nCa
mer
oon
Côte
d'Iv
oire
Eritr
eaM
adag
asca
rCa
mbo
dia
Zam
bia
Cong
oRw
anda
Moz
ambi
que
0
10
20
30
40
50
60
70
80
Pupi
l/tea
cher
ratio
1
90
02
Education f
or A
ll G
lobal M
onitorin
g R
eport
C H A P T E R 2
Education for All: measuringcomposite achievement
The EFA goals represent more than the sum of
their parts. While each is important in its own right,
what ultimately matters is progress on all fronts.
Achieving UPE without advancing policies to
strengthen early childhood development, gender
parity in post-primary education or progress in
adult literacy would put overall EFA achievement at
risk. Advancing on all fronts generates cumulative,
mutually reinforcing benefits. By contrast, slow
progress in one area can erode the benefits of
strong performance in others.
The EFA Development Index
The EFA Development Index (EDI) is a composite
measure that captures overall progress. Ideally,
it should reflect all six Dakar goals, but there are
serious data constraints. Reliable and comparable
data relating to goal 1 (ECCE) are not available for
most countries and progress on goal 3 (learning
needs of youth and adults) is not easy to measure
or monitor. The EDI thus focuses only on the four
most easily quantifiable EFA goals, attaching equal
weight to each measure:
UPE (goal 2) is proxied by the total primary NER.58
Adult literacy (goal 4) is proxied by the literacy
rate for those aged 15 and above.59
Gender parity and equality (goal 5) are proxied
by the gender-specific EFA index (GEI), an
average of the GPIs of primary and secondary
GERs, and of the adult literacy rate.
Quality of education (goal 6) is proxied by the
survival rate to grade 5.60
The EDI value for a given country is the arithmetic
mean of the four proxy indicators. It falls between
0 and 1, with 1 representing full EFA
achievement.61 For the school year ending
in 2006 it was possible to calculate values for
129 countries. Coverage varies substantially by
region, ranging from fewer than 40% of countries
in East Asia and the Pacific to about 80% or more
in Central and Eastern Europe, and North America
and Western Europe (Table 2.19). Data limitations
preclude a global look at overall EFA achievement.
Many countries are excluded, among them a
majority of what the OECD identifies as fragile
states,62 including those in conflict or post-
conflict situations.
Of the 129 countries for which the EDI could be
calculated for 2006:
Fifty-six – five more than in 2005 – have either
achieved the four most easily quantifiable EFA
goals or are close to doing so, with EDI values
averaging 0.95 or above. Most of these high-
achieving countries are in more developed
regions. With a few exceptions,63 they have
achieved balanced progress on the four EFA
goals included in the index.
Forty-four countries, mostly in Latin America
and the Caribbean, the Arab States and sub-
Saharan Africa, are midway to achieving EFA
as a whole, with EDI values ranging from 0.80
to 0.94. Most of these countries show uneven
progress. Participation in primary education
is often high, with deficits in other areas, such
as adult literacy (Algeria, Belize, Egypt, Kenya,
Swaziland, Tunisia, Zambia) education quality
as measured by the survival rate to grade 5
(Ecuador, El Salvador, the Dominican Republic,
Myanmar, the Philippines, Sao Tome and
Principe), or both (Guatemala).
Twenty-nine countries, more than a fifth of
those in the EDI sample, are lagging behind
with EDI values below 0.80. Sub-Saharan Africa
is overrepresented in this group, with EDI
values below 0.60 in Burkina Faso, Chad,
Ethiopia, Mali and the Niger. Countries in other
regions, including four Arab States and five out
62. The fragile states not included are Afghanistan, Angola, the CentralAfrican Republic, the Comoros, the Congo, Côte d’Ivoire, the DemocraticRepublic of the Congo, the Gambia, Guinea-Bissau, Haiti, Kiribati, Liberia,Papua New Guinea, Sierra Leone, the Solomon Islands, Somalia, theSudan, Timor-Leste, Uzbekistan and Vanuatu.
63. The total primary NER remains around 90% in Armenia, Belarus and Georgia, as does the average adult literacy rate in the United ArabEmirates.
58. The total primary NER measures the proportion of children ofprimary school age who are enrolled in either primary or secondaryeducation.
59. The literacy data used are based on conventional assessmentmethods – either self- and third-party declarations or educationalattainment proxies – and thus should be interpreted with caution; theyare not based on any test and may overestimate actual literacy levels.
60. For countries where primary education lasts fewer than five years,the survival rate to the last grade of primary is used.
61. For further explanation of the EDI rationale and methodology, see The EFA Development Index in the annex, which also includes detailedvalues and rankings for 2006.
1 2 2
While each
EFA goal is
important in
its own right,
what ultimately
matters is
progress on
all fronts

T H E D A K A R G O A L S : M O N I T O R I N G P R O G R E S S A N D I N E Q U A L I T Y
of six South Asian countries, are also in this
category. Except in a few cases where
participation of primary school-age children is
relatively high (e.g. Bangladesh, Cambodia, India,
Madagascar, Malawi, Nicaragua), these low EDI
countries face multiple challenges: low education
participation, widespread adult illiteracy, gender
inequalities and poor education quality.
Progress towards EFA as a whole
Analysis of changes in the EDI between 1999
and 2006 could be carried out for only forty-five
countries. Thirty-one of these recorded increases –
significant ones, in several cases (Figure 2.43).
Though absolute EDI values remained low in
Ethiopia, Mozambique and Nepal, they increased
by more than 20%. The EDI decreased in fourteen
countries. Chad experienced the largest fall:
it was in last place in 2006, well behind the others.
Increased school participation was the primary
driver of progress in the EDI. The total primary NER
increased on average by 7.3% across the forty-five
countries. In Ethiopia, the level of participation
in school more than doubled, from 35% in 1999
to 72% in 2006. Ethiopia also experienced gains
in adult literacy (+35%) and school retention (+14%).
In Yemen, significant increases in the total primary
NER, adult literacy, and gender parity and equality
more than compensated for a large drop in the
survival rate to grade 5 (-24%), leading to overall
EDI improvement of 10%. For most of the fourteen
countries where the EDI declined between 1999
and 2006, the education quality component was
an important factor.
Overall EFA achievement: inequalitieswithin countries remain the rule
The EDI provides a snapshot based on national
averages. But progress towards EFA, as the word
‘all’ implies, should be shared equally across the
whole of society. One drawback of the standard EDI
is that it does not capture variation based on wealth
and other indicators of disadvantage. To address
this shortcoming, an EFA Inequality Index for
Income Groups (EIIIG) was constructed for thirty-
five developing countries, using household survey
data (Harttgen et al., 2008). The EIIIG uses a
different set of indicators to provide a measure
similar to the EDI, showing distribution of overall
EFA achievement within countries by wealth and
by rural/urban location.64
The EIIIG shows large disparities in overall EFAachievement between wealth groups in most ofthe thirty-five countries. These gaps are almost
as large as those between nations (Figure 2.44).
They are particularly wide in Benin, Burkina Faso,
Chad, Ethiopia, Mali, Mozambique and the Niger:
the EIIIG for the richest group in those countries
is more than twice that of the poorest group. In
Ethiopia, which had the widest inequality in overall
EFA achievement, the EIIIG for the highest wealth
quintile was 0.873 in 2003, compared with 0.344
for the lowest quintile. Disparities within income
groups were less pronounced in seven countries,
64. The EIIIG differs from the EDI in three main ways. The total primarynet attendance rate is used rather than the total primary NER. As manyhousehold surveys do not include literacy rates, this EIIIG component isbased on the proportion of 15- to 25-year-olds with five or more years of education. Finally, the survival rate for the EIIIG is defined as theproportion of 17- to 27-year-olds who report having at least five years of education among those who reported having at least one year ofeducation.
Increased school
participation
was the main
driver of progress
in the EDI
1 2 3
E d u c a t i o n f o r A l l : m e a s u r i n g c o m p o s i t e a c h i e v e m e n t
17 9 1 27 454 9 2 15 20
1 2 4 7 92 5 2 4 13 335 1 6 91 18 3 2 24 41
2 19 21 262 4 10 16 21
29 44 16 40 129 204
Sub-Saharan AfricaArab StatesCentral AsiaEast Asia and the PacificSouth and West AsiaLatin America and the CaribbeanNorth America and Western EuropeCentral and Eastern Europe
Total
Table 2.19: Distribution of countries by EDI scores and region, 2006
Far from EFA:EDI below
0.80
Intermediateposition:
EDI between0.80 and 0.94
Close to EFA:EDI between0.95 and 0.96
EFA achieved: EDI between0.97 and 1.00
Subtotalsample
Totalnumber ofcountries
Source: Annex, The EFA Development Index, Table 1.

90
02
Education f
or A
ll G
lobal M
onitorin
g R
eport
C H A P T E R 2
1 2 4
Italy
Croatia
Cyprus
Cuba
Aruba
Estonia
Hungary
Kyrgyzstan
Latvia
Lithuania
Romania
Bulgaria
Bahrain
Argentina
U. A. Emirates
Mongolia
Albania
Rep. Moldova
Azerbaijan
Mauritius
Saint Lucia
Panama
Paraguay
Venezuela, B. R.
Fiji
Ecuador
Bolivia
Belize
South Africa
Namibia
Swaziland
Zambia
Dominican Rep.
Guatemala
Nicaragua
Lesotho
Iraq
Bangladesh
Nepal
Malawi
Mauritania
Yemen
Mozambique
Ethiopia
Chad
0.3 0.4 0.5 0.7 0.8 0.90.6 1.0
EDI
-5 50 10 20 25 3015 35
Change since 1999 (%)
0.992
0.989
0.987
0.981
0.981
0.980
0.979
0.976
0.972
0.970
0.965
0.963
0.959
0.956
0.956
0.952
0.952
0.948
0.948
0.946
0.942
0.941
0.8
2.0
1.6
0.8
0.8
-1.1
-0.3
1.1
-1.1
-2.1
-1.3
-0.8
1.6
-0.7
7.8
3.5
-0.8
-1.2
-0.3
2.1
2.2
-0.2
0.935
0.934
0.921
0.919
0.915
0.913
0.898
2.9
2.7
-1.6
0.7
2.3
5.5
5.0
0.865
0.847
0.842
0.1
2.2
12.5
0.824 -3.1
0.819
0.799
0.788
0.768
11.6
6.7
6.2
3.2
0.753 3.7
0.738 22.5
0.735 0.5
0.695 4.5
0.643 9.9
0.622 25.6
0.598 31.7
0.408 -4.2
Figure 2.43: EDI in 2006 and change since 1999
Note: Only countries with EDI values for both 1999 and 2006 are included.Source: Annex, The EFA Development Index, Table 3.

T H E D A K A R G O A L S : M O N I T O R I N G P R O G R E S S A N D I N E Q U A L I T Y
including Colombia, Indonesia, the Philippines,
the United Republic of Tanzania and Zimbabwe.
In these best-performing countries the richest
quintile achieved the maximum EIIIG score of 1.00.
The higher the average EIIIG, the fewer theeducation inequalities. Although cross-country
inequalities by income group are highly variable,
a general trend is visible: countries with better-
functioning education systems have not only higher
overall EFA achievement as measured by the EIIIG,
but also fewer inequalities.
Progress towards overall EFA achievement has
benefited the poorest in most countries. The EIIIG
ratio of the richest to poorest population quintile
decreased in about three-quarters of the thirty-five
countries in the sample. The reductions were
particularly significant in Benin, Ethiopia,
India and Nepal, with declines of 15% or more.
On the other hand, inequalities in overall EFA
achievement between the poorest and the richest
households increased in the remaining countries,
particularly Kenya and Nigeria, where the mean
EIIIG decreased slightly.
Overall EFA achievement is greater in urban than
in rural areas, whatever the wealth group. Rural
residents are particularly disadvantaged in Burkina
Faso, Chad, Ethiopia and Mali, where the ratio of
urban to rural EIIIG is about 2 or more. A close look
at the interaction between wealth and place of
residence highlights the impact of poverty in rural
areas. Education inequality between wealth groups
as measured by the EIIIG ratio of richest to poorest
quintile tends to be higher in rural areas than urban
in about two-thirds of the thirty-five countries.
In Chad, Ghana, Haiti and Nicaragua the ratio
of richest to poorest is close to 2 in rural areas.
In other countries, however, including Benin,
Cambodia and Mozambique, the urban poor are
more disadvantaged.
Education
inequality between
wealth groups
tends to be higher
in rural than
in urban areas in
about two-thirds
of the thirty-five
countries
1 2 5
E d u c a t i o n f o r A l l : m e a s u r i n g c o m p o s i t e a c h i e v e m e n t
0.2 0.4 0.6 1.00.8 1.2
EIIIG
MaliBurkina Faso
ChadEthiopia
MozambiqueNiger
GuineaBenin
Côte d’IvoireSenegal
CambodiaRwanda
MadagascarHaiti
MalawiZambiaGhana
NicaraguaNepal
NigeriaBolivia
UgandaIndia
CameroonBangladesh
Dominican Rep.Kenya
PeruNamibia
Viet NamColombia
PhilippinesIndonesia
U. R. TanzaniaZimbabwe
MaliBurkina Faso
ChadEthiopia
MozambiqueNiger
GuineaBenin
Côte d’IvoireSenegal
CambodiaRwanda
MadagascarHaiti
MalawiZambiaGhana
NicaraguaNepal
NigeriaBolivia
UgandaIndia
CameroonBangladesh
Dominican Rep.Kenya
PeruNamibia
Viet NamColombia
PhilippinesIndonesia
U. R. TanzaniaZimbabwe
MaliBurkina Faso
ChadEthiopia
MozambiqueNiger
GuineaBenin
Côte d’IvoireSenegal
CambodiaRwanda
MadagascarHaiti
MalawiZambiaGhana
NicaraguaNepal
NigeriaBolivia
UgandaIndia
CameroonBangladesh
Dominican Rep.Kenya
PeruNamibia
Viet NamColombia
PhilippinesIndonesia
U. R. TanzaniaZimbabwe
AveragePoorest 20% Richest 20%
Figure 2.44: EFA Inequality Index by wealth quintile,
selected countries, most recent year
Source: Demographic and Health Surveys, calculations by Harttgen et al. (2008).

90
02
Education f
or A
ll G
lobal M
onitorin
g R
eport
1 2 6
© G
urin
der
Osa
n/AP
/SIP
A
Going theirseparate ways:school girls andstreet children in New Delhi

1 2 7
9002Education for All Global Monitoring Report
Chapter 3
Raising quality andstrengthening equity:why governance matters
Many countries have introduced far-reaching governance
reforms in education. This chapter looks at governance
problems and reform measures in four important areas:
finance, school management, teacher recruitment and
allocation, and education planning. Two key findings
emerge. The first is that there is no blueprint for good
governance: each country has to develop national and
local strategies. The second finding is that governments
across the world have attached insufficient weight
to equity in the design of governance reforms.

Introduction .......................................................................................................... 128
Financing education for equity ......................................................................................................................... 132
Choice, competition and voice: school governance reform and EFA ...................................................................................... 152
Strengthening teacher governance and monitoring ............... 171
An integrated approach to education and poverty reduction: the missing link ..................... 185
90
02
Education f
or A
ll G
lobal M
onitorin
g R
eport
C H A P T E R 3
Introduction
Governance is a word that conjures up an image of
abstract political, administrative and management
processes. It is easy to lose sight of the real impact
that governance practices in education can have
on the lives of ordinary people, the hopes and
aspirations of parents and children, and the human
development prospects of nations.
To understand why good governance matters
in education, consider the alternative. Bad
governance leaves parents and communities facing
education provision that is unaccountable and
unresponsive to their needs. It contributes to
education systems that are ineffective in raising
learning achievements. It leaves communities and
regions with children sitting in classrooms lacking
basic teaching materials, and in the charge of
untrained and demotivated teachers. In some
cases, bad governance also means that financial
resources allocated to schools do not arrive.
Poor governance practices in education affect
the whole of society. But invariably it is the poor
who bear the brunt. Good governance implies
not just transparency and accountability, but also
a commitment to equal opportunity for all citizens.
Unlike the wealthy, who can opt for private
provision, poor households depend on
governments to deliver education services.
When those services are of poor quality,
inaccessible or unaffordable, it is the poor who
lose. Indicators for bad education governance
include large financing gaps between rich and
poor areas, provision that is unaffordable for
the poor and a lack of attention to strategies
for reaching the disadvantaged. Failure to tackle
corruption, another hallmark of bad governance,
has particularly damaging consequences for poor
households. When resources do not reach schools,
or when schools levy unauthorized fees, it is
the poor who are least able to pay.
The good governance agenda
Governance describes the institutions, rules and
norms through which policies are developed and
implemented – and through which accountability is
enforced. Governance reform in its broadest sense
is concerned with changing the rules of the game –
that is, changing the processes through which
decisions are made and implemented on behalf
1 2 8

R A I S I N G Q U A L I T Y A N D S T R E N G T H E N I N G E Q U I T Y: W H Y G OV E R N A N C E M AT T E R S
of members of an organization or a society
(Rodrik, 2008). However, governance is not just
about abstract institutional processes or formal
rules. It is also about power relationships in society.
At its most basic level, governance systems define
who decides on policies, how resources are
distributed across society and how governments
are held accountable.
Good governance is now a central part of the
international development agenda. Beyond
education, it is seen as a condition for increased
economic growth, accelerated poverty reduction
and improved service provision. The most widely
used data on governance indicators show that
objectives range from strengthening multiparty
democracy to reducing corruption, strengthening
the rule of law, increasing the accountability of
public institutions and enhancing the participation
and voice of citizens (Kaufmann et al., 2007).
Few people would take issue with the intrinsic
importance of improving governance in these
various dimensions – and most would argue that
progress is intrinsically important to development
(Rodrik, 2008). As one set of commentators put it:
‘Good governance is an ideal in which political
processes translate the will of the people into
public policies and establish the rules that
efficiently and effectively deliver services to all
members of society’ (Crouch and Winkler, 2007,
p. 1). More controversy surrounds the choice of
policies to achieve the desired end of good
governance. Achieving good governance may
require far-reaching political reforms and the
reordering of institutional arrangements.
This has often been forgotten by donors, who
sometimes present their aid partners with lengthy
shopping lists for good governance reform, with
little regard for prioritization or political feasibility
(Grindle, 2004). More broadly, the good governance
narrative is often silent on the power relationships
and vested interests that may be affected by
governance reform.
There has been a parallel failure to acknowledge
that national and local contexts are important.
When it comes to governance reform, what works
in one setting may not work in another. And there
is no guarantee that progress towards good
governance, as measured by the standard
indicators, will resolve wider problems in
development.
Education governance: the DakarFramework and beyond
Education governance is not simply the system
of administration and management of education
in a country. In its broadest sense, it is concerned
with the formal and informal processes by which
policies are formulated, priorities identified,
resources allocated, and reforms implemented
and monitored. Governance is an issue not only
for central government but also for every level
of the system, from the education ministry down
to the classroom and community. It is ultimately
concerned with the distribution of power in
decision-making at all levels.
As with any service, education provision is affected
by wider governance conditions. When democracy,
transparency and respect for the rule of law is
weak, accountability and participation suffer.
Within the education sector, governance structures
link many actors and define the terms of their
interactions. The ability of parents to participate
in school decisions, hold schools and teachers
to account, and secure access to information
is conditioned by the allocation of rights and
responsibilities under governance systems.
Governance rules also define the terms on which
governments recruit, allocate and train teachers.
They have an important bearing on the skills and
motivation that teachers bring to the classroom.
Beyond the classroom, governance systems shape
the relationship between school bodies, local
government and central government. They define
who sets priorities and makes decisions in key
areas ranging from the curriculum to teacher
management, and the monitoring and supervision
of schools. In the area of finance, education
governance is about how priorities are set and how
resources are mobilized, allocated and managed.
As this non-exhaustive list suggests, governance
involves a broad array of actors and many layers
of government, affecting virtually all decisions made
in education. Within any country, the relationships
between actors and government agencies can be
enormously complex and varied. Similarly, change
in governance can mean very different things in
different contexts. For example, decentralization
might reallocate authority in one area (say, teacher
recruitment) but not in another (say, teacher pay
or curriculum design). It might devolve political
authority but keep financial responsibility highly
centralized.
Bad governance
affects the whole
of society, but
invariably the poor
bear the brunt
1 2 9
I n t r o d u c t i o n

90
02
Education f
or A
ll G
lobal M
onitorin
g R
eport
C H A P T E R 3
The Dakar Framework for Action did not set out
a comprehensive agenda on governance reform.
However, it did define some broad principles.
It committed governments to ‘develop responsive,
participatory and accountable systems of
educational governance and management’.
Apart from being intrinsically important, progress
in these areas was identified as a strategy for
ensuring that governments ‘can respond more
effectively to the diverse and continuously
changing needs of learners’ (Unesco, 2000,
Expanded Commentary, para. 55). While the Dakar
Framework stops well short of offering a blueprint
for good governance, it does advocate moving
towards ‘more decentralized and participatory
decision-making, implementation and monitoring
at lower levels of accountability’.
Much of this is consistent with central themes in
wider governance debates. The development of
more accountable and participatory systems for
delivering services has been a broad goal in public
service reform. Decentralization – the transfer
of political, administrative and fiscal authority to
lower levels of government – is one of the most
pervasive governance reforms of the past two
decades. While decentralization has often been
driven by fiscal motives, governments invariably
present it as an exercise in bringing decision-
making closer to the people affected.
An underlying assumption in approaches to
governance reform involving devolution of
authority is that they are intrinsically beneficial
for equity. Making service providers more
accountable to the communities they serve,
and giving those communities a greater role in
decision-making, is widely presented as a source
of empowerment. The widely held conviction is
that moving decision-making away from remote
government agencies, and making the process
more localized and transparent will change
incentive structures, prompting education service
providers to be more responsive to the needs
and concerns of the poor.
After some two decades of far-reaching
governance reform in education the jury is still
out on the results. Despite continuing enthusiasm,
there is surprisingly little evidence that
governance policies implemented thus far have
actually improved education quality and led to
greater equity. This is true not just of countries
that have introduced reform on a piecemeal basis,
but also of such widely cited models of radical
governance reform as undertaken in Chile, South
Africa and Uganda (Crouch and Winkler, 2007).
Evaluation of governance reform is a difficult
exercise. The EFA Global Monitoring Report team
has examined the locus of decision-making in
184 countries, looking at areas ranging from
curriculum design and school infrastructure
to teacher recruitment and pay to finance and
resource allocation (see mapping exercise in annex,
p. 252). The sheer complexity of governance
systems makes the mapping of decision-making
in these areas difficult, even within one country.
Cross-country comparison is an even more
hazardous enterprise. Nevertheless, despite the
complexity of layers of decision-making, some
broad patterns emerge. One of the most striking
is that, notwithstanding frequent government
declarations in favour of decentralization, many
decisions in education are still taken by central
government authorities.
While governance systems across the world vary,
many have one thing in common. They are
delivering education services that are often
inaccessible, inefficient, unaffordable and of
questionable quality. Changing such systems is
crucial if countries are to accelerate progress
towards the goals set out in the Dakar Framework
for Action. Some countries have demonstrated what
is possible, but current approaches to governance
reform are often failing.
Why have outcomes to date been so disappointing?
No generalized answer is possible, as every
country faces different constraints and problems
in governance reform. Two broad problems can
be identified nonetheless.
First, there has been a tendency in many developing
countries to apply governance reform ‘blueprints’
borrowed uncritically from rich countries – a
practice that some donors have encouraged –
and to extend wider public service reforms to
education without paying sufficient attention
to their appropriateness for education, or to real
institutional constraints and local context
for reform.
Second, many governments have failed to place
poverty reduction and equity at the centre of
governance reform. Too often the interests
of the poor have been a rhetorical afterthought.
Education
is often
inaccessible,
inefficient,
unaffordable and
of questionable
quality
1 3 0
R A I S I N G Q U A L I T Y A N D S T R E N G T H E N I N G E Q U I T Y: W H Y G OV E R N A N C E M AT T E R S
If there is one clear lesson from experience
with governance reform, it is that changes in
administrative processes and shifts in the locus
of decision-making do not automatically generate
‘pro-poor’ outcomes. Tackling the root causes
of educational disadvantage requires political
commitment and policy processes that take
account of the problems and priorities of the poor
and vulnerable. It also calls for an integrated,
cross-sectoral approach to planning.
This chapter does not attempt to cover all aspects
of education governance. It focuses selectively on
some of the most important currents in governance
reform and on themes neglected in wider education
reform debates. It is divided into four sections.
1. Financing strategies for closing the equity gap.Many governments have increased their public
finance commitment to education since Dakar.
But many could – and should – be doing much
more. Governance reforms have focused on
improving efficiency, with scant regard for equity.
Decentralization is a case in point. Devolving
revenue mobilization in countries marked by
large regional wealth gaps can lead to increased
inequality in education financing. In many cases,
decentralization has reinforced and magnified
disparities in education. The lesson: while
decentralization is important, central government
should retain a strong role in equalizing the
distribution of education finance.
2. Choice, competition and voice. Choice and
competition are central themes in education
governance reform. The idea is that competition
drives gains in efficiency, with wide-ranging
advantages for learning achievement and equity.
Weak evidence of presumed benefits has not
diminished the enthusiasm of many reformers for
public-private partnerships involving an enlarged
role for private schools and voucher systems
to allocate public finance to such schools.
‘School-based management’, or the devolution
of authority to school and community level, has
been another powerful reform current. Its stated
aim is to make education providers more
responsive to local needs. Meanwhile, low-fee
private schools are seen by some as a viable
alternative to state provision. Positive outcomes
associated with reforms in these areas have been
muted. Public-private partnerships have a mixed
and modest record on learning achievements
and equity. And low-fee private schools are a
symptom of failure in public provision,
not a solution to the problem. The lesson:
transferring responsibility to communities,
parents and private providers is not a substitute
for fixing public-sector education systems.
3. Teacher governance and monitoring. Teachers
have figured prominently on the governance
reform agenda. Problems to be addressed range
from recruitment to motivation and deployment.
Low teacher morale, often linked to poor pay
and working conditions, is a major impediment
to high-quality learning. In many countries,
problems in teacher recruitment are
compounded by large disparities in access to
well-qualified teachers, with children from poor
households and remote rural areas losing out.
Monitoring of learning achievements can play
an important role in informing policy design –
but institutional capacity for effective monitoring
is often limited. The lessons: improve teacher
recruitment, deployment and motivation through
appropriate incentives and accountability
mechanisms to improve learning and enhance
equity; and strengthen the use of regional,
national and school-level assessments to
support policy design aimed at these same ends.
4. An integrated approach to education and povertyreduction. The planning processes through
which priorities are set are a key aspect of
governance reform. Education-sector planning
in developing countries has been strengthened
in recent years, reflecting increased political
and financial commitment. However, progress
towards greater equity in education requires
governance reform beyond the education sector
itself. Broader strategies are needed to remove
barriers to EFA associated with disparities based
on wealth, gender, ethnicity and other factors.
Coordination across sectors is needed to
influence health, nutrition and livelihood
opportunities. Poverty reduction strategy papers
have potential in this effort, but most are not
delivering. The lesson: integrate education with
wider strategies for overcoming poverty and
inequality.
Tackling the
root causes
of educational
disadvantage
requires political
commitment and
policy processes
that take
account of
the poor and
vulnerable
1 3 1
I n t r o d u c t i o n

90
02
Education f
or A
ll G
lobal M
onitorin
g R
eport
C H A P T E R 3
Financing education for equity
Introduction
In the Dakar Framework for Action governments
promise to ‘enhance significantly investment in
basic education’ (UNESCO, 2000, para. 8). Implicit in
this pledge is the conviction that additional financing
is needed if the world is to achieve UPE and the
wider EFA goals. But resource mobilization is just
one part of a broader set of governance challenges.
How governments mobilize, distribute and manage
investment in education has a crucial bearing on
the efficiency and equity of their school systems.
Countries vary enormously in their capacities
for financing education. Differences in wealth
contribute to vast disparities in spending per
student, which in turn fuel the global inequalities
in access and quality discussed in Chapter 2.
These inequalities have important implications not
just for education, but also for the future distribution
of wealth and opportunity in an increasingly
integrated global economy.
While low average incomes and high levels
of poverty impose obvious budget constraints,
patterns of spending on education also reflect
political choices. Some governments are far more
committed to financing education than others.
This has important consequences: higher spending
does not lead automatically to improved or more
equitable education outcomes, but sustained and
chronic underfinancing is definitely not conducive
either to the development of high-quality education
systems or to equity.
Financial management figures prominently in
debates on education governance. The issues
at stake have important consequences for equity.
Rules governing allocation of funds between
students, schools and regions can determine
whether the disadvantaged receive more or less
financing than the more advantaged. Governance
practices also affect the efficiency of government
spending, strongly influencing the availability of
classrooms, teachers and teaching materials.
Failure to tackle corruption, a key governance
concern, imposes a double economic burden
on education: it penalizes efficiency and, because
the burden of corruption falls disproportionately
on the poor, it erodes equity.
Decentralization has been widely advocated
and adopted as a governance reform. The main
argument for decentralization is that it brings
decisions closer to people. By devolving decision-
making and financial management to local
government agencies, the argument runs,
decentralized structures offer greater accountability
and responsiveness to local problems. However,
decentralization can also weaken education
provision and widen inequalities. Outcomes depend
on the design of decentralization strategies and the
commitment of central government to equalizing
opportunity.
Government spending on education
In recent years, two contrasting viewpoints have
emerged on the importance of increased financing
for achieving the EFA goals. Some commentators
treat increased spending on education as an
automatic indicator of progress. Others point to the
harsh lesson provided by analysis of cross-country
data: namely, that the relationship between
education spending and student performance
is weak at best and sometimes non-existent
(Hanushek, 2003; Pritchett, 2004; Wößmann, 2003).
The latter group has stressed the importance
of improving efficiency, viewing it as the best way
to progress towards the goals.
Reality is less clear-cut. Dismal learning outcomes
and high levels of inequality are possible at low,
medium and high levels of spending. Rapid
increases in spending do not necessarily lead
to improved achievement levels. Yet financing
thresholds are important. Students need access
to a minimum level of resources and materials.
Schools have to be built and buildings maintained.
Teachers have to be recruited and paid. Even with
improved efficiency, chronic financing gaps in many
countries contribute to inadequate access, poor
quality, insufficient teacher recruitment and low
teacher morale.
Underfinancing is not neutral in its effects.
Middle- and high-income groups can compensate
for inadequate state provision. They can send their
children to private schools and hire private tutors.
They can also buy supplementary textbooks and
teaching materials. Low-income households are
likely to find these choices impossible. For the
poorest groups, public investment and provision
constitute the only viable route to an education
that meets basic quality standards.
Failure to
tackle corruption
reduces
efficiency and
erodes equity
1 3 2

1.2 4.9 10.8 68
1.4 4.4 10.8 641.2 5.3 8.3 822.4 3.9 6.6 75
1.4 4.4 10.8 731.6 4.6 7.7 502.4 3.4 5.3 671.8 … 10.0 422.6 3.3 8.3 781.2 4.1 10.8 732.3 5.5 8.3 883.6 5.3 6.6 76
1.4 3.5 6.9 602.3 5.6 10.8 671.4 4.7 10.8 841.2 5.3 8.3 76
R A I S I N G Q U A L I T Y A N D S T R E N G T H E N I N G E Q U I T Y: W H Y G OV E R N A N C E M AT T E R S
Patterns and trends in public spendingaround the world
Any country’s public investment in education is
linked to four factors: national wealth, the share
of wealth converted into budget revenue, the
proportion of public expenditure dedicated to
education, and external support. In addition, the
distribution of spending on the various education
levels has important implications for equity within
countries. This subsection provides a brief snapshot
of global, regional and national financing
for education.
Education spending and national income: an
irregular association. The share of national income
devoted to education differs substantially among
regions and income groupings (Table 3.1). On
average, the share increases with national wealth,
largely because tax revenue collection rises with
per capita national income. Low-income countries
in sub-Saharan Africa, and South and West Asia,
where some 80% of the world’s out-of-school
children live, tend to invest the smallest proportion
of GNP in education. In sub-Saharan Africa, about
half of all low-income countries (eleven of the
twenty-one with relevant data) spend less than 4%
of their national income on education. In South Asia,
Bangladesh devotes only 2.6% of its national
income to education and Pakistan 2.7% (see annex,
Statistical Table 11). More surprisingly, India invests
a smaller share of GNP in education – around 3.3%
– than the sub-Saharan Africa median, even though
average incomes are around one-third higher.
While low income countries spend significantly less
on education than others, large differences exist
within this group. For example, the Central African
Republic allocates 1.4% of GNP to education while
Ethiopia devotes 6%.
Public spending is rising, but not across the board.
In the majority of countries with data, public
spending on education as a share of GNP has
increased since Dakar (Figure 3.1). Large increases
in spending have been associated in some countries
with substantial progress on EFA goals (though
association is not causation). For example, Ethiopia,
Kenya, Mozambique and Senegal have sharply
increased the share of GNP invested in education
and all have seen significant declines in numbers of
out-of-school children (see Chapter 2, Figure 2.10).
On a more negative note, the share of national
income devoted to education decreased between
1999 and 2006 in 40 of the 105 countries with data.
In twelve of them it dropped by more than a
percentage point. Worryingly for prospects of
achieving UPE by 2015, this group includes several
countries with relatively large out-of-school
populations, low levels of participation, or both,
including the Congo (-3.5 percentage points),
Eritrea (-2.9) and India (-1.3). The lack of significant
change in Pakistan and Bangladesh, and in some
sub-Saharan African countries, is equally worrying.
These countries need simultaneously to increase
the level, efficiency and equity of public spending
on education.
National commitment to education varies.
To the extent that budget priorities reflect political
priorities, how governments allocate resources
says something important about their ordering of
concerns.1 The share of education in total public
expenditure is a more direct measure of
government commitment to education than the
share in GNP. The median share of government
spending on education in sub-Saharan Africa is
among the highest for any region (Table 3.2). On the
other hand, South and West Asia devotes a smaller
share of government resources to education than
countries in the Arab States and sub-Saharan
Africa. Whatever their resource constraints, many
1. The share of nationalincome devoted to educationdepends on governments’ability to collect revenue.To devote the same share ofGNP to education, a countrywith a higher revenue sharein overall GNP can allocate asmaller share of governmentresources to educationcompared with a country withthe same national incomebut a lower revenue share.
The large share
of teacher
remuneration
in education
financing is not
an indicator
that teachers
are overpaid
1 3 3
F i n a n c i n g e d u c a t i o n f o r e q u i t y
World
Developing countriesDeveloped countries Countries in transition
Sub-Saharan AfricaArab StatesCentral AsiaEast Asia and the PacificSouth and West AsiaLatin America/CaribbeanN. America/W. EuropeCentral and Eastern Europe
Income groupLow income countriesLower middle income countriesUpper middle income countriesHigh income countries
Table 3.1: Total public expenditure on education as a percentage of GNP,
by region and income group, 2006
Minimum Median Maximum
Countrieswith data
(%)
Note: Country groupings in the first part of this table follow the classification used in the statistical tablesin the Report’s annex. The income classification in the second part of the table follows that used by theWorld Bank. Source: Annex, Statistical Table 11.

90
02
Education f
or A
ll G
lobal M
onitorin
g R
eport
C H A P T E R 3
countries in South and West Asia would appear
to suffer from a lack of political commitment to
education. Once again, regional averages hide
large differences across countries. For example,
in sub-Saharan Africa, Madagascar devotes 25%
of its government budget to education compared to
only 10% in Chad (see annex, Statistical Table 11).
Allocation of education finance
Overall resource mobilization patterns are just one
side of the financing equation. How governments
allocate resources within the education sector
is also important. The selection of priorities often
says something important about education
governance.
Allocations to primary education vary with
enrolment patterns. The allocation of funds
to a particular education level is influenced by
enrolment patterns. Countries with low levels
of post-primary enrolment tend to have higher
proportions of their overall budget allocated
to primary. In thirteen of the twenty-nine sub-
Saharan African countries with data, the proportion
of government spending allocated to primary
education is over 50% (Figure 3.2). Countries in
other regions with low post-primary participation
rates – Guatemala, Mauritania and the Philippines
are examples – demonstrate a similar
concentration of resources towards primary
education (see annex, Statistical Table 11).
The lowest allocations to primary education are
1 3 4
Figure 3.1: Change in total public expenditure on education as a percentage of GNP between 1999 and 2006 (percentage points)
Source: Annex, Statistical Table 11.
Chan
ge in
tota
l pub
lic e
xpen
ditu
re o
n ed
ucat
ion
as %
of G
NP
betw
een
1999
and
200
6 (p
erce
ntag
e po
ints
)
Cong
oEr
itrea
Nam
ibia
Gam
bia
Sout
h Af
rica
Ango
laGu
inea
Mau
ritiu
sZa
mbi
aLe
soth
oM
adag
asca
rCh
adSw
azila
ndCa
mer
oon
Mal
awi
Ghan
aSe
yche
lles
Mal
iBe
nin
Keny
aSe
nega
lBu
rund
iEt
hiop
iaM
ozam
biqu
e
Saud
i Ara
bia
Mau
ritan
iaDj
ibou
tiTu
nisi
aM
oroc
coLe
bano
nOm
an
Azer
baija
nKa
zakh
stan
Mon
golia
Geor
gia
Tajik
ista
nKy
rgyz
stan
Mar
shal
l Is
Tong
aN
ew Z
eala
ndTh
aila
ndAu
stra
liaJa
pan
Mal
aysi
aRe
p. o
f Kor
ea Fiji
Cam
bodi
aLa
o PD
RVa
nuat
u-4
-3
-2
-1
0
1
2
3
4
5
6Sub-Saharan Africa Arab States East Asia and the PacificCentral Asia
World 4 15 31 57
Developing countries 4 16 31 52Developed countries 6 12 17 73Countries in transition 9 17 20 58
Sub-Saharan Africa 4 18 30 51Arab States 10 21 31 55Central Asia 9 … 19 33East Asia and the Pacific 9 … 25 36South and West Asia 11 15 19 78Latin America/Caribbean 9 15 26 59N. America/W. Europe 9 12 17 81Central and Eastern Europe 6 13 20 71
Income groupLow income countries 10 17 26 40Lower middle income countries 4 13 31 74Upper middle income countries 8 16 30 53High income countries 9 13 28 69
Table 3.2: Total public expenditure on education as a percentage
of total government expenditure, by region and income group, 2006
Minimum Median Maximum
Countrieswith data
(%)
Note: Country groupings in the first part of this table follow the classification used in the statistical tablesin the Report’s annex. The income classification in the second part of the table follows that used by theWorld Bank.Source: Annex, Statistical Table 11.

R A I S I N G Q U A L I T Y A N D S T R E N G T H E N I N G E Q U I T Y: W H Y G OV E R N A N C E M AT T E R S
found in countries and regions where secondary
enrolment is almost universal and tertiary
enrolment high. As always, averages obscure
important variations: of the 108 countries with
data in all regions, 60 spend more on secondary
education than on primary education.
Spending on teachers dominates, especially in
the poorest countries. About half the countries
with data for 2006 spent more than three-quarters
of their primary education recurrent budgets on
teacher remuneration in public institutions (see
annex, Statistical Table 11). The share of teachers
in budget allocations sometimes leaves little space
for the financing of other inputs, including learning
materials and the professional development of
teachers. In Zambia, 93% of the primary recurrent
budget goes to teacher salaries and less than 4%
to textbooks, and other teaching and learning
materials – and this example is no anomaly. The
large share of teacher remuneration in education
financing is not, as is sometimes assumed, an
indicator that teachers are overpaid; many have
salary levels close to the poverty line (see section
below on teachers and monitoring). Rather, it
indicates that the primary education sector is
under-resourced, suggesting a need for increased
commitment from governments and aid donors.
Weak commitment and inequitable allocation have
consequences. Financial governance decisions
reflected in resource mobilization and allocation
In Zambia,
93% of the
primary education
budget goes to
teacher salaries
1 3 5
F i n a n c i n g e d u c a t i o n f o r e q u i t y
Chan
ge in
tota
l pub
lic e
xpen
ditu
re o
n ed
ucat
ion
as %
of G
NP
betw
een
1999
and
200
6 (p
erce
ntag
e po
ints
)
Indi
aPa
kist
anBa
ngla
desh
Nep
alIra
n, Is
l. Re
p.
Para
guay
Pana
ma
Sain
t Luc
iaGu
yana
Nic
arag
uaPe
ruAr
gent
ina
Cost
a Ri
caCh
ileBr
azil
Beliz
eUr
ugua
yCo
lom
bia
El S
alva
dor
Boliv
iaM
exic
oSt
Vin
cent
/Gre
nad.
Cuba
Barb
ados
St K
itts/
Nev
is
Aust
riaCa
nada
Isra
elSw
eden
Italy
Nor
way
Spai
nFr
ance
Germ
any
Denm
ark
Finl
and
Portu
gal
Mal
taUn
ited
Stat
esSw
itzer
land
Irela
ndN
ethe
rland
sUn
ited
King
dom
Gree
ceCy
prus
Esto
nia
Latv
iaSl
ovak
iaRo
man
iaTu
rkey
Bela
rus
Czec
h Re
p.Hu
ngar
yPo
land
Rep.
Mol
dova
Ukra
ine -4
-3
-2
-1
0
1
2
3
4
5
6South andWest Asia Central and Eastern EuropeNorth America and Western EuropeLatin America and the Caribbean
Share in public current expenditure on education (%)
0 20 40 60 80 100
Primary education Secondary education
BotswanaAngola
SeychellesCongo
MauritiusCameroon
GhanaSwaziland
LesothoEritrea
South AfricaRwandaSenegal
MadagascarChadBenin
EthiopiaBurundi
Sierra LeoneC. A. R.
KenyaCape Verde
ZambiaMali
UgandaMalawi
NigerBurkina FasoMozambique
Figure 3.2: Distribution of public current expenditure
on education by level, sub-Saharan Africa, 2006
Source: Annex, Statistical Table 11.

90
02
Education f
or A
ll G
lobal M
onitorin
g R
eport
C H A P T E R 3
matter for the experiences of children in
classrooms. The case of Nigeria is illustrative.
In 2005 between 3.5% and 4.2% of GDP was
allocated to education.2 However, education
represents only 11% to 13% of total government
spending, which compares unfavourably with the
regional average for sub-Saharan Africa (World
Bank, 2007b, 2008f, Table 3.2). The consequences
of underfunding are powerfully captured in the
following assessment: ‘Spending on essential
inputs, such as textbooks, instructional materials,
in-service teacher training, and operations
and maintenance are inadequate. About half
of primary schools require major rehabilitation,
with an additional 251,000 classrooms needed
countrywide’ (World Bank, 2008e, p. 15). Raising
government spending on education in Nigeria to
the regional average would release substantial
additional resources to address the many
difficulties the sector faces.
Global and regional inequalities in thedistribution of public education expenditure
Wealth inequalities among countries are mirrored
by disparities in education spending. These
disparities are closely associated with the large
global differences in opportunity for education
documented in Chapter 1. The links between
national wealth and education financing operate
in both directions. Differences in national wealth
reflect the impact of education attainment and
quality on growth and productivity. And differences
in education attainment and quality reflect the
financing capacities of countries with different
levels of national wealth.
Huge gaps in per-student spending between
developed and developing countries. In terms of
spending per student, children in developed and
developing countries live in different worlds. In
2006, per-student expenditure in primary education
varied between US$39 in the Congo and US$9,953
in Luxembourg, at purchasing power parity (PPP)
in constant 2005 dollars (Figure 3.3). While the
transmission mechanisms between education
spending and education quality are complex, the
very low absolute spending in many developing
countries is implicated in the abysmal learning
outcomes and dilapidated school infrastructure that
Chapter 2 documents. When per-pupil spending is
less than PPP US$300 a year and largely absorbed
by teacher salaries, the consequences are
registered in classrooms with leaking roofs,
no books and no chairs.
Global public expenditure on education is highly
skewed. Differences in per-student spending
translate into an extremely uneven global
distribution of public expenditure on education
(Figures 3.4 and 3.5). In 2004, North America and
Low spending
can lead to
dilapidated
schools and
poor outcomes
2. A range is providedbecause results differdepending on theestimating techniqueused. See World Bank(2008f) for details.
1 3 6
Figure 3.3: Inequality among countries in public expenditure per primary school pupil, 2006
Source: Annex, Statistical Table 11.
Publ
ic c
urre
nt e
xpen
ditu
re o
n pr
imar
y ed
ucat
ion
per p
upil
(uni
t cos
t) at
PPP
in c
onst
ant 2
005
US$
0
2 000
4 000
6 000
8 000
10 000
Luxe
mbo
urg
Swed
enDe
nmar
kSw
itzer
land
Icel
and
Aust
riaN
orw
ayIta
lyBe
lgiu
mUn
ited
King
dom
Net
herla
nds
Finl
and
Fran
ceSl
oven
iaAu
stra
liaIs
rael
Irela
ndPo
rtuga
lGe
rman
yN
ew Z
eala
ndSp
ain
Hung
ary
Gree
ceRe
p. o
f Kor
eaPo
land
Mal
taEs
toni
aSe
yche
lles
Czec
h Re
p.Ku
wai
tCr
oatia
Lith
uani
aSl
ovak
iaBu
lgar
iaAr
gent
ina
U. A
. Em
irate
sCo
sta
Rica
Mex
ico
Tuni
sia
Sout
h Af
rica
Mal
aysi
aCh
ileCo
lom
bia
St V
ince
nt/G
rena
d.M
aurit
ius
Bela
rus
Bots
wan
aFi
ji

R A I S I N G Q U A L I T Y A N D S T R E N G T H E N I N G E Q U I T Y: W H Y G OV E R N A N C E M AT T E R S
Western Europe alone accounted for 55% of the
world’s spending on education but only 10% of the
population aged 5 to 25. At the other extreme, sub-
Saharan Africa was home to 15% of 5- to 25-year-
olds but accounted for just 2% of global spending,
and South and West Asia for 28% of the age group
but 7% of the spending (UIS, 2007). For the poorest
countries, increased aid flows could play an
important role in reducing the public education
expenditure gap (see Chapter 4).
Both finance and governance matter
Governance reforms can unlock efficiency gains
that can expand access and improve quality. The
previous subsection showed the wide variation by
country in education financing. The extent to which
differences in levels of financing explain disparities
in outcomes such as those outlined in Chapter 2
is partly determined by education system efficiency.
Raising efficiency to increase the flow of benefits,
Differences
in per-student
spending translate
into an extremely
uneven global
distribution of
public expenditure
on education
1 3 7
F i n a n c i n g e d u c a t i o n f o r e q u i t y
0
2 000
4 000
6 000
8 000
10 000
Turk
eyCa
pe V
erde
Mor
occo
Braz
ilSa
int L
ucia
Nam
ibia
Rom
ania
Iran,
Isl.
Rep.
Beliz
eGr
enad
aGu
yana
Jord
anAl
geria
Leso
tho
Dom
inic
an R
ep.
Syria
n A.
R.
Vene
zuel
a, B
. R.
Jam
aica
Para
guay
Swaz
iland
El S
alva
dor
Peru
Boliv
iaPh
ilipp
ines
Leba
non
Guat
emal
aAz
erba
ijan
Nic
arag
uaBu
rkin
a Fa
soGh
ana
Sene
gal
Mon
golia
Keny
aM
aurit
ania
Mal
iN
iger
Moz
ambi
que
Buru
ndi
Ethi
opia
Beni
nN
epal
Bang
lade
shUg
anda
Rwan
daCa
mer
oon
Tajik
ista
nEr
itrea
Mal
awi
C. A
. R.
Lao
PDR
Mad
agas
car
Zam
bia
Chad
Cong
o
Publ
ic c
urre
nt e
xpen
ditu
re o
n pr
imar
y ed
ucat
ion
per p
upil
(uni
t cos
t) at
PPP
in c
onst
ant 2
005
US$
3% Brazil 3% Italy4% United Kingdom
4% France
4% Germany
5% India
6% Japan
6% China
28% United States
37% Other countries
Figure 3.5: Distribution of global public education
expenditure by country, 2004
Note: Distribution is calculated using PPP US$.Source: UIS (2007, Figure 1, p. 11).
3% Arab States
7% Central/Eastern Europe
0.3% Central Asia
18% East Asia/Pacific
8% Latin America/Caribbean
55% N. America/W. Europe
7% South and West Asia
2% Sub-Saharan Africa
Figure 3.4: Distribution of global public education
expenditure by region, 2004
Note: Distribution is calculated using PPP US$.Source: UIS (2007, Figure 1, p. 11).
90
02
Education f
or A
ll G
lobal M
onitorin
g R
eport
C H A P T E R 3
measured in terms of access, attainment and
quality, is an important public policy goal.
Improving efficiency and reducing corruption
Efficiency in public spending is about how effectively
governments use revenue to advance social
welfare. Defining efficiency is not straightforward.
Education outcomes cannot be measured simply
in terms of numbers, whether of children in
classrooms, books or teachers. Qualitative
indicators are critical. There are also important
questions about how much weight should be
attached to equity-related goals. Should an
additional year in education for a high-income child
in secondary school count for the same as an
additional year in primary school for a low-income
child? There are no simple answers – but no
government can afford to neglect efficiency.
Technical efficiency, at its most basic level, can be
thought of in terms of rates of conversion. What
level of financing is associated with a specific
output? Consider the following example. Senegal
and Ethiopia both had primary NERs of 71% in 2006
and 2007, respectively. However, Senegal spent
PPP US$299 per primary pupil, compared with
Ethiopia’s PPP US$130 (2005 dollars). On this
simple indicator, Ethiopia’s education system is
more efficient in translating resources into school
places. If the costs of a school place were similar
in the two countries, Senegal could easily provide
sufficient school places for all primary school-age
children with its current levels of public spending.
In this comparison differences in efficiency may be
driven by many factors, including teacher salary
levels and class size. Higher levels of efficiency
on the narrow technical indicator of an expenditure/
enrolment ratio may not indicate better quality
provision. The real question for policy-makers,
therefore, is whether better qualitative outcomes
(e.g. attainment of basic literacy) can be achieved
for less.
Classroom construction provides an example of
where efficiency gains can make a big difference.
In the Nigerian state of Kano the average building
cost per classroom in 2007 was US$14,000, while
the average cost estimated by the World Bank for
Africa was US$10,000 (FTI Secretariat, 2006; Kano
State Ministry of Education, 2008).3 If improvements
in efficiency could reduce the cost in Kano to the
average for Africa, an additional 40 classrooms
could be built for every 100 currently being
constructed. The efficiency saving could result
in more school places and reduced overcrowding,
within current levels of education spending.
Comparisons of this type do not provide grounds
for sweeping conclusions. Classroom construction
costs may vary across countries in sub-Saharan
Africa and other regions for many reasons. These
include the cost of materials, wage levels and the
quality of the classrooms constructed. Even so,
it would be wrong to understate the critical
importance of efficiency. In low-income countries
facing tight budget constraints and with large
deficits in classroom availability, efficiency is one of
the most critical requirements for expanded access
to education and enhanced equity. Cross-country
evidence can provide education planners with
insights into policies for achieving the central goal of
maximizing the number of good-quality classrooms
available, within their resource envelope.
Improving efficiency is not just an issue for the very
poorest countries. Nor is it just about infrastructure
and inputs. Efficiency gains can also be reflected
in learning achievement indicators. A recent study
explored differences in public education spending
efficiency across regions in Argentina and Mexico.
The study used NERs and test scores as output
indicators. It measured efficiency after controlling
for levels of regional income, literacy rates and
education spending per capita. For Mexico, the
analysis estimated that improvements in efficiency
alone could increase the primary NER by five
percentage points and the secondary NER by fifteen
percentage points. For Argentina, it estimated that
improving efficiency had the potential to increase
mathematics scores by seven percentage points
in primary school and by nine percentage points
in secondary (Jayasuriya and Wodon, 2007).
Corruption is a source of inefficiency and inequality.
Analysis of public education expenditure accounts
provides insights into the official picture of resource
flows. It reveals the level of resource mobilization
and the flow of funds through national budgets to
lower levels of government and down to schools.
In some countries there is a gap between budget
provision and delivery of real inputs to education.
Corruption is often implicated.
Tackling corruption in education is important
for the sector and for society in a broader sense.
Education receives a large share of total public
expenditure – in most countries it is the largest
Governments
can stretch
limited resources
by being more
efficient
3. The average for Africa was taken from an average based onWorld Bank projects. The original figure,US$8,000 in constant2000 prices, was inflatedto 2007 prices using the US GDP deflator.
1 3 8

R A I S I N G Q U A L I T Y A N D S T R E N G T H E N I N G E Q U I T Y: W H Y G OV E R N A N C E M AT T E R S
single area of government activity and the largest
public employer. Efforts to limit corruption in
general are unlikely to succeed if they do not
address the education sector in particular.
Moreover, ‘lack of integrity and unethical behaviour
within the education sector is inconsistent with one
of the main purposes of education itself, which is
to produce “good citizens” respectful of the law, of
human rights and of fairness. It is also incompatible
with any strategy that considers education as one
of the principal means of fighting corruption’
(Hallak and Poisson, 2004, p.7).
Corruption is difficult to measure and its effects
are hard to evaluate. Because it is illegal it is not
recorded in official data and, with government
agencies often implicated, its full extent may be
hidden. Corruption has adverse consequences for
efficiency and equity. Efficiency suffers because
corrupt practices mean part of the benefit of public
investment is captured in the form of private rent.
Equity suffers because corruption acts as a
regressive tax that hurts the poor the most.
Notwithstanding the problems with monitoring
corruption, cross-country and within-country
research has provided interesting insights.
One example comes from Nicaragua. Monitoring
of six major school upgrade and repair projects
that were undertaken by the education ministry
demonstrates how corrupt practices diminish
resource flows to education (Transparency
International, 2005). Comparison of the buildings
before and after project completion revealed
widespread irregularities. Substandard materials
and overpricing contributed to substantial
financial losses.
In Brazil, the otherwise highly effective FUNDEF
programme (Fundo de Manutenção e
Desenvolvimento do Ensino Fundamental e de
Valorização do Magistério) was affected in the past
by illegal appropriation of funds meant for teacher
salaries and training (Transparency International,
2005).4 On average, around 13% of the total was
lost in the course of transfer from the federal
budget to municipal bank accounts, rising to 55%
for some municipalities. The governance problem
was linked to the inability of local councils charged
with monitoring the grants to ensure that they
were properly received and used.
Measuring cross-country corruption is intrinsically
difficult. However, one study using a data set of
fifty-seven countries reached a conclusion that
has important implications for EFA. It found that
increased public spending on education was
associated with a significant increase in primary
education completion rates only in the least
corrupt countries and those with better-quality
bureaucracies (Rajkumar and Swaroop, 2008).
Corruption creates setbacks for equity because
the efficiency losses linked to corruption are not
distributed equally across society. The greatest
burden falls on the poor and disadvantaged, for
three reasons. First, the poor tend to be more
reliant on public services. Lacking financial
resources, they may not have the luxury of
responding to corruption by opting out of the public
system and putting their children into private
schools. Second, the poor are more likely to be
susceptible to corrupt practices because they have
limited recourse to formal or informal channels
through which to seek redress and they often lack
a strong enough voice to hold service providers
to account. Third, when informal payments are
required to secure access to education, the cost is
likely to represent a higher proportion of household
income for the poor, making it difficult for them to
send children to school. In Mexico, every two years
the National Survey on Corruption and Good
Governance records informal payments by
households for thirty-eight public services in all
thirty-two federal states, making it possible to
quantify what amounts to a tax (Transparency
International, 2005). Estimates based on the survey
indicate that households pay almost US$10 million
in bribes to secure access to public education,
which is legally free. In 2003 households paid an
average of US$30 each to meet illegal demands
from service providers. In a country where around
one-quarter of the population was living on less
than $2 per day, this is a significant financial
burden. There are also indications that informal
payments for access to basic services may be
charged more frequently to poorer households.
Tackling corruption through information,
institutional reform and monitoring. Because
corruption represents a regressive transfer of
public funds away from the poor and powerless,
reducing it is intrinsically good for equity – in the
education sector and elsewhere. In rich and poor
countries alike, corruption is rooted in political
cultures of non-accountability. Rooting out
corruption may be a long-term process, but
rapid progress is possible in the short term.
4. In 2007 the law governingFUNDEF was amended to addcoverage of pre-school andsecondary education and torename the programmeFUNDEB – Fundo deManutenção e Desenvolvimentodo Ensino Básico e deValorização do Magistério (Fund for the Maintenance andDevelopment of Basic Educationand Valorization of Teachers).
Corruption is
rooted in political
cultures of
non-accountability
1 3 9
F i n a n c i n g e d u c a t i o n f o r e q u i t y

90
02
Education f
or A
ll G
lobal M
onitorin
g R
eport
C H A P T E R 3
Governments acting with resolve can put policies
in place that make an immediate difference.
An important first step is to acknowledge the scale
of the problem and develop a commensurate
institutional response. Information has a key role
to play because governments and the public alike
are often insufficiently aware of the scale of the
corruption problem. A recent study in Bangladesh
provides a detailed tracking analysis of the flow of
resources through the system – an approach that
other countries could usefully follow (Box 3.1).
The analysis reveals a broadly positive picture
while identifying areas requiring greater scrutiny.
Another positive example comes from Indonesia.
Here the School Improvement Grant Programme
(SIGP) provided cash grants to primary and junior
secondary schools between 2000 and 2004,
targeting in particular those in the poorest districts
and with large populations of children from
households displaced by conflict or natural
disaster. A large programme, it covered some
8,000 schools in 130 districts and had a budget
of around US$60 million, of which 70% was for
physical rehabilitation of school buildings.
Recognizing that corruption was a systemic
problem, government and donors created an
institutional structure aimed at strengthening
governance. Among the central features:
Decision-making was decentralized: district
and local committees including non-government
representatives selected beneficiary schools.
School committees were involved in determining
needs and construction work involved
local people.
Details of block grants were announced publicly
and finance was directly transferred through the
banking system, thus avoiding interference from
intermediaries.
Comprehensive guidelines were issued for
programme procedures.
The programme was independently monitored
through a Central Independent Monitoring
Unit (CIMU).
The monitoring report of the CIMU, which was
publicly released, sparked an intense national
debate on corruption. It documented forty apparent
cases of corruption, from construction consultants
illegally charging for services to diversion of funds
by local government officers, attempted bribery and
collusion on prices between officials and building
contractors or textbook suppliers. Measured
against past practices, overall levels of corruption
in the SIGP were modest – institutionalized
transparency made a clear difference. The CIMU
report transformed corruption in the education
system from a well-hidden activity to a highly visible
subject for public debate (Baines, 2005).
Institutionalized public-expenditure tracking is
one of the most effective anti-corruption devices.
Monitoring real delivery of funds compared with
In Indonesia,
public availability
of monitoring
reports
transformed
corruption in
the education
system from a
well-hidden
activity to a
highly visible
subject for
public debate
1 4 0
Box 3.1: Tracking public expenditure
in Bangladesh
In 2005 a public expenditure tracking andquantitative service delivery survey was conductedto assess the primary education sector inBangladesh. Among the key findings:
Records for allocation and expenditure werefairly consistent among various sources, both at national level and at lower levels.
The teacher payment system appeared to berobust, with no evidence that resources for the payment of teacher salaries were leakingbetween the centre and local offices, or betweenlocal offices and schools.
Textbook leakage varied, with 98% of allocatedbooks reaching children in government andregistered non-government schools comparedwith 76% in madrasas.
Poor record-keeping by schools made it hard to track contingency payments and expenditureon small repairs and construction, though nomajor leakage of funds was found.
Nearly 20% of stipend payments weremisallocated due to exaggerated attendancefigures and payments to ineligible children; 5% of stipend resources were unaccounted for.
While the results point to a relatively effectivefinancial management system, some seriousproblems were identified. For example, informalpayments to local education offices were reportedby 16% of recently transferred teachers and about 40% of head teachers. Around one in ten households reported making informalpayments to get their children into the primaryschool stipend programme.
Source: Financial Management Reform Programme (2006a).

R A I S I N G Q U A L I T Y A N D S T R E N G T H E N I N G E Q U I T Y: W H Y G OV E R N A N C E M AT T E R S
budget provisions can turn a spotlight on problem
areas. Since the mid-1990s the World Bank and
other donors have conducted Public Expenditure
Tracking Surveys (PETS) to evaluate the
effectiveness of financial management systems and
identify where leakage occurs between ministries
and the classroom (Reinikka and Smith, 2004;
Winkler, 2005). Building on an exercise undertaken
initially in the mid-1990s in Uganda, PETS are now
a widely used monitoring tool (Box 3.2). Their
impact is strengthened when it is combined with
improved public access to information – a point
illustrated by the experiences of Indonesia
and Uganda.
Not all public expenditure tracking exercises
have been successful. When corruption is deeply
entrenched and political leaders do not create
conditions for strengthened accountability, such
exercises can deliver limited results. The PETS on
education conducted in Peru in 2002 is an example.
Opaque budget planning made it impossible to
establish real allocation levels, providing extensive
opportunities for corruption. Over 90% of the
resources earmarked for education were devoted
to payroll, but data lapses on teacher numbers
limited the scope for assessing delivery (Reinikka
and Smith, 2004).
As Transparency International puts it: ‘in many
countries, anti-corruption laws and regulation have
been in place for years, but citizens do not know
about them – often because they are rarely applied.
With no visible sanctions, people are inclined to
believe that corruption cannot be resisted and
therefore will not report it’ (Transparency
International, 2005, p. 14). Part of the problem is
that those who benefit from corruption have much
to lose from information campaigns and much to
gain from the maintenance of reporting systems
that lack transparency. On the other hand, most
citizens – particularly the poor and parents with
children in school – stand to lose a great deal
from failure to act.
Without visible
sanctions
corruption often
goes unreported
1 4 1
F i n a n c i n g e d u c a t i o n f o r e q u i t y
Box 3.2: Public expenditure tracking, information
campaigns and the fight against corruption in Uganda
Public information and budget monitoring are two of the most powerful antidotes for corruption.Uganda’s experience illustrates their effectiveness instrengthening public financial management systems.
In the mid-1990s official budget records were a weak guide to the financing of education in Uganda. In 1996, the World Bank conducted a PETS in 250 schools located in 19 districts. It showed that,according to school records, only 13% of centralgovernment capitation grants actually reachedschools. Most schools reported having received nofunds, and most teachers and parents were unawarethat the grants existed. Financing earmarked foreducation was diverted to other sectors, used forpolitical activities or stolen.
When Uganda introduced free primary education in1997, donor support was required to replace parentalcontributions with public spending. Aid partners madesupport conditional on implementation of an anti-corruption programme, including measures to raiseawareness about leakage and give parents a voice.Schools were instructed to publicly post detailedinformation about funds received from localgovernment. Several national and regionalnewspapers published information about granttransfers from central to local government, includingdates and amounts.
Institutional changes were also introduced. Instead of transferring funds for education and other sectorsto districts as a single block grant, the governmentdecided to transfer them as twenty-two separateconditional grants with payments linked to specificactions. A second PETS in 2002 showed that schoolswere receiving on average 80% of their capitationgrant, and that all schools were receiving at least partof the grant.
Evaluations of the Uganda experience have providedsome important insights. Detailed statistical analysisindicates that the reduction in grant leakage wasgreatest in schools that were closest to newspaperoutlets — an indication that information had the effectof empowering communities. However, the benefits ofinformation campaigns were not equitably distributed.Their impact was less marked in communities with the lowest literacy levels, thus underlining yet againthe importance of education — and literacy skills inparticular — to help people make informed choices and to create an enabling environment for responsibleand accountable governance.
Sources: Crouch and Winkler (2007); Hubbard (2007).

90
02
Education f
or A
ll G
lobal M
onitorin
g R
eport
C H A P T E R 3
Unequal spending reinforces disparities
Resource mobilization, efficiency and measures
to tackle corruption have system-wide benefits for
education. That is why governance in these areas
is of such importance for achieving EFA. Equity
also matters. Overcoming the disadvantages and
disparities documented in Chapter 2 requires
financing strategies that aim explicitly at equalizing
opportunity, with public financing being used to
counteract social deprivation.
Equitable financing is not an easy concept to define.
It clearly means something more than equal per-
student financing. Providing equivalent support to
children in very unequal circumstances is not the
same as equalizing opportunity. Children who are
disabled, who lack home advantages associated
with parental literacy, who are poor or are
disadvantaged by virtue of their gender or ethnicity
are not competing on a level playing field. For
children in cases like these, achieving a particular
outcome in education is likely to entail higher costs
than for children from social groups that are not
disadvantaged.
Whatever the precise definition of equity,
government spending patterns around the world
are often highly inequitable. Analysis of the
distribution of benefits from public spending across
populations suggests inequity is the rule, not the
exception. A study of countries in sub-Saharan
Africa, Asia and the Pacific, the Middle East and
North Africa, and countries in transition, discussed
in the 2008 Report, found that total expenditure on
education was not pro-poor in any region. In many
cases public spending was strongly ‘pro-rich’,
with pro-poor expenditure on primary education
outweighed by a bias towards higher income groups
in secondary and tertiary education.
National data broadly confirm this picture. In some
cases, public financing allocations fail to counteract
poverty-related disadvantage. One illustration
comes from Indonesia, where per-capita
expenditure on education in the poorest 20% of
districts amounts to only 54% of expenditure in the
richest 20%. The gap in per-student expenditure is
smaller because enrolment is lower in the poorest
districts (Table 3.3). In a more equitable system
the poorest districts, which face the most severe
deprivation in education, would receive the highest
per-student allocations. In some cases, the
contours of unequal financing follow ethnic lines.
In the former Yugoslav Republic of Macedonia,
schools whose students are of Albanian ethnicity
receive almost 20% less in per-student funding
than the national average. In rural areas they
receive almost 37% less than schools whose
students are of Macedonian ethnicity (Table 3.4).
In China, per student spending at the primary level
varies by a factor of ten between the lowest
spending and highest spending provinces, broadly
reflecting differences in provincial wealth
(Tsang, 2002).
Spending patterns are not fixed in stone. They
change with patterns of enrolment and as a result
of public policy decisions. During the 1990s, Brazil
had one of the world’s most inequitable patterns
of public spending. Per-student spending in the
poorest states of the north-east averaged around
half the level in the wealthier states of the south-
east. More recently, redistributive financing
programmes have significantly changed this
picture. Many governments are attempting to
redress social inequalities in education directly
through new approaches to financial resource
allocation, attaching more weight in allocation
formulas to disadvantaged groups and regions,
or to special programmes. Targeted interventions
focused on specific inputs have also been used. For
example, spending on free textbook programmes
targeting the disadvantaged in three Central
American countries was found to successfully
redirect resources to the poor (Table 3.5).
Many factors determine how governments allocate
resources in education. Technical financing
formulas can be useful, but the real drivers of
distribution patterns lie elsewhere. Governments
with a weak commitment to equity in general are
unlikely to attach a great deal of weight to the
interests of disadvantaged groups or regions in
In many
countries
public education
spending
tends to benefit
the relatively
well-off
1 4 2
53 14775 13263 12571 15198 169
Quintile 1 (poorest)Quintile 2Quintile 3Quintile 4Quintile 5 (richest)
Table 3.3: Poverty and public education expenditure
in Indonesia, 2004
Per capitaDistrict quintilePer public
school student
Source: Calculations based on Arze del Granado et al. (2007, Table 10, p. 17).
(Constant 2006US$)
Total district education expenditure

R A I S I N G Q U A L I T Y A N D S T R E N G T H E N I N G E Q U I T Y: W H Y G OV E R N A N C E M AT T E R S
education. Similarly, in situations where the
educationally disadvantaged have a weak political
voice, they are unlikely to exercise a strong claim
on public financial resources. Political leadership
can make an enormous difference. For example,
in Senegal, Uganda, the United Republic of
Tanzania and Zambia the decision of political
leaders to abolish user fees in education while
increasing spending at the primary level has
strengthened equity in public spending and had
important positive effects on enrolment.
Strategies for greater equity in financing
There are no ready-made formulas for equitable
financing in education. Any strategy aimed at
equalizing opportunity has to take into account
specific patterns of disadvantage. Some of these
patterns might be rooted in regional disparities.
Others will involve factors such as the incidence
and depth of poverty, or disadvantage based
on gender, ethnicity and language. In an equitable
system, allocation of education finance would be
inversely related to current outcomes, with those
in greatest need receiving the most support.
Moving from statements of principle to practical
measures raises multiple challenges for
government.
For all the egalitarian rhetoric of public policy
discourse on education, it is relatively rare to find
a clear link between student needs, as determined
by equity criteria, and per-student expenditure.
Governance rules for resource allocation vary
enormously. Most countries have funding formulas
for allocating money, teachers and teaching
materials across education systems. These
formulas can include a per-student component,
a fixed capital cost component and compensatory
elements aimed at redressing disadvantage.
Compensatory finance can address wide-ranging
sources and types of inequality, such as:
disadvantage associated with racial, ethnic,
caste and other characteristics where cultural
norms, political disenfranchisement and
systemic discrimination hold back achievement;
problems facing linguistic minorities or students
whose native language is not the national or
official language of instruction;
restricted opportunities facing children from
poor households whose parents may lack the
resources to keep them out of the labour force,
to finance transportation to school or to buy
school supplies, textbooks, uniforms and
school meals;
lack of provision for students in remote schools,
where small class sizes, transport problems,
boarding and dormitory costs, and problems
in attracting and retaining teachers restrict
opportunity;
the additional financing and specialized teaching
that may be required to assist students who are
disabled or have special needs.
One common application of formula funding in
developing countries has been the introduction
of school grants. Such grants represent a transfer
of resources and spending authority from central,
regional or district education authorities to local
communities and schools (Fredriksen, 2007). They
can address a wide range of equity-related goals.
On the supply side, grants can be used to increase
finance and the flow of teaching materials to
schools in areas marked by high concentrations
of poverty or with large numbers of disadvantaged
students. On the demand side, they can be used to
The link between
student needs
and per-student
expenditure
is often weak
1 4 3
F i n a n c i n g e d u c a t i o n f o r e q u i t y
289 263 261 255 274341 367 298 238 301457 347 364 290 359467 386 295 360 372454 … 375 296 395
391 352 332 285 342
AlbanianDominant AlbanianMacedonianDominant MacedonianOther
Total
Table 3.4: Ethnicity and public education expenditure in the former Yugoslav Republic
of Macedonia, 2005
RuralSchool ethnicity type
Municipality type
Source: Calculations based on World Bank (2008c, Table 2.7, p. 24).
Small city Large citySkopje
(capital) Total
(Constant 2006 US$)
29 26 24 14 729 27 21 16 829 23 26 15 8
El SalvadorGuatemalaNicaragua
Table 3.5: Free textbooks distributed by governments in selected
Central American countries, percentage per income quintile, 2000–2004
Quintile 1(poorest)Country
Source: Porta Pallais and Laguna (2007).
Quintile 2 Quintile 3 Quintile 4 Quintile 5(richest)
(% of total free textbooks)

90
02
Education f
or A
ll G
lobal M
onitorin
g R
eport
C H A P T E R 3
reduce barriers to access. Compensating schools
for the loss of revenue that occurs when user
charges are withdrawn is an example, as illustrated
by Ghana’s Capitation Grant Scheme (Box 3.3).
Other countries have also introduced school grants
into education financing. In Kenya, the government
established a school grant of US$14 per student to
enable schools to cover losses from the withdrawal
of student fees and to increase spending on
materials, maintenance and operations. The
programme has improved availability of textbooks
and other materials. It has also been used to fund
boarding schools to improve access for children
living in sparsely populated areas (Fredriksen,
2007). Similarly, the United Republic of Tanzania
introduced school grants soon after abolishing fees
in 2001. In 2002 its capitation grants for primary
schools amounted to about US$10 per pupil for
textbooks, teaching and learning materials, school
operations and administration, and teacher training
(Fredriksen, 2007).5
Formula funding and school grant design are often
viewed as narrowly technical matters. They seldom
figure in public debate or political programmes.In Ghana,
a government
grant enables
schools to cover
losses from the
withdrawal of
student fees
1 4 4
Box 3.3: Supporting school fee abolition: school grants in Ghana
Under the Free Compulsory Universal Basic Educationpolicy introduced in 1996, Ghana officially eliminatedtuition fees for grades 1 to 9. Five years later, thepolicy had not had its intended effect on enrolmentand retention. Policy reviews identified part of theproblem as a substitution effect: faced with a loss ofrevenue, communities and parent-teacher associationsauthorized the introduction of informal fees.
School grants were introduced in 2004/2005 as a response. They targeted schools in the forty most deprived districts and were linked to schoolimprovement plans. Intended to cover the cost of fee abolition, they were calculated based on studentnumbers, with a higher per-student grant for girls (the grants were equivalent to US$2.70 per boy andUS$3.88 per girl per year). Central government fundswere channelled through dedicated bank accounts in
each district and then on to individual school bankaccounts. Complaints and extensive lobbying fromother districts led to the programme being extendedto all primary schools from 2005/2006.
How successful has it been? Enrolment figurescovering the school years 2002/2003 to 2006/2007point to sharp increases in overall enrolment ratios(Figure 3.6). For example, the primary NER for girlsliving in deprived districts increased by twenty-fourpercentage points over this five year period. Whilethese improvements have been impressive, it is tooearly to tell whether the programme will have animpact on two central problems facing education inGhana: high dropout rates and low rates of transitionto secondary school.
Prim
ary
net e
nrol
men
t rat
ios
(%)
Male living in non-deprived district
Male living in deprived district
Female living in non-deprived district
Female living in deprived district
2002/2003 2003/2004 2004/2005
Introductionof Capitation
Grant Scheme
2005/2006 2006/200740
50
60
70
80
90
Figure 3.6: Trends in primary net enrolment ratios in Ghana before and after introduction
of the Capitation Grant Scheme
Sources: Fredriksen (2007); Gershberg and Maikish (2008).
5. Other sub-SaharanAfrican countriesexperimenting with schoolgrants include Ethiopia,Madagascar, Mozambiqueand Uganda.
R A I S I N G Q U A L I T Y A N D S T R E N G T H E N I N G E Q U I T Y: W H Y G OV E R N A N C E M AT T E R S
This is unhelpful. Financial resource management
is complex, but that does not mean it should be the
sole preserve of technocrats and administrators.
Formula funding design provides a strong indicator
of whether governments are intent on translating
commitments on equity into practical policies.
Chapter 2 suggests that governments could attach
more weight to the mapping and monitoring of
disparities in education. Approaches to formula
funding should be evaluated in the light of this
exercise, with governments providing full public
disclosure not just of the formula used but also
of the equity rationale for its selection.
Decentralization: a potential driver of inequality
The decentralization of public services to local
government control has been a major feature
of governance reform worldwide. Arguments for
decentralization extend from efficiency to equity.
Bringing decisions closer to the people affected,
and devolving authority to local governments
they elect, is seen as a route to more responsive
service provision.
Education has figured prominently in
decentralization reform. In the developing world,
a growing number of countries have transferred
responsibility for education to lower levels of
government, typically as part of wider public
service reform. Decentralization in education
redistributes authority not only from central to
local government but also from political authorities
to school providers (King and Cordeiro Guerra,
2005).
What this means in practice varies by country.
Governments seldom devolve power wholesale
and devolved education systems operate through
multilayered governance structures that link many
actors and agencies. Central governments may
transfer authority in some areas and either retain
authority in others or set rules putting limits on
local government choice. Despite widespread
advocacy for decentralization, central governments
often retain high levels of control, as the
governance mapping exercise in this Report’s
annex shows. Patterns of financial decentralization
are particularly complex and have important
implications for education provision. The rules
and policies governing fiscal decentralization also
shape the ways in which it affects education. Any
assessment has to take account of three key areas:
the assignment of spending authority, which
defines the level of government responsible
for making decisions on spending;
the assignment of revenue-raising authority,
which defines the powers of the various levels
of government to impose taxes and charges;
formulas for intergovernment resource
transfers, which determine how revenue
is allocated among regions and sectors.
Policies in each of these areas can have an
important impact on equity. It cannot be taken
as axiomatic that the impact will be positive.
The devolution of revenue-raising authority,
for example, can give local government greater
autonomy but also lead to the introduction
of user charges and taxes that may hurt the poor.
In Viet Nam, fiscal decentralization has gone a
long way but central government controls revenue
mobilization and transfers to local government
(see below). The only form of revenue autonomy
for district and commune governments is in the
introduction of fees in areas such as education
and health. User charges have been increased in
both areas, with damaging implications for equity
(Huong, 2006).
The experience in Viet Nam epitomizes some
of the tensions inherent in decentralization. Part
of the rationale for decentralization is to improve
efficiency and strengthen autonomy by devolving
real authority. But devolving revenue mobilization in
countries with high levels of inequality comes with
grave risks for equity. Governments can mitigate
those risks by ensuring that intergovernment
resource transfers equalize opportunity. The
formulas used by governments in designing these
transfers are highly technical – and highly political.
The following cases are instructive because equity
has been a primary concern in each:
Viet Nam: Provincial governments now have
extensive tax collection powers in areas such as
land and property, and responsibility for transfers
to communes. However, transfers from central
government remain the largest revenue stream.
Transfers are determined by a formula based
on population, but with weighting for poverty,
remoteness, health and education norms,
and the presence of disadvantaged populations.
A 2003 law recalculated the education norm on
the basis of all children, rather than in-school
Despite
widespread
advocacy for
decentralization,
central
governments
often retain high
levels of control
1 4 5
F i n a n c i n g e d u c a t i o n f o r e q u i t y

90
02
Education f
or A
ll G
lobal M
onitorin
g R
eport
C H A P T E R 3
children. Since the shares of school-age children
enrolled are lower in poorer provinces, this has
increased equity. Similarly, the education norm
for a child living in mountainous areas (which
have the worst education indicators) is 1.7 times
that of an urban child. The commitment to equity
is reflected in spending: richer regions such as
the Red River Delta have some twenty-five times
the income of the poorest regions such as the
North West, but budget spending per capita is
roughly equivalent, reflecting large transfers
from rich to poor regions (Adams, 2005;
Huong, 2006).
Uganda: Decentralization reforms in Uganda
have been among the most ambitious in
sub-Saharan Africa. However, decentralized
governance has proceeded faster in the sphere
of service management and delivery than in
finance. While district authorities are allowed
to collect local taxes, they are not entitled to
charge fees for basic services such as education.
They are also constrained in defining spending
priorities. Around 90% of revenue in most years
comes from central government. Over two-thirds
of the funding transferred is a conditional grant,
linked to achievement of goals from the national
poverty reduction strategy, including UPE,
secondary education and teacher recruitment.
Most of the rest is an unconditional grant
calculated on the basis of population and land
area. In addition, a small equalization grant is
aimed at reducing the gap between richer and
poorer districts (Obwona et al., 2000; Steiner,
2006; Uganda Local Government Finance
Commission, 2000).
South Africa: The end of apartheid in 1994
brought a new democratic government and
a radical move towards decentralization, with
provincial and local governments taking on
extensive new responsibilities in areas such as
health, education and housing. The financing
formula for fiscal decentralization incorporated
a strong redistributive component aimed at
overcoming inequalities inherited from the
apartheid era. Around 95% of provincial
government expenditure comes from central
government. The largest component is known as
an equitable share transfer, weighted to reflect
levels of poverty and the costs of achieving
minimum national norms in areas such as health
and education. In education, financing is based
on student numbers, with some additional weight
given to poor and rural provinces. Provincial
authorities are also required to rank schools
by a poverty index, which is used to allocate
funding for non-personnel inputs (Gershberg
and Winkler, 2003; Momoniat, 2003). As a
consequence of these reforms, resource
allocations to schools have become more
equitable (Crouch and Winkler, 2007).
Colombia: Decentralization of government
finance in the 1990s significantly improved
equity of intergovernment transfers. Before
decentralization, transfers from central
government were based on historic transfers –
an arrangement that favoured wealthier
provinces. Under the reforms, historic allocations
were replaced by a formula allocating resources
on the basis of population, with adjustments for
health and education provision (Bossert
et al., 2003).
The motivation for financial decentralization can
be important. Where reform is prompted by fiscal
pressures on central government, it can result in
reduced central government financing. In these
circumstances local governments, communities
and schools are likely to seek supplementary
funding from parents. This is broadly what
happened in China in the 1990s (King and Cordeiro
Guerra, 2005).
It is sometimes forgotten that decentralization is
a highly political process. It is one thing to devolve
authority in countries characterized by high levels
of national cohesion, strong national, regional and
local government institutions, and well-defined
processes for conflict resolution. It is quite another
to shift the locus of decision-making in countries
marked by weak governance systems and high
levels of tension. In a country such as Nigeria –
where public confidence in institutions is weak,
political relationships between regions are tense
and democracy is still under construction –
decentralization is a fraught political exercise
(World Bank, 2008f).
Decentralized finance in education
In education, as in other areas, decentralization
has to be evaluated on its outcomes. However,
in the context of financing EFA, two broad dangers
can be identified. First, devolution of finance can
act as a powerful driver for disparities in provision.
Decentralization with equity requires central
governments to retain a strong role in redistributing
Decentralization
is a highly
political process
1 4 6

R A I S I N G Q U A L I T Y A N D S T R E N G T H E N I N G E Q U I T Y: W H Y G OV E R N A N C E M AT T E R S
finance, with a commitment to equalizing
opportunity. Second, financial and political
devolution to weak local governance structures
can have negative consequences for the coverage
and quality of education, again with damaging
consequences for equity. Here too, successful
decentralization requires an active role for central
government in building capacity.
China’s experience with fiscal decentralization
provides a cautionary tale for education equity.
During the 1990s the central government reduced
its share in overall education financing, giving more
responsibility to local governments, schools and
communities. This decentralization effort had
unintended consequences. Overall resource
mobilization for education lagged behind economic
growth, leading to a decline in the share of GDP
allocated to education from 2.9% in 1991 to 2.2%
in 1997. Decentralization also generated major
geographic and income-based disparities in per-
student spending. The ratio of highest-spending
to lowest-spending province in per-student
expenditure in primary education almost doubled
from 5 to 9 (Table 3.6). Many schools and local
authorities resorted to formal and informal
household charges, so equity suffered: in effect,
fiscal decentralization acted as a regressive
education tax on the poor (King and Cordeiro
Guerra, 2005; Tsang, 2002).
Recognition that the lack of a strategy to equalize
financing has compromised equity and the quality
of education in poorer areas has prompted the
Chinese Government to rethink its initial strategy.
It has removed some tax powers from local
government, continued to finance teacher salaries
and maintained responsibility for parts of the capital
budget. Concerns over inequality are cited as a
primary motivation. However, these efforts have
met with limited success. While the central
government formally prohibits the charging of fees,
still many local governments informally encourage
it (Wang, 2004) and large gaps in the quality of
provision remain. More fundamentally, China still
lacks a system of transfers between provinces,
and between rich and poor areas within provinces,
consistent with a more equitable pattern of
expenditure while preserving the principle of
decentralized decision-making.
Tensions between the goals of equity and political
decentralization are not limited to China. In the
Philippines, where education financing has
remained less decentralized, local authorities are
permitted to raise revenue for education through
a Special Education Fund (SEF) tax on property
(King and Cordeiro Guerra, 2005). Spending per
student from the SEF in the poorest municipalities
with the lowest property values is only 13% of the
levels in the richest municipalities and 3% of that in
the richest cities. Here too, the absence of a strong
formula for redistributive public finance has
hampered efforts to strengthen equity.
In Indonesia, decentralization has gone hand in
hand with a large increase in the share of GNP
allocated to education, from less than 2% before
decentralization to over 4% today (King and
Cordeiro Guerra, 2005). It transfers resources
from central to local government via a block grant
system incorporating a strong equity component,
with the poorer districts receiving the largest
transfers. However, central government also
requires local districts to mobilize their own
resources – and it has devolved tax raising
authority. This has an inbuilt danger for equity: in
the richest provinces, such as Jakarta, per-capita
GDP is some nine times greater than in the poorest
provinces, such as South Sulawesi. Enrolment
ratios at junior secondary level range from 68%
in South Sulawesi to 93% in Jakarta.
The lesson from East Asia is that governments
need to plan for equity. The push towards financial
devolution has brought a risk of widening disparities
between regions, with attendant dangers for
the inequalities outlined in Chapter 2. Central
government resource transfers hold the key to
making financial decentralization work for the poor.
Evidence from Latin America is also instructive.
The decentralization of education from federal to
Decentralization
can generate
major geographical
and income-based
disparities in
per-student
spending
1 4 7
F i n a n c i n g e d u c a t i o n f o r e q u i t y
157 357 419 314 520 42466 90 75 141 166 10330 39 40 69 75 64
5 9 11 5 7 7
Highest-spending provinceMeanLowest-spending province
Ratio of highest-spendingto lowest-spending province
Table 3.6: Inequality in per-student education expenditure in China
following decentralization
1989
Source: Calculations based on Tsang (2002, Tables 1-3, p. 19).
1997 2000 1989 1997 2000
Primary education Lower secondary education
(constant 2006 US$)(constant 2006 US$)

90
02
Education f
or A
ll G
lobal M
onitorin
g R
eport
C H A P T E R 3
provincial governments was an important feature of
institutional reform in the region during the 1990s.
In Argentina, the transfer of responsibility for
secondary schools from federal to provincial level
was accompanied by a system of federal tax
transfers. Detailed evaluations of the
decentralization process have identified many
benefits. Nationally, decentralization appears to
have improved local participation, strengthened
monitoring and improved learning standards.
However, the results have not been uniform. Test
scores point to a widening gap between wealthier
provinces with strong government capacity and
poorer provinces with low administrative and
institutional capacity; the latter performed worse
under decentralization. National efficiency has
improved, but at the expense of equity (Galiani
et al., forthcoming; Rhoten, 2000).
Experience in other regions is more limited.
In sub-Saharan Africa, financial decentralization
is less advanced than political decentralization.
Some governments have integrated equity into
decentralized financing (as in Uganda). In other
cases, fiscal decentralization appears to have
had damaging consequences for education equity.
This is demonstrated by the experience of Nigeria,
whose financial governance system combines
a ‘worst of two worlds’ approach: low overall
commitment and highly unequal financing (Box 3.4).
In marked contrast, decentralization policies in
Ethiopia attach far more weight to equity. Apart
from highlighting innovative pro-poor financing
approaches in education, Ethiopia’s experience
demonstrates the importance of flexible policy
responses to unanticipated problems (Box 3.5).
Many governments now recognize the importance
of central transfer mechanisms to redress
education inequalities arising from decentralization.
These mechanisms can take various forms. The
primary one is often the block grant. Its size can be
linked to levels of deprivation, as in Uganda. Central
governments can introduce a conditional element
into such grants, requiring local governments
to meet specified standards for overall sector
financing and equity. In other cases, financing can
be linked to specified inputs. Two examples from
Latin America illustrate the scope for redistribution:
Colombia – the use of compensatory financing.
In 2004 Colombia introduced allocation rules
using a funding formula based on the number of
students enrolled, with a basic cost component
(covering teacher salaries and administrative
costs per student) supplemented by a
compensatory component which includes
weighting for geographic dispersion, poverty and
the share of rural households in the population.
In 2006 the seven poorest and most rural
departments received extra funding amounting
to between 39% and 112% of the average basic
cost. In addition, legislation provides for teachers
in rural and remote areas to receive 15% more
than the base salary (Meade and Gershberg,
2008). Preliminary evidence, while less than
clear-cut, suggests that the move has
strengthened equity on some indicators.
Transfers to Bogotá, the capital, have increased
at a rate below the national average. Meanwhile,
in 2006 two of the poorest departments, Chocó
and La Guajira, received 30% more than
Antioquia, one of the most urban and developed
departments (Meade and Gershberg, 2008).
Brazil – targeted redistribution through FUNDEF.
When Brazil devolved authority from a highly
centralized system to states and municipalities
in the mid-1990s, it created FUNDEF to reduce
the large national inequalities in per-student
spending (de Mello and Hoppe, 2005; Gordon and
Vegas, 2005). State and municipal governments
were required to transfer a proportion of their
tax revenue to FUNDEF, which redistributed it to
state and municipal governments that could not
meet specified minimum levels of per-student
expenditure. FUNDEF has not prevented
wealthier regions from increasing their overall
spending more rapidly than poorer regions, but it
has played a highly redistributive role. It has also
increased both the absolute level of spending
and the predictability of transfers, notably for
poor states and municipalities in the north and
north-east. There is strong evidence that
FUNDEF has been instrumental in reducing
class size, improving the supply and quality of
teachers, and expanding enrolment. At municipal
level, data show that the 20% of municipalities
receiving the most funds from FUNDEF were
able to double per-pupil expenditure between
1996 and 2002 in real terms (Gordon and
Vegas, 2005).
Are there rules of good practice in decentralization
that can be derived from experience to date?
As in many other areas of governance, the diversity
of country experience militates against drawing
simple lessons with universal application.
Central transfer
mechanisms
and targeted
redistribution
have proved
helpful in
redressing
education
inequalities
1 4 8

R A I S I N G Q U A L I T Y A N D S T R E N G T H E N I N G E Q U I T Y: W H Y G OV E R N A N C E M AT T E R S
1 4 9
F i n a n c i n g e d u c a t i o n f o r e q u i t y
Box 3.4: Fiscal decentralization in Nigeria — reinforcing regional disparities
Improved governance and the return of democracy to Nigeriahave done little to narrow inequalities in education. One reasonis that insufficient attention has been paid to the developmentof a more equitable financing system.
Primary net attendance rates (NARs) in Nigeria range from85% in Anambra and Ondo states to less than 30% in Jigawaand Zamfara states (Map 3.1). These disparities are linked tosubstantial differences in poverty rates. In 2004 the povertyheadcount ratio in Anambra was 20%, compared with 95%in Jigawa.
Under an equitable financing system more resources would be allocated to states with low levels of participation and high rates of poverty. In Nigeria the equity principle is turnedupside down: the wealthiest states and regions with the highest education participation secure the lion’s share offederal resources. For example, Lagos receives around fivetimes as much as Jigawa, which has attendance rates less than half of those in the commercial capital.
Fiscal decentralization has reinforced regional disparities ineducation. Since the return to multiparty democracy in 1999, an increasing share of federal revenue (predominantly from oiland gas) has been allocated to state and local governments.Since 2002 about half the federal budget has been allocated to states and local government areas (LGAs). Of this share, athird is reserved for the four oil-producing states in the Nigerdelta and the remainder is distributed under a complex formulathat produces a simple result: large financing inequalities.
In 2005, Kano, a poor state with a low primary NAR and limited revenue-generating capacity, received 20% less infederation account revenue than Enugu state, with similarrevenue raising capacity, lower poverty rates and a higherprimary NAR. Unlike most states that depend on federalallocations, Lagos generates two-thirds of its revenue fromlocal sources — an arrangement that reinforces regionalfinancing gaps.
Not all the problems in Nigeria’s education financing can betraced to unequal fiscal decentralization. National planning isalso weak. No statutory accountability mechanisms exist toensure that state and LGA plans, where they exist, are alignedwith national goals in education. As a result, the priority thatLGAs give to primary education varies enormously, even withinstates. In Kano, 28% of the Dala local government budget wasallocated to primary education, compared with 12% in Bichi.
Recognizing the need for additional financing in education, the federal government created the Universal Basic EducationCommission (UBEC) intervention fund, which channels federalresources directly to basic education. Between 2005 and early2008 about US$750 million was made available to statesthrough the fund. Unfortunately, this has done little to enhanceequity or efficiency:
Equal allocations lead to unequal effect. Some 70% ofavailable resources are allocated equally across stateswithout regard for differences in need. Only 9% of resourcesare directed to the most disadvantaged states and toactivities promoting education for physically and mentallychallenged children.
Disbursements have been much lower than expected. Only60% of allocated funds had been disbursed by mid-2007.Problems range from inadequate policy coordination tocomplex bureaucratic procedures and weak capacity in stateeducation bodies.
Use of funds is inflexible. The UBEC has strict guidelines on the proportion of funds that can be spent on pre-primary,primary and junior secondary education, as well as the typeof expenditure. For example, 70% of funds must be spent onconstruction, regardless of need. This makes it more difficultto use resources effectively to support state plans for thedevelopment of basic education.
Sources: Adediran et al. (2008); Bennell et al. (2007); Kano State Ministry of Education (2008); Nigeria National Bureau of Statistics (2006a, 2006b);World Bank (2007b, 2008f).
Niger
Borno
Yobe
Taraba
Bauchi
Oyo
Kogi
Kebbi
Kaduna
Kwara
Edo
Benue
Sokoto
Zamfara
Kano
AdamawaPlateau
Jigawa
Delta
Katsina
Ogun Ondo
Gombe
Nassarawa
Rivers
Osun
Imo
Ekiti
Bayelsa
Ebonyi
Cross River
Enugu
Abia
FCT, Abuja
AkwaIbom
Lagos Anambra
21
28
65
28
28
26
34
63
132
Less than 50%
50% - 79%
80% and above
Primary net attendance rate
Public spending per primary school-age child (constant 2006 US$)
Map 3.1: Net attendance rates and education spending per primary school-age child, Nigeria, most recent year
Sources: Calculations based on Kano State Ministry of Education (2008); Nigeria National Bureauof Statistics (2006a).
The boundaries and names shown and the designations used on this map
do not imply official endorsement or acceptance by UNESCO.
Based on United Nations map.

90
02
Education f
or A
ll G
lobal M
onitorin
g R
eport
C H A P T E R 3
Decentralization has been described as a process
rather than a destination (Bird and Smart, 2001).
The way the process unfolds is heavily influenced
by public policy choices, institutional capacity and
government commitment to deal with poverty
issues. In the case of education, much depends
on how governments use financing arrangements
to equalize opportunity and improve service
provision in poor areas. From an equity perspective,
the important question would seem to be not
whether to decentralize, but how and what to
decentralize. Four broad rules would appear to be
of particular importance for progress towards EFA.
First, revenue-raising powers for local government
should be clearly defined. Subnational authorities
should not be permitted to mobilize budget
resources through user charges in basic education,
which have regressive and damaging effects
on the poor.
Much depends on
how governments
use financing
arrangements to
improve service
in poor areas
1 5 0
Box 3.5: Financial decentralization with equity in Ethiopia
Since the late 1990s Ethiopia has witnessed rapidimprovement in education outcomes. The country has also been implementing far-reaching educationreform, including radical decentralization, in thecontext of wider governance reform. Equity is acentral concern.
Ethiopia’s decentralization has involved a radicaloverhaul of government structures. In the first phase,a four-tier governance structure was created: thecentre, the regions (nine ethnic-based states plus the cities of Addis Ababa and Dire Dawa), the zonesand the woredas (districts). In the second phase, legal, fiscal and administrative reforms devolvedresponsibility for management of social services to the woredas.
Education is now financed through a two-step process.The first involves fiscal transfers from the federalgovernment to the regions and the second fromregional governments to woredas, which now manageabout 45% of regional public expenditure. Mosttransfers operate through large federal block grantswhich regional and woreda governments may allocatefreely. A ‘three parameter’ formula for grant allocationto the regions takes into account population size,poverty and development levels, along with an indexof revenue effort and sector performance. While funding formulas have an equity component,they have tended to produce strong biases in favourof regions with smaller populations, even though they are not necessarily the poorest.
Most regional governments use the three-parameterformula to allocate their grants to woredas, but thereis sufficient flexibility for them to experiment withother approaches. The Southern Nations, Nationalitiesand Peoples Region, one of the country’s poorest, has taken advantage of that flexibility to developinnovative new approaches. Between 2003/2004 and2006/2007, authorities have experimented with a unitcost approach that distinguishes between recurrentand capital expenditure. Reduced to its essentials, it allocates higher per capita funding for recurrent
expenditure to the woredas with the more developedsocial services, so those services can be adequatelystaffed and function effectively. Meanwhile, higher percapita funding for capital expenditure is allocated toworedas having less developed social services so theycan expand infrastructure and reduce the gap with theother woredas.
Data on education expenditure suggest that the unitcost approach had equalizing effects betweenworedas. For instance, mean per-student recurrentexpenditure on primary education increased by 18%between 2001 and 2004, per-student funding becamemore equal among woredas, the mean woreda-levelprimary GER increased from 63% to 73% andenrolment gaps between woredas narrowed.
Decentralization in the region seems to havedisproportionately favoured remote, food-insecure andpastoral woredas (Table 3.7). Despite these outcomes,the unit cost approach has led to some woredasreceiving lower funding, prompting demands forfurther reform.
266 361 36
516 530 3
431 528 22288 320 11
126 221 75389 453 16
Remote (more than 50 kmfrom a zone head city)Non-remote
Food insecureFood secure
PastoralNon-pastoral
Table 3.7: Ethiopia’s Southern Nations, Nationalities
and Peoples Region: woreda-level spending on education
before and after decentralization
2001Type of woreda(district)
Total education
Source: Calculations based on World Bank (2007b, Table 4.3, p. 43).
2004Change between
2001 and 2004
Constant 2006 US$ (%)
R A I S I N G Q U A L I T Y A N D S T R E N G T H E N I N G E Q U I T Y: W H Y G OV E R N A N C E M AT T E R S
Second, central government should retain
redistributive capacity. Intergovernment transfers
are needed to prevent the growth of regional
financing inequalities and the widening gaps
in opportunity that can result.
Third, equity goals should be built into
intergovernment financing formulas. Transfers
should be weighted to provide larger per-capita
transfers to regions marked by high levels of
poverty and marginalization, with education
indicators as a central part of the formula.
In addition, national rules need to provide
a framework for ensuring that lower levels of
government prioritize equity in delivery of financing.
Finally, central governments should carefully
assess the implications of decentralization for
the achievement of national goals in education.
Ensuring that local governments have the
resources and capacity to manage progress
towards inclusive education is critical.
Conclusion
Approaches to education finance will continue
to exercise a critical influence over prospects for
achieving the goals set out in the Dakar Framework
for Action. Increased financing is not a sufficient
condition for delivering on the commitment to
education for all – but in many countries it is
a necessary condition. In some cases, national
governments are not demonstrating sufficient
levels of commitment either to resource
mobilization or to equity. Much of South and West
Asia falls into this category. In other cases, stronger
national commitment will need to be accompanied
by scaled-up donor support.
Financial governance challenges vary enormously
across regions and countries. Improving efficiency
and facing up to corruption are two immediate
priorities for many governments. It is also
important for governments to take stock of the
experience of decentralization. While the case
for avoiding overly centralized decision-making and
for devolving political authority under appropriate
conditions remains strong, decentralization is
not a panacea. In the area of financing, there
is an urgent need to place equity at the centre of
the decentralization agenda. That means central
government retaining a strongly redistributive
role consistent with commitments to inclusive
education and equal opportunity for education.
Central
government should
retain a strongly
redistributive role
consistent with
commitments to
equal opportunity
for education
1 5 1
F i n a n c i n g e d u c a t i o n f o r e q u i t y

90
02
Education f
or A
ll G
lobal M
onitorin
g R
eport
C H A P T E R 3
Choice, competition andvoice: school governancereform and EFA
Introduction
Governments around the world repeatedly
emphasize their commitment to providing good-
quality schooling for all citizens. Outcomes often fall
short of the commitment. Persistent problems with
education equity and quality, even in countries with
high levels of coverage and strong public spending,
have brought the management of school systems
to the centre of education governance debates.
The evident failure of current education strategies
to provide high-quality school systems accessible
to all in many countries has prompted calls for
wide-ranging reforms. This section looks at some
of the central currents in approaches to school
governance reforms, with a focus on school-based
management and reforms to promote choice in
education through public policies. Looking beyond
the formal public policy framework, the section also
explores the implications of the growth of low-fee
private schools for EFA.
‘Voice’, ‘participation’, ‘competition’ and ‘choice’
are buzzwords in debates on education governance
worldwide. Devolving authority away from central
government and towards schools – the core
principle behind school-based management –
is seen as a means of holding providers to account
and increasing participation. Giving parents an
opportunity to choose among education providers
is widely portrayed as a way to strengthen education
provision, with competition acting as a spur to
improved quality. While no government treats the
education sector as a pure market, many have
introduced what have been called ‘quasi-market’
principles into provision. For some commentators,
the entry of low-fee private providers into the
education marketplace is important precisely
because it provides an impetus towards greater
accountability and competition (Tooley, 2007).
The motivation behind quasi-market reform has
been to raise standards rather than to address
inequality. However, advocates for reform often
attach to their arguments claims of wide-ranging
benefits for equity.
There is a bewildering array of approaches to school
governance reform. Countries at very different levels
of development have taken up the mantle of reform.
The design, scope and depth of reform also come
in a multitude of variations. Evaluating outcomes
against this backdrop is inherently difficult.
Even so, two broad conclusions emerge from
the evidence presented in this section.
The first is that context matters. Governance
debates are frequently characterized by bold
assertions on the presumed benefits of school
management reform for learning outcomes and for
equity. Evidence to back these assertions is often
lacking. Moreover, there is a widespread tendency
to generalize findings and to assume that a policy
that works in one context will deliver the same
results elsewhere. Looking ahead, it is important
that policy-makers develop more evidence-based
approaches. It is also important that they identify
the broader institutional conditions and enabling
factors needed to strengthen education quality
and equity.
The second conclusion is that competition and
choice have the potential to reinforce inequality.
Choice is important in education, as in other areas.
The Universal Declaration of Human Rights
(Article 26) enshrines the right of parents ‘to choose
the kind of education that shall be given to their
children.’ Under certain conditions, competition
can act as a force to drive up standards and
improve efficiency. But choice and competition are
not abstract concepts. For people living in chronic
poverty, choice is often constrained by a lack of
purchasing power, limited access to information
and, in many cases, by an absence of responsive
providers. Introducing choice and competition into
an environment characterized by high levels of
inequality without effective public action to equalize
opportunity is a prescription for widening
disparities. As in many other areas, markets –
and quasi-markets – in education are unlikely
to prove effective in strengthening equity in
the absence of pro-poor regulation.
The issues raised in debates over school
governance go to the heart of wider questions about
the role of government in education. To what extent
should governments finance and provide education
services? If private providers are to play an
expanded role, how should governments manage
and regulate their operations? The answers to
these questions will vary across countries and
across levels of the education system, with a
distinction drawn between primary and post-
Debates
over school
governance go
to the heart of
wider questions
about the role of
government in
education
1 5 2

R A I S I N G Q U A L I T Y A N D S T R E N G T H E N I N G E Q U I T Y: W H Y G OV E R N A N C E M AT T E R S
primary education. The critical issue facing policy-
makers is to work out strategies through which
competition, incentives and accountability can be
harnessed to enhance overall quality and equity.
The bottom line is that governments have the
ultimate responsibility to ensure that everyone has
access to basic education systems of acceptable
quality. Discharging that responsibility effectively
means different things in different places, but it
invariably requires placing a premium on the
equalization of opportunity across the education
system.
School-based management:a broad spectrum of approachesand outcomes
Conventional education governance structures
allow schools little control over their affairs.
Principals, teachers, parents and even local
education bodies have been bound by centralized
rules and procedures, leaving them limited scope
for influence over staff selection, teaching methods
and wider practices. School-based management
reforms are challenging this model.
School-based management in its broadest
sense aims at increasing school autonomy
and empowering teachers and parents to make
decisions. It aims to strengthen incentives for
schools to deliver services that are responsive to
the needs of the communities they serve, and to
address problems facing disadvantaged groups
(Caldwell, 2005).
Advocates of school-based management point to a
wide range of potential benefits. They argue that the
devolution of decision-making authority to schools
can facilitate and enhance participation – a core
strategy in the Dakar Framework for Action. A
stronger parental voice and more participation in
school management, the argument runs, will lead
to greater incentives for education providers to offer
more efficient services (World Bank, 2007f). Moving
decisions away from remote planners and closer
to those who know the most about the learners
and their educational needs, as well as about local
values and realities, is seen as a route to a more
responsive system. Equity is another important
benefit cited for school-based management. It is
assumed that poor households will have a stronger
and more effective voice on school management
committees and in local community institutions
than under more remote centralized systems,
empowering them to play a role in framing
priorities and in holding school providers to
account (World Bank, 2007f).
School-based management is not a recent
innovation. Its origins can be traced to the United
States in the 1980s and Australia, Canada and
the United Kingdom in the 1990s. School-based
management programmes have also been adopted
in some developing countries. Most of these
programmes are in Latin America and South Asia,
though sub-Saharan Africa also figures with
increasing prominence. While much of the reform
impetus in developing countries is home grown, aid
donors have played an important role. For example,
some 11% of all education projects supported by
the World Bank between 2000 and 2006 included
school-based management components. These
programmes represent around US$1.74 billion
in education financing, or just under one-quarter
of the World Bank’s education portfolio (World
Bank, 2007f).
School-based management reform is an umbrella
description for a diverse range of country
experiences. In some countries the schools involved
have broad coverage. El Salvador’s Educación con
Participación de la Comunidad (EDUCO) schools
are an example. They account for half of enrolment
in public rural pre-schools and 37% in rural basic
education. EDUCO is the main schooling option
for about 80% of the municipalities with extreme
poverty in El Salvador (Meza et al., 2006). In other
contexts, the reforms operate on a smaller scale.
In some cases, authority is delegated to principals
and teachers, with weak community participation
included as part of the design. In other cases,
decision-making authority is also given to parents
or school committees. Similarly, while some
programmes transfer authority for hiring and firing
teachers, others do not. Variations are found in the
degree of devolution of budgetary authority as well.
The experience of three Latin American countries
with school-based management reform illustrates
this diversity (Table 3.8).
The context in which community schools are
formed is important. In some cases, the move
towards school-based management has been
driven from below. In Bolivia, indigenous schools
emerged in the 1980s in the context of an intense
political struggle over national education policies.
The decision of the Quechua communities in some
School-based
management aims
to move decisions
closer to those
who know more
about learners,
local values
and realities
1 5 3
C h o i c e , c o m p e t i t i o n a n d v o i c e : s c h o o l g o v e r n a n c e r e f o r m a n d E FA

90
02
Education f
or A
ll G
lobal M
onitorin
g R
eport
C H A P T E R 3
areas to withdraw their children from state
schools started out as a protest against teacher
absenteeism but rapidly became part of a
movement against the imposition of the dominant
‘Criollo’ culture (the culture and language of
the Creole Spanish descendents). Communities
themselves took over the running of schools
and recruitment of teachers, and they initiated
a curriculum for indigenous language teaching.
Under the 1994 Education Act and subsequent
legislation, indigenous communities have been
given greater autonomy within the state system
and indigenous language teaching has been
brought to the centre of the national curriculum
(Albó and Anaya, 2003; Regalsky and Laurie, 2007).
Learning achievement: a mixed record
Assessing the impact of school-based management
reforms on learning outcomes presents serious
methodological problems. Cross-country
comparisons are of limited relevance and within-
country assessments point in various directions.
In some cases positive results have been
registered but the association between school-
based management and improved education
quality is weak.
Several factors contribute to the difficulty in
extrapolating clear lessons for education quality.
Diversity of context is one obvious factor. More
broadly, it is difficult to identify or isolate the
‘school-based management effect’ in achievement,
not least because school-based management is
usually part of a broader package of political,
administrative or educational change. Selection
bias is another problem. Schools and communities
either self-select into school-based management
programmes or are selected to participate by
government authorities, often on the basis of
specific characteristics that differentiate them
from others. This makes it difficult to tell how,
or whether, school autonomy in particular had
an influence on outcomes.
Most detailed school-based management
evaluations come from Latin America. The regional
evidence points to some positive effects on
attainment. Some studies have found an association
between delegation of management functions and
reduction of school repetition and dropout (Gertler
et al., 2006; Jimenez and Sawada, 2003; Murnane
et al., 2006; Paes de Barros and Mendonça, 1998;
Skoufias and Shapiro, 2006; World Bank, 2007e).
Learning outcomes are more variable, with
marked differences among countries. A study of
mathematics and language performance among
grade 3 students found that EDUCO schools in
El Salvador scored lower than traditional schools.
However, after controlling for background, the
differences disappeared and EDUCO pupils actually
scored slightly higher in language tests, on average
(Jimenez and Sawada, 1999). On the other hand,
evaluations in Honduras of schools in the
Programa Hondureño de Educación Comunitaria
(PROHECO) concluded that the delegation of
decision-making was not associated with significant
changes in learning achievement (Di Gropello
and Marshall, 2005).
Autonomy and pedagogy: a loose connection.
An important assumption behind school-based
managment is that greater autonomy will permit
more flexible, responsive and innovative teaching.
That assumption is not strongly backed by evidence.
Findings from Latin America show that school-
based management reforms can result in improved
teacher motivation. Reduced absenteeism, more
time meeting with parents and more hours spent
at school are among the key indicators for improved
motivation (Di Gropello, 2006; Sawada and Ragatz,
2005). However, evidence from a wide range of
country experiences suggests that teaching
In Latin America
and East Asia,
school-based
management
has not greatly
affected teaching
practices
1 5 4
Paying staff salaries √ √Hiring/firing teaching staff √ √Supervising and evaluating teachers √ √
Setting school calendar, classroom hours √Selecting some textbooks/curriculum √Method of instruction
Building/maintaining school √ √ √Buying school materials √ √ √
Oversight √ √Allocation √
Table 3.8: Functions transferred to schools in three Latin American programmes
El SalvadorEDUCO1
MexicoPEC2
Nicaraguaautonomous
schools3
1. EDUCO - Educación con Participación de la Comunidad.2. PEC - Programa Escuelas de Calidad.3. The policy ended in 2007.Note: Empty cells indicate that the function was not transferred to schools.Source: World Bank (2007f ).
Personnel management
Pedagogy
Maintenance and infrastructure
Budget

R A I S I N G Q U A L I T Y A N D S T R E N G T H E N I N G E Q U I T Y: W H Y G OV E R N A N C E M AT T E R S
practices in schools with more autonomy do not
differ significantly from those in other schools
(Di Gropello and Marshall, 2005; Fuller and
Rivarola, 1998; Gunnarsson et al., 2004;
Jimenez and Sawada, 1999; King and Ozler, 1988;
Parker, 2005). Why has improved motivation not
led to new teaching practices?
Once again the explanation varies by country and
context. An important factor is that school-based
management reforms do not always increase the
autonomy of schools and teachers in areas such
as pedagogy, as Table 3.8 shows. Even where
reforms do provide for greater flexibility, schools
and teachers often have not had an opportunity
to acquire the capacity and skills to introduce
innovative practices. This is borne out by evidence
from East Asia. In Indonesia, legislation allows
schools to devote 20% of instruction to locally
designed subject matter. In Thailand, 30% of
the curriculum in basic education can be locally
determined. Yet these windows of opportunity
for greater flexibility are not fully exploited in either
country, partly because teachers have no training
or experience in developing innovative approaches
to instruction and curriculum design (Bjork, 2004;
Shoraku, 2008).
Enabling environments are important
Devolving authority to schools shifts the locus of
decision-making and transfers new responsibilities
to parents, teachers and principals. Such
governance reforms can change incentives and
influence relationships between key actors in the
delivery of education. Under what circumstances
is devolved authority likely to produce positive
results? Outcomes invariably depend on local
factors but case studies have identified four broad
conditions influencing equity and efficiency
(Cárdenas, 2008):
voluntary participation of the school
and the surrounding community;
organizational and technical capacity in,
or available to, the school;
strong and committed school leadership;
support from upper levels of government.
Voluntary participation. Public-sector schools
managed by communities need the motivation
and capacity to generate demand for schooling.
School-based management initiatives are likely
to be most successful when they are driven
by demand from below. However, community
participation can be a double-edged sword from
an equity perspective, especially when it involves
competition for resources. Schools with committed
principals and organized communities are in
a stronger position to exploit opportunities.
Evidence from Mexico’s Programa Escuelas
de Calidad (PEC) illustrates the point: voluntary
participation by itself resulted in a selection
of schools that were neither located in the poorest
communities nor among the lowest performers
(Cárdenas, 2008). An important lesson is that
voluntary participation has to be supported by
measures that strengthen equity.
Organizational and technical capacity of schools.
Schools must have sufficient financial and human
resources to take on new responsibilities. Drawing
up school plans, budgets, and requests for
financial and material inputs from central
government may require new skills. Evidence
suggests that technical capacity of this kind on the
part of the head teacher and staff is an important
condition for overall school improvement
(Abu-Duhou, 1999; Briggs and Wohlstetter, 2003;
UNESCO, 2004). The delegation of management
functions to schools in Central Asian countries
in recent years has been hampered by a lack of
programmes to develop school staff capacity for
the additional responsibilities involved (Chapman
et al., 2005). One danger for equity that comes with
school-based management derives from the
unequal capacities of schools. In some cases,
schools that select themselves for school-based
management may have stronger planning capacity
than other schools and thus be better able to
secure access to resources (Cárdenas, 2008;
Reimers and Cárdenas, 2007). The upshot is that
schools with weak capacity and the greatest needs
may fall further behind.
Strong and committed school leadership. The EFA
Global Monitoring Report 2005 argued that strong
school leadership was a prerequisite for creating
a culture of school improvement (UNESCO, 2004).
Because school-based management increases
their responsibilities, head teachers often end up
spending more time on administration than on
leadership to support pedagogical initiatives and
quality improvements. In Nicaragua a common
feature of autonomous schools that succeeded
in reducing school failure and improving learning
Successful
devolution to
schools requires
strong school
leadership
and high-level
government
support
1 5 5
C h o i c e , c o m p e t i t i o n a n d v o i c e : s c h o o l g o v e r n a n c e r e f o r m a n d E FA

90
02
Education f
or A
ll G
lobal M
onitorin
g R
eport
C H A P T E R 3
outcomes was the principal’s leadership abilities
(PREAL and Foro Educativo Nicaragüense
EDUQUEMOS, 2008). Skilled head teachers can
take advantage of the opportunities autonomy
provides rather than getting buried in administrative
burdens. But the skills needed to maintain a
balance between such responsibilities are often
lacking, pointing to a need for any move towards
school autonomy to be accompanied by training
of head teachers for their new roles.
Sustained support from upper levels of
government. If the goal is to reduce disparities
in learning, upper levels of government need to
focus their efforts on schools with disadvantaged
learners. This means strengthening the schools’
institutional and technical capacity and ensuring
that teachers use their increased autonomy
effectively. There should be feedback mechanisms
that link monitoring through school supervision
to the provision of pedagogical support, including
staff training (an issue discussed in the section
below on governance of teachers and monitoring).
Building financial capacity: the role of school grants
Autonomy without financial capacity is a general
prescription for weak governance. To be effective,
schools taking on new responsibilities need
sufficient financial and human resources to meet
those responsibilities.
Some countries have attempted to build school
capacity through school grant programmes.
Disbursed and allocated in a variety of ways, grants
can be used to achieve a wide range of goals in
areas such as education quality and equity. In some
cases disbursement is tied to development of a
strategic plan to achieve agreed goals in areas such
as quality (Espínola, 2000; Nielsen, 2007). In others,
grants are geared towards the provision of specific
services and inputs.
Uses for school grants range from upgrading
infrastructure to contracting additional teachers.
Grants provided under the PEC in Mexico have been
used mainly for improving infrastructure and
acquiring school materials rather than changing
teaching practices or working with parents
(Yoshikawa et al., 2007). Participation in the
programme is associated with overall improvement
in school progression although differences in
capacity have contributed to inequalities (Skoufias
and Shapiro, 2006; Box 3.6). In Brazil there is
evidence that the School Development Plan and
School Improvement Projects under the Fundo
School grants
need to be
predictable,
timely and
adequately
funded
1 5 6
Box 3.6: Planning for strengthened school autonomy in Mexico
Introducing school-based management in anenvironment marked by deep capacity inequalitiesbetween schools is unlikely to enhance equity. The Programa Escuelas de Calidad (PEC) in Mexicohas attempted to strengthen support for its mostdisadvantaged areas, but has encountered problemslinked to weak capacity.
The PEC aims to increase school autonomy andstrengthen performance. Schools compete forgrants, which are provided for up to five years to improve pedagogical practices, encouragecollaborative work between teachers, parents and school authorities, and improve planning in pre-schools and primary schools.
Though the intent is to encourage participation by disadvantaged schools, in practice the initialallocations were skewed against the poorestcommunities and the worst-performing schools. The schools were often the least equipped to makesuccessful applications, even though they were in greatest need of support.
To apply to the PEC, a school must prepare aStrategic Transformation Plan. This requires a levelof organizational capacity often lacking in schoolswith many disadvantaged students. Differences inthe priorities set out in school plans also haveimportant implications for outcomes. Rural andindigenous schools participating in the programmeare likely to use the funds for infrastructure andmaterials instead of pedagogical improvement. As a result, the quantity and quality of physicalinputs and materials have generally improved morethan the quality of the education process.
The overall record of the PEC remains problematic.While it has made available technical andsupervisory support that has improved quality inparticipating schools, the support has been greaterin wealthier states and at more advantaged schools.Instead of reducing gaps between less and moreadvantaged children, the initiative risks amplifyinginequalities.
Sources: Bracho (2006); Murnane et al. (2006); Reimers and Cárdenas (2007); Yoshikawa et al. (2007).

R A I S I N G Q U A L I T Y A N D S T R E N G T H E N I N G E Q U I T Y: W H Y G OV E R N A N C E M AT T E R S
de Fortalecimento da Escola (FUNDESCOLA) are
associated with increased availability of learning
materials. For schools in FUNDESCOLA that have
managed to increase spending, evidence indicates
some improvement in learning outcomes
(Carnoy et al., 2008).
School grants do not automatically produce positive
results. To be effective, they need to be predictable,
timely and large enough to cover the activities in
the strategic plan. These conditions are not always
in place. In Nepal, a school improvement plan is
a condition for the release of government block
grants, but funds are very limited. Inadequate grant
transfers can have adverse implications for equity.
In the case of Nepal, there is evidence that
underfinancing has led to parents being asked
for the funds to recruit teachers and meet other
basic needs (Vaux et al., 2006).
Involving parents and communities in school management
In the Dakar Framework for Action, governments
pledge to ‘develop responsive, participatory and
accountable systems of educational governance
and management.’ The devolution of authority to
schools and local communities is seen by many as
a means to this end. Whatever the intrinsic merits
of devolution, its implications for parental and
community participation are not straightforward.
Moves towards greater school autonomy are often
accompanied by the creation of formal structures,
such as school committees, village education
committees and parent-teacher associations, to
facilitate parental and community involvement in
school management. The terms of engagement
and the distribution of authority between schools
and parents vary, with important implications for
decision-making structures. But whatever the
arrangements, formal devolution does not override
deeply entrenched imbalances in power linked
to wealth, gender and other factors.
The transfer of decision-making responsibility
from central governments to ‘user groups’ has
been a recurrent theme in areas such as health
and water provision as well as school management.
Numerous development programmes have aimed
to empower the poor by transferring authority to
village-level associations. In many cases, the effect
has been to concentrate power in the hands of
affluent and powerful members of society, with
local elites dominating decision-making and
capturing the lion’s share of resources (Mosse,
2004). Education has not been immune to the
effects of ‘elite capture’.
Parental participation: some voicesare louder than others
While schools may officially have formal structures
designed to facilitate community and parental
involvement, there is often a large gap between
intent and outcome. Membership of these bodies
may or may not be representative. And they may or
may not facilitate influence over decision-making.
To the extent that cross-country evidence is
available, it suggests that in both developed and
developing countries the direct involvement of
parents in school affairs is limited (OECD, 2007b;
Zhang et al., 2008). Even when parents nominally
participate in school management, they may have
a limited say. In some contexts ‘participation’ is
confined to raising money, with limited influence
over how it is used. Research in some West African
countries is instructive. It shows that parent
associations have only nominal control over the use
of financial resources – much of which they have
contributed – because they lack the capacity to
exercise control (Lugaz and De Grauwe, 2006).
Evidence from Cambodia points in a similar
direction. There the devolution of authority to
schools is backed by the creation of local school
support committees. Comprising community
members and the school principal, the committees
are charged with monitoring children’s progress,
increasing enrolment, developing school
improvement plans and monitoring the
management of operational budgets allocated
by the Priority Action Programme. However,
a Public Expenditure Tracking Survey reveals
that the committees have not been effective,
that few parents know about the funds and that
parental representation is limited (Shoraku, 2008;
World Bank, 2005a).
Representation is an important component
of participation. Having a voice on a school
management committee implies either a direct
presence or the delegation of authority through
a democratic process. In practice, community
representation is often just one of the
considerations shaping the committee profile.
Formal and informal eligibility rules can create a
barrier to equitable representation. In Pakistan’s
Transferring
decision-making
to village-level
associations often
concentrates
power in the hands
of local elites
1 5 7
C h o i c e , c o m p e t i t i o n a n d v o i c e : s c h o o l g o v e r n a n c e r e f o r m a n d E FA

90
02
Education f
or A
ll G
lobal M
onitorin
g R
eport
C H A P T E R 3
Punjab province, membership of school councils for
rural public-sector elementary schools is divided
along socio-economic status and gender lines:
most members are men of high socio-economic
status, even for girls’ schools. Members of school
management councils are meant to be elected, but
they are often appointed by principals, who choose
people with relatively high education, wealth or
social status, partly because of the social networks
they can bring to benefit the schools (Khan, 2007).
If participation is to enhance equity, the poor,
marginalized and disadvantaged need to be not
just adequately represented but actively engaged.
They have to be able to articulate their concerns
and to influence decisions. In many cases this
implies a change in power relationships. It also
requires the design of governance structures that
empower poor households. Unfortunately, school-
based management reforms seldom address this
issue of ‘voice’ explicitly. Programme design often
just assumes that devolved authority is inherently
more equitable.
Evidence from several countries suggests that far
more attention needs to be paid to the conditions
for participation. Many factors influence ‘voice’,
including parental socio-economic status, education
level, race, caste and gender (Dunne et al., 2007;
Educational Research Network for West and
Central Africa and USAID, 2002; Khan, 2007; OECD,
2006a). For example, people who are chronically
poor, of low caste or from an indigenous minority
may have little experience of articulating concerns
in a forum including wealthier community
members. A study in India of participatory decision-
making in local government found landless
labourers far less likely than others to participate in
meetings (Alsop and Kurey, 2005). Two factors were
critical in weakening their voice. First, economic
dependence on landed groups, combined with their
low caste, was seen as a constraint on dissent.
Second, education and access to information were
significantly associated with participation. On a
constructed scale of participation, someone with
ten years of education was 27% more active than
someone with no education.
The terms of dialogue on school management
boards can reinforce the marginalization of the
poor. One study reviewing parental participation
in the management of rural schools in South Africa
found that the language employed, the use of
technical jargon and ways of addressing the parents
all affected participation. This might explain why
a survey in Gauteng province found that, despite
a general view that parental participation had
increased, real participation remained limited:
only 10% of parents had voted in elections for
the boards (Naidoo, 2005).
Any assessment of the role of participation
has to start by asking what is being assessed.
Participation is viewed by many as a goal in its own
right. But for most parents the ultimate aim of any
involvement in school management is to improve
children’s education. Formal participation and
consultative arrangements may not facilitate
achievement of this goal. Participants may have
limited knowledge about issues under discussion,
such as school performance and teaching
practices. Parents may lack the expertise or
confidence to appraise approaches to pedagogy
or curriculum effectively. Poor, illiterate parents
with limited school experience are at a particular
disadvantage. One possible approach, when many
parents lack the time and basic literacy skills
to participate effectively, is to train community
volunteers to support children’s learning (Box 3.7).
If real participation, rather than the creation of
formal participatory structures, is the ultimate aim
of policy, then many current approaches to school
Poor, illiterate
parents may lack
the expertise
and confidence
to evaluate
approaches
to teaching
or curriculum
design
1 5 8
Box 3.7: Community involvement in Uttar Pradesh
The Sarva Shiksha Abhiyan (Universal Elementary Education)programme in India gives a prominent role to village educationcommittees. Each committee comprises three parents, the principalof the village school and the head of local government. Its tasksinclude monitoring school performance. Despite the committees’prominence in education policy, most parents are either unawarethat the committees exist or do not realize that they can beinvolved in school affairs. Furthermore, many committee membersare not aware of the options they have to improve school quality.
Would improved access to information make a difference in theireffectiveness? A project by the Indian NGO Pratham in UttarPradesh suggests that information is only part of the story. Prathamcarried out interventions aimed at encouraging greater participationby village members in the monitoring and improvement ofeducation. It reported, however, that even mobilizing communities,spreading information about the village committees and informingpeople about their potential to improve the quality of schooling,were not enough to induce effective participation and improvechildren’s learning. Far more effective was the training of volunteersto conduct reading classes for village children.
Sources: Banerjee et al. (2006); Banerjee et al. (2008); Pritchett and Pande (2006).

R A I S I N G Q U A L I T Y A N D S T R E N G T H E N I N G E Q U I T Y: W H Y G OV E R N A N C E M AT T E R S
management have to be rethought. The idea that
the devolution of authority to parents, schools
and communities is inherently pro-poor is not well
grounded. One of the defining characteristics of
poverty and marginalization in many contexts
is precisely that those affected lack an effective
voice. That is why central and local governments
should ensure that moves towards devolution are
backed by measures aimed at facilitating real
participation. Such measures might include
affirmative action in areas such as representation
of, say, women or people of low caste. At the same
time government agencies should manage
devolution to ensure that powerful groups with a
strong voice do not introduce policies – on school
fees, for example – that might have damaging
implications for equity.
Choice and competitionin education provision
In standard economic theory, choice and
competition are two of the most powerful drivers
of efficiency, with the spur of the market acting
to raise productivity and enhance welfare.
Few people see education provision as directly
comparable with the production of market goods
and services. But competition and its corollary,
choice, are increasingly viewed as antidotes for
the failings of public education systems in relation
to learning standards and equity gaps.
This theme is at the centre of some of the most
heated controversies about education governance
reform. In the United States, much of Europe
and parts of the developing world, the topic divides
political parties and can generate polarized
debates. Underlying the debates are strongly
held views and questions about the proper role
of government in education provision, the place
of non-state providers and the rights of parents
to choose.
What do choice and competition in education mean
in practice? In almost all countries, the ultimate
responsibility for school systems resides with the
state. Governments set policy, curriculum and
standards, and are responsible for assessment
and the regulation of the system as a whole.
Within this framework, however, many approaches
are possible. In broad terms, education service
delivery can be broken down into four types,
depending on who owns and manages schools,
and who finances them (Table 3.9).
Governments play a key role in defining the
parameters of choice. They can provide financial
support to private providers, either directly or in
the form of financing arrangements that allow
parents to send children to private schools. Since
the early 1990s Sweden has used a voucher-type
system to give parents the right to take children
out of state schools, put them in independent
schools and take state funding with them. In some
states in the United States, authorities distribute
vouchers to parents who can use them to finance
the transition of their children to private schools.
Another approach is to contract the management
of government provision to the non-state sector.
For example, other American states have sought
to increase competition by encouraging the
development of charter schools. Several European
Union countries, including parts of the United
Kingdom, also follow this model, in effect
substituting private management for state
management while retaining public finance.
In all these cases, governments have developed
public-private partnerships to facilitate choice
and competition. Not all competition involves such
partnerships (see the discussion below of low-fee
private schools that operate independently of state
control or support), but they are a powerful force
in governance reform. To what extent is this good
news in terms of improving the overall quality of
education and enhancing equity?
As in the case of school-based management, there
is no simple answer. Experiences and outcomes
have varied. Once again, context is important. It is
one thing to introduce vouchers in Sweden, which
offers high-quality public education for all, and
quite another in Pakistan, which does not. What
makes sense in Chile may be entirely inappropriate
for Burkina Faso. Institutional capacity, levels of
Competition
and choice are
increasingly
viewed as
antidotes for the
failings of public
education systems
1 5 9
C h o i c e , c o m p e t i t i o n a n d v o i c e : s c h o o l g o v e r n a n c e r e f o r m a n d E FA
• Vouchers to parents • Subsidies to private schools • Contracting management to private operators (e.g. charter schools)
• Purely private schooling: low-fee to elite
Purely government schooling
User fees for government schooling
Table 3.9: Responsibilities of the public and private sectors in provision and financing
of education service delivery
Source: Adapted from Patrinos and Sosale (2007).
Public provision Private provision
Public finance
Private finance
90
02
Education f
or A
ll G
lobal M
onitorin
g R
eport
C H A P T E R 3
inequality and the effectiveness of education
planning all play an important role in defining
governance reform options.
One problem with the current debate on education
governance is that insufficient attention is paid to
evidence and context. There is a widespread
tendency to draw far-reaching public policy
conclusions from a weak evidence base (Lubienski,
2008). The importance of national circumstance is
often forgotten. Advocacy for increased competition
and choice in the developing world makes repeated
reference to programmes in high-income and some
middle-income countries – voucher systems,
charter schools and other public-private
partnership arrangements (Patrinos and Sosale,
2007). Quite apart from the fact that such
governance reforms have been highly contentious
in rich countries and that the evidence on their
impact is uncertain, little attention is paid to key
questions of institutional capacity in poor countries.
School choice and achievement — strong claims, weak association
The idea that increased parental choice leads to
improved learning outcomes has intuitive appeal
but is not well supported by evidence. While there
may be good reasons to allow parents greater
flexibility in selecting schools, the assumption
that this will raise standards is questionable.
The evidence in favour of public-private
partnerships is not clear-cut even in the developed
world. One study using data from thirty-five
countries claimed that private providers using
public funding delivered the largest gains in
learning outcomes (Wößmann, 2006). However,
interpretation of this exercise is open to question
since the results were largely driven by scores in
just a few countries, notably Belgium, Denmark
and the Netherlands.
Another study, based on analysis of data from the
PISA 2006 assessment, found that around 60% of
students in mainly OECD countries had a choice
between two or more schools. Results of a
modelling exercise showed that students at the
schools competing with other schools in the same
area did perform better in terms of average test
scores. The effect disappeared when demographic
and socio-economic factors were accounted for,
however; and effects on both equity and quality
were muted. As the PISA analysis puts it: ‘Whether
students are in competitive schools or not does not
matter for their performance when socio-economic
factors are accounted for. ... None of the factors
related to parent’s pressure and choice were found
to have a statistically significant association with
educational equity’ (OECD, 2007b, p. 236). One of the
most detailed reviews of the impact of choice and
competition for part of the United Kingdom reaches
a broadly similar conclusion. Focusing on primary
schools in the South-East of England, the study
assessed test scores on the basis of parental
choice (defined in terms of location) and school
competition for a fixed pool of students. It found
that neither choice nor competition had a bearing
on test results (Gibbons et al., 2006).
Some of the most detailed evidence on school
competition and learning achievement comes from
the United States and Chile. Both countries have
been in the forefront of governance reforms aimed
at expanding choice. Measured in terms of learning
achievements, the outcomes have been mixed.
Assessing these learning achievements is difficult.
Consider first the charter school experience in the
United States. Such schools represent a hybrid
approach to provision in which the public sector
gives funds to private organizations to establish
and manage schools independently of state
administration while meeting certain conditions set
by the state (Lubienski, 2008). During the 2004/2005
school year charter schools served around 1 million
students in forty states and the District of Columbia
(Education Commission of the States, 2008;
US Department of Education, National Center for
Education Statistics, 2007), or just over 2% of total
American public-sector school enrolment (Center
for Education Reform, cited in Lubienski, 2008). The
broad aim is to improve performance by removing
many of the rules binding regular public-sector
schools and by introducing competition. Because
the schools’ characteristics are determined by state
law, the diversity of arrangements is immense –
making comparison far from straightforward.
Although charter schools cater disproportionately
for African-American students in several states, the
percentage of those from better-off households is
also higher than in regular public-sector schools.
Evaluations of the impact of programmes aimed
at increasing choice, including through charter
schools, have found widely disparate results. Some
commentators have identified positive effects on
learning in some states (Hoxby and Murarka, 2008).
Other research finds little benefit.
Advocacy for
increased
competition and
choice in the
developing world
makes repeated
reference to
programmes in
high-income
countries
1 6 0

R A I S I N G Q U A L I T Y A N D S T R E N G T H E N I N G E Q U I T Y: W H Y G OV E R N A N C E M AT T E R S
Using a national data set to examine mathematics
achievement at grade 4, one evaluation found
charter school students to be performing
significantly below their public-sector school
counterparts (Lubienski and Lubienski, 2006,
cited in Lubienski, 2008). Another study found
similar results for reading (Braun et al. 2006, cited
in Lubienski, 2008). Still another found the overall
charter school effect on African-American students
to be negative (Carnoy et al., 2005). To the extent
that any conclusion can be drawn, it is that
generalizations are not warranted on the basis
of the available evidence. Findings are heavily
influenced by localized contexts and by the
evaluation methodology used.
Flagship programmes aimed at expanding choice
have also produced little compelling evidence that
choice makes a difference. The 2001 No Child Left
Behind Act (see section below on teachers and
monitoring) contains a federal mandate in favour
of school choice: parents can transfer their children
from schools that repeatedly fail to meet targets
of academic progress to non-failing public-sector
schools in the same district. Students who opted
to change schools under this provision showed
no significant gains after two or more years
(Zimmer et al., 2007).
The United States experience with school vouchers
is also ambiguous. Research has identified positive
effects on student achievement in some subjects
after children switched schools, but not in others,
with effects usually emerging after some time
(Molnar, 1999; Rouse, 1998). Meanwhile, small
private voucher programmes introduced in Dayton
(Ohio), New York City and Washington, DC, in the
late 1990s resulted in improved test scores for
African-American students but not for other groups
(Peterson and Howell, 2006).6 One review of the
Washington, DC, district-wide voucher programme,
conducted two years after its initiation, found no
significant impact on the academic achievement
of public schools (Winters and Greene, 2007).
It might be argued that the outcomes of small
voucher programmes are sensitive to levels of
competition and to time horizons. Such programmes
could generate small initial effects, with benefits
increasing with the level of competition and over
time. Evidence from the Milwaukee Parental Choice
Programme, the longest-running voucher scheme
in the country, lends some weight to the proposition
that there are long-run competition effects. In this
case, there is some evidence that public-sector
schools with high levels of student eligibility for
vouchers have raised their standards – an outcome
interpreted by some as evidence that the risk
of losing students has created incentives for
more efficient teaching (Chakrabarti, 2007; Hoxby,
2003). Evidence from other states, however, is
inconclusive: partly positive in Florida, negative in
Michigan, insignificant in California, North Carolina
and Texas (Arsen and Ni, 2008; Miron et al., 2008;
Ni, 2007). At best, the overall results are muted.
As one commentator put it: ‘If any general finding
is available it is that advantages to academic
outcomes stemming from voucher programmes
are at most notably modest, and also certainly
do not rise to the level anticipated by the early
optimistic assumptions’ (Lubienski, 2008).
In the developing world Chile is often viewed as
a standard-bearer for choice-based governance
reform. It has had a nationwide system of school
vouchers for over two decades. Yet here, too, the
results have been disappointing (Box 3.8).
The United States and Chilean experiences provide
no definitive evidence in favour of choice and
competition. Experience in Sweden has been more
positive (Box 3.9). There, increased choice and
competition have led to expansion of independent
private schools, albeit from a low base. Importantly,
though, reform in Sweden was not prompted by
a chronically underperforming public system.
Moreover, it was introduced in a country with
relatively low levels of inequality and strong
regulatory institutions. While the Swedish model
provides useful insights and lessons, there are
limits to its exportability to developed countries
with greater social polarization and failing public
education systems – and even stronger limits to
its relevance for developing countries.
Choice, competition and inequality
Choice and competition are often presented in
education governance debates as drivers not only
of efficiency improvements but also of enhanced
equity. The fact that competition by its nature
creates losers as well as winners is sometimes
forgotten. This has specific consequences in
education where losers are students remaining
in underperforming schools while the winners
are those with parents who have the motivation,
information, resources or connections to secure
transfers to schools of better quality (Arsen and Ni,
2008). One obvious question that arises is whether
6. Other studies have shownthat the results are sensitiveto the way race and ethnicityare measured and to how thesample for the baseline datais constructed (Krueger andZhu, 2002).
Flagship
programmes aimed
at expanding
choice have
produced little
compelling
evidence that
choice makes
a difference
1 6 1
C h o i c e , c o m p e t i t i o n a n d v o i c e : s c h o o l g o v e r n a n c e r e f o r m a n d E FA

90
02
Education f
or A
ll G
lobal M
onitorin
g R
eport
C H A P T E R 3
governments should allow choice to be exercised
on terms that leave many behind. Governance
reform that aims to expand school choice without
building in protection for equity carries an inherent
risk of school systems becoming sources of
widening disparities.
School choice can exacerbate inequalities in many
ways. If high-performing schools are allowed to
select students on the basis of measured ability
at a given age, disadvantages linked to income
or ethnic background are magnified. Students
with high levels of inherited disadvantage end
up concentrated in the worst-performing schools.
The same thing can happen if high-performing
schools are allowed to select students when total
applications exceed places (Epple et al., 2004).
Evidence from the OECD is instructive: cross-
country research shows that countries with highest
levels of school choice tend to be more socially
segmented (OECD, 2007b). In Chile too, the student
composition of schools is marked by rigid divides.
Municipal schools largely enrol students from lower
socio-economic groups, while private independent
schools draw pupils almost entirely from higher
ones (González, 2008). Parent surveys show that
active choice in school selection is strongly
associated with higher socio-economic status and
that parents making active choices tend to choose
schools with a more homogeneous demographic
composition (Elacqua, 2004).
Inequalities associated with school choice interact
with wider inequalities in society. People who are
poor, marginalized or illiterate may lack access
to information to enable them to make choices.
Research in the United States shows that parents
with wider social networks and more access
to information are more likely to take advantage
of choice policies and that they are better able
to ensure that their children enter the higher-
quality schools they select (Goldring and Rowley,
2006; Lacireno-Paquet and Brantley, 2008).
Where private school enrolment is expanding and
attracting a large share of children from the middle
class, which can include many of the most
motivated students and most active parents, public
education stands to lose a powerful constituency
with a strong political voice in claiming financial
resources. The economist Albert Hirschman
identified the phenomenon of middle-class exit
from public education systems as a threat to school
quality and equity as a major problem some four
1 6 2
Box 3.8: Chile’s experience with choice and competition:
no advertisement for the governance reform blueprint
Increased competition between schools has been just oneelement in Chile’s education governance reforms. A partial list of wider measures includes devolution to municipal level in many areas of management, increased use of exams andassessment to monitor performance, increased funding (since the return of democracy in 1990), performance-relatedincentives for teachers and the lengthening of the school day.The reforms have led to large gains in education coverage,especially at secondary level, and they have made Chile a widely-cited ‘model’ for governance reform.
Outcomes for learning achievement and equity have been far from impressive. Private schools with public subsidies doregister an advantage over municipal schools on the yardstickprovided by fourth-grade standardized tests. However, thefindings are reversed when the socio-economic characteristicsof schools are taken into account. In other words, there is no equalizing effect. Municipal schools do a better job thanprivate schools of lifting the achievement of students in the lowest group. Only among students in the middle socio-economic group do private subsidized schools have higherassociated test scores.
Analysis of international assessment data over time also callsinto question Chile’s credentials as a governance success story.Governance reforms have certainly done little to close the gapbetween Chile and the developed world. For example, while thePISA reading assessment shows 32% of 15-year-old students in OECD countries scoring in the top two levels, only 6% ofstudents in Chile do so. National standardized achievementtests show little improvement over time, even in primaryeducation, where enrolment has been near universal since theearly 1970s. The TIMSS assessment of 2003 told roughly thesame story of poor performance as in 1999, with Chile failing tocatch up with countries such as Egypt and Thailand — neither ofwhich has been in the front rank of reformers. And Chile retainssome of the starkest education disparities in Latin America,with large gaps in test scores persisting between students in municipal schools, which serve students primarily from socio-economically disadvantaged backgrounds, and privateschool students.
While Chile’s experience with education governance reform isoften held up as a model, Chileans themselves have been morecircumspect. The government is embarking on a new wave of reforms with a more explicit focus on equity. Secondaryschool students have responded not with enthusiasm for pastgovernance reforms, but with street protests over poor qualityand highly unequal education provision. After more than fifteenyears of education reform under a democratic government andten years before that under the military government, Chileremains a weak advertisement for the governance reformblueprint favoured by many governments and aid donors.
Sources: Bellei (2005); Contreras (2001); Crouch and Winkler (2007);González (2008); Mizala and Romaguera (2000); Mizala et al. (1998);Sapelli and Vial (2002); Tokman Ramos (2002); World Bank (2007a).

R A I S I N G Q U A L I T Y A N D S T R E N G T H E N I N G E Q U I T Y: W H Y G OV E R N A N C E M AT T E R S
decades ago (Hirschman, 1970). Evidence from
many countries suggests that he was right. Today
there is a real danger in many countries that
poorly managed ‘quasi-markets’ in education
with an enlarged role for choice and competition
will leave public education systems trapped
in a downward spiral of underinvestment, poor
quality of provision and widening inequalities.
There are important respects in which choice
and competition have enjoyed an exaggerated
press. In most countries, governments continue
overwhelmingly to dominate education provision,
finance and management, especially at the
primary level. However, advocates of choice
and competition continue to exercise a marked
influence on education governance reform
debates in the developed world and – increasingly
– the developing world.
The evidence and issues at stake need to be
carefully weighed up. While analogies with markets
may have some effect in the context of political
debate, their relevance to the real world of
education is questionable. Schools are not allowed
to go ‘bankrupt’ and no government can allow
schools to fail – the social, economic and political
stakes are too high. Similarly, no government
with a concern to protect basic citizenship rights
can allow disadvantaged children to be further
marginalized through competitive choice.
Assertions to the effect that school competition
creates ‘a rising tide that lifts all boats’ (Hoxby,
2003, p. 288) are not substantiated by cross-country
evidence. Simultaneously raising achievement
and strengthening equity needs good governance
supported by strong institutional arrangements –
and it requires political leadership in tackling
poverty and inequality.
There is a real
danger that an
enlarged role
for choice and
competition will
leave public
education systems
in a downward
spiral of under-
investment,
poor quality
and widening
inequalities
1 6 3
C h o i c e , c o m p e t i t i o n a n d v o i c e : s c h o o l g o v e r n a n c e r e f o r m a n d E FA
Box 3.9: Swedish lessons in competition: not readily exportable
The Swedish school system is marked by strongachievement in international learning assessmentsand high levels of equity. Since the early 1990s, thecountry has introduced radical and wide-rangingeducation governance reforms, with more extensivepower devolved to the local level as a core objective.The ‘Swedish model’ is frequently held up as ablueprint for others to follow. Is this justified?
Expanded parental choice is a central pillar of reform in Sweden. Since the early 1990s parents have had the right to send their children toindependent schools. Public funding follows thechildren. Independent schools are closely regulated: they cannot select pupils by ability or charge fees and they follow national curricula.
Independent schools have been spreading in someparts of the country. By 2007 there were nearly 1,000of them, providing for about 9% of children aged 7 to 16 and 17% of those aged 16-plus. At lower levels,many of these schools provide for children withlearning difficulties. Higher-level schools often providevocational training. Initially a source of intensepolitical controversy, independent schools today enjoy broad support.
Private school providers have clearly responded toparental demands in important areas of education.Evaluation results on the standard academiccurriculum suggest that growth in independent schoolenrolment has been associated with improvedachievement in mathematics. The impact on equity
is less clear-cut. Positive achievement effects have not been observed for students with less educatedparents, or for foreign-born students.
The Swedish experience of governance reformprovides valuable insights and lessons. There haveclearly been important benefits. However, none of this means that the ‘Swedish model’ is an exportableblueprint, or that the model itself is as far-reaching as is sometimes assumed.
Despite the incentives for the private sector provided by the reforms, independent schools stillcover only a minority of students and their presencevaries widely by municipality. Many municipalitieshave no independent schools; their presence is mostvisible in urban centres. The transferability of thereforms is questionable. Sweden has relatively lowlevels of inequality: an emphasis on equality is deeplyembedded in society. Governance reform andcompetition were not introduced in the context of a national crisis in public education but rather weredriven by a desire for diversity in the school system.Public schools continue to offer all children the optionof a good education. The country also has a highlydeveloped institutional capacity for regulation andoversight of private providers at the central level.Many of these conditions are absent in otherdeveloped countries, let alone much of thedeveloping world.
Sources: Björklund et al. (2004); Böhlmark and Lindahl (2007);Sandström and Bergström (2005); Swedish National Agency for Education (2008).

90
02
Education f
or A
ll G
lobal M
onitorin
g R
eport
C H A P T E R 3
Low-fee private schools: symptom of state failure
Debate over the role of public-private partnerships
can divert attention from pressing concerns.
Unplanned growth in private schooling for the poor
in some parts of the world is symptomatic of an
underlying malaise: underperformance, or outright
failure, of public providers.
The previous subsection looked at choice within
the formal education governance structure.
In developing countries, however, millions of
households are exercising choice outside that
structure. While private schools affordable only
to middle-class and high-income groups continue
to play an important role, new patterns of private
provision are emerging.
Even a cursory observation of education
provision in slums from Hyderabad to Nairobi
demonstrates that private provision in some
developing countries is no longer the sole preserve
of the rich. Private primary schools charging
modest fees and operating as small businesses,
often with neither regulation nor support from
government, are changing the education landscape.
Whatever the formal education policy may be,
a growing marketplace in education provision
is appearing by default. The rapid emergence
of low-fee private schools is reflected in wider
education governance debates.
Some observers see the growth in this sector
as a potentially powerful force for greater equity
and expanded opportunity. Guidelines written for
USAID to inform its investment in private primary
schooling provide an illustration: ‘The private
sector… has played a critical role in meeting
the needs of disadvantaged groups and has the
potential to further increase access and equity.
Private provision of education is more effective
in terms of student achievement on standardized
tests and is an effective alternative to publicly
provided education’ (Chandani et al., 2007, p. 6).
In a similar vein, the World Bank’s 2006 Education
Sector Strategy Update signals a commitment
to promote an enlarged role for the private sector
in reaching the poor: ‘Increased competition
among public and private education institutions
(for example, through new methods of public finance
that shift education decisions to private households)
is providing more incentives to improve quality.
The Bank can help countries investigate the market
for education, develop an enabling environment
for private participation and competition, and align
private provision whenever possible with equity
principles laid out in national education strategies’
(World Bank, 2005b, p. 34). Some advocates of
more radical privatization options have called on
governments and donors to use public financing,
vouchers and other public-private partnership
arrangements to open the door to a large-scale
exit from public provision (Tooley, 2007).
As in other areas, sweeping recommendations
have been weakly grounded in evidence. Clearly,
unplanned growth in low-fee private primary
schools is responding to real demand. Many poor
people are voting with their feet and their meagre
incomes to leave public provision. The important
question for public policy is whether governments
should use financial resources to accelerate that
trend, or resolve the underlying problem driving it:
namely, the failure of public education systems to
meet the needs of the poor. Given that nine out of
ten primary school children in developing countries
attend public-sector schools, the overwhelming
priority should be to improve their standards and
accessibility rather than to channel public finance
into the private sector.
Provision expanding but difficult to measure
Estimating the size of the low-fee private sector is
intrinsically difficult because documentation is poor,
institutions are typically unregistered and national
administrative data provide only a very partial
account. Even so, observation and anecdotal
evidence suggest the sector is growing rapidly in
many developing countries.
The extent of its expansion varies. Evidence from
countries as diverse as Ghana, India, Kenya, Nigeria
and Pakistan points to rapid growth. In urban India,
around 96% of the total increase in primary
enrolment between 1993 and 2002 is estimated
to be due to growth in private schools unaided
by government. While growth in private enrolment
was slower in rural India, it still accounted for 24%
of the increase in rural areas (Kingdon, 2006).
In Pakistan’s Punjab province, one in every three
children enrolled in primary school studies in a
private school (Andrabi et al., 2006). Nigeria has
also witnessed prolific growth in low-fee private
schooling. It is estimated that in parts of Lagos
state, three-quarters of the children in school are
enrolled in registered and unregistered private
In some
developing
countries,
low-fee private
schools are
changing the
education
landscape
1 6 4
R A I S I N G Q U A L I T Y A N D S T R E N G T H E N I N G E Q U I T Y: W H Y G OV E R N A N C E M AT T E R S
schools. According to one (admittedly speculative)
study, incorporating students enrolled in
unregistered private schools into administrative
data would reduce the proportion of those out of
school from 50% to 26% (Tooley and Dixon, 2007).
These figures should be interpreted with caution.
The fact that a country has many low-fee private
school providers in slums is not a sound basis for
extrapolation to rural areas with more dispersed,
and often much poorer, populations. National
averages can also give a distorted picture of
coverage. One study in India finds that 28% of
rural people have access to a private school in
their village, and that half of the schools are
unrecognized. Variation among states, however,
is considerable: fewer than 1% of villages have
a private school in rural Gujarat and Maharashtra,
compared with over 50% in Rajasthan, Bihar, Uttar
Pradesh, Punjab and Haryana. In general, richer
states are more likely to have rural private schools
(Muralidharan and Kremer, 2006).
Questions of quality, accountability and affordability
Whatever the precise dimensions of the
phenomenon, low-fee private schools are clearly
an important element in education provision
for many poor households. And the sector is
expanding. Advocates of a bigger role for the
private sector see in these two observations
evidence that such schools are cost-effective,
affordable, less prone to teacher absenteeism than
public schools, better equipped to provide a good-
quality education and more accountable to parents
(Tooley and Dixon, 2007).7 Evidence to support
these wide-ranging claims is less emphatic than
the claims themselves. Available data does not
provide a robust base for meaningful large-scale
comparisons across or even within countries. The
findings of the most credible assessments point
to large grey areas in which parental motivation,
perceptions of quality and the availability of
alternative providers intersect to inform choice.
Parental perceptions and motivations. Parents
clearly would not pay to send children to private
schools if they believed government providers
offered better provision at an equivalent or lower
price, let alone for free. Parents send their
children to low-fee private schools because they
perceive an advantage, whether in the form of
reduced teacher absenteeism, greater pupil and
teacher discipline, and smaller class sizes.
These are not the only attractions, however.
The choice of low-fee private schools may also
be associated with aspirations for social mobility,
especially if the schools use English as the
medium of instruction (Rose, 2006; Srivastava,
2007). Detailed work on attitudes in Uttar Pradesh
state, India, shows parental motivation to be
complex (Box 3.10). Other research in the same
state finds that recourse to private providers is not
1 6 5
C h o i c e , c o m p e t i t i o n a n d v o i c e : s c h o o l g o v e r n a n c e r e f o r m a n d E FA
In India, some
families seek
access to a
low-fee private
school in order
to distinguish
themselves from
others within
their community
Box 3.10: Why poor households choose
low-fee schools in an Indian district
Why do low-income households, many with childrenwho are first-generation learners, choose for-profit,low-fee private schools even where a less costlystate alternative exists?
The reasons are complex, according to a qualitativestudy on low-fee private schools in LucknowDistrict of Uttar Pradesh state in India. Not allparents, particularly in rural areas, are convincedof the quality at low-fee private schools. While such schools are seen as a better option thangovernment provision, they were not necessarilyseen as being of acceptable quality. Rather thanbasing choice on the quality of education provided,however, some families seek access to a low-feeprivate school in order to distinguish themselvesfrom others within their communities. Lalita Bai, a rural migrant and wife of a labourer, whosefamily belongs to a scheduled caste, explained why she sent her daughters and sons to a low-feeprivate school: ‘Only those who are absolutelypenniless, the lowest of the low in society, can sendtheir children to government schools. Most peoplecannot bring themselves to send them there.’Some higher-caste families had a similarexplanation for why they found low-fee privateschooling important. Rambha Devi, a ruralgrandmother of four, said: ‘Only low-caste childrenattend government schools so no real schoolingtakes place there.’
The concerns expressed in these views arerevealing. They point to a disconcerting lack ofconfidence in public provision on the part of thepoor, coupled with a concern to maintain socialdivides on the part of some households. Theoverall findings suggest that there is an urgentneed to examine more closely the role of low-feeprivate schools in the context of achieving India’sEFA goals, including the wider social impact ofhousehold choices within increasingly socially and economically segmented schooling arenas.
Source: Srivastava (2006, 2008).
7. Teachers in low-feeprivate schools areusually recruited underconditions similar tothose of contractteachers in governmentschools, for whomsimilar arguments aremade regardingaccountability. See thesection on teachers andmonitoring.

90
02
Education f
or A
ll G
lobal M
onitorin
g R
eport
C H A P T E R 3
the same as trust, or an indicator for preferences
between providers. Interviews with parents reveal
a high level of mistrust of the private sector. The
most widely stated parental preference in this case
was for a properly functioning government system;
parents resorted to private school because they
felt they had no alternative (Härmä, 2008).
Assessing quality. Do low-fee private schools offer
an efficient route to improved education quality?
Data constraints rule out a general answer to
the question, but country evidence suggests that
caution is in order. There is evidence that in many
contexts private schools are outperforming state
schools. In parts of India and Pakistan, children
enrolled in low-fee private schools perform better,
on average, than those in government schools,
once adjustments are made for socio-economic
status and other variables (Andrabi et al., 2008;
Aslam, 2007; Das et al., 2006; Muralidharan and
Kremer, 2006; Schagen and Shamsen, 2007). This
does not mean government provision is necessarily
worse than private provision across the board.
Even in Pakistan, where the poor condition of
government education in general is widely
recognized, the top-performing public-sector
providers outperform private schools. The problem
is that there are many more poorly performing
government schools, in which learning outcomes
are considerably lower than in the worst private
schools. As one study concludes: ‘The only reason
the private schools look so good is that the poorly
performing public schools are so disastrous:
if at some future date, children actually started
demanding something more than the most
rudimentary education, the semi-educated
teachers in the private schools would actually find
it hard to cope’ (Andrabi et al., 2008, p. xiii).
Teacher accountability and parental participation.
It is widely argued that dependence on parental
finance makes low-fee private schools and their
teachers more accountable. Available evidence
does not lend clear support to this view.
In Pakistan, a survey in Punjab has suggested
that teacher absenteeism (one indicator for
accountability) is less of a problem in private
schools than in government schools. The study
found that head teachers reported 13%
absenteeism in the former and 8% in the latter.
By contrast, a more rigorous analysis of teacher
absenteeism in rural India, based on data collected
during unannounced visits to schools, reported
very little difference in teacher absenteeism –
around one-quarter of teachers were absent from
both types of school (Muralidharan and Kremer,
2006). In addition, a qualitative study in Lucknow
District of Uttar Pradesh, India, found low parental
participation and interest in the private schools,
which proprietors and households attributed to
parents’ low education levels and inexperience with
schooling. Interaction with the school was limited
to fee-related complaints rather than dealing with
concerns to do with education (Srivastava, 2007).
Affordability in perspective. Advocates for low-fee
private schools claim that they are affordable to the
poor. However, affordability is not a straightforward
concept. When poor households pay for education,
they divert income from other areas, including
nutrition, health, shelter and savings for
emergencies. Education expenditure by poor
households for low-fee private schools can be
viewed, as it is by some, as a market preference
freely expressed. Alternatively, it can be seen, with
more credibility, as an entry charge to education
paid by vulnerable households with two options:
paying for education through severe sacrifices in
other areas, or accepting that their children have
no opportunity for an education meeting minimum
quality standards. Evidence from a variety of
contexts illustrates the real trade-offs facing poor
households when they have to pay low-fee
providers:
In Hyderabad, India, a city with a fast growing
market for low-fee private primary schools, it
is estimated that a family living on the minimum
wage would have to spend roughly one-quarter
of its income to put three children through such
a school, even before taking account of additional
related costs for nutrition and other household
needs (Watkins, 2004).
In rural Uttar Pradesh, India, one survey puts the
total cost of educating four children (the average
family size) in a low-fee school at half the mean
annual salary for households in the lowest two
income quintiles. Unsurprisingly, most of these
households send their children to government
schools. Choice is limited to better-off
households. Those in the richest 20% of the
sample were almost eleven times more likely
to choose private schooling than families
in the poorest 20% (Härmä, 2008).
In urban Malawi, even the relatively modest fees
cited by owners of low-fee private schools
Even low fees
are a burden for
poor families
1 6 6

R A I S I N G Q U A L I T Y A N D S T R E N G T H E N I N G E Q U I T Y: W H Y G OV E R N A N C E M AT T E R S
(around US$3 per term in 2004) are beyond the
reach of poor households, even before taking
other costs of education into account. For the
two-thirds of the population living below the
poverty line, fees at this level would translate
to over one-third of available resources per
person per household (Kadzamira et al., 2004).
In Ghana’s capital, Accra, around 17% of total
enrolment in primary education is in the private
sector. But households in the rural north and
other areas where enrolment is already low are
far less likely to opt for private schools, since
school costs are already the major reason their
children are out of school. While private schools
are spreading in rural Ghana, it is mainly in
areas where fishing and trading are the main
occupations, not areas dependent on
subsistence farming (Akyeampong, 2008).
Households with livelihoods in the latter area
tend to be poorer.
Access and equity. Recourse to private schools
on the part of the poor is not an indicator for
equitable access. As noted, chronically poor
households may not be able to finance even
relatively low fees without suffering adverse
consequences. Locality is also a limitation on
equity. By definition, low-fee private schools will
be established only where enough parents are
willing to pay fees. As such markets are far more
likely in high-density urban areas than remote
rural areas, the schools could exacerbate the
rural-urban divide. In addition, significant gender
disparities have been observed with low-fee
private schooling. Parents lacking the resources
to send all their children to private school often
choose to send only some of them. Studies in
India and Pakistan find significant pro-male bias
in this choice (Aslam, 2007; Härmä, 2008;
Mehrotra and Panchamukhi, 2007). In India’s
Bihar state, 10% of all enrolled scheduled-caste
girls are in private schools that receive no public
funds, compared with 21% of upper-caste girls.
In Uttar Pradesh the respective shares are 16%
and 37% (Mehrotra and Panchamukhi, 2007).
Where there is no choice. While many poor
households are rejecting public provision by
switching to private providers, the extent of choice
is often exaggerated. People in some slums of the
Kenyan capital, Nairobi, do not have the option of
sending their children to government schools for a
very simple reason: there are none. The residents
of these informal settlements lack formal property
rights, so the government provides no basic
services in education (Box 3.11). State failure in
education provision in slum areas across many
countries has created a strong impetus for the
development of private school markets. Even where
children can travel to a school in a neighbouring
area, they often cannot enrol as they lack the
People in some
slums of Nairobi
do not have the
option of sending
their children
to government
schools for a very
simple reason:
there are none
1 6 7
C h o i c e , c o m p e t i t i o n a n d v o i c e : s c h o o l g o v e r n a n c e r e f o r m a n d E FA
Box 3.11: Government schools for the rich,
private schools for the poor in Kenya’s slums
Does the high incidence of low-fee private schoolsin slum areas reflect the power of choice in acompetitive market? Not in the Kenyan capital,Nairobi.
Over 60% of Nairobi’s population lives in slums.This population is crowded into just 5% of theresidential area of the city. Slums are marked byhigh levels of poverty and deprivation, and are not at first sight an obvious location for privateeducation provision. Yet a longitudinal studycovering two slum and two non-slum areas, with a total sample of over 13,000 children, finds thatchildren living in slum areas are more likely toattend private school. Conversely, children ofhigher socio-economic status were more likely to attend a government school: the richest 20% of households were more than twice as likely as the poorest to send their children to agovernment school.
The Kenyan study suggests that governmentschools are the preferred choice for richer, non-slum residents, while private providers are the onlyviable option for the poor. From the perspective ofthe poor, however, the choice is highly constrained.There are no government providers in some slums.Where there are government schools on theperiphery of the slums, they require an officialresidency title for entry. Because most slumdwellers lack legal property status, their childrenare excluded.
In this context, ‘choice’ is an inappropriatedescription of the parameters for decision-making.Parents ‘choose’ low-fee private providers becausethere is no alternative. It is not a positive choicebased on an assessment of the relative merits of different providers. Indeed, household surveysshow that parents complain about the privateschools, with staff shortages, congestedclassrooms and lack of teaching materialsidentified as common problems.
Source: Mugisha et al. (2008).
90
02
Education f
or A
ll G
lobal M
onitorin
g R
eport
C H A P T E R 3
necessary paperwork and residential eligibility.
Thus poor slum dwellers may find the only
schooling available to them is a low-fee private
school, while richer households have the choice
of attending a government school.
Governing low-fee private schools
Low-fee private schools are the subject of an often
polarized debate. Some advocates of increased
competition and of an expanded role in education
for the private sector see them as an alternative
to publicly financed and delivered provision. Critics
see them as a symptom of state failure. Whatever
the perspective, it is clear that the low-fee private
school sector is a response to demand and that it
is unlikely to shrink rapidly, let alone disappear, in
the foreseeable future. Governance of the sector
to advance the EFA goals is therefore a priority.
In many countries low-fee private schools
currently operate as a governance-free zone.
The schools have increased in number far faster
than the capacity of regulatory and management
regimes to ensure that their activity is aligned
with national policies. Malawi has only one person
in the education ministry responsible for school
registration, so small private schools effectively
remain outside the system (Kadzamira et al.,
2004). In India, compliance of low-fee private
schools with the rules and norms governing
teacher qualifications, teaching practices, the
curriculum and infrastructure is haphazard at
best, non-existent at worst (Kingdon, 2006). Even
where governments do regulate low-fee private
providers, the focus is often on assessment at
the time of school registration rather than regular
monitoring of performance and outcomes.
More effective management and regulation are
easier to advocate in principle than to deliver in
practice. Low-fee private providers tend to expand
most rapidly in areas where many government
schools are struggling to meet standards and
levels of poverty are often high. Nigeria, for
example, has stringent legislation on private-
sector regulation, including fines and even
imprisonment if providers do not comply with
regulations. Yet the states in which private
provision is most prevalent, such as Lagos,
find it almost impossible to enforce the legislation,
not least given the government failure to provide
alternatives for children whose schools would be
closed (Rose and Adelabu, 2007).
Public-private partnerships offer another
regulatory option. In principle, education
authorities can use financing and other measures
to generate incentives and enforce rules while
addressing concerns over equity. Pakistan’s
programme of public-private partnership is
an example. The government, with support
of donors, has embarked on a range of public-
private partnership projects aimed at addressing
long-standing problems in access and equity.
The problems are acute: Pakistan’s NER is 73%
for boys and 57% for girls. Not only are overall
enrolment levels lower than in poorer countries
such as Nepal and the United Republic of
Tanzania, but Pakistan is near the bottom of
the international league table for gender parity.
Large disparities between states, between urban
and rural areas and between richer and poorer
households are at the heart of Pakistan’s slow
progress in basic education. Low-fee private
providers are widely presented as a dynamic
force for change, though experience and
evidence point to the case for a more cautious
appraisal (Box 3.12).
Countries with more developed institutional
capabilities might be well placed to oversee
effective partnerships with low-fee private
schools. But the countries in which such schools
are flourishing are those with weaker institutional
capacity and tighter financial constraints.
For these countries, it is not obvious that public-
private partnerships involving management
relationships with large numbers of small private
providers will deliver progress towards a national
system based on uniform standards and equal
access for all. The question remains: why are
governments not using their capabilities to deliver
equitable and affordable public education?
There is no ‘one-size-fits-all’ model for effective
governance of low-fee private schools. The
overarching challenge for governments is to
develop strong national strategies for achieving
EFA and to ensure that all providers operate
within these strategies. The bottom-line obligation
of all governments, especially at the primary
school level, is to develop a publicly financed and
operated education system that offers the option
of good-quality, free education to all citizens.
The bottom-line
obligation for all
governments is
to develop
publicly financed
and operated
primary schooling
of good quality
for all children
1 6 8

R A I S I N G Q U A L I T Y A N D S T R E N G T H E N I N G E Q U I T Y: W H Y G OV E R N A N C E M AT T E R S
1 6 9
C h o i c e , c o m p e t i t i o n a n d v o i c e : s c h o o l g o v e r n a n c e r e f o r m a n d E FA
Box 3.12: In Pakistan, a questionable public-private partnership
The Government of Pakistan, with support of aid donors,has made public-private partnerships the ‘anchor’ of itsstrategy to address the challenges of education access,quality and equity. A 2004 policy paper spelled out thepremise underpinning the current policy framework:‘Government has officially recognized that the publicsector on its own lacks all the necessary resources andexpertise to effectively address and rectify low educationindicators.’
Low-fee private schools figure prominently in this strategy.Such schools are expanding rapidly in parts of Pakistan.Coverage is variable: there are more of the schools in therelatively prosperous Punjab province (where enrolment is already higher) than in rural Sindh or Balochistan, whichhave the lowest enrolment rates overall and particularlywide gender gaps (Figure 3.7). Although equity concernshave figured in the design of public-private partnerships,experience in Punjab illustrates just how difficult it can be to achieve more equitable outcomes.
The Punjab Education Foundation has been running two different but overlapping public-private partnershipmodels. Under an education voucher programme forselected slums, parents can use state funding for entry to low-fee private schools. Meanwhile, a FoundationAssisted Schools programme provides a per-child subsidyfor children enrolled directly in private schools in selectedhigh-priority areas. While there is some initial evidence of positive influence on enrolment and learning outcomes,serious problems have been identified:
Fragmented authority and inequality of financing.Responsibility for running public-private partnershipsrests not within the Ministry of Education but with
semi-autonomous education foundations that depend on their ability to raise external funds. Provinces such as the Punjab that are already in a stronger position in terms of education can benefit more because theyhave the possibility to recruit qualified staff, have morepotential NGO and private sector partners, and are a priority client for most donors.
Financial sustainability. Public-private partnershipmodels have been an important component ofeducation-sector World Bank loans in Punjab and Sindh.Their continuation and expansion is contingent onsustained donor support, as the Ministry of Educationhas so far not decided to mainstream the models. That support cannot be taken for granted.
Limited scope. Notwithstanding the internationalattention Pakistan’s public-private partnershipprogramme is receiving as a potential model for othercountries to follow, the school voucher programmereaches only 10,000 students and the FoundationAssisted Schools programme only 50,000 (PunjabEducation Foundation, 2008). This is in a country with2.7 million boys and 4.1 million girls out of school.
Whatever the course of public-private partnership projects,the majority of children from poor households in Pakistanrely on government provision — and will continue to do so.Reaching children who are not in school will requireexpansion of the public education system, with a farstronger focus on wealth, gender and regional inequalities.Chronic underfinancing of education is an immediateproblem, with just 2.7% of GNP (12% of total governmentexpenditure) allocated to education.
Sources: Andarabi et al. (2006, 2008); Aslam (2007); Bano (2008).
Gros
s en
rolm
ent r
atio
s (%
)
0
20
40
60
80
100
120
UrbanBalochistan NWFP1 Punjab Sindh
Rural Urban Rural Urban Rural Urban Rural
MaleFemale
Figure 3.7: Primary gross enrolment ratios in Pakistan by location and gender, 2004/2005
1. North West Frontier Province.Source: Pakistan Ministry of Education (2006).

90
02
Education f
or A
ll G
lobal M
onitorin
g R
eport
C H A P T E R 3
Conclusion
Governance reform in school management has
been widely cited as a positive force promoting
a wide range of important goals in basic education,
including improved quality and enhanced equity.
Strengthened choice, competition between schools,
devolved authority and increased public
participation have all been identified as drivers
of more accountable education provision.
Disadvantaged households are commonly
presented as first among equals in the list
of beneficiaries.
Evidence presented in this section calls into
question some of the more optimistic assessments
of school governance reform, particularly with
regard to the ability to promote free, good-quality,
equitable education for all citizens. Increasing
accountability and participation are important
ends in themselves in the design of education
policy. But devolving authority to schools does not
automatically confer increased voice in school
management on parents or communities, especially
if they are poor and marginalized. Similarly, while
choice and competition between providers may
have the potential to play a role in improving
education quality, there is little evidence of that
potential being realized on a significant scale.
For marginalized, vulnerable and impoverished
households, choice remains highly constrained –
and access to basic education remains contingent
on public education provision. The rapid emergence
of low-fee private schools may be a response to
real demand, but there is little evidence to suggest
that low-fee providers offer a genuine choice of
affordable, accessible, quality education.
All this points to a strong case for governments
to focus their energies and resources on public
provision of quality basic education for everyone.
Private finance and private providers have a role
to play, and governments need to ensure that they
are integrated into properly managed national
strategies. However, transferring responsibility
to schools, parents, communities and private
providers will not address the underlying problems
faced by education systems in providing equitable
opportunities for quality education. These will only
be revealed through governance systems that
combine strong institutional arrangements with
a commitment to equity.
For marginalized,
vulnerable
and impoverished
households,
choice remains
highly constrained
1 7 0

R A I S I N G Q U A L I T Y A N D S T R E N G T H E N I N G E Q U I T Y: W H Y G OV E R N A N C E M AT T E R S
Strengthening teachergovernance and monitoring
Introduction
Getting children into school, through a full primary
education cycle and into secondary school is a
priority for public policy. But education is about
more than putting bodies in classrooms. It is about
engaging minds, expanding horizons and ensuring
that students have access to real opportunities for
learning. The ultimate aim of any education system
is to ensure that children develop their cognitive,
emotional and social capacities – and that they
acquire the skills they need to realize their
potential (UNESCO, 2004). Schools are the primary
institution for achieving this aim. And teachers are
on the front line of delivery.
Chapter 2 documents serious problems in the
quality of education. In many countries absolute
levels of learning are so low as to raise questions
about the value of primary schooling. There is
disconcerting evidence that the gap in average
performance between rich and poor countries may
be widening. Moreover, that average gap obscures
large disparities in learning achievement within
countries. In short, many school systems are
failing to deliver services that meet even the most
basic standards for quality and equity.
Improved governance in teacher management is
vital for changing this picture. Education systems
need to attract qualified people into the teaching
profession, retain them, provide the skills and
knowledge they need, and ensure that they are
motivated. But how should poor countries with
limited financial resources set about achieving
these goals? And what mechanisms are available
to ensure that disadvantaged children living in
marginalized areas have access to good teachers?
This section addresses these questions. It also
looks at the crucial role of monitoring as a vehicle
for raising standards. In the absence of effective
monitoring, problems relating to education quality
and equity often remain invisible to the public and
policy-makers alike. When integrated into policy
formulation, monitoring can play a key role in
raising quality and strengthening equity.
Recruitment, deployment and motivation
If the world’s poorest countries are to achieve
UPE by 2015, millions of additional teachers have
to be recruited, trained and deployed, the majority
of them in marginalized areas characterized by
high levels of poverty. The problem is not just
a quantitative one of recruitment. A recent cross-
country survey on teacher motivation in sub-
Saharan Africa and South Asia concludes: ‘[V]ery
sizeable proportions of primary school teachers,
particularly in sub-Saharan Africa, have low levels
of job satisfaction and are poorly motivated. Many
tens of millions of children are not being taught
properly and are not receiving even a minimally
acceptable education. … [T]he unavoidable
conclusion is that most schooling systems are
faced with what amounts to a teacher motivation
crisis’ (Bennell and Akyeampong, 2007, p. 25).
Increasing recruitment, strengthening motivation
and improving qualifications are issues at the
heart of the teacher governance challenge. Equity
concerns are also paramount. The distribution
of more experienced, better-qualified teachers is
often skewed towards the best performing schools
and students from higher socio-economic
backgrounds. Marginal rural areas and low-
income urban settlements are more likely to
attract unqualified teachers or to experience large
deficits in teaching staff. This subsection looks
at four important governance themes relating
to teachers:
salaries and living standards;
recruitment and contract teachers;
deployment patterns;
motivation and performance-related pay.
Salaries and living standards
Teacher salaries figure prominently in education
governance debates. This is for good reason.
Remuneration for teachers absorbs the lion’s
share of education budgets, especially in low-
income countries. Pay levels also influence
recruitment. Salary has an important bearing
on the number of people entering the profession
and their qualifications. Higher salary levels are
likely to be positively associated with levels of
recruitment, experience and morale. By the same
token, the higher the recruitment costs, the fewer
teachers can be recruited within a fixed budget.
Many school
systems are faced
with a teacher
motivation crisis
1 7 1
S t r e n g t h e n i n g t e a c h e r g o v e r n a n c e a n d m o n i t o r i n g

90
02
Education f
or A
ll G
lobal M
onitorin
g R
eport
C H A P T E R 3
There is no simple formula for determining an
appropriate level for teacher salaries. As in any
labour market, costs are determined partly by
supply and demand, and partly by political factors.
Decisions on recruitment levels, qualification
requirements, and pay and conditions are all
important. Average teacher wages as a multiple
of GNP tend to decline as a country develops
economically (Bruns et al., 2003). But the ratio
of teacher salaries to GNP is of questionable
relevance in determining what salary corresponds
to the attainment of specified goals in areas such
as recruitment and motivation. In any country,
policies on teacher pay and recruitment have
to take into account average incomes, relative pay
with comparable professions and wider labour
market conditions.
Whatever the national ratio of pay to GNP,
it is clear that many teachers in developing
countries have very low income levels. In some
countries pay levels do not cover basic living costs
and this is a major factor in the teacher motivation
crisis. In much of sub-Saharan Africa and South
Asia teacher pay levels are perilously near, or even
below, the poverty line (Bennell and Akyeampong,
2007; Benveniste et al., 2008; Sinyolo, 2007).
In some cases salaries have fallen precipitously.
In Malawi, average teacher salaries were 30% lower
in real terms in 2004 than in 1992. At the equivalent
of just US$3.50 per day, a teacher’s average pay
is below the amount needed to cover the most
immediate household needs (Kadzamira, 2006).
Late payment, a widespread problem in many
countries, adds to the pressures associated with
low salaries (Benveniste et al., 2008; Sherry, 2008;
VSO, 2007).
It is not just absolute salary levels that are
important. Relative pay matters in terms of both
recruitment and morale. In Latin America, teacher
salaries are generally well above the poverty
threshold but compare unfavourably with pay
in other professional and technical occupations
(Morduchowicz and Duro, 2007). Similarly, teacher
salaries in much of Central Asia are considered
unattractive. This is true even in countries such
as Armenia and Tajikistan where teacher salaries
increased markedly between 2003 and 2007
(Steiner-Khamsi et al., 2008). One consequence
of low relative pay in Central Asia has been an
increase in the number of teachers seeking to
supplement their income through a second job –
a phenomenon that has been extensively
documented in most Central Asian countries
(Education Support Program, 2006). This practice
can have damaging consequences for the quality
of education, with some teachers withholding
curriculum to pressure students into private
tutoring (Bray, 2003). The students least able
to pay for private tutoring stand to lose the most.
Debates over teacher pay have to be viewed in a
broader context. Governance reforms have often
increased teachers’ level of responsibility and
workload. In many countries teachers are being
asked to use demanding new ‘learner-centred’
curricula which entail major changes in teaching
practice, and frequently increased preparation and
marking time. Yet these new responsibilities are
seldom reflected in pay and conditions, helping
explain why many teachers lack enthusiasm for
reform efforts (Bennell and Akyeampong, 2007).
Contract teachers: increasing recruitmentat the expense of quality and equity?
All governments operate under real budget
constraints in education. The constraints are
particularly severe in many of the poorest countries.
The fact that these countries need to increase
recruitment on a large scale poses an obvious
public spending problem: namely, how to increase
the supply of teachers within a sustainable budget
framework. Many governments have attempted to
resolve the problem by increasing the recruitment
of contract teachers.
Teachers have traditionally been recruited as
civil servants. This influences the structure of their
pay and benefits – and the costs of recruitment.
Recruiting teachers on a contract basis, outside the
civil service scale, has the potential to reduce costs.
It also gives education authorities greater flexibility
with respect to hiring and firing. One feature of
civil service employment in many countries is that
teachers have a high level of immunity when it
comes to being fired. According to one study in
India, only one in 3,000 head teachers surveyed
has ever fired a teacher (Chaudhury et al., 2006).
Such findings confirm that education authorities
have trouble dismissing tenured teachers for
substandard performance. This is seen by some as
a factor in the high levels of absenteeism in many
countries noted in Chapter 2. Contract teaching
arrangements are seen by some as a vehicle for
greater flexibility. While civil service employment
is a long-term arrangement, contracts are time-
bound and can be revoked swiftly. Increasing the
Poor training,
poor pay and
poor working
conditions
contribute
to teacher
discontent
1 7 2

R A I S I N G Q U A L I T Y A N D S T R E N G T H E N I N G E Q U I T Y: W H Y G OV E R N A N C E M AT T E R S
opportunity for communities and head teachers
to hire and fire teachers is widely cited as a
governance benefit of private schools, discussed
earlier in this chapter.
Recruitment on a contract basis has increased the
supply of teachers in many countries. This is
particularly the case in West Africa (Göttelmann-
Duret and Tournier, 2008). Over a third of teachers
in Guinea, the Niger and Togo are contract teachers
(UNESCO, 2007a). Many other countries have also
stepped up recruitment of contract teachers,
among them Cambodia, China, India, Nepal,
Nicaragua, Pakistan and Sri Lanka (Duthilleul,
2005; Göttelmann-Duret and Tournier, 2008;
Govinda and Josephine, 2004). To what extent has
this enabled governments to achieve EFA goals?
The evidence on contract teachers is mixed.
The increase in the supply of contract teachers
has enabled governments to reduce pupil/teacher
ratios (PTRs) in many countries. However, that
superficially positive outcome has to be weighed
against concerns that there may be a trade-off
between the supply of contract teachers and overall
education quality. For example, contract teachers
in Togo appear to provide lower-quality education.
That is not entirely surprising since they have less
experience and training than civil service teachers
(Box 3.13). There is also evidence from West Africa
that recourse to contract teaching may in some
cases compound problems of teacher morale.
The testimony of one contract teacher in Cameroon
provides an eloquent account of the impact of
contract teaching arrangements on self-esteem
in one particular context (Box 3.14). The broader
concern with contract teaching is that what might
appear as an advantage from one perspective
(more flexibility and reduced cost) might be seen
from another perspective as a threat to livelihood
security and a source of low morale.
Evidence from other regions also varies. In some
cases, increased recruitment of contract teachers
can have positive effects on equity. This is especially
true where contract teachers are recruited from
regions and communities that are not well served.
There is also some evidence – admittedly mixed –
that contract teachers are less likely to be absent.
This appears to be the case in India, where the
practice of employing contract teachers has
expanded rapidly since 2002 (Box 3.15). Most
contract teachers in the country work in rural
areas, often teaching in schools used by very
poor communities. However, even here the
implications for equity are ambiguous. An obvious
concern is that contract teaching arrangements
will leave some of India’s most marginalized
children to be taught by its least qualified and
experienced teachers.
The issues raised by contract teaching are far from
straightforward. All governments need to assess
carefully the potential risks, in terms of equity
and education quality, of a recruitment strategy
that lowers the standards for recruited teachers.
From an EFA perspective, increasing teacher
supply while lowering quality standards is a false
economy. The first objective of teacher governance
should be raising learning achievement. At the
same time, governments have to operate within a
defined resource envelope. In the poorest countries,
increased national effort and increased aid to meet
recurrent costs in education may be needed for
meeting recruitment goals.
One way of reducing the pressure for recruitment
is to strengthen teacher retention. In many
countries, large numbers of teachers are leaving
the profession not just because of poor pay and
conditions, but also because of inadequate support,
There is a
potential trade-off
between
the recruitment
of contract
teachers and
education quality
1 7 3
S t r e n g t h e n i n g t e a c h e r g o v e r n a n c e a n d m o n i t o r i n g
Box 3.13: Weighing the costs of lower teacher wages in Togo
Public sector reforms in Togo in the 1980s and 1990s resulted in payand recruitment freezes for teachers, leading to a sharp rise in PTRs.The country responded by recruiting contract teachers. One-half ofpublic primary school teachers are now contract teachers. Their wagesare some 60% below those on the civil service salary scale, and theyare not entitled to promotion, pension rights or other non-wage benefits.While contract recruits often receive teacher training and may haveas many years of general education as civil service teachers, they tendto have fewer years of teaching experience.
What difference has the introduction of more flexible contracts madeto accountability and quality? An analysis of data from the PASECachievement survey found no difference in absenteeism betweencontract and civil service teachers. The threat of not having a contractrenewed does not appear to have changed teachers’ behaviour, probably because the threat is seldom acted upon. However, the analysisdid find that, controlling for student background and for teachereducation and experience, students in classes taught by contractteachers performed worse than those taught by civil service teachers. In other words, low-wage contracts do appear to have attracted a neededpool of teachers, as intended, but with the unintended consequence of potentially long-term detrimental effects on education quality.
Source: Vegas and De Laat (2003).
90
02
Education f
or A
ll G
lobal M
onitorin
g R
eport
C H A P T E R 3
In Cameroon,
recruitment of
contract teachers
is allowing an
expansion in
enrolment at
the expense of
teacher morale
1 7 4
Box 3.14: ‘Marginal and frustrated’: a contract teacher’s view from Cameroon
In Cameroon, contract teachers make up more than half of the teaching staff at primary level. The experience of one teacher, Mr Bikono, who works in a government school in Yaounde, illustrates the potential trade-off between teacher supply on the one hand and teacher morale on the other.
Unable to get a job after qualifying as a lawyer,Mr Bikono took the qualifying exam to enter theteaching profession. After eight years of experience as a substitute teacher, he achieved contract teacherstatus. Being a contract teacher in Cameroon makesMr Bikono ‘feel marginal and frustrated’. His monthlysalary amounts to 99,000 CFA francs (about US$158),a long way from the starting salary of 140,000 CFAfrancs for a teacher with a civil service job. He alsolacks benefits attached to civil service posts, such as a pension. Mr Bikono sees it as discrimination.‘We’re doing the same job and we have the same
amount of work. In fact, contractors are sometimesbetter qualified than civil servants.’ He is indignantabout his paltry salary, which forces him to live in hisfather’s home. His wife has left him, tired of waitingfor a ‘supposed improvement of the situation’.
The mass recruitment of contract teachers hasprovided a short cut to expanding the teaching force.This is in a national context where one-third ofteachers are untrained and there is a need to morethan double teacher numbers to achieve UPE by 2015.While the recruitment of contract teachers is allowingan expansion in enrolment, the effect on the morale of teachers such as Mr Bikono is damaging. Thedanger is that contract teaching will lead to furtherdeterioration of quality, which in turn would haveworrying implications for the number of childrensuccessfully completing the primary cycle.
Sources: Ekwè (2007); UIS (2006b).
Box 3.15: Contract teaching in India: reaching the underserved
The recruitment of contract teachers in India aims to address the dual challenges of teacher shortagesand high absenteeism in some states. Outcomes foraccess, equity and quality have been mixed.
Contract teachers have been a feature of theeducation system in several Indian states since the1990s. The practice has expanded rapidly since 2002,when states were permitted to recruit such teachersthrough central government grants. By 2004 half a million contract teachers had been hired. Theirrecruitment is aimed at reaching villages not servedby regular government schools and increasing thenumber of teachers in single-teacher schools. Mostcontract teachers, accordingly, work in remote ruralschools, particularly in the states of Madhya Pradesh(which accounts for 46% of all contract teachers) andRajasthan (21%); contract teachers make up half theteaching force in the former and a third in the latter.Their pay averages around one-fifth to half of whatcivil service teachers make. The least qualified, lowest-paid contract teachers are concentrated in rural tribal areas serving deprived children.
What impact has the increased recruitment ofcontract teachers had on education? There isinsufficient evidence to provide a clear answer to that question. Contract teachers are often recruitedfrom marginalized communities, increasing the supply
of teachers in areas where civil service teachers oftendo not want to work. Indeed, the policy of hiringteachers under contract has been supported in somecases by civil service teachers, who benefit by nothaving to transfer to less attractive areas. Clearly,many children being taught by contract teacherswould not otherwise receive an education. The factthat these teachers may be of a similar background to the children they are teaching may help to addressproblems of caste stigma. There is also some evidencethat contract teachers are less likely to be absent,thus helping schools open more regularly and forlonger hours; and that learning outcomes are at leastas good for children taught by contract teachers asfor those taught by civil service teachers.
From a broader public policy perspective thequestions facing India are similar to those raisedelsewhere. While contract teachers have brought realbenefits for many communities, increased the equityof teacher deployment and cut average recruitmentcosts, they are often less qualified and experiencedthan civil service teachers. The obvious danger is that children who are poor, low caste and living in remote rural areas will be taught by lower-qualityteachers — an outcome that will reinforce widerinequalities in India.
Sources: Govinda and Josephine (2004); Muralidharan and Sundaraman (2006); Pandey (2006).

R A I S I N G Q U A L I T Y A N D S T R E N G T H E N I N G E Q U I T Y: W H Y G OV E R N A N C E M AT T E R S
large class sizes and low job status. Reducing the
outflow requires an approach that looks beyond pay
to the wider factors affecting the morale of teachers
who, it must be remembered, provide a critical
public service.
Tackling equity gaps in teacher deployment
Average PTRs can mask serious problems in
deployment of teachers within a country. Areas
that are remote, poor and home to disadvantaged
ethnic, racial or caste groups are often
underserved, especially in having their share of
experienced teachers. This is not surprising: where
teachers have a choice, they may be unwilling to
work in hard-to-reach locations offering poor
housing, no water or electricity and few public
services, especially if they must also be separated
from their spouses. But the skewed allocation
of teachers is a factor in the large equity gaps
in access and learning outcomes discussed
in Chapter 2.
Urban bias is a systemic problem. In countries
where most teachers come from urban areas and
there are few recruits from disadvantaged groups,
filling posts serving rural areas and minority groups
is often difficult. Most teachers want to be posted to
urban schools for both professional and personal
reasons, including the education of their own
children. But the effect in many countries is to
reinforce the rural-urban gulf in educational
opportunity. In Pakistan, lack of transport, security
problems and poor housing in remote rural areas
form a major deterrent to equitable deployment
of teachers, especially women (Khan, 2007).
In Namibia, 40% of teachers in rural schools
in the north are qualified, compared with 92% in
the capital. Two-thirds of urban teachers in Uganda
are qualified, but only half of rural teachers
(Bennell and Akyeampong, 2007).
Public policies can create incentives that weaken
the urban bias. One strategy is to change
recruitment patterns so that more teachers from
underserved areas join the profession. Another
is to provide special incentive packages, such as
accelerated career advancement, eligibility for
study leave and better housing aimed at drawing
teachers towards underserved areas. Giving
teachers bonuses for accepting rural postings
is another incentive that can change location
preferences. All these measures are widely,
if haphazardly, used in sub-Saharan Africa.
The problem is that the incentives are usually
insufficient to outweigh the perceived disadvantages
of living in isolated areas (Bennell and
Akyeampong, 2007).
Recruitment of teachers from under-represented
groups offers several potential benefits. Most
immediately, it helps target increases in teacher
supply on the areas where it is most needed.
There are also motivational benefits. Some
evidence suggests that locally recruited teachers
in sub-Saharan Africa and South Asia tend to be
more satisfied with their jobs, which should help
reduce attrition (Bennell and Akyeampong, 2007).
In addition locally recruited teachers are more
likely to be familiar with the cultural context in
which they are working, with potential benefits for
the quality and relevance of their teaching. Where
teachers are part of the community, there is also
greater opportunity for closer monitoring by
parents, which can increase teacher effort and
reduce absenteeism. In El Salvador, for example,
parental oversight of teacher attendance and
working hours resulted in increases in the time
teachers spent on work (Di Gropello, 2006).
Various strategies have been developed to create
incentives for the recruitment of teachers from
under-represented groups. Some countries have
set teacher training quotas, including for women
and people from ethnic minorities or low castes.
Further incentives can be generated by waiving fees
for entry to training on condition that candidates
agree to teach for a stipulated period in their local
areas. Devolving authority for teacher hiring to
communities or regional and district governments
can also facilitate the recruitment of teachers from
under-represented groups.
None of this implies that increased local
recruitment is straightforward. Locally recruited
teachers are often untrained initially and may have
less education than other teachers – some may
have completed only primary school. Increasing
the cohort of secondary-school graduates in
underserved areas is often a first step in ensuring
that teachers from under-represented groups meet
required national standards. This may be difficult
in educationally disadvantaged areas, however.
Experience in the Lao People’s Democratic
Republic and Cambodia demonstrates the
problems that governments face (Box 3.16). Both
countries have succeeded in getting more teachers
from ethnic minority groups into teacher training,
partly by reducing eligibility requirements. However,
Areas that are
remote, poor
and home to
disadvantaged
ethnic, racial
or caste groups
often lack
experienced
teachers
1 7 5
S t r e n g t h e n i n g t e a c h e r g o v e r n a n c e a n d m o n i t o r i n g

90
02
Education f
or A
ll G
lobal M
onitorin
g R
eport
C H A P T E R 3
they have faced problems in ensuring that trained
teachers return to teach in their home areas.
Cambodia’s approach, combining quotas for such
groups in teacher training with local recruitment,
has been more promising.
Some countries have developed national
programmes aimed at overcoming disparities in
teacher allocation through financing mechanisms
to support teacher recruitment in underserved
areas. One particularly striking example comes
from Brazil. During the 1990s, high levels of
inequality in education attainment and achievement
in the country were linked to deep disparities in
teacher allocation. The FUNDEF programme used
national education financing strategies to change
this picture. Under FUNDEF, a share of subnational
tax revenue was pooled and used to supplement
spending per student in poor states. Around 60%
of these resources were used to hire and train
teachers or to increase teacher salaries. The
highest salary increases were in the poorer states
of the north-east with the greatest education needs.
After FUNDEF began in 1998, the percentage of
teachers having completed more than a primary
education rose sharply, especially in poor areas
such as the north-east. The programme has been
associated with sharp increases in school
attendance, particularly in the upper grades
of basic education (Gordon and Vegas, 2005).
Fragile states affected by conflict face particularly
acute problems in teacher allocation. Restoring
education systems is a critical part of post-conflict
reconstruction. Yet teachers may have good
reasons for wishing to avoid placement in areas
recently or currently affected by security problems.
The experience of Afghanistan is instructive.
The country is showing signs of success in its
programmes to improve school access, but large
disparities in teacher allocation remain. Now that
the governance system is being rebuilt, the country
must ensure that qualified teachers are deployed
to the areas where they are most needed. Bringing
community-recruited teachers into the system is
one response (Box 3.17).
In Cambodia,
local recruitment
of ethnic minority
teachers is
helping tackle
shortages in
remote areas
1 7 6
Box 3.16: Recruiting ethnic minority teachers in the Lao People’s Democratic Republic and Cambodia
The Lao People’s Democratic Republic and Cambodia areaccelerating progress towards UPE, but teacher shortages in remote areas are holding back their efforts to expand access and overcome marked regional disparities. In response,authorities in both countries are trying to recruit teachers from ethnic minority groups.
In the Lao People’s Democratic Republic initiatives emerged as a response to the failure of incentives to increase teachersupply in remote, mountainous areas. Under a previous policy,the government offered supplements equivalent to between15% and 20% of salary, but these proved insufficient tooutweigh teacher preferences for urban postings.
The emphasis has now shifted to a programme aimed atrecruiting ethnic minorities into teacher training. Entryrequirements have been adjusted and financial inducementsprovided. Numbers passing through the programme haveincreased. However, serious administrative problems have beenidentified. Some of the students recruited do not actually comefrom targeted villages but are enrolling to receive the benefitsoffered. Language problems in teacher training have resulted inhigh dropout levels for indigenous minorities. And many of thestudents who graduate do not go back to teach in their homearea, suggesting that the pull of urban employment is strongerthan the incentives on offer to return to the local area to teach.
Public policy in Cambodia has followed a similar trajectory. In the past, transferring teachers into areas of high need,coupled with incentives for rural hardship postings, met withlimited success. Salaries were too low to support the transfer ofteachers lacking an extended family, housing or land in the area.Special resettlement allowances also proved insufficient. Therehas also been an increased emphasis on local recruitment.
Entry requirements for teacher training (set at grade 12 for national recruitment) have been waived in districts andprovinces where secondary education is not widely available.This has opened the door to students from those areas whohave only a lower secondary education. Teacher trainingscholarships for students from poor and ethnic minority (non-Khmer) backgrounds have helped. Affirmative actiontargets have been set for the recruitment of minority studentsinto teacher-training colleges, with one in four places reservedfor non-Khmer students.
Evidence suggests that the strategy may be starting to paydividends, although problems remain. Teaching posts in manyremote areas remain unfilled. Moreover, it has not been possibleeither to fill all quota places with ethnic minority students or to prevent abuse of the quota system. Even so, local recruitmenthas helped rapidly expand the supply of teachers to isolatedrural areas.
Source: Benveniste et al. (2008).

R A I S I N G Q U A L I T Y A N D S T R E N G T H E N I N G E Q U I T Y: W H Y G OV E R N A N C E M AT T E R S
Local recruitment is not a quick fix for inequalities
in teacher deployment. Training and support
programmes also have to be developed and made
accessible. Several countries are using teacher
resource centres8 to address this challenge and
to break the isolation of teachers in rural areas.
Teacher resource centres offer an alternative
to central or regional teacher training, enabling
teachers to develop their capacity while remaining
in the community. In India, Kenya, Malawi, Mali
and Uganda, teacher resource centres have been
an important mechanism for rapid teacher
upgrading, accreditation and professional
development, and for generating local solutions
to local problems (Giordano, 2008; Global March
Against Child Labour and International Center
on Child Labor and Education, 2006).
According to one review, teachers participating
in teacher resource centres report increased
professional dialogue and commitment, increased
awareness of child-centred teaching methods and
increased access to materials and resources. There
is also some evidence of wider benefits, with teacher
resource centres reportedly having helped to narrow
the achievement gap between urban and rural
schools (Chile and Kenya) and to reduce repetition
and improve retention (Cambodia). Nevertheless,
teacher resource centres are not universally
effective. In the worst cases, they reproduce many
of the problems of national teacher-training
programmes. Often they are underfinanced and
training is disconnected from teachers’ and pupils’
real classroom needs (Giordano, 2008).
Teacher deployment patterns are not just a
reflection of incentives and teacher preferences.
Weak management capacity and corruption also play
a role. Bribery of politicians and officials by teachers
to secure favoured postings is reported to be
common in some countries (Hallak and Poisson,
2007). In a study in Bangladesh, for example, over
40% of secondary school teachers believed that
teacher appointment procedures were unfair and
that informal payments were needed to secure a
post. Many head teachers also saw promotion and
transfer procedures for government teachers as
unfair and reported that informal payments were
commonly required to secure a transfer (Financial
Management Reform Programme, 2005). Contrary
to some widely held views, devolution of authority to
parent-teacher associations is not an automatic cure
for such practices. For example, there is evidence in
West Africa of school principals and parent-teacher
association chairs appointing relatives or friends
as teachers (De Grauwe et al., 2005). In Rajasthan,
India, local recruitment combined with a lack
of performance or duty incentives encourages
teachers to network with political leaders and
local bureaucrats to secure posts and awards
(Ramachandran et al., 2005). As both these cases
demonstrate, governance problems associated
with teacher recruitment and deployment seldom
have simple solutions.
The limits to performance-related pay
Teacher pay in most countries is tied not to
learning outcomes but to qualifications and years
of experience. The weakness of the link between
pay and student learning achievement has
prompted some to advocate a shift towards
performance-related pay. Paying teachers for what
they deliver rather than their qualifications and
years of experience, the argument runs, could
create new incentives that might significantly raise
learning outcomes while improving motivation and
retention among the best teachers (Sander, 2008).
The ideas behind performance-related pay are
not new. Nor are they restricted to education. 8. Also known as teacherdevelopment centres.
Teacher resource
centres can help
to make training
accessible and
break the isolation
of teachers
in rural areas
1 7 7
S t r e n g t h e n i n g t e a c h e r g o v e r n a n c e a n d m o n i t o r i n g
Box 3.17: Teacher deployment in a fragile state:
the experience of Afghanistan
Given the massive increases in student enrolment taking place inAfghanistan since 2002 and the high numbers of school-age children who remain out of school, rapid teacher training, recruitment andtargeted deployment are critical.
The government took the important step of deciding to build acomprehensive system of thirty-eight teacher training colleges in acontext where schools have long relied on teachers with little or noprofessional training. However, training is a route to increased supplyrather than equitable deployment. Over 20% of teacher-training students— and almost 40% of women students — are in Kabul, the capital.
One way to redress the imbalance is by integrating community schoolsinto the government system and improving their status. Under theMinistry of Education’s Community-based Education Policy, teacherspreviously paid by communities on a largely ad hoc basis, often withsmall cash or in-kind contributions, are being brought onto thegovernment payroll. Achieving the transition has been a majorundertaking. In collaboration with provincial Ministry of Educationofficers, a partnership of four non-government organizations calledPACE-A (Partnership for Advancing Community Education in Afghanistan)has been collecting from teachers the signatures and photos needed to include them on the payroll.
Source: Kirk (2008).
90
02
Education f
or A
ll G
lobal M
onitorin
g R
eport
C H A P T E R 3
The concept has been widely applied in a variety
of public sector reforms. The broad idea is that
less weight should be attached to the fixed salary
component of teacher pay (usually linked to
qualifications and experience) and more to actual
teacher performance payments (linked to student
or school results). The issues at stake are highly
contentious, with teacher unions frequently
opposing what they see as market-based
incentives that are inappropriate to education
(Umansky, 2005).
Despite the controversy and the enthusiasm
for performance-related pay in some quarters,
evidence of the benefits claimed is limited. One
reason is that the measurement issues involved
are enormously complex. Measuring performance
is challenging for many reasons, not least because
of the difficulty in separating teacher performance
from the multitude of other home-based factors,
school-based factors and random events that
influence learning outcomes. Another problem
with performance-related pay systems is their
potential for producing perverse outcomes in
at least two areas. First, they can lead to a focus
on the development of a narrow range of subjects
and skills needed to pass tests, at the expense
of creative thinking. Second, they can encourage
teachers and schools to exclude from tests the
children who are least likely to do well (Glewwe
et al., 2003).
Relatively few countries have introduced
performance-related pay on a large scale.
Moreover, the different contexts in which pilot
programmes have been introduced make
meaningful cross-country comparison difficult.
In many cases the evidence is inconclusive. For
example, extensive evaluations of experience in
the United States and other developed countries
do not indicate a clear cause-effect relationship
between performance-related pay and teacher
performance (Umansky, 2005).
Evidence of perverse incentives comes from several
countries. In Chile a national performance-related
pay system, the Sistema Nacional de Evaluación
del Desempeño, awards the schools that show the
greatest progress in student achievement, giving
them a financial bonus for teachers equivalent to
about half a month’s salary. Schools are stratified
within regions by socio-economic status and other
external factors that affect school performance.
This ensures that competition is among
comparable establishments. However, the design
has some inherent flaws. It rewards schools that
are already doing well rather than those that are
improving yet still need to do better (Carnoy et al.,
2007). Similar problems have emerged in Mexico.
In this case, a long-standing programme, the
Carrera Magisterial, allows teachers to move
up a pay level based on assessment of a range
of criteria, including their students’ performance.
The approach encourages teachers to focus on the
best-performing students (Vegas and Petrow, 2007).
The experience of Chile and Mexico is instructive
in a wider sense. While the introduction of
performance-related pay was highly controversial
in both countries, the impact of the pay incentives
on learning achievement has been minimal.
This is partly because only a small minority of
teachers has any real likelihood of receiving a
reward in the form of a bonus in Chile or promotion
in Mexico (Vegas and Petrow, 2007). Salary
increments for performance have emerged as
a popular governance reform in a number of
post-socialist countries in Central Asia. Political
and administrative obstacles, however, have
often prevented their effective implementation,
as Mongolia’s experience demonstrates (Box 3.18).
There is even less experience with performance-
related pay in poor countries with very low teacher
pay. Some small-scale randomized experiments
have been conducted, mainly through NGOs, with
Linking
teacher pay to
performance can
create perverse
incentives,
including teachers
focussing on the
best-performing
students
1 7 8
Box 3.18: Problems in Mongolia’s teacher bonus system
Introducing performance-related pay is not a simple administrativematter. In Mongolia, large bonuses, up to 25% of annual salary or three months’ pay, were introduced in 2006 with the aim ofacknowledging outstanding teacher performance. In the first year of the reform, schools received central funding with which to givebonuses to selected teachers. In subsequent years schools were toraise their own funds or deduct money from salary supplements forsome teachers to reward others. The idea of bonuses was abandoneda year after its inception, for several reasons:
a strongly held belief in social redistribution that prohibitsrewarding a few at the expense of others;
concerns that the plan would emphasize a hierarchical structurebetween those who are monitored (teachers) and those whomonitor (head teachers);
the heavy load of documentation and paperwork that resultedfrom close and continuous monitoring over the course of a year.
Source: Steiner-Khamsi et al. (2008).
R A I S I N G Q U A L I T Y A N D S T R E N G T H E N I N G E Q U I T Y: W H Y G OV E R N A N C E M AT T E R S
indeterminate results. Studies in the Indian state
of Andhra Pradesh and in Kenya found that student
test results were better in schools exposed to
performance-related pay than in others. Both
programmes gave teachers a financial bonus if
students achieved higher-than-average scores on
standardized tests. However, a key factor behind
improved results in both countries was a tendency
of teachers to train students for the test, often
excluding other aspects of the curriculum. In
Kenya the learning achievement improvement was
found to be short-lived – an outcome that raises
questions about sustainability. In addition, teachers
receiving incentives were as likely to be absent
from school as those receiving none, raising
further questions about the strength of incentive
effects associated with performance-related pay
(Glewwe et al., 2003; Muralidharan and
Sundararaman, 2006). By contrast, evidence from
another randomized experiment in India found a
positive effect on teacher attendance and learning
outcomes. In this case, what appears to have been
important is a mix of close monitoring and
financial incentives (Box 3.19). Monitoring of the
intensity carried out in this case, however, is
neither feasible nor desirable on a national scale.
The idea that teacher earnings should reward
good teaching and not just qualifications and
seniority has intuitive appeal. Yet learning
processes are very complex and so is the
attribution of improvement in student performance
to teachers alone. This makes it extremely
difficult to develop a policy framework that links
pay to improved learning outcomes. Another
problem with some performance-related pay
proposals is that they take a highly reductionist
view of teacher motivation. Factors such as job
satisfaction, status, an ethos of public service
and work conditions may have as much bearing
on teacher motivation as monetary incentives
(Bennell and Akyeampong, 2007).
Monitoring education systems for enhanced quality and equity
Broad-based learning and the acquisition of skills
defined in national curricula are the ultimate
education policy objectives. Monitoring these
qualitative outcomes is more difficult than counting
heads. Yet it is vital for policy-makers on four
counts: to chart progress and identify disparities in
learning; to influence and monitor policy measures
aimed at improving learning (related to teacher
training, curriculum development and textbook
revision, for example); to determine the allocation
of resources to support poorly performing schools;
and to provide information to parents and policy-
makers, ensuring that schools are held to account
for student performance.9
From classroom to system level, the weakness of
existing monitoring mechanisms in many countries
undermines efforts to address the learning needs
of the most disadvantaged schools and students.
Two strategies have been adopted to address
this problem: more extensive use of large-scale
learning assessments and reform of school
supervision services.10 A key motive for large-scale
assessments has been to track performance of
education systems as a whole, while supervision
reforms have aimed to improve monitoring and
support quality at school level. This subsection
discusses the role of these two strategies for
improving quality and equity.
Learning assessments: more coverage, but weak links to planning
Recent growth in the number of large-scale
learning assessments indicates the increased
emphasis on learning outcomes. Between 2000
and 2006, around half of all countries conducted
at least one national learning assessment
(UNESCO, 2007a). In addition, an increasing
number of developing countries are participating
in international learning assessments primarily
designed for OECD countries, although their
involvement remains limited (three sub-Saharan
9. Monitoring is alsoimportant in building publicconfidence in the educationsystem, and giving parentsand communities anopportunity to hold schoolsto account – aspects of whichare reviewed earlier inthis chapter.
10. The terms ‘schoolinspection’ and ‘inspectorate’are used in many countries.
Recent growth
in the number
of large-scale
learning
assessments
indicates an
increased
emphasis on
learning outcomes
1 7 9
S t r e n g t h e n i n g t e a c h e r g o v e r n a n c e a n d m o n i t o r i n g
Box 3.19: Incentives to reduce absenteeism
in India: a randomized experiment
Combining teacher incentives with close monitoring ofteachers can reduce absenteeism and enhance quality, a randomized experiment in India has shown. The projectselected 60 one-teacher non-formal education centres fromamong 120 operated by an NGO in villages. The other centresserved as a control group. Instructors were given a camerawith a tamper-proof time and date function, which childrenwere asked to use at the beginning and the end of eachschool day. The teacher’s salary was linked to proven hours in school. Absenteeism fell immediately, from 44% to 24%, in the schools supplied with cameras, while staying the samein the other schools. The programme also resulted in highertest scores and, one year after the experiment, higher ratesof student transition into regular schools.
Source: Duflo et al. (2007).

90
02
Education f
or A
ll G
lobal M
onitorin
g R
eport
C H A P T E R 3
African countries participated in the most recent
round of the PIRLS, PISA or TIMSS assessments –
Botswana, Ghana and South Africa). Regional
learning assessments, more explicitly designed
to address concerns in developing countries,
have expanded. Thirty-seven African countries
participate in SACMEQ and PASEC, and sixteen
Latin American countries in LLECE (Lockheed,
2008).11 The limits to assessment have to be
recognized: many developing countries have never
carried out a countrywide learning assessment
and many other have only recently done so
(Benavot and Tanner, 2007). But there has been
an exponential increase in the flow of information
on learning outcomes.
How countries use information from different types
of assessments varies greatly. At one extreme,
yearly census-based test results in Chile are
widely disseminated. Public access to information
is seen as a mechanism for holding schools and
municipalities to account, informing parental
choice and creating competition between schools.
By contrast, in Uruguay assessment results from
individual schools are not made public and there
are no school rankings. The government’s stated
policy is to use assessments not to create
competition in the education system but to inform
policies and resource allocation, and guide the
targeting of support to teachers (Benveniste, 2002).
These differing approaches are rooted partly in
different governance agendas. Some countries
see testing as a mechanism for promoting an
agenda that emphasizes competition, choice
and public information to hold service providers
to account. Others view testing results as an input
to public policy design. The optimal design is
to combine both.
Even where data from assessments are available,
it does not follow that they are widely used. For
example, South Africa has seen a proliferation of
national and international assessments generated
through large investments of human and financial
resources. These assessments have provided a
better understanding of how learning occurs by
developing some key indicators. But the use of test
results remains limited. Education authorities
seldom use them to inform approaches to equity
in addressing the learning needs of students from
disadvantaged backgrounds. Reporting of
information to schools as part of a strategy to
improve their performance also remains
uncommon (Kanjee, forthcoming).
South Africa’s experience is a microcosm of a
common problem. While education policy-makers
are equipped with an increasing amount of
information, learning assessment data often
have a relatively weak impact on policy design.
One reason is weak institutional capacity,
reinforced in some cases by institutional
segmentation between assessment agencies and
education planning. While the need for information
on achievement is widely recognized, translating
the lessons that emerge from assessments into
policy design and implementation remains
a pressing challenge (Postlethwaite and
Kellaghan, Forthcoming).
High-stakes testing
Most recent national, regional and international
learning assessments have been conducted to
measure the performance of education systems
as a whole. These sample-based assessments are
often described as ‘low-stakes’ because they are
not directly linked with incentives for participants
(students or schools) to perform well, or with
sanctions for those performing badly. In ‘high-
stakes’ assessments, measured outcomes have
direct consequences, most commonly for the
pupil. Tests can also serve as accountability
measures for schools and teachers, and the
results used as the basis for rewards and
sanctions.
High-stakes assessment is most frequently
associated with consequences for student
progression and certification. It is also used in
some cases to inform approaches to
performance-related pay for teachers (see above).
Cross-country evidence on the implications for
student learning is limited. Standardized exit
examinations at the end of secondary school are
the most studied accountability measure. Findings
suggest that students perform significantly better
in countries with such exams than in countries
lacking them. On the other hand, this association
is variable: taking demographic and socio-
economic factors into account, exit exams are
positively associated with an increase in average
scores for students from both poor and rich
households, but students from rich households
improve their scores by a greater amount (Schütz
et al., 2007). One implication, then, is that high-
stakes testing may reinforce inequalities in
learning achievement. Another problem is that
high-stakes testing can have unintended
consequences for the quality of education and for
Translating
lessons from
assessments
into policy
design and
implementation
remains a
pressing
challenge
11. Chapter 2 gives fullerdescription of learningoutcomes from theseassessments.
1 8 0

R A I S I N G Q U A L I T Y A N D S T R E N G T H E N I N G E Q U I T Y: W H Y G OV E R N A N C E M AT T E R S
weaker students. Recent evidence on the impact
of England’s rigorous testing system shows that
the overall rise in test scores since the mid-1990s
has been achieved at the price of a narrowed
curriculum and extensive time devoted to test
preparation. Particularly worrying is the finding
by some researchers that the intensified focus
on passing tests has lowered the self-esteem
of poorly performing students (Harlen, 2007;
Wyse et al., 2008).
Most developing countries have long-standing
traditions of high-stakes testing through public
examinations. Results are primarily used for
student certification and selection. Here, too, there
have been unintended effects for efficiency and
equity. In some developing countries, such exams
have contributed to increased grade repetition
and lower levels of transition from primary to
secondary school (Kellaghan and Greaney, 2004;
N'tchougan-Sonou, 2001). A study in Kenya, for
example, found that the transition rate from grade
6 to grade 7 was reduced partly because poor-
performing pupils were discouraged from taking
the final primary examination. The reason: schools’
average scores were made public in league tables
and school officials did not want the poorer pupils
to pull down their average (Ackers et al., 2001).
As a mechanism for holding schools and teachers
to account, high-stakes testing has strengths and
weaknesses. The strengths include the generation
of simple and comparable results. The weaknesses
are also results-related. The assumption is that
teachers and schools strive harder when they can
work towards standardized goals, with incentives
attached to meeting specified targets. But if the
driving concern is to maximize average school
scores, underperformers or hard-to-teach children
may be viewed as potential liabilities (as in Kenya).
There will be incentives in this case to support
the students who are most likely to pass the tests
and devote less time to their weaker classmates.
Moreover, where selection to schools is related
to socio-economic status, which in turn is closely
correlated with performance, rewarding schools
for test scores can be tantamount to penalizing
the schools that enrol less wealthy students.
Recent international debate on high-stakes testing
has been heavily influenced by experience in the
United States. The 2001 No Child Left Behind Act,
which was introduced expressly to close equity gaps
in learning achievement, uses high-stakes testing
as a device aimed at strengthening accountability,
extending choice and improving school
management (Box 3.20). There is a great deal
In the
United States,
high-stakes
testing has
yielded uncertain
outcomes
1 8 1
S t r e n g t h e n i n g t e a c h e r g o v e r n a n c e a n d m o n i t o r i n g
Box 3.20: No Child Left Behind in the United States: the jury is still out
The No Child Left Behind Act has given a push to high-stakes testing in the United States. Legislation nowrequires all states to put in place accountability systems,including mandatory testing in mathematics and reading,annually for all pupils in grades 3 through to 8(corresponding roughly to ages 8 to 13) and once insecondary school. Test results are used as the basis fordecisions on a range of important questions, such aswhether to adopt special improvement measures for aschool or district and whether pupils receive subsidizedtutoring. Sustained low performance can result ininterventions that range from the replacement of teachingstaff to the contracting out of school management to a private operator.
There are obvious difficulties associated with evaluatingoutcomes at this relatively early stage. One of the mostcomprehensive studies so far concludes that averagelearning achievements in mathematics and readingimproved between 2002-2006. However, it notes thatchanges in this area cannot be directly attributed to the2001 legislation because implementation has coincidedwith other national and state level programmes.
The study finds that achievement gaps between ethnicgroups have narrowed in some states, though once againstopping short of attribution. Moreover, in twenty-four of thirty-eight states with comparable data, differences in reading test scores remained unchanged between whiteand African-American pupils. Given that closing equitygaps is one of the reform’s key objectives, this evidencesuggests that it may be under-performing.
The No Child Left Behind legislation has generatedextensive debate in the United States. For instance,144 major education and labour organizations in 2008together called for major corrections to make the Act fairer and more effective. They questioned theoverwhelming reliance on standardized test andadvocated for wider measures to hold states and schooldistricts accountable. More broadly, critics of the Act suggest that the tests are too narrowly focused,encourage ‘teaching to the test’ and exclude low-scoringchildren to boost test results. They also sayimplementation of the Act is underfunded.
Sources: Center on Education Policy (2007); Forum on EducationalAccountability (2008).

90
02
Education f
or A
ll G
lobal M
onitorin
g R
eport
C H A P T E R 3
of controversy surrounding the record to date.
However, the evidence does not suggest that the
legislation has been an unequivocal success story.
Using monitoring to improve policy-making
Whatever the problems associated with high-stakes
testing, information from learning assessments
can play a critical role in informing policy design.
The following examples identify some key areas:
Defining minimum learning standards.In Lesotho and Sri Lanka, national learning
assessments have been used to establish
minimum learning standards against which
pupils’ achievements are monitored (Greaney
and Kellaghan, 2008). Kenya has used SACMEQ
results to set benchmarks for classroom
facilities, such as textbooks and desks per pupil
(Nzomo and Makuwa, 2006).
Informing curriculum reform. An evaluation
of the value of participating in PIRLS and TIMSS
found that twenty out of twenty-four low- and
middle-income countries participating indicated
that taking part in the assessments had
influenced changes in curriculum. In Romania,
for instance, poor results in TIMSS were a
‘wake-up call’ spurring curriculum changes.
Topics were added to the mathematics
curriculum, an integrated science curriculum
was approved, new teacher guides in science
were developed for some grades, and several
new chemistry and mathematics textbooks
were written (Gilmore, 2005).
Reviewing policy. High repetition rates have been
cause for concern in Senegal. Data from the
PASEC learning assessments from 1995 to 2000
were used to shed light on the effects of grade
repetition for primary school outcomes. The
results consistently showed that, on average,
Senegalese students who repeated a grade did
not perform better than those who did not repeat,
taking aspects such as family background,
school environment and initial achievement
levels into account. This gave further weight
to the education ministry’s desire to reduce
repetition. As a result, the government has
prohibited repetition for some primary grades
since 2003 (Bernard and Michaelowa, 2006).
Contributing to education planning and reform.Results from the SACMEQ cross-national
learning assessments in sub-Saharan Africa
have been used in national reviews and
commissions on the status of the education
systems in Mauritius, Namibia, Zambia, Zanzibar
(United Republic of Tanzania) and Zimbabwe.
These analyses of learning conditions have
played a role in formulation of sector or
subsector reform programmes (Greaney
and Kellaghan, 2008).
Information from learning assessments can also
play an important role in addressing equity goals.
One example comes from Viet Nam. In 2001 the
country conducted a national grade 5 learning
assessment in mathematics and reading. The
results provided a basis for understanding the
problems and identifying ways to improve education
quality in some of the country’s most deprived
areas. After controlling for socio-economic
background and school location, the assessment
showed strong correlations between pupil
achievements and both teacher qualifications and
availability of school resources. In 2003 Viet Nam
adopted new regulations for primary schools,
specifying minimum levels for several education
inputs, including learning materials, school
infrastructure, teacher qualifications and in-service
training. By 2005 the concerted efforts to raise
the quality of the learning environment had begun
to show results, with reduced gaps in quality
inputs between the poorest and richest districts
(Swinkels and Turk, 2006; World Bank, 2005f).
The experience in Viet Nam demonstrates a strong
link between assessment and policy design. Such
linkage is not always evident. By definition, ‘low-
stakes’ assessments generate weak incentives
to change. A survey covering Ethiopia, Malawi,
the Niger, Nigeria, South Africa and Uganda
showed that only one country had used the findings
from assessment exercises as a basis for allocating
resources to schools and only two had undertaken
campaigns to inform teachers or schools about the
assessment process (Kellaghan and Greaney,
2004). Limited public awareness is one factor
that may have weakened incentives in these cases:
nowhere were the assessment results subject
to parliamentary debate.
Good quality assessment systems are no guarantee
of effective integration into public policy.
Institutional structures and capacity are also
important. Bolivia, for example, has an evaluation
system called SIMECAL that is of very high
standard. It uses nationally developed test items
In Viet Nam,
using information
from learning
assessments has
helped to reduce
quality gaps
between the
poorest and the
richest districts
1 8 2

R A I S I N G Q U A L I T Y A N D S T R E N G T H E N I N G E Q U I T Y: W H Y G OV E R N A N C E M AT T E R S
that reflect Bolivia’s culture in both Spanish and
indigenous languages. The SIMECAL staff has high
levels of expertise. Yet despite the technical
excellence, inadequate funding has resulted in
sporadic and irregular testing. Moreover, weak
links between SIMECAL evaluations and policy
management units in the education ministry has
meant that policy development in several critical
areas, from pedagogy to curriculum development
and teacher training, has not been tied to
assessment results (World Bank, 2006a).
What conditions can facilitate better use of
assessment results? An environment promoting
close interaction between the various actors
in the education system is important. So is an
overall focus on supporting teachers’ professional
development. Recent practices in Uruguay are
instructive (Box 3.21).
As concern has shifted towards the poor quality
of education in many countries, monitoring is
emerging as a central governance theme.
The experiences of two countries at the forefront of
education reform are instructive. In post-apartheid
South Africa, the school management and public
financing systems have been transformed to
expand access and address equity concerns. Yet
the record on quality gains has been disappointing.
A national assessment in 2004 revealed that learner
performance on grade 6 tasks was worse than that
on grade 3 tasks in 2001 and that proficiency levels
were low in absolute terms (only 40% of answers
were correct). In Chile, sweeping reforms during
the 1990s produced disappointing outcomes with
respect to quality. National assessments point to
a very slow rate of improvement and international
assessments suggest that Chile has not overtaken
developing countries with more centralized
systems. One key problem identified in both
countries has been the lack of an effective
pedagogical management system – extending from
the setting of curriculum standards to supervision,
information management, school inspection and
support, and in-service training – to address
problems identified in monitoring exercises
(Crouch and Winkler, 2007).
Combining national assessment with school-level monitoring
To understand the realities facing schools,
information from international, regional and
national assessments needs to be combined with
monitoring at school level. School supervision is
an essential aspect of monitoring, not only to check
teacher and school performance but also to identify
and support needed quality improvements.
External assessment can be reinforced by school-
level assessment as part of broader quality
improvement strategies. This is an area in which
South Africa’s District Development Support
Programme has been attempting to strengthen
national commitment to equity. The programme
aims to improve education quality in grades 1 to 9 at
the weakest schools. Since its inception in 2000, the
programme has focused on improving classroom
learning, and school and district management.
To improve classroom assessment practices,
resource materials have been developed, and
extensive training and support provided to teachers.
External supervision and learning assessments
further underpin these school-level efforts.
Evaluations of the programme are largely positive.
They suggest that a gain in learning achievements
between 2000 and 2003 resulted partly from the
increased supervisory support available to schools
and teachers, and partly from increased use
of classroom assessments (Schollar, 2006).12
As the only direct institutional link between
classrooms and education ministries, school
supervision plays a crucial role in education system
management. School visits can allow supervisors
not only to support and monitor implementation of
official policies but also to bring school realities to
12. The District DevelopmentSupport Programme endedin 2003, and was succeededby the Integrated EducationProgramme.
Linking classrooms
and education
ministries, school
supervision plays
a crucial role in
education system
management
1 8 3
S t r e n g t h e n i n g t e a c h e r g o v e r n a n c e a n d m o n i t o r i n g
Box 3.21: Assessments inform teacher
support in Uruguay’s schools
Uruguay has managed to improve learning outcomesrapidly in recent years. Its quality improvement efforts have been informed by sample-based assessments aimed at strengthening pedagogical management in schools.
By combining the assessments with cluster-based teachertraining and support, spread over the whole school year,education authorities have turned information into policypractice. Evidence suggests that learning outcomesimproved in certain grades by 30% over six years. Specialmeasures have been taken to improve the functioning ofweaker schools. Important moves to redress learningdisparities have included targeting financial resourcesprimarily on the basis of poverty rather than test resultsand using test results to provide targeted support toteachers in weaker schools and districts.
Sources: Crouch and Winkler (2007); Ravela (2005).

90
02
Education f
or A
ll G
lobal M
onitorin
g R
eport
C H A P T E R 3
the attention of policy-makers. School supervision
systems in developing countries are under-
researched, though anecdotal evidence suggests
they are overstretched. With demanding mandates,
and limited human and financial resources, few
developing countries have supervision services that
are fit for the task at hand. However, in their quest
for quality education, many countries have changed
and clarified the role and structure of supervision
in recent years (De Grauwe, 2008). The experience
of Uganda shows that supervision can be used to
foster more cooperative approaches aimed at
raising learning achievement and reducing
inequality (Box 3.22).
The very large gaps in learning outcomes between
schools in many developing countries mirror other
inequalities in education and in society at large.
Supervision has a key role to play in closing these
gaps. What weak schools need is not just inspection
but also consistent pedagogical support, including
regular visits by support-oriented supervisors.
This implies radical institutional change, with
supervisors finding the right balance between
allowing schools sufficient autonomy and
intervening to identify performance problems
(De Grauwe, 2008).
One model based on a more collaborative and
supportive approach has been developed in Chile,
where each supervisor visits a limited number of
carefully selected schools, giving priority to the
weakest ones. To improve teaching and school
functioning, school plans and projects are
developed in collaboration with the supervisor.
Learning assessments allow the education ministry
and the supervision service to know which schools
to focus on. The most intricate challenge has been
changing the culture of the supervision service from
one of control over many schools to one of
supporting a few selected schools. That challenge
has been addressed through training, new job
descriptions with removal of all control functions
and the elaboration of new working tools.
Supervisors have found it difficult nonetheless
to abandon their tradition of control and to adopt
a support-oriented approach (De Grauwe, 2008).
Conclusion
Delivering high-quality education for all will require
far-reaching governance reforms in the areas
covered by this section. There are no ready-made
solutions to the problems identified. Clearly,
governments need to recognize that declines in
teacher pay and conditions have the potential to
damage morale, quite apart from reducing quality
in recruitment and the quantity of applicants
seeking to join the profession. It is important that
governments recognize the potential risks for equity
and education quality of scaling-up contract teacher
recruitment. In the case of teacher allocation,
far more emphasis has to be placed on the
development of incentives for greater equity,
in some cases through a stronger commitment
to the training and local recruitment of teachers
from marginalized groups and areas.
Learning assessments provide a valuable and
increasing flow of information. That information
could – and should – be used to identify the factors
behind low levels of learning achievement and
to map disparities in achievement. The limits of
high-stakes testing in strengthening accountability,
performance and equity have to be recognized.
At the same time, it is important for governments
to reinforce the institutional links between
assessment exercises, on the one hand, and public
policy development, monitoring practices and
school supervision on the other.
What weak
schools need
is not just
inspection but
also consistent
pedagogical
support
1 8 4
Box 3.22: Reforming school supervision in Uganda
Uganda’s recent strides towards improving the quality ofeducation have included a strengthened inspection service. Aftera slow start, the Education Standards Agency began operating in 2001, replacing an outdated inspectorate in the educationministry. Efforts have been made to tailor the service to what isfeasible with limited resources. Where the former body coveredsuch disparate areas as policy, curriculum development, exams,troubleshooting, staff development and independent schoolregistration, the new one focuses on school visits.
The inspection service reform drew on experience in Masindi,one of Uganda’s poorest districts, with many internally displacedfamilies from conflict-affected northern Uganda and refugeesfrom neighbouring countries. In 2000 Masindi scored among the lowest districts in the national primary-school leaving exam. An extensive district-based programme of school improvement,combining internal school evaluation and external district-basedsupervision, produced remarkable results: Masindi went fromone of the poorest-performing districts in 2000 to one of the top five in 2007. Know-how from Masindi was fed into the revised national inspection approach, which was subject to a national consultation in 2005.
Sources: Penny et al. (2008); Roebuck (2007).

R A I S I N G Q U A L I T Y A N D S T R E N G T H E N I N G E Q U I T Y: W H Y G OV E R N A N C E M AT T E R S
An integrated approachto education and povertyreduction: the missing link
Introduction
Accelerated progress towards EFA requires more
than increased public investment, more and better
equipped schools, and an increase in the number
of well-trained and motivated teachers. It also
requires progress towards poverty reduction and
a reduction in social disparities. Education reforms
can make an important contribution in both areas.
But good policies in the education sector cannot
compensate for weak policies on poverty reduction
or for the failure of political leaders to tackle
extreme inequality. Achieving EFA requires an
integrated approach to planning for education
and poverty reduction.
When they met in Dakar, governments recognized
that their ambition could not be achieved through
education reform alone. That is why they called for
EFA policies to be promoted within ‘a sustainable
and well-integrated sector framework clearly linked
to poverty elimination and development strategies’.
The engagement and participation of civil society
in the formulation, implementation and monitoring
of strategies was seen as an important means
to this end.
This section asks whether governments have acted
on their Dakar commitment. More specifically,
it examines how education has been integrated
into wider strategies for overcoming poverty and
inequality. The issues involved are highly political.
They relate directly to the power relationships
that sustain social inequities. Chapter 2 documents
the barriers to EFA created by disparities based on
wealth, gender, ethnicity and wider disadvantages.
In principle, the Dakar Framework commits
governments to rapid removal of these barriers.
Yet the disparities themselves indicate past and
present failure to address the underlying causes
of unequal educational opportunities. In short,
government tolerance of extreme inequality has
been, and remains, part of the problem.
This section explores the link between education
planning and wider policies for combating poverty
and inequality. It focuses on the treatment of
education within poverty reduction strategy papers
(PRSPs). These documents set out governments’
broad development priorities and provide a
framework for international cooperation.
Clearly, PRSPs are not the only measure of policy
coherence. But they do reveal something important
about the degree to which education is being
integrated into the wider public policies that shape
prospects for attaining the Dakar goals. PRSPs are
a vital link in the governance chain for education.
Apart from providing a broad framework for poverty
reduction policies, they represent a vehicle for
dialogue between a wide range of actors.
Planning is about more than producing technical
documents. National plans provide an opportunity
for governments to set out their goals and their
strategies for achieving them. They define a
purpose against which governments can be held
to account. Hence, plans – and planning processes
– are a vital part of the governance architecture.
The stated intent is to give civil society opportunities
to shape priorities and strategies, in the expectation
that this will assure greater responsiveness to the
marginalized. But have PRSPs provided a coherent
framework and facilitated real dialogue?
The central message of this section is that
education remains poorly integrated into poverty
reduction planning. With some exceptions,
governments have not acted on their commitments.
PRSPs in general fail to articulate clear strategies
either for overcoming poverty-related barriers
to education or for reducing inequalities. Most take
a narrow and reductionist approach to education,
rarely reflecting the broad EFA agenda. There are
promising experiences that PRSPs could draw on.
The development of integrated social protection
programmes in several countries shows that
interventions aimed at tackling social inequality
and reducing vulnerability have large potential
benefits for education. The record on participation
in planning processes is more encouraging:
PRSPs have widened the space for dialogue with
civil society. However, participation and ‘voice’
are not the same as influence and outcome –
and there have been distinct limits to the policy
influence of the poor and marginalized.
Education planning: stronger, but still not strong enough
Since the Dakar Forum many countries have
strengthened their education planning capabilities.
The 2008 Report provided an overview of
achievements in this area. It highlighted the greater
Education remains
poorly integrated
into poverty
reduction planning
1 8 5
A n i n t e g ra t e d a p p r o a c h t o e d u c a t i o n a n d p o v e r t y r e d u c t i o n : t h e m i s s i n g l i n k

90
02
Education f
or A
ll G
lobal M
onitorin
g R
eport
C H A P T E R 3
clarity evident in many national education plans
with respect to the formulation of clear objectives
and time-bound targets. Strategic priorities are also
more apparent: UPE is a well-defined core priority
and there is a strengthened focus on gender parity.
The development of sector-wide approaches
(SWAps) has played an important role in
strengthening national education planning.
Experience with SWAps over the past decade
indicates they are potentially more effective than
previous planning approaches in addressing
education quality and equity problems.
Sri Lanka provides an illustration (Box 3.23).13
While much has been achieved in education
planning, continued systemic challenges remain
in three areas. One of these is finance. Education
plans may set out medium-term targets but they
rarely include plausible cost estimates for achieving
them. That partly explains why education goals are
commonly absent from the medium-term financial
frameworks that shape real budget allocations
(FTI Secretariat, 2007b). One lesson from the
lengthy and not particularly encouraging history
of goal-setting in development is that targets that
are not backed by finance are seldom attained.
Another weakness has been the tendency of
planning documents to follow a highly generalized
blueprint. One recent assessment of forty-five
national education plans found remarkable
similarity in policy approach, with limited attention
paid to social and political context or to the
constraints faced by marginalized groups
(UNESCO-IIEP, 2006). This is unhelpful because
overcoming marginalization requires
the delineation of practical strategies within
a particular context.
Cross-sectoral planning weaknesses constitute
another area for concern. Education planners know
they are not operating in an insulated sector; they
recognize the enormous importance of poverty,
public health, child nutrition, social marginalization
and other factors in shaping prospects for
education. Yet the cross-sectoral planning
processes needed to address these problems
continue to be characterized by high levels of
fragmentation and weak political leadership.
The standard education-plan blueprint also tends
to downplay the importance of progress in some
key areas. For example, early childhood education,
literacy and non-formal education are often EFA
‘orphans’ (UNESCO, 2007a).
Poverty reduction strategies: new generation, old problems
When they were launched in 2000, PRSPs were
seen as a bold innovation in development
cooperation. The aim was to provide a
comprehensive integrated framework for placing
poverty reduction strategies at the centre of
macroeconomic policy. Each country was expected
to identify clear goals, which would be reflected
in short-term budget allocations and long-term
financial planning. In line with a broader shift away
Cross-sectoral
planning is
characterized by
fragmentation
and weak
political
leadership
13. Boxes on Ethiopia,Nepal and the UnitedRepublic of Tanzania in Chapter 2 furtherillustrate the benefits of SWAps in addressingequity challenges.
1 8 6
Box 3.23: Strengthening equity through sector-wide approaches:
Sri Lanka’s experience
Sri Lanka has a long-standing commitment to equityin education planning. Even so, persistent widespreadpoverty (estimated to affect one-quarter of thepopulation) and the impact of ethnic conflict in thenorth and east remain challenges. The devastatingeffects of the 2004 tsunami are also still being felt.
The development of the Education SectorDevelopment Framework and Programme for2006–2010 has helped strengthen Sri Lanka’sapproach to tackling inequality. This SWAp recognizesthat equity is a matter not just of access but also ofquality and resourcing, and it attempts to mainstreamvarious aspects of equity from the outset. It provides
a clear strategic approach and monitoring framework,linked to a medium-term budgetary frameworkallowing resources to be aimed at the mostdisadvantaged schools.
One important aspect is that the SWAp also setsquantifiable goals for reducing disparities. Equity-based targets extend from the number of disabledstudents enrolled in regular schools, the number of special education centres and centres for streetchildren, and the presence of professionally qualifiedteachers in difficult schools to learning outcomes by school, district, urban/rural area and gender.
Source: Jayaweera and Gunawardena (2007).
R A I S I N G Q U A L I T Y A N D S T R E N G T H E N I N G E Q U I T Y: W H Y G OV E R N A N C E M AT T E R S
from loan conditionality and project-based
approaches, PRSPs defined a new set of core
principles. They were to be country owned,
developed through dialogue with civil society,
results oriented, long term, and comprehensive
and multidimensional in their approach to poverty.
PRSPs remain a core poverty reduction planning
document. While some commentators downplay
their importance in public policy, PRSPs play a key
role in setting and reflecting national priorities and
strategies. They also define the terms and broad
goals of the ‘aid partnership’ between developing
country governments and aid donors – an issue
explored in Chapter 4. Fifty-four countries now have
operational PRSPs. Most are low-income countries,
twenty-eight of them in sub-Saharan Africa.
It would be a mistake to overstate the significance
of PRSPs or to exaggerate the level of country
ownership they imply. Donors retain a strong
influence in framing PRSP priorities in many
countries. However, given their scope and the
intensity of the dialogue surrounding their
development, PRSPs provide important insights
into the place of education in national poverty
reduction processes.
The implementation period for second-generation
PRSPs is now well advanced. Have the lessons
of the first generation been absorbed? Has there
been a significant improvement in quality? In some
countries both these questions can be answered
in the affirmative. In Uganda, the first country to
adopt a PRSP, the PRSP built on the existing
Poverty Eradication Action Plan to set out well-
defined goals and budget commitments aimed
at accelerating progress in health, education and
the development of rural infrastructure, with
positive results (see Chapter 4). These strong
foundations have been built upon, facilitating
a marked increase in programme-based aid from
many donors. Moreover, in countries with well-
developed education sector plans, there is evidence
that education planning and poverty reduction
strategies are mutually supportive. For example,
the United Republic of Tanzania has steadily
strengthened its institutional capacity, resulting
in better integration of education within a poverty
reduction framework (Box 3.24).
Wider experience is less encouraging. Cross-
country evidence suggests that second-generation
PRSPs suffer from many of the same problems
as their predecessors. They continue to focus on
a narrow range of education goals and targets,
often limited to those associated with the MDGs.
Attainment of UPE heavily outweighs wider
education goals in priority-setting. Moreover,
surprisingly little attention has been paid to the
interaction between deprivation in education and
other areas in explaining the intergenerational
transmission of poverty. Detailed evidence relating
to the types of policies that might break the vicious
cycle of education deprivation and poverty is in
similarly short supply (Rose and Dyer, 2006). As
a result, many PRSPs fail in their core purpose.
There is also little evidence to suggest that the
development of second-generation PRSPs has
helped break down the fragmentation in planning
between education and other line ministries. Such
fragmentation has real consequences for poor and
vulnerable people – and for progress towards the
goals set in the Dakar Framework for Action.
In exploring the link between education planning
and poverty reduction, this EFA Global Monitoring
Report has carried out a detailed review of eighteen
second-generation PRSPs.14 Part of the aim was to
examine whether there has been a change from the
approaches set out in the first PRSPs. In particular,
the review considered whether the latest PRSPs
14. The eighteen countrieswith two PRSPs included inthe review are: Burkina Faso,Cambodia, Ethiopia, theGambia, Ghana, Guinea,Madagascar, Malawi, Mali,Mauritania, Mozambique,Nicaragua, Rwanda, Senegal,the United Republic ofTanzania, Uganda, Viet Namand Zambia. Table 3.10 at theend of this Chapter presentsa selected summary of thisreview.
1 8 7
A n i n t e g ra t e d a p p r o a c h t o e d u c a t i o n a n d p o v e r t y r e d u c t i o n : t h e m i s s i n g l i n k
Box 3.24: Building capacity for pro-poor
reform in the United Republic of Tanzania
The relationship between education and poverty has beena policy focus in the United Republic of Tanzania sinceindependence. It was central to President Nyerere’s policy of Education for Self-Reliance. The PRSP process has built onthis existing political commitment to strengthen institutionalcapacity for pro-poor reform.
The country’s first PRSP in 2000 was relatively narrow,focusing on macroeconomic policy and key social investments.However, as implementation unfolded, the strategy was steadilybroadened. Sector strategies were further developed andincorporated into the overall development agenda. With thesecond PRSP, the 2005 National Strategy for Growth andReduction of Poverty, the medium-term developmentprogramme was clearly articulated across a broad range ofsectors, incorporated cross-cutting issues and was linked tomedium-term countrywide goals. Attention within the educationsector has also broadened: while the first plan focused onprimary schooling, the second PRSP includes attention tosecondary education, in accordance with priorities set in thecountry’s Secondary Education Sector Development Plan.
Source: Wedgwood (2007); World Bank and IMF (2005).

90
02
Education f
or A
ll G
lobal M
onitorin
g R
eport
C H A P T E R 3
were less prone to blueprint approaches and more
geared towards addressing the underlying causes
of disparity in education. Table 3.10, at the end of
this chapter, summarizes some of the key findings.
The conclusions to emerge from the review are not
encouraging. They point to a broad failure on the
part of governments and donors to articulate a
more integrated approach to education planning.
With some exceptions, PRSPs also downplay the
issues raised by extreme inequalities in opportunity.
Four areas stand out as meriting an urgent rethink
of current approaches:
the weak link with the EFA agenda;
problems in defining credible equity-based targets;
the separation of education from broader
governance reforms;
limited attention to wider drivers of education
disadvantage.
Weak link to the EFA agenda
The point of reference for most first-generation
PRSPs was the MDGs and associated targets for
2015 (Caillods and Hallak, 2004). This focus appears
to have strengthened over time. One practical
consequence is that most PRSPs attach far more
weight to the quantitative target of UPE by 2015
than to other EFA goals. Where education equity
is identified as needing attention, it is almost
exclusively associated with strategies for improving
access to primary schooling.
While UPE is undeniably important, this is a highly
limited approach. The need for particular attention
to disadvantaged learners is rarely recognized
in PRSPs. Meanwhile, wider EFA goals are either
downplayed or separated from a broader poverty
reduction agenda. To the extent that the eighteen
second-generation PRSPs mention ECCE at all,
it is still frequently seen as a means of improving
learning in primary schools rather than as a source
of progress in child health, nutrition and cognitive
development with potential benefits for primary and
secondary education – and for wider opportunities
(see Chapter 2). Strategies concerning technical
and vocational education and training (TVET) and
skills development are often considered principally
in relation to the role of the private sector. The
distribution of benefits in TVET provision is rarely
considered – and the linkage to poverty reduction
is often vague. Other intersectoral links between
education and employment strategies are barely
visible. Literacy is another part of the EFA agenda
for which vital intersectoral links are absent.
This is surprising in view of the critical role of
literacy in overcoming poverty, inequality and
political marginalization.
One consequence of the overwhelming weight
attached to primary education is the neglect of
secondary schooling. This is counterproductive at
many levels. As primary school completion rates
increase, demand for secondary school places will
grow. Indeed, improving access to secondary
school is one of the conditions in many countries
for creating incentives to complete primary
education. Some recent PRSPs pay more attention
to equity considerations at secondary level,
although the focus is primarily on building schools
(Table 3.10). The barriers facing poor households in
getting children into and through secondary school
seldom figure in PRSPs. This is despite the fact
that public policies in this area can have a powerful
impact on gender equity – as witnessed by the
experience of Bangladesh (see Chapter 2).
Fragmentation is at the heart of many of these
problems. To take one example, progress in
literacy requires coordination across a wide range
of government bodies. PRSPs rarely acknowledge
this, even though most successful policies
explicitly address the problem of institutional
fragmentation. Madagascar’s programme on
non-formal education is an example. It is based on
cooperation between different parts of government
and various United Nations agencies, and
integrates literacy into several specialized areas
of development. The programme is noted for
contributing to a ‘strong literacy lens’ in the
national PRSP (UNESCO, 2008, p. 10, cited in
Robinson-Pant, 2008). Such experience is,
however, extremely rare.
Problems in target-setting
For targets to be meaningful guides to policy, they
must be both credible and consistent. Those set
in many PRSPs are neither. For example, Senegal
aims to achieve a primary school NER of 90%
according to an MDG follow-up document, while its
PRSP puts the objective for this indicator at 98%;
the United Republic of Tanzania sets a target
of primary school NER at 99% by 2010, but aims
for only 30% of orphans and vulnerable children
enrolled or having completed primary education
by that year (UNESCO-IIEP, 2006). Such
inconsistencies send confused signals to budget
planners and other policy-makers involved in
the development of national strategies.
The narrow focus
on primary
education has
eclipsed other
EFA goals
and the broader
development
agenda
1 8 8
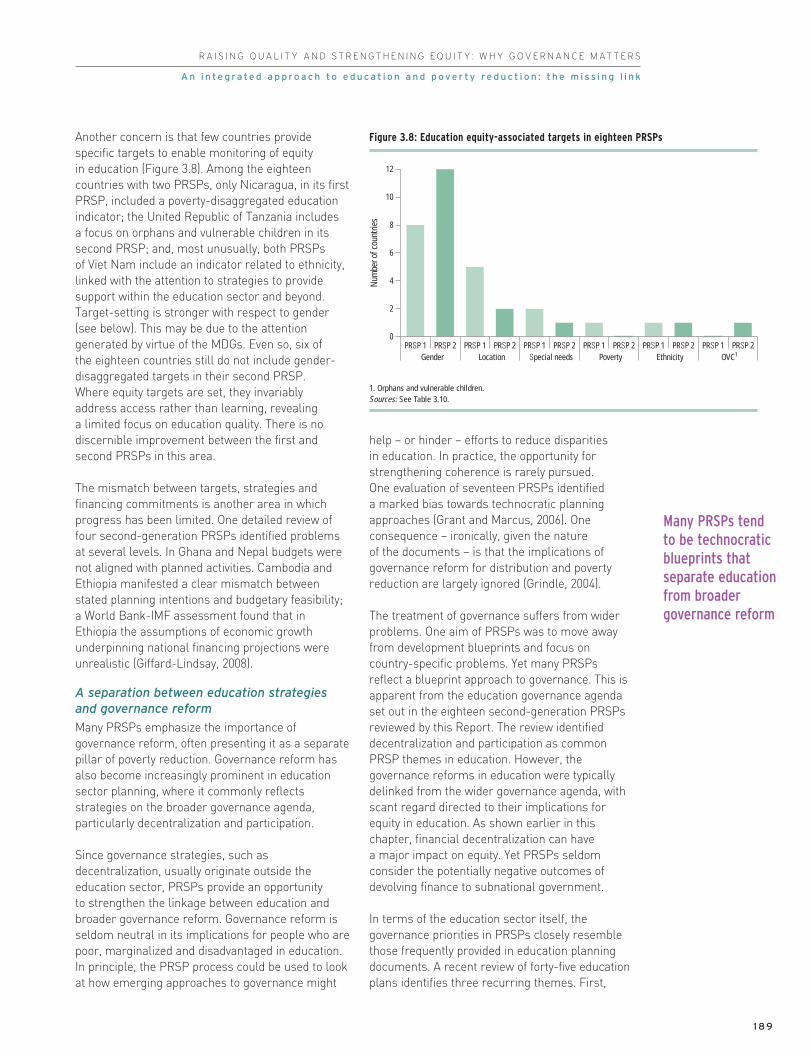
R A I S I N G Q U A L I T Y A N D S T R E N G T H E N I N G E Q U I T Y: W H Y G OV E R N A N C E M AT T E R S
Another concern is that few countries provide
specific targets to enable monitoring of equity
in education (Figure 3.8). Among the eighteen
countries with two PRSPs, only Nicaragua, in its first
PRSP, included a poverty-disaggregated education
indicator; the United Republic of Tanzania includes
a focus on orphans and vulnerable children in its
second PRSP; and, most unusually, both PRSPs
of Viet Nam include an indicator related to ethnicity,
linked with the attention to strategies to provide
support within the education sector and beyond.
Target-setting is stronger with respect to gender
(see below). This may be due to the attention
generated by virtue of the MDGs. Even so, six of
the eighteen countries still do not include gender-
disaggregated targets in their second PRSP.
Where equity targets are set, they invariably
address access rather than learning, revealing
a limited focus on education quality. There is no
discernible improvement between the first and
second PRSPs in this area.
The mismatch between targets, strategies and
financing commitments is another area in which
progress has been limited. One detailed review of
four second-generation PRSPs identified problems
at several levels. In Ghana and Nepal budgets were
not aligned with planned activities. Cambodia and
Ethiopia manifested a clear mismatch between
stated planning intentions and budgetary feasibility;
a World Bank-IMF assessment found that in
Ethiopia the assumptions of economic growth
underpinning national financing projections were
unrealistic (Giffard-Lindsay, 2008).
A separation between education strategiesand governance reform
Many PRSPs emphasize the importance of
governance reform, often presenting it as a separate
pillar of poverty reduction. Governance reform has
also become increasingly prominent in education
sector planning, where it commonly reflects
strategies on the broader governance agenda,
particularly decentralization and participation.
Since governance strategies, such as
decentralization, usually originate outside the
education sector, PRSPs provide an opportunity
to strengthen the linkage between education and
broader governance reform. Governance reform is
seldom neutral in its implications for people who are
poor, marginalized and disadvantaged in education.
In principle, the PRSP process could be used to look
at how emerging approaches to governance might
help – or hinder – efforts to reduce disparities
in education. In practice, the opportunity for
strengthening coherence is rarely pursued.
One evaluation of seventeen PRSPs identified
a marked bias towards technocratic planning
approaches (Grant and Marcus, 2006). One
consequence – ironically, given the nature
of the documents – is that the implications of
governance reform for distribution and poverty
reduction are largely ignored (Grindle, 2004).
The treatment of governance suffers from wider
problems. One aim of PRSPs was to move away
from development blueprints and focus on
country-specific problems. Yet many PRSPs
reflect a blueprint approach to governance. This is
apparent from the education governance agenda
set out in the eighteen second-generation PRSPs
reviewed by this Report. The review identified
decentralization and participation as common
PRSP themes in education. However, the
governance reforms in education were typically
delinked from the wider governance agenda, with
scant regard directed to their implications for
equity in education. As shown earlier in this
chapter, financial decentralization can have
a major impact on equity. Yet PRSPs seldom
consider the potentially negative outcomes of
devolving finance to subnational government.
In terms of the education sector itself, the
governance priorities in PRSPs closely resemble
those frequently provided in education planning
documents. A recent review of forty-five education
plans identifies three recurring themes. First,
Many PRSPs tend
to be technocratic
blueprints that
separate education
from broader
governance reform
1 8 9
A n i n t e g ra t e d a p p r o a c h t o e d u c a t i o n a n d p o v e r t y r e d u c t i o n : t h e m i s s i n g l i n k
Num
ber o
f cou
ntrie
s
0
2
4
6
8
10
12
PRSP 1Gender Location Special needs Poverty Ethnicity OVC1
PRSP 2 PRSP 1 PRSP 2 PRSP 1 PRSP 2 PRSP 1 PRSP 2 PRSP 1 PRSP 2 PRSP 1 PRSP 2
Figure 3.8: Education equity-associated targets in eighteen PRSPs
1. Orphans and vulnerable children.Sources: See Table 3.10.

90
02
Education f
or A
ll G
lobal M
onitorin
g R
eport
C H A P T E R 3
decentralization, accompanied by aspirations for
grass-roots participation, features prominently
in thirty-six plans, including all those in Latin
America and in South and West Asia, and all but
one in sub-Saharan Africa (Zimbabwe being the
exception). The second theme, school-based
management and school autonomy, figures in
seventeen plans, most notably in Latin America.
The third theme, appearing in thirty plans, is
increased recourse to and support for private
providers, particularly in South and West Asia
and in sub-Saharan Africa (UNESCO-IIEP, 2006).
Apart from this striking uniformity, some
obvious equity-related questions arise from
the governance content of PRSPs. How will
decentralization be pursued without widening
financing gaps between richer and poorer
regions? If authority is devolved to regional and
local governments and schools, what measures
will be taken to facilitate participation by
marginalized groups? If the private sector is to
play an expanded role, what regulatory measures
will be put in place to prevent the development
of a two-tier system and to keep poor households
from being priced out of provision? How will the
education ministry fulfil its mandate of assuring
EFA if it lacks control over a wide variety of private
providers and no institutional mechanism for
monitoring them exists? These are some of
the challenges raised in earlier sections
of the chapter that PRSPs have the potential
to address – but they are not doing so.
The experience of Nepal draws attention to the
importance of country-specific circumstances.
As Chapter 2 notes, Nepal has made great strides
in education planning within a sector-wide
framework, resulting in improvements in access
and equity. However, governance challenges
remain. Drawing up uniform ‘good governance’
blueprints is a simple enough exercise but, under
the conditions prevailing in Nepal, decentralization
and devolution can have adverse consequences
linked to a lack of capacity or imbalances in
political power and can as a result have the effect
of disadvantaging certain groups (Box 3.25).
Education missing in cross-sectoralapproaches
Recognition that poverty is multidimensional
is at the heart of the PRSP concept. Yet strategies
for tackling multidimensional poverty are often
conspicuous by their absence. An earlier review
of PRSPs carried out in 2003 found that the
education component was little more than a
‘copy-summary’ of education ministry plans.
More broadly, education sector planning was
weakly integrated into poverty reduction strategy
formulation and, to an even greater degree, into
budget planning (Caillods and Hallak, 2004). One
more recent review finds that PRSPs continue
to present a summary of education plans (Giffard-
Lindsay, 2008). While this has the advantage of
ensuring that priorities developed in the education
sector are aligned with those in PRSPs, it means
the potential of PRSPs to address causes of
education disadvantage originating outside the
sector is not being realized. This is arguably the
most serious of all PRSP failings. While education
policy can make a real difference in extending
opportunity, progress in education depends
critically on addressing the underlying causes
of poverty and inequality outside of the school.
Real progress
in education
depends
on addressing
the underlying
causes of poverty
and inequality
outside
the school
1 9 0
Box 3.25: Decentralization in Nepal:
a difficult journey
Central to the education strategies in Nepal’s PRSP(which corresponds to its tenth national plan,2002–2007), and education planning in the countrymore generally, is the devolution of schoolmanagement, including teacher recruitment, to communities. Initiatives are being fundedthrough District Development Councils butimplementation has not been straightforward for a number of reasons:
Line ministries’ reluctance to relinquish controlof budgets and programmes is stalling theprocess.
Political uncertainty, resistance from somegroups, security constraints and weakmonitoring have also hampered implementation.
Many schools lack the necessary financial and technical capacity.
Parents have trouble judging school quality and influencing government decisions, whichaffects school management committee activitiesand weakens accountability by governmentdecision-makers.
Because the central government handed down a fixed programme framework and budgetallocation, communities feel burdened ratherthan empowered.
Sources: Acharya (2007); International DevelopmentAssociation and IMF (2006); Nepal National PlanningCommission (2005).

R A I S I N G Q U A L I T Y A N D S T R E N G T H E N I N G E Q U I T Y: W H Y G OV E R N A N C E M AT T E R S
The problem can be illustrated by reference to six
areas highlighted in Chapter 2, in which initiatives
outside education are critical to EFA progress:
tackling gender equality;
reducing child malnutrition;
responding to HIV/AIDS;
addressing disability;
overcoming marginalization;
responding to problems associated with conflict.
Gender equality features less prominently than
gender parity. Gender is more visible in PRSPs than
other dimensions of education inequity. Attention
to gender parity has been growing: twelve of the
eighteen countries in this Report’s analysis have a
second PRSP that includes gender-disaggregated
targets (Figure 3.8). There are also promising signs
that some of these countries’ strategies now go
beyond targeting headcount parity in school and
are seeking to address wider issues of inequality,
such as violence and abuse in schools (Table 3.10).
Nevertheless, gender equity in PRSPs focuses on
improving girls’ access to education. This narrow
approach can be traced to education plans and,
to some degree, the MDG framework. A review of
twenty-eight education plans by the EFA Fast Track
Initiative (FTI) showed that half lacked a strategy for
girls’ education. Where ‘strategies’ were included,
they took the form of a list of unprioritized
interventions (FTI Secretariat, 2007b).
Restricted approaches to gender have important
analytical and wider policy consequences. Consider
the interface between female education and the
position of women in labour markets. In
Bangladesh, a range of education policies –
including increased spending, stipends for girls’
secondary education and recruitment of more
female teachers – have played an important role
in strengthening gender parity. However, one of the
most critical drivers of change has been the income
and empowerment effects associated with mass
female employment in the garment industry
(Hossain, 2007; Schuler, 2007). In this context,
it could be argued that change in education has
been driven to a large degree by changes in
employment and labour markets. From a policy
perspective, one conclusion might be that education
planning should consider the potential benefits of
policy interventions in areas that shape women’s
lives and aspirations, including the strengthening
of employment rights and minimum wage provision.
The relevant conclusion that can be drawn for
PRSPs is that what happens in employment
is an education issue.
Malnourished children. EFA cannot be achieved
while mass childhood malnutrition continues at
current levels (Chapter 2). In countries where
stunting affects 30% to 40% of the population,
the goal of UPE by 2015 is out of reach. This is
a challenge that cannot be addressed through
compartmentalized policies. Achieving
breakthroughs requires secure access to adequate
food, a sanitary environment, adequate health
services and education. It also requires political
commitment from a variety of sectors, including
agriculture, local government, health, water and
sanitation, environment, public works and
education, as well as links with finance, economic
planning and justice.
Most PRSPs point to a combination of neglect
and highly fragmented approaches to malnutrition
(Grant and Marcus, 2006; Shekar and Lee, 2006).
The neglect is related to the insufficient attention
that has been directed towards malnutrition under
the MDG framework, which often guides priorities
in PRSPs. In turn, this problem can be traced to the
absence of a visible constituency in a position to put
malnutrition on the political agenda (Benson, 2004).
The malnourished are not just widely dispersed –
they are overwhelmingly poor and marginalized.
Yet the neglect of policy options associated with
nutrition affects the lives of young children and
the educational opportunities of those who survive.
This neglect was captured in a recent review of
forty PRSPs for countries where malnutrition is
particularly acute:
Only thirteen countries included activities
to address vitamin A deficiency and anaemia,
despite recognition that they are public health
problems in the vast majority of the forty
countries.
Only 35% of the PRSPs allocated budget
resources specifically for nutrition. Yet more
than 90% mentioned food security interventions,
even when food security was not necessarily
the main problem (Shekar and Lee, 2006).
PRSPs often identify malnutrition as an important
symptom of poverty yet fail to include actions or
budgets for improving nutrition. Where budgets
are included, they may cover only micronutrient
Achieving
breakthroughs in
childhood nutrition
requires political
commitment
from a variety
of sectors
1 9 1
A n i n t e g ra t e d a p p r o a c h t o e d u c a t i o n a n d p o v e r t y r e d u c t i o n : t h e m i s s i n g l i n k

90
02
Education f
or A
ll G
lobal M
onitorin
g R
eport
C H A P T E R 3
programmes or specific interventions. School
feeding is one common intervention, although
such programmes are not always found to have
much impact on nutrition – particularly for children
who are too ill to attend school in the first place
(Shekar and Lee, 2006).
There are exceptions to this picture of
fragmentation. Nutrition is among the six pillars
of Bangladesh’s PRSP, which has helped
institutionalize nutrition in the country’s
development agenda, building on the earlier
Bangladesh Integrated Nutrition Project and
National Nutrition Project. In Madagascar nutrition
is being mainstreamed and scaled up after project
experience. The Ethiopian government has
developed a national nutrition strategy with
coordinated support from development partners
(Shekar and Lee, 2006). Nevertheless, the more
common institutionalized failure of PRSPs
to address the crisis in malnutrition points
to a deeper obstacle to progress towards EFA.
HIV/AIDS: the high price of uncoordinated
responses. The devastating impact of HIV/AIDS
on education systems in highly affected countries
has been extensively documented. Yet many of
these countries have not developed an effective
planning response to prevent new infections
and to limit the effect of HIV/AIDS on families,
communities and schools. In many cases the focus
has been on curriculum reform in education to
include teaching on HIV/AIDS prevention rather
than an integrated response aimed at addressing
the multiple disadvantages faced by children
affected by HIV/AIDS (Table 3.10). There are
exceptions to this rule, as the experience of
Cambodia shows (Box 3.26).
The approach to HIV/AIDS and education in PRSPs
is closely associated with wider failures in
education planning. A review of twelve FTI-
endorsed education plans found considerable
variability in how HIV/AIDS was addressed: five
made no mention of it and only four had specific
cost estimates (Clark and Bundy, 2004). Follow-up
research found that the FTI appraisal and
endorsement process was still uneven despite
amendments to the guidelines following the first
report (Clark and Bundy, 2006). Three of the eight
plans endorsed had no HIV/AIDS component, even
though two of the countries involved have a
generalized HIV epidemic (HIV prevalence above 1%
in the general adult population); and two had only a
limited set of interventions. More promisingly, the
other three – Ethiopia, Kenya and Lesotho – were
moving towards a comprehensive response and
provided good examples of what could be achieved.
Disabled children: little evidence of inclusive
approaches. Disability is a significant source of
inequality and marginalization in education (see
Chapter 2). If governments are to get the remaining
out-of-school children into school, removing
barriers facing disabled children is one priority.
Another is the creation of inclusive education
systems that respond to varying needs. A shift
towards more inclusive systems is supported
by the Convention on the Rights of Persons with
Disabilities, which came into force in May 2008.
It not only recognizes that inclusive education
is a right, but calls for an improved educational
environment for the disabled and measures
to break down barriers and stereotypes related
to disability (United Nations, 2006).
Progress in recognizing disability as an area
needing policy attention has been limited. Only ten
of the twenty-eight education plans endorsed by the
There is slow
progress in
integrating
HIV/AIDS and
children with
disabilities into
multisectoral
planning
1 9 2
Box 3.26: Intersectoral planning on
HIV/AIDS and education in Cambodia
Cambodia’s Ministry of Education, Youth andSports (MOEYS) established an InterdepartmentalCommittee on HIV/AIDS in 1999 to coordinatemainstreaming of HIV/AIDS issues in the educationsector. The committee, chaired by the MOEYSsecretary of state, comprises representatives offifteen departments and institutes. It has ensuredthat priority is given to HIV/AIDS, which since 2001has been referred to as a key cross-cutting priorityin Education Strategic Plans (2001–2005 and2006–2010), in the annual Education SectorSupport Programme and in the PRSP (the NationalStrategic Development Plan, 2006–2010). In termsof the curriculum, HIV/AIDS is integrated as aregular topic in primary and secondary schools,and in non-formal education settings, and is part of pre- and in-service teacher training. MOEYS hasa strategic plan on HIV/AIDS (2008–2012) andrecently became the first Cambodian ministry to adopt a workplace policy on the issue. Politicalcommitment is reported to have contributed to a rapid decline in the prevalence of HIV, from 3% in 1997 to 1.9% in 2005.
Source: Cambodia Ministry of Education, Youth and Sports,and Interdepartmental Committee on HIV/AIDS (2007).

R A I S I N G Q U A L I T Y A N D S T R E N G T H E N I N G E Q U I T Y: W H Y G OV E R N A N C E M AT T E R S
FTI between 2002 and 2006 included a strategy for
children affected by disability. While thirteen others
mention disability, there is little detail of strategies
for the inclusion of disabled children in education,
and five make no mention at all (World Vision, 2007).
Ensuring that disabled children receive an inclusive
education demands a multisector approach. PRSPs
could play an important role in coordinating health
and social welfare issues that affect educational
opportunities and outcomes for disabled children,
such as nutrition, access to health services, early
childhood care and social assistance. The United
Republic of Tanzania, with its 2003 National Policy
on Disability, is a rare example of a country that
includes targets and strategies aimed at increasing
educational opportunities for children with
disabilities in its second PRSP (Figure 3.8) (World
Vision, 2007). PRSPs that include strategies aimed
at supporting children with disabilities tend to focus
on school infrastructure and sometimes curriculum
relevance (Table 3.10). Few PRSPs and education
plans address the interlocking forms of social
exclusion that children with disabilities often face.
The ‘invisible’ marginalized. Chapter 2 shows that
simply living in a particular part of a country can
reinforce disadvantage in educational opportunities.
An Oxfam review of first-generation PRSPs found
that only a few had education strategies for the
special needs of marginalized or impoverished areas
of countries (Oxfam International, 2004). Second-
generation PRSPs continue to pay sparse attention
to geographic factors limiting the visibility of
particular groups (Table 3.10) (Chronic Poverty
Research Centre, 2008). Uniform strategies are
commonly identified, with insufficient attention to
the ways in which forms of disadvantage vary for
different population groups geographically; targets
are usually not differentiated by location (Figure 3.8).
Where PRSPs do address geographic imbalances,
they usually focus on disadvantaged rural areas,
often failing to recognize the plight of slum dwellers
(Chronic Poverty Research Centre, 2008). There is,
moreover, almost no mention in recent PRSPs of
the educational needs of child migrants (whether
with their families or alone) (Black, 2004). Given that
children of both domestic migrants and, in many
cases, cross-border migrants are among the most
disadvantaged in education, this is a serious
omission. Similarly, children living on the street
are seldom considered as a distinctive group
facing disadvantage.
Also neglected are ethnic minorities. Where they
do appear in PRSPs, the main strategy aimed
at overcoming inequalities is associated with
educational access (Grant and Marcus, 2006).
But children from minority groups face exclusion
beyond the school environment. Kenya provides
a rare illustration of an integrated approach to the
needs of marginalized people with its Pastoralist
Thematic Group, which influenced the PRSP
(Box 3.27). Attention to religious minorities is rarer
still – none of the eighteen second-generation
PRSPs refers to education of religious minority
groups (Table 3.10).
Children in conflict-affected states are too often an
absent constituency. Many of the world’s children
without any opportunity to attend school live in
fragile states. In some cases, their lives are directly
affected by violence and civil conflict. In others,
their countries are undergoing post-conflict
reconstruction. Either way, with weak institutions,
limited resources and often restricted government
authority, fragile states face distinctive problems
in planning for education and poverty reduction.
Children from
marginalized
or impoverished
areas and ethnic
minorities need
greater visibility
in planning
1 9 3
A n i n t e g ra t e d a p p r o a c h t o e d u c a t i o n a n d p o v e r t y r e d u c t i o n : t h e m i s s i n g l i n k
Box 3.27: Getting pastoralist concerns
onto the PRSP agenda in Kenya
The pastoralists of Kenya’s arid and semi-aridregions make up about a quarter of the totalpopulation. In 2000 only 20% of their children hadthe opportunity to attend school. Yet the interimPRSP totally neglected pastoralist issues.
This picture started to change from early 2001 when a Pastoralist Thematic Group was included in PRSP consultations. There was wide-rangingdiscussion on whether to present these concerns asa cross-cutting theme in a separate chapter or fitthem to each ministry’s priorities. In the final PRSP(Investment Programme for the Economic RecoveryStrategy for Wealth and Employment Creation,2003–2007), pastoralist issues were discussed under the theme of human resource development.The discussion combined a number of interlinkedaspects, including closing the gap with the rest of the country by developing a creative schoolingprogramme for pastoralist children, strengtheningcommunity-based health care systems andpreventive medicine, and improving food securitythrough community-based early warning systems. A target of increasing primary enrolment amongpastoralists to 40% was adopted.
Source: Abkula (2002).

90
02
Education f
or A
ll G
lobal M
onitorin
g R
eport
C H A P T E R 3
Many lack the technical capacity to develop plans.
Political commitment is often constrained and likely
to result in particular groups being ignored in the
planning process. Recent experiences with PRSPs
developed in Afghanistan and the Democratic
Republic of the Congo show nonetheless that, even
in particularly challenging contexts, it is possible
to develop conflict-sensitive education strategies,
to varying degrees of success.
Afghanistan demonstrates the importance of
developing an education plan that can provide the
basis for conflict-sensitive strategies in the PRSP.
The development of the country’s Education
Strategic Plan under the leadership of the
education minister is a considerable achievement
associated with a series of key changes in
management of the sector. The plan is incorporated
under Social and Economic Development in the
2008 Afghanistan National Development Strategy,
the country’s PRSP. Given the technical work
already undertaken for the sector strategy, the
education sector was well advanced for inclusion
in the national development strategy.
Conflict and reconstruction define the context
for education planning. Afghanistan faces some
of the world’s highest estimated rates of disability
and gender inequality. It is estimated that half
the school-age population is out of school; thus,
the government’s aim to achieve primary NERs
of at least 60% for girls and 75% for boys by 2010
is laudable. However, as the PRSP notes: ‘threats
to schools, destruction of school buildings, killing
and maiming of students and teachers is
increasing, particularly in the southern provinces’.
Schools are not always considered safe, a fact
affecting the enrolment of girls in particular.
Against this backdrop, Afghanistan still has far to
go to achieve EFA and to narrow the gender gap.
While the Education Strategic Plan and PRSP
provide a clear basis for moving in the right
direction, along with clear signals of political
commitment, some commentators have pointed
to the need for greater consideration to be given to
strategies that can address the impact of security
issues on the education sector (Greeley, 2007a).
The specific challenges posed for education by
conflict vary across countries. In the Democratic
Republic of the Congo, education is at the heart
of a reform process whose urgency is underscored
by recognition that broader state legitimization
depends in large measure on the perceived
strength of government commitment to improving
education provision (Greeley, 2007b). As a marker of
such commitment, the government elected in 2006
has developed a PRSP, the Poverty Reduction and
Growth Strategy Paper. Education appears under
the pillar of improving access to social services and
reducing vulnerability. The paper identifies core
problems in the sector, including deterioration in
the primary GER from 92% in 1972 to 64% in 2002
and a stagnant secondary GER at 30%. However,
while there are some similarities to Afghanistan
in terms of the formal PRSP approach, the
substantive differences are also marked. In
contrast to Afghanistan, the government has not
yet developed a more detailed education sector
strategy that takes into account the realities in
the country. Thus the PRSP deals with governance,
provision of free education and equity issues,
but lacks details of how to achieve the goals set out.
Given the devastating impact of conflict on nutrition,
health, poverty and security, there is an urgent need
for policies that address the real problems facing
the Democratic Republic of the Congo.
Integrated social protection for the poor and vulnerable
The compartmentalized approach to planning
evident in many PRSPs contrasts strongly with
emerging approaches to tackling poverty and
inequality. One example is social protection. Many
of these approaches place an emphasis on linkages
between education, health and employment –
and on policy integration across sectors. They
also stress the importance of equipping poor
households with the capabilities they need to break
the cross-generational transmission of poverty.
Recognizing that poverty is multidimensional,
many governments are introducing programmes
that target reductions in risk and vulnerability at
several levels in health, nutrition, education and
employment. ‘Social protection’ describes a broad
set of policies that can help poor and vulnerable
households manage risk through transfers of cash,
food or entitlements to key services during critical
periods (Marcus, 2007). For households lacking
assets or insurance, a drought, a flood, a shift in
labour market conditions or an illness can give rise
to coping strategies that lead to long-run cycles
of deprivation. For example, in East Africa drought
is often the catalyst for reduced nutrition and
withdrawal of children from school. Poor
households may also withdraw children from
Afghanistan has
shown political
commitment
to developing
conflict-sensitive
education
strategies
1 9 4
R A I S I N G Q U A L I T Y A N D S T R E N G T H E N I N G E Q U I T Y: W H Y G OV E R N A N C E M AT T E R S
school in difficult times, partly to save on schooling
costs but also to send them to work.
Successful programmes in several Latin American
countries combine social protection and
enhancement of investments in children’s
education and health with alleviation of pressure to
send children to work. The objective is to go beyond
traditional social welfare transfers by equipping
vulnerable households with assets that will break
the cycle of poverty. Cash transfer has played an
important role in the design of social protection
programmes, some of which now operate on a
national scale. For example, the Bolsa Família
programme in Brazil reaches around 11 million
families. It provides a cash transfer of up to US$35
per month to poor families with children,
conditional on their keeping the children in school
and taking them for regular health checks
(Lindert et al., 2007).
Social protection programmes have far-reaching
aims. Rather than responding to poverty through
welfare payments, they aim to meet immediate
needs and break the intergeneration transmission
of poverty through their impact on education and
child health. Evaluations point to some positive
results. A recent study of targeted social protection
programmes in Honduras, Mexico and Nicaragua
found them effective not only at increasing school
attendance and but also at keeping poor children
in school when households faced shocks to their
livelihoods (de Janvry et al., 2006b). They have also
had significant positive effects on children’s health
and nutritional status, particularly in the early years
(Gertler, 2004). In Nicaragua, the Red de Proteción
Social programme increased visits to health
centres and improved diet, resulting in a five
percentage point decline in the stunting of children
under 5 compared with control areas (Maluccio and
Flores, 2004).15
The Oportunidades programme in Mexico, which
provides poor households with a cash transfer of
up to US$55 per month if they send their children
to school and visit nutrition monitoring centres
regularly, is often held up as a successful cross-
sectoral social protection programme. A recent
study showed that unemployment or illness of the
household head reduced the chances of poor
children enrolling in school by some two
percentage points. For Oportunidades beneficiaries,
however, the drop was almost completely non-
existent (de Janvry et al., 2006a).
Social protection programmes are also having an
impact on child labour. The employment of children
is both a consequence of poverty and a cause of
restricted opportunity in education. Few PRSPs pay
explicit attention to the trade-off between education
and child labour (World Bank, 2005d). Yet social
protection programmes have demonstrated that
the links between poverty and child labour can be
broken. Bono de Desarrollo Humano in Ecuador
illustrates what can be achieved. Under this
programme, households identified as extremely
poor receive a cash transfer of US$15 per month.
Unlike Oportunidades, the programme does not
make the transfer conditional on changes in
household behaviour. A recent evaluation based on
an experimental research design found that the
programme had a large positive impact on school
enrolment (by about 10%) and a large negative
impact on child labour (a reduction of around 17%)
(Schady and Araujo, 2006).
Other programmes that provide unconditional
cash support targeting families of poor children
have also led to marked improvement in the
children’s educational and nutritional status.
For example, a recent study of the child support
grant in South Africa found that children who had
been in the programme for a large part of their
childhood had significantly higher height-for-age
ratios, a measure of improved nutrition
(Agüero et al., 2006). The programme has also
had a significant impact on school enrolment
(Case et al., 2005).
Part of the success of social protection
programmes in improving educational outcomes
for the poor and disadvantaged comes from their
effectiveness at channelling resources to target
groups. A recent study on programmes in Brazil
(Bolsa Família), Chile (Solidario) and Mexico
(Oportunidades) found that about 60% of transfer
funds flowed to the poorest 20% of the population.
Conditional cash transfers have materially
increased equity in the income distribution (Soares
et al., 2007). The success of social protection
programmes is increasingly recognized. Mexico’s
Oportunidades programme even offers a rare
example of policy transfer from a developing
country to a developed country (Box 3.28).
These examples provide a practical demonstration
of how integrated approaches to reducing
vulnerability benefit education. The good news is
that social protection has emerged as a greater
15. Stunting is defined as aheight-for-age z-score twoor more standard deviationsbelow the reference median(see glossary).
Social protection
programmes in
Latin America
show positive
impacts on
poverty, health
and education
1 9 5
A n i n t e g ra t e d a p p r o a c h t o e d u c a t i o n a n d p o v e r t y r e d u c t i o n : t h e m i s s i n g l i n k
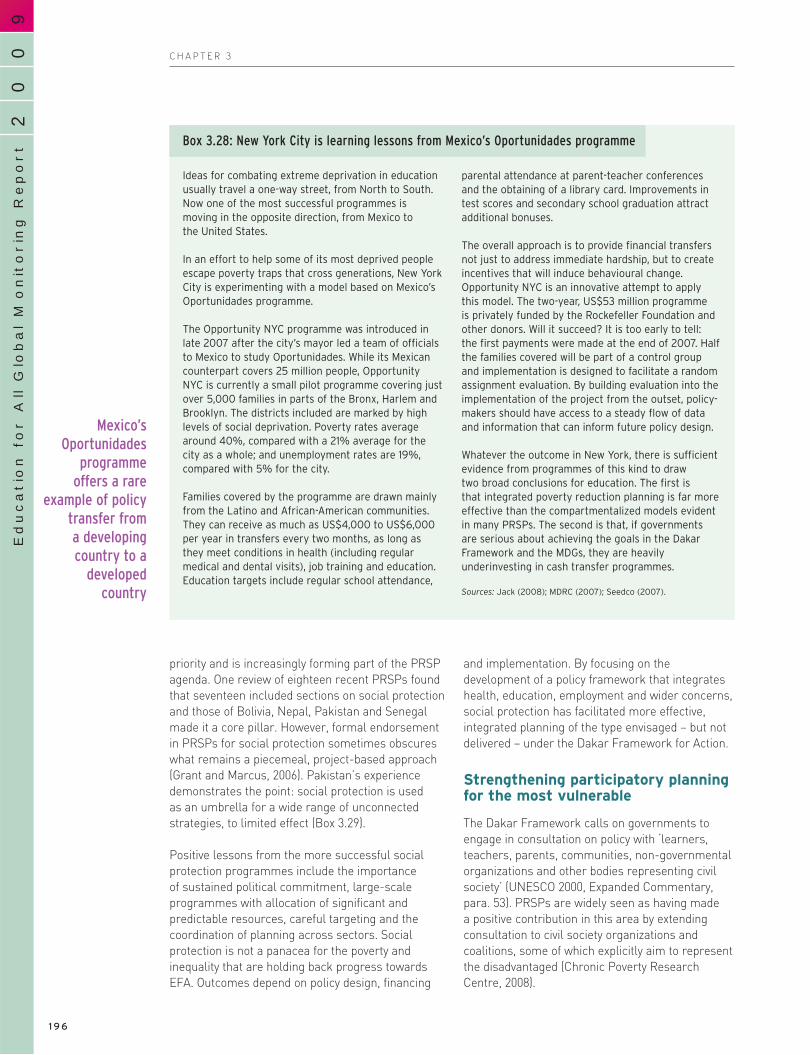
90
02
Education f
or A
ll G
lobal M
onitorin
g R
eport
C H A P T E R 3
priority and is increasingly forming part of the PRSP
agenda. One review of eighteen recent PRSPs found
that seventeen included sections on social protection
and those of Bolivia, Nepal, Pakistan and Senegal
made it a core pillar. However, formal endorsement
in PRSPs for social protection sometimes obscures
what remains a piecemeal, project-based approach
(Grant and Marcus, 2006). Pakistan’s experience
demonstrates the point: social protection is used
as an umbrella for a wide range of unconnected
strategies, to limited effect (Box 3.29).
Positive lessons from the more successful social
protection programmes include the importance
of sustained political commitment, large-scale
programmes with allocation of significant and
predictable resources, careful targeting and the
coordination of planning across sectors. Social
protection is not a panacea for the poverty and
inequality that are holding back progress towards
EFA. Outcomes depend on policy design, financing
and implementation. By focusing on the
development of a policy framework that integrates
health, education, employment and wider concerns,
social protection has facilitated more effective,
integrated planning of the type envisaged – but not
delivered – under the Dakar Framework for Action.
Strengthening participatory planningfor the most vulnerable
The Dakar Framework calls on governments to
engage in consultation on policy with ‘learners,
teachers, parents, communities, non-governmental
organizations and other bodies representing civil
society’ (UNESCO 2000, Expanded Commentary,
para. 53). PRSPs are widely seen as having made
a positive contribution in this area by extending
consultation to civil society organizations and
coalitions, some of which explicitly aim to represent
the disadvantaged (Chronic Poverty Research
Centre, 2008).
Mexico’s
Oportunidades
programme
offers a rare
example of policy
transfer from
a developing
country to a
developed
country
1 9 6
Box 3.28: New York City is learning lessons from Mexico’s Oportunidades programme
Ideas for combating extreme deprivation in educationusually travel a one-way street, from North to South.Now one of the most successful programmes ismoving in the opposite direction, from Mexico to the United States.
In an effort to help some of its most deprived peopleescape poverty traps that cross generations, New YorkCity is experimenting with a model based on Mexico’sOportunidades programme.
The Opportunity NYC programme was introduced inlate 2007 after the city’s mayor led a team of officialsto Mexico to study Oportunidades. While its Mexicancounterpart covers 25 million people, OpportunityNYC is currently a small pilot programme covering justover 5,000 families in parts of the Bronx, Harlem andBrooklyn. The districts included are marked by highlevels of social deprivation. Poverty rates averagearound 40%, compared with a 21% average for thecity as a whole; and unemployment rates are 19%,compared with 5% for the city.
Families covered by the programme are drawn mainlyfrom the Latino and African-American communities.They can receive as much as US$4,000 to US$6,000per year in transfers every two months, as long asthey meet conditions in health (including regularmedical and dental visits), job training and education.Education targets include regular school attendance,
parental attendance at parent-teacher conferencesand the obtaining of a library card. Improvements intest scores and secondary school graduation attractadditional bonuses.
The overall approach is to provide financial transfersnot just to address immediate hardship, but to createincentives that will induce behavioural change.Opportunity NYC is an innovative attempt to applythis model. The two-year, US$53 million programme is privately funded by the Rockefeller Foundation andother donors. Will it succeed? It is too early to tell: the first payments were made at the end of 2007. Halfthe families covered will be part of a control groupand implementation is designed to facilitate a randomassignment evaluation. By building evaluation into theimplementation of the project from the outset, policy-makers should have access to a steady flow of dataand information that can inform future policy design.
Whatever the outcome in New York, there is sufficientevidence from programmes of this kind to draw two broad conclusions for education. The first is that integrated poverty reduction planning is far moreeffective than the compartmentalized models evidentin many PRSPs. The second is that, if governments are serious about achieving the goals in the DakarFramework and the MDGs, they are heavilyunderinvesting in cash transfer programmes.
Sources: Jack (2008); MDRC (2007); Seedco (2007).

R A I S I N G Q U A L I T Y A N D S T R E N G T H E N I N G E Q U I T Y: W H Y G OV E R N A N C E M AT T E R S
Whether consultation translates into action
depends on political actors’ willingness to listen
and respond, which is affected in turn by the
influence of the electorate on political priorities and
by the extent of support from elites. A convergence
of interests among a range of stakeholders on
access to primary schooling has helped keep this
topic high on the agenda in many countries. In
some contexts, concerns about the need to develop
a skilled workforce have also raised awareness
of the stakes. However, where priorities are set
according to whose voices are heard, other areas
of the EFA agenda are at risk of being further
sidelined.
Amplifying the voice of civil society including the unheard poor
As the EFA Global Monitoring Report 2008 noted,
civil society organizations are increasingly influential
in the formulation of national education plans,
a trend further strengthened by the formation of
national coalitions of such organizations since 2000
in many countries, in response to commitments
made at Dakar. However, as the Report observed,
challenges remain:
Opportunities to participate systematically in
agenda-setting and final drafting remain limited.
New concerns have arisen as a result of
broadening consultation, including rising
Whether
consultation
translates into
action depends
on political actors’
willingness to
listen and respond
1 9 7
A n i n t e g ra t e d a p p r o a c h t o e d u c a t i o n a n d p o v e r t y r e d u c t i o n : t h e m i s s i n g l i n k
Box 3.29: Social protection in Pakistan’s poverty reduction strategy: the effects of fragmentation
Pakistan’s 2003 PRSP, called Accelerating EconomicGrowth and Reducing Poverty: The Road Ahead,reflects the growing importance of vulnerability in poverty analyses. Social protection is identified as a central priority, but programme implementationhas been dogged by institutional fragmentation,inadequate financing and poor targeting.
Why is this relevant to Pakistan’s efforts to achieveEFA? First, the children are highly vulnerable as a result of high levels of poverty. Second, ill health,unemployment and natural disaster are a recurringtheme in the lives of the poor, often leading tochildren being taken out of school. Around 10% ofpoor households in one study reported taking childrenout of school and putting them to work during suchcrises. Because poor households have fewer resourcesto support coping strategies, crises tend to widensocial and economic disparities.
In response, Pakistan has established a range of socialprotection initiatives, including microfinance, publicworks, pensions and various social safety nets. Suchmeasures are intended to protect the households atgreatest risk and help them regarding income in timesof financial crisis so they may eventually escapepoverty. Some initiatives are directly linked toeducation while others have an indirect impact.Examples specific to education include:
central government stipends to girls in middleschool from poor districts;
provincial stipend programmes, such as one in Punjab;
free textbooks for poor students who attendgovernment schools;
a pilot child support programme in five districts(since 2006/2007);
the Tawana Pakistan Project, a school-feedingprogramme aimed at improving health, nutritionand enrolment;
non-formal education provision for vulnerablechildren, such as child labourers.
The list is impressive, but it also highlights a series of problems:
Programmes overlap in their intended scope, with uncoordinated financing and delivery modes(e.g. via federal or provincial government, quasi-government and non-government organizations).
Coordination is lacking among bodies responsiblefor implementation, including the ministries ofeducation, labour, social welfare and specialeducation, and science and technology, along withthe National Technical and Vocational EducationCommission.
Many initiatives are experiments or relatively small in scale.
In a context where government commitment to education and other social sector spending isalready low (education spending amounts to just2.7% of GDP), measures often depend on externalresources and so are unlikely to be sustainable.
Targeted stipend programmes are extremely limited in scale, fail to pay beneficiaries regularlyand do not show a positive impact on schooling.
Sources: Bano (2007, 2008); World Bank (2007c).

90
02
Education f
or A
ll G
lobal M
onitorin
g R
eport
C H A P T E R 3
stakeholder expectations that plans will reflect
their concerns more prominently.
Some civil society organizations lack the
analytical capacity to engage in consultation
productively and confidently.
Consultation can serve to validate decisions
already taken rather than to facilitate genuine
engagement.
As in any process of political dialogue and
consultation, issues of representation are
important in education planning. A detailed
analysis of civil society participation in Burkina
Faso, Kenya, Mali and the United Republic of
Tanzania identified a wide range of actors
interested in participating, including national
and international non-government organizations,
faith-based groups, national parent-teacher
associations, teachers’ unions, private provider
groups and research networks. The analysis found
a lack of transparency in the processes for
selecting which actors to invite to the policy
dialogue table. Those most likely to represent
critical viewpoints are excluded. Teachers’ unions,
many of which oppose education reforms that
affect employment and pay conditions, are often
not invited to participate in policy dialogue
(Mundy et al., 2007).
The shortcomings of participation in education
sector planning are also evident in PRSP
consultations, with participation by civil society
organizations and coalitions working on education
remaining restricted (Commonwealth Education
Fund, 2007).
Despite the important role of civil society
organizations and coalitions in mobilizing public
concern over the policy decisions most likely to
affect the disadvantaged, such groups do not
usually include the voices of the poor directly.
To address this deficiency, participatory poverty
assessments have been undertaken in many
countries as part of the PRSP consultation
process. There have also been attempts to involve
the marginalized more directly in consultation.
These are laudable aims. There have also been
some important results. National participatory
poverty assessments have given new insights into
the underlying causes of poverty and vulnerability.
In some cases – Uganda is an example – the
evidence collected has had a direct bearing
on the framing of national poverty reduction
priorities. Efforts have been made to increase
the accessibility of PRSP documents (for example,
by making them available in national languages).
And there have been efforts to extend
consultation. Nepal’s recent PRSP process
provided opportunities for extensive consultation
in the fragile economic and political context of an
ethnically, geographically and linguistically diverse
country emerging from years of conflict between
government and Maoist forces. It went far beyond
the consultation process for education plans,
which has been top-down with little real
involvement of minority rights groups (Giffard-
Lindsay, 2008; Vaux et al., 2006).
For all these advances, the limits to consultation
have to be acknowledged. Some of the limits
relate to representation. PRSP consultation
exercises have led to engagement with national
and civil society organizations on a very large
scale. Engagement with organizations of the poor,
as distinct from organizations claiming to speak
on their behalf, has been far more limited.
Marginalized groups face many barriers to
meaningful engagement, including lack of time,
literacy and organizational capacity. Even when
their views seem to be invited, information
asymmetry can mean that they remain weakly
involved (Goetz and Jenkins, 2005). Marginalized
groups may simply lack access to the information
they need to develop policy inputs. There is also
a wider point to be made. PRSPs do not override
everyday political realities that perpetuate deep
inequalities in society. Governments that turn a
deaf ear to the concerns of the poor in everyday
public policy formulation are unlikely to undergo
political transformation as a result of PRSP
exercises. Tackling poverty and reducing
inequality require policies and public spending
priorities that are likely to call into question
prevailing power relationships in many countries.
That is precisely why many political elites prefer to
ensure that PRSPs are pitched at a very high level
of generality with a restricted process of dialogue
and consultation.
PRSPs are part of a wider process of public policy
development and political debate – a process that
involves donors as well as national governments
and political constituencies. Outcomes will be
shaped by the interactions and power
relationships between actors. In many cases,
PRSP
consultation
exercises
have led to
engagement
with civil society
organizations
on a large scale
1 9 8

R A I S I N G Q U A L I T Y A N D S T R E N G T H E N I N G E Q U I T Y: W H Y G OV E R N A N C E M AT T E R S
PRSPs may give rise to tensions. Take the twin
commitment to national ownership and equity.
These goals might be attainable. But what if
national governments are not committed to equity,
or if they are less committed than sections of
their society – or aid donors – might desire?
(Booth and Curran, 2005).
Priorities in poverty reduction strategies are not
set in a political vacuum. They are formulated
by governments that assess constraints,
opportunities and political pay-off. Experience in
education is instructive. Undertaking highly visible
reforms such as the abolition of user fees often
generates a high and fast political return. The
Kenyan Government announced the abolition of
secondary school fees at a moment that coincided
with the controversy surrounding the 2008
election. In Burundi, school fees were abolished
in 2005 following a controversial one-party
election. Elsewhere, too, user-fee abolition has
been seen as a quick route to enhanced political
legitimacy (Rose and Brown, 2004).
Interventions in other areas with a longer payback
period have been less enthusiastically taken up.
For example, the development of strategic policy
frameworks to strengthen education standards
and monitoring has not received a great deal of
prominence in political discourse (Giffard-Lindsay,
2008). The same is true in areas that are likely to
raise questions of social division, such as the
narrowing of regional inequalities or transfers
from higher-income to lower-income groups and
areas. Reforms that have less immediately visible
outcomes, such as improvements to education
quality, or ones that might challenge political
authority and patronage systems, such as those
supporting girls’ education, might gain less
popularity in election processes (Rose and
Brown, 2004).
Moving towards integrated and more equitable
education planning poses challenges at many
levels. Potentially, many of the issues involved
are highly divisive. This is especially the case
in societies marked by high levels of social
polarization. Part of the challenge is to create a
political discourse that looks beyond narrow self-
interest to national interest and to shared goals –
including the goals of equal citizenship and shared
opportunity. One reason Bangladesh has
progressed so rapidly in primary enrolment is that
the return of multiparty democracy in the 1990s
was marked by a broad-based consensus in favour
of education. Another important factor was a
recognition by national elites of the benefits of
education for poverty reduction and development
(Hossain, 2007).
The starting point for political consensus is a
shared recognition that greater equity in education
is not a zero-sum game. No section of society has
to lose out – and society as a whole stands to gain
from progress towards UPE and wider education
goals. As Chapter 1 argues, equitable education is
a powerful force for economic growth and rising
living standards, as well as gains in other areas.
Viewed from a different perspective, large-scale
disparities are a source of inefficiency. This can
also hamper advances in areas such as public
health and fuel social polarization.
Conclusion
There is evidence that education planning has
improved since Dakar. Education planning within
a sector-wide framework is leading to greater
coherence in priority-setting. However, serious
problems remain. Far more has to be done to
integrate education planning into wider poverty
reduction strategies and to back priorities with
budget commitments. Particular attention has
to be paid to the interlocking disadvantages that
are holding back progress towards EFA. Social
protection programmes provide important lessons.
They demonstrate that broad-based strategies for
reducing poverty and vulnerability can generate
important gains for education, creating new
opportunities for the poor. Achieving this outcome
will require the development of high-level political
commitment, supported by strong national
consensus, in favour of education for all.
Far more has to be
done to integrate
education planning
into wider
poverty reduction
strategies and
to back priorities
with budget
commitments
1 9 9
A n i n t e g ra t e d a p p r o a c h t o e d u c a t i o n a n d p o v e r t y r e d u c t i o n : t h e m i s s i n g l i n k

90
02
Education f
or A
ll G
lobal M
onitorin
g R
eport
C H A P T E R 3
2 0 0
2 5 2 3 1 3 2 4 1 0 0 00 0 1 1 6 6 1 1 3 4 5 28 8 0 0 0 1 2 1 0 1 0 01 1 6 5 2 0 1 0 0 0 0 01 0 5 3 0 1 1 0 2 1 0 00 3 0 0 0 0 0 0 0 0 0 01 0 0 0 0 1 0 0 0 0 0 00 0 0 0 0 1 1 0 0 0 0 00 0 4 1 1 0 0 0 0 0 0 00 0 0 0 0 0 0 0 0 0 0 00 0 0 0 1 0 0 1 0 1 2 3
13 17 18 13 11 13 8 7 6 7 7 5
GenderPoor/vulnerableHIV/AIDSDisabled/special education needsGeographic (e.g. region)Conflict-affected areasEthnicityOut-of-school childrenRural/urbanReligionNot specified
Total number of strategies
Table 3.10: Strategies to address education inequity in eighteen PRSPs
Primary education
PRSP1Type of inequity PRSP1 PRSP2
School building/infrastructure
PRSP1 PRSP2
Stipends
PRSP1 PRSP2
Communitysensitization
PRSP1 PRSP2
School feeding
PRSP1 PRSP2
Fee abolitionCurriculumrelevance
PRSP2
0 4 1 3 0 2 0 1 1 00 2 0 0 3 1 1 0 0 00 0 0 2 0 0 0 0 0 00 2 0 0 1 1 0 0 0 01 1 0 1 1 0 0 0 0 00 0 0 0 0 0 0 0 0 00 0 0 1 0 0 0 0 0 00 0 0 0 0 0 0 0 0 01 2 0 0 0 0 0 0 0 00 0 0 0 0 0 0 0 0 00 1 0 0 0 0 0 0 0 0
2 12 1 7 5 4 1 1 1 0
4 124 50 41 67 30 00 16 22 30 02 3
26 39
GenderPoor/vulnerableHIV/AIDSDisabled/special education needsGeographic (e.g. region)Conflict-affected areasEthnicityOut-of-school childrenRural/urbanReligionNot specified
Total number of strategies
Secondary education
PRSP1Type of inequity PRSP1 PRSP2
Curriculumrelevance
PRSP1 PRSP2
Stipends
PRSP1 PRSP2
Quotas
PRSP1 PRSP2
Counselling
PRSP1 PRSP2
Total secondarySchool building/
infrastructure
PRSP2
Table 3.10 presents information on PRSPs for the eighteencountries that have prepared two plans. Most of the first PRSPswere prepared around 2000, with the second prepared in most cases between 2004 and 2007. Based on the informationprovided in the PRSPs, the table indicates the number of countries that propose strategies aimed at addressingeducational inequalities in the areas of ECCE, primary andsecondary education, TVET and adult literacy, as well as theforms of disadvantage addressed.
The table identifies ten broad sources of inequality identified inPRSPs. It then summarizes the number of plans with proposedactions, comparing the first- and second-generation PRSPs. Thebroad headline message is that PRSPs pay insufficient attentionto addressing educational inequalities and the change betweenthe first- and second-generation PRSPs was limited. Among the
findings to emerge from an analysis of the information in the table:
Attention to primary education strategies aimed at tacklingdisparities increased slightly between the first- and second-generation PRSPs, with a total of seventy-one strategiespresented in the first and eighty in the second.
This increase is due to the inclusion of a wider range ofstrategies aimed at achieving gender parity and equality. In total, twenty-five gender-related strategies are mentioned in the more recent PRSPs, compared with eleven in the earlyones. Encouragingly, this is due in part to a focus on strategiesaimed at addressing gender inequality within the schoolenvironment (including recruitment of female teachers andaddressing gender abuse in schools) — an area that did notappear in early PRSPs.

R A I S I N G Q U A L I T Y A N D S T R E N G T H E N I N G E Q U I T Y: W H Y G OV E R N A N C E M AT T E R S
2 0 1
Note: ‘Not specified’ indicates that the strategy included in the PRSP does not specify the type of disparity that is being targeted. Sources: Burkina Faso Ministry of Economy and Development(2004); Burkina Faso Ministry of Economy and Finance (2000);Cambodia Council for Social Development (2002); CambodiaGovernment (2005); Ethiopia Ministry of Finance and EconomicDevelopment (2002, 2006); Gambia Department of State forFinance and Economic Affairs (2002, 2006); Ghana NationalDevelopment Planning Commission (2003, 2005); GuineaGovernment (2002); Guinea Ministry of the Economy, Financesand Planning (2007); Madagascar Government (2003, 2007);Malawi Government (2002, 2006); Mali Government (2006);Mali Ministry of Economy and Finance (2002); MauritaniaGovernment (2000, 2006); Mozambique Government (2001,2006); Nicaragua Government (2001, 2005); Rwanda Ministryof Finance and Economic Planning (2002, 2007); SenegalGovernment (2002, 2006); Uganda Ministry of Finance,Planning and Economic Development (2000, 2004); UnitedRepublic of Tanzania Government (2000, 2005); Viet NamGovernment (2003, 2006); Zambia Government (2006); ZambiaMinistry of Finance and National Planning (2002).
0 4 1 2 0 2 1 2 1 00 0 0 0 0 0 0 0 0 00 0 1 1 0 0 0 0 0 00 0 0 1 0 0 0 1 0 00 0 0 0 0 0 0 0 1 00 0 0 0 0 0 0 0 0 00 0 0 0 0 0 0 0 2 10 0 0 0 0 0 0 0 0 00 0 0 0 0 0 0 0 0 00 0 0 0 0 0 0 0 0 01 1 0 0 0 2 0 0 0 1
1 5 2 4 0 4 1 3 4 2
11 2516 1411 1210 810 50 33 21 15 10 04 9
71 80
GenderPoor/vulnerable
HIV/AIDSDisabled/special education needs
Geographic (e.g. region)Conflict-affected areas
EthnicityOut-of-school children
Rural/urbanReligion
Not specified
Total number of strategies
Primary education
PRSP1 Type of inequityPRSP1 PRSP2
Teacher sensivitytraining
PRSP1 PRSP2
Addressingabuse in school
PRSP1 PRSP2
Water andsanitation
PRSP1 PRSP2
Language ofinstruction
PRSP1 PRSP2
Total primaryFemale
teachers
PRSP2
0 0 1 2 1 0 4 31 3 0 2 0 0 0 10 1 0 1 0 1 0 00 1 0 3 0 0 0 01 1 3 0 2 1 0 00 0 0 0 0 0 0 00 0 0 0 0 0 0 00 0 2 1 4 1 1 11 2 1 1 0 0 1 10 0 0 0 0 0 1 07 7 1 0 1 2 1 1
10 15 8 10 8 5 8 7
GenderPoor/vulnerableHIV/AIDSDisabled/special education needsGeographic (e.g. region)Conflict-affected areasEthnicityOut-of-school childrenRural/urbanReligionNot specified
Total number of strategies
ECCE TVET Adult literacy
PRSP1Type of inequity PRSP1 PRSP2
Relevance
PRSP1 PRSP2
Non formal
PRSP1 PRSP2PRSP2
Some countries include strategies in both first- and second-generation PRSPs to increase participation by poor andvulnerable households, notably through stipends and schoolfeeding programmes. Given the potential of such strategies insupporting educational opportunities, the number of countriesincluding them remains low. For example, stipends for the poor and vulnerable are mentioned in only six of the eighteenPRSPs. Moreover, there is limited emphasis on fee abolition(five of the eighteen second-generation PRSPs mention it as a strategy), even though informal fees continue to be an important barrier to enrolment of poor and vulnerablechildren.
Approaches to supporting children with disabilities are mainlyfocused on improving accessibility of school infrastructurerather than paying attention to curriculum reform.
Strategies aimed at tackling regional and rural-urbanmarginalization have declined, mainly because less attention is given to school construction. Strategies aimed at supportingethnic or religious minorities remain extremely limited.
More positively, greater attention is being given to educationstrategies aimed at overcoming inequalities at secondary level.As with primary schooling, the focus is on schoolinfrastructure and curriculum relevance.
Inequality in ECCE continues to receive limited attention. Even where strategies are mentioned, they often do notspecify how they intend to address particular forms ofdisadvantage.
Similarly, there is limited attention in PRSPs to addressinginequalities in TVET and adult literacy (the main focus of the latter is on women’s literacy).

90
02
Education f
or A
ll G
lobal M
onitorin
g R
eport
2 0 2
© A
mi V
itale
/PAN
OS
Empowering localcommunities: low castewomen meet to exchangeinformation and voicetheir concerns, in UttarPradesh, India

2 0 3
9002Education for All Global Monitoring Report
Chapter 4
Increasing aid and improvinggovernance
Increased and more effective aid is vital to achieving the EFA
goals. At the 2000 World Education Forum in Dakar, rich
countries pledged that no credible national plan would be allowed
to fail for want of finance. The pledge has yet to be honored.
This chapter examines the most recent evidence on aid flows.
That evidence points to continued shortfalls in development
assistance — and to worrying signs that promises made in 2005
are not being met. The chapter also explores the significant
shift in approaches to aid governance under the 2005 Paris
Declaration on Aid Effectiveness. Drawing on recent evidence,
it asks whether the strengthened focus on country ownership,
sector-wide approaches and harmonization is creating
an enabling environment for more effective aid.

Introduction ............................................................................................................. 204
Aid for education ............................................................................... 205
Governance and aid effectiveness ....................................................... 219
90
02
Education f
or A
ll G
lobal M
onitorin
g R
eport
C H A P T E R 4
Introduction
The Dakar Framework for Action is built on a compact
between developing countries and rich countries.
Like any compact, it involves two-way responsibilities
and obligations. Developing countries pledged to
strengthen national education plans, tackle inequality
and enhance accountability to their citizens.
Governments of developed countries pledged to
provide the aid needed to ensure that no credible
strategy in the poorest countries would fail for want
of finance. Since Dakar, both groups of countries have
reinforced these pledges on numerous occasions.
As Chapters 2 and 3 show, the record of developing
countries in translating their pledges into actions
has been mixed. The record of donors is also mixed,
but it is one of collective failure. As a group, donors
have failed to act on their commitments – and they
have failed to close a large financing gap. On
conservative estimates, US$11 billion of aid is
needed annually in low income countries to achieve
three of the targets set in the Dakar Framework for
Action: universal primary education (UPE), early
childhood programmes and literacy. In 2006 aid in
support of basic education in low income countries
was just one-third of the estimated requirement.
Several major donors appear to have almost
abandoned support for Education for All in spite
of explicit promises. During 2005, the Gleneagles
summit of the Group of Eight (G8) and commitments
made by donors outside this group raised
expectations of a sharp increase in aid by 2010 to
achieve the Millennium Development Goals (MDGs).
There is now a clear danger that donors will not
deliver and current trends point in the direction
of a large shortfall against the target.
All of this has grave implications for progress
towards the goals set at Dakar. Having been
encouraged to draw up ambitious national plans,
many developing countries will be left without the
resources required for their full implementation.
Changing this picture is an urgent priority because
of the time lag between investment and outcome.
If countries are to achieve UPE by 2015, they cannot
wait to put in place the financing needed to build
schools, recruit and train teachers, and provide
incentives needed to reach marginalized social
groups. More broadly, progress in education is
contingent on delivery of the aid needed to achieve
the MDGs in areas such as child health, water and
sanitation, and the reduction of extreme poverty.
2 0 4

I N C R E A S I N G A I D A N D I M P R OV I N G G OV E R N A N C E
The bottom line message is that time is running
out. While developing country governments have to
redouble their efforts, in the absence of a concerted
drive by donors to close the gap between aid
pledges and aid delivery, the targets set at Dakar
will not be achieved in many countries.
Both donors and the governments receiving aid
have recognized that there are serious problems
in aid governance. Too often, national ownership is
weak, transaction costs are high and development
assistance is delivered in ways that erode, rather
than build, the institutional capacity of aid recipients.
New approaches to aid governance are emerging,
slowly. The emphasis is shifting away from aid
projects to support for sector programmes and
national budgets – and education is in the forefront
of this transition. In addition, donors have taken
on other important commitments to enhance aid
effectiveness and cut transaction costs. All of these
commitments have quantifiable targets for 2010.
Early monitoring suggests that, while some progress
has been made, without acceleration most of the
2010 targets will be missed. There are also concerns
that the agenda may turn out to be a double-edged
sword, if stronger collective action on the part of
donors leads to a weakening of national ownership.
Good governance is at the heart of the emerging aid
dialogue in education. Commitment by governments
to accountability, transparency, participation and
equity is vital for achieving the targets set under the
Dakar Framework for Action. These are intrinsically
important goals in their own right, as well as
a means to education progress. Unfortunately,
as Chapter 3 shows, too many governments have
not taken this commitment seriously enough.
As for donors, there is a danger they might seek
to advance a good governance blueprint geared
towards a narrow set of policies of questionable
relevance to the needs of developing countries.
This chapter is divided into two parts. The first
provides a monitoring overview of developments
in the level of aid. Looking beyond current trends in
commitments and disbursements, it also explores
issues of equity in aid distribution. The second part
turns to the evolving agenda concerning the delivery
of aid. It examines how the strengthened donor
commitment to supporting sector programmes
is playing out in the education sector. It also looks
at what donors understand by ‘good governance’
in education and the types of programmes they and
governments are developing together to achieve it.
Aid for education
International aid is at the centre of an increasingly
polarized debate. Most governments in rich
countries, backed by United Nations agencies and
international financial organizations, and prompted
by non-government organizations, see increased
development assistance as a condition for achieving
the MDGs and wider development goals. Aid
‘pessimists’ respond with the claim that big
increases in aid have achieved small results at
best and that at worst aid is a barrier to progress.
In reality, the situation is more complex than
either view suggests. No amount of international
aid will override the consequences of widespread
corruption, inefficient service delivery or inequitable
patterns of public spending. And how donors
provide aid is also important. The benefits of
development assistance are certainly contingent on
good governance, not only in the receiving country
but also on the part of the donor community.
That being said, aid can – and does – make a large
difference. And it makes the biggest difference
when it is aligned behind nationally owned country
strategies. In the case of EFA, international aid has
played a crucial role in supporting policies that have
improved access to education, enhanced equity and
addressed the quality issue. While disentangling the
precise effects of aid is difficult, it seems clear that
many countries that have achieved rapid progress
towards some or all of the Dakar goals would have
progressed more slowly without aid, as the
following examples illustrate:
In Cambodia, Ghana, Kenya, Mozambique,
the United Republic of Tanzania and Zambia, the
increase in international aid has facilitated the
abolition of primary school tuition fees, leading to
a large expansion of primary school enrolment.
While the main responsibility for financing basic
education lies with governments, external
assistance can make a difference (Box 4.1).
In the case of the United Republic of Tanzania,
aid has supported an education sector strategy
that has cut the number of out-of-school
children by 3 million since 1999.
In Ethiopia, education’s share of the budget
increased from 3.6% of gross national product
(GNP) to 6% between 1999 and 2006. International
aid was a critical component of overall financing.
As a group,
donors have failed
to act on their
commitments
to close a large
financing gap
2 0 5
A i d f o r e d u c a t i o n
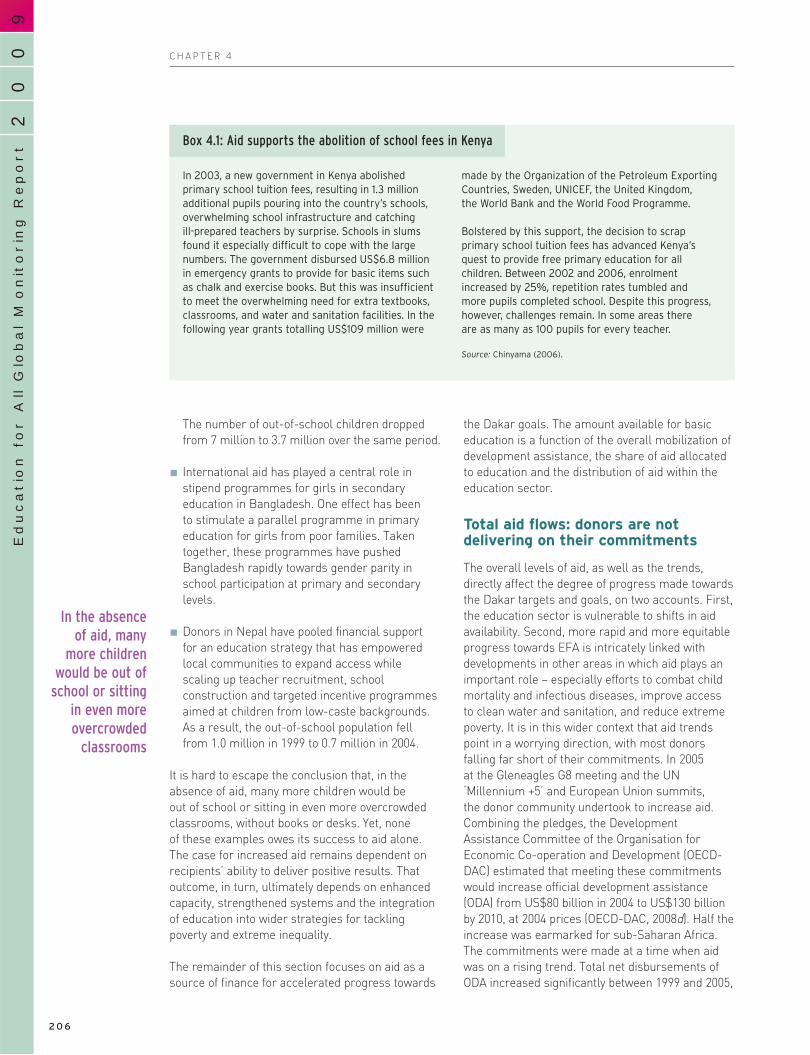
90
02
Education f
or A
ll G
lobal M
onitorin
g R
eport
C H A P T E R 4
The number of out-of-school children dropped
from 7 million to 3.7 million over the same period.
International aid has played a central role in
stipend programmes for girls in secondary
education in Bangladesh. One effect has been
to stimulate a parallel programme in primary
education for girls from poor families. Taken
together, these programmes have pushed
Bangladesh rapidly towards gender parity in
school participation at primary and secondary
levels.
Donors in Nepal have pooled financial support
for an education strategy that has empowered
local communities to expand access while
scaling up teacher recruitment, school
construction and targeted incentive programmes
aimed at children from low-caste backgrounds.
As a result, the out-of-school population fell
from 1.0 million in 1999 to 0.7 million in 2004.
It is hard to escape the conclusion that, in the
absence of aid, many more children would be
out of school or sitting in even more overcrowded
classrooms, without books or desks. Yet, none
of these examples owes its success to aid alone.
The case for increased aid remains dependent on
recipients’ ability to deliver positive results. That
outcome, in turn, ultimately depends on enhanced
capacity, strengthened systems and the integration
of education into wider strategies for tackling
poverty and extreme inequality.
The remainder of this section focuses on aid as a
source of finance for accelerated progress towards
the Dakar goals. The amount available for basic
education is a function of the overall mobilization of
development assistance, the share of aid allocated
to education and the distribution of aid within the
education sector.
Total aid flows: donors are notdelivering on their commitments
The overall levels of aid, as well as the trends,
directly affect the degree of progress made towards
the Dakar targets and goals, on two accounts. First,
the education sector is vulnerable to shifts in aid
availability. Second, more rapid and more equitable
progress towards EFA is intricately linked with
developments in other areas in which aid plays an
important role – especially efforts to combat child
mortality and infectious diseases, improve access
to clean water and sanitation, and reduce extreme
poverty. It is in this wider context that aid trends
point in a worrying direction, with most donors
falling far short of their commitments. In 2005
at the Gleneagles G8 meeting and the UN
‘Millennium +5’ and European Union summits,
the donor community undertook to increase aid.
Combining the pledges, the Development
Assistance Committee of the Organisation for
Economic Co-operation and Development (OECD-
DAC) estimated that meeting these commitments
would increase official development assistance
(ODA) from US$80 billion in 2004 to US$130 billion
by 2010, at 2004 prices (OECD-DAC, 2008d). Half the
increase was earmarked for sub-Saharan Africa.
The commitments were made at a time when aid
was on a rising trend. Total net disbursements of
ODA increased significantly between 1999 and 2005,
In the absence
of aid, many
more children
would be out of
school or sitting
in even more
overcrowded
classrooms
2 0 6
Box 4.1: Aid supports the abolition of school fees in Kenya
In 2003, a new government in Kenya abolishedprimary school tuition fees, resulting in 1.3 millionadditional pupils pouring into the country’s schools,overwhelming school infrastructure and catching ill-prepared teachers by surprise. Schools in slumsfound it especially difficult to cope with the largenumbers. The government disbursed US$6.8 million in emergency grants to provide for basic items such as chalk and exercise books. But this was insufficientto meet the overwhelming need for extra textbooks,classrooms, and water and sanitation facilities. In thefollowing year grants totalling US$109 million were
made by the Organization of the Petroleum ExportingCountries, Sweden, UNICEF, the United Kingdom, the World Bank and the World Food Programme.
Bolstered by this support, the decision to scrapprimary school tuition fees has advanced Kenya’squest to provide free primary education for allchildren. Between 2002 and 2006, enrolmentincreased by 25%, repetition rates tumbled and more pupils completed school. Despite this progress,however, challenges remain. In some areas there are as many as 100 pupils for every teacher.
Source: Chinyama (2006).

I N C R E A S I N G A I D A N D I M P R OV I N G G OV E R N A N C E
from US$64 billion to US$110 billion, or 8% per
year. Much of this growth was driven by debt relief.
Total ODA then fell for two consecutive years to less
than US$97 billion, with a decline of 8.4% in 2007
(Figure 4.1).1 As a share of OECD gross national
income (GNI), ODA declined from 0.33% in 2005
to 0.28% in 2007.
The OECD recently completed its first
comprehensive survey of donors‘ spending plans
(OECD-DAC, 2008d). It reports that of the promised
increase in programme aid of US$50 billion by
2010, about US$5 billion was delivered in 2005 and
an additional US$16 billion was either committed
by donors to the multilateral development agencies
or included in their own spending plans for 2010.
Almost US$30 billion (in 2004 prices) remains
to be committed if the overall promise on aid is
to be met.
Behind the overall deficit are wide variations
in donor performance. They relate to current
disbursements measured as a share of GNI, and
to both initial promises and progress to date
(Figure 4.2). Between 2005 and 2007, Denmark,
Luxembourg, the Netherlands, Norway and Sweden
each maintained a level of aid above 0.8% of GNI.
At the other end of the scale, Japan and the United
States allocated a very low share of GNI and made
only modest commitments in 2005 to increase this.
Having set the bar low, both countries are likely to
achieve their targets. All countries in the European
Union have set the bar higher and in many cases,
particularly those of Greece, Italy, Portugal and
Spain, achieving the target level will take a
sustained increase in aid. Only Ireland and Spain
significantly increased their share of national
income devoted to aid between 2005 and 2007.
Overall, most donors are not on track to fulfil their
promises and will need to make unprecedented
increases to meet the targets they have set
themselves for 2010 (OECD-DAC, 2008d).
Global trends in aid financing give serious cause for
concern not just for education but for a wide range
of development goals: donor performance in 2006
and 2007 may reflect weakening commitment to the
Gleneagles pledges and, by extension, to the MDGs.
With economic growth slowing in many OECD
countries and governments facing mounting fiscal
pressure, there is additional danger that aid
budgets will be cut still further.
Aid to education is stagnating
Domestic resource mobilization is the key to
sustainable financing for EFA. Even in the poorest
countries, national finance is far more important
than aid. Nonetheless, for a significant number
of low income countries, external assistance
is needed to help them reach the Dakar goals.
Millions of children from poor backgrounds and
rural communities are still deprived of access
1. These figures refer to contributions made by OECD-DAC countrieseither directly (bilateral aid)or indirectly throughmultilateral organizations(multilateral aid). Otherdonors are increasing theirODA but information remainssketchy. Contributions from donors other than DACmembers and from privatefoundations are discussedlater in the chapter.
Almost
US$30 billion
remains to be
committed
if the overall
promise on aid
is to be met
2 0 7
A i d f o r e d u c a t i o n
19991999 20002000 20012001 20022002 20032003 20042004 2006200620052005 20072007
61 64 66 63 7283 87 89
63
6368
76 80 83
110 10597
64
Total ODA minus debt reliefTotal ODA
Cons
tant
200
6 US
$ bi
llion
s
Figure 4.1: Total ODA net disbursements, 1999–2007
Source: OECD-DAC (2008c).
2007 (increase) 2007 (decrease)2005 2010
GreeceUnited States
JapanItaly
PortugalNew Zealand
CanadaAustralia
United KingdomGermany
SwitzerlandFranceFinland
SpainBelgiumAustriaIreland
DenmarkNetherlandsLuxembourg
SwedenNorway
0.0 0.2 0.4 0.6 0.8 1.0 1.2
ODA as % of GNI
Figure 4.2: Aid as a percentage of GNI, net disbursements,
2005–2010
Sources: OECD-DAC (2008b, 2008c).

90
02
Education f
or A
ll G
lobal M
onitorin
g R
eport
C H A P T E R 4
to primary education because many governments
cannot make adequate provision and continue to
charge school tuition fees or impose other costs
on primary school attendance. In most low income
countries, early childhood programmes remain
largely underdeveloped and illiteracy is still
widespread, especially for women. Challenges
also remain in increasing access to post-primary
education as well as in improving education quality
and addressing threats to education systems from
pandemics, natural disasters and civil conflict.
The Dakar Framework for Action sets ambitious
targets and goals in all these areas. It also
incorporates an important commitment. When
developed countries signed on to the Framework,
they affirmed that ‘no countries seriously committed
to education for all will be thwarted in their
achievement of this goal by a lack of resources’
(UNESCO, 2000). The G8 reaffirmed this at its 2007
summit in Heiligendamm, Germany (Group of 8,
2007). Two years earlier at Gleneagles, G8 leaders
declared: ‘We support our African partners’
commitment to ensure that by 2015 all children
have access to and complete free and compulsory
primary education’ (Group of 8, 2005). To what
extent are donors acting on their promises?
The EFA Global Monitoring Report 2007 estimated
that an annual US$11 billion of aid was required
for low income countries to achieve UPE, make
significant gains in reducing adult illiteracy and
expand early childhood programmes (UNESCO,
2006). For the full set of EFA goals, including
providing basic life skills for all youth and adults
and reaching the literacy goal, the requirement
would be higher. Aid commitments to the
education sector have broadly followed overall
aid trends. The period between 1999 and 2004
was marked by a significant increase, from
US$7.3 billion to US$11.0 billion. However,
commitments fell by 23% in 2005 to US$8.5 billion
(Figure 4.3). Commitments to basic education
followed the same pattern, increasing to
US$5.2 billion by 2004 and then falling to
US$3.7 billion in 2005. (Box 4.2 details the
assumptions made to compute aid to education
and to basic education.) Overall commitments
increased again in 2006, but only to a level slightly
above that of 2004 – and aid to basic education did
not regain even its 2004 level. Annual variability
alone does not explain the pattern. The slowdown
in the growth of aid for education, and even more
so for basic education, is confirmed by calculating
two-year averages to reduce the effect of volatility
in year-on-year commitments. As Figure 4.3
shows, the average annual aid commitments in
2005 and 2006 were below those made in 2003
and 2004 for both education and basic education.
The shares of education and basic education in
total ODA are indicators of the priority they receive.
There has been little change. Table 4.1 shows that
education’s share in total aid remained broadly
stable at around 9% between 2000 and 2006, with
the exception of a fall in 2005. The share for basic
education was also maintained at around 4%,
suggesting that its position within the education
sector remained about the same. In other words,
all the growth in aid commitments to both
Aid to basic
education
in 2006
was below
2004 levels
2 0 8
19991999 20002000 20012001 20022002 20032003 20042004 2006200620052005
Cons
tant
200
6 US
$ bi
llion
s
Cons
tant
200
6 US
$ bi
llion
s
2.8
6.67.0
8.3
9.4
11.0
8.5
7.3
11.3
2.8 3.0 3.04.1
5.23.7
5.1
1999–20001999–2000
7.0
2.8
2001–20022001–2002
7.7
3.0
2003–20042003–2004
10.2
4.7
2005–20062005–2006
9.9
4.4
Total aid to education Total aid to basic education
Two year averagesAnnual
Figure 4.3: Total aid commitments to education and basic education, 1999–2006
Source: OECD-DAC (2008c).

I N C R E A S I N G A I D A N D I M P R OV I N G G OV E R N A N C E
education and basic education over this period
resulted from the general increase in aid
commitments rather than from any shifts in priority.
How has the education sector fared in comparison
with other social sectors? Increased commitments
from multilateral agencies and the growth of global
funds led to a rise in the share of health and
population programmes in total aid commitments
from 7% to 9% between 1999–2000 and 2005–2006
(Figure 4.5). The share for water and sanitation
remained at 5%. Overall, the share of total ODA
allocated to these social sectors (education, health,
population programmes, and water and sanitation),
which are at the heart of the MDGs, remained
constant at 21% between 1999–2000 and
2005–2006.
Discussion so far has centred on aid commitments.
These are important since they reflect current
priorities given to aid in general and to individual
sectors. However, the aid committed in a given year
is usually disbursed over several years.
Disbursements reflect the amount of aid actually
made available to countries in any given year.
Because of the time lag between the decision
to commit aid and its disbursement, total
disbursements reflect commitments in previous
years. Figure 4.6 shows total aid disbursements to
education and to basic education between 2002 (the
first year for which the data are available) and 2006,
pointing to a continual increase. Disbursements for
education reached US$9.0 billion in 2006, up from
US$5.5 billion in 2002 – an average increase of 11%
per year. Aid disbursements for basic education
grew at the same rate, reaching US$3.5 billion
in 2006 compared with US$2.1 billion in 2002.
2 0 9
A i d f o r e d u c a t i o n
Box 4.2: Assessing the amount of total aid to the education sector
The OECD-DAC statistical reporting system distinguishesthree main levels of education: basic, secondary and post-secondary. Aid to basic education is divided into earlychildhood education, primary education and basic life skillsfor youth and adults, including literacy. However, not all aidfor education is specified as going to a particular level ofeducation. Since 2006, the EFA Global Monitoring Reportand the Secretariat of the EFA Fast Track Initiative (FTI) haveassumed that half of ‘level unspecified’ aid for educationbenefits basic education. In addition, the education sectorreceives aid as part of general budget support. It is assumedthat one-fifth of this is allocated to education, with half of that benefiting basic education.* Hence:
Total aid to the education sector = direct aid to education+ 20% of general budget support.
Total aid to basic education = direct aid to basic education+ 50% of ‘level unspecified’ aid to education + 10% ofgeneral budget support.
Figure 4.4 shows the components of total aid commitmentsand disbursements to education and to basic education in 2006 for all recipient countries.
* A review of World Bank Poverty Reduction Support Credits suggests that between 15% and 25% of general budget support typically benefitsthe education sector (FTI Secretariat, 2006).
11.3
9.0
5.1
3.5
0.8
8.2
1.1
10.2
0.5
1.1
3.5
0.3
0.6
2.6
CommitmentsCommitments CommitmentsCommitmentsDisbursementsDisbursements DisbursementsDisbursements
Budget support
Level unspecified
Direct aidto education
Direct aid to basic education
Total
Education Basic education
Cons
tant
200
6 US
$ bi
llion
s
Cons
tant
200
6 US
$ bi
llion
s
Figure 4.4: Components of aid to education and to basic education, 2006
Source: OECD-DAC (2008c).
Table 4.1: Share of education and basic education
in aid commitments, 2000–2006
9% 9% 10% 9% 10% 7% 9%
42% 43% 36% 43% 48% 44% 45%
4% 4% 3% 4% 5% 3% 4%
Education as a shareof total ODA
Basic education as a shareof total aid to education
Basic education as a shareof total ODA
Source: OECD-DAC (2008c).
2000 2001 2002 2003 2004 2005 2006

90
02
Education f
or A
ll G
lobal M
onitorin
g R
eport
C H A P T E R 4
If commitments increase year on year,
disbursements will tend to be lower than
commitments in any given year. Provided the
commitment/disbursement ratio remains roughly
constant, education planners can expect an
increased flow of real funding. The opposite also
holds: any contraction of commitments signals
shrinkage in future flows. In the current aid context,
there is a risk that the slowdown in growth in
commitments since 2004 will soon be reflected
in slower growth, or even stagnation, of
disbursements.
Allocating aid to those in greatestneed: is equity improving?
As financial aid is scarce, its distribution is
important. Achieving maximum impact and reaching
those in greatest need are twin imperatives, but
combining efficiency with equity is often a difficult
balancing act: there is no guarantee that aid to
those in greatest need will achieve the greatest
impact. While there is no formula for determining
the right balance, increasing attention is being paid
to how aid is distributed, especially given the
slowdown in the growth of aid commitments for
education and basic education since 2004. Previous
EFA Global Monitoring Reports, particularly the
2008 Report, have described in detail the amounts
of aid received by individual countries and changes
since 1999. In the aid tables of the annex to this
year’s report, monitoring information has been
updated for 2006. This subsection goes beyond
descriptions of aid levels by country. It attempts
to evaluate the degree to which allocations are
equitable, as defined by indicators for need, and
whether they are related to progress towards EFA.
The analysis draws on data for total aid committed
to education and basic education in 2006 across
sixty-eight low income countries.
What share of aid to education goes to the poorest countries?
Aid for education was allocated to 147 countries
in 2006. The OECD-DAC defines seventy-nine of
these as middle income developing countries and
sixty-eight as low income developing countries
(OECD-DAC, 2007a). The latter group includes fifty
countries categorized as least developed. In 2006,
the low income countries received US$6.4 billion in
aid to education, slightly below the amount received
in 2004 but higher than in earlier years (Figure 4.7).
Their share of total aid to education in 2006 was
57%. While this aid share may appear relatively low,
it is higher than for any year since 2000 apart from
2004. Low income countries received a higher share
of overall aid to basic education: 75% in 2006. Again,
apart from 2004, this was higher than in any other
recent year, and almost ten percentage points
higher than during 2001–2003. These positive trends
notwithstanding, middle income developing
countries received over two-fifths of aid to education
and a quarter of aid to basic education in 2006.
Given their Dakar and G8 commitments, donors
may need to ask themselves whether this allocation
is consistent with distributional equity and the
achievement of the Dakar goals.
There is a risk
that the
slowdown in
growth in
commitments
since 2004 will
soon be reflected
in slower growth
of disbursements
2 1 0
1999–2000average
1999–2000average
2003–2004average
2003–2004average
2001–2002average
2001–2002average
2005–2006average
2005–2006average
OtherGovernment and civil societyWater supply and sanitationPopulation programmesHealthEducationAll social sectors
2%
5%
7%
5%
5%
9%
3%
4%
8%
4%
4%
8%
4%
4%
10%
4%
5%
9%
32%33%
36%35%
4%
5%
9%
4%
5%
7%
Figure 4.5: Share of social sectors in total aid commitments, 1999–2006
Note: This figure shows only direct contribution to sectors. It excludes general budget support.Source: OECD-DAC (2008c).
Cons
tant
200
6 US
$ bi
llion
s
2.1
5.5
7.2 7.28.1
9.0
2.7 2.8 3.2 3.5
20022002 20032003 20042004 20052005 20062006
Total aid to educationTotal aid to basic education
Figure 4.6: Total aid disbursements to education
and basic education, 2002–2006
Note: The European Commission was the only multilateral agencyreporting data on disbursements to the OECD-DAC Secretariat,although the IDA provided unofficial data.Source: OECD-DAC (2008c).
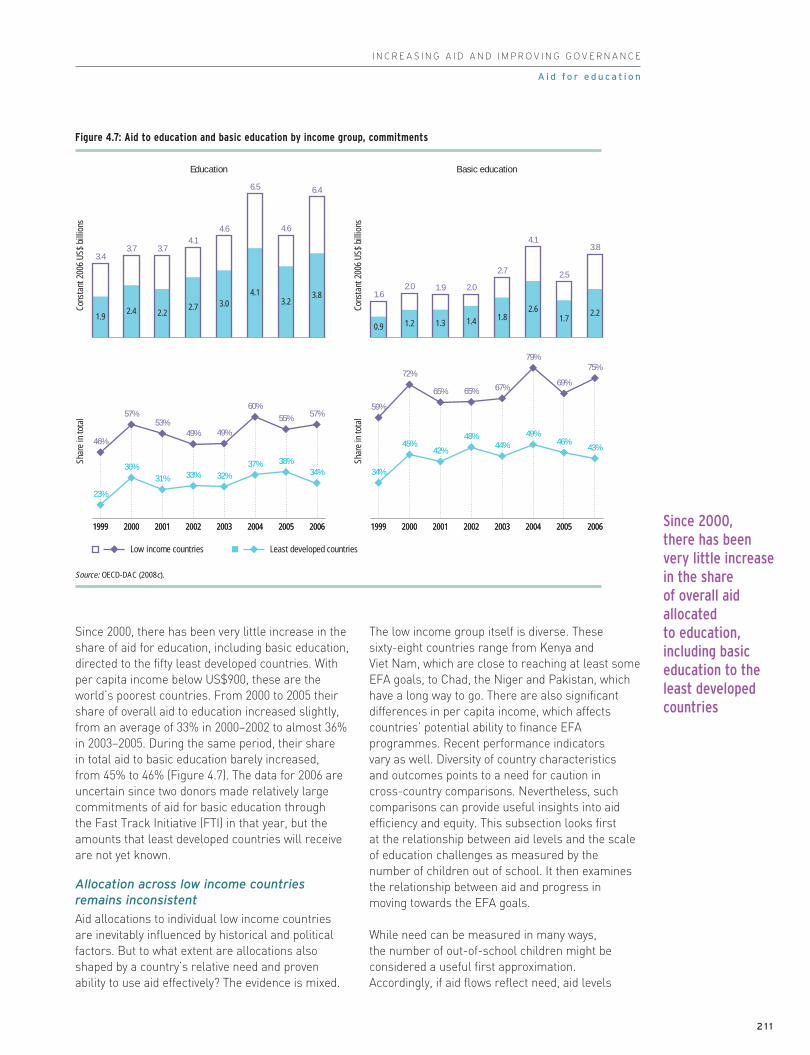
I N C R E A S I N G A I D A N D I M P R OV I N G G OV E R N A N C E
Since 2000, there has been very little increase in the
share of aid for education, including basic education,
directed to the fifty least developed countries. With
per capita income below US$900, these are the
world’s poorest countries. From 2000 to 2005 their
share of overall aid to education increased slightly,
from an average of 33% in 2000–2002 to almost 36%
in 2003–2005. During the same period, their share
in total aid to basic education barely increased,
from 45% to 46% (Figure 4.7). The data for 2006 are
uncertain since two donors made relatively large
commitments of aid for basic education through
the Fast Track Initiative (FTI) in that year, but the
amounts that least developed countries will receive
are not yet known.
Allocation across low income countriesremains inconsistent
Aid allocations to individual low income countries
are inevitably influenced by historical and political
factors. But to what extent are allocations also
shaped by a country’s relative need and proven
ability to use aid effectively? The evidence is mixed.
The low income group itself is diverse. These
sixty-eight countries range from Kenya and
Viet Nam, which are close to reaching at least some
EFA goals, to Chad, the Niger and Pakistan, which
have a long way to go. There are also significant
differences in per capita income, which affects
countries’ potential ability to finance EFA
programmes. Recent performance indicators
vary as well. Diversity of country characteristics
and outcomes points to a need for caution in
cross-country comparisons. Nevertheless, such
comparisons can provide useful insights into aid
efficiency and equity. This subsection looks first
at the relationship between aid levels and the scale
of education challenges as measured by the
number of children out of school. It then examines
the relationship between aid and progress in
moving towards the EFA goals.
While need can be measured in many ways,
the number of out-of-school children might be
considered a useful first approximation.
Accordingly, if aid flows reflect need, aid levels
Since 2000,
there has been
very little increase
in the share
of overall aid
allocated
to education,
including basic
education to the
least developed
countries
2 1 1
A i d f o r e d u c a t i o nCo
nsta
nt 2
006
US$
billi
ons
Cons
tant
200
6 US
$ bi
llion
s
Shar
e in
tota
l
Shar
e in
tota
l
19991999 20002000 20012001 20022002 20032003 20042004 2006200620052005 19991999 20002000 20012001 20022002 20032003 20042004 2006200620052005
1.62.0 1.9 2.0
2.7
4.1
2.5
3.83.4
3.7 3.74.1
4.6
6.5
4.6
6.4
59%
72%
65% 65% 67% 69%
75%79%
34%
45%42%
48%44% 46%
43%
49%
23%
36%31% 33% 32%
38%34%
37%
46%
57%53%
49% 49%
55% 57%60%
Low income countries Least developed countries
1.92.4 2.2
2.7 3.04.1
3.23.8
0.9 1.2 1.3 1.4 1.82.6
1.72.2
Education Basic education
Figure 4.7: Aid to education and basic education by income group, commitments
Source: OECD-DAC (2008c).

90
02
Education f
or A
ll G
lobal M
onitorin
g R
eport
C H A P T E R 4
should rise with the number of out-of-school
children and countries with similar numbers of
out-of-school children should receive broadly
similar amounts. Yet Figure 4.8 suggests that
the relationship between the level of aid and the
number of out-of-school children is not consistent.
For example, prior to Dakar, Ethiopia had twice as
many out-of-school children as the United Republic
of Tanzania but received three-fifths of the amount
of aid for basic education. Similarly, while the
number of out-of-school children in Kenya was
over three times as high as that in Zambia,
the latter received twice as much aid. In 2006,
Kenya still received a small amount of aid to basic
education relative to the number of out-of-school
children compared with countries such as
Mozambique and the United Republic of Tanzania.
However, while the relationship between aid and
number of out-of-school children is weak, simple
regression analysis indicates there is some
movement towards needs-based provision. Aid
to basic education was more concentrated on the
countries with the highest number of out-of-school
children in 2006 than in 2000.
If the average association between aid and out-
of-school children is positive but weak, did poorer
countries receive more aid than countries with
similar numbers of out-of-school children but
higher per capita incomes? The answer appears
to be negative. For example, while the per capita
income of Bangladesh was three times that of the
Niger, it received five times as much aid for basic
education, though both countries had around
1.3 million children out of school (see annex, aid
tables and Statistical Table 5). While donors have
increasingly allocated more aid for basic education
to countries with more out-of-school children,
there is no evidence that they have given greater
priority to the poorest countries.
Countries
making more
progress
received, on
average, slightly
more aid
2 1 2
2005–2006 average
10 000 100 000 1 000 000 10 000 000
Out-of-school children, 2005–2006
Tota
l aid
to b
asic
edu
catio
n, c
omm
itmen
ts, 2
005–
2006
ave
rage
1 000
100
10
1
Nigeria
Zambia
Kenya
EthiopiaU. R. Tanzania
1999–2000 average
10 000 100 000 1 000 000 10 000 000
Out-of-school children, 1999–2000 average
Tota
l aid
to b
asic
edu
catio
n, c
omm
itmen
ts, 1
999–
2000
ave
rage
Zambia
Kenya
Bangladesh
U. R. Tanzania Ethiopia
Nigeria
1 000
100
10
1
R2 = 0.3309R2 = 0.242
Bangladesh
Figure 4.8: Total aid to basic education (commitments) and out-of-school children of primary-school age, 1999–2000 and 2005–2006
Notes: Logarithmic scale. Size of bubbles reflects total aid to basic education (commitments).Sources: Annex, Statistical Table 5; OECD-DAC (2008c).
Total aid to basiceducation, US$ millionsOut-of-school children, millions
Bangladesh Ethiopia Kenya Nigeria U. R. Tanzania Zambia
1999–2000 average
82 26 40 42 42 93
2.3 7.0 1.8 8.1 3.1 0.6
Total aid to basiceducation, US$ millionsOut-of-school children, millions
Bangladesh Ethiopia Kenya Nigeria U. R. Tanzania Zambia
2005–2006 average
101 169 81 12 133 111
1.4 4.8 1.3 8.0 0.3 0.2

I N C R E A S I N G A I D A N D I M P R OV I N G G OV E R N A N C E
Is a country’s recent performance in educational
development reflected in the allocation of aid?
Figure 4.9 plots the amount of aid committed to
basic education per primary school-age child in
2005–2006 against the change in net enrolment
ratios since Dakar in forty-one countries. The
relationship overall is positive but weak. Countries
making more progress (shown towards the right
side of the figure) received, on average, slightly
more aid. The relationship, however, is far from
perfect. Countries including Ethiopia and the United
Republic of Tanzania, where enrolment rates have
almost doubled since Dakar, received less aid per
capita than Burkina Faso, Mali, Senegal and
Zambia, where progress was slower. Overall,
progress in increasing enrolment explained only
about 15% of the variance in the distribution of
the amounts of aid to basic education per child.
Measured against common indicators of progress,
the aid distribution reveals some apparently
arbitrary outcomes. For example, if aid is partly
intended to reflect strong performance on shared
goals, it is not clear why Malawi received somewhat
more aid than Ethiopia, since the enrolment rate
fell in the former and doubled in the latter. Clearly,
donor perceptions of countries’ capacity to absorb
increased aid are important, although this would
appear to provide a limited explanation. The Niger,
for instance, has a stronger record than Burkina
Faso on getting children into school, but received
only one-third the amount of aid per primary
school-age child.
Fragile states are a distinctive subset of countries.
By almost any standard they have high need relative
to domestic financing capacity. Many also face tight
constraints in terms of institutional capacity. Is it
possible to judge whether donors are giving
sufficient attention to such countries? In 2006,
the thirty-five countries that the OECD-DAC
defines as fragile received US$1.6 billion in aid to
education, of which US$0.9 billion was allocated
to basic education.2 These amounts represented
14% of all education aid and 17% of aid to basic
education, only slightly higher than the share
of fragile states in the combined population of all
developing countries. Given the low levels of access
to education, low completion rates and severe
problems in education quality in the fragile states,
combined with their domestic financing and
capacity constraints, these aid levels would appear
to reflect a very limited commitment to needs-
based aid financing.
The overall record can be briefly summarized.
In recent years there has been a slight shift towards
targeting aid to basic education in the countries
most in need. Low income countries’ share of total
aid to education marginally increased, though
within this group the share going to the least
developed countries remained constant. Within
the low income country group there is a weak but
positive trend in aid commitments towards the
countries with the greatest educational needs, as
defined by the size of their out-of-school population.
There is also some evidence – albeit limited and
inconsistent – that countries that have performed
2. The education sectors of fragile states also received2% of all emergency aidallocations (Save theChildren, 2008b).
2 1 3
A i d f o r e d u c a t i o n
More rapid progress towards UPE
Mor
e ai
d to
bas
ic e
duca
tion
per c
hild
30
40
50
60
70
80
-20 0 20 40 60 80 100 120
Burkina Faso
Yemen
Nepal
Bolivia
Malawi
DomincanRep.
Zambia
Ghana
Mali
Mozambique
U. R. Tanzania
EthiopiaGuinea
Niger
Nigeria
Senegal
Change in NER between 1999–2000 and 2005–2006 (%)Ai
d to
bas
ic e
duca
tion
per p
rimar
y sc
hool
-age
chi
ld,
com
mitm
ents
, 200
5–20
06 a
vera
ge
R2 = 0.1472
10
20
Figure 4.9: Aid to basic education (commitments) and progress towards UPE
Note: Size of bubbles reflects total aid to basic education per primary school-age child (commitments).Sources: Annex, Statistical Table 5; OECD-DAC (2008c).
Dominican Rep.MalawiBoliviaNigeriaNepalGhanaMaliSenegalYemenBurkina FasoZambiaMozambiqueGuineaNigerU. R. TanzaniaEthiopia
Total aid to basic education per primary
school-age child(Constant 2006 US$)
2005–2006 average
Out-of-primary school children
(000)
2005–2006 average
Change in net enrolmentratios between 1999–2000
and 2005–2006
(%)
19 239 -715 180 -720 52 0
1 8 097 95 702 22
36 1 200 2674 795 3042 500 3113 906 3451 1 237 3549 150 3639 928 4512 403 6117 1 238 6619 329 9713 4 782 108

90
02
Education f
or A
ll G
lobal M
onitorin
g R
eport
C H A P T E R 4
relatively well in expanding access to basic
education have been rewarded with aid. Yet none
of this points to any overarching commitment to
greater efficiency or equity in aid flows.
It is important to exercise caution in interpreting
these results. The concept of need is broad and
can be measured in various ways. Similarly, there
is no single yardstick for progress towards EFA.
Nevertheless, there appear to be strong grounds
for strengthening both the focus on equity and
the level of aid commitments to those countries
registering progress.
Donor performance: a mixed record
In their dialogue with developing countries, donors
have strongly emphasized the importance of equity
in public spending. The share of basic education
in overall spending is widely used as an indicator
for equity. Were they to apply the same standards
to themselves, many donors would regard their own
aid programmes as highly inequitable. Few give
high priority to supporting the EFA goals, either
through their own programmes or in contributions
to the Fast Track Initiative Catalytic Fund.
Although several countries have made significant
aid contributions to education relative to the size
of their economies (e.g. Canada, Denmark, Ireland,
Luxembourg), overall financing to education is
dominated by a small core of donors. In 2006,
France was the largest (US$1.9 billion), followed
by Germany (US$1.4 billion), the Netherlands
(US$1.4 billion), the United Kingdom (US$1.2 billion)
and the International Development Association (IDA)
of the World Bank (US$1.0 billion) (Figure 4.10).
Apart from Japan, the European Commission and
the United States, no other donor committed more
than US$300 million to education. Because of its
relatively small economy, the performance of
the Netherlands stands out.
When it comes to distribution among different
levels of education, large donors have a mixed
record. For example, in 2006 France directed only
17% of total aid to education to the basic levels and
Germany only 11%. Both countries’ education aid is
skewed towards tertiary education. In contrast, the
Netherlands allocated 83% of its total education aid
to basic education and the United Kingdom 71%.
The Netherlands was the largest donor to basic
education in 2006 at US$1.1 billion, almost one-
Financing to
education
is dominated
by a small
core of donors
2 1 4
Total aid to education Total aid to basic education
IDAEC
AfDFAsDF
FTIUNICEF
FranceGermany
NetherlandsUnited Kingdom
JapanUnited States
CanadaNorway
SpainSwedenBelgium
AustraliaAustria
SwitzerlandIreland
New ZealandFinland
DenmarkLuxembourg
Greece
Constant 2006 US$ millions
0 500 1 000 1 500 2 000 0
IDAEC
AfDFAsDF
FTIUNICEF
NetherlandsUnited Kingdom
United StatesFranceJapan
GermanySwedenNorway
SpainAustralia
IrelandBelgium
SwitzerlandDenmark
New ZealandFinland
LuxembourgPortugalAustriaGreece
200 400 600 800 1 000 1 200
Constant 2006 US$ millions
Education Basic education
1 026683
206190
8540
1 8621 388
1 3571 170
920553
270266
233211
164155
10469686046443024
597302
7026
8539
1 129834
403308
243155153
13588
744542
2827201911953
Figure 4.10: Total aid to education and basic education (commitments), by donor, 2006
Note: Italy did not report aid data in 2006.Source: OECD-DAC (2008c).
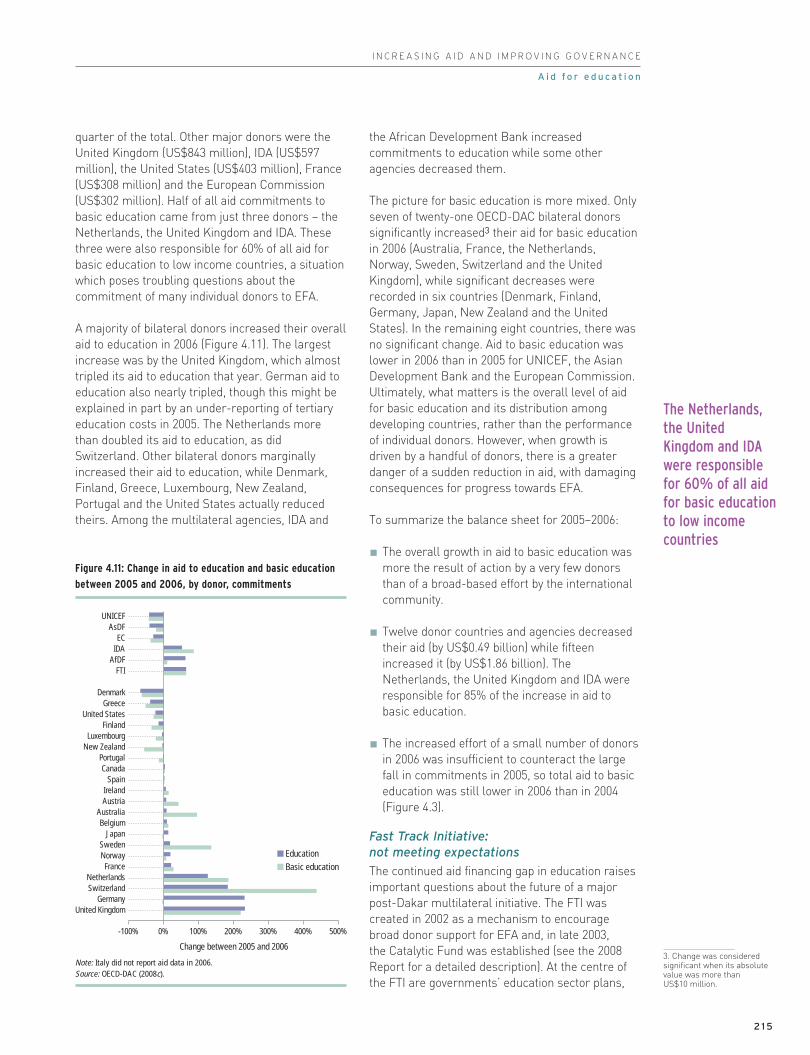
I N C R E A S I N G A I D A N D I M P R OV I N G G OV E R N A N C E
quarter of the total. Other major donors were the
United Kingdom (US$843 million), IDA (US$597
million), the United States (US$403 million), France
(US$308 million) and the European Commission
(US$302 million). Half of all aid commitments to
basic education came from just three donors – the
Netherlands, the United Kingdom and IDA. These
three were also responsible for 60% of all aid for
basic education to low income countries, a situation
which poses troubling questions about the
commitment of many individual donors to EFA.
A majority of bilateral donors increased their overall
aid to education in 2006 (Figure 4.11). The largest
increase was by the United Kingdom, which almost
tripled its aid to education that year. German aid to
education also nearly tripled, though this might be
explained in part by an under-reporting of tertiary
education costs in 2005. The Netherlands more
than doubled its aid to education, as did
Switzerland. Other bilateral donors marginally
increased their aid to education, while Denmark,
Finland, Greece, Luxembourg, New Zealand,
Portugal and the United States actually reduced
theirs. Among the multilateral agencies, IDA and
the African Development Bank increased
commitments to education while some other
agencies decreased them.
The picture for basic education is more mixed. Only
seven of twenty-one OECD-DAC bilateral donors
significantly increased3 their aid for basic education
in 2006 (Australia, France, the Netherlands,
Norway, Sweden, Switzerland and the United
Kingdom), while significant decreases were
recorded in six countries (Denmark, Finland,
Germany, Japan, New Zealand and the United
States). In the remaining eight countries, there was
no significant change. Aid to basic education was
lower in 2006 than in 2005 for UNICEF, the Asian
Development Bank and the European Commission.
Ultimately, what matters is the overall level of aid
for basic education and its distribution among
developing countries, rather than the performance
of individual donors. However, when growth is
driven by a handful of donors, there is a greater
danger of a sudden reduction in aid, with damaging
consequences for progress towards EFA.
To summarize the balance sheet for 2005–2006:
The overall growth in aid to basic education was
more the result of action by a very few donors
than of a broad-based effort by the international
community.
Twelve donor countries and agencies decreased
their aid (by US$0.49 billion) while fifteen
increased it (by US$1.86 billion). The
Netherlands, the United Kingdom and IDA were
responsible for 85% of the increase in aid to
basic education.
The increased effort of a small number of donors
in 2006 was insufficient to counteract the large
fall in commitments in 2005, so total aid to basic
education was still lower in 2006 than in 2004
(Figure 4.3).
Fast Track Initiative: not meeting expectations
The continued aid financing gap in education raises
important questions about the future of a major
post-Dakar multilateral initiative. The FTI was
created in 2002 as a mechanism to encourage
broad donor support for EFA and, in late 2003,
the Catalytic Fund was established (see the 2008
Report for a detailed description). At the centre of
the FTI are governments’ education sector plans,
3. Change was consideredsignificant when its absolutevalue was more thanUS$10 million.
The Netherlands,
the United
Kingdom and IDA
were responsible
for 60% of all aid
for basic education
to low income
countries
2 1 5
A i d f o r e d u c a t i o n
EducationBasic education
Change between 2005 and 2006
UNICEFAsDF
ECIDA
AfDFFTI
DenmarkGreece
United StatesFinland
LuxembourgNew Zealand
PortugalCanada
SpainIrelandAustria
AustraliaBelgium
JapanSwedenNorway
FranceNetherlandsSwitzerland
GermanyUnited Kingdom
-100% 0% 100% 200% 300% 400% 500%
Figure 4.11: Change in aid to education and basic education
between 2005 and 2006, by donor, commitments
Note: Italy did not report aid data in 2006.Source: OECD-DAC (2008c).

90
02
Education f
or A
ll G
lobal M
onitorin
g R
eport
C H A P T E R 4
whose endorsement by local donor representatives
serves as an indicator of readiness for scaled-up
aid. The Catalytic Fund is not intended as a first
call for aid for basic education – bilateral and
multilateral agency programmes continue to play
that role. The Fund’s initial purpose was to provide
short-term support to countries without bilateral
programmes. The rules for eligibility and length
of support have since been expanded. Currently,
thirty-five country plans have been endorsed, eight
others were expected to be by the end of 2008 and
a further thirteen during 2009. While the FTI’s
central role is to leverage bilateral programmes,
several countries see its Catalytic Fund as an
important source of finance in its own right.
The balance sheet raises some important questions
about the current and prospective role of the
Catalytic Fund. One concerns the failure to develop
a deep donor support base. Pledges to the Fund for
2004–2011 amount to US$1.3 billion from seventeen
donors. Pledges for 2007 and 2008 were below
those for 2006 (US$265 million and US$383 million,
against US$439 million). So far the Netherlands has
pledged 43% of the total and the United Kingdom
21%. Together with the European Commission and
Spain, these donors are responsible for 79% of all
pledges. Eight of the sixteen bilateral donors that
are members of the FTI and regularly take part
in its meetings have so far pledged less than
US$20 million each. This suggests either a low
level of commitment or a low level of confidence
in the Catalytic Fund, or both.
When measured in terms of overall financing,
the Catalytic Fund is of limited relevance. Of the
US$1.3 billion pledged, US$1.1 billion has been
notionally allocated but not all of it has been
transferred yet. Agreements totalling just
US$329 million have been made with countries,
with total disbursements by the end of February
2008 amounting to US$270 million. Eighteen
countries have received grants; the largest
amounts went, in descending order, to Kenya,
Yemen, Madagascar, Ghana and Nicaragua.
No other country has received above US$10 million.
Of the total commitments of aid to basic education
in low income countries in 2006, the Catalytic Fund
accounted for just over 2%. Looking to the future,
the Fund faces a large and imminent shortfall.
For 2008, the projected needs for endorsed
programmes are estimated at US$1.0 billion.
By 2010, the estimated financing gap for the
fifty-six countries expected to have had their
plans endorsed is US$2.2 billion per year. Without
more pledges, projected needs will not be met.
Some countries receiving support from the Catalytic
Fund will see it interrupted while those with newly
endorsed plans will not be able to get support
from the fund at all.
Non-DAC and other kinds of aid
The data on aid presented so far are those
reported by bilateral and multilateral agencies
to the OECD-DAC Secretariat. Non-DAC bilateral
donors also support education in developing
countries. For instance, the number of African
students on government scholarships in China is
expected to double from 2,000 in 2006 to at least
4,000 by 2009. China has also agreed to train
15,000 African professionals between 2007
and 2009 in several technical, scientific and
administrative fields, and to construct 100 rural
schools (Forum on China-Africa Cooperation, 2006).
Private foundations increasingly provide support
for basic education. In 2006 the Hewlett and Gates
foundations announced they would provide a series
of grants totalling US$60 million to improve the
quality of primary and secondary school education
in developing countries (William and Flora Hewlett
Foundation, 2006). In 2007 they allocated
US$9.1 million over three years to the Indian
non-government organization (NGO) Pratham for
its Read India programme, which works to improve
reading skills across 100 districts in India (William
and Flora Hewlett Foundation, 2007). Another
significant initiative in 2007 was the launch of Dubai
Cares. This foundation has raised nearly
US$1 billion from individuals and businesses in
Dubai and entered a partnership with UNICEF to
educate 1 million children (UNICEF, 2008). The first
activities of this partnership are a programme in
Djibouti to build and rehabilitate primary schools to
benefit 30,000 children and to improve the quality of
education. In addition, the foundation has allocated
US$16.6 million to Save the Children to support
education in Sudan (Save the Children, 2008a).
As well as providing ODA through grants and
concessional loans, several multilateral agencies
provide non-concessional loans for education. The
World Bank is the largest source of such loans. It
provided US$1.3 billion a year on average between
1999 and 2006 to support education development,
mainly in middle income countries, including about
US$700 million for basic education, which is slightly
above the amount of aid allocated to basic
Looking to
the future, the
Fast Track
Initiative’s
Catalytic Fund
faces a large
and imminent
shortfall
2 1 6

I N C R E A S I N G A I D A N D I M P R OV I N G G OV E R N A N C E
education through IDA. Around 60% of the loans
were made to Latin American countries in 2005
and 2006, the largest recipients being Brazil,
Colombia, Mexico and the Bolivarian Republic
of Venezuela (plus the Philippines). Regional
development banks are also active. Over 1999–2006,
the African Development Bank committed
US$16 million a year, the Asian Development Bank
US$83 million a year and the Inter-American
Development Bank about US$283 million a year,
on average (Figure 4.12). About half these loans
were specifically for basic education.
Are donors adequately supportingEFA in low income countries?
International aid for education is at a watershed.
As Chapter 2 shows, achieving the goals and targets
of the Dakar Framework for Action will require a
significant increase in momentum. National policies
will determine prospects for success. But if donors
do not renew their commitment to act on their
Dakar pledge that no country should fail in its
efforts to achieve EFA for want of resources,
the UPE goal will not be reached.
An earlier section cites the estimate of
US$11 billion needed annually to achieve a subset
of basic education goals in low income countries.
Achieving all the EFA goals requires more than
that. To close the financing gap, overall aid to basic
education in low income countries will have to rise
by a factor of three from the current level of
US$3.8 billion a year. Whether this is done through
an increase in total aid or redistribution of total
aid to education, or both, it is clear that current
practices have to change – and soon. The Dakar
UPE commitment is time-bound. To achieve UPE
by 2015, governments need to put the long-term
plans in place today for building schools, recruiting
and training teachers, and providing incentives for
marginalized groups.
In reality, it does not make sense to talk of ‘the
donors’ for basic education in aggregate, because
there are vast differences among the countries
and organizations supporting EFA. Some are
clearly giving it high priority – increasing overall
aid for education, focusing on the poorest countries
and allocating a high share to the basic levels –
and some are not (Figure 4.13).
In 2005 and 2006, Canada, IDA, the Netherlands
and the United Kingdom each allocated,
on average, more than three-quarters of their
education aid to low income countries and basic
education made up at least half of their total aid
to education. To a lesser degree, Norway and
Sweden have demonstrated similar priorities.
Several other major donors are falling short on
one or more counts. France, Germany and Japan
have shown a relative neglect of basic education
and low income countries. France and Germany
maintain aid programmes that are weakly
aligned with their international commitments
to the Dakar Framework for Action and the
education MDGs. Both give greater weight to
subsidizing the entry into their universities of
foreign students, mainly from middle income
developing countries, than to supporting basic
education in low income countries (Box 4.3).
The recent commitment by the French
Government to work with the United Kingdom
in a partnership aimed at getting 16 million
sub-Saharan African children into school by 2015
is welcome if it signals a more thoroughgoing
reassessment of aid priorities (France Ministry
of External and European Affairs, 2008).
France, Germany
and Japan have
shown a relative
neglect of basic
education and low
income countries
2 1 7
A i d f o r e d u c a t i o n
1.4
0.9
2.32.2
1.2
2.6
1.51.6
19991999 20002000 20012001 20022002 20032003 20042004 2006200620052005
AsDBAfDBECIDBIBRDTotal
Cons
tant
200
6 US
$ bi
llion
s
0
0.5
1.0
1.5
2.0
2.5
3.0
Figure 4.12: Non-concessional loans for education,
1999–2006, commitments
Source: OECD-DAC (2008c).

90
02
Education f
or A
ll G
lobal M
onitorin
g R
eport
C H A P T E R 4
Missed opportunities, collective underperformance and a weak voice for EFA
Current trends in aid raise serious concerns about
prospects for delivering on the promises made at
Dakar. Commitments to education were no higher
in 2006 than in 2004 – and in basic education they
were a little lower. Distribution remains a serious
concern: less than half of aid for basic education
was allocated to the fifty least developed countries.
It is not just the level of aid that is less than what is
needed – and what was promised. Central parts of
the post-Dakar aid architecture are falling short.
The FTI was created to support the development
of the credible EFA plans called for in the Dakar
Framework, to harmonize donor efforts in basic
education and to encourage more bilateral aid. The
subsequent creation of the Catalytic Fund, initially
for countries not linked with bilateral donors but
later expanded to others, was an important
addition. Yet, having created these institutions,
donors are failing to deliver. Bilateral support for
basic education is stalling and, unless the Catalytic
Fund is replenished sufficiently, its credibility and
that of the FTI itself will be diminished.
2 1 8
Box 4.3: France and Germany focus on aid to post-secondary education
In 2005 and 2006, France’s aid to educationaveraged US$1.7 billion annually and Germany’sUS$0.9 billion, making them the largest andthird-largest donors to the sector (Figure 4.14).However, only 12% of France’s aid to educationsupported basic education in low incomecountries, while for Germany the share was 7%.They allocated a large share of their overalleducation aid to the imputed cost of studentsfrom developing countries studying in theirtertiary education institutions. Imputed studentcosts accounted for 62% of France’s aid toeducation and 50% of Germany’s.
Imputed student costs were a significant shareof all aid to education for some recipientcountries. In Algeria, for example, theyaccounted for 80% and in Tunisia for 40%.In Morocco, where the net enrolment ratio wasbelow 90% in 2006 and the adult literacy ratewas just over 50%, two-thirds of all aid toeducation took the form of imputed studentcosts while only 7% supported the EFA goals.
All developingcountries
All developingcountries
All developingcountries
All developingcountries
Low incomecountries
Low incomecountries
Low incomecountries
Low incomecountries
Other post-secondary educationImputed student costsSecondary educationBasic education
Cons
tant
200
6 US
$ bi
llion
s
0
0.2
0.4
0.6
0.8
1.0
1.2
1.4
1.6
1.8 France Germany
1.1
0.3 0.2 0.20.1
0.30.4
0.3
0.2
0.20.1 0.2
0.0
0.1
0.1
0.1
Figure 4.14: Distribution of aid to education by level, France and Germany, commitments, 2005–2006 annual average
Source: OECD-DAC (2008c).
Share of low income countries in total aid to education
Shar
e of
bas
ic e
duca
tion
in to
tal a
id to
edu
catio
n
0%
20%
40%
60%
80%
100%
20% 30% 40% 50% 60% 70% 80% 90% 100%
More priority for low income countries
Mor
e pr
iorit
y fo
r bas
ic e
duca
tion
Germany France
UnitedKingdom
IDASweden
Norway
Netherlands
Japan
United States
EC
Canada
Figure 4.13: Donor priority to low income countries and to basic education,
aid commitments, 2005–2006 annual average
Notes: Size of bubbles reflects total aid for basic education to low income countries, 2005–2006 average(commitments). Only donors with education aid above US$100 million on average in 2005 and 2006 are shown.Source: OECD-DAC (2008c).
Some donors have a strong record on prioritizing aid
to basic education but a weak record on targeting
low income countries. For example, the United
States and the European Commission allocate less
than half their education aid to low income countries.

I N C R E A S I N G A I D A N D I M P R OV I N G G OV E R N A N C E
An opportunity to help galvanize donors as a
whole behind the EFA agenda will have been lost.
Set against this discouraging background are some
positive signs. The reaffirmation in the 2007 G8
communiqué of the Dakar commitment to ensure
that lack of resources does not undermine national
EFA efforts was encouraging (Group of 8, 2007).
So was the promise to work ‘to meet shortfalls
in all FTI-endorsed countries’, repeated in 2008 in
Hokkaido. In June 2008, the European Council
reaffirmed its support for EFA and pledged an
increase in education aid of ¤4.3 billion by 2010
(Council of the European Union, 2008).
But promises are only as good as their realization.
If donors are serious, they cannot afford another
two years of collective underperformance.
Accelerated progress towards EFA will not be
possible without a strengthened international
commitment to increase overall aid to the levels
pledged in 2005. In the current international
environment, that commitment will require
renewed international leadership – part of which
must come from the education sector itself. The
most obvious source of guidance is the High-Level
Group on Education for All, the intent of which is
to bring together heads of state or government,
ministers of education and of international
cooperation, heads of development agencies, and
representatives of civil society and the private
sector. Its role is to reinforce political will in order
to accelerate progress towards EFA, strengthen
partnerships, identify priorities and highlight the
resources to be mobilized.
Meetings of the High-Level Group have so far failed
to drive the Dakar Framework forward and to
galvanize international action, partly because they
have not attracted sufficient ministerial attendance
from donor countries. The broader problem is that,
with the notable exception of a few bilateral donors,
EFA has lacked a strong and consistent voice to
keep it at the centre of the international
development agenda. An important challenge for
the High-Level Group meeting in 2008, and for
UNESCO, is to provide that voice and to lay the
base for reinvigorating donor support to EFA.
Governance and aid effectiveness
Increased aid is one part of the equation for
delivering on the commitments made at Dakar.
More effective aid is the other. Ultimately, the case
for more aid will be won only if it is perceived as
delivering positive results. Whether aid is effective
is partly a function of governance in developing
countries. High levels of corruption, low levels of
transparency and accountability, and an absence
of effective development strategies add up to an
environment not conducive to effective aid. The
governance of aid itself is also important. Ensuring
that development assistance builds, rather than
erodes, national capacity to deliver change, that
it is predictable and that it supports national
strategies for achieving well-defined goals is
critical to its effectiveness.
Recent years have witnessed a growing concern
to address problems in aid quality. Some of that
concern originates with aid recipients. Developing
country governments point to the high transaction
costs, undue donor influence in policy design and
a failure to use national systems as problems that
reduce aid effectiveness. For their part, donors
have recognized that traditional aid delivery
systems are flawed. Increasingly, developed
country governments have acknowledged that
aid conditionality is less effective in delivering
results than national ownership of development
strategies. Wider problems in aid governance
have also been recognized. These include the
channelling of aid through stand-alone projects
rather than through national budgets, financial
systems and programmes; weak coordination
between donors; and unpredictable aid financing.
Accordingly, in 2005 donors set out a new vision for
the governance of development assistance in the
Paris Declaration on Aid Effectiveness (OECD-DAC,
2005). In it, rich countries resolve ‘to take far-
reaching and monitorable actions to reform the
ways we deliver and manage aid’. The watchwords
of the new approach are harmonization, alignment
and national ownership. Specific commitments
have been undertaken in the form of targets
for enhancing aid predictability, using national
institutions and financial systems, and cutting
transaction costs through improved donor
coordination.
EFA has lacked
a strong and
consistent voice
to keep it
at the centre of
the international
development
agenda
2 1 9
G o v e r n a n c e a n d a i d e f f e c t i v e n e s s

90
02
Education f
or A
ll G
lobal M
onitorin
g R
eport
C H A P T E R 4
Is the new governance model delivering results?
In some cases, changes in aid delivery mechanisms
are lowering transaction costs and reducing
fragmentation. In others, new delivery mechanisms
have not been able to overcome existing problems.
The emerging aid governance system is struggling
to produce benign outcomes, partly because
genuine national ownership requires a real capacity
to develop, implement and evaluate strategies,
which has not yet emerged in all countries; and
partly because some old donor habits die hard
and many donors find it difficult to remain at arms
length. One example, touched on at the end of this
section, is that donors tend to develop their own
positions on what constitutes ‘good governance’
in the education sector and elsewhere. This may
be giving rise to a rather narrowly defined range
of good governance measures that governments
perceive as necessary to attract donor support.
In the rest of this section the emerging aid
governance agenda is examined to see what
difference, if any, it has made to the quality and
effectiveness of aid to education. The recent
approach of donors to education governance
in developing countries is also described.
Improving the quality of aid
Viewed from one perspective, the importance
of international aid is exaggerated. In the case
of the Dakar commitments, as in other areas,
real progress ultimately depends on whether
goverments address problems, mobilize domestic
resources and tackle inequalities in their education
systems. But as this chapter has made clear,
for many countries aid matters: even the best
plans will not deliver UPE and wider goals by 2015
in the poorest countries without a large increase
in development assistance.
How aid is delivered can be as important as
how much aid is delivered. Unpredictable flows
do not provide a secure foundation for long-term
investment in schools, teacher recruitment and
training, and targeted support for marginal groups.
Similarly, when donors provide aid in ways that
bypass national systems and overstretch national
management capacity, the outcomes are seldom
sustainable.
The new aid paradigm is intended to address
governance problems in aid delivery and highlight
government responsibility. Few people would
contest the objectives. Respect for national
ownership and the pursuit of greater efficiency
in donors’ contributions to poverty reduction
are intrinsically laudable. In practice, though,
it is more difficult to change procedures than
it is to change the language of aid governance.
The Paris Declaration marks an important
acknowledgement by donors of real failings in
their performance. Donor proliferation, the use
of projects to bypass government structures,
weak coordination and disparate reporting
systems are hallmarks of poor aid governance
that have left a deep imprint on many countries.
Consequences have included weakened policy-
making and budgeting processes, fragmentation
of service delivery, and erosion of capacity and
national institutions. The OECD-DAC, in its 2008
survey of aid practices in fifty-four countries,
revealed the scale of the problem. Only 43%
of donor-supported projects and programmes
evaluated were using partner country procurement
systems. The Niger hosted over 600 donor
missions in 2007, fewer than 100 of which were
joint missions (OECD-DAC, 2008a).
OECD-DAC members have adopted indicators
to measure progress towards more effective aid.
Goals include quantified reductions in the share
of aid not reported or included in national budgets,
and targets for increasing joint missions. There is
also a commitment to increase the share of aid
delivered through programme-based, rather than
project-based, approaches to two-thirds of the
total. Recognizing that short- as well as medium-
term aid predictability is central to sound public
finances, the Paris agenda includes a commitment
to halve the proportion of aid not disbursed in
the fiscal year for which it was scheduled.
Despite good intentions, progress in all these
areas has been variable (Box 4.4). Of course, not
all the problems and shortfalls can be attributed
to donor failings. It makes little sense, for instance,
to channel resources through national budgets
in countries where egregious corruption is known
to exist. Still, donors’ performance against their
own benchmarks raises important governance
questions. Donors can hold aid recipients to
account for good governance by simply restricting
aid flows, but how might aid recipients who have
delivered on their side of the compact hold donors
to account? Do any incentives exist to encourage
good behaviour by donors?
The Paris
Declaration marks
an important
acknowledgement
by donors of real
failings in their
performance
2 2 0

I N C R E A S I N G A I D A N D I M P R OV I N G G OV E R N A N C E
Monitoring the Paris agenda commitments
is an important step towards genuinely shared
accountability. Yet monitoring exercises are only
as effective as their follow-up. The 2008 OECD-DAC
survey provides clear evidence of serious problems
in aid partnerships. National ownership remains
weak, transaction costs are high, donor
commitment to national systems is still lacking
and donor coordination remains rudimentary.
If aid is scaled up while governance arrangements
remain largely the same, transaction costs
can be expected to rise without a commensurate
increase in aid effectiveness, as measured in real
development results.
The following subsections examine what the
emerging agenda on the governance of aid has
meant for aid to education and for prospects of
achieving the goals and targets set under the Dakar
Framework for Action. Four areas are considered:
the shift from projects to programmes;
action on ownership;
alignment of aid with national priorities
and systems;
donor coordination.
Shifting from projects to programmes
One benchmark used to assess progress on the
new approach to delivering aid is the level of donor
commitment to programme-based aid. Project-
based support is widely perceived as an underlying
cause of fragmentation, involving high transaction
costs and, especially where projects are
administered and evaluated through separate
units, potentially undermining efforts to strengthen
national capacity. The criteria for measuring
commitment to programme-based aid include
growth in the share of aid provided as pooled
funding and budget support. The target is to provide
two-thirds of the total by 2010. There has been a
particularly strong trend towards the adoption of
sector-wide approaches (SWAps) in social sectors,
with education figuring prominently. The trend
has been driven by a conviction that coordinated
provision of aid from all donors to support broad
sector programmes will strengthen national
ownership and improve development results.
Experience to date suggests that this view is
broadly justified, with some important caveats.
In terms of financial commitment, there has been
a strong push towards programme-based support
in education. Although the data represent only a
rough guide because of definition problems,
the best estimate suggests that the share of aid
delivered through sector programmes increased
from 31% in 1999–2000 to 54% in 2005–2006
(Figure 4.15). Examples of education sector
programmes developed and implemented in five
countries over the past decade are summarized
in Figure 4.16. From a narrow base, the number
of donors involved in these programmes has
increased. However, some major donors, including
Japan and the United States, as yet provide no
financial support directly through SWAps.
There has
been a strong
push towards
programme–
based
support in
education
2 2 1
G o v e r n a n c e a n d a i d e f f e c t i v e n e s s
Box 4.4: Aid effectiveness —
falling short of the 2010 targets
The Paris Declaration marked a departure for aid governance.For the first time, donors and recipient governments settargets for 2010 for measuring aid effectiveness. Earlymonitoring results from fifty-four developing countries andtwenty-seven donors, accounting for half of all aid delivered in 2007, suggest that the targets will not be achieved in mostcountries and that progress has been slow and uneven:
Country ownership remains weak. Fewer than one-quarterof the surveyed countries have national developmentstrategies that are clearly linked to the national budget.This is up from 17% in 2005, but far short of the 2010target of 75%.
Monitoring capacity is limited. Fewer than 10% of the aidrecipients covered are assessed as having systems capableof monitoring development results — a slight increase from 7% in 2005, but the 2010 target is 35%.
Progress on aligning aid with government programmes has been minimal. 46% of all aid was delivered throughcommon aid delivery arrangements such as SWAps. This is roughly the same proportion as in 2005. The target for 2010 is 66%.
Use of national systems remains limited. Only 45% of aid is channelled through national public financial managementsystems. This is not a major increase over the 40% levelregistered in 2005 and is only just over halfway towards the2010 target of 80%. Even in countries with good systems,donors are not necessarily making more use of them,indicating that quality is not the only factor influencingdonor choices. For example, although Mongolia’s financialmanagement system was ranked one of the highest amongthe fifty-four countries monitored, only 17% of all aid to the country is managed through its national system.
Donor coordination is still rudimentary. In 2007, the fifty-four countries received more than 14,000 donor missions,of which only one in five was coordinated on a joint-donorbasis. The 2010 target is 40%.
Source: OECD-DAC (2008a).

90
02
Education f
or A
ll G
lobal M
onitorin
g R
eport
C H A P T E R 4
The strength of the momentum towards
programme-based support varies. In broad terms,
it has been strongest in low income, more aid
dependent countries. While it was initially driven
largely by donors, governments in these countries
expect that programme-based support will allow
for greater flexibility, more predictability and
reduced transaction costs, and that national
priorities will dictate programme content. In
contrast, governments in middle income countries,
which tend to have fewer donors and are less aid
dependent, often prefer to negotiate with donors
separately rather than with a coordinated group.
Coordinated aid to education sector programmes is
also uncommon in fragile states, mainly because of
the lack of government capacity to lead the process.
Acting on ownership
One aim of programme-based support is to
strengthen national ownership. In the language
of the new aid governance paradigm, country
ownership requires governments to ‘exercise
leadership in developing and implementing their
national development strategies through broad
consultative processes’ and donors to ‘respect
partner country leadership and help strengthen
the capacity to exercise it’ (OECD-DAC, 2005).
Is this happening in education?
In the education sector as in other areas, SWAps
are widely presented as a vehicle for strengthened
ownership. In a world of good governance,
education sector plans would be developed by
governments, with clear priorities reflected in
national budgets and wider strategies, and they
would be supported through coordinated donor
actions. Early SWAps did not conform to this model.
Most governments lacked capacity to develop
effective SWAps, and donor influence weighed
heavily in design and implementation. Over time,
ownership and government leadership have
strengthened, but progress has been neither
universal nor uniform.
An obvious dilemma for aid dependent countries
is that donors control the purse strings and have
a ‘right of last refusal’. Paradoxically, SWAps can
weaken aid recipients’ negotiating position and
strengthen donors’ policy leverage. Project-based
aid, whatever its wider limitations, was based on
a bilateral relationship between recipients and
individual donors. The strength of any donor was
contingent on the size of its financial commitment
or strategic role. With programme-based aid,
donors act collectively, effectively pooling their
resources in national budgets. Collective action in
this context can increase the negotiating strength
of the donor community in SWAp discussions.
The prospect of increased donor power may be one
reason why some governments continue to prefer
projects. Programme aid might offer a textbook
route to greater efficiency, but it can also entail
greater intrusion into national policy. As one
commentator puts it, ‘recipients now face a more
intimate supervision of all aspects of national
planning, budgeting and development programme
implementation than at any time since
independence’ (Fraser, 2006).
Governments vary, of course, in their ability to
take responsibility for education sector programme
development, to lead the dialogue with donors and
to restrict donor influence. Countries face different
types of problems, and governments have different
levels of policy-making, administrative and financial
capacity. How these differences affect the
relationships that frame the development and
implementation of SWAps is a complex matter.
The contrasting experiences of India and
Mozambique illustrate the point and provide
a pointer to some conditions for more effective
government leadership.
The Government of India’s current programme
to achieve UPE is Sarva Shiksha Abhiyan (SSA).
Sector-wide
approaches
can weaken
aid recipients’
negotiating
position and
strengthen
donors’ policy
leverage
2 2 2
1999–20001999–2000 2003–20042003–20042001–20022001–2002 2005–20062005–2006
OthersInvestment projectTechnical cooperationSector programme
31%
45%
19%
5%
34%
42%
22%
2%
42%
22%
32%
4%
54%
24%
18%
4%
Figure 4.15: Categories of aid to basic education, 1999–2006,
commitments
Source: OECD-DAC (2008c).

I N C R E A S I N G A I D A N D I M P R OV I N G G OV E R N A N C E
Launched in 2001, it received donor support two
years later and has become the world’s largest
SWAp in basic education. While donors have a large
stake in absolute financial terms, they represent
a relatively small part of the overall financing
envelope: 4% of the total cost. Evaluations of SSA
leave little doubt that it is country led, with the
government firmly in control of priority-setting
and implementation.
SSA developed out of a long process of national
policy development and donor dialogue, and its
origins can be traced to the success of the District
Primary Education Programme (DPEP), which
began in 1994 and was developed under strong
government leadership, including strict national
management of donor participation (Box 4.5).
Negotiating authority was delegated to the federal
department of education, which brought together
the relevant national organizations to forge
2 2 3
G o v e r n a n c e a n d a i d e f f e c t i v e n e s s
Figure 4.16: Donor involvement in education sector programmes in five countries
Mali
Zambia
Nicaragua
UnitedRepublic of Tanzania
Nepal 1999-2003: BPEP IIDonor harmonization started with pooledfinancing from five donors (Denmark, EC, Finland, Norway and the World Bank)to the Second Basic and Primary EducationProgramme. Use of IDA managementprocedures.
2004-2009: National EFA programmeSupported by a SWAp including pooled financingfrom seven donors and three non-pooled donors.Joint Financial Arrangement signed by the pooleddonors, specifying use of the government’smanagement procedures. Code of Conduct setsprinciples for all donor coordination and alignment.The government, all donors and NGOrepresentatives participate in annual joint reviewmissions of the national EFA programme.
2004-2008: PCTThe Common Work Plan (PCT) wasadopted by the Ministry of Education as a sector programme and accepted as a SWAp by all donors. Funded by a majorityof aid regardless of aid modality. Budgetsupport from the European Commissionand a pooled fund with support from threedonors introduced in 2005. Sector-widecommittee monitors implementation.
1997-2001: ESDPLaunch of the government’s BasicEducation Master Plan in 1997, with thesupporting Education Sector DevelopmentProgramme, including non-pooled support from eighteen donors. Intensivegovernment-donor consultations andsector analysis to move towardsprogramme aid. Donor group formedunder an appointed lead donor.
1999-2002: BESSIP ILaunch of the Basic EducationSub-Sector InvestmentProgramme, with pooled aid from four donors (Ireland, theNetherlands, Norway and theUnited Kingdom). By the end ofBESSIP, fourteen donors involvedin the SWAp.
2003-2007: MoESPThe government’s second education plan,covering the whole education sector. Nine donors and the government signed a MoU to specify the principles ofgovernment-donor interaction and pooledfinancing. The Joint Assistance Strategy for Zambia to coordinate all aid to thecountry was launched in 2007, indicatingthe government’s preference for generalbudget support. At the end of MoESP, four donors left the pool to move togeneral budget support.
2001-2006: PEDP IThe government’s Primary EducationDevelopment Programme launched in2001, accompanied by a subsector SWAp,including pooled funding from nine donors governed by a Memorandum ofUnderstanding (MoU). The PEDP steeredby a committee, with attached technicalworking groups.
2007-2011: ESDPSWAp covering the whole education sector.All previous donors contributing to thepooled fund moved to budget support. Launch of the Joint Assistance Strategy for the United Republic of Tanzania in 2006,stating government’s preference forgeneral budget support and concernsabout pooled funds as parallelmechanisms.
1997 1998 1999 2000 2001 2002 2003 2004 2005 2006 2007 2008 2009 2010 2011
2006-2009: PISE IISecond phase of PRODEC/PISEsupported by fourteen donorsthrough sector budget supportfrom six donors and eight donorsfinancing specific components ofthe sector plan through projects.Joint Financial Arrangementsigned by the six budget supportdonors.
2001-2005: PISE I Launch of Mali’s 10-year education sectorplan PRODEC in 2000, accompanied by theSWAp PISE I in 2001, with pooled fundingfrom three donors (the Netherlands,Sweden and the World Bank) and non-pooled funding from ten donors. APartnership Framework sets the principlesfor donor coordination with rotating leaddonor and joint review missions.
90
02
Education f
or A
ll G
lobal M
onitorin
g R
eport
C H A P T E R 4
agreement on the framework of the programme.
Intense negotiations between the central and state
governments reconciled divergent interests and
perceptions prior to discussions with donors.
Capacity-building was identified early on as a major
priority, with many national institutes mobilized to
provide support programmes.
The situation in Mozambique has been less
conducive to government leadership in the aid
relationship. Even so, its experience shows that
ownership can develop over time. Twenty-two
multilateral and bilateral donor agencies and
around a hundred NGOs are involved in the
education sector, making aid effectiveness a daily
preoccupation. Some 42% of the education budget
is provided externally. Since 1998 most of this
assistance has been given in the context of SWAps,
first focusing mainly on primary education (to 2005)
and then adopting more comprehensive coverage
(2006–2011).
Preparation of the current plan took more than
three years. It tested the ability of the government
and donors to come to agreement. On several
occasions, including the sensitive area of teachers’
pay and conditions, donors collectively challenged
government positions. However, an assessment
of the relationship suggests that donors have
primarily pressed for clarity and more dialogue
on priorities, rather than exerting direct pressure
on policies and strategies (Takala, 2008). With
regard to implementation, despite an agreement
in 1998 to follow the national planning cycle, donors
initially continued to bypass planning and budgeting
procedures, and to micro-manage the activities
they funded. However, in 2003, fifteen donors
collectively recognized the negative effects of their
behaviour and agreed to change it. This resulted
in an increase in the government’s ability to take
charge of the programme (Takala, 2008).
The Indian example shows it is possible for a
recipient government to lead the aid relationship.
Low levels of aid dependence, high levels of
government capacity and strong national
institutions for capacity development enabled India
to engage with donors on its own terms. In addition,
the federal government had a clearly defined
strategy for education and it instigated domestic
political processes through which differences
among states, and between the states and the
central government were resolved before
negotiations with donors began. Mozambique faced
a very different set of circumstances, having
emerged from a protracted civil war with very weak
capacity in key areas of administration, a collapsed
education system and high dependence on donors.
Inevitably, donors had considerable policy leverage
capacity. However, the picture changed over time,
with government capacity strengthening and donor
confidence in national systems increasing.
Aligning aid with national priorities and using government systems
The Paris Declaration envisages an aid relationship
in which donors support the strategies, institutions
and procedures of their partner governments. This
vision reflects a belief that when aid is aligned with
country priorities and systems it is likely to be more
effective than when aid is donor driven, fragmented
and administered through donor systems. As with
ownership, assessing alignment of aid in this broad
sense is difficult.
While many statements have been made in support
of aligning aid with government priorities and
practices, donor behaviours vary. They range from
very loose support to fully shared acceptance.
Progress towards alignment has proved far from
The Mozambique
experience shows
that ownership
can develop
over time
2 2 4
Box 4.5: India’s education aid:
standing firm in negotiations
India’s District Primary Education Programme is in manyrespects a prototype of what sector programmes aim toachieve. It was unique at the time of its inception, not only in its design, which emphasized participatory planning andoutcomes, but also because of the level of governmentleadership.
From the outset, the central government adopted a firmposition on limiting donor influence. Agreement on aid wasreached only after donors had given clear assurances thatthey accepted the programme’s goals and approach, and thatthe federal government alone had the right to develop andoversee its implementation in the states. To manage thedonors, DPEP pioneered common financial procedures, joint reporting and joint review mechanisms. Prolongednegotiations were required on the scope and composition of review missions and the participation of the federalgovernment as an equal partner. Late in 1994, agreementwas reached on modalities and on the limited areas ofimplementation donors could assess. Two years after DPEPwas scaled up and relaunched as the SSA in 2001, DFID, theEuropean Commission and the World Bank provided supportwithin all existing parameters.
Source: Ayyar (2008).

I N C R E A S I N G A I D A N D I M P R OV I N G G OV E R N A N C E
straightforward, with frustrations on both sides.
The issues involved raise complex questions. Using
national procedures to channel aid makes donors
much more dependent on national systems. Being
answerable to their citizens and legislative bodies
for ensuring that aid is used effectively, donors
are very concerned about corruption and the speed
of delivery. For their part, many aid recipients
complain about the administrative and reporting
requirements of programme aid.
Such challenges notwithstanding, efforts to align
aid to education sector programmes and national
management systems can have positive outcomes.
Greater sector coherence is one example. Closer
collaboration in areas such as joint planning and
monitoring can provide better oversight of donor
activities, averting fragmented service delivery.
Programme aid, including budget support and
pooled funds, can also help increase flexibility.
Traditionally, aid for the education sector funded
development expenditure such as classroom
construction. Yet much of the incremental cost
of expanding the education system and improving
its quality requires increased recurrent expenditure,
notably for teacher salaries. Programme aid has
the advantage of being able to cover both
development and recurrent costs. Millions of
additional primary school teachers are needed
to achieve UPE by 2015 and it will be difficult
for aid dependent governments to finance them
without relying on more, and more flexible,
external aid (Foster, 2008).
Some countries have indeed increased the
proportion of programme aid to the education
sector with positive results. In Uganda, for example,
an initial surge in primary school enrolments
after the withdrawal of tuition fees severely
compromised aid effectiveness. The government
responded by developing the Education Strategic
Investment Plan, which reflected a strong national
commitment to education, enshrined in the national
poverty reduction strategy. The plan, covering the
whole education sector, became a central tool for
more strategic decision-making. The government
integrated aid flows into sector-wide planning.
Donor support enabled Uganda to strengthen its
public finance management system, which in turn
encouraged donors to channel aid through it. From
a donor perspective, the key factor enabling the
effective use of aid to the education sector was
the government’s capacity for strategic decision-
making, which provided a basis for reduced
fragmentation and increased flexibility of aid.
The stability and predictability of funding was
enhanced by a medium-term budget framework
guaranteeing the availability of budget funds to
the sector (Ward et al., 2006).
While donors and aid recipients may share
a commitment to alignment in their policy
pronouncements, differences do arise. The complex
history of aid to Rwanda is a case in point. Today,
almost half the national recurrent budget and over
95% of the development budget for the education
sector come from external resources. The past
fifteen years have seen an extraordinary evolution
of the aid relationship, from a huge number of
emergency aid and relief projects in the mid-1990s
to a sector-wide approach. The transition has not
been without tension. Donors have attached
overwhelming priority to primary and lower
secondary education, whereas the government has
also wanted to expand tertiary education. Several
donors put pressure on Rwanda to lower its
allocation to tertiary education (from 37%) and give
higher priority to basic education. The result has
been a package of cost savings at tertiary level,
including higher charges for boarding facilities
(Hayman, 2007).
Project-based aid is often a response to a negative
risk assessment. However, it is possible to
strengthen alignment, at least in policy areas,
through project aid provided a strong sector plan
is in place. The experience of Cambodia is
instructive. The introduction of the Education
Strategic Plan in 2001 marked the beginning of
closer government-donor cooperation. The plan
has given the government more focus internally
and has gradually become the key reference for
almost all donor support to primary education.
With sixty separate basic education projects from
fourteen donors in 2007, national planning and
monitoring remain complex. Yet the Ministry of
Education’s leadership within the education reform
process has strengthened, and ministry officials
report that the increased importance given to the
plan by donors has helped improve the ministry’s
knowledge of, and influence on, donor actions
(Pirnay, 2007; Prasertsri, 2008).
In addition to governments developing strong sector
programmes, donor support for improving national
management systems and efforts to increase aid
predictability are two key conditions for successful
alignment.
Progress towards
alignment
has not been
straightforward,
with frustrations
on both sides
2 2 5
G o v e r n a n c e a n d a i d e f f e c t i v e n e s s

90
02
Education f
or A
ll G
lobal M
onitorin
g R
eport
C H A P T E R 4
Developing management systems. The new aid
agenda assumes that increased recourse to
national management systems will create incentives
for their improvement and that, rather than
circumventing national systems to facilitate rapid
delivery of aid, many donors will recognize that
effective aid ultimately depends on improved
institutionalized capacity for its delivery.
The overall record of progress on the use of
national systems is mixed, as Box 4.4 showed. Their
use is also arbitrary. The 2008 OECD-DAC survey of
aid practices reported that donor policies on the use
of national systems are often very slow to respond
to successful reforms. Even when countries register
improvement in their capacity for financial
management, many donors still prefer their own
systems. Others are sending more consistent
signals. In Burkina Faso, for example, Canada,
the Netherlands and the World Bank have worked
with the Ministry of Basic Education to improve
government management structures so as to
disburse funds through them. As a result, the
predictability of external funds has improved and
the number of donors accepting common funding
arrangements has increased. In 2007, 57% of the
country’s total aid to basic education was disbursed
through such arrangements (Vachon, 2007).
Not all donors agree on the benefits of channelling
aid through government management systems.
A group including Canada, the Netherlands and the
United Kingdom has been willing to use deficient
systems while supporting efforts to strengthen
them. Most of these donors share the view that
aligned aid delivery stands a better chance of
developing sustainable institutions and that
administering aid flows through continued reliance
on parallel project implementation units is
ineffective and unsustainable. Another group
of donors takes the more cautious position that
systems have to function better before they are
ready to channel aid through them. Australia,
Portugal and the United States are prominent
in this group.
Increasing aid predictability. Unpredictable aid flows
make national planning in education a hazardous
affair. Hiring teachers has financial implications
over several years. In dialogue with the OECD-DAC,
aid recipients have stressed the importance of aid
predictability in making their budget management
and planning more effective (OECD-DAC, 2007b).
Programme aid is not an automatic route to
greater medium-term predictability. A recent
survey of donor support to fourteen countries for
2006 showed that 94% of committed sector budget
support was delivered within the year (Strategic
Partnership with Africa, 2008). However, while
commitments for 2007 had been made for 90%
of the budget support programmes, the share
fell to 68% for 2008 and to 47% for 2009. While
short-term predictability of sector budget support
is high, medium- to long-term predictability still
tends to be low.
Progress on aid predictability has been limited.
Some of the reasons can be traced to developing
country governance practices. It is clearly
legitimate for donors to withhold support when
faced with systematic underperformance. But many
donors have been slow to address weaknesses in
their own institutional practices. Bilateral donors
often use an annual funding cycle linked to their
budgeting processes. National legislation may
prevent them from signing binding medium- or
long-term financing agreements, thus precluding
predictable multiyear provision. Recent initiatives
have started to address this problem. The European
Commission’s MDG contracts, the United
Kingdom’s ten year memoranda of understanding
and the United States Millennium Challenge
Corporation all provide for multiyear commitments.
The MDG contracts become operational in 2008,
with the aim of committing general budget support
for six years. Monitoring will mainly focus on
outcomes in the education and health sectors.
The initial contracts will be made with countries
that have shown good performance in managing
budget support and strong commitment to
achieving the MDGs.
Cross-country evidence on efforts to strengthen
national leadership and improve alignment points
to the importance of several enabling conditions:
Recipient governments’ political will to lead
the education agenda is fundamental – and
the development of well-structured education
sector plans can facilitate their task.
National commitment to improve public
management, especially financial management,
is a prerequisite for increasing donor confidence
in national systems and procedures, though
donors can do much to create incentives and
provide support.
Progress on aid
predictability
has been limited,
and many donors
have been slow
to improve their
own institutional
practices
2 2 6

I N C R E A S I N G A I D A N D I M P R OV I N G G OV E R N A N C E
For aid alignment to be effective, donors
must be willing and able to adapt to country
circumstances and to set aside many of their
own agendas.
Mutual trust is another key ingredient. For
SWAps and programme aid to be sustained over
time, governments must be confident of donors’
commitment and donors must have a degree
of trust in government policy direction and
management capacities.
Tailoring the new aid agenda to national realities
is critical. Countries vary widely in institutional
capacity to meet donor standards. Fragile states
in particular face deeply entrenched problems
(Box 4.6).
Improving coordination among donors
For countries with a narrow base of skilled
administrators, inefficient time allocation has high
costs. One source of inefficiency is the management
of donors. When multiple donors arrive separately
to assess performance in the same programmes,
or local donor representatives require separate
meetings with government, the transaction costs
of aid and the opportunity costs associated with
the diversion of human resources are high. Better
management and coordination of donors can
reduce these costs.
Having to service multiple missions when a single
joint mission might suffice is one source of
inefficiency. The Paris agenda sets targets for
increasing the number of joint missions. While
donors vary in their preference for joint missions,
collectively they are far short of the target level.
In 2007 only 20% of missions were conducted on
a joint basis, while the target is 40% (OECD-DAC,
2008a). Education is widely cited as the sector in
which donors have made the most progress on this
count. For instance, a recent survey by the FTI
Secretariat (2008) showed that in Honduras, 73% of
education donor missions in 2007 were conducted
jointly, and in Ethiopia 55%. However, just 20%
of donor analytic work on Nicaragua’s education
sector was undertaken in joint exercises. Some aid
recipients are beginning to cut transaction costs
and manage the flow of demands from donors.
Several have introduced ‘mission-free’ periods.
Ghana, for instance, does not accommodate
missions during the one-month period when
it finalizes the national budget.
The emergence of new donor coordination
practices across the education sector could play
an important role in lowering transaction costs.
In many countries donor groups are being formed
with appointed lead donors. Among the countries
which had received funds from the FTI Catalytic
Fund by the end of 2007, all but the Republic of
Moldova had such arrangements (FTI Secretariat,
2007a). These donor groups have considerable
responsibility, for instance in managing appraisals
of education sector plans. Some are more effective
than others, however, and capacities vary among
countries. Donors move at different speeds, and
some groups are restricted to general information
sharing rather than joint aid management.
Ghana does not
accommodate
donor missions
when it finalizes
the national
budget
2 2 7
G o v e r n a n c e a n d a i d e f f e c t i v e n e s s
Box 4.6: Fragile states and the new aid agenda
Fragile states present particularly challenging environments for aid.In some states, such as Sudan and Afghanistan, violent conflictcontinues to hold back development. In others, post-conflictreconstruction confronts governments with enormous politicalchallenges. Two common features link all fragile states: limitedinstitutional capacity and vast unmet needs. In education, such statesare dealing not just with a backlog of deprivation but also with schoolsystems that fail to reach many citizens. In Somalia, for instance, two generations have reached adulthood with practically no access to education (Netherlands Ministry of Foreign Affairs, 2006).
Few fragile states are in a position to meet the demands of the newaid agenda, with its emphasis on country ownership, donor alignmentwith education sector plans and the use of national systems. Mostlack the capacity to plan, implement and report through nationalsystems. Emergency assistance and project aid thus continue to playan important role, and the road from emergency aid to developmentaid is not straightforward. The FTI has encountered difficulty, for example, in supporting fragile states. Its endorsement processrequires credible education sector plans, which many fragile statesare unprepared to develop.
Where government capacity is weak, early engagement by donors is crucial to a managed transition to long-term development aid.Afghanistan is an example. In 2002, the Afghanistan ReconstructionTrust Fund (ARTF) was established as a coordinated aid mechanism,pooling contributions from twenty-five donors. By mid-2007 theARTF had mobilized US$1.45 billion to finance the government’srecurrent budget and priority reconstruction projects (Berry, 2007).In the education sector, the ARTF pays the salaries of around100,000 teachers and provides financial support to communityinitiatives to build and renovate schools. The priority given toexternal financing of recurrent salary expenditure is seen as crucialto strengthening the country’s long-term effort to reconstruct itspublic service delivery system. Although the Ministry of Education’scapacity is weak, it has shown some willingness and ability to engage with and coordinate donors to rebuild the education system. Bridging emergency and development aid requires such qualities.
90
02
Education f
or A
ll G
lobal M
onitorin
g R
eport
C H A P T E R 4
Duplication frequently persists, notably in textbook
provision and classroom construction. The
Netherlands, the United Kingdom and some
Scandinavian countries have taken the lead in
harmonizing their donor procedures; others,
including Japan and the United States, prefer
to continue working through parallel structures.
In some cases, the incentive systems for donor
staff are holding back progress. Pressure for
tangible and visible results, rigid administrations
and lack of support for staff members’
coordination of work across agencies have limited
their interest (De Renzio et al., 2005).
A large number of donors each providing small
amounts of aid is a prescription for higher than
necessary transaction costs. The Paris Declaration
stresses the need to reduce this kind of
fragmentation, for good reason: in 2006, fourteen
countries each had to deal with at least twelve
donors for basic education.4 To look at it the other
way round: on average, each OECD-DAC donor
had aid programmes in basic education with thirty-
three countries (counting only programmes of
at least US$100,000). France topped the list with
programmes in seventy-two countries.
As the aid system has become increasingly
complex, with ever more donors and financing
mechanisms, donors are beginning to recognize
the need to rationalize their delivery of aid.
However, progress has been limited. Between 2002
and 2006, fourteen out of twenty-one major donors
increased the number of countries to which they
provided aid for basic education. The largest
increases were for the European Commission,
Greece, Japan and the United States. While most
of these fourteen donors also increased their total
aid to basic education during the period, several –
including Austria, Greece, Ireland, Japan and Spain
– increased recipient countries more rapidly than
aid levels, thereby reducing the average amount
of aid per country. In sharp contrast, five donors
reduced the number of recipient countries while
increasing aid, thereby raising the amount of aid
per country. In particular, the two largest bilateral
donors to basic education, the Netherlands and
the United Kingdom, more than doubled total
disbursements to basic education while each
reduced the number of recipient countries by five.
In 2007 the European Union adopted a code
of conduct to address skewed aid distribution.
The code encourages a division of labour among
donors. Where appropriate, one donor may provide
resources to another to administer alongside its
own aid programme. The code also encourages
more equitable distribution of donors among
countries. The European Commission, after
surveying donors on the challenges of applying
the code in the education sector, indicated that
Denmark, Finland, Ireland, the Netherlands,
Norway and Spain, along with the Commission
itself, would withdraw from active participation in
some countries. The decisions resulted partly from
exercises analysing the division of labour within
countries and partly from limited capacity in the
field. Finland, Ireland and Norway reported that
they had withdrawn direct support to education
but secured continued aid for the sector through
general budget support. Denmark and the
Netherlands similarly chose to redirect some
of their education aid through the FTI Catalytic
Fund (European Commission, 2007b).
Donors are not alone in addressing fragmentation.
Some governments in ‘donor-dense’ developing
countries are attempting to rationalize the
assistance they receive. For example, the
Government of Afghanistan has introduced a rule
to reduce the number of donors in each sector,
including education. A donor wishing to provide
funding to more than three sectors must
contribute at least US$30 million per sector (Rocha
Menocal and Mulley, 2006). In the United Republic
of Tanzania, one aim of the Joint Assistance
Strategy is to develop a more effective division of
labour among donors. Among its eighteen donors
in education, Finland, Ireland, the Netherlands and
Norway recently decided to withdraw following
consultations with government and other donors
on overall financing. Similarly, after the Joint
Assistance Strategy in Zambia reviewed the
involvement of donors in education, two left the
sector and four moved to general budget support.
In India the government is strongly selective,
accepting aid for the SSA programme from only
three donors.
Most efforts towards more effective division of
labour among donors are very recent and it is too
early to evaluate their impact on the quality and
quantity of aid to education. Again, though, recent
work by the OECD-DAC points to the importance
of government leadership in low income countries
(OECD-DAC, 2008d).
The aid system
has become
increasingly
complex, with
ever more donors
and financing
mechanisms
4. This understates theproblem as it includesonly OECD-DAC donors.
2 2 8

I N C R E A S I N G A I D A N D I M P R OV I N G G OV E R N A N C E
Looking ahead
Sector-wide approaches have driven the new
model of aid emphasizing country ownership and
leadership, alignment and harmonization. The
Paris agenda in turn has further reinforced SWAps
as the default model of aid to education in many
low income countries. That model can point to
significant achievements, including large
enrolment increases in several countries having
sector-wide programmes, such as Burkina Faso,
Ethiopia, India, Nepal, Uganda, the United Republic
of Tanzania and Zambia.
Yet SWAps are far from straightforward and
major challenges remain. Recipient government
leadership stands out as the most critical
determinant of success. Strong education plans
cannot be carried through with weak political
leadership. Nor can they be managed by
governments lacking capacity. Where education
ministries remain unconvinced of their advantages
or unable to develop capacity to take the lead,
SWAps have not facilitated education reform.
The new modalities face common tensions in
country level aid management. The tensions are
not new but have become more explicit through
increased harmonization and alignment.
Among them:
Long-term capacity-building versus short-term
impact: SWAps typically emphasize long-term
institutional capacity development, mainly
through more extensive use of national
management systems. The argument is
sometimes made that investment in these areas
of capacity-building, mainly channelled as
programme aid, comes at the expense of short-
term effects, for instance in terms of numbers
of schools built and textbooks distributed.
Others see short-term achievements through
project aid as undermining efforts to build and
sustain national capacity. While the trade-off
between short-term delivery and long-term
capacity may be overstated, it is important to
consider whether countries are best served by
adopting one model rather than a mix of models.
Sector coherence versus donor influence on
national policies: SWAps have potentially opened
recipients’ doors to increased donor influence.
Sector analysis and government-donor
discussions on sector policies and strategies
have undeniably contributed to more coherent
thinking and implementation of education
activities. Yet at the same time programme
support has provided opportunities for donors
to strengthen their collective influence over
strategic decisions. Differences between donors
may counteract this effect to some degree by
giving rise to ‘lowest common denominator’
positions. But a government in a very poor, highly
aid dependent country is unlikely to risk a breach
with a group of major donors. Does collective
action by donors weaken the potential for real
national ownership? To prevent such trade-offs,
donors must exercise a high level of self-
restraint when policy differences arise.
Process-oriented consensus building versus the
drive for results: At country level, much energy
goes into coordination and consultation. These
are clearly important, as making SWAps effective
requires substantial ‘process’ work. However,
without a firm managerial hand and a focus
on results, SWAp processes can become ends
in themselves, absorbing large amounts of
technical assistance and diverting government
resources. The focus on results, though, carries
its own risks because of a growing tendency
to assess performance on the basis of common
sets of key indicators – an approach that can
reduce complex processes to static and
reductionist yardsticks.
More aid for better governance
The restructuring of aid relationships is leading
to less direct involvement of donors in designing
programmes and monitoring implementation.
Recourse to aid conditionality as a lever for reform
is also more limited. However, ‘aid dialogue’
remains a source of donor influence. Increasingly
central to that dialogue are issues of good
governance. Donors advocate their own approaches
to governance reform, in terms of what areas are
important and what policies are effective, and
may use aid programmes to leverage change.
The question is whether donors’ approaches to
governance are consistent with the needs of poor
countries and the spirit of the Paris agenda.
Governance is climbing the aid agenda
Financial flows provide one indicator of the growing
profile of governance issues in aid programmes.
The share of all sector-allocable ODA supporting
projects and programmes in the ‘governance and
civil society’ category was 9% in 2006 – the highest
Recipient
government
leadership stands
out as the
most critical
determinant
of success
2 2 9
G o v e r n a n c e a n d a i d e f f e c t i v e n e s s

90
02
Education f
or A
ll G
lobal M
onitorin
g R
eport
C H A P T E R 4
share of any single sector (Figure 4.5). This does
not include programmes in other sectors, such
as education and health, that have governance
components.
Donors have invested heavily in developing their
approaches to governance reform. In 2006 and 2007
several major donors (including the European
Commission, France, the Netherlands, the United
Nations Development Programme, the United
Kingdom, the United States and the World Bank)
adopted new strategies on governance. A 2006
United Kingdom white paper on aid policy captures
the emerging mood by committing the government
to ‘[p]ut support for good governance at the centre
of what we do, focusing on state capability,
responsiveness and accountability’ (DFID, 2006).
The European Commission and the World Bank
have been particularly active in promoting good
governance through their aid programmes. The
broad governance agenda covers a multitude of
areas ranging from public financial management,
decentralization, transparency and accountability
(linked to corruption) to participation and reform
of public sector employment, to mention a few.
Donors have also developed quantitative and
qualitative tools to measure the status of a
country’s governance arrangements (Advisory
Board for Irish Aid, 2008). DFID produces Country
Governance Analyses, the European Commission
prepares Governance Profiles for its main partner
countries, the Netherlands carries out Strategic
Governance and Anti-Corruption Assessments, and
the World Bank is piloting a Governance and Anti-
Corruption Assessment instrument. Increasingly,
these measures are being used to inform decisions
on aid allocation and assessment. They also play
an important role by highlighting donor concerns
and priorities that governments must bear in mind
when developing programmes they hope donors
will support.
Education figures prominently in governance
reforms. Any broad public sector reform, whether
in employment conditions, budget management or
financial management, affects education because
the sector accounts for a large share of public
expenditure and a commensurately large share
of the public sector wage bill. Donors have also
supported governance reforms in the education
sector directly through specific projects and SWAps.
The most recent World Bank Education Sector
Strategy Update sends a clear institutional signal
on key elements of good governance to be included
in projects and programmes. In a section on
maximizing the effectiveness of education aid,
it calls for more support to decentralized local
authorities, increased devolution of power to
schools and more public-private partnerships,
as part of a strategy for integrating education into
a broader policy framework (World Bank, 2005b).
The emphasis on governance reform is stronger
in the update than in its 1999 predecessor. Most
bilateral donors have also followed this trend.
How has increased interest in governance among
donors influenced policies and practices in the
education sector in recipient countries? This is not
a simple question to answer. In a traditional project
almost wholly funded by a donor, it is reasonable
to assume that the donor strongly influences
the design and that implementation is closely
monitored. With programme support, influence is
more difficult to untangle because it is embedded
in complex processes of dialogue and bargaining.
However, by examining the components of recently
prepared projects and programmes supported
by donors, it is possible to discern the contours
of a distinctive governance agenda.
The EFA Global Monitoring Report team reviewed
eighteen projects or programmes in basic
education supported by the World Bank since 2006.
The focus was on activities relating to governance
and on loan conditions. Thirteen of the operations
are relatively conventional arrangements in which
financial support is provided for specific activities.
However, reflecting the change in aid modalities,
these are generally components of the
government’s sector plan. Four of the operations
provide budget support for sector programmes.
The remaining one is an example of the treatment
of education sector reform in a recent programme
of general budget support. Table 4.2 describes the
components of each operation. The World Bank
was chosen partly because it is one of the largest
sources of development assistance for education,
especially in the poorest countries, partly because
it makes more information available than most
donors, and partly because the terms and
conditions of its operations reflect and inform the
views of the wider donor community. Other donors
are involved in several of the sector programmes
being supported.
What broad conclusions about approaches to
governance can be drawn from these eighteen
operations? In the thirteen that can be categorized
The European
Commission and
the World Bank
are promoting
a broad
good-governance
agenda through
their aid
programmes
2 3 0

I N C R E A S I N G A I D A N D I M P R OV I N G G OV E R N A N C E
as conventional projects, seven cover governance
as a peripheral issue, their main focus being
on direct financial support for school buildings,
learning materials and teacher training. These
seven projects are in Afghanistan, Burundi,
the Democratic Republic of the Congo, the Gambia,
Haiti, Mali and Nigeria; all but Mali are categorized
as fragile states. Improvements in governance
are sought largely through capacity development
in the Ministry of Education and through
Improvements
in governance
are sought
through capacity
development
in the Ministry
of Education
2 3 1
G o v e r n a n c e a n d a i d e f f e c t i v e n e s s
Table 4.2: Governance components of recent education projects and programmes supported by the World Bank
Source: Group of 8 (2005, Annex 2).
Components: expansion of primary enrolment by financing school buildings; support for teaching andlearning through in-service training programmes, provision of textbooks for all primary and lower secondarystudents, and measurement of reading adequacy; and capacity-building in policy and planning in the ministry.
Components: increasing access and equity in primary schooling through the rehabilitation of schoolinfrastructure and support for eliminating school fees; improving quality through the provision of textbooks;and building capacity to assess learning achievement and strengthening institutional capacity in theeducation system by preparing policies for teacher training, and strengthening education sector policymaking and planning, and the project management unit.
Components: school development grants to improve the quality of teaching and learning; development ofmodel ‘whole’ schools through infrastructure and furniture grants plus basic teaching inputs to a smallselection of schools; institutional development of state and local government authorities particularly via theEMIS and the Inspectorate plus project management and monitoring, and evaluation support to all states.
Components: improving the quality of basic education through establishing reading areas in classrooms andproviding libraries in teacher-training colleges, funding schemes to purchase school supplies, and providingin-service and accelerated training programmes for teachers; increasing access to education throughfinancing new classrooms in basic education and one new secondary school; strengthening institutionalmanagement capacity in the education sector in human resources, EMIS, budgetary and financialmanagement, and programme coordination.
Components: improving access and equity in primary education; operationalizing partnerships betweenpublic and non-public sectors; and building capacity to assess learning outcomes.
Components: construction/rehabilitation of urban and multigrade classrooms; support for in-service teachertraining and mentoring; developing monitoring tools for tracking instructional time, observations ofclassroom instruction, attendance of school personnel and students, and parental involvement; technicalassistance for functional analysis of the education ministry and for the development of management andteacher in-service training modules, monitoring and evaluation, and support to the project coordination unit.
Components: quality enhancement and social awareness; teacher training and increases in female teachers;school grants for infrastructure; and project management, monitoring and evaluation.
Components: providing modern, low-cost learning materials in selected schools to improve learning;strengthening community participation in school decision-making; building capacity in the education sectorfor budget planning and formulation, and management and accounting; enhancing the capacity of line unitsin the ministry to implement the project and, in doing so, to strengthen capacity overall.
Components: develop and strengthen school-based management; improve teacher effectiveness throughrefining teacher competency standards and using them for appraisal, training needs and promotion, andthrough a more equitable distribution of teachers across schools; increase equity and quality by applying astandards-based approach to address growing disparities in inputs and outcomes; improve budget planningand management in the education department.
Components: establish community schools in rural areas; support private schools; and provide capacity-building activities for education NGO staff, members of parent education committees and teachers includingthrough training, school monitoring and supervision.
Components: reform teacher pre-service training; strengthen structures for teacher improvement at thelocal level; reform teacher accountability and incentive systems for performance appraisal and careeradvancement; and monitoring and evaluation, including the development of a teacher data base.
Components: scale up interventions in pre-school and primary schools in poor areas; increase communityparticipation within a new integrated school management system; governance and institutional strengtheningof the ministry; and project administration.
Components: improve the capacity of a set of departmental and municipality secretariats to deliver ruraleducation; strengthening rural education at the school level in these municipalities; and strengthening theMinistry of Education in the area of rural education.
Burundi 2007: EducationReconstruction Project
Democratic Republic ofthe Congo 2007: EducationSector Project
Nigeria 2007: StateEducation Sector Project
Mali 2006: SecondEducation SectorInvestment ProgrammeProject
Haiti 2007: First Phase of the Education for AllProject
Gambia 2006: ThirdEducation Phase TwoSector Programme
Afghanistan 2008: SecondEducation QualityImprovement Programme
Uzbekistan 2006:Basic Education Project
Philippines 2006: NationalProgram Support forBasic Education Project
Pakistan 2006:Balochistan EducationSupport Project
Indonesia 2007:Better Education throughReformed Managementand Universal TeacherUpgrading
Honduras 2008: EducationQuality, Governance andInstitutional Strengthening
Colombia 2008: RuralEducation Project
Conventional basic education projects

90
02
Education f
or A
ll G
lobal M
onitorin
g R
eport
C H A P T E R 4
2 3 2
Table 4.2 (continued)
Source: Group of 8 (2005, Annex 2).
Support for the government’s programme to provide basic education and improve the quality of education forall children through twenty-three investment programmes in four areas; equity of access to basic education;improving quality and learning achievement; providing opportunities for post-primary education and training;and strengthening education sector management. ‘All of the investment programmes emphasise informationdissemination, transparency, accountability and addressing corruption, within the context of the sector’sstrategy for good governance.’
This loan directly focuses on governance and a general sector reform progammme which ‘attempts toaddress systemic governance issues in order to raise the quality and cost effectiveness of service delivery’.The reform agenda focuses on accountability and systemic improvement through enforcing the criteria forestablishing new schools, linking school grants to measures of school performance and strengtheningschool management committees; building administrative capacity through further development of oversightmeasures and devolving more responsibility to lower levels of government; improving monitoring andevaluation through expenditure tracking surveys and impact evaluations plus greater dissemination ofinformation on examination outcomes, school performance and programme effectiveness; increasingteacher quality through the establishment of an autonomous teacher registration and accreditation authority;and improving the efficiency of textbook production and curriculum development through production beingopened up to competition and transparent textbook evaluation and approval mechanisms.Triggers for the loan are in areas related to accountability and systemic improvements in school financing,teacher effectiveness and textbook production.
The reform programme being supported has three pillars – improve fiscal sustainability and the fiduciaryenvironment through ensuring increases in education expenditure and increasing transparency of financialmanagement and procurement practices; improve equitable access to primary education throughparticipation of the private sector and its quality through better teaching practices and textbooks, and acredible examination system; and improve public education sector governance and management throughstrengthening district departments and expanding school-based management and the monitoring of schoolsby communities.Triggers include performance formulae for school grants, a draft law for establishing a procurementregulatory authority, approval of policy and implementation modalities to scale up government financialsupport to private schools, textbooks printed and published through open competitive bidding, and aperformance monitoring index, including for teacher absenteeism, approved with quarterly ranking ofdistricts against the indicators.
The reform programme being supported has four components: improving fiscal sustainability and theeffectiveness of public expenditures in education, partly through improving financial management andprocurement reforms to increase credibility, transparency and accountability of public resources; improvingeducation sector management through reforms to strengthen the functioning, capacity and accountability of provincial and district management in line with devolution objectives and to strengthen the role of schoolmanagement committees; improving access to quality education with a focus on rural areas and girlsthrough infrastructure and reducing implementation bottlenecks of incentive programmes (free textbooksand stipends) and by launching partnerships with the non-government/private sector; and improving thequality of teaching and learning through merit-based recruitment of teachers and improved accountabilityand through a competency-based system of teacher education and continuous professional development.
Kenya 2006: EducationSector Support Project
Bangladesh 2007: ThirdEducation SectorDevelopment SupportProject
Pakistan 2007: FourthPunjab EducationDevelopment Policy CreditProject
Pakistan 2007: First SindhEducation SectorDevelopment Policy CreditProject
This loan is part of a wider framework of support to India’s poorest and second largest state by the WorldBank, DFID, the Asian Development Bank and Japan. The overall objective is to ‘support the implementationof critical fiscal, governance, administrative and service delivery reforms’. Bihar’s Eleventh Plan (2007)emphasizes three pillars – increasing public investment and strengthening public financial management andgovernance; raising economic growth through agriculture, investment climate reforms and infrastructure;and improving public service delivery in the social services. The last of these focuses strongly on teachers.Huge numbers of teachers are required to move towards universal primary and elementary schooling. The plan emphasizes the need to refine recruitment criteria for teachers, selection processes, contractingterms and the overall management. The current situation is summed up as ‘Lack of comprehensive data onteachers leads to problems such as corruption and political manoeuvring in teacher recruitment, irrationaldeployment and transfer of teachers, high teacher absenteeism and ineffective overall management’. Prioractions for the release of the first tranche of the loan include devolution to panchayats (local governments) of the responsibility for all new teacher hiring, with a first round of approximately 100,000 teachers hired.Conditions for the release of the second tranche include hiring the second round of 100,000 teachers,incorporating lessons learned in terms of standardization of recruitment criteria, increased transparency of candidate review process with proper registries and third party monitoring of selection processes andsample-based evaluation of the recruitment process by an independent agency. Indicative triggers for apotential follow-up loan include the development and piloting of a teacher competence assessment tooland an assessment of the 100,000 new teacher hirings in basic education levels and pedagogical skills plusthe development and implementation of a monitoring system to record and improve teacher attendance in both primary and secondary schools.
India 2007: First BiharDevelopment PolicyLoan/Credit
Note: Governance components are displayed in italics.
Education sector/subsector-wide plan
General budget support and the education sector

I N C R E A S I N G A I D A N D I M P R OV I N G G OV E R N A N C E
the strengthening of monitoring and evaluation
units. A deeper governance agenda is nonetheless
discernible in the components for school autonomy
in Afghanistan and public-private partnerships
in Haiti.
In the remaining conventional projects, governance
issues are predominant. This is reflected in support
for community participation in the running of
schools (Honduras, the province of Balochistan
in Pakistan and Uzbekistan), school-based
management (the Philippines), development
of formulas for school funding (the Philippines),
teacher recruitment, deployment and monitoring
(Indonesia, the Philippines), support for private
schooling (Balochistan) and significant efforts
to improve overall administration and governance
across the sector (all countries, but particularly
Colombia).
The education sector programmes being supported
are associated with the promotion of a yet more
ambitious governance agenda. Programmes in
Bangladesh, Kenya and the provinces of Punjab
and Sindh in Pakistan set wide-ranging goals.
They include accountability, transparency,
decentralization, school autonomy, information
sharing, reforms of teacher recruitment and
placement, teacher performance monitoring, and
private sector involvement in schools and textbook
production. In addition, there is a common focus
on improving broad aspects of public financial
management. Triggers for the loans include
government actions intended to improve criteria
for school financing, teacher effectiveness and
textbook production, and to provide support
to private schools. In the case of general budget
support to the state of Bihar in India, required
actions concern the rules for hiring teachers
and monitoring teacher performance.
This examination reveals some patterns. Traditional
education projects focusing on activities directly
aimed at expanding access (such as through
provision of school buildings) and improving the
quality of schooling (such as through provision of
learning materials and support for pre-service and
in-service teacher training) are typical in countries
with weak governments or bureaucracies. In other
countries where aid is still tied to specific activities,
the focus has shifted towards improving education
service delivery, accountability and transparency.
When it comes to SWAps, the governance agenda
dominates even more strongly. The initial
government-donor negotiations on the grant or
loan, and the triggers required for the release of
financing tranches, provide mechanisms for
leveraging reform. Sector plans give a great deal
of emphasis to teachers, including recruitment,
terms of service, lines of accountability, transfers
and absenteeism. Measures to support greater
community participation in schools through village
or school education committees, and the auditing
of school funds, are also common. So, too, is the
encouragement of private sector participation,
both through private schools – often supported
by public funds – and expansion of the private
sector in producing, printing and distributing
learning materials.
What conclusions can be drawn from this exercise?
Clearly, caution has to be exercised in deriving
general lessons from these particular projects and
programmes. Yet even with this caveat, there is
compelling evidence that governance now figures
prominently in aid dialogues on education, as well
as strong grounds for predicting it will figure even
more prominently in the future. At one level, this
is entirely justified. The need for good governance in
the education sector cannot be contested. Indeed, it
is a condition for achieving the goals and targets set
in the Dakar Framework for Action. Furthermore,
as aid is increasingly directed towards broad sector
programmes rather than specific activities, and
more of it is managed through government
systems, it is not surprising if donors pay greater
attention to the broad governance framework.
At the same time, donors have no monopoly
on insights into what constitutes good governance
for education. There is a risk that policies reflecting
particular currents of education policy debates
in rich countries – such as shifting powers from
local authorities to schools, expansion of voucher
programmes, performance-related pay for
teachers, and an increased role for private sector
provision – will become routinely promoted. As
Chapter 3 shows, the evidence for their relevance
in poor countries is not always strong.
Donors have
no monopoly
on insights into
what constitutes
good governance
for education
2 3 3
G o v e r n a n c e a n d a i d e f f e c t i v e n e s s

90
02
Education f
or A
ll G
lobal M
onitorin
g R
eport
2 3 4
The long road to education:walking through the desertto get to school, in Yemen
© A
bbie
Tra
yler
-Sm
ith/P
ANO
S

2 3 5
9002Education for All Global Monitoring Report
Chapter 5
Policy conclusions and recommendations
Inequality is one of the major barriers to the goals set
out in the Dakar Framework for Action. Governments
across the world need to act with far greater resolve
to reduce the disparities that restrict opportunity
in education. One of the central lessons to emerge
from this Report is that there is no quick fix for
enhanced equity, or for accelerated progress towards
education for all. However, it is possible to identify
some of the broad principles and approaches needed
to guide policy. This chapter sets out key priorities
for national governments, donors and civil society.

What governments can do ....................... 236
The role of aid donors ................................................ 240
The role of non-government actors .............................................................................................................................................. 241
90
02
Education f
or A
ll G
lobal M
onitorin
g R
eport
C H A P T E R 5
What governments can do
Every country faces a different set of constraints
and challenges in education. That is why effective
national planning is the starting point for
governance reform and for the development
of national strategies to accelerate progress
towards EFA.
With the 2015 target date for key EFA goals
drawing closer, the early warning indicators for
failure are clearly visible. Particularly disconcerting
is the fact that, on current trends, the goal
of universal primary education (UPE) will not be
achieved. Governments need to act with far greater
urgency in tackling the inequalities holding back
progress in this area. Simultaneously, education
quality and learning achievement must be brought
to the centre of national education planning at
the primary level and beyond. In taking forward
the EFA agenda, eight broad thematic lessons
can be drawn from the experience of strong
national performances.
1 Get serious about equity
Education planners need to ensure that the
benefits of expanded provision are shared by
disadvantaged groups and underserved regions.
Practical strategies for strengthening equity
include the removal of user fees, the introduction
of financial incentives for the education of girls
and children from disadvantaged backgrounds,
targeted support to keep children in school and
the deployment of well-trained teachers proficient
in local languages. More equitable public spending
patterns are also critical to ensure that schools,
teachers and resources are skewed towards
those with the greatest need rather than those
with the greatest wealth.
Setting clear equity targets is one of the most
important things governments can do in rethinking
planning approaches. Current EFA targets, such
as those in the Millennium Development Goals
(MDGs), are set in terms of national average goals.
The problem, as Chapter 2 shows, is that national
averages can mask deep underlying disparities.
Average progress that leaves whole sections of
society behind is not consistent with the spirit
of the Dakar Framework for Action: the EFA goals
are for everyone. Going beyond national average
targeting to identify well-defined equity goals
2 3 6
P O L I C Y C O N C L U S I O N S A N D R E C O M M E N D AT I O N S
would make a difference at a number of levels.
Even taking the political decision to adopt equity
goals in education and monitor progress towards
them would send an important signal. It would
place inequality of opportunity where it deserves
to be: at the centre of the political agenda. Concrete
targets for reducing disparities could also provide a
benchmark for holding political leaders to account.
Equity goals in education need to be well-defined.
As in other areas discussed in this Report, there
are no blueprints. The starting point is an
assessment of current disparities. For purposes
of illustration, the overall commitment to UPE by
2015 could be supported by interim 2010–2012
targets for, say, halving the school attendance gap
between the richest and poorest 20%, or between
rural and urban areas, or majority and minority
ethnic populations. Specific targets could be set
for particularly marginalized groups or regions
with high concentrations of deprivation.
Progress towards the equity targets could
be monitored through household surveys and
education reporting systems.
Equity targets could also play a role in informing
approaches to national planning. Meaningful
targets would have to be backed by financing and
wider policy commitments. Particular attention
would have to be paid to estimating the cost of
reaching disadvantaged groups and areas, not least
since the marginal costs are likely to be far higher
than average costs. Similarly, extending opportunity
to children from households marked by poverty, ill-
health and acute vulnerability might require higher
levels of per capita spending than for children from
more advantaged households. This is an area that
continues to receive insufficient consideration in
education planning. An important priority for EFA
is for governments and donors to develop estimates
of the costs of reaching the marginalized and
reducing disparities – and to make provisions
for these costs in national budgets. Moreover,
strategies for achieving equity targets in education
would have to consider not just school-based
policies, but also wider strategies on nutrition,
health and poverty. The targets themselves could
provide an opportunity to develop the type of
integrated approach to education planning and
poverty reduction set out in Chapter 3.
The commitment to equity has to start before
primary school – and continue afterwards.
Good-quality early childhood care and education
(ECCE) strengthens cognitive development and
helps prepare children for school. The benefits
are reflected in improved attainment and
achievement levels in school. Progress towards
ECCE has been disappointing and highly unequal,
both among and within countries. National
governments should prioritize ECCE in planning,
with incentives provided to improve coverage
of disadvantaged children. Similarly, it is
increasingly apparent that progress in many
EFA areas – and towards many of the MDGs –
depends on a rapid scaling up of opportunities
for good-quality secondary education.
2 Provide leadership, set ambitious targets and forgeeffective partnerships
International evidence provides insights into
the specific policies that can accelerate progress
towards EFA. But the crucial ingredient for
success is leadership. There is no substitute for
sustained political commitment. Political leaders
need to put education at the centre of national
development strategies and use their influence
to make equity a shared goal throughout society.
They also need to reach beyond government
agencies to involve civil society, the voluntary
and private sectors, and groups representing the
poor in policy processes. Ensuring that the voices
of the poor and marginalized are heard in policy
formulation is a condition for strengthened equity.
Setting clear policy objectives is crucial. Successful
governments have fixed ambitious long-term
goals that are supported by clear medium-term
‘stepping stone’ targets and backed by
commitments on inputs ranging from classroom
construction to teacher recruitment and textbook
supply. Governments with less successful track
records have often set ambitious goals but failed to
underpin them either with coherent strategies for
delivery or with predictable budget commitments.
Another crucial condition for progress in education
is ensuring that the policies of departments whose
work affects education are complementary rather
than contradictory. Many countries have improved
policy coherence within the education sector and
between education and other line ministries.
Sector-wide approaches have played an important
role in this regard. Even so, problems remain.
Education targets are often weakly integrated
in national budgets and financing strategies.
2 3 7
W h a t g o v e r n m e n t s c a n d o
Strategies for
achieving equity
targets in
education should
also consider
wider constraints
linked to nutrition,
health and poverty
90
02
Education f
or A
ll G
lobal M
onitorin
g R
eport
C H A P T E R 5
3 Strengthen wider anti-povertycommitments
It is a widely overlooked fact that sustained
progress in education cannot be built on the
foundations of mass poverty and deep social
inequality. One in three pre-school children has
what amounts to brain damage as a result of
malnutrition, which constitutes a formidable
obstacle to UPE. The associated facts that
10 million children die before the age of 5 and
that tens of millions more suffer life-threatening
diseases represent further limitations on
the human right to education.
National governments should strengthen policies
for combating the poverty, inequality and wider
structural factors that produce such outcomes.
Cash transfer programmes, targeted health
interventions and more equitable public spending
in health service provision all have a role to play.
Child malnutrition must also be accorded a far
higher priority. The bottom line is that progress
in education is being held back by the failings of
current national strategies for poverty reduction.
The Dakar Framework envisages the integration
of education planning within effective national
poverty reduction strategies. This is an important
goal because many of the most insurmountable
barriers to access and learning are located beyond
the school. Unfortunately, progress towards
coherent national strategies linking education and
poverty reduction has been limited. Many countries
urgently need poverty reduction strategies to
address the health, nutrition and wider poverty-
related constraints on progress towards EFA.
Conditional cash transfer programmes in countries
such as Brazil and Mexico have demonstrated
that strategies for tackling child labour, poor
health and weak nutrition can yield large benefits
for education. All governments and donors should
actively explore the potential for strengthening
and expanding social protection as part of the
strategy for advancing the EFA agenda. Within
the education sector, far more weight should
be attached to targeted interventions such
as incentive programmes for children who are
disadvantaged as a consequence of poverty,
gender, caste, ethnicity or location. Ensuring
that schools and classroom are built and teachers
allocated so they are within reach of marginalized
communities is also important.
4 Raise quality standards
Senior policy-makers should renew and strengthen
the Dakar pledge on education quality. Policies
should emphasize new approaches to teaching and
learning, improved provision of learning materials
and strong incentives to raise standards. National
authorities, community officials and local school
leaders must work together to ensure that every
school becomes an effective learning environment.
Such an environment requires well-nourished and
motivated students, well-trained teachers using
adequate facilities and instructional materials,
a relevant, local-language curriculum, and
a welcoming, gender-sensitive, healthy, safe
environment that encourages learning. This must
be accompanied by a clear definition and accurate
assessment of learning outcomes. It is also
important that students receive the threshold
international benchmark of 850 hours per year
in instructional time. These are all areas in
which clear norms and policy rules have to be
defined and enforced.
5 Strengthen capacity to measure, monitor and assesseducation quality, and inform parents and policy-makers
The methods used and the information collected
in monitoring and assessment exercises should
be transparent and accessible to diverse education
stakeholders. Successful monitoring is not just
about generating information. It is also about
creating institutional mechanisms through which
monitoring can inform the development and
implementation of policy.
The monitoring of education quality should include
three dimensions: (i) input or enabling conditions
for learning (from infrastructure and learning
materials to qualified, trained teachers and
adequate budgets); (ii) pedagogy and the learning
process, including an appropriate language of
instruction, and learning time; and (iii) learning
outcomes. Official reporting in these areas can
be supplemented by monitoring undertaken by civil
society organizations.
6 Scale up education financing with a commitment to equity
High levels of education financing do not guarantee
universal access or strong learning achievements.
2 3 8
Conditional
cash transfer
programmes
in Brazil and
Mexico have
demonstrated
that strategies
for tackling child
labour, poor
health and weak
nutrition can
yield large
benefits for
education
P O L I C Y C O N C L U S I O N S A N D R E C O M M E N D AT I O N S
Nevertheless, sustained underfinancing is
unequivocally bad for efficiency, equity and
education quality. Many developing countries,
especially (though not exclusively) in South Asia,
chronically underinvest in education. Under-
financing is not consistent with a commitment to
EFA or the targets set in the Dakar Framework for
Action. To make matters worse, current spending
patterns are often pro-rich rather than pro-poor.
Decentralization, under the right conditions, can
help foster political accountability, but it is not
a panacea for inequality. On the contrary, financial
decentralization can widen disparities to the
detriment of poor regions and disadvantaged
communities. Avoiding this outcome requires
a built-in commitment to equity in the financing
formulas adopted for decentralization. It is
important for central government to retain
a strong redistributive role, facilitating the transfer
of resources from richer to poorer subnational
regions. In developing rules for transfers to
subnational authorities, central governments must
also attach sufficient weight to equity indicators –
such as poverty levels, health status and children
out of school – in allocating transfers. The guiding
principle should be that those in greatest need
receive the most per capita support. Too often
the inverse is the case, with the wealthiest regions
receiving the highest levels of per capita public
spending in education. While one aim of
decentralization is the devolution of authority,
in the area of finance governments should
recognize the limits to fiscal autonomy. In
particular, fiscal autonomy for local governments
should not mean authority to mobilize revenue
through user charges in basic education.
As Chapter 3 suggests, the real issue raised by
decentralization is not whether to do it, but how
to do it. And the starting point has to be a
commitment to decentralization with equity.
7 Recognize the limits to competition and choice
Under the right conditions, competition and choice
can support EFA goals. At the same time, policy-
makers need to recognize that education provision
cannot be reduced to oversimplified market
principles. Imperfect and asymmetric information,
time and distance constraints, and institutional
capacity failings all impose limits on competition.
Meanwhile, poverty and social disadvantage limit
choice. Public-private partnership models aim to
expand choice by separating education finance
and management. Voucher programmes, state
funding for private schools and the development
of independent schools are all public-private
partnership strategies – and each has a limited
record of success, even in the developed world.
Private schools in Sweden are one exception to
this rule – but the ‘Swedish model’ is not readily
transferable to other developed countries, let
alone developing ones.
Choice and competition are often presented
as a solution to the failings of public provision.
Some commentators view low-fee private schools
in the same light. The failings of public provision
are strongly evident in many countries. And millions
of poor households are voting with their feet,
switching to low-fee private providers. However,
the vast majority of the world’s children – especially
those from poor and disadvantaged households –
will depend on public provision for the foreseeable
future. Low-fee private schools will continue to
play a role, but they are symptoms of state failure
and the entry costs impose a considerable burden
on poor households. Introducing choice and
competition into a system in which all parents
have the option of sending their children to a
good-quality public provider is one thing. Using
private providers to compensate for state failure
is quite another – and in most cases will not be the
best option when it comes to efficiency and equity.
The bottom line, for governments in countries
where public-sector basic education is failing the
poor, is to fix the system first and consider options
for competition between providers second.
8 Strengthen the recruitment,deployment and motivation of teachers
An adequate supply of motivated, qualified
and properly trained teachers is a foundation of
good-quality education for all. All countries have to
assess remuneration levels consistent with building
that foundation. Poverty-level wages and poor
conditions, moreover, are not consistent with strong
motivation. Improving the teaching environment
through the provision of learning materials,
training and support is vital for raising morale.
Hiring contract teachers can reduce the marginal
costs of recruitment and thereby release resources
for investment in other areas. But it can also
reduce the quality of recruited teachers and weaken
2 3 9
W h a t g o v e r n m e n t s c a n d o
Policy-makers
need to recognize
that education
provision cannot
be reduced to
oversimplified
market principles

90
02
Education f
or A
ll G
lobal M
onitorin
g R
eport
C H A P T E R 5
motivation, with damaging consequences for
children in classrooms. There is a case for
recourse to contract teacher recruitment as a
strategy for reaching marginalized groups and
underserved areas. However, it is important for
governments to recognize the potential trade-off
between teacher quantity and quality that can
come with contract teaching. Other strategies
for reaching marginalized groups include incentives
for teachers to locate in underserved areas
and measures to increase recruitment from
disadvantaged communities.
Performance-related pay for teachers is a popular
topic in discussions of governance. In practice,
however, it is difficult to implement and unlikely
to create incentives for improved learning
achievement. It may also have damaging
consequences for equity as schools and teachers
focus on the students most likely to attain
high scores.
In some countries, especially in sub-Saharan Africa,
expanding teacher recruitment is an urgent priority.
UPE by 2015 will not be attainable without a marked
increase in the rate of recruitment and retention. In
many cases, donors will need to increase support to
achieve these goals. If teacher retirement is taken
into account, sub-Saharan Africa alone will need
to recruit around 3.8 million teachers by 2015.
The role of aid donors
National governments carry the main responsibility
for achieving the EFA goals. Many of the developing
countries that are most off track are highly
dependent on aid, and will remain so for the
foreseeable future. Developed countries can
support progressive strategies by increasing their
level of financial commitment, improving aid
practices and ensuring that aid is used to support
national priorities.
UPE will not be achieved without effective aid
partnerships. What is needed is the renewal and the
realization of the compact embodied in the Dakar
Framework for Action. There are responsibilities
and obligations on both sides. But donors need
to demonstrate a far greater level of resolve and
political leadership. This Report proposes action
in four areas.
Delivering on commitments and expanding the donor base
Donors pledged in 2005 to ‘double aid to halve
poverty’. Since then they have instead cut
development assistance. Debt relief explains only
part of the reduction. Meeting the 2005 commitment
requires an additional US$30 billion (at 2004 prices)
– some three times the increases currently set out
in aid spending plans. The shortfall for sub-Saharan
Africa is around US$14 billion (2004 prices).
Failure to act on the Gleneagles commitment
will hamper global poverty reduction efforts,
with damaging consequences for education. More
detailed national and international efforts to update
estimates of education financing gaps are required;
however, having promised that no national strategy
would fail for want of finance, donors need to
increase aid for basic education to at least
US$11 billion annually. In 2006, commitments to
basic education in low-income countries totalled
US$3.8 billion – around a third of the level required.
The two year average for 2005 and 2006 points
unmistakably towards a reduction in commitments
for basic education, compared with the previous
two years. This is true for developing countries in
general and the poorest countries in particular.
Failure to reverse the trend will adversely affect
future disbursements. As an immediate priority,
donors should commit to an increase of US$7 billion
annually in aid financing for basic education.
Aid flows to basic education are heavily concentrated
in a small group of donors. Just three donors –
the Netherlands, the United Kingdom and the
International Development Association – accounted
for half of all aid commitments and 85% of the
increase in disbursements in 2006. The narrowness
of the donor base is a source of underfinancing.
It is also a source of potential instability and
unpredictability in aid.
Strengthening the commitment to equity
Several donors appear to attach a low priority to
equity in their education aid. France, Germany and
Japan, for example, have shown neglect for basic
education and low-income countries. Calculations
for this Report suggest that France and Germany
devote far more aid to bringing students to study
in their domestic tertiary education systems than
they spend on aid to basic education. If developing
2 4 0
Donors need to
increase aid for
basic education
to at least
US$11 billion
annually

P O L I C Y C O N C L U S I O N S A N D R E C O M M E N D AT I O N S
country governments followed this practice and
allocated well over half their education budget to
the tertiary level, they would – justifiably – stand
accused of questionable governance practices.
To avoid potential double standards, it is important
for donors to consider whether their aid allocation
patterns are consistent with a commitment to equity
and to the spirit of the Dakar Framework for Action.
Getting behind the Fast Track Initiative
The balance sheet of the Fast Track Initiative (FTI)
is a source of growing concern. In mid-2008, there
were thirty-five countries with plans endorsed by
the FTI, entailing programme costs estimated at
US$8 billion and external financing needs of
US$2 billion. The gap between current aid pledges
and external financing requirements was around
US$640 million. With eight countries expected to
join the FTI by the end of the year, that gap could
climb to US$1 billion. Another thirteen countries
are scheduled to join in 2009, which means the total
annual financing gap could reach US$2.2 billion.
Closing that gap is the responsibility of a wide
range of bilateral and multilateral donors. However,
working on an assumption that the Catalytic Fund
of the FTI might be expected to cover around 40%
to 50%, a prospective 2010 financing gap of around
US$1 billion will remain. These looming shortfalls
pose a real and imminent threat to efforts to
achieve the targets set in the Dakar Framework
for Action. They also call into question donors’
commitments to ensure that no viable plan for
achieving UPE and wider education goals would
be allowed to fail for want of financial support.
Addressing the FTI deficit is an urgent priority.
At the same time, it is important for the FTI to
broaden its currently narrow base of donor support.
Delivering on the Paris agenda
Progress towards the goals set in the Paris
Declaration for improved aid quality has been
limited and uneven. Donors could do far more
to reduce transaction costs and improve aid
effectiveness through greater alignment of aid
behind national priorities, better coordination,
increased use of national financial management
systems and improved predictability in aid flows.
Increased emphasis on programme-based aid
creates opportunities and threats. The opportunities
lie in the potential for more effective national
planning and donor alignment behind national
priorities. The threats derive from donors’ ability
to use collective action through programme aid to
assert their priorities. There are no easy answers –
but donors must engage in genuine dialogue.
The role of non-governmentactors
This Report has emphasized the central
importance of government leadership and public
policy. That is not to minimize the responsibilities
and capacities of other actors. Achieving EFA
requires partnerships at many levels – between
schools and parents, between civil society
organizations and governments, between state
and non-state education providers.
Civil society has a critical role to play in
strengthening equity in education. Organizations
of the marginalized – slum dwellers, child
labourers, members of low castes, indigenous
people – have been in the forefront of international
efforts to extend education to all, often in the face
of government indifference or outright hostility.
National and international non-government
organizations have also emerged as key EFA actors,
holding governments to account, supporting
provision and building capacity. Governance reform
provides an opportunity to strengthen the voice
and effectiveness of civil society organizations
and to enhance participation and accountability.
Governance in education cannot be treated
in isolation from wider governance issues.
Democracy, transparency and the rule of law
are enabling conditions for effective participation
and accountability. When citizens lack a voice in
choosing their government, or when they face
arbitrary laws, they are unlikely to have an effective
voice in framing education priorities. Within the
education sector, governance reforms can play
a role in devolving authority to parents and
communities. Yet devolution is not an automatic
ticket to empowerment; there is a danger that poor
and marginalized communities will lack the
capacities and resources needed for effective
management. To ensure that devolved
responsibilities do not result in a further widening
of equity gaps, schools that are in disadvantaged
areas or serving disadvantaged groups need to
be provided with extra resources and support.
2 4 1
T h e r o l e o f a i d d o n o r s / T h e r o l e o f n o n - g o v e r n m e n t a c t o r s
Governance
reform provides
an opportunity
to strengthen
the voice and
effectiveness
of civil society
organizations,
and to enhance
participation and
accountability

00
2Education f
or A
ll G
lobal M
onitorin
g R
eport
9
2 4 2
© C
risp
in H
ughe
s/P
ANO
S
A committed teacheropens young minds to the excitement andbenefits of education,in rural Mali
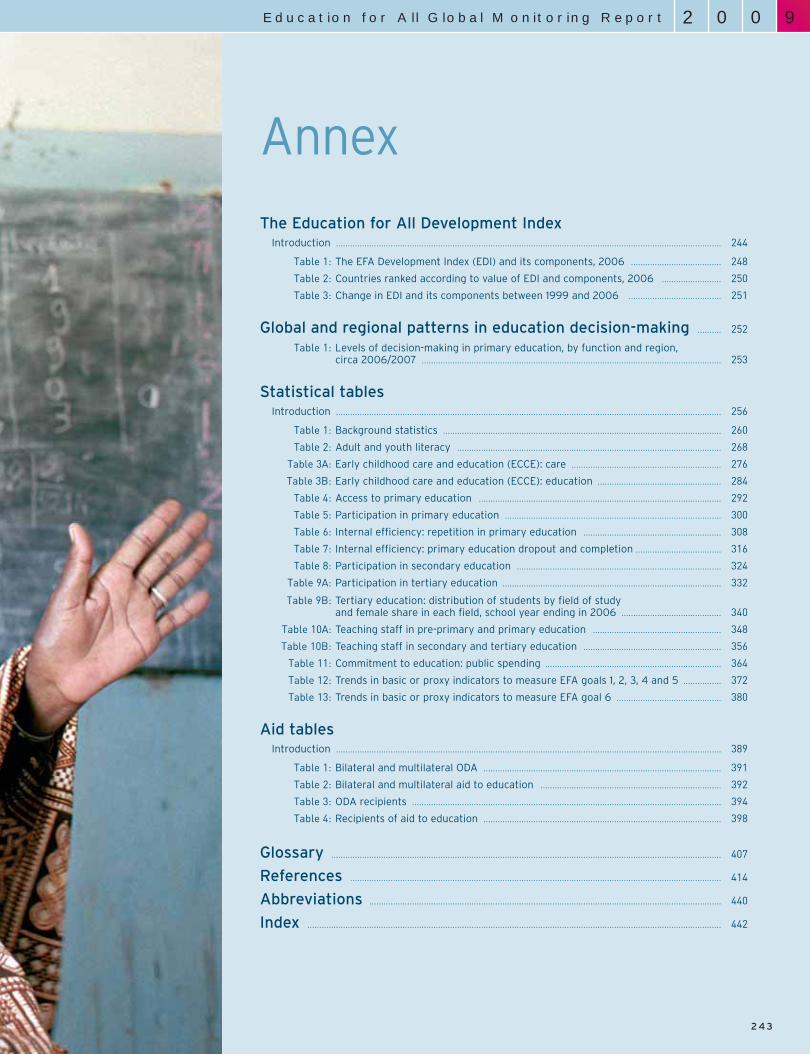
002Education for All Global Monitoring Report
Annex
9
2 4 3
The Education for All Development IndexIntroduction . . . . . . . . . . . . . . . . . . . . . . . . . . . . . . . . . . . . . . . . . . . . . . . . . . . . . . . . . . . . . . . . . . . . . . . . . . . . . . . . . . . . . . . . . . . . . . . . . . . . . . . . . . . . . . . . . . . . . . . . . . . . . . . . . . . . . . . . . . . . . . . . . . . . . . . . . . . . . . . . . . 244
Table 1: The EFA Development Index (EDI) and its components, 2006 . . . . . . . . . . . . . . . . . . . . . . . . . . . . . . . . . . . . . . 248
Table 2: Countries ranked according to value of EDI and components, 2006 . . . . . . . . . . . . . . . . . . . . . . . . . 250
Table 3: Change in EDI and its components between 1999 and 2006 . . . . . . . . . . . . . . . . . . . . . . . . . . . . . . . . . . . . . . . 251
Global and regional patterns in education decision-making . . . . . . . . . . 252
Table 1: Levels of decision-making in primary education, by function and region, circa 2006/2007 . . . . . . . . . . . . . . . . . . . . . . . . . . . . . . . . . . . . . . . . . . . . . . . . . . . . . . . . . . . . . . . . . . . . . . . . . . . . . . . . . . . . . . . . . . . . . . . . . . . . . . . . . . . . . . . . . . . . . . . . . . . . . . 253
Statistical tablesIntroduction . . . . . . . . . . . . . . . . . . . . . . . . . . . . . . . . . . . . . . . . . . . . . . . . . . . . . . . . . . . . . . . . . . . . . . . . . . . . . . . . . . . . . . . . . . . . . . . . . . . . . . . . . . . . . . . . . . . . . . . . . . . . . . . . . . . . . . . . . . . . . . . . . . . . . . . . . . . . . . . . . . 256
Table 1: Background statistics . . . . . . . . . . . . . . . . . . . . . . . . . . . . . . . . . . . . . . . . . . . . . . . . . . . . . . . . . . . . . . . . . . . . . . . . . . . . . . . . . . . . . . . . . . . . . . . . . . . . . . . . . . . . . . . . . . . . . 260
Table 2: Adult and youth literacy . . . . . . . . . . . . . . . . . . . . . . . . . . . . . . . . . . . . . . . . . . . . . . . . . . . . . . . . . . . . . . . . . . . . . . . . . . . . . . . . . . . . . . . . . . . . . . . . . . . . . . . . . . . . . . . 268
Table 3A: Early childhood care and education (ECCE): care . . . . . . . . . . . . . . . . . . . . . . . . . . . . . . . . . . . . . . . . . . . . . . . . . . . . . . . . . . . . . . . 276
Table 3B: Early childhood care and education (ECCE): education . . . . . . . . . . . . . . . . . . . . . . . . . . . . . . . . . . . . . . . . . . . . . . . . . . . . 284
Table 4: Access to primary education . . . . . . . . . . . . . . . . . . . . . . . . . . . . . . . . . . . . . . . . . . . . . . . . . . . . . . . . . . . . . . . . . . . . . . . . . . . . . . . . . . . . . . . . . . . . . . . . . . . . . . 292
Table 5: Participation in primary education . . . . . . . . . . . . . . . . . . . . . . . . . . . . . . . . . . . . . . . . . . . . . . . . . . . . . . . . . . . . . . . . . . . . . . . . . . . . . . . . . . . . . . . . . . . 300
Table 6: Internal efficiency: repetition in primary education . . . . . . . . . . . . . . . . . . . . . . . . . . . . . . . . . . . . . . . . . . . . . . . . . . . . . . . . . . 308
Table 7: Internal efficiency: primary education dropout and completion . . . . . . . . . . . . . . . . . . . . . . . . . . . . . . . . . . . . 316
Table 8: Participation in secondary education . . . . . . . . . . . . . . . . . . . . . . . . . . . . . . . . . . . . . . . . . . . . . . . . . . . . . . . . . . . . . . . . . . . . . . . . . . . . . . . . . . . . . . 324
Table 9A: Participation in tertiary education . . . . . . . . . . . . . . . . . . . . . . . . . . . . . . . . . . . . . . . . . . . . . . . . . . . . . . . . . . . . . . . . . . . . . . . . . . . . . . . . . . . . . . . . . . . . 332
Table 9B: Tertiary education: distribution of students by field of study and female share in each field, school year ending in 2006 . . . . . . . . . . . . . . . . . . . . . . . . . . . . . . . . . . . . . . . . . . 340
Table 10A: Teaching staff in pre-primary and primary education . . . . . . . . . . . . . . . . . . . . . . . . . . . . . . . . . . . . . . . . . . . . . . . . . . . . . . 348
Table 10B: Teaching staff in secondary and tertiary education . . . . . . . . . . . . . . . . . . . . . . . . . . . . . . . . . . . . . . . . . . . . . . . . . . . . . . . . . . 356
Table 11: Commitment to education: public spending . . . . . . . . . . . . . . . . . . . . . . . . . . . . . . . . . . . . . . . . . . . . . . . . . . . . . . . . . . . . . . . . . . . . . . . . . . 364
Table 12: Trends in basic or proxy indicators to measure EFA goals 1, 2, 3, 4 and 5 . . . . . . . . . . . . . . . . 372
Table 13: Trends in basic or proxy indicators to measure EFA goal 6 . . . . . . . . . . . . . . . . . . . . . . . . . . . . . . . . . . . . . . . . . . . . 380
Aid tablesIntroduction . . . . . . . . . . . . . . . . . . . . . . . . . . . . . . . . . . . . . . . . . . . . . . . . . . . . . . . . . . . . . . . . . . . . . . . . . . . . . . . . . . . . . . . . . . . . . . . . . . . . . . . . . . . . . . . . . . . . . . . . . . . . . . . . . . . . . . . . . . . . . . . . . . . . . . . . . . . . . . . . . . 389
Table 1: Bilateral and multilateral ODA . . . . . . . . . . . . . . . . . . . . . . . . . . . . . . . . . . . . . . . . . . . . . . . . . . . . . . . . . . . . . . . . . . . . . . . . . . . . . . . . . . . . . . . . . . . . . . . . . . . . 391
Table 2: Bilateral and multilateral aid to education . . . . . . . . . . . . . . . . . . . . . . . . . . . . . . . . . . . . . . . . . . . . . . . . . . . . . . . . . . . . . . . . . . . . . . . . . . . . 392
Table 3: ODA recipients . . . . . . . . . . . . . . . . . . . . . . . . . . . . . . . . . . . . . . . . . . . . . . . . . . . . . . . . . . . . . . . . . . . . . . . . . . . . . . . . . . . . . . . . . . . . . . . . . . . . . . . . . . . . . . . . . . . . . . . . . . . . . . . . . . 394
Table 4: Recipients of aid to education . . . . . . . . . . . . . . . . . . . . . . . . . . . . . . . . . . . . . . . . . . . . . . . . . . . . . . . . . . . . . . . . . . . . . . . . . . . . . . . . . . . . . . . . . . . . . . . . . . . . 398
Glossary . . . . . . . . . . . . . . . . . . . . . . . . . . . . . . . . . . . . . . . . . . . . . . . . . . . . . . . . . . . . . . . . . . . . . . . . . . . . . . . . . . . . . . . . . . . . . . . . . . . . . . . . . . . . . . . . . . . . . . . . . . . . . . . . . . . . . . . . . . . . . . . . . . . . . . . . . . . . . . . . . . . . 407
References . . . . . . . . . . . . . . . . . . . . . . . . . . . . . . . . . . . . . . . . . . . . . . . . . . . . . . . . . . . . . . . . . . . . . . . . . . . . . . . . . . . . . . . . . . . . . . . . . . . . . . . . . . . . . . . . . . . . . . . . . . . . . . . . . . . . . . . . . . . . . . . . . . . . . . . . . . . . 414
Abbreviations . . . . . . . . . . . . . . . . . . . . . . . . . . . . . . . . . . . . . . . . . . . . . . . . . . . . . . . . . . . . . . . . . . . . . . . . . . . . . . . . . . . . . . . . . . . . . . . . . . . . . . . . . . . . . . . . . . . . . . . . . . . . . . . . . . . . . . . . . . . . . . . . . . . . 440
Index . . . . . . . . . . . . . . . . . . . . . . . . . . . . . . . . . . . . . . . . . . . . . . . . . . . . . . . . . . . . . . . . . . . . . . . . . . . . . . . . . . . . . . . . . . . . . . . . . . . . . . . . . . . . . . . . . . . . . . . . . . . . . . . . . . . . . . . . . . . . . . . . . . . . . . . . . . . . . . . . . . . . . . . . . . . . . . 442
90
02
Education f
or A
ll G
lobal M
onitorin
g R
eport
The EFA goals represent more than the sum of
their individual parts. While each is individually
important, it is also useful to have a means of
indicating achievement of EFA as a whole. The
EFA Development Index (EDI), a composite of
relevant indicators, provides one way of doing so. Ideally,
it should reflect all six EFA goals but, due to data
constraints, it currently focuses only on the four most
easily quantifiable EFA goals: universal primary education
(UPE), adult literacy, the quality of education and gender
parity. The two goals not yet included in the EDI are goals
1 and 3. Neither has a quantitative target for 2015. Goal 1
(early childhood care and education) is multidimensional
and covers both the care and education aspects. The
indicators currently available on this goal cannot easily
be incorporated in the EDI because national data are
insufficiently standardized and reliable, and comparable
data are not available for most countries (see Chapter 2
and EFA Global Monitoring Report 2007). Goal 3 (learning
needs of youth and adults) has not yet been sufficiently
defined for quantitative measurement (see Chapter 2).
In accordance with the principle of considering each goal
to be equally important, one indicator is used as a proxy
measure for each of the four EDI components1 and each
component is assigned equal weight in the overall index.
The EDI value for a particular country is thus the
arithmetic mean of the observed values for each
component. Since the components are all expressed
as percentages, the EDI value can vary from 0 to 100%
or, when expressed as a ratio, from 0 to 1. The closer
a country’s EDI value is to the maximum, the greater
the extent of its overall EFA achievement and the nearer
the country is to the EFA goal as a whole.
Choice of indicators as proxy measuresof EDI components
In selecting indicators, relevance has to be balanced with
data availability.
Universal primary education
The UPE goal includes both universal access to and
universal completion of primary education. However,
while both access and participation at this level are
relatively easy to measure, there is a lack of consensus
on the definition of primary school completion. Therefore,
the indicator selected to measure UPE achievement
(goal 2) in the EDI is the total primary net enrolment
ratio (NER), which reflects the percentage of primary
school-age children who are enrolled in either primary
or secondary school. Its value varies from 0 to 100%.
A NER of 100% means all eligible children are enrolled
in school in a given school year, even though some of
them may not complete it. However, if the NER is at 100%
for many consecutive years, it may imply that all children
enrolled do complete school.
Adult literacy
The adult literacy rate is used as a proxy to measure
progress towards the first part of goal 4.2 This has its
limitations. First, the adult literacy indicator, being a
statement about the stock of human capital, is slow to
change and thus it could be argued that it is not a good
‘leading indicator’ of year-by-year progress. Second, the
existing data on literacy are not entirely satisfactory.
Most of them are based on ‘conventional’ non-tested
methods that usually overestimate the level of literacy
among individuals.3 New methodologies, based on tests
and on the definition of literacy as a continuum of skills,
are being developed and applied in some countries to
improve the quality of literacy data. Providing a new data
series of good quality for even a majority of countries will
take many years, however. The literacy rates now used
are the best currently available internationally.
A N N E X
2 4 4
The Education For All Development Index
Introduction
1. The EDI’s gender component is itself a composite index.
2. The first part of goal 4 is: ‘Achieving a 50 per cent improvement in levels of adult literacy by 2015, especially for women’. To enable progress towards this target to be monitored for all countries, whatever their current adult literacylevel, it was decided as of the EFA Global Monitoring Report 2006 to interpret it in terms of a reduction in the adult illiteracy rate.
3. In most countries, particularly developing countries, current literacy data are derived from methods of self-declaration or third-party reporting (e.g. a household head responding on behalf of other household members) used incensuses or household surveys. In other cases, particularly as regards developedcountries, they are based on education attainment proxies as measured in labourforce surveys. Neither method is based on any test, and both are subject to bias(overestimation of literacy), which affects the quality and accuracy of literacy data.

Quality of education
There is considerable debate about the concept of quality
and how it should be measured. Several proxy indicators
are generally used to measure quality of education,
among them measures of students’ learning outcomes,
which are widely used for this purpose, particularly
among countries at similar levels of development.
However, measures of learning achievement are
incomplete, as they are often limited to basic skills
(reading, numeracy, science) and do not include values,
capacities and other non-cognitive skills that are also
important aims of education (UNESCO, 2004, pp. 43-4).
They also tell nothing about the cognitive value added
by schooling (as opposed to home background) or the
distribution of ability among children enrolled in school.4
Despite these drawbacks, learning outcomes would likely
be the most appropriate single proxy for the average
quality of education, but as comparable data are not yet
available for a large number of countries, it is not yet
possible to use them in the EDI.
Among the feasible proxy indicators available for a large
number of countries, the survival rate to grade 5 seems
to be the best available for the quality of education
component of the EDI.5 Figures 1, 2 and 3 show that there
is a clear positive link between such survival rates and
learning achievement across various regional and
international assessments. The coefficient of correlation
(R2) between survival rates and learning outcomes in
reading is 37% (Figure 1). Education systems capable
of retaining a larger proportion of their pupils to grade 5
tend to perform better, on average, in student
assessment tests. The survival rate to grade 5 is
associated even more strongly with learning outcomes
in mathematics (with a coefficient of 45%; Figure 2)
and science (42%; Figure 3).
Another possible proxy indicator for quality is the
pupil/teacher ratio (PTR). Among Latin American
countries participating in the 2006 Segundo Estudio
Regional Comparativo y Explicativo (SERCE) assessment,
the association between this indicator and learning
outcomes in mathematics is strong (45%), about the
same as for the survival rate to grade 5. Many other
studies, however, produce much more ambiguous
evidence of the relationship between PTRs and learning
outcomes (UNESCO, 2004). In a multivariate context,
PTRs are associated with higher learning outcomes in
some studies, but not in many others. In addition,
T H E E D U C AT I O N F O R A L L D E V E L O P M E N T I N D E X
I n t r o d u c t i o n
2 4 5
4. Strictly speaking, it would be necessary to compare average levels of cognitiveachievement for pupils completing a given school grade across countries withsimilar levels and distributions of income, and with similar levels of NER, so as to account for home background and ability cohort effects.
5. See EFA Global Monitoring Report 2003/4, Appendix 2, for background.
0 20 40 60 80 1000
20
40
60
80
100
Surv
ival
rate
to g
rade
5 (%
)
15-year-old students performing below or at level 1 in reading literacy (%)
y = -0.138x + 101.03R2 = 0.3732
Countries participating in PISA, 2006
Figure 1: Survival rates to grade 5 and learning outcomes in reading
at lower secondary level, 2006
Sources: Annex, Statistical Table 7; OECD (2007b).
0 10 20 30 40 5040
60
80
100
Surv
ival
rate
to g
rade
5 (%
)
Sixth-grade students performing below or at level 1 in mathematics (%)
Countries participating in SERCE, 2006
Nicaragua
Dominican Rep.
Panama
Ecuador
Guatemala
El Salvador
BrazilColombia
Argentina
Chile
Mexico
Paraguay
Peru
CubaCosta Rica
Uruguay
y = -0.7222x + 97.26R2 = 0.4538
Figure 2: Survival rates to grade 5 and learning outcomes in mathematics
at primary level, 2006
Sources: Annex, Statistical Table 7; UNESCO-OREALC (2008).
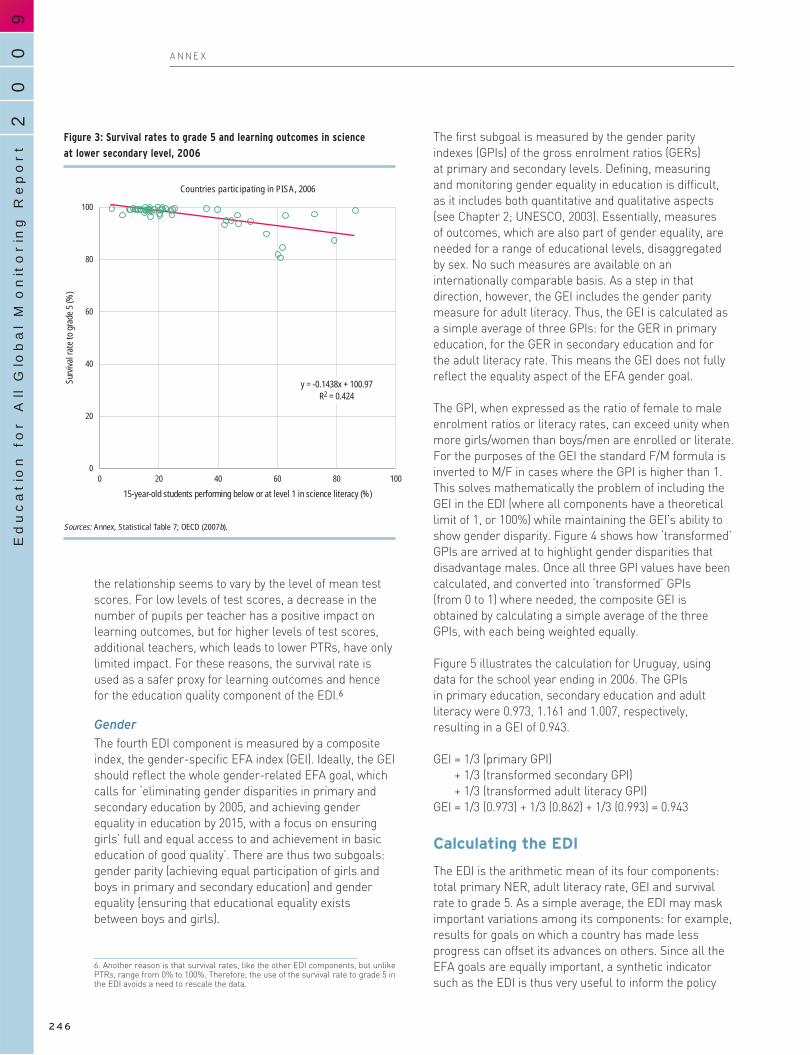
90
02
Education f
or A
ll G
lobal M
onitorin
g R
eport
The first subgoal is measured by the gender parity
indexes (GPIs) of the gross enrolment ratios (GERs)
at primary and secondary levels. Defining, measuring
and monitoring gender equality in education is difficult,
as it includes both quantitative and qualitative aspects
(see Chapter 2; UNESCO, 2003). Essentially, measures
of outcomes, which are also part of gender equality, are
needed for a range of educational levels, disaggregated
by sex. No such measures are available on an
internationally comparable basis. As a step in that
direction, however, the GEI includes the gender parity
measure for adult literacy. Thus, the GEI is calculated as
a simple average of three GPIs: for the GER in primary
education, for the GER in secondary education and for
the adult literacy rate. This means the GEI does not fully
reflect the equality aspect of the EFA gender goal.
The GPI, when expressed as the ratio of female to male
enrolment ratios or literacy rates, can exceed unity when
more girls/women than boys/men are enrolled or literate.
For the purposes of the GEI the standard F/M formula is
inverted to M/F in cases where the GPI is higher than 1.
This solves mathematically the problem of including the
GEI in the EDI (where all components have a theoretical
limit of 1, or 100%) while maintaining the GEI’s ability to
show gender disparity. Figure 4 shows how ‘transformed’
GPIs are arrived at to highlight gender disparities that
disadvantage males. Once all three GPI values have been
calculated, and converted into ‘transformed’ GPIs
(from 0 to 1) where needed, the composite GEI is
obtained by calculating a simple average of the three
GPIs, with each being weighted equally.
Figure 5 illustrates the calculation for Uruguay, using
data for the school year ending in 2006. The GPIs
in primary education, secondary education and adult
literacy were 0.973, 1.161 and 1.007, respectively,
resulting in a GEI of 0.943.
GEI = 1/3 (primary GPI)
+ 1/3 (transformed secondary GPI)
+ 1/3 (transformed adult literacy GPI)
GEI = 1/3 (0.973) + 1/3 (0.862) + 1/3 (0.993) = 0.943
Calculating the EDI
The EDI is the arithmetic mean of its four components:
total primary NER, adult literacy rate, GEI and survival
rate to grade 5. As a simple average, the EDI may mask
important variations among its components: for example,
results for goals on which a country has made less
progress can offset its advances on others. Since all the
EFA goals are equally important, a synthetic indicator
such as the EDI is thus very useful to inform the policy
the relationship seems to vary by the level of mean test
scores. For low levels of test scores, a decrease in the
number of pupils per teacher has a positive impact on
learning outcomes, but for higher levels of test scores,
additional teachers, which leads to lower PTRs, have only
limited impact. For these reasons, the survival rate is
used as a safer proxy for learning outcomes and hence
for the education quality component of the EDI.6
Gender
The fourth EDI component is measured by a composite
index, the gender-specific EFA index (GEI). Ideally, the GEI
should reflect the whole gender-related EFA goal, which
calls for ‘eliminating gender disparities in primary and
secondary education by 2005, and achieving gender
equality in education by 2015, with a focus on ensuring
girls’ full and equal access to and achievement in basic
education of good quality’. There are thus two subgoals:
gender parity (achieving equal participation of girls and
boys in primary and secondary education) and gender
equality (ensuring that educational equality exists
between boys and girls).
A N N E X
2 4 6
6. Another reason is that survival rates, like the other EDI components, but unlikePTRs, range from 0% to 100%. Therefore, the use of the survival rate to grade 5 inthe EDI avoids a need to rescale the data.
0 20 40 60 80 1000
20
40
60
80
100
Surv
ival
rate
to g
rade
5 (%
)
15-year-old students performing below or at level 1 in science literacy (%)
y = -0.1438x + 100.97R2 = 0.424
Countries participating in PISA, 2006
Figure 3: Survival rates to grade 5 and learning outcomes in science
at lower secondary level, 2006
Sources: Annex, Statistical Table 7; OECD (2007b).

debate on the prominence of all the EFA goals and to
highlight the synergy among them.
Figure 6 illustrates the calculation of the EDI, again using
Uruguay as an example. The total primary NER, adult
literacy rate and GEI are for 2006 while the survival rate
to grade 5 is for 2005. Their values were 1.00, 0.978, 0.943
and 0.931, respectively, resulting in an EDI of 0.963.
EDI = 1/4 (total primary NER)
+ 1/4 (adult literacy rate)
+ 1/4 (GEI)
+ 1/4 (survival rate to grade 5)
EDI = 1/4 (1.00) + 1/4 (0.978) + 1/4 (0.943) + 1/4 (0.931)
= 0.963
Data sources and country coverage
All data used to calculate the EDI for the school year
ending in 2006 are from the statistical tables in this annex
and the UNESCO Institute for Statistics (UIS) database,
with one exception. Adult literacy data for some OECD
countries that did not answer the annual UIS literacy
survey are based on European Labour Force Survey data.
Only the 129 countries with a complete set of the
indicators required to calculate the EDI are included
in this analysis. Many countries thus are not included
in the EDI, among them a number of fragile states and
countries with weak education statistical systems. This
fact, coupled with the exclusion of goal 1 and 3, means
the EDI does not yet provide a fully comprehensive global
overview of EFA achievement.
T H E E D U C AT I O N F O R A L L D E V E L O P M E N T I N D E X
I n t r o d u c t i o n
2 4 7
1.20
1.00
0.800
0.600
0.400
0.200
0.00
1.161
Transformed secondary education
GPI (M/F)GPI (F/M)
Example used: Uruguay
0.862
Figure 4: Calculating the ‘transformed’ GPI
1.00
0.800
0.600
0.400
0.200
0.00
0.943
GPIs
GEIPrimary
educationSecondaryeducation
Adultliteracy
Example used: Uruguay
0.862
0.993
(M/F)(F/M) (M/F)
0.973
Figure 5: Calculating the GEI
Components
0.978
Adult literacy rate
GEI
Totalprimary NER
Survival rateto grade 5
0.943 0.931
0.800
0.600
0.400
0.200
0.00
1.000.963
EDI
Example used: Uruguay
1.00
Figure 6: Calculating the EDI

90
02
Education f
or A
ll G
lobal M
onitorin
g R
eport
A N N E X
2 4 8
Table 1: The EFA Development Index (EDI) and its components, 2006
0.9950.9940.9940.9940.9930.9920.9920.9910.9890.9890.9890.9880.9880.9870.9870.9870.9860.9850.9840.9840.9840.9810.9810.9810.9800.9800.9790.9790.9790.9760.9760.9760.9760.9740.9720.9720.9710.9710.9700.9700.9690.9690.9670.9670.9650.9650.9630.9630.9590.9590.9560.9560.9560.9550.9520.952
0.9480.9480.9470.9460.9430.9430.9420.9410.941
0.9900.9980.9960.9810.9960.9940.9860.9930.9870.9890.9950.9760.9680.9700.9740.9950.9820.9970.9490.9850.9970.9700.9950.9630.9690.9700.9750.9460.9250.9350.9720.9350.9490.9950.9220.9740.9730.9210.9200.9030.8990.9920.9070.9840.9990.9551.0000.9380.9800.9940.9910.9510.9940.9350.9720.936
0.8520.8540.9130.9500.9620.9370.9880.8940.991
0.9960.9921.0001.0000.9980.9881.0000.9880.9900.9860.9881.0000.9971.0001.0000.9760.9870.9741.0000.9910.9700.9980.9810.9830.9980.9710.9901.0000.9991.0000.9680.9930.9940.9180.9980.9460.9960.9960.9970.9980.9970.9460.9950.9920.9150.9760.9780.9830.9700.8830.9760.8980.9170.9140.9740.990
0.9920.9930.9290.8700.8840.9270.9010.9860.932
0.9930.9980.9920.9960.9890.9910.9910.9950.9830.9830.9820.9870.9970.9850.9850.9850.9850.9690.9970.9670.9820.9860.9800.9900.9850.9840.9870.9930.9930.9800.9810.9900.9750.9910.9860.9700.9270.9910.9960.9770.9870.9470.9740.9700.9520.9910.9430.9810.9660.9710.9610.9840.9690.9800.9540.981
0.9790.9720.9550.9750.9800.9600.9210.9740.960
1.0000.9900.9890.9990.9900.9950.9900.9900.9960.9970.9900.9910.9890.9940.9900.9910.9901.0000.9900.9930.9860.9720.9670.9860.9690.9950.9640.9780.9980.9900.9820.9860.9850.9900.9810.9980.9870.9740.9671.0000.9920.9900.9940.9210.9930.9370.9310.9480.9210.9890.8970.9910.9440.9900.9090.899
0.9700.9730.9900.9890.9460.9470.9590.9100.880
KazakhstanJapan3
Germany2
Norway2
United Kingdom2
ItalyDenmark2
France2
Luxembourg2
CroatiaNew Zealand3
Iceland2
SloveniaFinland2
Austria2Cyprus2
Netherlands2
SpainSweden2
Republic of Korea3
GreeceCubaArubaPoland2
EstoniaIsrael2
Belgium2
Hungary2
Czech Republic2
Switzerland2
TFYR MacedoniaKyrgyzstanIreland2
SeychellesLatviaBrunei DarussalamTajikistanSlovakia2
LithuaniaGeorgia3
BelarusPortugalArmeniaTongaMalaysiaRomaniaUruguayBulgariaMaldivesBahrainArgentinaUnited Arab EmiratesMexicoMaltaMongoliaAlbania
Republic of MoldovaAzerbaijanMacao, ChinaMauritiusBarbados3
JordanSaint Lucia2
Trinidad and TobagoPanama
Ranking accordingto level of EDI Countries/Territories EDI
Total primary NER1
Adult literacy rate
Gender-specificEFA index (GEI)
Survival rateto grade 5
High EDI123456789
1011121314151617181920212223242526272829303132333435363738394041424344454647484950515253545556
Medium EDI575859606162636465

T H E E D U C AT I O N F O R A L L D E V E L O P M E N T I N D E X
Ta b l e 1
2 4 9
Table 1 (continued)
0.9350.9350.9350.9340.9310.9250.9210.9210.9190.9150.9130.9130.9090.9050.9010.9010.9000.8980.8950.8880.8880.8870.8870.8850.8830.8770.8670.8670.8650.8570.8470.8420.8240.8190.816
0.7990.7940.7880.7780.7770.7680.7570.7530.7530.7380.7370.7350.7250.7120.6950.6860.6840.6520.6430.6430.6430.6220.6210.6080.5980.5700.5380.4700.408
0.8850.9820.9490.9320.9900.9840.9420.8840.9940.9630.9910.7980.9140.9200.9560.9250.9740.9340.9960.9770.9200.8300.9700.7650.8840.9600.8410.9570.7640.9770.7850.9350.7970.9610.762
0.9140.9610.7270.8990.7990.7740.7480.8370.9210.8010.9600.9180.6500.8410.7990.8270.3830.6560.7220.8220.7540.7600.4750.7270.7230.6050.4780.4410.604
0.9330.8980.9360.9300.8870.9100.9290.9580.9240.8980.7690.9240.8810.9230.8960.8810.7690.8760.8990.7460.9330.8830.8260.8370.8300.7140.8210.8360.8760.8750.7960.6800.8880.7250.736
0.8010.6520.8220.7560.5430.7410.5930.7250.5250.5520.7070.7090.7100.6490.5520.5320.7030.5420.4200.3970.5730.4380.5760.2950.3590.2290.2600.2980.257
0.9660.9880.9770.9540.9510.9630.9530.9900.9860.9500.9700.9490.8730.9620.9480.9170.8910.9580.9690.8800.9600.9240.9160.9380.8980.8670.9800.9540.9510.9350.9660.8610.9250.9010.937
0.9460.8340.8660.8330.8330.7500.8080.8300.9140.8150.9210.8700.8150.8980.8560.6410.7500.7140.7790.6370.5810.7130.6950.6000.6670.6330.6880.5750.440
0.9580.8710.8770.9200.8950.8440.8600.8500.7730.8480.9220.9810.9690.8170.8050.8800.9670.8240.7150.9520.7400.9090.8341.0000.9190.9680.8250.7210.8680.6410.8410.8930.6840.6890.829
0.5370.7300.7370.6220.9320.8060.8790.6200.6510.7850.3580.4420.7260.4580.5740.7460.8990.6970.6500.7150.6630.5760.7370.8090.6440.8120.7250.5650.332
KuwaitQatarParaguayVenezuela, B. R.PeruIndonesiaFiji3
Bahamas3
EcuadorBoliviaBelize3
Palestinian A. T.TurkeyColombiaBrazilSt Vincent/Grenad.2
TunisiaSouth AfricaMyanmarAlgeriaPhilippinesLebanon3
HondurasOmanCape VerdeEgyptBotswanaEl SalvadorNamibiaSao Tome and PrincipeSwazilandZambiaDominican RepublicGuatemalaKenya
NicaraguaIndiaLesothoCambodiaBhutanIraqBurundiLao PDRBangladeshNepalMadagascarMalawiNigeriaRwandaMauritaniaTogoDjibouti3
PakistanSenegalBeninYemenMozambiqueEritrea3
GuineaEthiopiaMaliBurkina FasoNigerChad
Ranking accordingto level of EDI Countries/Territories EDI
Total primary NER1
Adult literacy rate
Gender-specificEFA index (GEI)
Survival rateto grade 5
Medium EDI66676869707172737475767778798081828384858687888990919293949596979899
100
Low EDI101102103104105106107108109110111112113114115116117118119120121122123124125126127128129
Notes: Data in blue indicate thatgender disparities are at theexpense of boys or men,particularly at secondary level.1. Total primary NER includes
children of primary school agewho are enrolled in eitherprimary or secondary schools.
2. The adult literacy rate is aproxy measure based oneducational attainment; thatis, the proportion of the adultpopulation with at least acomplete primary education.
3. Adult literacy rates areunofficial UIS estimates.
Sources: Annex, StatisticalTables 2, 5, 7 and 8;UIS database; EuropeanCommission (2007a) for proxyliteracy measure for Europeancountries.

90
02
Education f
or A
ll G
lobal M
onitorin
g R
eport
A N N E X
2 5 0
KazakhstanJapan3
Germany2
Norway2
United Kingdom2
ItalyDenmark2
France2
Luxembourg2
CroatiaNew Zealand3
Iceland2
SloveniaFinland2
Austria2
Cyprus2
Netherlands2
SpainSweden2
Republic of Korea3
GreeceCubaArubaPoland2
EstoniaIsrael2
Belgium2
Hungary2
Czech Republic2
Switzerland2
TFYR MacedoniaKyrgyzstanIreland2
SeychellesLatviaBrunei DarussalamTajikistanSlovakia2
LithuaniaGeorgia3
BelarusPortugalArmeniaTongaMalaysiaRomaniaUruguayBulgariaMaldivesBahrainArgentinaUnited Arab EmiratesMexicoMaltaMongoliaAlbania
Republic of MoldovaAzerbaijanMacao, ChinaMauritiusBarbados3
JordanSaint Lucia2
Trinidad and TobagoPanama
Table 2: Countries ranked according to value of EDI and components, 2006
1 23 21 7 32 7 1 10 333 3 28 1 204 33 1 4 55 8 14 19 206 15 34 12 117 27 1 13 208 17 35 6 209 26 31 34 9
10 24 37 35 811 11 33 36 2012 37 1 23 1713 50 18 2 3514 47 1 27 1215 41 1 29 2016 10 45 31 1917 31 36 28 2018 5 47 60 419 63 1 3 2020 28 29 61 1521 4 49 37 3922 48 11 25 4823 9 41 44 5324 51 39 18 3825 49 12 30 5126 46 48 32 1027 38 32 21 5628 66 1 8 4529 78 10 9 630 73 1 42 2031 44 51 38 4232 72 25 16 4033 65 23 50 4134 12 66 11 2035 79 13 24 4336 40 54 56 737 42 20 89 3738 81 19 15 4639 84 17 5 5540 90 15 47 141 92 16 22 1642 18 53 83 2043 89 22 52 1344 29 26 57 6945 2 68 77 1446 60 44 14 6447 1 42 85 6648 68 40 40 6049 34 50 63 6850 13 81 54 3651 19 43 67 7752 61 73 33 1853 14 67 59 6354 71 69 41 2055 43 46 74 7356 70 30 39 75
57 98 27 46 4958 97 24 53 4759 88 61 72 2060 62 87 49 3461 53 79 43 6262 69 62 69 6163 25 71 92 5764 93 38 51 7265 21 58 68 80
66 94 57 64 5867 32 74 20 8468 64 55 48 8369 76 59 75 7070 22 78 79 7871 30 70 65 8972 67 60 76 8673 96 52 17 8774 16 63 26 10175 52 75 80 8876 20 96 55 6777 108 64 81 4478 87 82 102 5079 83 65 66 9580 59 76 82 9981 77 83 94 8182 39 97 100 5483 75 85 71 9484 6 72 58 11185 35 99 101 5986 82 56 70 10387 102 80 91 7488 45 91 95 9189 112 88 86 290 95 90 99 7191 57 104 104 5292 100 93 45 9393 58 89 73 10994 113 84 78 8595 36 86 88 11996 110 95 62 9097 74 109 106 7998 109 77 90 11499 54 102 97 113
100 114 101 87 92
101 86 94 84 125102 55 110 108 106103 119 92 105 104104 91 98 110 120105 106 117 109 65106 111 100 117 98107 117 112 114 82108 101 103 111 121109 80 120 96 116110 105 115 112 100111 56 107 93 128112 85 106 103 127113 123 105 113 107114 99 111 98 126115 107 116 107 123116 103 119 123 102117 129 108 116 76118 122 118 118 112119 121 122 115 117120 104 123 124 110121 116 114 127 115122 115 121 119 122123 127 113 120 105124 118 126 126 97125 120 124 122 118126 124 129 125 96127 126 127 121 108128 128 125 128 124129 125 128 129 129
Countries/Territories EDI
Totalprimary
NER1
Adultliteracy
rate
Gender-specific
EFA index(GEI)
Survivalrate tograde 5
Countries/Territories EDI
Totalprimary
NER1
Adultliteracy
rate
Gender-specific
EFA index(GEI)
Survivalrate tograde 5
KuwaitQatarParaguayVenezuela, B. R.PeruIndonesiaFiji3
Bahamas3
EcuadorBoliviaBelize3
Palestinian A. T.TurkeyColombiaBrazilSt Vincent/Grenad.2
TunisiaSouth AfricaMyanmarAlgeriaPhilippinesLebanon3
HondurasOmanCape VerdeEgyptBotswanaEl SalvadorNamibiaSao Tome/PrincipeSwazilandZambiaDominican RepublicGuatemalaKenya
NicaraguaIndiaLesothoCambodiaBhutanIraqBurundiLao PDRBangladeshNepalMadagascarMalawiNigeriaRwandaMauritaniaTogoDjibouti3
PakistanSenegalBeninYemenMozambiqueEritrea3
GuineaEthiopiaMaliBurkina FasoNigerChad
Notes:1. Total primary NER
includes children ofprimary school age whoare enrolled in eitherprimary or secondaryschools.
2. The adult literacy rateis a proxy measurebased on educationalattainment; that is, theproportion of the adultpopulation with at leasta complete primaryeducation.
3. Adult literacy rates areunofficial UIS estimates.
Sources: Annex,Statistical Tables 2, 5, 7and 8; UIS database;European Commission(2007a) for proxy literacymeasure for Europeancountries.
High EDI
Medium EDI
Medium EDI
Low EDI

T H E E D U C AT I O N F O R A L L D E V E L O P M E N T I N D E X
Ta b l e s 2 a n d 3
2 5 1
Table 3: Change in EDI and its components between 1999 and 2006
0.984 0.992 0.8 -0.4 0.4 0.1 3.00.970 0.989 2.0 7.6 0.5 0.2 0.00.971 0.987 1.6 1.6 0.8 0.8 3.10.974 0.981 0.8 -2.2 0.0 1.9 3.70.974 0.981 0.8 1.6 0.8 0.7 -0.10.991 0.980 -1.1 -3.0 0.0 1.0 -2.20.982 0.979 -0.3 -2.5 0.0 0.4 1.10.965 0.976 1.1 -0.8 0.6 0.5 4.30.983 0.972 -1.1 -6.4 0.0 0.6 1.20.991 0.970 -2.1 -6.2 0.0 0.4 -2.60.978 0.965 -1.3 -4.4 0.3 0.9 -2.10.971 0.963 -0.8 -5.1 0.1 -0.2 2.00.944 0.959 1.6 0.8 2.0 2.0 1.50.963 0.956 -0.7 -0.6 0.4 -1.7 -0.60.887 0.956 7.8 16.6 6.9 1.6 7.30.920 0.952 3.5 6.4 -0.4 4.1 4.20.960 0.952 -0.8 -0.9 0.3 -0.2 -2.70.960 0.948 -1.2 -6.7 0.7 -0.8 1.70.951 0.948 -0.3 -0.1 0.6 -2.3 0.80.927 0.946 2.1 4.9 3.2 1.3 -0.60.922 0.942 2.2 1.6 0.0 0.7 6.50.942 0.941 -0.2 2.2 1.5 -0.2 -4.30.909 0.935 2.9 -1.7 1.5 1.0 12.30.910 0.934 2.7 7.1 0.0 2.5 1.40.936 0.921 -1.6 -4.6 0.0 -0.1 -1.70.913 0.919 0.7 0.4 1.6 0.5 0.40.894 0.915 2.3 0.4 3.5 2.4 3.10.866 0.913 5.5 3.8 0.0 0.8 18.60.855 0.898 5.0 -5.3 3.8 1.4 27.30.864 0.865 0.1 4.1 3.0 0.1 -5.90.829 0.847 2.2 5.0 0.0 -0.6 5.20.748 0.842 12.5 37.1 0.0 4.2 10.80.850 0.824 -3.1 -6.3 2.1 -0.2 -8.80.734 0.819 11.6 15.1 4.9 6.1 23.10.749 0.799 6.7 14.2 4.4 0.2 10.80.742 0.788 6.2 26.0 0.0 4.6 -0.40.744 0.768 3.2 -8.4 0.0 2.0 22.90.725 0.753 3.7 6.7 10.5 0.0 0.20.603 0.738 22.5 19.7 13.6 20.6 35.30.731 0.735 0.5 -7.2 9.0 9.4 -9.60.666 0.695 4.5 24.3 7.8 3.3 -15.40.585 0.643 9.9 34.0 24.3 32.0 -24.20.495 0.622 25.6 45.1 10.3 12.8 35.00.454 0.598 31.7 107.9 35.1 4.4 14.00.426 0.408 -4.2 18.1 0.0 14.0 -39.7
Variation1999–2006(in relative
terms)20061999Countries/Territories
EFA Development Index Change in EDI components between 1999 and 2006 (% in relative terms)
Total primaryNER1
Adultliteracy rate
Gender-specificEFA index
(GEI)
Survivalrate tograde 5
ItalyCroatiaCyprus2
CubaArubaEstoniaHungary2
KyrgyzstanLatviaLithuaniaRomaniaBulgariaBahrainArgentinaUnited Arab EmiratesMongoliaAlbaniaRepublic of MoldovaAzerbaijanMauritiusSaint LuciaPanamaParaguayVenezuela, B. R.Fiji3
EcuadorBoliviaBelizeSouth AfricaNamibiaSwazilandZambiaDominican RepublicGuatemalaNicaraguaLesothoIraqBangladeshNepalMalawiMauritaniaYemenMozambiqueEthiopiaChad
Notes:1. Total primary NER
includes children ofprimary school age whoare enrolled in eitherprimary or secondaryschools.
2. The adult literacy rateis a proxy measurebased on educationalattainment; that is, theproportion of the adultpopulation with at leasta complete primaryeducation.
3. Adult literacy rates areunofficial UIS estimates.
Sources: Annex,Statistical Tables 2, 5, 7and 8; UIS database;European Commission(2007a) for proxy literacymeasure for Europeancountries.

90
02
Education f
or A
ll G
lobal M
onitorin
g R
eport
Governance reforms in education involve the
reallocation of decision-making authority
across levels of government. These
arrangements affect the roles of parents,
teachers, civil servants and politicians at
local and national levels. The issues at stake range
from financing to school supervision, curriculum
development, and teacher recruitment and management.
Decentralization has been a dominant theme in
governance reforms. What does this mean in practice
for the locus of decision-making? A mapping of
184 countries, described in the accompanying box, finds
that some broad patterns in levels of decision-making
are discernable, as Table 1 shows. One prominent finding
is that, even in nominally decentralized structures,
central government continues to play a key role in
various areas of education service delivery – notably
in designing curricula and instructional materials,
in teacher governance and management, and in
financing arrangements. Other actors – including local
government, schools and communities – play a highly
variable role. The following are among the findings
to emerge:
In most countries, the central government continues to
take overall responsibility for curriculum development
and the design of instructional materials. In two-thirds
of countries in Central and Eastern Europe, and North
America and Western Europe, the curriculum is jointly
developed by schools and teachers based on a general
framework established by the central government.
The central government remains strong in many
aspects of teacher governance and management,
especially with regard to training standards, salary
levels and conditions of service. Teacher training
is organized and run by the central government
in sixty-eight of the seventy-six countries with
the relevant information.
When teacher recruitment, appointment and
deployment are not centralized, as in around half
the cases covered, this administrative role is usually
undertaken by a mix of provincial or municipal
governments. In one-quarter of Latin America and
Caribbean countries, decisions in this area are shared
among various government levels. Generally, schools
have little control over teacher management.
With respect to infrastructure, school mapping and
other decisions regarding the opening and closing
of schools occur at all levels of government. The
decisions may originate at one government level and
the budget to implement them at another. In Croatia,
Ethiopia, the Gambia, Latvia, Nepal and the Syrian Arab
Republic, for example, the largest source of capital
funds is the central government, while school
infrastructure decisions are taken at municipal
or provincial levels.
School inspection and supervision occurs at either
national or municipal level in most countries.
The central government is the main source of funding
for primary schools in more than three-quarters of
the countries surveyed. Although financial responsibility
in some countries is located at the level of provinces
(7% of cases) or municipalities (13%), this does
not preclude high levels of central government
involvement. Municipalities are responsible
for operating expenditure in one-third of the countries
surveyed, mostly developed countries or countries
in transition.
Parental involvement in school governance and
management tends to be limited in most countries
to providing additional funding and, particularly in
sub-Saharan Africa, supporting school construction.
While these broad patterns are informative, there is
a need to understand in more detail how decisions are
made, by whom and for what purpose, within a given
context. Decisions are sometimes made at more than
one level and patterns are not static – countries that
have decentralized aspects of service delivery may later
recentralize them. Of particular concern for this Report,
as Chapter 3 highlights, is that the ways in which
decisions are made within a particular context can
significantly affect educational opportunities available
to the poor.
A N N E X
2 5 2
Global and regional patterns in education decision-making

G L O B A L A N D R E G I O N A L PAT T E R N S I N E D U C AT I O N D E C I S I O N - M A K I N G
Ta b l e 1
2 5 3
Box 1: Mapping levels of decision-making in primary education
UNESCO’s International Bureau of Education (UNESCO-IBE) has compiled data for 184 countries on governance,management and financing of formal education,focusing on who makes key decisions. The regionalcompilations of country reports, commissioned for thisReport and available online (www.efareport.unesco.org),were used to develop a database of levels of decision-making and responsibility for primary education in six key areas:
curriculum and learning materials;
teacher training, management and employmentconditions;
school infrastructure;
school supervision and inspection;
financing arrangements;
administration/management.
For each function, the database identifies the levelat which decisions are made, including whether decision-making is shared by multiple levels. Five levelsof decision-making authority are identified: centralgovernment; subnational government (state, province,region or governorate); local government (district,municipality or other locality); school boards or otherschool authorities; and non-state (including the privatesector, non-government organizations, communities andaid donors). Table 1 presented in this Annex presents asummary of some indicators available in the database.
UNESCO-IBE compiled the information for the databasefrom an array of sources, including its own 2006/2007World Data on Education database and 2004 series ofNational Reports, as well as sources such as websites ofministries of education, World Bank public expenditurereviews, regional development bank reports andeducation reports by various international organizations.
14 0 0 0 0 0 144 1 0 0 9 0 143 1 0 0 2 0 6
11 2 0 0 2 0 1517 0 0 0 5 0 22
5 1 0 0 11 0 178 0 0 0 0 0 8
28 1 0 0 0 0 29
90 6 0 0 29 0 125
15 0 0 0 0 0 152 0 0 0 0 0 25 0 0 0 0 0 57 0 1 0 0 0 86 0 0 0 0 0 64 0 0 0 0 0 47 0 0 0 0 0 7
15 0 0 0 0 0 15
61 0 1 0 0 0 62
Table 1: Levels of decision-making in primary education, by function and region, circa 2006/2007
Arab States (20)Central and Eastern Europe (20)Central Asia (9)East Asia and the Pacific (33)Latin America and the Caribbean (41)North America and Western Europe (26)South and West Asia (9)Sub-Saharan Africa (45)
Total
Arab States (20)Central and Eastern Europe (20)Central Asia (9)East Asia and the Pacific (33)Latin America and the Caribbean (41)North America and Western Europe (26)South and West Asia (9)Sub-Saharan Africa (45)
Total
Number ofcountries
in the sampleSchool3Joint
responsibility4 Non-state5Central
governmentSubnationalgovernment1
Localgovernment2
Curriculum and learning materials
Curriculum development/revision
Development of instructional materials

90
02
Education f
or A
ll G
lobal M
onitorin
g R
eport
A N N E X
2 5 4
7 0 0 0 0 0 77 0 0 0 0 0 74 0 1 0 0 0 59 1 0 0 0 0 10
17 0 0 0 2 0 193 2 0 0 0 0 55 0 0 0 0 0 5
16 2 0 0 0 0 18
68 5 1 0 2 0 76
9 0 0 0 0 0 96 0 0 0 1 0 72 0 1 0 0 0 33 0 1 0 0 0 47 1 0 1 0 0 94 2 1 0 1 0 82 0 0 0 0 0 2
15 4 0 0 0 0 19
48 7 3 1 2 0 61
0 3 0 0 0 0 30 0 0 1 0 0 10 0 0 0 0 0 01 0 1 2 0 0 4
10 1 1 0 4 0 162 2 4 0 0 0 82 0 1 0 0 0 3
11 1 2 0 2 0 16
26 7 9 3 6 0 51
3 0 0 0 0 0 34 0 0 0 2 0 60 0 0 0 1 0 11 1 0 0 0 0 2
12 0 1 0 0 0 136 2 0 0 0 0 81 1 0 0 0 0 29 0 0 0 0 0 9
36 4 1 0 3 0 44
5 2 2 0 0 0 90 0 7 0 0 0 70 0 2 0 0 0 21 0 2 0 0 0 34 1 5 0 0 0 100 2 7 0 0 0 90 0 1 0 0 0 13 2 3 0 0 0 8
13 7 29 0 0 0 49
Table 1 (continued)
Arab States (20)Central and Eastern Europe (20)Central Asia (9)East Asia and the Pacific (33)Latin America and the Caribbean (41)North America and Western Europe (26)South and West Asia (9)Sub-Saharan Africa (45)
Total
Arab States (20)Central and Eastern Europe (20)Central Asia (9)East Asia and the Pacific (33)Latin America and the Caribbean (41)North America and Western Europe (26)South and West Asia (9)Sub-Saharan Africa (45)
Total
Arab States (20)Central and Eastern Europe (20)Central Asia (9)East Asia and the Pacific (33)Latin America and the Caribbean (41)North America and Western Europe (26)South and West Asia (9)Sub-Saharan Africa (45)
Total
Arab States (20)Central and Eastern Europe (20)Central Asia (9)East Asia and the Pacific (33)Latin America and the Caribbean (41)North America and Western Europe (26)South and West Asia (9)Sub-Saharan Africa (45)
Total
Arab States (20)Central and Eastern Europe (20)Central Asia (9)East Asia and the Pacific (33)Latin America and the Caribbean (41)North America and Western Europe (26)South and West Asia (9)Sub-Saharan Africa (45)
Total
Number ofcountries
in the sampleSchool3Joint
responsibility4 Non-state5Central
governmentSubnationalgovernment1
Localgovernment2
Teachers
Teacher training
In-service training
Teacher management (recruitment, appointment, dismissal, deployment, promotion, transfer, discipline)
Establishment of teacher salary levels and other conditions of service (allowances, vacations, promotions)
Infrastructure
Establishment/opening and closure of schools, school mapping

G L O B A L A N D R E G I O N A L PAT T E R N S I N E D U C AT I O N D E C I S I O N - M A K I N G
Ta b l e 1
2 5 5
Table 1 (continued)
2 1 6 0 0 0 95 0 5 0 0 0 100 0 0 0 0 0 02 0 2 0 0 0 4
11 0 2 0 0 0 133 1 3 0 0 0 70 1 1 0 0 0 29 2 8 0 1 0 20
32 5 27 0 1 0 65
15 0 0 0 0 0 159 1 6 0 0 0 162 0 6 0 0 0 8
14 2 0 0 0 1 1720 1 0 0 1 0 2211 4 4 0 0 0 19
4 1 0 0 0 0 524 0 0 0 0 0 24
99 9 16 0 1 1 126
6 0 1 0 0 0 72 0 3 0 0 0 50 0 0 0 0 0 01 0 2 3 0 1 76 0 0 0 2 0 82 0 8 0 0 0 102 1 0 0 0 1 46 0 0 0 0 5 11
25 1 14 3 2 7 52
5 0 0 0 0 0 58 0 1 0 0 0 90 0 0 0 0 0 04 1 0 0 0 0 5
16 1 0 0 0 0 176 4 1 1 0 0 123 1 0 0 0 0 4
22 0 1 0 0 0 23
64 7 3 1 0 0 75
5 0 1 0 0 0 61 0 8 0 0 0 90 0 0 0 0 0 01 0 1 3 0 0 5
10 0 1 0 0 0 112 0 6 1 0 0 90 1 0 0 0 0 1
10 0 0 0 0 2 12
29 1 17 4 0 2 53
Arab States (20)Central and Eastern Europe (20)Central Asia (9)East Asia and the Pacific (33)Latin America and the Caribbean (41)North America and Western Europe (26)South and West Asia (9)Sub-Saharan Africa (45)
Total
Arab States (20)Central and Eastern Europe (20)Central Asia (9)East Asia and the Pacific (33)Latin America and the Caribbean (41)North America and Western Europe (26)South and West Asia (9)Sub-Saharan Africa (45)
Total
Arab States (20)Central and Eastern Europe (20)Central Asia (9)East Asia and the Pacific (33)Latin America and the Caribbean (41)North America and Western Europe (26)South and West Asia (9)Sub-Saharan Africa (45)
Total
Arab States (20)Central and Eastern Europe (20)Central Asia (9)East Asia and the Pacific (33)Latin America and the Caribbean (41)North America and Western Europe (26)South and West Asia (9)Sub-Saharan Africa (45)
Total
Arab States (20)Central and Eastern Europe (20)Central Asia (9)East Asia and the Pacific (33)Latin America and the Caribbean (41)North America and Western Europe (26)South and West Asia (9)Sub-Saharan Africa (45)
Total
Number ofcountries
in the sampleSchool3Joint
responsibility4 Non-state5Central
governmentSubnationalgovernment1
Localgovernment2
Supervision
School supervision/inspection practices6
Financing arrangements7
General
Capital expenditure
Personnel expenditure
Current or operating expenditure
1. State, province, region or governorate.
2. District, municipality or other locality.
3. School authorities or school boards.
4. Only where explicitlyindicated.
5. Private sector, non-government organizations,communities, aid donors and other non-state entities.
6. Supervision/inspectionpractices, unlike standards,imply direct involvement of schools.
7. Indicates the level providingthe largest share of funding.
Sources: UNESCO-IBE (2008a,2008b, 2008c, 2008d, 2008e,2008f, 2008g, 2008h).

90
02
Education f
or A
ll G
lobal M
onitorin
g R
eport
The most recent data on pupils, students,
teachers and expenditure presented in these
statistical tables are for the school year ending
in 2006.1 They are based on survey results
reported to and processed by the UNESCO
Institute for Statistics (UIS) before the end of May 2008.
Data received and processed after this date will be used
in the next EFA Global Monitoring Report. A small
number of countries2 submitted data for the school year
ending in 2007, presented in bold in the statistical tables.
These statistics refer to all formal schools, both public
and private, by level of education. They are supplemented
by demographic and economic statistics collected or
produced by other international organizations, including
the United Nations Development Programme (UNDP),
the United Nations Children’s Fund (UNICEF), the United
Nations Population Division (UNPD) and the World Bank.
A total of 204 countries and territories are listed in the
statistical tables.3 Most of them report their data to the
UIS using standard questionnaires issued by the Institute.
For some countries, however, education data are
collected via surveys carried out under the auspices
of the World Education Indicators (WEI) or are provided
by the Organisation for Economic Co-operation and
Development (OECD) and the Statistical Office of
the European Communities (Eurostat).
Population
The indicators on school access and participation in the
statistical tables were calculated using the 2006 revision
of population estimates produced by the UNPD. Because
of possible differences between national population
estimates and those of the United Nations, these
indicators may differ from those published by individual
countries or by other organizations.4 The UNPD does
not provide data by single year of age for countries with
a total population of fewer than 80,000. Where no UNPD
estimates exist, national population figures, when
available, or estimates from the UIS were used to
calculate enrolment ratios.
ISCED classification
Education data reported to the UIS are in conformity
with the 1997 revision of the International Standard
Classification of Education (ISCED). In some cases,
data have been adjusted to comply with the ISCED97
classification. Data for the school year ending in 1991
may conform to the previous version of the classification,
ISCED76, and therefore may not be comparable in some
countries with those for years after 1997. ISCED is used
to harmonize data and introduce more international
comparability among national education systems.
Countries may have their own definitions of education
levels that do not correspond to ISCED. Some differences
between nationally and internationally reported enrolment
ratios may be due, therefore, to the use of these
nationally defined education levels rather than the ISCED
standard, in addition to the population issue raised above.
Adult participation in basic education
ISCED does not classify education programmes by
participants’ age. For example, any programme with
a content equivalent to primary education, or ISCED 1,
may be classed as ISCED 1 even if provided to adults.
The guidance the UIS provides for respondents to its
regular annual education survey, on the other hand, asks
countries to exclude ‘data on programmes designed for
people beyond regular school age’. As for the guidance
for the UIS/OECD/Eurostat (UOE) and WEI questionnaires,
until 2005 it stated that ‘activities classified as “continuing”,
“adult” or “non-formal” education should be included’
if they ‘involve studies with subject content similar to
regular educational programmes’ or if ‘the underlying
A N N E X
2 5 6
Statistical tables*
Introduction
1. This means 2005/2006 for countries with a school year that overlapstwo calendar years and 2006 for those with a calendar school year.
2. Egypt, Ethiopia, Ghana, Kazakhstan, the Marshall Islands, the FederatedStates of Micronesia, Nauru, the Republic of Korea, Saint Kitts and Nevis,Saint Vincent and the Grenadines, Sao Tome and Principe, Serbia, Seychelles,Sierra Leone, the United Republic of Tanzania, Uzbekistan and Vanuatu.
3. Serbia and Montenegro are now presented separately as two independent entities.
4. Where obvious inconsistencies exist between enrolment reported by countriesand the United Nations population data, the UIS may decide to not calculate or publish the enrolment ratios. This is the case, for example, with China, publicationof whose NER is suspended pending further review of the population data.
* For more detailed statistics and indicators, please consult the website: www.efareport.unesco.org

programmes lead to similar potential qualifications’
as do the regular programmes. Since 2005, however,
the countries involved in the UOE/WEI survey have been
requested to report data for such programmes separately
so that the UIS can exclude them when calculating
internationally comparable indicators. Despite the UIS
instructions, data from countries in the annual survey
may still include pupils who are substantially above
the official age for basic education.
Literacy data
UNESCO has long defined literacy as the ability to read
and write, with understanding, a short simple statement
related to one’s daily life. However, a parallel definition
arose with the introduction in 1978 of the notion of
functional literacy. A definition approved in the UNESCO
General Conference that year stated that a person was
considered functionally literate who could engage in all
activities in which literacy is required for effective
functioning of his or her group and community, and also
for enabling him or her to continue to use reading, writing
and calculation for his or her own and the community’s
development.
In many cases, the current UIS literacy statistics rely on
the first definition and are largely based on data sources
that use a ‘self-declaration’ method: respondents are
asked whether they and the members of their household
are literate, as opposed to being asked a more
comprehensive question or to demonstrate the skill.
Some countries assume that persons who complete a
certain level of education are literate.5 As definitions and
methodologies used for data collection differ by country,
data need to be used with caution.
Literacy data in this report cover adults aged 15 and over
as well as youth aged 15 to 24. They refer to two periods,
1985–1994 and 2000–2006. Data for the first period are
mostly based on observed information obtained from
national censuses and surveys taken during that period.
For the second period, most of the literacy data in the
table are UIS estimates. They refer to 2006 and are based
on the most recent observed national data. For countries
indicated with an asterisk (*), for which estimates could
not be made, national observed literacy data are used.
The reference years and literacy definitions for each
country are presented in a longer version of this
introduction, posted on the EFA Global Monitoring Report
website. Both UIS estimates and projections to 2015
presented in the literacy statistical table are produced
using the Global Age-specific Literacy Projections Model.
For a description of the projection methodology, see
p. 261 of the EFA Global Monitoring Report 2006, as well
as Global Age-specific Literacy Projections Model (GALP):
Rationale, Methodology and Software, available at
www.uis.unesco.org/TEMPLATE/pdf/Literacy/GALP.pdf.
In many countries, interest in assessing the literacy skills
of the population is growing. In response to this interest,
the UIS has developed a methodology and data collection
instrument called the Literacy Assessment and
Monitoring Programme (LAMP). Following the example
of the International Adult Literacy Survey (IALS), LAMP
is based on the actual, functional assessment of literacy
skills. It aims to provide literacy data of higher quality and
is based on the concept of a continuum of literacy skills
rather than the common literate/illiterate dichotomy.
Estimates and missing data
Both actual and estimated education data are presented
throughout the statistical tables. When data are not
reported to the UIS using the standard questionnaires,
estimates are often necessary. Wherever possible, the
UIS encourages countries to make their own estimates,
which are presented as national estimates. Where this
does not happen, the UIS may make its own estimates
if sufficient supplementary information is available.
Gaps in the tables may also arise where data submitted
by a country are found to be inconsistent. The UIS makes
every attempt to resolve such problems with the
countries concerned, but reserves the final decision
to omit data it regards as problematic.
To fill the gaps in the statistical tables, data for previous
school years were included when information for the
school year ending in 2006 was not available. Such cases
are indicated by a footnote.
Data processing timetable
The timetable for collection and publication of data
used in this report was as follows.
June 2006 (or December 2006 for some countries with
a calendar school year): the final school year in the
data collection period ended.
November 2006 and June 2007: questionnaires were
sent to countries whose data are collected directly either
by the UIS or through the WEI and UOE questionnaires,
with data submission deadlines of 31 March 2007,
1 August 2007 and 30 September 2007, respectively.
S TAT I S T I C A L TA B L E S
I n t r o d u c t i o n
2 5 7
5. For reliability and consistency reasons, the UIS has decided no longer topublish literacy data based on educational attainment proxies. Only data reportedby countries based on the ‘self-declaration method’ and ‘household declaration’are included in the statistical tables. However, in the absence of such data,educational attainment proxies are used to calculate the EDI for some countries,particularly developed ones.

90
02
Education f
or A
ll G
lobal M
onitorin
g R
eport
June 2007: after sending reminders by e-mail, fax,
phone and/or post, the UIS began to process data and
calculate indicators.
September 2007: estimation was done for missing data.
October 2007: provisional statistical tables were
produced and draft indicators sent to member states
for their review.
End February 2008: the first draft of statistical tables
was produced for the EFA Global Monitoring Report.
April 2008: the final statistical tables were sent
to the Report team.
Regional averages
Regional figures for literacy rates, gross intake rates,
gross and net enrolment ratios, school life expectancy
and pupil/teacher ratios are weighted averages, taking
into account the relative size of the relevant population
of each country in each region. The averages are derived
from both published data and broad estimates for
countries for which no reliable publishable data are
available.
The figures for the countries with larger populations thus
have a proportionately greater influence on the regional
aggregates. Where not enough reliable data are available
to produce an overall weighted mean, a median figure
is calculated for countries with available data only.
Capped figures
There are cases where an indicator theoretically should
not exceed 100 (the NER, for example), but data
inconsistencies may have resulted nonetheless in the
indicator exceeding the theoretical limit. In these cases
the indicator is ‘capped’ at 100 but the gender balance is
maintained: the higher value, whether for male or female,
is set equal to 100 and the other two values – the lower
of male or female plus the figure for both sexes –
are then recalculated so that the gender parity index
for the capped figures is the same as that for the
uncapped figures.
Footnotes to the tables, along with the glossary following
the statistical tables, provide additional help in
interpreting the data and information.
Symbols used in the statistical tables(printed and web versions)
* National estimate
** UIS estimate
… Missing data
— Magnitude nil or negligible
. Category not applicable
./. Data included under another category
Composition of regions
World classification6
Countries in transition (12):
Countries of the Commonwealth of Independent States,
including 4 in Central and Eastern Europe (Belarus,
Republic of Moldova, Russian Federationw, Ukraine)
and the countries of Central Asia minus Mongolia.
Developed countries (44):
North America and Western Europe (minus Cypruso
and Israelo); Central and Eastern Europe (minus
Belarus, the Republic of Moldova, the Russian
Federationw, Turkeyo and Ukraine); Australiao,
Bermuda, Japano and New Zealando.
Developing countries (148):
Arab States; East Asia and the Pacific (minus
Australiao, Japano and New Zealando); Latin America
and the Caribbean (minus Bermuda); South and West
Asia; sub-Saharan Africa; Cypruso, Israelo, Mongolia
and Turkeyo.
EFA regions
Arab States (20 countries/territories)
Algeria, Bahrain, Djibouti, Egyptw, Iraq, Jordanw,
Kuwait, Lebanon, Libyan Arab Jamahiriya, Mauritania,
Morocco, Oman, Palestinian Autonomous Territories,
Qatar, Saudi Arabia, Sudan, Syrian Arab Republic,
Tunisiaw, United Arab Emirates and Yemen.
Central and Eastern Europe (21 countries)
Albaniao, Belarus, Bosnia and Herzegovinao, Bulgariao,
Croatia, Czech Republico, Estoniao, Hungaryo, Latviao,
Lithuaniao, Montenegro, Polando, Republic of Moldova,
Romaniao, Russian Federationw, Serbia, Slovakia,
Sloveniao, The former Yugoslav Republic of Macedoniao,
Turkeyo and Ukraine.
A N N E X
2 5 8
6. This is a United Nations Statistical Division country classification revised in 2004.

Central Asia (9 countries)
Armenia, Azerbaijan, Georgia, Kazakhstan, Kyrgyzstan,
Mongolia, Tajikistan, Turkmenistan and Uzbekistan.
East Asia and the Pacific (33 countries/ territories)
Australiao, Brunei Darussalam, Cambodia, Chinaw,
Cook Islands, Democratic People’s Republic of Korea,
Fiji, Indonesiaw, Japano, Kiribati, Lao People’s
Democratic Republic, Macao (China), Malaysiaw,
Marshall Islands, Micronesia (Federated States of),
Myanmar, Nauru, New Zealando, Niue, Palau, Papua
New Guinea, Philippinesw, Republic of Koreao, Samoa,
Singapore, Solomon Islands, Thailandw, Timor-Leste,
Tokelau, Tonga, Tuvalu, Vanuatu and Viet Nam.
East Asia (16 countries/territories)
Brunei Darussalam, Cambodia, Chinaw, Democratic
People’s Republic of Korea, Indonesiaw, Japano,
Lao People’s Democratic Republic, Macao (China),
Malaysiaw, Myanmar, Philippinesw, Republic of Koreao,
Singapore, Thailandw, Timor-Leste and Viet Nam.
Pacific (17 countries/territories)
Australiao, Cook Islands, Fiji, Kiribati, Marshall Islands,
Micronesia (Federated States of), Nauru, New Zealando,
Niue, Palau, Papua New Guinea, Samoa, Solomon
Islands, Tokelau, Tonga, Tuvalu and Vanuatu.
Latin America and the Caribbean
(41 countries/territories)
Anguilla, Antigua and Barbuda, Argentinaw, Aruba,
Bahamas, Barbados, Belize, Bermuda, Bolivia, Brazilw,
British Virgin Islands, Cayman Islands, Chilew,
Colombia, Costa Rica, Cuba, Dominica, Dominican
Republic, Ecuador, El Salvador, Grenada, Guatemala,
Guyana, Haiti, Honduras, Jamaicaw, Mexicoo,
Montserrat, Netherlands Antilles, Nicaragua, Panama,
Paraguayw, Peruw, Saint Kitts and Nevis, Saint Lucia,
Saint Vincent and the Grenadines, Suriname, Trinidad
and Tobago, Turks and Caicos Islands, Uruguayw
and the Bolivarian Republic of Venezuela.
Caribbean (22 countries/territories)
Anguilla, Antigua and Barbuda, Aruba, Bahamas,
Barbados, Belize, Bermuda, British Virgin Islands,
Cayman Islands, Dominica, Grenada, Guyana, Haiti,
Jamaicaw, Montserrat, Netherlands Antilles,
Saint Kitts and Nevis, Saint Lucia, Saint Vincent
and the Grenadines, Suriname, Trinidad and Tobago,
and Turks and Caicos Islands.
Latin America (19 countries)
Argentinaw, Bolivia, Brazilw, Chilew, Colombia,
Costa Rica, Cuba, Dominican Republic, Ecuador,
El Salvador, Guatemala, Honduras, Mexicoo,
Nicaragua, Panama, Paraguayw, Peruw, Uruguayw
and the Bolivarian Republic of Venezuela.
North America and Western Europe
(26 countries/territories)
Andorra, Austriao, Belgiumo, Canadao, Cypruso,
Denmarko, Finlando, Franceo, Germanyo, Greeceo,
Icelando, Irelando, Israelo, Italyo, Luxembourgo,
Maltao, Monaco, Netherlandso, Norwayo, Portugalo,
San Marino, Spaino, Swedeno, Switzerlando,
United Kingdomo and United Stateso.
South and West Asia (9 countries)
Afghanistan, Bangladesh, Bhutan, Indiaw, Islamic
Republic of Iran, Maldives, Nepal, Pakistan
and Sri Lankaw.
Sub-Saharan Africa (45 countries)
Angola, Benin, Botswana, Burkina Faso, Burundi,
Cameroon, Cape Verde, Central African Republic, Chad,
Comoros, Congo, Côte d’Ivoire, Democratic Republic
of the Congo, Equatorial Guinea, Eritrea, Ethiopia,
Gabon, Gambia, Ghana, Guinea, Guinea-Bissau, Kenya,
Lesotho, Liberia, Madagascar, Malawi, Mali, Mauritius,
Mozambique, Namibia, Niger, Nigeria, Rwanda,
Sao Tome and Principe, Senegal, Seychelles, Sierra
Leone, Somalia, South Africa, Swaziland, Togo, Uganda,
United Republic of Tanzania, Zambia and Zimbabwew.
o Countries whose education data are collected
through UOE questionnaires
w WEI project countries
Least developed countries (50 countries)7
Afghanistan, Angola, Bangladesh, Benin, Bhutan,
Burkina Faso, Burundi, Cambodia, Cape Verde,
Central African Republic, Chad, Comoros, Democratic
Republic of the Congo, Djibouti, Equatorial Guinea,
Eritrea, Ethiopia, Gambia, Guinea, Guinea-Bissau,
Haiti, Kiribati, Lao People’s Democratic Republic,
Lesotho, Liberia, Madagascar, Malawi, Maldives, Mali,
Mauritania, Mozambique, Myanmar, Nepal, Niger,
Rwanda, Samoa, Sao Tome and Principe, Senegal,
Sierra Leone, Solomon Islands, Somalia, Sudan,
Timor-Leste, Togo, Tuvalu, Uganda, United Republic
of Tanzania, Vanuatu, Yemen and Zambia.
S TAT I S T I C A L TA B L E S
I n t r o d u c t i o n
2 5 9
7. Fifty countries are currently designated by the United Nations as ‘leastdeveloped countries’ (LDCs). The list of LDCs is reviewed every three years by theEconomic and Social Council of the United Nations, in the light of recommendationsmade by the Committee for Development Policy. The LDCs grouping is notpresented in the statistical tables but is discussed in the main text.

AlgeriaBahrainDjiboutiEgyptIraqJordanKuwaitLebanonLibyan Arab JamahiriyaMauritaniaMoroccoOmanPalestinian A. T.QatarSaudi ArabiaSudanSyrian Arab RepublicTunisiaUnited Arab EmiratesYemen
AlbaniaBelarusBosnia and HerzegovinaBulgariaCroatiaCzech RepublicEstoniaHungaryLatviaLithuaniaMontenegroPolandRepublic of MoldovaRomaniaRussian FederationSerbiaSlovakiaSloveniaTFYR MacedoniaTurkeyUkraine
ArmeniaAzerbaijanGeorgiaKazakhstanKyrgyzstanMongoliaTajikistanTurkmenistanUzbekistan
AustraliaBrunei DarussalamCambodiaChina
33 351 1.5 1.7 72 71 74 2.4 0.1 29 …
739 1.8 -0.4 76 74 77 2.3 … … …
819 1.7 0.3 55 54 56 3.9 3.1 58 574 166 1.8 0.9 71 69 74 2.9 … 29 …
28 506 1.8 0.0 60 58 61 4.3 … … …
5 729 3.0 1.6 73 71 74 3.1 … … …
2 779 2.4 2.3 78 76 80 2.2 … … …
4 055 1.1 0.0 72 70 74 2.2 0.1 <33 …
6 039 2.0 1.5 74 72 77 2.7 … … …
3 044 2.5 1.2 64 62 66 4.4 0.8 28 330 853 1.2 1.0 71 69 73 2.4 0.1 28 …
2 546 2.0 1.2 76 74 77 3.0 … … …
3 889 3.2 1.7 73 72 75 5.1 … … …
821 2.1 1.6 76 75 76 2.7 … … …
24 175 2.2 1.4 73 71 75 3.4 … … …
37 707 2.2 0.8 59 57 60 4.2 1.4 59 …
19 408 2.5 1.6 74 72 76 3.1 … … …
10 215 1.1 0.8 74 72 76 1.9 0.1 28 …
4 248 2.8 3.4 79 77 81 2.3 … … …
21 732 3.0 2.7 63 61 64 5.5 … … …
3 172 0.6 0.0 76 73 80 2.1 … … …
9 742 -0.6 -0.3 69 63 75 1.2 0.2 30 …
3 926 0.1 -3.1 75 72 77 1.2 <0.1 … …
7 693 -0.7 -0.4 73 69 77 1.3 … … …
4 556 -0.1 -0.2 76 72 79 1.3 <0.1 … …
10 189 0.0 0.4 76 73 80 1.2 … <33 …
1 340 -0.3 1.7 71 66 77 1.5 1.3 24 …
10 058 -0.3 -0.7 73 69 77 1.3 0.1 <30 …
2 289 -0.5 0.8 73 67 78 1.3 0.8 27 …
3 408 -0.5 -0.2 73 67 78 1.3 0.1 <45 …
601 -0.3 0.5 75 72 77 1.8 … … …
38 140 -0.2 0.2 76 71 80 1.2 0.1 29 …
3 833 -0.9 -0.8 69 65 72 1.4 0.4 30 …
21 532 -0.4 -0.8 72 69 76 1.3 0.1 50 …
143 221 -0.5 1.1 65 59 73 1.3 1.1 26 …
9 851 0.1 0.8 74 72 76 1.8 0.1 28 …
5 388 0.0 0.6 75 71 79 1.3 <0.1 … …
2 001 0.0 0.2 78 74 82 1.3 <0.1 … …
2 036 0.1 -1.7 74 72 77 1.4 <0.1 … …
73 922 1.3 0.3 72 69 74 2.1 … … …
46 557 -0.8 1.0 68 62 74 1.2 1.6 44 …
3 010 -0.2 2.1 72 68 75 1.4 0.1 <42 …
8 406 0.8 3.3 67 64 71 1.8 0.2 17 …
4 433 -0.8 -1.5 71 67 75 1.4 0.1 <37 …
15 314 0.7 4.2 67 62 72 2.3 0.1 28 …
5 259 1.1 1.9 66 62 70 2.5 0.1 26 …
2 605 1.0 -0.2 67 64 70 1.9 0.1 <20 …
6 640 1.5 0.1 67 64 69 3.3 0.3 21 …
4 899 1.3 0.5 63 59 68 2.5 <0.1 … …
26 981 1.4 0.6 67 64 70 2.5 0.1 29 …
20 530 1.0 0.5 81 79 84 1.8 0.2 7 …
382 2.1 0.3 77 75 80 2.3 … … …
14 197 1.7 1.2 60 57 62 3.2 0.8 29 …
1 320 864 0.6 -0.1 73 71 75 1.7 0.1 29 …
90
02
Education f
or A
ll G
lobal M
onitorin
g R
eport
A N N E X
Table 1Background statistics
DEMOGRAPHY1 HIV/AIDS2
2006 2005-2010 2005-2010Total TotalMale Female
2005-2010 20072007 2007
Total population
(000)
Averageannual growth
rate (%) total
population
2005-2010
Average annual growth
rate (%) age 0-4
population
Life expectancy at birth (years)
Total fertility rate
(children per woman)
% of womenamong people
(age 15+) living with HIV
HIV prevalence
rate (%) in adults (15-49)
Orphansdue to AIDS
(000)
Country or territory
Arab States
Central and Eastern Europe
Central Asia
East Asia and the Pacific
2 6 0
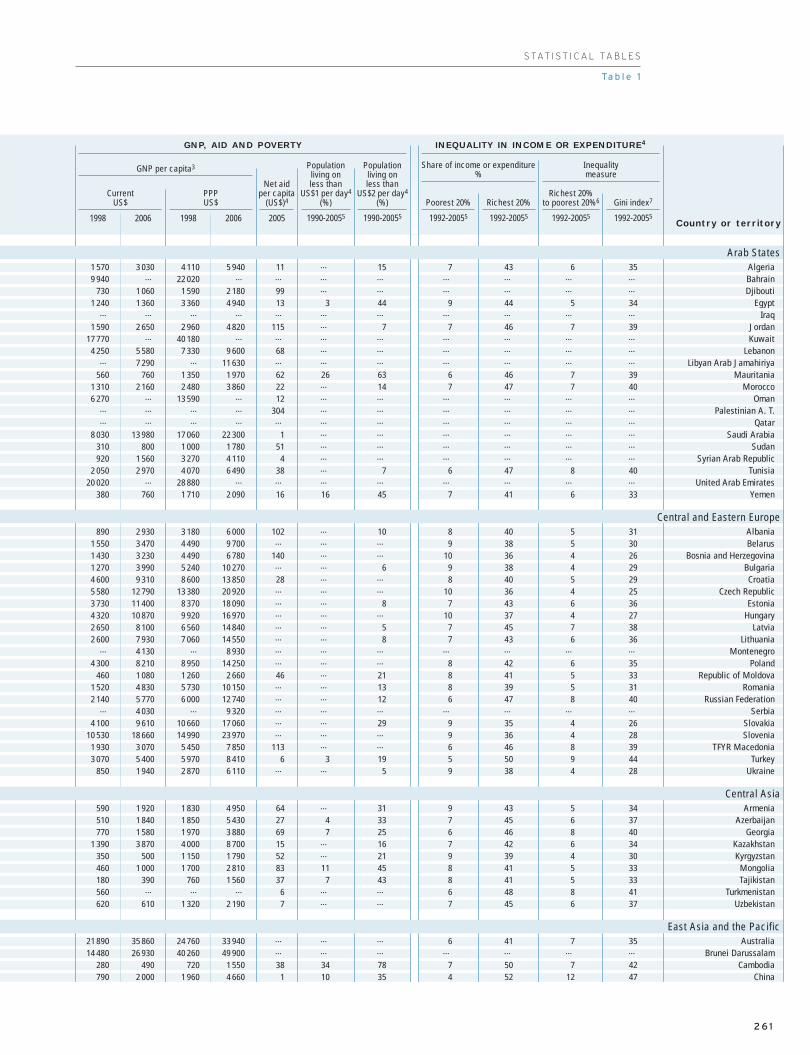
AlgeriaBahrainDjibouti
EgyptIraq
JordanKuwait
LebanonLibyan Arab Jamahiriya
MauritaniaMorocco
OmanPalestinian A. T.
QatarSaudi Arabia
SudanSyrian Arab Republic
TunisiaUnited Arab Emirates
Yemen
AlbaniaBelarus
Bosnia and HerzegovinaBulgariaCroatia
Czech RepublicEstonia
HungaryLatvia
LithuaniaMontenegro
PolandRepublic of Moldova
RomaniaRussian Federation
SerbiaSlovakiaSlovenia
TFYR MacedoniaTurkey
Ukraine
ArmeniaAzerbaijan
GeorgiaKazakhstanKyrgyzstan
MongoliaTajikistan
TurkmenistanUzbekistan
AustraliaBrunei Darussalam
CambodiaChina
1 570 3 030 4 110 5 940 11 … 15 7 43 6 359 940 … 22 020 … … … … … … … …
730 1 060 1 590 2 180 99 … … … … … …
1 240 1 360 3 360 4 940 13 3 44 9 44 5 34… … … … … … … … … … …
1 590 2 650 2 960 4 820 115 … 7 7 46 7 3917 770 … 40 180 … … … … … … … …
4 250 5 580 7 330 9 600 68 … … … … … …… 7 290 … 11 630 … … … … … … …
560 760 1 350 1 970 62 26 63 6 46 7 391 310 2 160 2 480 3 860 22 … 14 7 47 7 406 270 … 13 590 … 12 … … … … … …
… … … … 304 … … … … … …… … … … … … … … … … …
8 030 13 980 17 060 22 300 1 … … … … … …
310 800 1 000 1 780 51 … … … … … …
920 1 560 3 270 4 110 4 … … … … … …
2 050 2 970 4 070 6 490 38 … 7 6 47 8 4020 020 … 28 880 … … … … … … … …
380 760 1 710 2 090 16 16 45 7 41 6 33
890 2 930 3 180 6 000 102 … 10 8 40 5 311 550 3 470 4 490 9 700 … … … 9 38 5 301 430 3 230 4 490 6 780 140 … … 10 36 4 261 270 3 990 5 240 10 270 … … 6 9 38 4 294 600 9 310 8 600 13 850 28 … … 8 40 5 295 580 12 790 13 380 20 920 … … … 10 36 4 253 730 11 400 8 370 18 090 … … 8 7 43 6 364 320 10 870 9 920 16 970 … … … 10 37 4 272 650 8 100 6 560 14 840 … … 5 7 45 7 382 600 7 930 7 060 14 550 … … 8 7 43 6 36
… 4 130 … 8 930 … … … … … … …
4 300 8 210 8 950 14 250 … … … 8 42 6 35460 1 080 1 260 2 660 46 … 21 8 41 5 33
1 520 4 830 5 730 10 150 … … 13 8 39 5 312 140 5 770 6 000 12 740 … … 12 6 47 8 40
… 4 030 … 9 320 … … … … … … …
4 100 9 610 10 660 17 060 … … 29 9 35 4 2610 530 18 660 14 990 23 970 … … … 9 36 4 28
1 930 3 070 5 450 7 850 113 … … 6 46 8 393 070 5 400 5 970 8 410 6 3 19 5 50 9 44
850 1 940 2 870 6 110 … … 5 9 38 4 28
590 1 920 1 830 4 950 64 … 31 9 43 5 34510 1 840 1 850 5 430 27 4 33 7 45 6 37770 1 580 1 970 3 880 69 7 25 6 46 8 40
1 390 3 870 4 000 8 700 15 … 16 7 42 6 34350 500 1 150 1 790 52 … 21 9 39 4 30460 1 000 1 700 2 810 83 11 45 8 41 5 33180 390 760 1 560 37 7 43 8 41 5 33560 … … … 6 … … 6 48 8 41620 610 1 320 2 190 7 … … 7 45 6 37
21 890 35 860 24 760 33 940 … … … 6 41 7 3514 480 26 930 40 260 49 900 … … … … … … …
280 490 720 1 550 38 34 78 7 50 7 42790 2 000 1 960 4 660 1 10 35 4 52 12 47
S TAT I S T I C A L TA B L E S
Ta b l e 1
GNP, AID AND POVERTY INEQUALITY IN INCOME OR EXPENDITURE4
1998 2006 1998 2006 2005 1990-20055 1990-20055 1992-20055 1992-20055 1992-20055
CurrentUS$
GNP per capita3 Share of income or expenditure%
Inequalitymeasure
PPPUS$
Net aid per capita
(US$)4
Populationliving on less than
US$1 per day4
(%)
Populationliving on less than
US$2 per day4
(%) Poorest 20% Richest 20%Richest 20%
to poorest 20%6 Gini index7
Country or territory1992-20055
Arab States
Central and Eastern Europe
Central Asia
East Asia and the Pacific
2 6 1
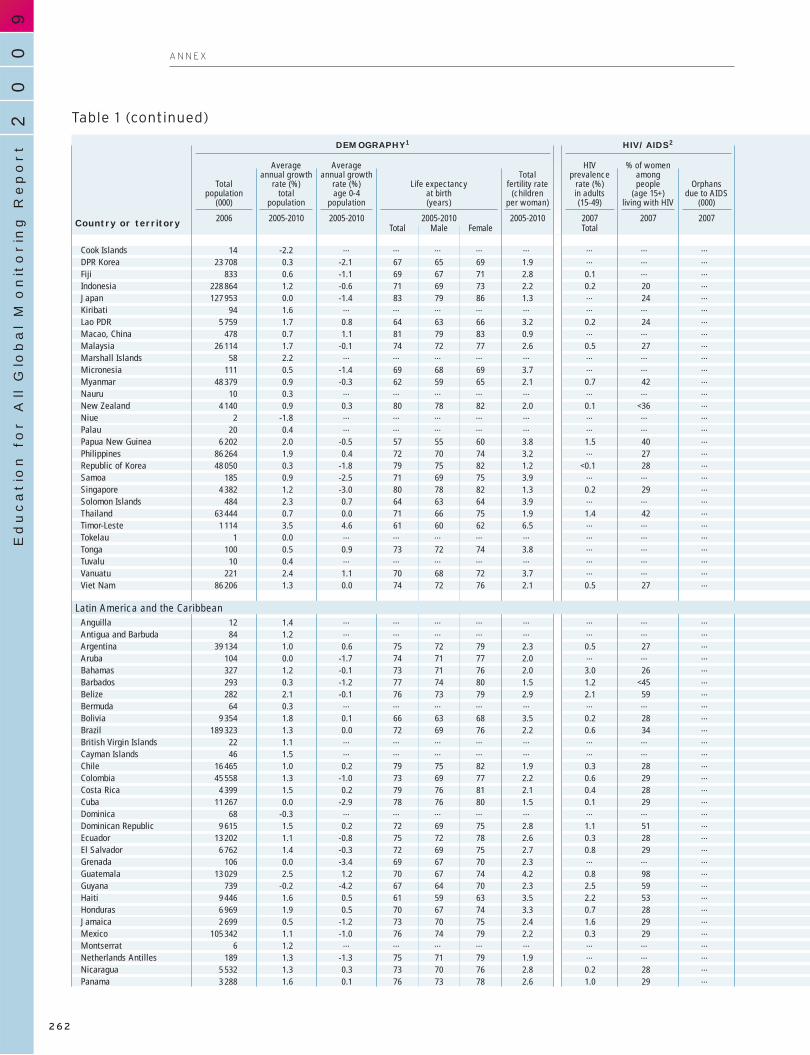
Cook IslandsDPR KoreaFijiIndonesiaJapanKiribatiLao PDRMacao, ChinaMalaysiaMarshall IslandsMicronesiaMyanmarNauruNew ZealandNiuePalauPapua New GuineaPhilippinesRepublic of KoreaSamoaSingaporeSolomon IslandsThailandTimor-LesteTokelauTongaTuvaluVanuatuViet Nam
AnguillaAntigua and BarbudaArgentinaArubaBahamasBarbadosBelizeBermudaBoliviaBrazilBritish Virgin IslandsCayman IslandsChileColombiaCosta RicaCubaDominicaDominican RepublicEcuadorEl SalvadorGrenadaGuatemalaGuyanaHaitiHondurasJamaicaMexicoMontserratNetherlands AntillesNicaraguaPanama
14 -2.2 … … … … … … … …
23 708 0.3 -2.1 67 65 69 1.9 … … …
833 0.6 -1.1 69 67 71 2.8 0.1 … …
228 864 1.2 -0.6 71 69 73 2.2 0.2 20 …
127 953 0.0 -1.4 83 79 86 1.3 … 24 …
94 1.6 … … … … … … … …
5 759 1.7 0.8 64 63 66 3.2 0.2 24 …
478 0.7 1.1 81 79 83 0.9 … … …
26 114 1.7 -0.1 74 72 77 2.6 0.5 27 …
58 2.2 … … … … … … … …
111 0.5 -1.4 69 68 69 3.7 … … …
48 379 0.9 -0.3 62 59 65 2.1 0.7 42 …
10 0.3 … … … … … … … …
4 140 0.9 0.3 80 78 82 2.0 0.1 <36 …
2 -1.8 … … … … … … … …
20 0.4 … … … … … … … …
6 202 2.0 -0.5 57 55 60 3.8 1.5 40 …
86 264 1.9 0.4 72 70 74 3.2 … 27 …
48 050 0.3 -1.8 79 75 82 1.2 <0.1 28 …
185 0.9 -2.5 71 69 75 3.9 … … …
4 382 1.2 -3.0 80 78 82 1.3 0.2 29 …
484 2.3 0.7 64 63 64 3.9 … … …
63 444 0.7 0.0 71 66 75 1.9 1.4 42 …
1 114 3.5 4.6 61 60 62 6.5 … … …
1 0.0 … … … … … … … …
100 0.5 0.9 73 72 74 3.8 … … …
10 0.4 … … … … … … … …
221 2.4 1.1 70 68 72 3.7 … … …
86 206 1.3 0.0 74 72 76 2.1 0.5 27 …
12 1.4 … … … … … … … …
84 1.2 … … … … … … … …
39 134 1.0 0.6 75 72 79 2.3 0.5 27 …
104 0.0 -1.7 74 71 77 2.0 … … …
327 1.2 -0.1 73 71 76 2.0 3.0 26 …
293 0.3 -1.2 77 74 80 1.5 1.2 <45 …
282 2.1 -0.1 76 73 79 2.9 2.1 59 …
64 0.3 … … … … … … … …
9 354 1.8 0.1 66 63 68 3.5 0.2 28 …
189 323 1.3 0.0 72 69 76 2.2 0.6 34 …
22 1.1 … … … … … … … …
46 1.5 … … … … … … … …
16 465 1.0 0.2 79 75 82 1.9 0.3 28 …
45 558 1.3 -1.0 73 69 77 2.2 0.6 29 …
4 399 1.5 0.2 79 76 81 2.1 0.4 28 …
11 267 0.0 -2.9 78 76 80 1.5 0.1 29 …
68 -0.3 … … … … … … … …
9 615 1.5 0.2 72 69 75 2.8 1.1 51 …
13 202 1.1 -0.8 75 72 78 2.6 0.3 28 …
6 762 1.4 -0.3 72 69 75 2.7 0.8 29 …
106 0.0 -3.4 69 67 70 2.3 … … …
13 029 2.5 1.2 70 67 74 4.2 0.8 98 …
739 -0.2 -4.2 67 64 70 2.3 2.5 59 …
9 446 1.6 0.5 61 59 63 3.5 2.2 53 …
6 969 1.9 0.5 70 67 74 3.3 0.7 28 …
2 699 0.5 -1.2 73 70 75 2.4 1.6 29 …
105 342 1.1 -1.0 76 74 79 2.2 0.3 29 …
6 1.2 … … … … … … … …
189 1.3 -1.3 75 71 79 1.9 … … …
5 532 1.3 0.3 73 70 76 2.8 0.2 28 …
3 288 1.6 0.1 76 73 78 2.6 1.0 29 …
DEMOGRAPHY1 HIV/AIDS2
2006 2005-2010 2005-2010Total TotalMale Female
2005-2010 20072007 2007
Total population
(000)
Averageannual growth
rate (%) total
population
2005-2010
Average annual growth
rate (%) age 0-4
population
Life expectancy at birth (years)
Total fertility rate
(children per woman)
% of womenamong people
(age 15+) living with HIV
HIV prevalence
rate (%) in adults (15-49)
Orphansdue to AIDS
(000)
Country or territory
Latin America and the Caribbean
90
02
Education f
or A
ll G
lobal M
onitorin
g R
eport
A N N E X
Table 1 (continued)
2 6 2
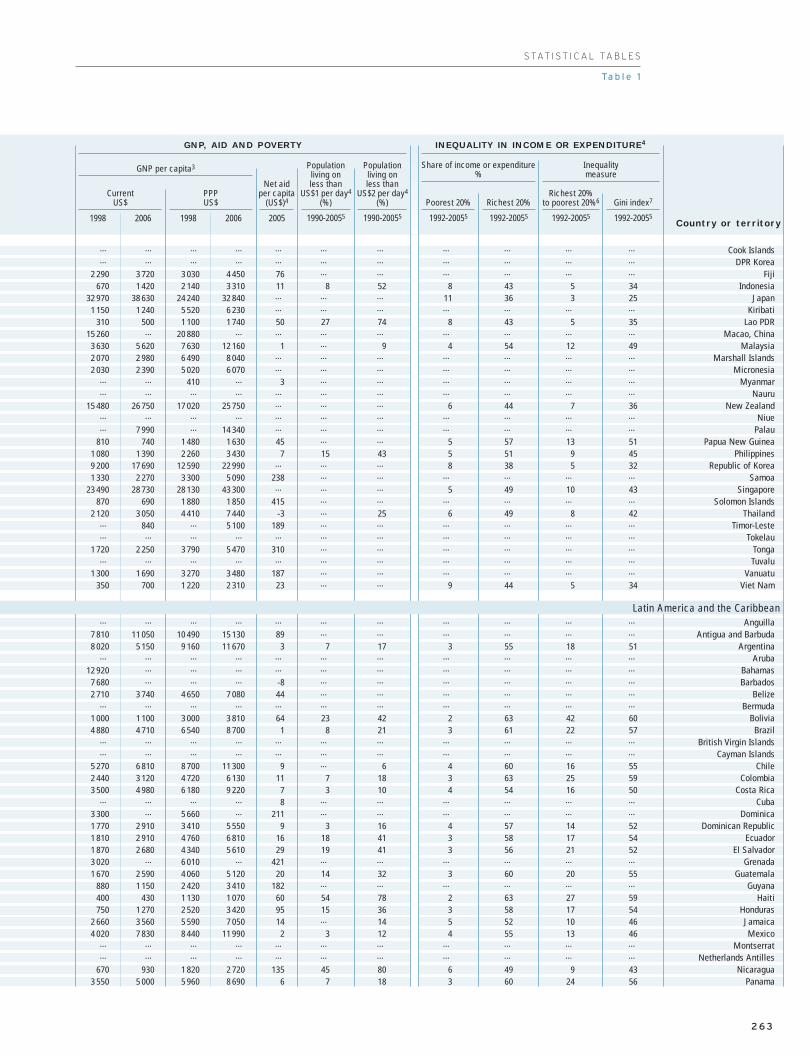
Cook IslandsDPR Korea
FijiIndonesia
JapanKiribati
Lao PDRMacao, China
MalaysiaMarshall Islands
MicronesiaMyanmar
NauruNew Zealand
NiuePalau
Papua New GuineaPhilippines
Republic of KoreaSamoa
SingaporeSolomon Islands
ThailandTimor-Leste
TokelauTongaTuvalu
VanuatuViet Nam
AnguillaAntigua and Barbuda
ArgentinaAruba
BahamasBarbados
BelizeBermuda
BoliviaBrazil
British Virgin IslandsCayman Islands
ChileColombia
Costa RicaCuba
DominicaDominican Republic
EcuadorEl Salvador
GrenadaGuatemala
GuyanaHaiti
HondurasJamaicaMexico
MontserratNetherlands Antilles
NicaraguaPanama
… … … … … … … … … … …… … … … … … … … … … …
2 290 3 720 3 030 4 450 76 … … … … … …
670 1 420 2 140 3 310 11 8 52 8 43 5 3432 970 38 630 24 240 32 840 … … … 11 36 3 25
1 150 1 240 5 520 6 230 … … … … … … …
310 500 1 100 1 740 50 27 74 8 43 5 3515 260 … 20 880 … … … … … … … …
3 630 5 620 7 630 12 160 1 … 9 4 54 12 492 070 2 980 6 490 8 040 … … … … … … …
2 030 2 390 5 020 6 070 … … … … … … …… … 410 … 3 … … … … … …… … … … … … … … … … …
15 480 26 750 17 020 25 750 … … … 6 44 7 36… … … … … … … … … … …… 7 990 … 14 340 … … … … … … …
810 740 1 480 1 630 45 … … 5 57 13 511 080 1 390 2 260 3 430 7 15 43 5 51 9 459 200 17 690 12 590 22 990 … … … 8 38 5 321 330 2 270 3 300 5 090 238 … … … … … …
23 490 28 730 28 130 43 300 … … … 5 49 10 43870 690 1 880 1 850 415 … … … … … …
2 120 3 050 4 410 7 440 -3 … 25 6 49 8 42… 840 … 5 100 189 … … … … … …… … … … … … … … … … …
1 720 2 250 3 790 5 470 310 … … … … … …… … … … … … … … … … …
1 300 1 690 3 270 3 480 187 … … … … … …
350 700 1 220 2 310 23 … … 9 44 5 34
… … … … … … … … … … …
7 810 11 050 10 490 15 130 89 … … … … … …
8 020 5 150 9 160 11 670 3 7 17 3 55 18 51… … … … … … … … … … …
12 920 … … … … … … … … … …
7 680 … … … -8 … … … … … …
2 710 3 740 4 650 7 080 44 … … … … … …… … … … … … … … … … …
1 000 1 100 3 000 3 810 64 23 42 2 63 42 604 880 4 710 6 540 8 700 1 8 21 3 61 22 57
… … … … … … … … … … …… … … … … … … … … … …
5 270 6 810 8 700 11 300 9 … 6 4 60 16 552 440 3 120 4 720 6 130 11 7 18 3 63 25 593 500 4 980 6 180 9 220 7 3 10 4 54 16 50
… … … … 8 … … … … … …
3 300 … 5 660 … 211 … … … … … …
1 770 2 910 3 410 5 550 9 3 16 4 57 14 521 810 2 910 4 760 6 810 16 18 41 3 58 17 541 870 2 680 4 340 5 610 29 19 41 3 56 21 523 020 … 6 010 … 421 … … … … … …
1 670 2 590 4 060 5 120 20 14 32 3 60 20 55880 1 150 2 420 3 410 182 … … … … … …
400 430 1 130 1 070 60 54 78 2 63 27 59750 1 270 2 520 3 420 95 15 36 3 58 17 54
2 660 3 560 5 590 7 050 14 … 14 5 52 10 464 020 7 830 8 440 11 990 2 3 12 4 55 13 46
… … … … … … … … … … …… … … … … … … … … … …
670 930 1 820 2 720 135 45 80 6 49 9 433 550 5 000 5 960 8 690 6 7 18 3 60 24 56
GNP, AID AND POVERTY INEQUALITY IN INCOME OR EXPENDITURE4
1998 2006 1998 2006 2005 1990-20055 1990-20055 1992-20055 1992-20055 1992-20055
CurrentUS$
GNP per capita3 Share of income or expenditure%
Inequalitymeasure
PPPUS$
Net aid per capita
(US$)4
Populationliving on less than
US$1 per day4
(%)
Populationliving on less than
US$2 per day4
(%) Poorest 20% Richest 20%Richest 20%
to poorest 20%6 Gini index7
Country or territory1992-20055
S TAT I S T I C A L TA B L E S
Ta b l e 1
Latin America and the Caribbean
2 6 3

Table 1 (continued)
ParaguayPeruSaint Kitts and NevisSaint LuciaSt Vincent/Grenad.SurinameTrinidad and TobagoTurks and Caicos IslandsUruguayVenezuela, B. R.
AndorraAustriaBelgiumCanadaCyprusDenmarkFinlandFranceGermanyGreeceIcelandIrelandIsraelItalyLuxembourgMaltaMonacoNetherlandsNorwayPortugalSan MarinoSpainSwedenSwitzerlandUnited KingdomUnited States
AfghanistanBangladeshBhutanIndiaIran, Islamic Republic ofMaldivesNepalPakistanSri Lanka
AngolaBeninBotswanaBurkina FasoBurundiCameroonCape VerdeCentral African RepublicChadComorosCongo
6 016 1.8 0.3 72 70 74 3.1 0.6 29 …
27 589 1.2 0.2 71 69 74 2.5 0.5 28 …
50 1.3 … … … … … … … …
163 1.1 1.1 74 72 76 2.2 … … …
120 0.5 -0.1 72 69 74 2.2 … … …
455 0.6 -1.0 70 67 74 2.4 2.4 28 …
1 328 0.4 0.9 70 68 72 1.6 1.5 59 …
25 1.4 … … … … … … … …
3 331 0.3 -0.8 76 73 80 2.1 0.6 28 …
27 191 1.7 0.5 74 71 77 2.5 … … …
74 0.4 … … … … … … … …
8 327 0.4 -0.3 80 77 83 1.4 0.2 30 …
10 430 0.2 -0.5 79 76 82 1.6 0.2 27 …
32 577 0.9 0.3 81 78 83 1.5 0.4 27 …
846 1.1 1.5 79 76 82 1.6 … … …
5 430 0.2 -1.1 78 76 81 1.8 0.2 23 …
5 261 0.3 0.6 79 76 82 1.8 0.1 <42 …
61 330 0.5 -0.3 81 77 84 1.9 0.4 27 …
82 641 -0.1 -1.2 79 77 82 1.4 0.1 29 …
11 123 0.2 0.2 79 77 82 1.3 0.2 27 …
298 0.8 0.6 82 80 83 2.1 0.2 <40 …
4 221 1.8 2.2 79 76 81 2.0 0.2 27 …
6 810 1.7 0.4 81 79 83 2.8 0.1 59 …
58 779 0.1 -0.1 81 78 83 1.4 0.4 27 …
461 1.1 0.3 79 76 82 1.7 0.2 … …
405 0.4 0.0 79 77 81 1.4 0.1 … …
33 0.3 … … … … … … … …
16 379 0.2 -2.0 80 78 82 1.7 0.2 27 …
4 669 0.6 -0.1 80 78 83 1.8 0.1 <33 …
10 579 0.4 0.0 78 75 81 1.5 0.5 28 …
31 0.8 … … … … … … … …
43 887 0.8 1.8 81 78 84 1.4 0.5 20 …
9 078 0.4 1.2 81 79 83 1.8 0.1 47 …
7 455 0.4 -0.8 82 79 84 1.4 0.6 37 …
60 512 0.4 1.0 79 77 82 1.8 0.2 29 …
302 841 1.0 0.8 78 76 81 2.1 0.6 21 …
26 088 3.9 3.6 44 44 44 7.1 … … …
155 991 1.7 -0.3 64 63 65 2.8 … 17 …
649 1.4 -1.6 66 64 67 2.2 0.1 <20 …
1 151 751 1.5 -0.1 65 63 66 2.8 0.3 38 …
70 270 1.4 3.0 71 69 73 2.0 0.2 28 …
300 1.8 3.1 68 68 69 2.6 … … …
27 641 2.0 0.8 64 63 64 3.3 0.5 25 …
160 943 1.8 1.9 65 65 66 3.5 0.1 29 …
19 207 0.5 -1.1 72 69 76 1.9 … 38 …
16 557 2.8 2.5 43 41 44 6.4 2.1 61 508 760 3.0 2.4 57 56 58 5.4 1.2 63 291 858 1.2 0.7 51 50 51 2.9 23.9 61 95
14 359 2.9 2.4 52 51 54 6.0 1.6 51 1008 173 3.9 5.3 50 48 51 6.8 2.0 59 120
18 175 2.0 0.4 50 50 51 4.3 5.1 60 300519 2.2 1.1 72 68 74 3.4 … … …
4 265 1.8 1.0 45 43 46 4.6 6.3 65 7210 468 2.9 2.3 51 49 52 6.2 3.5 61 85
818 2.5 1.0 65 63 67 4.3 <0.1 <50 <0.13 689 2.1 1.2 55 54 57 4.5 3.5 59 69
DEMOGRAPHY1 HIV/AIDS2
2006 2005-2010 2005-2010Total TotalMale Female
2005-2010 20072007 2007
Total population
(000)
Averageannual growth
rate (%) total
population
2005-2010
Average annual growth
rate (%) age 0-4
population
Life expectancy at birth (years)
Total fertility rate
(children per woman)
% of womenamong people
(age 15+) living with HIV
HIV prevalence
rate (%) in adults (15-49)
Orphansdue to AIDS
(000)
Country or territory
North America and Western Europe
South and West Asia
Sub-Saharan Africa
90
02
Education f
or A
ll G
lobal M
onitorin
g R
eport
A N N E X
2 6 4
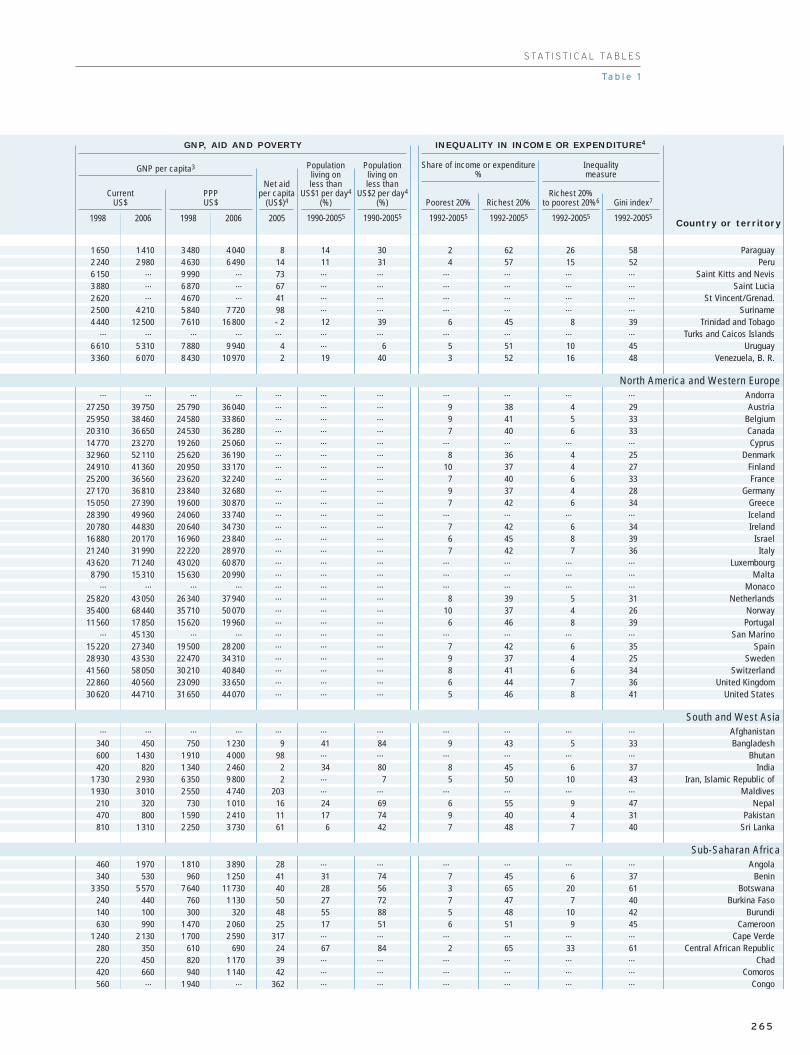
ParaguayPeru
Saint Kitts and NevisSaint Lucia
St Vincent/Grenad.Suriname
Trinidad and TobagoTurks and Caicos Islands
UruguayVenezuela, B. R.
AndorraAustria
BelgiumCanadaCyprus
DenmarkFinlandFrance
GermanyGreeceIcelandIreland
IsraelItaly
LuxembourgMalta
MonacoNetherlands
NorwayPortugal
San MarinoSpain
SwedenSwitzerland
United KingdomUnited States
AfghanistanBangladesh
BhutanIndia
Iran, Islamic Republic ofMaldives
NepalPakistan
Sri Lanka
AngolaBenin
BotswanaBurkina Faso
BurundiCameroon
Cape VerdeCentral African Republic
ChadComoros
Congo
1 650 1 410 3 480 4 040 8 14 30 2 62 26 582 240 2 980 4 630 6 490 14 11 31 4 57 15 526 150 … 9 990 … 73 … … … … … …
3 880 … 6 870 … 67 … … … … … …
2 620 … 4 670 … 41 … … … … … …
2 500 4 210 5 840 7 720 98 … … … … … …
4 440 12 500 7 610 16 800 - 2 12 39 6 45 8 39… … … … … … … … … … …
6 610 5 310 7 880 9 940 4 … 6 5 51 10 453 360 6 070 8 430 10 970 2 19 40 3 52 16 48
… … … … … … … … … … …
27 250 39 750 25 790 36 040 … … … 9 38 4 2925 950 38 460 24 580 33 860 … … … 9 41 5 3320 310 36 650 24 530 36 280 … … … 7 40 6 3314 770 23 270 19 260 25 060 … … … … … … …
32 960 52 110 25 620 36 190 … … … 8 36 4 2524 910 41 360 20 950 33 170 … … … 10 37 4 2725 200 36 560 23 620 32 240 … … … 7 40 6 3327 170 36 810 23 840 32 680 … … … 9 37 4 2815 050 27 390 19 600 30 870 … … … 7 42 6 3428 390 49 960 24 060 33 740 … … … … … … …
20 780 44 830 20 640 34 730 … … … 7 42 6 3416 880 20 170 16 960 23 840 … … … 6 45 8 3921 240 31 990 22 220 28 970 … … … 7 42 7 3643 620 71 240 43 020 60 870 … … … … … … …
8 790 15 310 15 630 20 990 … … … … … … …… … … … … … … … … … …
25 820 43 050 26 340 37 940 … … … 8 39 5 3135 400 68 440 35 710 50 070 … … … 10 37 4 2611 560 17 850 15 620 19 960 … … … 6 46 8 39
… 45 130 … … … … … … … … …
15 220 27 340 19 500 28 200 … … … 7 42 6 3528 930 43 530 22 470 34 310 … … … 9 37 4 2541 560 58 050 30 210 40 840 … … … 8 41 6 3422 860 40 560 23 090 33 650 … … … 6 44 7 3630 620 44 710 31 650 44 070 … … … 5 46 8 41
… … … … … … … … … … …
340 450 750 1 230 9 41 84 9 43 5 33600 1 430 1 910 4 000 98 … … … … … …
420 820 1 340 2 460 2 34 80 8 45 6 371 730 2 930 6 350 9 800 2 … 7 5 50 10 431 930 3 010 2 550 4 740 203 … … … … … …
210 320 730 1 010 16 24 69 6 55 9 47470 800 1 590 2 410 11 17 74 9 40 4 31810 1 310 2 250 3 730 61 6 42 7 48 7 40
460 1 970 1 810 3 890 28 … … … … … …
340 530 960 1 250 41 31 74 7 45 6 373 350 5 570 7 640 11 730 40 28 56 3 65 20 61
240 440 760 1 130 50 27 72 7 47 7 40140 100 300 320 48 55 88 5 48 10 42630 990 1 470 2 060 25 17 51 6 51 9 45
1 240 2 130 1 700 2 590 317 … … … … … …
280 350 610 690 24 67 84 2 65 33 61220 450 820 1 170 39 … … … … … …
420 660 940 1 140 42 … … … … … …
560 … 1 940 … 362 … … … … … …
GNP, AID AND POVERTY INEQUALITY IN INCOME OR EXPENDITURE4
1998 2006 1998 2006 2005 1990-20055 1990-20055 1992-20055 1992-20055 1992-20055
CurrentUS$
GNP per capita3 Share of income or expenditure%
Inequalitymeasure
PPPUS$
Net aid per capita
(US$)4
Populationliving on less than
US$1 per day4
(%)
Populationliving on less than
US$2 per day4
(%) Poorest 20% Richest 20%Richest 20%
to poorest 20%6 Gini index7
Country or territory1992-20055
S TAT I S T I C A L TA B L E S
Ta b l e 1
North America and Western Europe
South and West Asia
Sub-Saharan Africa
2 6 5

Côte d’IvoireD. R. CongoEquatorial GuineaEritreaEthiopiaGabonGambiaGhanaGuineaGuinea-BissauKenyaLesothoLiberiaMadagascarMalawiMaliMauritiusMozambiqueNamibiaNigerNigeriaRwandaSao Tome and PrincipeSenegalSeychellesSierra LeoneSomaliaSouth AfricaSwazilandTogoUgandaUnited Republic of TanzaniaZambiaZimbabwe
World
Countries in transitionDeveloped countriesDeveloping countries
Arab StatesCentral and Eastern EuropeCentral AsiaEast Asia and the Pacific
East AsiaPacific
Latin America/CaribbeanCaribbeanLatin America
N. America/W. EuropeSouth and West AsiaSub-Saharan Africa
18 914 1.8 0.8 48 48 49 4.5 3.9 60 42060 644 3.2 3.5 46 45 48 6.7 … … …
496 2.4 2.0 52 50 53 5.4 3.4 60 54 692 3.2 3.1 58 56 60 5.0 1.3 60 18
81 021 2.5 1.6 53 52 54 5.3 2.1 60 6501 311 1.5 0.4 57 56 57 3.1 5.9 59 181 663 2.6 1.3 59 59 60 4.7 0.9 60 3
23 008 2.0 0.6 60 60 60 3.8 1.9 60 1609 181 2.2 1.5 56 54 58 5.4 1.6 59 251 646 3.0 3.1 46 45 48 7.1 1.8 58 6
36 553 2.7 2.9 54 53 55 5.0 … … …
1 995 0.6 -0.4 43 43 42 3.4 23.2 58 1103 579 4.5 4.7 46 45 47 6.8 1.7 59 15
19 159 2.7 1.5 59 58 61 4.8 0.1 26 313 571 2.6 1.5 48 48 48 5.6 11.9 58 56011 968 3.0 3.2 54 52 57 6.5 1.5 60 44
1 252 0.8 -0.5 73 70 76 1.9 1.7 29 <0.520 971 1.9 0.6 42 42 42 5.1 12.5 58 400
2 047 1.3 0.4 53 52 53 3.2 15.3 61 6613 737 3.5 3.1 57 58 56 7.2 0.8 30 25
144 720 2.3 1.2 47 46 47 5.3 3.1 58 1 2009 464 2.8 4.0 46 45 48 5.9 2.8 60 220
155 1.6 0.3 66 64 67 3.9 … … …
12 072 2.5 1.3 63 61 65 4.7 1.0 59 886 0.5 … … … … … … … …
5 743 2.0 1.9 43 41 44 6.5 1.7 59 168 445 2.9 2.0 48 47 49 6.0 0.5 28 9
48 282 0.6 -0.5 49 49 50 2.6 18.1 59 1 4001 134 0.6 0.2 40 40 39 3.4 26.1 59 566 410 2.6 1.4 58 57 60 4.8 3.3 58 68
29 899 3.2 3.1 52 51 52 6.5 5.4 59 1 20039 459 2.5 1.2 53 51 54 5.2 6.2 58 97011 696 1.9 0.9 42 42 42 5.2 15.2 57 60013 228 1.0 0.3 43 44 43 3.2 15.3 57 1 000
6 578 149 1.2 0.5 68.6 66.5 70.8 2.6 0.8 50 15 000
278 295 -0.1 1.2 66.5 61.0 72.5 1.6 … … …
1 015 689 0.4 0.2 79.2 76.2 82.0 1.7 … … …
5 284 165 1.4 0.5 66.7 65.1 68.5 2.8 … … …
314 822 2.0 1.2 68.8 67.0 70.7 3.2 … … …
403 456 -0.1 0.5 69.9 65.3 74.8 1.5 … … …
77 546 1.0 1.5 67.2 63.4 71.0 2.3 … … …
2 119 172 0.7 -0.2 73.0 71.0 75.1 1.9 … … …
2 085 044 0.7 -0.2 72.9 70.9 75.1 1.9 0.1 27 …
34 128 1.2 0.1 75.7 73.3 78.2 2.3 0.4 30 …
559 994 1.2 -0.2 73.4 70.2 76.6 2.2 … … …
16 628 1.1 0.0 65.4 63.2 67.6 3.0 1.1 50 …
543 365 1.3 -0.2 73.6 70.5 76.8 2.2 0.5 32 …
744 476 0.6 0.4 79.3 76.6 82.0 1.8 … … …
1 612 841 1.6 0.3 64.7 63.4 66.2 2.9 … … …
745 842 2.4 1.8 50.3 49.4 51.2 5.2 5.0 59 11 592
DEMOGRAPHY1 HIV/AIDS2
2006 2005-2010 2005-2010Total TotalMale Female
2005-2010 20072007 2007
Total population
(000)
Averageannual growth
rate (%) total
population
2005-2010
Average annual growth
rate (%) age 0-4
population
Life expectancy at birth (years)
Total fertility rate
(children per woman)
% of womenamong people
(age 15+) living with HIV
HIV prevalence
rate (%) in adults (15-49)
Orphansdue to AIDS
(000)
Country or territory
90
02
Education f
or A
ll G
lobal M
onitorin
g R
eport
A N N E X
Table 1 (continued)
Weighted average Weighted averageSum
1. UN Population Division (2007), medium variant.2. UNAIDS (2008).
3. World Bank (2008).4. UNDP (2007).
5. Data are for the most recent year available during the period specified.For more details see UNDP (2007).
2 6 6

Côte d’IvoireD. R. Congo
Equatorial GuineaEritrea
EthiopiaGabon
GambiaGhana
GuineaGuinea-Bissau
KenyaLesothoLiberia
MadagascarMalawi
MaliMauritius
MozambiqueNamibia
NigerNigeria
RwandaSao Tome and Principe
SenegalSeychelles
Sierra LeoneSomalia
South AfricaSwaziland
TogoUganda
United Republic of TanzaniaZambia
Zimbabwe
World
Countries in transitionDeveloped countries
Developing countries
Arab StatesCentral and Eastern Europe
Central AsiaEast Asia and the Pacific
East AsiaPacific
Latin America/CaribbeanCaribbean
Latin AmericaN. America/W. Europe
South and West AsiaSub-Saharan Africa
730 880 1 520 1 580 7 15 49 5 51 10 45110 130 240 270 32 … … … … … …
1 120 8 510 5 100 16 620 78 … … … … … …
210 190 750 680 81 … … … … … …
130 170 410 630 27 23 78 9 39 4 304 070 5 360 12 240 11 180 39 … … … … … …
300 290 810 1 110 38 59 83 5 53 11 50370 510 820 1 240 51 45 79 6 47 8 41470 400 840 1 130 19 … … 7 46 7 39140 190 390 460 50 … … 5 53 10 47440 580 1 140 1 470 22 23 58 6 49 8 43650 980 1 320 1 810 38 36 56 2 67 44 63130 130 250 260 … … … … … … …
250 280 700 870 50 61 85 5 54 11 48200 230 600 690 45 21 63 7 47 7 39280 460 690 1 000 51 36 72 6 47 8 40
3 760 5 430 6 740 10 640 26 … … … … … …
220 310 400 660 65 36 74 5 54 10 472 030 3 210 3 360 4 770 61 35 56 1 79 56 74
200 270 540 630 37 61 86 3 53 21 51270 620 1 010 1 410 49 71 92 5 49 10 44260 250 530 730 64 60 88 5 53 10 47… 800 … 1 490 204 … … … … … …
510 760 1 140 1 560 59 17 56 7 48 7 417 320 8 870 12 770 14 360 223 … … … … … …
160 240 340 610 62 57 75 1 63 58 63… … … … … … … … … … …
3 280 5 390 6 140 8 900 16 11 34 4 62 18 581 460 2 400 3 820 4 700 41 48 78 4 56 13 50
300 350 680 770 14 … … … … … …
280 300 600 880 42 … … 6 53 9 46220 350 630 980 39 58 90 7 42 6 35310 630 800 1 140 81 64 87 4 55 15 51570 … … … 28 56 83 5 56 12 50
… 7 448 … 9 209 16 … … … … … …
… … … … … … … … … … …… … … … … … … … … … …… … … … 17 … … … … … …
… … … … 94 … … … … … …… … … … … … … … … … …… … … … … … … … … … …… 1 856 … 4 359 5 … … … … … …… … … … … … … … … … …… … … … … … … … … … …… 4 785 … 8 682 11 … … … … … …… … … … … … … … … … …… … … … … … … … … … …… … … … … … … … … … …… … … … … … … … … … …… 829 … 1 681 42 … … … … … …
GNP, AID AND POVERTY INEQUALITY IN INCOME OR EXPENDITURE4
1998 2006 1998 2006 2005 1990-20055 1990-20055 1992-20055 1992-20055 1992-20055
CurrentUS$
GNP per capita3 Share of income or expenditure%
Inequalitymeasure
PPPUS$
Net aid per capita
(US$)4
Populationliving on less than
US$1 per day4
(%)
Populationliving on less than
US$2 per day4
(%) Poorest 20% Richest 20%Richest 20%
to poorest 20%6 Gini index7
Country or territory1992-20055
S TAT I S T I C A L TA B L E S
Ta b l e 1
Weighted average Weighted average
6. Data show the ratio of income or expenditure share of the richest group to that of the poorest.7. A value of 0 represents perfect equality and a value of 100 perfect inequality.
2 6 7

50.* 63.* 36.* 75 84 65 81 88 74 6 572 64.* 6 030 68 5 392 6884.* 89.* 77.* 88 90 86 92 93 90 56 56.* 64 49 55 49… … … … … … … … … … … … … … …
44.* 57.* 31.* 71 83 60 77 86 68 16 428 62.* 14 213 71 13 822 70… … … 74.* 84.* 64.* … … … … … 4 327 69.* … …… … … 93 96 89 95 98 93 … … 266 74 215 7374.* 78.* 69.* 93.* 95.* 91.* 96 96 95 276 48.* 145 50.* 114 48… … … … … … … … … … … … … … …
76 88 63 86 94 78 91 97 84 685 73 580 78 472 81… … … 55 63 47 61 66 55 … … 817 59 934 5742.* 55.* 29.* 55 68 42 62 74 51 9 602 62.* 9 826 66 9 458 67… … … 84 89 76 89 93 84 … … 278 60 242 62… … … 92 97 88 95 98 93 … … 161 78 135 7676.* 77.* 72.* 90 90 90 93 93 93 68 30.* 66 28 54 3071.* 80.* 57.* 84 89 78 89 92 85 2 907 59.* 2 506 58 2 176 60… … … 61.* 71.* 52.* … … … … … 8 674 63.* … …… … … 83 89 76 87 92 82 … … 2 169 69 2 037 70… … … 77 86 68 83 90 76 … … 1 764 69 1 464 7171.* 72.* 69.* 90 90 89 94 95 92 473 31.* 347 31 259 3937.* 57.* 17.* 57 76 39 70 85 55 4 686 66.* 5 076 72 4 961 75
… … … 99 99 99 99 99 99 … … 24 66 19 5998.* 99.* 97.* 100 100 100 100 100 100 166 87.* 25 68 16 50… … … 97.* 99.* 94.* … … … … … 110 86.* … …… … … 98 99 98 98 98 98 … … 114 63 118 5897.* 99.* 95.* 99 99 98 99 100 99 120 82.* 52 81 31 74… … … … … … … … … … … … … … …
100.* 100.* 100.* 100 100 100 100 100 100 3 79.* 2 50 2 47… … … … … … … … … … … … … … …
99.* 100.* 99.* 100 100 100 100 100 100 11 80.* 4 54 4 5198.* 99.* 98.* 100 100 100 100 100 100 44 76.* 9 52 8 52… … … … … … … … … … … … … … …… … … … … … … … … … … … … … …
96.* 99.* 94.* 99 100 99 100 100 100 113 82.* 26 78 12 6397.* 99.* 95.* 98 98 97 98 98 97 589 78.* 443 67 394 5898.* 99.* 97.* 100 100 99 100 100 100 2 290 88.* 604 72 398 61… … … … … … … … … … … … … … …… … … … … … … … … … … … … … …
100.* 100.* 99.* 100 100 100 100 100 100 7 60.* 6 57 5 5794.* 97.* 91.* 97 99 95 98 99 97 87 77.* 52 77 36 7379.* 90.* 69.* 88.* 96.* 80.* 91 97 86 7 640 75.* 6 285 83.* 5 282 84… … … 100 100 100 100 100 100 … … 129 70 83 58
99.* 99.* 98.* 99 100 99 100 100 100 31 77.* 13 73 8 63… … … 99 100 99 100 100 100 … … 42 78 24 76… … … … … … … … … … … … … … …
98.* 99.* 96.* 100 100 99 100 100 100 278 82.* 46 74 34 65… … … 99 99 99 99 100 99 … … 27 67 21 55… … … 97 97 98 96 95 98 … … 49 44 85 3298.* 99.* 97.* 100 100 99 100 100 100 68 74.* 16 70 11 62… … … 99 100 99 100 100 100 … … 18 71 12 61… … … 97.* 98.* 96.* … … … … … 565 68.* … …
… … … … … … … … … … … … … … …
88.* 92.* 82.* 95 96 93 97 98 96 21 67.* 15 65 11 65… … … 76 86 67 81 88 75 … … 2 188 72 2 146 6978.* 87.* 68.* 93 96 90 96 98 93 184 214 70.* 73 232 73 49 848 74… … … … … … … … … … … … … … …… … … … … … … … … … … … … … …
AlgeriaBahrainDjiboutiEgyptIraqJordanKuwaitLebanonLibyan Arab JamahiriyaMauritaniaMoroccoOmanPalestinian A. T.QatarSaudi ArabiaSudan2
Syrian Arab RepublicTunisiaUnited Arab EmiratesYemen
AlbaniaBelarusBosnia and HerzegovinaBulgariaCroatiaCzech RepublicEstoniaHungaryLatviaLithuaniaMontenegroPolandRepublic of MoldovaRomaniaRussian FederationSerbiaSlovakiaSloveniaTFYR MacedoniaTurkeyUkraine
ArmeniaAzerbaijanGeorgiaKazakhstanKyrgyzstanMongoliaTajikistanTurkmenistanUzbekistan
AustraliaBrunei DarussalamCambodiaChinaCook IslandsDPR Korea
90
02
Education f
or A
ll G
lobal M
onitorin
g R
eport
A N N E X
Table 2Adult and youth literacy
ADULT LITERACY RATE (15 and over)(%) ADULT ILLITERATES (15 and over)
(000) FemaleTotal %
1985-19941 2000-20061Projected
20151985-19941 2000-20061Projected
2015
Country or territory (000) FemaleTotal %
(000) FemaleTotal %Total Male FemaleTotal Male FemaleTotal Male Female
Arab States
Central and Eastern Europe
Central Asia
East Asia and the Pacific
2 6 8

74.* 86.* 62.* 92 94 90 95 95 95 1 215 73.* 593 63 320 4897.* 97.* 97.* 100 100 100 100 100 100 3 53.* 0.5 42 0.1 45… … … … … … … … … … … … … … …
63.* 71.* 54.* 85 90 80 91 92 90 3 473 60.* 2 238 66 1 435 55… … … 85.* 89.* 80.* … … … … … 877 63.* … …… … … 99 99 99 99 99 100 … … 11 45 7 3087.* 91.* 84.* 99.* 99.* 98.* 100 100 100 37 62.* 7 45.* 0.05 37… … … … … … … … … … … … … … …
95 99 91 99 100 98 100 100 100 55 89 18 88 0.7 67… … … 66 70 62 71 73 70 … … 207 54 211 5258.* 71.* 46.* 74 83 64 83 89 78 2 239 65.* 1 704 68 1 017 67… … … 98 99 98 99 100 99 … … 10 62 3 63… … … 99 99 99 99 99 100 … … 7 52 6 3690.* 89.* 91.* 97 96 98 99 99 99 6 31.* 3 28 1.05 6088.* 94.* 81.* 97 98 96 99 99 98 369 74.* 150 66 75 76… … … 77.* 85.* 71.* … … … … … 1 659 64.* … …… … … 93 95 91 96 97 95 … … 298 63 163 60… … … 95 97 94 98 98 97 … … 100 65 39 5782.* 81.* 85.* 97 98 96 99 100 98 36 38.* 17 60 5 7860.* 83.* 35.* 79 93 64 90 97 83 1 122 78.* 1 003 82 587 87
… … … 99 99 99 99 99 99 … … 4 44 4 41100.* 100.* 100.* 100 100 100 100 100 100 3 43.* 3 37 3 33… … … 100.* 100.* 100.* … … … … … 1 38.* … …… … … 98 98 98 96 96 96 … … 25 50 28 46
100.* 100.* 100.* 100 100 100 100 100 100 2 53.* 2 48 2 44… … … … … … … … … … … … … … …
100.* 100.* 100.* 100 100 100 100 100 100 0.3 35.* 0.4 37 … …… … … … … … … … … … … … … 20 33
100.* 100.* 100.* 100 100 100 100 100 100 0.8 40.* 1.0 41 0.8 42100.* 100.* 100.* 100 100 100 100 100 100 2 44.* 1 46 0.8 50… … … … … … … … … … … … … … …… … … … … … … … … … … … … … …
100.* 100.* 100.* 100 100 100 100 100 100 2 48.* 2 48 2 4999.* 99.* 99.* 98 97 98 96 96 97 35 53.* 81 47 86 42
100.* 100.* 100.* 100 100 100 100 100 100 56 44.* 72 40 53 36… … … … … … … … … … … … … … …… … … … … … … … … … … … … … …
100.* 100.* 100.* 100 100 100 100 100 100 0.7 44.* 0.4 37 0.3 3099.* 99.* 99.* 99 99 99 99 99 98 4 62.* 4 57 4 5293.* 97.* 88.* 96.* 98.* 94.* 97 99 96 867 76.* 507 78.* 388 75… … … 100 100 100 100 100 100 … … 15 41 12 39
100.* 100.* 100.* 100 100 100 100 100 100 0.5 49.* 1 38 1.3 33… … … 100 100 100 100 100 100 … … 1 28 0.6 18… … … … … … … … … … … … … … …
100.* 100.* 100.* 100 100 100 100 100 100 8 44.* 5 38 5 36… … … 100 100 100 99 99 100 … … 4 38 6 31… … … 96 94 97 91 86 96 … … 25 30 46 24
100.* 100.* 100.* 100 100 100 100 100 100 3 56.* 2 47 2 44… … … 100 100 100 100 100 100 … … 2 41 2 33… … … 99.* 99.* 99.* … … … … … 39 52.* … …
… … … … … … … … … … … … … … …
98.* 98.* 98.* 100 100 99 100 100 100 0.9 49.* 0.3 53 0.12 57… … … 85 89 81 91 93 89 … … 495 62 313 5994.* 97.* 91.* 99 99 99 100 100 100 14 352 73.* 1 703 58 907 51… … … … … … … … … … … … … … …… … … … … … … … … … … … … … …
AlgeriaBahrainDjibouti
EgyptIraq
JordanKuwait
LebanonLibyan Arab Jamahiriya
MauritaniaMorocco
OmanPalestinian A. T.
QatarSaudi Arabia
Sudan 2
Syrian Arab RepublicTunisia
United Arab EmiratesYemen
AlbaniaBelarus
Bosnia and HerzegovinaBulgariaCroatia
Czech RepublicEstonia
HungaryLatvia
LithuaniaMontenegro
PolandRepublic of Moldova
RomaniaRussian Federation
SerbiaSlovakiaSlovenia
TFYR MacedoniaTurkey
Ukraine
ArmeniaAzerbaijan
GeorgiaKazakhstanKyrgyzstan
MongoliaTajikistan
TurkmenistanUzbekistan
AustraliaBrunei Darussalam
CambodiaChina
Cook IslandsDPR Korea
S TAT I S T I C A L TA B L E S
Ta b l e 2
Country or territory
YOUTH LITERACY RATE (15-24)(%) YOUTH ILLITERATES (15-24)
(000) FemaleTotal %
1985-19941 2000-20061Projected
20151985-19941 2000-20061Projected
2015
(000) FemaleTotal %
(000) FemaleTotal %Total Male FemaleTotal Male FemaleTotal Male Female
Arab States
Central and Eastern Europe
Central Asia
East Asia and the Pacific
2 6 9

… … … … … … … … … … … … … … …
82.* 88.* 75.* 91 95 87 94 96 92 21 577 68.* 14 772 71 11 158 71… … … … … … … … … … … … … … …… … … … … … … … … … … … … … …… … … 72 80 66 78 83 73 … … 967 64 993 62… … … 93 96 90 95 97 93 … … 28 74 22 7383.* 89.* 77.* 92 94 89 94 96 93 1 989 66.* 1 527 64 1 244 63… … … … … … … … … … … … … … …… … … … … … … … … … … … … … …… … … 90.* 94.* 86.* … … … … … 3 529 70.* … …… … … … … … … … … … … … … … …… … … … … … … … … … … … … … …… … … … … … … … … … … … … … …… … … … … … … … … … … … … … …… … … 57 62 53 61 63 60 … … 1 579 55 1 831 5294.* 94.* 93.* 93 93 94 94 94 95 2 325 53.* 3 711 48 4 073 46… … … … … … … … … … … … … … …
98.* 98.* 97.* 99 99 98 99 99 99 2 60.* 1 58 1 5489.* 95.* 83.* 94 97 91 96 98 94 259 78.* 207 76 157 74… … … … … … … … … … … … … … …… … … 94 96 92 96 97 94 … … 3 022 66 2 387 65… … … … … … … … … … … … … … …… … … … … … … … … … … … … … …… … … 99 99 99 99 99 99 … … 0.5 46 0.4 45… … … … … … … … … … … … … … …… … … … … … 84 85 82 … … … … … …
88.* 93.* 83.* 90.* 94.* 87.* … … … 4 789 72.* 5 892 69.* … …
… … … … … … … … … … … … … … …… … … … … … … … … … … … … … …
96.* 96.* 96.* 98 98 98 98 98 98 889 53.* 701 51 602 50… … … 98 98 98 98 99 98 … … 2 54 1 54… … … … … … … … … … … … … … …… … … … … … … … … … … … … … …
70.* 70.* 70.* … … … … … … 32 49.* … … … …… … … … … … … … … … … … … … …
80.* 88.* 72.* 90 95 85 93 97 90 825 71.* 597 76 471 77… … … 90.* 89.* 90.* 93 92 93 … … 14 242 50.* 11 275 49… … … … … … … … … … … … … … …… … … … … … … … … … … … … … …
94.* 95.* 94.* 96 96 96 97 97 97 547 53.* 447 52 367 5181.* 81.* 81.* 92.* 92.* 92.* 95 95 95 4 458 52.* 2 461 52.* 1 876 51… … … 96 96 96 97 96 97 … … 133 47 124 46… … … 100 100 100 100 100 100 … … 19 53 17 54… … … … … … … … … … … … … … …… … … 89 88 89 92 91 92 … … 718 49 641 4888.* 90.* 86.* 92 93 91 94 95 93 731 59.* 678 57 636 5674.* 77.* 71.* 84.* 87.* 81.* 89 91 87 830 58.* 729 61.* 594 60… … … … … … … … … … … … …
64.* 72.* 57.* 72 78 67 79 83 74 1 915 61.* 2 047 63 2 106 63… … … … … … … … … … … … … … …… … … … … … … … … … … … … … …… … … 83 82 83 86 85 88 … … 734 49 747 46… … … 85 80 91 89 85 94 … … 269 33 218 3088.* 90.* 85.* 92.* 94.* 90.* 94 96 93 6 397 62.* 6 037 64.* 4 880 64… … … … … … … … … … … … … … …
95.* 95.* 95.* 96 96 96 97 97 97 7 54.* 6 55 5 54… … … 80 79 81 84 82 85 … … 693 49 685 4689.* 89.* 88.* 93 94 93 95 95 94 175 52.* 156 55 150 5590.* 92.* 89.* 94 94 93 95 95 95 255 59.* 250 55 242 5387.* 93.* 82.* 89.* 94.* 83.* 93 96 90 1 848 72.* 2 126 74.* 1 578 75… … … … … … … … … … … … … … …
FijiIndonesiaJapanKiribatiLao PDRMacao, ChinaMalaysiaMarshall IslandsMicronesiaMyanmarNauruNew ZealandNiuePalauPapua New GuineaPhilippinesRepublic of KoreaSamoaSingaporeSolomon IslandsThailandTimor-LesteTokelauTongaTuvaluVanuatuViet Nam
AnguillaAntigua and BarbudaArgentinaArubaBahamasBarbadosBelizeBermudaBoliviaBrazilBritish Virgin IslandsCayman IslandsChileColombiaCosta RicaCubaDominicaDominican RepublicEcuadorEl SalvadorGrenadaGuatemalaGuyanaHaitiHondurasJamaicaMexicoMontserratNetherlands AntillesNicaraguaPanamaParaguayPeruSaint Kitts and Nevis
Table 2 (continued)
ADULT LITERACY RATE (15 and over)(%) ADULT ILLITERATES (15 and over)
(000) FemaleTotal %
1985-19941 2000-20061Projected
20151985-19941 2000-20061Projected
2015
Country or territory (000) FemaleTotal %
(000) FemaleTotal %Total Male FemaleTotal Male FemaleTotal Male Female
Latin America and the Caribbean
90
02
Education f
or A
ll G
lobal M
onitorin
g R
eport
A N N E X
2 7 0

… … … … … … … … … … … … … … …
96.* 97.* 95.* 99 99 99 99 99 99 1 421 65.* 506 53 335 42… … … … … … … … … … … … … … …… … … … … … … … … … … … … … …… … … 82 85 79 87 89 85 … … 228 58 196 58… … … 100 100 100 100 100 100 … … 0.2 37 0.05 2296.* 96.* 95.* 98 98 98 99 99 99 155 53.* 90 47 51 43… … … … … … … … … … … … … … …… … … … … … … … … … … … … … …… … … 95.* 96.* 93.* … … … … … 509 60.* … …… … … … … … … … … … … … … … …… … … … … … … … … … … … … … …… … … … … … … … … … … … … … …… … … … … … … … … … … … … … …… … … 64 63 65 68 63 74 … … 434 48 490 4097.* 96.* 97.* 94 94 95 95 94 96 428 45.* 950 42 997 38… … … … … … … … … … … … … … …
99.* 99.* 99.* 99 99 99 100 99 100 0.3 49.* 0.2 42 0.2 3799.* 99.* 99.* 100 100 100 100 100 100 6 44.* 2 38 1 31… … … … … … … … … … … … … … …… … … 98 98 98 99 99 99 … … 187 52 132 49… … … … … … … … … … … … … … …… … … … … … … … … … … … … … …… … … 100 100 100 100 100 100 … … 0.1 40 0.1 45… … … … … … … … … … … … … … …… … … … … … … … … … … … … … …
94.* 94.* 93.* 94.* 94.* 94.* … … … 831 53.* 1 771 39.* … …
… … … … … … … … … … … … … … …… … … … … … … … … … … … … … …
98.* 98.* 99.* 99 99 99 99 99 99 92 43.* 60 39 48 37… … … 99 99 99 100 99 100 … … 0.1 44 0.07 40… … … … … … … … … … … … … … …… … … … … … … … … … … … … … …
76.* 76.* 77.* … … … … … … 9 49.* … … … …… … … … … … … … … … … … … … …
94.* 96.* 92.* 98 99 98 99 99 99 83 70.* 30 68 18 63… … … 98.* 97.* 98.* 99 98 99 … … 853 33.* 375 26… … … … … … … … … … … … … … …… … … … … … … … … … … … … … …
98.* 98.* 99.* 99 99 99 99 99 100 38 41.* 28 41 17 3991.* 89.* 92.* 98.* 98.* 98.* 98 98 99 693 43.* 181 42.* 139 34… … … 98 98 98 98 98 99 … … 18 38 13 35… … … 100 100 100 100 100 100 … … 0.4 52 0.2 64… … … … … … … … … … … … … … …… … … 96 95 97 97 97 98 … … 76 37 52 3496.* 97.* 96.* 96 96 97 97 96 97 79 54.* 89 46 88 4185.* 85.* 85.* 95.* 94.* 95.* 97 96 98 173 51.* 64 45.* 45 35… … … … … … … … … … … … … … …
76.* 82.* 71.* 85 88 82 89 90 88 462 62.* 396 60 362 56… … … … … … … … … … … … … … …… … … … … … … … … … … … … … …… … … 90 88 93 92 89 95 … … 146 38 140 31… … … 94 90 98 96 94 99 … … 30 19 20 1795.* 96.* 95.* 98.* 98.* 98.* 99 99 99 828 56.* 402 57.* 215 45… … … … … … … … … … … … … … …
97.* 97.* 97.* 98 98 98 99 99 99 0.9 44.* 0.4 50 0.3 49… … … 88 85 91 92 88 95 … … 140 36 109 2995.* 95.* 95.* 96 97 96 97 97 97 25 52.* 22 52 21 5096.* 96.* 95.* 96 96 96 97 97 97 37 52.* 47 47 39 4495.* 97.* 94.* 98.* 99.* 97.* 99 99 98 215 67.* 121 67.* 79 54… … … … … … … … … … … … … … …
FijiIndonesia
JapanKiribati
Lao PDRMacao, China
MalaysiaMarshall Islands
MicronesiaMyanmar
NauruNew Zealand
NiuePalau
Papua New GuineaPhilippines
Republic of KoreaSamoa
SingaporeSolomon Islands
ThailandTimor-Leste
TokelauTongaTuvalu
VanuatuViet Nam
AnguillaAntigua and Barbuda
ArgentinaAruba
BahamasBarbados
BelizeBermuda
BoliviaBrazil
British Virgin IslandsCayman Islands
ChileColombia
Costa RicaCuba
DominicaDominican Republic
EcuadorEl Salvador
GrenadaGuatemala
GuyanaHaiti
HondurasJamaicaMexico
MontserratNetherlands Antilles
NicaraguaPanama
ParaguayPeru
Saint Kitts and Nevis
Country or territory
YOUTH LITERACY RATE (15-24)(%) YOUTH ILLITERATES (15-24)
(000) FemaleTotal %
1985-19941 2000-20061Projected
20151985-19941 2000-20061Projected
2015
(000) FemaleTotal %
(000) FemaleTotal %Total Male FemaleTotal Male FemaleTotal Male Female
S TAT I S T I C A L TA B L E S
Ta b l e 2
Latin America and the Caribbean
2 7 1

… … … … … … … … … … … … … … …… … … … … … … … … … … … … … …… … … 90 93 88 92 94 91 … … 32 63 27 6297.* 98.* 96.* 99 99 98 99 99 99 26 70.* 14 67 10 62… … … … … … … … … … … … … … …
95.* 95.* 96.* 98.* 97.* 98.* 98 98 99 102 46.* 56 45.* 45 4290.* 91.* 89.* 93.* 93.* 93.* … … … 1 242 54.* 1 318 52.* … …
… … … … … … … … … … … … … … …… … … … … … … … … … … … … … …… … … … … … … … … … … … … … …… … … … … … … … … … … … … … …
94.* 98.* 91.* 98 99 96 99 99 98 29 81.* 17 78 9 75… … … … … … … … … … … … … … …… … … … … … … … … … … … … … …… … … … … … … … … … … … … … …… … … … … … … … … … … … … … …
93.* 96.* 89.* 97 98 96 98 99 97 615 74.* 289 70 200 67… … … … … … … … … … … … … … …… … … … … … … … … … … … … … …… … … … … … … … … … … … … … …… … … 99 99 99 99 99 99 … … 596 63 386 62… … … … … … … … … … … … … … …
88.* 88.* 88.* 91 90 93 93 92 95 31 50.* 29 41 24 37… … … … … … … … … … … … … … …… … … … … … … … … … … … … … …… … … … … … … … … … … … … … …
88.* 92.* 85.* 95 96 93 97 98 96 965 67.* 486 68 268 68… … … … … … … … … … … … … … …
96.* 98.* 95.* 97 99 96 98 99 97 1 103 73.* 988 72 787 72… … … … … … … … … … … … … … …… … … … … … … … … … … … … … …… … … … … … … … … … … … … … …… … … … … … … … … … … … … … …
… … … 28.* 43.* 13.* … … … … … 9 916 59.* … …
35.* 44.* 26.* 52 58 47 61 64 58 44 458 56.* 48 392 55 48 189 53… … … 54 66 40 64 73 54 … … 202 60 198 6048.* 62.* 34.* 65 76 53 72 81 62 283 848 61.* 270 058 65 261 687 6566.* 74.* 56.* 84 89 78 89 93 85 11 124 62.* 8 133 67 6 504 6996.* 96.* 96.* 97 97 97 98 97 98 5 47.* 6 48 6 4633.* 49.* 17.* 55 69 42 66 77 56 7 619 63.* 7 620 67 7 346 67… … … 54.* 68.* 40.* 62 73 49 … … 47 060 64.* 49 588 64… … … 91.* 93.* 89.* 93 94 92 … … 1 339 61.* 1 061 59
… … … 67.* 83.* 54.* … … … … … 2 828 74.* … …
27.* 40.* 17.* 40 52 27 47 59 35 2 131 59.* 2 959 61 3 476 6169.* 65.* 71.* 82 82 82 87 87 88 247 47.* 215 51 176 4914.* 20.* 8.* 26 34 18 36 43 30 4 136 55.* 5 740 56 6 567 5637.* 48.* 28.* 59.* 67.* 52.* … … … 1 945 61.* 1 831 61.* … …… … … 68.* 77.* 60.* … … … … … 3 367 62.* … …
63.* 75.* 53.* 83 89 78 89 93 86 70 70.* 54 69 45 6834.* 48.* 20.* 49.* 65.* 33.* … … … 1 085 63.* 1 263 67.* … …
12.* … … 26.* 41.* 13.* … … … 3 177 …. 4 133 60.* … …… … … … … … … … … … … … … … …
74 83 65 86 92 81 92 95 89 404 67 299 70 216 7234.* 44.* 23.* 49.* 61.* 39.* … … … 4 180 55.* 5 541 60.* … …… … … 67.* 81.* 54.* … … … … … 10 486 71.* … …… … … 87.* 93.* 80.* … … … … … 38 75.* … …… … … … … … … … … … … … … … …
Saint LuciaSaint Vincent/Grenad.SurinameTrinidad and TobagoTurks and Caicos IslandsUruguayVenezuela, B. R.
AndorraAustriaBelgiumCanadaCyprusDenmarkFinlandFranceGermanyGreeceIcelandIrelandIsraelItalyLuxembourgMaltaMonacoNetherlandsNorwayPortugalSan MarinoSpainSwedenSwitzerlandUnited KingdomUnited States
AfghanistanBangladeshBhutanIndia2
Iran, Islamic Republic ofMaldivesNepalPakistanSri Lanka2
AngolaBeninBotswanaBurkina FasoBurundiCameroonCape VerdeCentral African RepublicChadComorosCongoCôte d’IvoireD. R. CongoEquatorial GuineaEritrea
Table 2 (continued)
ADULT LITERACY RATE (15 and over)(%) ADULT ILLITERATES (15 and over)
(000) FemaleTotal %
1985-19941 2000-20061Projected
20151985-19941 2000-20061Projected
2015
Country or territory (000) FemaleTotal %
(000) FemaleTotal %Total Male FemaleTotal Male FemaleTotal Male Female
North America and Western Europe
South and West Asia
Sub-Saharan Africa
90
02
Education f
or A
ll G
lobal M
onitorin
g R
eport
A N N E X
2 7 2

… … … … … … … … … … … … … … …… … … … … … … … … … … … … … …… … … 95 96 94 96 96 96 … … 4 56 3 5399.* 99.* 99.* 99 99 99 100 100 100 2 50.* 1 49 0.8 48… … … … … … … … … … … … … … …
99.* 98.* 99.* 99.* 98.* 99.* 99 99 99 6 37.* 6 34.* 6 3095.* 95.* 96.* 97.* 96.* 98.* … … … 176 39.* 148 34.* … …
… … … … … … … … … … … … … … …… … … … … … … … … … … … … … …… … … … … … … … … … … … … … …… … … … … … … … … … … … … … …
100.* 100.* 100.* 100 100 100 100 100 100 0.4 44.* 0.2 37 0.1 36… … … … … … … … … … … … … … …… … … … … … … … … … … … … … …… … … … … … … … … … … … … … …… … … … … … … … … … … … … … …
99.* 99.* 99.* 99 99 99 99 100 99 16 49.* 10 50 6.0 56… … … … … … … … … … … … … … …… … … … … … … … … … … … … … …… … … … … … … … … … … … … … …… … … 100 100 100 100 100 100 … … 7 46 4 46… … … … … … … … … … … … … … …
98.* 97.* 99.* 97 96 99 98 97 99 1 26.* 2 24 0.9 21… … … … … … … … … … … … … … …… … … … … … … … … … … … … … …… … … … … … … … … … … … … … …
99.* 99.* 99.* 100 100 100 100 100 100 13 46.* 5 44 2 42… … … … … … … … … … … … … … …
100.* 100.* 100.* 100 100 100 100 100 100 29 47.* 17 48 12 50… … … … … … … … … … … … … … …… … … … … … … … … … … … … … …… … … … … … … … … … … … … … …… … … … … … … … … … … … … … …
… … … 34.* 51.* 18.* … … … … … 3 324 60.* … …
45.* 52.* 38.* 71 70 72 83 80 85 12 833 55.* 9 175 48 5 908 41… … … 76 81 70 88 90 87 … … 36 59 17 5562.* 74.* 49.* 81 86 76 88 90 86 63 893 64.* 41 644 62 29 320 5887.* 92.* 81.* 98 98 97 99 99 99 1 399 70.* 423 61 169 5298.* 98.* 98.* 98 98 98 98 98 99 1 45.* 1 42 1 3750.* 68.* 33.* 78 85 71 88 91 85 1 847 67.* 1 228 64 819 60… … … 69.* 79.* 58.* 78 83 72 … … 11 151 65.* 8 771 60… … … 97.* 97.* 98.* 99 98 99 … … 90 40.* 43 35
… … … 72.* 84.* 63.* … … … … … 888 70.* … …
40.* 55.* 27.* 51 63 40 60 69 51 612 62.* 870 61 895 6189.* 86.* 92.* 94 93 95 95 95 96 31 35.* 26 39 20 4320.* 27.* 14.* 34 40 28 45 47 43 1 495 54.* 1 912 54 2 068 5154.* 59.* 48.* 73.* 77.* 70.* … … … 495 56.* 473 56.* … …… … … … … … … … … … … … … … …
88.* 90.* 86.* 97 96 98 99 98 100 8 58.* 4 40 1 2048.* 63.* 35.* 59.* 70.* 47.* … … … 270 64.* 365 65.* … …
17.* … … 38.* 56.* 23.* … … … 1 042 …. 1 235 63.* … …… … … … … … … … … … … … … … …
94 96 91 98 99 97 100 100 100 35 69 14 67 3 6049.* 60.* 38.* 61.* 71.* 52.* … … … 1 054 60.* 1 587 62.* … …… … … 70.* 78.* 63.* … … … … … 3 512 63.* … …… … … 95.* 95.* 95.* … … … … … 5 49.* … …… … … … … … … … … … … … … … …
Saint LuciaSaint Vincent/Grenad.
SurinameTrinidad and Tobago
Turks and Caicos IslandsUruguay
Venezuela, B. R.
AndorraAustria
BelgiumCanadaCyprus
DenmarkFinlandFrance
GermanyGreeceIcelandIreland
IsraelItaly
LuxembourgMalta
MonacoNetherlands
NorwayPortugal
San MarinoSpain
SwedenSwitzerland
United KingdomUnited States
AfghanistanBangladesh
BhutanIndia 2
Iran, Islamic Republic ofMaldives
NepalPakistan
Sri Lanka 2
AngolaBenin
BotswanaBurkina Faso
BurundiCameroon
Cape VerdeCentral African Republic
ChadComoros
CongoCôte d’IvoireD. R. Congo
Equatorial GuineaEritrea
Country or territory
YOUTH LITERACY RATE (15-24)(%) YOUTH ILLITERATES (15-24)
(000) FemaleTotal %
1985-19941 2000-20061Projected
20151985-19941 2000-20061Projected
2015
(000) FemaleTotal %
(000) FemaleTotal %Total Male FemaleTotal Male FemaleTotal Male Female
S TAT I S T I C A L TA B L E S
Ta b l e 2
North America and Western Europe
South and West Asia
Sub-Saharan Africa
2 7 3

27.* 36.* 19.* 36.* 50.* 23.* … … … 23 045 57.* 28 859 64.* … …
72.* 79.* 65.* 85 90 81 91 94 88 165 64.* 124 65 92 66… … … … … … … … … … … … … … …… … … 64 71 57 71 76 66 … … 5 053 59 5 152 58… … … 29.* 43.* 18.* … … … … … 3 628 59.* … …… … … … … … … … … … … … … … …… … … 74.* 78.* 70.* … … … … … 5 473 58.* … …… … … 82.* 74.* 90.* … … … … … 205 31.* … …
41 52 30 54 60 49 64 65 64 652 60 865 56 946 51… … … 71.* 77.* 65.* … … … … … 3 154 60.* … …
49.* 65.* 34.* 71 79 63 79 83 74 2 197 68.* 2 094 64 2 009 61… … … 23 31 16 27 34 20 … … 4 832 58 6 146 5780.* 85.* 75.* 87 90 84 90 92 89 150 63.* 124 62 103 60… … … 44 57 32 49 58 41 … … 6 566 64 7 112 6076.* 78.* 74.* 88 88 87 90 90 91 198 56.* 156 54 150 49… … … 30 44 16 36 48 23 … … 5 014 60 6 334 6055.* 68.* 44.* 71 79 63 79 85 74 23 296 64.* 23 451 65 21 577 6358.* … … 65.* 71.* 60.* … … … 1 468 … 1 871 61.* … …
73.* 85.* 62.* 87 93 82 91 94 88 17 73.* 11 74 10 6827.* 37.* 18.* 42 53 32 47 56 38 2 964 56.* 4 067 60 4 802 5988.* 87.* 89.* 92.* 91.* 92.* … … … … … … … … …… … … 37 49 26 47 58 37 … … 2 066 61 2 080 61… … … … … … … … … … … … … … …… … … 88 88 87 91 92 91 … … 4 088 55 3 107 5567.* 70.* 65.* 80.* 81.* 78.* … … … 126 59.* 141 56.* … …… … … 53.* 69.* 38.* … … … … … 1 706 67.* … …
56.* 68.* 45.* 73 81 64 81 86 75 4 185 64.* 4 154 66 4 045 6459.* 71.* 48.* 72 79 65 74 79 70 5 217 65.* 6 157 63 7 185 5965.* 73.* 57.* 68.* 76.* 60.* … … … 1 541 62.* 2 039 63.* … …
84.* 89.* 79.* 91 94 88 94 96 93 990 66.* 754 67 532 65
76 82 70 84 88 79 87 90 83 871 096 63 775 894 64 706 130 64
98 99 97 99 100 99 100 100 100 3 730 84 1 519 71 752 5999 99 99 99 99 99 99 100 99 8 686 64 7 660 62 7 047 5968 77 59 79 85 73 84 88 79 858 680 63 766 716 64 698 332 64
58 70 46 72 82 61 79 87 71 55 311 63 57 798 67 53 339 6996 98 94 97 99 96 98 99 97 11 945 78 8 235 80 6 801 7998 99 97 99 99 98 99 99 100 960 74 784 68 328 5082 89 75 93 96 90 95 97 94 229 172 69 112 637 71 81 398 7182 89 75 93 96 90 96 97 94 227 859 69 110 859 71 79 420 7194 94 93 93 93 92 93 93 93 1 313 56 1 778 55 1 979 5287 88 86 91 91 90 93 94 93 39 575 55 36 946 55 31 225 5466 65 67 74 72 76 78 75 81 2 870 50 2 803 48 2 749 4587 88 86 91 92 90 94 94 93 36 705 55 34 142 56 28 476 5599 99 99 99 99 99 99 99 99 6 400 63 5 682 61 5 115 5948 60 34 64 74 52 71 79 62 394 719 61 392 725 63 380 256 6353 63 45 62 71 53 72 78 67 133 013 61 161 088 62 147 669 60
EthiopiaGabonGambiaGhanaGuineaGuinea-BissauKenyaLesothoLiberiaMadagascarMalawiMaliMauritiusMozambiqueNamibiaNigerNigeriaRwandaSao Tome and PrincipeSenegalSeychellesSierra LeoneSomaliaSouth AfricaSwazilandTogoUgandaUnited Republic of TanzaniaZambiaZimbabwe
World
Countries in transitionDeveloped countriesDeveloping countries
Arab StatesCentral and Eastern EuropeCentral AsiaEast Asia and the Pacific
East AsiaPacific
Latin America/CaribbeanCaribbeanLatin America
N. America/W. EuropeSouth and West AsiaSub-Saharan Africa
Table 2 (continued)
ADULT LITERACY RATE (15 and over)(%) ADULT ILLITERATES (15 and over)
(000) FemaleTotal %
1985-19941 2000-20061Projected
20151985-19941 2000-20061Projected
2015
Country or territory (000) FemaleTotal %
(000) FemaleTotal %Total Male FemaleTotal Male FemaleTotal Male Female
90
02
Education f
or A
ll G
lobal M
onitorin
g R
eport
A N N E X
Weighted average Sum % F Sum % F Sum % F
Note: For countries indicated with (*), national observed literacy data are used. For all others, UIS literacy estimates are used. The estimates were generated using the UIS Global Age-specificLiteracy Projections model. Those in the most recent period refer to 2006 and are based on themost recent observed data available for each country.
The population used to generate the number of illiterates is from the United NationsPopulation Division estimates (2007), revision 2006. For countries with national observedliteracy data, the population corresponding to the year of the census or survey was used.For countries with UIS estimates, populations used are for 1994 and 2006.
2 7 4

34.* 39.* 28.* 50.* 62.* 39.* … … … 7 404 54.* 8 068 62.* … …
93.* 94.* 92.* 97 98 96 98 99 97 13 59.* 9 66 5 72… … … … … … … … … … … … … … …… … … 77 79 75 84 84 84 … … 1 111 54 867 48… … … 47.* 59.* 34.* … … … … … 967 61.* … …… … … … … … … … … … … … … … …… … … 80.* 80.* 81.* … … … … … 1 588 49.* … …… … … … … … … … … … … … … … …
51 56 47 70 67 74 80 72 87 196 54 212 44 200 31… … … 70.* 73.* 68.* … … … … … 1 108 54.* … …
59.* 70.* 49.* 82 83 81 90 89 91 616 64.* 484 53 380 45… … … 29 36 22 33 38 27 … … 1 732 55 2 175 5591.* 91.* 92.* 96 95 97 97 96 98 18 46.* 8 37 6 31… … … 52 58 46 57 59 56 … … 1 977 56 2 225 5288.* 86.* 90.* 93 91 94 94 91 96 35 40.* 34 39 34 32… … … 38 53 25 46 56 36 … … 1 493 64 1 884 6071.* 81.* 62.* 86 88 84 92 92 91 5 091 67.* 4 171 58 3 078 5175.* … … 78.* 79.* 77.* … … … 305 … 524 52.* … …
94.* 96.* 92.* 95 95 95 95 93 96 1 65.* 2 48 2 3538.* 49.* 28.* 51 58 43 56 61 51 849 58.* 1 224 58 1 322 5599.* 98.* 99.* 99.* 99.* 99.* … … … … … … … … …… … … 52 63 42 67 76 59 … … 522 61 430 63… … … … … … … … … … … … … … …… … … 95 94 96 98 97 98 … … 491 41 218 3584.* 83.* 84.* 88.* 87.* 90.* … … … 24 51.* 33 44.* … …… … … 74.* 84.* 64.* … … … … … 346 69.* … …
70.* 77.* 63.* 85 88 83 91 92 91 1 061 62.* 893 58 711 5282.* 86.* 78.* 78 79 76 77 76 77 831 62.* 1 795 53 2 306 4966.* 67.* 66.* 69.* 73.* 66.* … … … 543 51.* 758 55.* … …
95.* 97.* 94.* 98 98 98 99 99 100 102 62.* 62 41 25 16
84 88 79 89 91 86 92 93 91 166 725 62 130 498 59 92 655 54
100 100 100 100 100 100 100 100 100 122 46 149 43 133 3399 99 99 99 99 99 99 99 99 752 53 789 52 786 5280 85 75 87 90 84 91 92 90 165 852 62 129 559 59 91 736 54
76 84 67 86 91 81 93 95 90 10 934 66 8 949 67 5 192 6398 99 97 99 99 98 99 99 98 1 056 71 774 67 643 63
100 100 100 99 99 100 99 99 100 58 47 82 43 108 2795 97 93 98 98 98 99 99 99 19 961 68 6 449 54 3 935 4795 97 93 98 98 98 99 99 99 19 607 69 5 974 54 3 404 4792 93 92 91 90 91 90 89 92 354 54 475 48 531 4094 93 94 97 96 97 98 97 98 5 638 46 3 290 43 2 170 3878 75 81 86 82 90 91 87 95 578 44 462 36 303 2694 94 95 97 97 97 98 98 99 5 060 46 2 828 45 1 867 4099 100 99 99 100 99 99 100 99 476 52 495 52 497 5261 72 49 79 84 74 87 89 85 92 147 62 67 074 60 46 007 5664 70 58 71 76 67 81 82 80 36 456 59 43 385 59 34 101 53
EthiopiaGabon
GambiaGhana
GuineaGuinea-Bissau
KenyaLesothoLiberia
MadagascarMalawi
MaliMauritius
MozambiqueNamibia
NigerNigeria
RwandaSao Tome and Principe
SenegalSeychelles
Sierra LeoneSomalia
South AfricaSwaziland
TogoUganda
United Republic of TanzaniaZambia
Zimbabwe
World
Countries in transitionDeveloped countries
Developing countries
Arab StatesCentral and Eastern Europe
Central AsiaEast Asia and the Pacific
East AsiaPacific
Latin America/CaribbeanCaribbean
Latin AmericaN. America/W. Europe
South and West AsiaSub-Saharan Africa
Country or territory
YOUTH LITERACY RATE (15-24)(%) YOUTH ILLITERATES (15-24)
(000) FemaleTotal %
1985-19941 2000-20061Projected
20151985-19941 2000-20061Projected
2015
(000) FemaleTotal %
(000) FemaleTotal %Total Male FemaleTotal Male FemaleTotal Male Female
S TAT I S T I C A L TA B L E S
Ta b l e 2
Weighted average Sum % F Sum % F Sum % F
2 7 5
1. Data are for the most recent year available during the period specified.See the web version of the introduction to the statistical tables for a broader explanation of national literacy definitions, assessment methods, and sources and years of data.2. Literacy data for the most recent year do not include some geographic regions.

31 33 6 4 3 11 7 39 2211 14 8 9 5 10 34 65 4185 126 10 29 21 33 1 23 1829 34 14 6 4 18 38 67 3782 105 15 8 5 21 25 51 3619 22 12 4 2 9 27 70 12
8 10 7 10 11 24 12 26 922 26 6 4 5 11 27 35 1118 20 7 5 3 15 … … 2363 92 … 32 13 35 20 78 5731 36 15 10 9 18 31 66 1512 14 8 18 7 10 … 92 7318 20 7 3 1 10 27 … …
8 10 10 6 2 8 12 48 2119 22 11 14 11 20 31 60 3065 105 31 41 16 43 16 47 4016 18 9 10 9 22 29 37 1620 22 7 4 2 12 47 … 22
8 9 15 14 15 17 34 52 2959 79 32 46 12 53 12 76 …
19 22 7 8 7 22 2 38 209 12 4 1 1 3 9 38 4
12 14 5 2 3 7 18 29 1012 14 10 … … … … … …
6 8 6 1 1 1 23 … …
4 5 7 … … … … … …
7 10 4 … … … … … …
7 8 9 … … … … … …
10 14 5 … … … … … …
9 11 4 … … … … … …
22 24 4 3 3 5 19 35 137 8 6 … … … … … …
16 19 6 4 4 8 46 18 215 18 8 3 2 10 16 41 …
17 21 6 3 4 13 … … …
12 14 5 2 3 6 15 39 87 8 7 … … … … … …
5 6 6 … … … … … …
15 17 6 2 2 9 37 8 1028 32 16 4 1 12 21 38 2413 16 4 1 0 3 6 83 11
29 34 8 4 5 13 33 57 1572 86 12 7 2 13 7 39 1639 41 7 3 2 12 18 12 1224 29 6 4 4 13 17 39 1653 64 5 3 4 14 32 49 2640 54 6 6 2 21 57 57 6560 78 10 17 7 27 25 15 3475 95 4 11 6 15 11 54 3755 66 5 5 3 15 26 45 38
4 6 7 … … … … … …
6 7 10 … … … … … …
63 89 11 36 7 37 60 82 54
AlgeriaBahrainDjiboutiEgyptIraqJordanKuwaitLebanonLibyan Arab JamahiriyaMauritaniaMoroccoOmanPalestinian A. T.QatarSaudi ArabiaSudanSyrian Arab RepublicTunisiaUnited Arab EmiratesYemen
AlbaniaBelarusBosnia and HerzegovinaBulgariaCroatiaCzech RepublicEstoniaHungaryLatviaLithuaniaMontenegroPolandRepublic of MoldovaRomaniaRussian FederationSerbiaSlovakiaSloveniaTFYR MacedoniaTurkeyUkraine
ArmeniaAzerbaijanGeorgiaKazakhstanKyrgyzstanMongoliaTajikistanTurkmenistanUzbekistan
Australia6
Brunei DarussalamCambodia
90
02
Education f
or A
ll G
lobal M
onitorin
g R
eport
A N N E X
Table 3AEarly childhood care and education (ECCE): care
CHILD SURVIVAL1 CHILD WELL-BEING2
2000-200632000-200632000-200632000-200632000-200632000-200631999-20063
% of children who are:
Country or territory
Arab States
Central and Eastern Europe
Central Asia
East Asia and the Pacific
Stillbreastfeeding
(20-23 months)
Breastfed withcomplementary
food
(6-9 months)
Exclusivelybreastfed
(<6 months)
% of children under age 5 suffering from:
Stuntingmoderate
and severe
Wastingmoderate
and severe
Underweightmoderate
and severe
Infants with low
birth weight
(%)
2005-2010
Under-5 mortality
rate
(‰)
2005-2010
Infant mortality
rate
(‰)
2 7 6
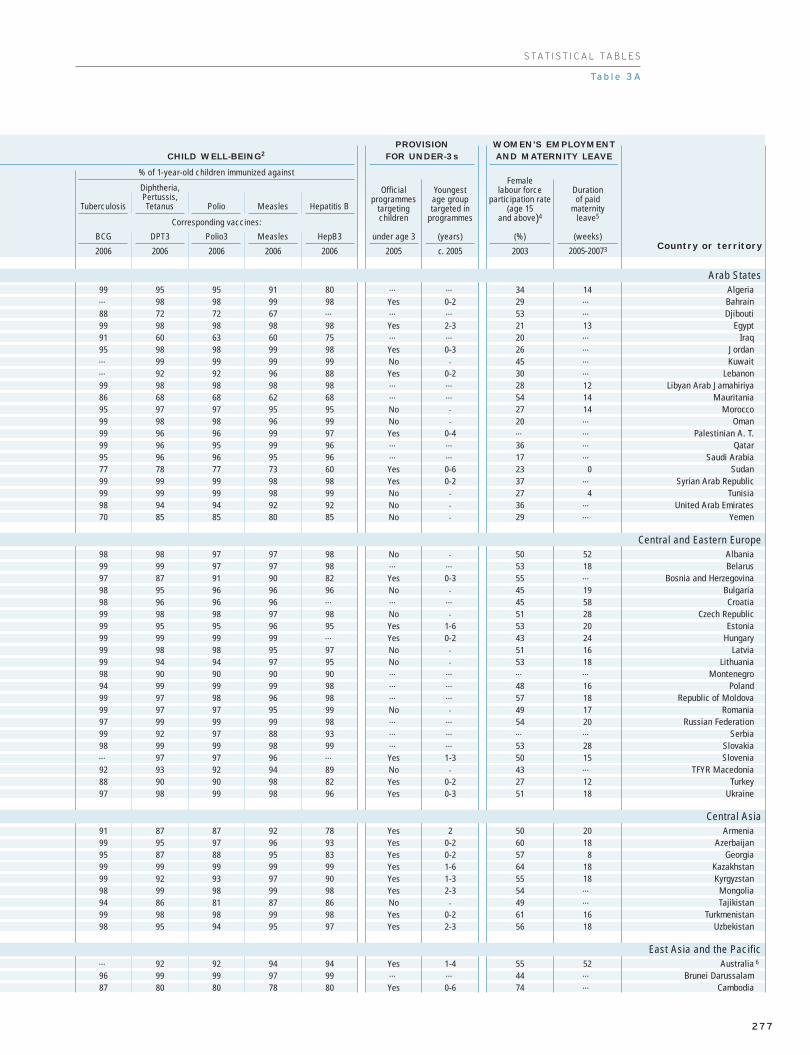
99 95 95 91 80 … … 34 14… 98 98 99 98 Yes 0-2 29 …
88 72 72 67 … … … 53 …
99 98 98 98 98 Yes 2-3 21 1391 60 63 60 75 … … 20 …
95 98 98 99 98 Yes 0-3 26 …… 99 99 99 99 No . 45 …… 92 92 96 88 Yes 0-2 30 …
99 98 98 98 98 … … 28 1286 68 68 62 68 … … 54 1495 97 97 95 95 No . 27 1499 98 98 96 99 No . 20 …
99 96 96 99 97 Yes 0-4 … …
99 96 95 99 96 … … 36 …
95 96 96 95 96 … … 17 …
77 78 77 73 60 Yes 0-6 23 099 99 99 98 98 Yes 0-2 37 …
99 99 99 98 99 No . 27 498 94 94 92 92 No . 36 …
70 85 85 80 85 No . 29 …
98 98 97 97 98 No . 50 5299 99 97 97 98 … … 53 1897 87 91 90 82 Yes 0-3 55 …
98 95 96 96 96 No . 45 1998 96 96 96 … … … 45 5899 98 98 97 98 No . 51 2899 95 95 96 95 Yes 1-6 53 2099 99 99 99 … Yes 0-2 43 2499 98 98 95 97 No . 51 1699 94 94 97 95 No . 53 1898 90 90 90 90 … … … …
94 99 99 99 98 … … 48 1699 97 98 96 98 … … 57 1899 97 97 95 99 No . 49 1797 99 99 99 98 … … 54 2099 92 97 88 93 … … … …
98 99 99 98 99 … … 53 28… 97 97 96 … Yes 1-3 50 1592 93 92 94 89 No . 43 …
88 90 90 98 82 Yes 0-2 27 1297 98 99 98 96 Yes 0-3 51 18
91 87 87 92 78 Yes 2 50 2099 95 97 96 93 Yes 0-2 60 1895 87 88 95 83 Yes 0-2 57 899 99 99 99 99 Yes 1-6 64 1899 92 93 97 90 Yes 1-3 55 1898 99 98 99 98 Yes 2-3 54 …
94 86 81 87 86 No . 49 …
99 98 98 99 98 Yes 0-2 61 1698 95 94 95 97 Yes 2-3 56 18
… 92 92 94 94 Yes 1-4 55 5296 99 99 97 99 … … 44 …
87 80 80 78 80 Yes 0-6 74 …
AlgeriaBahrainDjibouti
EgyptIraq
JordanKuwait
LebanonLibyan Arab Jamahiriya
MauritaniaMorocco
OmanPalestinian A. T.
QatarSaudi Arabia
SudanSyrian Arab Republic
TunisiaUnited Arab Emirates
Yemen
AlbaniaBelarus
Bosnia and HerzegovinaBulgariaCroatia
Czech RepublicEstonia
HungaryLatvia
LithuaniaMontenegro
PolandRepublic of Moldova
RomaniaRussian Federation
SerbiaSlovakiaSlovenia
TFYR MacedoniaTurkey
Ukraine
ArmeniaAzerbaijan
GeorgiaKazakhstanKyrgyzstan
MongoliaTajikistan
TurkmenistanUzbekistan
Australia 6
Brunei DarussalamCambodia
S TAT I S T I C A L TA B L E S
Ta b l e 3 A
CHILD WELL-BEING2PROVISION
FOR UNDER-3s
% of 1-year-old children immunized against
Corresponding vaccines:
Country or territory
WOMEN’S EMPLOYMENTAND MATERNITY LEAVE
Arab States
Central and Eastern Europe
Central Asia
East Asia and the Pacific
Tuberculosis
Diphtheria,Pertussis,Tetanus Polio Measles Hepatitis B
2006
BCG
2006
DPT3
2006
Polio3
2006
Measles
2006 2005 c. 2005
HepB3
Officialprogrammes
targetingchildren
under age 3
Youngest age grouptargeted in
programmes
(years)
2003 2005-20073
Female labour force
participation rate(age 15
and above)4
(%)
Duration of paid
maternity leave5
(weeks)
2 7 7

23 29 2 7 … 11 51 32 15… … 3 10 … … 19 … …
48 62 7 23 7 37 65 31 3720 24 10 … … … 47 … …
27 32 9 28 … … 40 75 593 4 8 … … … … … …
… … 5 13 … … 80 … …
51 67 14 40 15 42 23 10 477 8 … … … … … … …
9 11 9 8 … … 29 … 12… … 12 … … … 63 … …
34 42 18 15 … … 60 … …
66 97 15 32 9 32 15 66 67… … … … … … … … …
5 6 6 … … … … … …… … 0 … … … … … …… … 9 … … … 59 … …
61 84 11 … … … 59 74 6623 27 20 28 6 30 34 58 32
4 5 4 … … … … … …
22 27 4 … … … … … …
3 4 8 3 2 2 … … …
55 72 13 … … … 65 … …
11 15 9 9 4 12 5 43 1967 92 … … … … … … …… … … … … … … … …
19 22 3 … … … 62 … …… … 5 … … … … … …
28 34 6 … … … 50 … …
20 23 7 25 7 30 17 70 23
… … … … … … … … …… … 5 … … … … … …
13 16 7 4 1 4 … … …
17 20 … … … … … … …
14 17 7 … … … … … …
10 11 13 … … … … … …
16 20 6 7 1 18 24 54 23… … … … … … … … …
46 61 7 8 1 27 54 74 4624 29 8 6 2 11 … 30 17… … … … … … … … …… … … … … … … … …
7 9 6 1 0 1 63 47 …
19 26 9 7 1 12 47 65 3210 11 7 5 2 6 35 47 12
5 7 5 4 2 5 41 42 9… … 10 … … … … … …
30 33 11 5 1 7 4 36 1521 26 16 9 2 23 40 77 2322 29 7 10 1 19 24 76 4334 41 9 … … … 39 … …
30 39 12 23 2 49 51 67 4743 57 13 14 11 11 11 42 3149 72 25 22 9 24 41 87 3528 42 10 11 1 25 30 69 4814 17 12 4 4 3 15 36 2417 20 8 5 2 13 38 36 21… … … … … … … … …
15 17 … … … … … … …
21 26 12 10 2 20 31 68 39
ChinaCook IslandsDPR KoreaFijiIndonesiaJapanKiribatiLao PDRMacao, ChinaMalaysiaMarshall IslandsMicronesiaMyanmarNauruNew ZealandNiuePalauPapua New GuineaPhilippinesRepublic of KoreaSamoaSingaporeSolomon Islands7
ThailandTimor-LesteTokelauTongaTuvaluVanuatuViet Nam
AnguillaAntigua and BarbudaArgentinaArubaBahamasBarbadosBelizeBermudaBoliviaBrazilBritish Virgin IslandsCayman IslandsChileColombiaCosta RicaCubaDominicaDominican RepublicEcuadorEl SalvadorGrenadaGuatemalaGuyanaHaitiHondurasJamaicaMexicoMontserratNetherlands AntillesNicaragua
Table 3A (continued)
CHILD SURVIVAL1 CHILD WELL-BEING2
2000-200632000-200632000-200632000-200632000-200632000-200631999-20063
% of children who are:
Country or territory
Latin America and the Caribbean
Stillbreastfeeding
(20-23 months)
Breastfed withcomplementary
food
(6-9 months)
Exclusivelybreastfed
(<6 months)
% of children under age 5 suffering from:
Stuntingmoderate
and severe
Wastingmoderate
and severe
Underweightmoderate
and severe
Infants with low
birth weight
(%)
2005-2010
Under-5 mortality
rate
(‰)
2005-2010
Infant mortality
rate
(‰)
90
02
Education f
or A
ll G
lobal M
onitorin
g R
eport
A N N E X
2 7 8

92 93 94 93 91 Yes 0-3 70 1399 99 99 99 99 … … … …
96 89 98 96 96 Yes 0-3 51 …
93 81 83 99 81 No . 50 …
82 70 70 72 70 Yes 0-6 51 0… 99 97 99 … Yes 0-6 49 1499 86 86 61 88 No . … …
61 57 56 48 57 Yes 0-2 54 12… … … … … No . 54 …
99 96 96 90 87 Yes 0-3 45 092 74 95 96 97 … … … 055 67 81 83 84 … … … …
85 82 82 78 75 … … 68 1299 72 45 99 99 … … … …… 89 89 82 87 Yes 0-5 59 1499 99 99 99 99 … … … …… 98 98 98 98 … … … …
75 75 75 65 70 No . 72 …
91 88 88 92 77 No . 52 998 98 98 99 99 Yes 0-5 49 1284 56 57 54 56 … … 40 …
98 95 95 93 94 Yes 2-6 50 1284 91 91 84 93 No . 55 099 98 98 96 96 Yes 0-5 65 1372 67 66 64 … … … 54 …… … … … … … … … …
99 99 99 99 99 … … 46 …
99 97 97 84 97 … … … …
92 85 85 99 85 … … 79 1295 94 94 93 93 Yes 0-2 72 17
… … … … … … … … …… 99 99 99 99 … … … 1399 91 92 97 84 Yes 0-5 52 13… … … … … … … … …… 95 94 88 96 … … 64 13… 84 85 92 84 Yes 0-2 65 1297 98 98 99 98 … … 42 14… … … … … … … … 493 81 79 81 81 Yes 0-4 63 1399 99 99 99 97 Yes 0-3 57 17… … … … … Yes 0-3 54 13… … … … … … … … …
98 94 94 91 94 Yes 0-2 37 1888 86 86 88 86 Yes 0-5 60 1288 91 91 89 90 Yes 0-3 42 1799 89 99 96 89 Yes 1-6 43 1899 95 88 99 7 … … … 1295 81 85 99 74 … … 44 1299 98 97 97 98 Yes 0-4 54 1293 96 96 98 96 Yes 0-3 47 12… 91 91 98 91 Yes 0-2 … 1296 80 81 95 80 Yes 0-6 33 1296 93 92 90 93 No . 43 1375 53 52 58 … Yes 0-3 55 …
90 87 87 91 87 Yes 0-3 44 1290 85 86 87 87 No . 57 899 98 98 96 98 Yes 0-3 39 12… … … … … … … … …… … … … … … … 50 …
99 87 88 99 87 Yes 0-3 36 12
ChinaCook Islands
DPR KoreaFiji
IndonesiaJapan
KiribatiLao PDR
Macao, ChinaMalaysia
Marshall IslandsMicronesia
MyanmarNauru
New ZealandNiue
PalauPapua New Guinea
PhilippinesRepublic of Korea
SamoaSingapore
Solomon Islands 7
ThailandTimor-Leste
TokelauTongaTuvalu
VanuatuViet Nam
AnguillaAntigua and Barbuda
ArgentinaAruba
BahamasBarbados
BelizeBermuda
BoliviaBrazil
British Virgin IslandsCayman Islands
ChileColombia
Costa RicaCuba
DominicaDominican Republic
EcuadorEl Salvador
GrenadaGuatemala
GuyanaHaiti
HondurasJamaicaMexico
MontserratNetherlands Antilles
Nicaragua
CHILD WELL-BEING2PROVISION
FOR UNDER-3s
% of 1-year-old children immunized against
Corresponding vaccines:
Country or territory
WOMEN’S EMPLOYMENTAND MATERNITY LEAVE
Latin America and the Caribbean
Tuberculosis
Diphtheria,Pertussis,Tetanus Polio Measles Hepatitis B
2006
BCG
2006
DPT3
2006
Polio3
2006
Measles
2006 2005 c. 2005
HepB3
Officialprogrammes
targetingchildren
under age 3
Youngest age grouptargeted in
programmes
(years)
2003 2005-20073
Female labour force
participation rate(age 15
and above)4
(%)
Duration of paid
maternity leave5
(weeks)
S TAT I S T I C A L TA B L E S
Ta b l e 3 A
2 7 9

18 24 10 8 1 18 25 38 2132 38 9 5 1 14 22 60 …
21 29 11 8 1 24 64 81 41… … 9 … … … 56 … …
13 16 12 … … … … … …
23 28 5 … … … … … …
28 35 13 13 7 10 9 25 1112 18 19 6 4 4 13 43 22… … … … … … … … …
13 16 8 5 2 11 … … …
17 22 9 5 4 13 7 50 31
… … … … … … … … …
4 5 7 … … … … … …
4 5 8 … … … … … …
5 6 6 … … … … … …
6 7 … … … … … … …
4 6 5 … … … … … …
4 5 4 … … … … … …
4 5 7 … … … … … …
4 5 7 … … … … … …
7 8 8 … … … … … …
3 4 4 … … … … … …
5 6 6 … … … … … …
5 6 8 … … … … … …
5 6 6 … … … … … …
5 7 8 … … … … … …
6 8 6 … … … … … …… … … … … … … … …
5 6 … … … … … … …
3 4 5 … … … … … …
5 7 8 … … … … … …… … … … … … … … …
4 5 6 … … … … … …
3 4 4 … … … … … …
4 5 6 … … … … … …
5 6 8 … … … … … …
6 8 8 2 0 1 … … …
157 235 … 39 7 54 … 29 5452 69 22 48 13 43 37 52 8945 65 15 19 3 40 … … …
55 79 30 43 20 48 46 56 …
31 35 7 11 5 15 44 … 034 42 22 30 13 25 10 85 …
54 72 21 39 13 49 53 75 9567 95 19 38 13 37 16 31 5611 13 22 29 14 14 53 … 73
132 231 12 31 6 45 11 77 3798 146 16 23 7 38 70 50 5746 68 10 13 5 23 34 57 11
104 181 16 37 23 35 7 50 8599 169 11 39 7 53 45 88 …
88 144 11 19 6 30 21 64 2125 29 13 … … … 57 64 1397 163 13 29 10 38 23 55 47
119 189 22 37 14 41 2 77 6548 63 25 25 8 44 21 34 45
PanamaParaguayPeruSaint Kitts and NevisSaint LuciaSaint Vincent/Grenad.SurinameTrinidad and TobagoTurks and Caicos IslandsUruguayVenezuela, Bolivarian Rep. of
AndorraAustriaBelgiumCanadaCyprusDenmarkFinlandFranceGermanyGreeceIcelandIrelandIsraelItalyLuxembourgMaltaMonacoNetherlandsNorwayPortugalSan MarinoSpainSwedenSwitzerlandUnited KingdomUnited States7
AfghanistanBangladeshBhutanIndiaIran, Islamic Republic ofMaldivesNepalPakistanSri Lanka
AngolaBeninBotswanaBurkina FasoBurundiCameroonCape VerdeCentral African RepublicChadComoros
Table 3A (continued)
CHILD SURVIVAL1 CHILD WELL-BEING2
2000-200632000-200632000-200632000-200632000-200632000-200631999-20063
% of children who are:
Country or territory
North America and Western Europe
South and West Asia
Sub-Saharan Africa
Stillbreastfeeding
(20-23 months)
Breastfed withcomplementary
food
(6-9 months)
Exclusivelybreastfed
(<6 months)
% of children under age 5 suffering from:
Stuntingmoderate
and severe
Wastingmoderate
and severe
Underweightmoderate
and severe
Infants with low
birth weight
(%)
2005-2010
Under-5 mortality
rate
(‰)
2005-2010
Infant mortality
rate
(‰)
90
02
Education f
or A
ll G
lobal M
onitorin
g R
eport
A N N E X
2 8 0
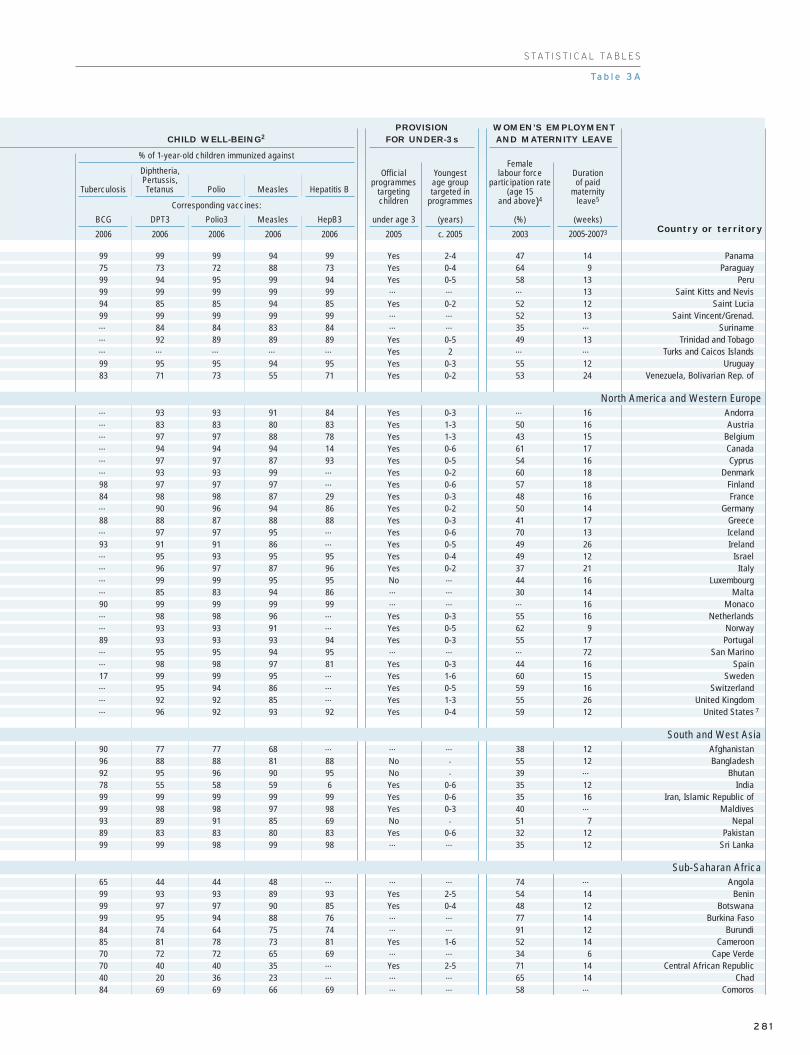
99 99 99 94 99 Yes 2-4 47 1475 73 72 88 73 Yes 0-4 64 999 94 95 99 94 Yes 0-5 58 1399 99 99 99 99 … … … 1394 85 85 94 85 Yes 0-2 52 1299 99 99 99 99 … … 52 13… 84 84 83 84 … … 35 …… 92 89 89 89 Yes 0-5 49 13… … … … … Yes 2 … …
99 95 95 94 95 Yes 0-3 55 1283 71 73 55 71 Yes 0-2 53 24
… 93 93 91 84 Yes 0-3 … 16… 83 83 80 83 Yes 1-3 50 16… 97 97 88 78 Yes 1-3 43 15… 94 94 94 14 Yes 0-6 61 17… 97 97 87 93 Yes 0-5 54 16… 93 93 99 … Yes 0-2 60 1898 97 97 97 … Yes 0-6 57 1884 98 98 87 29 Yes 0-3 48 16… 90 96 94 86 Yes 0-2 50 1488 88 87 88 88 Yes 0-3 41 17… 97 97 95 … Yes 0-6 70 1393 91 91 86 … Yes 0-5 49 26… 95 93 95 95 Yes 0-4 49 12… 96 97 87 96 Yes 0-2 37 21… 99 99 95 95 No … 44 16… 85 83 94 86 … … 30 1490 99 99 99 99 … … … 16… 98 98 96 … Yes 0-3 55 16… 93 93 91 … Yes 0-5 62 989 93 93 93 94 Yes 0-3 55 17… 95 95 94 95 … … … 72… 98 98 97 81 Yes 0-3 44 1617 99 99 95 … Yes 1-6 60 15… 95 94 86 … Yes 0-5 59 16… 92 92 85 … Yes 1-3 55 26… 96 92 93 92 Yes 0-4 59 12
90 77 77 68 … … … 38 1296 88 88 81 88 No . 55 1292 95 96 90 95 No . 39 …
78 55 58 59 6 Yes 0-6 35 1299 99 99 99 99 Yes 0-6 35 1699 98 98 97 98 Yes 0-3 40 …
93 89 91 85 69 No . 51 789 83 83 80 83 Yes 0-6 32 1299 99 98 99 98 … … 35 12
65 44 44 48 … … … 74 …
99 93 93 89 93 Yes 2-5 54 1499 97 97 90 85 Yes 0-4 48 1299 95 94 88 76 … … 77 1484 74 64 75 74 … … 91 1285 81 78 73 81 Yes 1-6 52 1470 72 72 65 69 … … 34 670 40 40 35 … Yes 2-5 71 1440 20 36 23 … … … 65 1484 69 69 66 69 … … 58 …
PanamaParaguay
PeruSaint Kitts and Nevis
Saint LuciaSaint Vincent/Grenad.
SurinameTrinidad and Tobago
Turks and Caicos IslandsUruguay
Venezuela, Bolivarian Rep. of
AndorraAustria
BelgiumCanadaCyprus
DenmarkFinlandFrance
GermanyGreeceIcelandIreland
IsraelItaly
LuxembourgMalta
MonacoNetherlands
NorwayPortugal
San MarinoSpain
SwedenSwitzerland
United KingdomUnited States 7
AfghanistanBangladesh
BhutanIndia
Iran, Islamic Republic ofMaldives
NepalPakistan
Sri Lanka
AngolaBenin
BotswanaBurkina Faso
BurundiCameroon
Cape VerdeCentral African Republic
ChadComoros
CHILD WELL-BEING2PROVISION
FOR UNDER-3s
% of 1-year-old children immunized against
Corresponding vaccines:
Country or territory
WOMEN’S EMPLOYMENTAND MATERNITY LEAVE
North America and Western Europe
South and West Asia
Sub-Saharan Africa
Tuberculosis
Diphtheria,Pertussis,Tetanus Polio Measles Hepatitis B
2006
BCG
2006
DPT3
2006
Polio3
2006
Measles
2006 2005 c. 2005
HepB3
Officialprogrammes
targetingchildren
under age 3
Youngest age grouptargeted in
programmes
(years)
2003 2005-20073
Female labour force
participation rate(age 15
and above)4
(%)
Duration of paid
maternity leave5
(weeks)
S TAT I S T I C A L TA B L E S
Ta b l e 3 A
2 8 1

70 102 13 14 7 26 19 78 21117 183 17 20 7 34 4 54 37114 196 12 31 13 38 24 79 52
92 155 13 19 7 39 24 … …
55 77 14 40 13 38 52 43 6287 145 20 38 11 47 49 54 …
54 86 14 12 3 21 6 62 974 128 20 20 6 22 41 44 5357 90 9 18 5 22 54 58 56
103 156 12 26 9 35 27 41 71113 195 … … … … … … …
64 104 10 20 6 30 13 84 5765 98 13 20 4 38 36 79 60
133 205 … 26 6 39 35 70 4566 106 17 42 13 48 67 78 6489 132 13 19 3 46 56 89 73
129 200 23 33 11 38 25 32 6914 17 14 15 14 10 21 … …
96 164 15 24 4 41 30 80 6542 66 14 24 9 24 19 57 37
111 188 13 44 10 50 14 62 62109 187 14 29 9 38 17 64 34112 188 6 23 4 45 88 69 77
72 95 8 9 8 23 60 60 1866 115 19 17 8 16 34 61 42… … … … … … … … …
160 278 24 30 9 40 8 52 57116 193 11 36 11 38 9 15 35
45 66 15 12 3 25 7 46 …
71 114 9 10 1 30 24 60 2589 126 12 26 14 24 28 35 4477 127 12 20 5 32 60 80 5473 118 10 22 3 38 41 91 5593 157 12 20 6 50 40 87 5858 94 11 17 6 29 22 79 28
49 74 15 25 11 31 38 56 39
31 38 … … … … … … …
6 7 … … … … … … …
54 81 16 26 11 32 38 56 40
41 54 16 17 8 25 28 57 2517 21 … … … … … … …
51 62 … … … … … … …
24 31 6 14 … 16 43 45 2724 31 … … … … … … …
26 36 … … … … … … …
22 27 9 7 2 16 … … …
39 56 … … … … … … …
21 26 … … … … … … …
5 7 … … … … … … …
58 83 … … … … … … …
95 158 14 28 9 38 30 67 50
CongoCôte d’IvoireD. R. CongoEquatorial GuineaEritreaEthiopiaGabonGambiaGhanaGuineaGuinea-BissauKenyaLesothoLiberiaMadagascarMalawiMaliMauritiusMozambiqueNamibiaNigerNigeriaRwandaSao Tome and PrincipeSenegalSeychellesSierra LeoneSomaliaSouth AfricaSwazilandTogoUgandaUnited Republic of TanzaniaZambiaZimbabwe
World
Countries in transitionDeveloped countriesDeveloping countries
Arab StatesCentral and Eastern EuropeCentral AsiaEast Asia and the Pacific
East AsiaPacific
Latin America and the CaribbeanCaribbeanLatin America
N. America/W. EuropeSouth and West AsiaSub-Saharan Africa
Table 3A (continued)
CHILD SURVIVAL1 CHILD WELL-BEING2
2000-200632000-200632000-200632000-200632000-200632000-200631999-20063
% of children who are:
Country or territory
Stillbreastfeeding
(20-23 months)
Breastfed withcomplementary
food
(6-9 months)
Exclusivelybreastfed
(<6 months)
% of children under age 5 suffering from:
Stuntingmoderate
and severe
Wastingmoderate
and severe
Underweightmoderate
and severe
Infants with low
birth weight
(%)
2005-2010
Under-5 mortality
rate
(‰)
2005-2010
Infant mortality
rate
(‰)
90
02
Education f
or A
ll G
lobal M
onitorin
g R
eport
A N N E X
1. UN Population Division (2007), median variant.2. UNICEF (2007).3. Data are for the most recent year available during the period specified.
4. Employed and unemployed women as a share of the working age population, including women with a jobbut temporarily not at work (e.g. on maternity leave), home employment for the production of goods andservices for own household consumption, and domestic and personal services produced by employing paiddomestic staff. Data exclude women occupied solely in domestic duties in their own households (ILO, 2008).
2 8 2
Weighted average Weighted average Weighted average
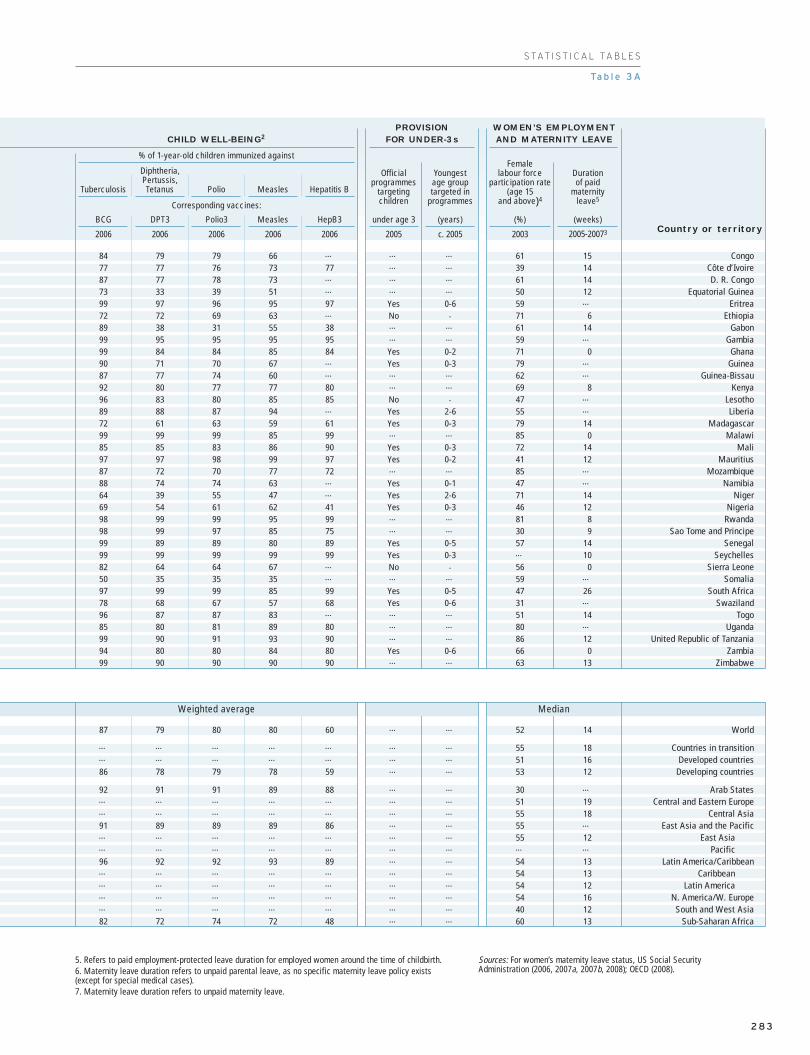
84 79 79 66 … … … 61 1577 77 76 73 77 … … 39 1487 77 78 73 … … … 61 1473 33 39 51 … … … 50 1299 97 96 95 97 Yes 0-6 59 …
72 72 69 63 … No . 71 689 38 31 55 38 … … 61 1499 95 95 95 95 … … 59 …
99 84 84 85 84 Yes 0-2 71 090 71 70 67 … Yes 0-3 79 …
87 77 74 60 … … … 62 …
92 80 77 77 80 … … 69 896 83 80 85 85 No . 47 …
89 88 87 94 … Yes 2-6 55 …
72 61 63 59 61 Yes 0-3 79 1499 99 99 85 99 … … 85 085 85 83 86 90 Yes 0-3 72 1497 97 98 99 97 Yes 0-2 41 1287 72 70 77 72 … … 85 …
88 74 74 63 … Yes 0-1 47 …
64 39 55 47 … Yes 2-6 71 1469 54 61 62 41 Yes 0-3 46 1298 99 99 95 99 … … 81 898 99 97 85 75 … … 30 999 89 89 80 89 Yes 0-5 57 1499 99 99 99 99 Yes 0-3 … 1082 64 64 67 … No . 56 050 35 35 35 … … … 59 …
97 99 99 85 99 Yes 0-5 47 2678 68 67 57 68 Yes 0-6 31 …
96 87 87 83 … … … 51 1485 80 81 89 80 … … 80 …
99 90 91 93 90 … … 86 1294 80 80 84 80 Yes 0-6 66 099 90 90 90 90 … … 63 13
87 79 80 80 60 … … 52 14
… … … … … … … 55 18… … … … … … … 51 1686 78 79 78 59 … … 53 12
92 91 91 89 88 … … 30 …… … … … … … … 51 19… … … … … … … 55 1891 89 89 89 86 … … 55 …… … … … … … … 55 12… … … … … … … … …
96 92 92 93 89 … … 54 13… … … … … … … 54 13… … … … … … … 54 12… … … … … … … 54 16… … … … … … … 40 1282 72 74 72 48 … … 60 13
CongoCôte d’IvoireD. R. Congo
Equatorial GuineaEritrea
EthiopiaGabon
GambiaGhana
GuineaGuinea-Bissau
KenyaLesothoLiberia
MadagascarMalawi
MaliMauritius
MozambiqueNamibia
NigerNigeria
RwandaSao Tome and Principe
SenegalSeychelles
Sierra LeoneSomalia
South AfricaSwaziland
TogoUganda
United Republic of TanzaniaZambia
Zimbabwe
World
Countries in transitionDeveloped countries
Developing countries
Arab StatesCentral and Eastern Europe
Central AsiaEast Asia and the Pacific
East AsiaPacific
Latin America/CaribbeanCaribbean
Latin AmericaN. America/W. Europe
South and West AsiaSub-Saharan Africa
CHILD WELL-BEING2PROVISION
FOR UNDER-3s
% of 1-year-old children immunized against
Corresponding vaccines:
Country or territory
WOMEN’S EMPLOYMENTAND MATERNITY LEAVE
Tuberculosis
Diphtheria,Pertussis,Tetanus Polio Measles Hepatitis B
2006
BCG
2006
DPT3
2006
Polio3
2006
Measles
2006 2005 c. 2005
HepB3
Officialprogrammes
targetingchildren
under age 3
Youngest age grouptargeted in
programmes
(years)
2003 2005-20073
Female labour force
participation rate(age 15
and above)4
(%)
Duration of paid
maternity leave5
(weeks)
S TAT I S T I C A L TA B L E S
Ta b l e 3 A
5. Refers to paid employment-protected leave duration for employed women around the time of childbirth.6. Maternity leave duration refers to unpaid parental leave, as no specific maternity leave policy exists(except for special medical cases).7. Maternity leave duration refers to unpaid maternity leave.
Sources: For women’s maternity leave status, US Social SecurityAdministration (2006, 2007a, 2007b, 2008); OECD (2008).
2 8 3
Weighted average Median

123456789
1011121314151617181920
212223242526272829303132333435363738394041
424344454647484950
51525354
90
02
Education f
or A
ll G
lobal M
onitorin
g R
eport
A N N E X
AlgeriaBahrainDjiboutiEgyptIraqJordanKuwaitLebanonLibyan Arab JamahiriyaMauritaniaMoroccoOmanPalestinian A. T.QatarSaudi ArabiaSudanSyrian Arab RepublicTunisiaUnited Arab EmiratesYemen
AlbaniaBelarusBosnia and HerzegovinaBulgariaCroatiaCzech RepublicEstoniaHungaryLatviaLithuaniaMontenegroPolandRepublic of Moldova1,2
RomaniaRussian FederationSerbia1
SlovakiaSloveniaTFYR MacedoniaTurkeyUkraine
ArmeniaAzerbaijanGeorgiaKazakhstanKyrgyzstanMongoliaTajikistanTurkmenistanUzbekistan
AustraliaBrunei DarussalamCambodiaChina
4-5 36 49 166 47 . 45 3 3 3 1.013-5 14 48 19 48 100 100 36 37 36 0.964-5 0.2 60 1 47 100 72 0.4 0.3 0.5 1.504-5 328 48 580 47 54 30 11 11 10 0.954-5 68 48 93...z 49...z . .z 5 5 5 0.984-5 74 46 95 47 100 94 29 30 27 0.914-5 57 49 67 48 24 40 78 78 79 1.023-5 143 48 148 48 78 78 61 62 60 0.974-5 10 48 22 48 . 17 5 5 5 0.973-5 … … 5...z … … 78...z … … … .…
4-5 805 34 705 40 100 100 62 82 43 0.524-5 7 45 10 47 100 100 6 6 6 0.884-5 77 48 77 48 100 100 39 40 39 0.963-5 8 48 16 49 100 90 25 25 25 0.983-5 … … … … … … … … … .…
4-5 366 … 505 49 90 70 19 … … .…
3-5 108 46 155 47 67 75 8 9 8 0.903-5 78 47 … … 88 … 14 14 13 0.954-5 64 48 90 48 68 77 64 65 63 0.973-5 12 45 18.z 45.z 37 49.z 0.7 0.7 0.6 0.86
3-5 82 50 80.y 48.y . 5.y 40 39 41 1.063-5 263 47.* 271 48 – 5 75 77.* 73.* 0.95*3-5 … … … … … … … … … .…
3-6 219 48 206 48 0.1 0.3.z 67 67 66 0.993-6 81 48 90 48 5 10 40 40 39 0.983-5 312 50 284 48 2 1 90 87 93 1.073-6 55 48 45 48 1 2 87 88 87 0.993-6 376 48 327 48 3 5 78 79 77 0.983-6 58 48 65 48 1 3 53 54 51 0.953-6 94 48 89 48 0.3 0.2 50 50 49 0.97… … … … … … … … … … .…
3-6 958 49 840 49 3 9 50 50 50 1.013-6 103 48 102 48 … 0.2 48 49 48 0.963-6 625 49 648 49 1 1 62 61 63 1.023-6 4 379 … 4 530 47 … 2 68 … … .…
3-6 175 46 173 49 … 0.1 54 57 51 0.903-5 169 … 145 48 0.4 2 82 … … .…
3-5 59 46 43 48 1 2 75 78 71 0.913-6 33 49 33.z 49.z . .z 27 27 28 1.013-5 261 47 550 48 6 9 6 6 6 0.943-5 1 103 48 1 032 48 0.04 3 50 50 49 0.98
3-6 57 … 49 51 – 2 26 … … .…
3-5 111 46 109 47 – 0.1 21 22 20 0.893-5 74 48 76 46 0.1 – 36 36 36 1.003-6 165 48 331 48 10 5 14 15 14 0.963-6 48 43 57 49 1 1 10 11 9 0.803-6 74 54 95 52 4 1.z 25 23 27 1.213-6 56 42 62 46 . . 8 9 7 0.763-6 … … … … … … … … … .…
3-6 616 47 562 48 … 4 24 24 23 0.94
4-4 … … 263 48 … 67 … … … .…
3-5 11 49 12 48 66 66 50 49 51 1.043-5 58 50 106 51 22 29 5 5 5 1.034-6 24 030 46 21 790 45 … 31 38 38 37 0.97
Table 3BEarly childhood care and education (ECCE): education
GROSS ENROLMENT RATIO (GER)IN PRE-PRIMARY EDUCATION
(%)
Enrolment in privateinstitutions as %
of total enrolment
GPI
19991999 2006
School year ending inSchool year ending in
Country or territory (F/M)FemaleMaleTotal
ENROLMENT IN PRE-PRIMARY EDUCATION
Total2006
% F
1999Agegroup
2006
School year ending in
(000)Total % F(000)
Arab States
Central and Eastern Europe
Central Asia
East Asia and the Pacific
2 8 4

1234567891011121314151617181920
212223242526272829303132333435363738394041
424344454647484950
51525354
S TAT I S T I C A L TA B L E S
Ta b l e 3 B
15 15 14 0.93 6.z 6.z 6.z 0.96.z … … … .… 4 4 452 52 51 0.98 51 51 50 0.98 55 56 54 0.97 82 83 81
2 2 2 0.92 1 1 1 0.99 2 2 2 0.92 2 2 217 18 17 0.94 16 17 16 0.93 17 18 17 0.94 … … …
6...z 6...z 6...z 1.00...z 6...z 6...z 6...z 1.00...z 6...z 6...z 6...z 1.00...z … … …
32 33 31 0.94 30 31 29 0.95 32 33 31 0.94 50 52 4975 76 73 0.96 50 50 49 0.98 75 76 73 0.96 87 87 8764 65 63 0.97 62 63 61 0.97 64 65 63 0.97 95 95 95
9 9 9 0.97 8 8 7 0.96 … … … .… … … …
2...z … … .… … … … .… … … … .… 50 52 4859 70 48 0.69 52 62 43 0.70 59 70 48 0.69 … … …
8 9 8 0.94 7 7 7 0.95 8 9 8 0.94 … … …
30 31 30 0.98 25 25 25 0.98 30 31 30 0.98 … … …
43 43 43 1.00 40 39 40 1.02 43 43 43 1.00 … … …… … … .… … … … .… … … … .… … … …
24 24 24 1.00 24...z 24...z 24...z 1.00...z 24 24 24 1.00 51 47 5511 11 11 0.93 11 11 10 0.93 11 11 11 0.93 12.z 12.z 12.z… … … .… … … … .… … … … .… … … …
78 79 77 0.98 56 57 56 0.98 78 79 77 0.98 83 83 830.9.z 1.0.z 0.8.z 0.85.z … … … .… … … … .… … … …
49.y 49.y 49.y 1.00.y 47.y 47.y 47.y 1.00.y 49.y 49.y 49.y 1.00.y … … …
103 104 102 0.98 90 90 89 0.99 120 122 119 0.98 … … …… … … .… … … … .… … … … .… … … …
82 82 82 0.99 79 79 78 0.99 82 82 82 0.99 … … …
50 50 49 0.98 50 50 49 0.98 50 50 49 0.98 … … …
114 116 112 0.96 … … … .… 114 116 112 0.96 … … …
93 93 92 0.99 88 88 88 1.00 … … … .… … … …
86 87 86 0.99 85 86 85 1.00 86 87 86 0.99 … … …
89 90 88 0.98 87 87 86 0.99 89 90 88 0.98 … … …
69 70 68 0.98 68 68 67 0.98 69 70 68 0.98 … … …… … … .… … … … .… … … … .… … … …
57 57 58 1.01 56 55 56 1.01 57 57 58 1.01 … … …
71 71 70 0.99 69 69 68 0.99 71 71 70 0.99 … … …
72 72 73 1.01 71 71 72 1.02 72 72 73 1.01 … … …
87 90 85 0.95 70.y … … .… … … … .… … … …
59 59. 59. 1.00. … … … .… … … … .… … … …
93 95 92 0.97 86...z 88...z 85...z 0.96...z 93 95 92 0.97 … … …
81 82 80 0.97 79 79 78 0.98 81 82 80 0.97 … … …
33.z 33.z 34.z 1.03.z 32.z 31.z 32.z 1.02.z … … … .… … … …
13 14 13 0.96 13 14 13 0.96 … … … .… … … …
90 91 88 0.97 68 69 67 0.97 90 91 88 0.97 … … …
36 33 40 1.21 26.* 24.* 29.* 1.20.* 36 33 40 1.21 … … …
32 32 32 1.02 22 22 23 1.04 32 32 33 1.02 7 7 755 56 54 0.96 39 40 38 0.95 55 56 54 0.96 2.y 2.y 2.y
38 38 38 0.98 38 38 37 0.98 … … … .… … … …
14 14 14 1.00 11 11 11 1.00 14 14 14 1.00 13 13 1354 51 57 1.13 47 … … .… … … … .… … … …
9 10 9 0.88 7 7 7 0.91 … … … .… … … …… … … .… … … … .… … … … .… … … …
27 27 26 0.94 21 … … .… … … … .… … … …
104 106 103 0.97 63 63 62 0.97 104 106 103 0.97 … … …
51 51 51 1.00 46 45 46 1.02 55 55 55 1.01 99 99 9911 11 11 1.06 10 10 10 1.07 12 12 13 1.06 16 15 1739 40 38 0.95 … … … .… 39 40 38 0.95 … … …
GROSS ENROLMENT RATIO (GER)IN PRE-PRIMARY EDUCATION
(%)
2006
School year ending in
GPI(F/M)FemaleMaleTotal
NET ENROLMENT RATIO (NER)IN PRE-PRIMARY EDUCATION
(%)
2006
School year ending in
GPI(F/M)FemaleMaleTotal
GROSS ENROLMENT RATIO (GER)IN PRE-PRIMARY AND OTHER
ECCE PROGRAMMES (%)
2006
School year ending in
GPI(F/M)FemaleMaleTotal
NEW ENTRANTS TO THE FIRSTGRADE OF PRIMARY EDUCATION
WITH ECCE EXPERIENCE (%)
2006
School year ending in
FemaleMaleTotal
Arab States
Central and Eastern Europe
Central Asia
East Asia and the Pacific
2 8 5

5556575859606162636465666768697071727374757677787980818283
84858687888990919293949596979899
100101102103104105106107108109110111112113114
Cook Islands1
DPR KoreaFijiIndonesiaJapanKiribatiLao PDRMacao, ChinaMalaysiaMarshall Islands1
MicronesiaMyanmarNauruNew ZealandNiue1
Palau1
Papua New GuineaPhilippinesRepublic of KoreaSamoaSingapore3
Solomon IslandsThailandTimor-LesteTokelau1
TongaTuvalu1
VanuatuViet Nam
AnguillaAntigua and BarbudaArgentinaArubaBahamasBarbadosBelizeBermudaBoliviaBrazilBritish Virgin Islands1
Cayman Islands3
ChileColombiaCosta RicaCubaDominica1
Dominican RepublicEcuadorEl SalvadorGrenada1
GuatemalaGuyanaHaitiHondurasJamaicaMexicoMontserratNetherlands AntillesNicaraguaPanama
4-4 0.4 47 0.5.z 45.z 25 19.z 86 87 85 0.984-5 … … … … … … … … … .…
3-5 9 49 9 49 … 100...z 16 16 16 1.025-6 1 981 49 3 143 50 99 99 23 23 23 1.013-5 2 962 49 3 073 … 65 67 83 82 84 1.023-5 … … 5...y … … … … … … .…
3-5 37 52 49 51 18 30 8 7 8 1.113-5 17 47 10 49 94 95 87 89 85 0.955-5 572 50 668.z 51.z 49 43.z 108 105 110 1.044-5 2 50 1 48 19 … 59 57 60 1.043-5 3 … … … … … 37 … … .…
3-4 41 … 93 50 90 50 2 … … .…
3-5 … … 1 49 … … … … … .…
3-4 101 49 102 49 … 98 85 85 85 1.004-4 0.1 44 0.03.z 58.z . … 154 159 147 0.933-5 0.7 54 1...z 53...z 24 20...z 63 56 69 1.236-6 … … … … … … … … … .…
5-5 593 50 912 49 47 43 30 30 31 1.055-5 535 47 547 48 75 78 80 83 77 0.923-4 5 53 5...y 54...y 100 … 53 48 58 1.213-5 99 32 … … … … … … … .…
3-5 13 48 … … … … 35 35 35 1.023-5 2 745 49 2 462 49 19 21 97 96 97 1.014-5 … … 7.z 51.z … … … … … .…
3-4 … … 0.1...y 48...y … … … … … .…
3-4 2 53 1...z 56...z … 12.y 30 27 33 1.243-5 … … 0.7 52 … … … … … .…
3-5 … … 5 48 … 83 … … … .…
3-5 2 179 48 2 713 48 49 61 39 41 38 0.94
3-4 0.5 52 0.5 49 100 100 … … … .…
3-4 … … … … … … … … … .…
3-5 1 191 50 1 334.z 50.z 28 30.z 57 56 57 1.024-5 3 49 3 49 83 75 99 99 99 1.003-4 1 51 … … … … 12 11 12 1.093-4 6 49 6 49 … 16 74 75 73 0.983-4 4 50 5 52 … 81 27 27 27 1.034-4 … … … … … … … … … .…
4-5 208 49 241 49 … 10 45 44 45 1.014-6 5 733 49 7 298.z 49.z 28 29.y 58 58 58 1.003-4 0.5 53 0.7 52 100 100 62 57 66 1.164-4 0.5 48 0.7 52 88 92 … … … .…
3-5 450 49 402 50 45 52 77 77 76 0.993-5 1 034 50 1 084 49 45 39 37 37 38 1.024-5 70 49 110 49 10 11 84 84 85 1.013-5 484 50 465 48 . . 109 107 111 1.043-4 3 52 2.z 50.z 100 100.z 80 76 85 1.113-5 195 49 212 49 45 44 32 31 32 1.015-5 181 50 261 49 39 43 64 63 66 1.044-6 194 49 240 50 22 18 43 42 43 1.013-4 4 50 3...z 52...z … … 93 93 93 1.013-6 308 49 451 50 22 20 46 46 45 0.974-5 37 49 33 49 1 8 124 125 124 0.993-5 … … … … … … … … … .…
3-5 … … 211 50 … 14 … … … .…
3-5 138 51 154.z 50.z 88 91.z 78 75 81 1.084-5 3 361 50 4 463 49 9 15 74 73 75 1.023-4 0.1 52 0.1 56 . – … … … .…
4-5 7 50 … … 75 … 111 110 112 1.023-5 161 50 210 49 17 16 27 27 28 1.044-5 49 49 92 49 23 17 39 39 40 1.01
Table 3B (continued)
GROSS ENROLMENT RATIO (GER)IN PRE-PRIMARY EDUCATION
(%)
Enrolment in privateinstitutions as %
of total enrolment
GPI
19991999 2006
School year ending inSchool year ending in
Country or territory (F/M)FemaleMaleTotal
ENROLMENT IN PRE-PRIMARY EDUCATION
Total2006
% F
1999Agegroup
2006
School year ending in
(000)Total % F(000)
Latin America and the Caribbean
90
02
Education f
or A
ll G
lobal M
onitorin
g R
eport
A N N E X
2 8 6

5556575859606162636465666768697071727374757677787980818283
84858687888990919293949596979899100101102103104105106107108109110111112113114
94...z 99...z 89...z 0.90...z 88...z 92...z 83...z 0.91...z 94...z 99...z 89...z 0.90...z 100.z 100.z 100.z… … … .… … … … .… … … … .… … … …
16 16 16 1.01 15 15 15 1.01 16 16 16 1.01 … … …
37 36 38 1.03 26 26 27 1.03 37 36 38 1.03 42 42 4286 … … .… 85 … … .… 101 … … .… … … …
75...y … … .… … … … .… 75...y … … .… … … …
11 11 12 1.06 11 10 11 1.07 11 11 12 1.06 10 9 1087 87 86 0.99 82 82 81 0.99 87 87 86 0.99 97 97 97
125.z 120.z 131.z 1.10.z 74.z 73.z 77.z 1.05.z 125.z 120.z 131.z 1.10.z 76.z 74.z 79.z
45 45 45 1.00 9 9 10 1.05 45 45 45 1.00 … … …… … … .… … … … .… … … … .… … … …
6 5 6 1.02 6 5 6 1.02 … … … .… 11 11 1189 89 88 0.99 … … … .… … … … .… … … …
92 91 93 1.02 91 89 92 1.02 … … … .… … … …
119.z 108.z 129.z 1.19.z … … … .… 119.z 108.z 129.z 1.19.z … … …
64...z 59...z 68...z 1.16...z … … … .… 64...z 59...z 68...z 1.16...z … … …… … … .… … … … .… … … … .… … … …
45 44 45 1.02 35 36 35 0.96 45 44 45 1.02 58 57 60101 100 103 1.03 54 54 55 1.03 101 100 103 1.03 … … …
48...y 43...y 54...y 1.26...y … … … .… 48...y 43...y 54...y 1.26...y … … …… … … .… … … … .… … … … .… … … …… … … .… … … … .… … … … .… … … …
92 91 92 1.01 84 84 85 1.01 … … … .… … … …
10.z 10.z 11.z 1.09.z … … … .… 10.z 10.z 11.z 1.09.z … … …
125...y 126...y 125...y 1.00...y … … … .… 125...y 126...y 125...y 1.00...y … … …
23...z 19...z 26...z 1.37...z … … … .… 23...z 19...z 26...z 1.37...z … … …
107 98 116 1.18 92 84 100 1.19 … … … .… … … …
29 29 29 0.98 20 20 20 1.02 29 29 29 0.98 … … …… … … .… … … … .… … … … .… … … …
103 110 97 0.88 93 100 87 0.87 103 110 97 0.88 100 100 100… … … .… … … … .… … … … .… … … …
66.z 65.z 66.z 1.02.z 65.z 65.z 66.z 1.02.z 66.z 65.z 66.z 1.02.z 94.z 94.z 94.z
99 99 98 1.00 96 96 97 1.00 99 99 98 1.00 90.z 90.z 90.z… … … .… … … … .… … … … .… … … …
94 94 94 1.00 83 82 83 1.01 94 94 94 1.00 100 100 10034 32 35 1.09 32 31 34 1.10 34 32 35 1.09 . . .… … … .… … … … .… … … … .… … … …
50 50 51 1.01 42 41 42 1.02 50 50 51 1.01 66 66 6669.z 69.z 68.z 0.98.z 53.z 53.z 53.z 1.00.z … … … .… … … …
93 88 97 1.11 84 80 88 1.10 166 158 175 1.11 99 102 97… … … .… … … … .… … … … .… 90.* 90.* 90.*55 54 55 1.03 … … … .… 55 54 55 1.03 … … …
40 41 40 0.99 35 35 35 1.00 40 41 40 0.99 … … …
70 70 70 1.00 … … … .… 74 74 74 1.00 86 86 86113 113 113 1.00 100 99 100 1.01 193 193 193 1.00 99 99 99
77.z 72.z 82.z 1.13.z … … … .… 77.z 72.z 82.z 1.13.z 100.y 100.y 100.y
32 32 32 1.00 28 28 28 1.02 … … … .… … … …
90 89 90 1.02 74 74 75 1.01 193 187 200 1.07 58 57 5951 51 52 1.03 45 44 46 1.05 51 51 52 1.03 68 66 6981...z 77...z 84...z 1.09...z 80...y 76..y 83...y 1.09...y 81...z 77...z 84...z 1.09...z … … …
29 29 29 1.01 27 27 27 1.01 29 29 29 1.01 … … …
99 99 100 1.01 84 83 84 1.00 99 99 100 1.01 … … …… … … .… … … … .… … … … .… … … …
38 37 39 1.05 28 27 28 1.04 44 43 45 1.05 … … …
92.z 91.z 94.z 1.03.z 91...z 90...z 93...z 1.04...z 92.z 91.z 94.z 1.03.z … … …
106 106 106 1.00 93 93 93 1.00 106 106 106 1.00 … … …
91 76 108 1.42 79 65 95 1.47 91 76 108 1.42 78.z 114.z 48.z… … … .… … … … .… … … … .… … … …
52 52 53 1.02 52 52 53 1.02 74 … … .… 42 42 4367 67 67 1.01 60 59 60 1.01 67 67 67 1.01 69 68 70
GROSS ENROLMENT RATIO (GER)IN PRE-PRIMARY EDUCATION
(%)
2006
School year ending in
GPI(F/M)FemaleMaleTotal
NET ENROLMENT RATIO (NER)IN PRE-PRIMARY EDUCATION
(%)
2006
School year ending in
GPI(F/M)FemaleMaleTotal
GROSS ENROLMENT RATIO (GER)IN PRE-PRIMARY AND OTHER
ECCE PROGRAMMES (%)
2006
School year ending in
GPI(F/M)FemaleMaleTotal
NEW ENTRANTS TO THE FIRSTGRADE OF PRIMARY EDUCATION
WITH ECCE EXPERIENCE (%)
2006
School year ending in
FemaleMaleTotal
Latin America and the Caribbean
S TAT I S T I C A L TA B L E S
Ta b l e 3 B
2 8 7

115116117118119120121122123124
125126127128129130131132133134135136137138139140141142143144145146147148149150
151152153154155156157158159
160161162163164165166167168169170
ParaguayPeruSaint Kitts and NevisSaint LuciaSaint Vincent/Grenad.SurinameTrinidad and TobagoTurks and Caicos IslandsUruguayVenezuela, Bolivarian Rep. of
Andorra1
AustriaBelgiumCanadaCyprus1
DenmarkFinlandFrance4
GermanyGreeceIcelandIrelandIsraelItalyLuxembourgMaltaMonaco3
NetherlandsNorwayPortugalSan Marino3
SpainSwedenSwitzerlandUnited Kingdom5
United States
AfghanistanBangladeshBhutanIndiaIran, Islamic Republic of6
MaldivesNepalPakistanSri Lanka
AngolaBeninBotswanaBurkina FasoBurundiCameroonCape VerdeCentral African RepublicChadComorosCongo
3-5 123 50 148.z 49.z 29 28.z 29 29 30 1.033-5 1 017 50 1 131 49 15 22 55 54 56 1.023-4 … … 2 52 … 68 … … … .…
3-4 4 50 4 50 … 100 70 69 71 1.033-4 … … 4...z 49...z … 100...z … … … .…
4-5 … … 16 47 … 48 … … … .…
3-4 23 50 30.*,z 49.*,z 100 100.*,z 58 57 58 1.014-5 0.8 54 1.z 47.z 47 65.z … … … .…
3-5 100 49 122 49 … 43 60 59 60 1.023-5 738 50 1 011 49 20 19 45 44 45 1.03
3-5 … … 3 47 … 2 … … … .…
3-5 225 49 217 48 25 27 82 82 82 0.993-5 399 49 412 49 56 53 111 112 110 0.994-5 512 49 494...y 49...y 8 … 64 64 64 0.993-5 19 49 20 48 54 50 60 59 60 1.023-6 251 49 253 49 27 … 90 90 90 1.003-6 125 49 140 49 10 9 48 49 48 0.993-5 2 393 49 2 628 49 13 13 112 112 112 1.003-5 2 333 48 2 418 48 54 63 94 94 93 0.984-5 143 49 143 49 3 3 68 67 68 1.013-5 12 48 12 49 5 8 88 88 87 0.993-3 … … … … … … … … … .…
3-5 355 48 362 49 7 3 105 106 105 0.983-5 1 578 48 1 662 48 30 30 95 96 95 0.983-5 12 49 15 48 5 7 73 73 73 1.003-4 10 48 9.z 50.z 37 39.z 103 103 102 0.993-5 0.9 52 1.y … 26 19.y … … … .…
4-5 390 49 355 49 69 70.y 97 98 97 0.993-5 139 50 159 … 40 44 75 73 77 1.063-5 220 49 262 49 52 47 69 69 69 0.993-5 … … 1.y … … .y … … … .…
3-5 1 131 49 1 490 49 32 35 100 100 100 1.003-6 360 49 333 50 10 12 76 76 76 1.015-6 158 48 156 48 6 9 89 89 88 0.993-4 1 155 49 990 50 6 29 77 77 77 1.003-5 7 183 48 7 342 49 34 37 58 59 57 0.97
3-6 … … 25...y 43...y … … … … … .…
3-5 1 825 50 1 109.y 49.y … 52.y 17 17 17 1.044-5 0.3 48 0.4 47 100 100 1 1 1 0.933-5 13 869 48 29 254.z 49.z … … 18 18 19 1.025-5 220 50 549 51 … 8 13 13 14 1.053-5 12 48 14 49 30 38.z 54 54 54 1.003-4 238 41 392 46 … … 11 13 10 0.733-4 … … 4 075.z 46.z … … … … … .…
4-4 … … … … … … … … … .…
3-5 … … … … … … … … … .…
4-5 18 48 31 50 20 37.z 4 4 4 0.973-5 … … 20.z 50.z … 96.z … … … .…
4-6 20 50 27 48 34 … 2 2 2 1.044-6 5 50 12 52 49 54 0.8 0.8 0.8 1.014-5 104 48 195 50 57 62 11 11 11 0.953-5 … … 21 50 … – … … … .…
3-5 … … 6...y 51...y … … … … … .…
3-5 … … 8...z 33...z … 47.y … … … .…
3-5 1 51 2...z 48...z 100 62...z 2 2 2 1.073-5 6 61 28 52 85 79 2 2 3 1.59
Table 3B (continued)
GROSS ENROLMENT RATIO (GER)IN PRE-PRIMARY EDUCATION
(%)
Enrolment in privateinstitutions as %
of total enrolment
GPI
19991999 2006
School year ending inSchool year ending in
Country or territory (F/M)FemaleMaleTotal
ENROLMENT IN PRE-PRIMARY EDUCATION
Total2006
% F
1999Agegroup
2006
School year ending in
(000)Total % F(000)
North America and Western Europe
South and West Asia
Sub-Saharan Africa
90
02
Education f
or A
ll G
lobal M
onitorin
g R
eport
A N N E X
2 8 8

115116117118119120121122123124
125126127128129130131132133134135136137138139140141142143144145146147148149150
151152153154155156157158159
160161162163164165166167168169170
34.z 34.z 34.z 1.01.z 30.z 30.z 31.z 1.03.z 34.z 34.z 34.z 1.01.z 75.y 74.y 76.y
68 67 68 1.02 67 66 68 1.02 68 67 68 1.02 61 61 6299 91 107 1.18 … … … .… 143 133 153 1.15 … … …
69 67 70 1.05 53 53 54 1.03 … … … .… … … …
88...z 89...z 86...z 0.97...z … … … .… 88...z 89...z 86...z 0.97...z 100...z 100...z 100...z
84 87 80 0.93 83...z 82...z 84...z 1.02...z … … … .… 100 100 10085.*,z 86.*,z 84.*,z 0.97.*,z 68.*,z 68.*,z 67.*,z 1.00.*,z 85.*,z 86.*,z 84.*,z 0.97.*,z 81.*,y 80.*,y 82.*,y
118...z 132...z 106...z 0.80...z 73...z 80...z 68...z 0.85...z 118...z 132...z 106...z 0.80...z 100.z 101.z 100.z
79 79 80 1.01 79 79 80 1.01 94 94 95 1.02 96 96 9660 60 60 1.01 54 54 54 1.02 80 80 80 1.01 75 74 76
102 102 102 1.00 86 86 87 1.00 102 102 102 1.00 … … …
90 90 89 0.99 87 87 86 0.99 90 90 89 0.99 … … …
121 122 121 0.99 100 100 100 1.00 121 122 121 0.99 … … …
68...y 68...y 68...y 1.00...y … … … .… … … … .… … … …
79 80 78 0.98 71 72 70 0.98 79 80 78 0.98 … … …
95 95 96 1.01 92 90 93 1.04 95 95 96 1.01 … … …
62 62 62 0.99 61 61 61 1.00 62 62 62 0.99 … … …
116 116 115 1.00 100.y 100.y 100.y 1.00.y 116 116 115 1.00 … … …
105 106 105 0.99 … … … .… 105 106 105 0.99 … … …
69 68 70 1.02 69 68 70 1.02 69 68 70 1.02 … … …
96 96 96 1.00 96 96 96 1.00 96 96 96 1.00 … … …… … … .… … … … .… … … … .… … … …
91 91 91 1.00 86 85 87 1.02 91 91 91 1.00 … … …
104 105 104 0.98 99 100 98 0.98 104 105 104 0.98 … … …
88 88 88 1.00 86 86 86 1.01 88 88 88 1.00 … … …
97.z 95.z 100.z 1.05.z 83.z 82.z 85.z 1.04.z 97.z 95.z 100.z 1.05.z … … …… … … .… … … … .… … … … .… … … …
90 90 90 0.99 90 90 90 0.99 90 90 90 0.99 … … …
90 … … .… 90 … … .… 90 … … .… … … …
79 79 80 1.01 78 78 79 1.02 79 79 80 1.01 … … …… … … .… … … … .… … … … .… … … …
121 121 120 1.00 100 100 100 1.00 … … … .… … … …
95 93 98 1.05 95 92 98 1.06 95 93 98 1.05 … … …
99 99 98 1.00 74 74 74 0.99 99 99 98 1.00 … … …
72 71 73 1.03 67 67 68 1.03 72 71 73 1.03 … … …
61 61 61 1.00 56 56 57 1.02 61 61 61 1.00 … … …
0.8...y 0.9...y 0.7...y 0.80...y … … … .… 0.8...y 0.9...y 0.7...y 0.80...y … … …
10.y 10.y 10.y 1.01.y 9.y 9.y 9.y 1.01.y … … … .… … … …
2 2 2 0.93 … … … .… 1.6 1.7 1.5 0.93 … … …
39.z 38.z 40.z 1.04.z … … … .… 39.z 38.z 40.z 1.04.z … … …
53 50 56 1.11 … … … .… 53 50 56 1.11 31.z 34.z 29.z
82 82 82 1.00 69 69 69 0.99 82 82 82 1.00 94 94 9327 28 26 0.91 … … … .… 27 28 26 0.91 19.z 19.z 18.z
52.z 55.z 50.z 0.90.z 43.z 45.z 40.z 0.89.z … … … .… 57.z 52.z 63.z… … … .… … … … .… … … … .… … … …
… … … .… … … … .… … … … .… … … …
6 6 6 1.05 3...z 3...z 3...z 1.03...z … … … .… … … …
15.z 15.z 15.z 1.00.z 11.z 11.z 11.z 1.01.z 15.4.z 15.4.z 15.3.z 1.00.z … … …
2 2 2 0.97 … … … .… 2 2 2 0.97 3.y 3.y 3.y
2 2 2 1.09 … … … .… 2 2 2 1.09 1 1 119 19 19 1.01 … … … .… 19 19 19 1.01 … … …
53 53 53 1.00 50 49 50 1.01 53 53 53 1.00 85 84 862...y 2...y 2...y 1.05...y 2...y 2...y 2...y 1.05...y 2...y 2...y 2...y 1.05...y … … …
0.8...z 1.1...z 0.5...z 0.49...z … … … .… … … … .… … … …
3...z 3...z 3...z 0.96...z … … … .… … … … .… … … …
9 8 9 1.11 9 8 9 1.11 9 8 9 1.11 12.z 11.z 13.z
GROSS ENROLMENT RATIO (GER)IN PRE-PRIMARY EDUCATION
(%)
2006
School year ending in
GPI(F/M)FemaleMaleTotal
NET ENROLMENT RATIO (NER)IN PRE-PRIMARY EDUCATION
(%)
2006
School year ending in
GPI(F/M)FemaleMaleTotal
GROSS ENROLMENT RATIO (GER)IN PRE-PRIMARY AND OTHER
ECCE PROGRAMMES (%)
2006
School year ending in
GPI(F/M)FemaleMaleTotal
NEW ENTRANTS TO THE FIRSTGRADE OF PRIMARY EDUCATION
WITH ECCE EXPERIENCE (%)
2006
School year ending in
FemaleMaleTotal
North America and Western Europe
South and West Asia
Sub-Saharan Africa
S TAT I S T I C A L TA B L E S
Ta b l e 3 B
2 8 9

171172173174175176177178179180181182183184185186187188189190191192193194195196197198199200201202203204
I
IIIIIIV
VVI
VIIVIII
IXX
XIXII
XIIIXIVXV
XVI
Côte d’IvoireD. R. CongoEquatorial GuineaEritreaEthiopiaGabonGambiaGhanaGuineaGuinea-BissauKenyaLesothoLiberiaMadagascarMalawiMaliMauritiusMozambiqueNamibiaNigerNigeriaRwandaSao Tome and PrincipeSenegalSeychelles1
Sierra LeoneSomaliaSouth AfricaSwazilandTogoUgandaUnited Republic of TanzaniaZambiaZimbabwe
World
Countries in transitionDeveloped countriesDeveloping countries
Arab StatesCentral and Eastern EuropeCentral AsiaEast Asia and the Pacific
East AsiaPacific
Latin America and the CaribbeanCaribbeanLatin America
North America and Western EuropeSouth and West AsiaSub-Saharan Africa
3-5 36 49 54 50 46 53 2 2 2 0.963-5 … … … … … … … … … .…
3-6 17 51 25.z 45.z 37 49.z 34 33 34 1.045-6 12 47 36 50 97 44 5 6 5 0.894-6 90 49 219 49 100 95 1 1 1 0.973-5 … … … … … … … … … .…
3-6 29 47 30...y 50...y … 100...y 18 19 17 0.913-5 667 49 1 105 50 33 19 39 39 39 1.023-6 … … 80 49 … 84 … … … .…
4-6 4 51 … … 62 … 3 3 3 1.053-5 1 188 50 1 672 48 10 31.z 44 44 43 1.003-5 33 52 30 64 100 100 21 20 22 1.083-5 112 42 358 51 39 32 41 47 35 0.743-5 50 51 146 51 93 94 3 3 3 1.023-5 … … … … … … … … … .…
3-6 21 51 51 49 … … 2 2 2 1.063-4 42 50 37 50 85 83 96 95 97 1.023-5 … … … … … … … … … .…
3-5 35 53 33 50 100 100...y 21 19 22 1.154-6 12 50 24 51 33 31 1 1 1 1.043-5 … … 1 753.y 49.y … … … … … .…
4-6 … … … … … … … … … .…
3-6 4 52 6 51 – –...z 25 24 26 1.124-6 24 50 95 52 68 76 3 3 3 1.004-5 3 49 3 48 5 6 109 107 111 1.043-5 … … 25 52 … 50 … … … .…
3-5 … … … … … … … … … .…
6-6 207 50 387.y 50.y 26 7.y 21 20 21 1.013-5 … … 15...z 49...z … .z … … … .…
3-5 11 50 13...y 50...y 53 59...y 2 2 2 0.994-5 66 50 69 50 100 100 4 4 4 1.005-6 … … 795 51 … 2 … … … .…
3-6 … … … … … … … … … .…
3-5 439 51 … … … … 41 40 41 1.03
… 112 367 48 138 895 48 30 34 33 33 32 0.97
… 7 139 47 7 316 47 0.02 2 46 47 44 0.94… 25 376 49 26 049 49 6 9 73 73 73 0.99… 79 851 47 105 529 48 47 49 27 28 26 0.96
… 2 441 43 3 078 46 83 76 15 17 13 0.77… 9 455 48 9 597 48 0.7 2 49 50 49 0.97… 1 365 47 1 476 48 0.1 1 21 21 20 0.92… 37 027 47 36 833 47 49 55 40 40 39 0.98… 36 615 47 36 323 47 57 50 40 40 39 0.98… 412 49 510 48 … … 61 61 61 1.00… 16 392 49 20 335 49 29 39 56 55 56 1.02… 672 50 792 51 88 86 65 64 67 1.05… 15 720 49 19 544 49 23 20 55 55 56 1.01… 19 133 48 19 881 49 26 27 75 76 74 0.98… 21 425 46 38 807 48 … … 21 22 20 0.94… 5 129 49 8 887 49 53 53 9 10 9 0.98
Table 3B (continued)
GROSS ENROLMENT RATIO (GER)IN PRE-PRIMARY EDUCATION
(%)
Enrolment in privateinstitutions as %
of total enrolment
GPI
19991999 2006
School year ending inSchool year ending in
Country or territory (F/M)FemaleMaleTotal
ENROLMENT IN PRE-PRIMARY EDUCATION
Total2006
% F
1999Agegroup
2006
School year ending in
(000)Total % F(000)
90
02
Education f
or A
ll G
lobal M
onitorin
g R
eport
A N N E X
1. National population data were used to calculate enrolment ratios.2. Enrolment and population data exclude Transnistria. 3. Enrolment ratios were not calculated due to lack of United Nations population data by age.4. Data include French overseas departments and territories (DOM-TOM).
5. The decline in enrolment is essentially due to a reclassification of programmes.From 2004, it was decided to include children categorized as being aged ‘4 rising 5’ in primary education enrolment rather than pre-primary enrolment even if they startedthe school year at the latter level. Such children typically (though not always) start primary school reception classes in the second or third term of the school year.
2 9 0
Weighted averageMedian% FSum% FSum

171172173174175176177178179180181182183184185186187188189190191192193194195196197198199200201202203204
I
IIIIIIV
VVIVIIVIIIIXXXIXIIXIIIXIVXVXVI
3 3 3 0.99 … … … .… 3 3 3 0.99 … … …… … … .… … … … .… … … … .… … … …
44.z 48.z 40.z 0.83.z … … … .… 44.z 48.z 40.z 0.83.z 70.z 67.z 72.z
14 13 14 1.03 7 7 7 1.01 18 17 18 1.06 … … …
3 3 3 0.96 2 2 2 0.96 3 3 3 0.96 … … …… … … .… … … … .… … … … .… … … …
17...y 16...y 17...y 1.04...y … … … .… … … … .… … … …
60 59 62 1.04 42 41 43 1.05 … … … .… … … …
7 7 7 1.01 7 7 7 1.01 7 7 7 1.01 17.z 17.z 18.z… … … .… … … … .… … … … .… … … …
49 51 48 0.94 27 27 27 0.98 … … … .… … … …
18 13 23 1.79 12 7 16 2.19 … … … .… … … …
100 97 102 1.05 35 34 36 1.08 … … … .… … … …
8 8 8 1.04 8 7 8 1.05 8 8 8 1.04 … … …… … … .… … … … .… … … … .… … … …
3 3 3 0.99 … … … .… 3 3 3 0.99 3 0.4 7101 100 101 1.02 90 89 91 1.02 101 100 101 1.02 100 100 100… … … .… … … … .… … … … .… … … …
22 22 22 1.01 … … … .… … … … .… .y .y .y
2 2 2 1.10 1 1 2 1.09 2 2 2 1.10 … … …
14.y 14.y 13.y 0.98.y 10.y 10.y 10.y 0.95.y … … … .… … … …… … … .… … … … .… … … … .… … … …
34 33 35 1.07 34 32 35 1.08 … … … .… 42 42 439 9 10 1.11 6 6 7 1.12 … … … .… 4.y 4.y 5.y
109 110 107 0.97 95 97 92 0.95 109 110 107 0.97 … … …
5 4 5 1.07 4 4 4 1.07 … … … .… … … …… … … .… … … … .… … … … .… … … …
38.y 37.y 38.y 1.02.y … … … .… 58.y … … .… … … …
17...z 17...z 17...z 0.99...z 11.y 11.y 11.y 0.99.y 17...z 17...z 17...z 0.99...z … … …
2...y 2...y 2...y 0.98...y 2...y 2...y 2...y 0.98...y 2...y 2...y 2...y 0.98...y … … …
3 3 3 1.03 2 2 2 1.01 … … … .… … … …
32 31 33 1.07 32 31 33 1.07 32 31 33 1.07 … … …… … … .… … … … .… … … … .… 17 16 17… … … .… … … … .… … … … .… … … …
41 41 40 0.98 … … … … … … … … … … …
62 64 61 0.95 … … … … … … … … … … …
79 79 79 1.00 … … … … … … … … … … …
36 36 35 0.98 … … … … … … … … … … …
18 19 17 0.89 … … … … … … … … … … …
62 63 61 0.96 … … … … … … … … … … …
28 29 28 0.96 … … … … … … … … … … …
45 45 44 0.97 … … … … … … … … … … …
44 45 44 0.97 … … … … … … … … … … …
74 75 73 0.98 … … … … … … … … … … …
65 65 65 1.00 … … … … … … … … … … …
79 77 82 1.06 … … … … … … … … … … …
64 64 64 1.00 … … … … … … … … … … …
81 81 81 1.00 … … … … … … … … … … …
39 39 39 1.01 … … … … … … … … … … …
14 14 14 0.97 … … … … … … … … … … …
GROSS ENROLMENT RATIO (GER)IN PRE-PRIMARY EDUCATION
(%)
2006
School year ending in
GPI(F/M)FemaleMaleTotal
NET ENROLMENT RATIO (NER)IN PRE-PRIMARY EDUCATION
(%)
2006
School year ending in
GPI(F/M)FemaleMaleTotal
GROSS ENROLMENT RATIO (GER)IN PRE-PRIMARY AND OTHER
ECCE PROGRAMMES (%)
2006
School year ending in
GPI(F/M)FemaleMaleTotal
NEW ENTRANTS TO THE FIRSTGRADE OF PRIMARY EDUCATION
WITH ECCE EXPERIENCE (%)
2006
School year ending in
FemaleMaleTotal
S TAT I S T I C A L TA B L E S
Ta b l e 3 B
6. The apparent increase in the gender parity index (GPI) is due to the recent inclusion in enrolment statistics of literacy programmes in which 80% of participants are women. Data in italic are UIS estimates.Data in bold are for the school year ending in 2007.
(z) Data are for the school year ending in 2005.(y) Data are for the school year ending in 2004.(*) National estimate.
2 9 1
Weighted average Weighted average Weighted average Median

90
02
Education f
or A
ll G
lobal M
onitorin
g R
eport
A N N E X
Algeria2
BahrainDjiboutiEgypt3
IraqJordan2
Kuwait2
Lebanon2,3
Libyan Arab Jamahiriya2
Mauritania3
MoroccoOmanPalestinian A. T.Qatar3
Saudi ArabiaSudan3
Syrian Arab Republic2
TunisiaUnited Arab Emirates3
Yemen3
Albania3
Belarus3
Bosnia and Herzegovina3
Bulgaria2,3
Croatia3
Czech RepublicEstoniaHungaryLatvia3
Lithuania2
MontenegroPoland2,4
Republic of Moldova3,5,6
Romania3
Russian Federation3
SerbiaSlovakia2
Slovenia2
TFYR Macedonia2,3
Turkey3
Ukraine3
Armenia3
Azerbaijan3
Georgia3
KazakhstanKyrgyzstan3
Mongolia3
Tajikistan3
Turkmenistan3
Uzbekistan3
AustraliaBrunei DarussalamCambodia3
China3,7
6-14 Yes 745 569 101 102 100 0.98 98 99 97 0.986-15 Yes 13 15 105 103 107 1.04 125 124 126 1.026-15 No 6 11 29 33 25 0.74 52 57 48 0.856-14 Yes 1 451 1 702 92 94 91 0.96 103 105 102 0.976-11 Yes 709 844...z 102 109 95 0.88 108...z 111...z 105...z 0.94...z
6-15 Yes 126 131 101 100 101 1.00 90 89 90 1.016-14 Yes 35 41 97 97 98 1.01 94 96 93 0.976-15 Yes 71 68 93 97 90 0.92 86 86 86 0.996-14 Yes … … … … … .… … … … .…
6-14 Yes … 103 … … … .… 127 124 129 1.046-14 Yes 731 615 112 115 108 0.94 102 104 100 0.966-15 Yes 52 44 87 87 87 1.00 76 76 76 1.016-15 … 95 95 103 103 104 1.01 78 78 78 1.016-17 Yes 11 13 108 109 107 0.98 108 107 109 1.026-11 Yes … … … … … .… … … … .…
6-13 Yes … 795 … … … .… 77 83 72 0.876-14 Yes 466 568 106 109 103 0.94 123 125 122 0.976-16 Yes 204 158 100 100 100 1.00 98 97 100 1.026-14 Yes 47 56 93 95 92 0.97 102 103 101 0.996-14 Yes 440 730 76 88 63 0.71 112 122 102 0.83
6-13 Yes 67 56.y 96 97 95 0.98 99.y 100.y 99.y 0.99.y
6-15 Yes 173 91 131 132 131 0.99 101 102 100 0.98… Yes … … … … … .… … … … .…
7-14 Yes 93 64 101 102 100 0.98 100 100 100 1.007-14 Yes 50 46 94 95 93 0.98 97 97 97 1.006-15 Yes 124 92 100 101 99 0.98 109 109 108 1.007-15 Yes 18 12 100 101 100 0.99 96 96 95 0.997-16 Yes 127 97 102 104 101 0.97 97 97 96 1.007-15 Yes 32 18 98 99 98 1.00 95 95 95 1.007-15 Yes 54 35 104 105 104 0.99 96 98 94 0.96… … … … … … … .… … … … .…
7-15 Yes 535 386 101 101 100 0.99 97 97 98 1.007-15 Yes 62 40 105 105 104 1.00 98 98 97 0.997-14 Yes 269 217 94 95 94 0.99 97 97 97 1.006-15 Yes 1 866 1 288 96 … … .… 100 101 100 0.997-14 Yes … … … … … .… … … … .…
6-15 Yes 75 56 102 102 101 0.99 101 102 101 0.996-14 Yes 21 17 98 98 97 0.99 96 95 96 1.007-14 Yes 32 26.z 102 102 102 1.00 99.z 99.z 99.z 1.01.z
6-14 Yes … 1 311 … … … .… 94 95 92 0.976-17 Yes 623 395.* 97 97 97 1.00 99.* 99.* 99.* 1.00.*
7-14 Yes … 40 … … … .… 104 102 106 1.056-16 Yes 175 124 94 94 95 1.01 98 99 97 0.986-14 Yes 74 49 99 99 100 1.02 100 97 103 1.067-17 Yes … 235 … … … .… 110 110 110 1.007-15 Yes 120.* 103 100.* 99.* 100.* 1.02.* 97 98 97 0.997-15 Yes 70 56 109 109 109 1.00 122 122 122 1.007-15 Yes 177 173 99 102 96 0.95 101 103 99 0.957-15 Yes … … … … … .… … … … .…
7-15 Yes 677 505 102 … … .… 93 95 92 0.97
5-15 Yes … 269...z … … … .… 106...z 106...z 105...z 1.00...z
5-16 No 8 8 107 107 106 0.99 105 105 105 1.00… Yes 404 435 109 112 106 0.95 131 135 127 0.94
6-14 Yes … 16 764 … … … .… 88 88 87 0.99
Table 4Access to primary education
GROSS INTAKE RATE (GIR)IN PRIMARY EDUCATION
(%)
GPI
Compulsoryeducation
(age group)
Legalguarantees
of freeeducation1
New entrants(000)
20062006 19991999
School year ending inSchool year ending in
Country or territory (F/M)FemaleMaleTotalGPI
(F/M)FemaleMaleTotal
Arab States
Central and Eastern Europe
Central Asia
East Asia and the Pacific
2 9 2

S TAT I S T I C A L TA B L E S
Ta b l e 4
Algeria 2
BahrainDjibouti
Egypt 3
IraqJordan 2
Kuwait 2
Lebanon 2,3
Libyan Arab Jamahiriya 2
Mauritania 3
MoroccoOman
Palestinian A. T.Qatar 3
Saudi ArabiaSudan 3
Syrian Arab Republic 2
TunisiaUnited Arab Emirates 3
Yemen 3
Albania 3
Belarus 3
Bosnia and Herzegovina 3
Bulgaria 2,3
Croatia 3
Czech RepublicEstonia
HungaryLatvia 3
Lithuania 2
MontenegroPoland 2,4
Republic of Moldova 3,5,6
Romania 3
Russian Federation 3
SerbiaSlovakia 2
Slovenia 2
TFYR Macedonia 2,3
Turkey 3
Ukraine 3
Armenia 3
Azerbaijan 3
Georgia 3
KazakhstanKyrgyzstan 3
Mongolia 3
Tajikistan 3
Turkmenistan 3
Uzbekistan 3
AustraliaBrunei Darussalam
Cambodia 3
China 3,7
77 79 76 0.97 85 86 84 0.98 … … … 13...z 13...z 13..z
89 86 91 1.06 99 99 100 1.01 13 13 14 15 14 1621 24 18 0.75 37 41 33 0.81 3 4 3 4 5 4… … … .… 93...y 93...y 92...y 0.99...y 13 … … 12...y … …
79 83 74 0.90 83...z 86...z 79...z 0.92...z 8 9 7 10...z 11...z 8...z
67 67 68 1.02 62.y 63.y 62.y 0.99.y … … … 13 13 1362 63 61 0.97 55.z 54.z 55.z 1.01.z 14 13 14 13 12 1369 70 67 0.95 60 61 59 0.97 12 12 12 13 13 13… … … .… … … … .… … … … … … …… … … .… 38 38 39 1.04 7 … … 8 8 851 53 48 0.92 84 86 82 0.96 8 9 7 10 … …
70 70 71 1.01 54 53 54 1.01 … … … 12 12 11… … … .… 58 58 58 0.99 12 12 12 14 13 14… … … .… … … … .… 13 12 14 13 13 14… … … .… … … … .… … … … … … …… … … .… … … … .… 5 … … … … …
60 60 59 0.98 52 52 52 1.00 … … … … … …… … … .… 88 88 89 1.02 13 13 13 14 13 1449 49 49 1.00 38 39 37 0.94 11 10 11 … … …
25 30 20 0.68 … … … .… 8 10 5 9 11 7
… … … .… … … … .… 11 11 11 11...y 11...y 11...y
76 77 76 0.99 84 85 83 0.98 14 13 14 15 14 15… … … .… … … … .… … … … … … …… … … .… … … … .… 13 13 13 14 13 1468 69 66 0.97 … … … .… 12 12 12 14 13 14… … … .… … … … .… 13 13 13 15 15 15… … … .… … … … .… 14 14 15 16 15 17… … … .… 65...z 67...z 63...z 0.94...z 14 14 14 15 15 16… … … .… … … … .… 14 13 14 16 14 17… … … .… … … … .… 14 13 14 16 15 17… … … .… … … … .… … … … … … …… … … .… … … … .… 15 14 15 15 15 16… … … .… 71 71 71 1.00 11 11 12 12 12 13… … … .… … … … .… 12 12 12 14 14 14… … … .… … … … .… … … … 14 13 14… … … .… … … … .… … … … … … …… … … .… … … … .… 13 13 13 15 14 15… … … .… … … … .… 15 14 15 17 16 17… … … .… … … … .… 12 12 12 12.z 12.z 12.z… … … .… 74...z 75...z 73...z 0.97...z … … … 11 12 1169 … … .… 75.* 75.* 75.* 1.00.* 13 13 13 14 14.* 15.*
… … … .… 55 53 58 1.08 11 … … 11 11 12… … … .… 70 71 69 0.98 10 10 10 11 11 1169 68 69 1.02 74 73 76 1.05 12 12 12 12 12 13… … … .… 59 61 57 0.93 12 12 12 15 15 1658.* 59.* 58.* 0.99.* 59 60 58 0.96 11 11 12 12 12 1381 81 81 0.99 79 79 79 1.00 9 8 10 13 12 1493 95 90 0.95 98 100 95 0.95 10 11 9 11 12 10… … … .… … … … .… … … … … … …… … … .… 77 … … .… 11 11 10 11 12 11
… … … .… 72...z 69...z 75...z 1.08...z 20 20 20 20 20 21… … … .… 68 67 69 1.03 14 13 14 14 14 1464 65 63 0.97 82 83 82 1.00 … … … 10 10 9… … … .… … … … .… … … … 11 11 11
Country or territory
1999 2006
School year ending in
FemaleMaleTotal FemaleMaleTotal
NET INTAKE RATE (NIR)IN PRIMARY EDUCATION
(%)
SCHOOL LIFE EXPECTANCY(expected number of years of formal schooling
from primary to tertiary education)
GPI
20061999
School year ending in
(F/M)FemaleMaleTotalGPI
(F/M)FemaleMaleTotal
Arab States
Central and Eastern Europe
Central Asia
East Asia and the Pacific
2 9 3

Cook Islands5
DPR KoreaFijiIndonesiaJapan4
Kiribati5
Lao PDRMacao, ChinaMalaysiaMarshall Islands2,5
MicronesiaMyanmar3
NauruNew Zealand4
Niue5
Palau2,5
Papua New GuineaPhilippines3
Republic of Korea2,4
SamoaSingaporeSolomon IslandsThailandTimor-Leste3
Tokelau5
TongaTuvalu5
VanuatuViet Nam3
Anguilla3
Antigua and BarbudaArgentina2,3
Aruba5
BahamasBarbadosBelizeBermuda5
Bolivia3
Brazil3
British Virgin Islands5
Cayman Islands8
Chile2,3
Colombia2
Costa Rica3
CubaDominica5
Dominican Republic3
Ecuador3
El Salvador3
Grenada5
Guatemala3
Guyana3
HaitiHonduras2,3
JamaicaMexico3
MontserratNetherlands AntillesNicaragua3
Panama3
5-15 … 0.6 0.3.z 131 … … .… 68...z 67...z 70...z 1.04...z
6-15 Yes … … … … … .… … … … .…
6-15 No … 18 … … … .… 96 96 96 1.007-15 No … 5 122 … … … .… 121 123 119 0.966-15 Yes 1 222 1 205 101 102 101 1.00 99 99 99 1.016-15 No 3 3...z 109 106 113 1.06 120...z 119...z 121...z 1.02...z
6-10 No 180 186 114 121 108 0.89 124 129 120 0.935-14 … 6 4 88 88 89 1.02 95 94 96 1.02… No … 520.z … … … .… 98.z 98.z 98.z 0.99.z
6-14 No 1 1.6 123 122 123 1.01 100 105 96 0.916-13 No … … … … … .… … … … .…
5-9 Yes 1 226 1 173 132 130 133 1.03 138 139 136 0.98… No … 0.2 … … … .… 71 65 77 1.19
5-16 Yes … 58...z … … … .… 104...z 105...z 104...z 1.00...z
5-16 … 0.05 0.02...z 105 79 137 1.73 81...z 69...z 93...z 1.34...z
6-14 Yes 0.4 0.3.y 118 120 115 0.96 87...y … … .…
6-14 No … … … … … .… … … … .…
6-12 Yes 2 551 2 547 133 136 129 0.95 126 131 121 0.936-14 Yes 711 606 106 109 103 0.94 107 106 109 1.025-14 No 5 6...y 105 106 104 0.98 101...y 101...y 101...y 1.00...y
6-16 No … … … … … .… … … … .…… No … … … … … .… … … … .…
6-14 Yes 1 037 … 110 111 107 0.96 … … … .…
7-15 Yes … 37.z … … … .… 112.z 118.z 105.z 0.89.z… … … 0.04...y … … … .… 78...y 48...y 109...y 2.28...y
6-14 No 3 3 104 107 100 0.94 116 118 114 0.977-14 No 0.2 0.3 89 94 83 0.89 112 120 104 0.866-12 No 6 7.y 109 109 109 1.00 120.y 122.y 117.y 0.96.y
6-14 Yes 2 035 1 355 106 110 103 0.93 … … … .…
5-17 Yes 0.2 0.2 … … … .… 116 101 137 1.365-16 Yes … … … … … .… … … … .…
5-14 Yes 781 743.z 112 111 112 1.00 109.z 109.z 108.z 0.99.z
6-16 … 1 1 109 112 106 0.94 98 93 103 1.105-16 No 7 6 116 122 111 0.91 107 106 108 1.015-16 Yes 4 4 99 99 98 0.99 111 112 109 0.975-14 Yes 8 9 128 129 126 0.98 123 122 124 1.025-16 … … 1 … … … .… 103 … … .…
6-13 Yes 282 287 124 124 125 1.01 122 122 122 1.007-14 Yes … 4 323.z … … … .… 125.z … … .…
5-16 … 0.4 0.4 106 109 103 0.95 113 110 115 1.04.*5-16 … 1 1 … … … .… … … … .…
6-13 Yes 284 252 95 95 94 0.99 99 100 99 0.985-14 No 1 267 1 129 137 140 134 0.96 125 127 123 0.976-15 Yes 87 86 104 104 105 1.01 108 108 108 1.006-14 Yes 164 145 106 109 104 0.95 103 102 104 1.025-16 No 2 1 111 118 104 0.88 82 79 85 1.075-13 Yes 267 217 132 137 128 0.94 101 102 100 0.985-14 Yes 374 399 134 134 134 1.00 137 138 137 0.997-15 Yes 196 183 134 138 129 0.94 119 121 116 0.965-16 No … 2...z … … … .… 100...z 102...z 99...z 0.96...z
7-15 Yes 425 460 131 135 127 0.94 124 125 122 0.986-15 Yes 18 20...y 126 123 128 1.05 126...y 126...y 127...y 1.02...y
6-11 No … … … … … .… … … … .…
6-11 Yes … 252 … … … .… 137 139 134 0.966-11 No … 52...z … … … .… 93...z 94...z 92...z 0.98...z
6-15 Yes 2 509 2 355 111 111 111 1.00 111 112 110 0.985-16 … 0.1 0.1 … … … .… 110 108 113 1.046-15 … 4 … 112 109 115 1.06 … … … .…
6-12 Yes 203 228 141 144 137 0.95 168 173 163 0.946-11 Yes 69 78 112 113 111 0.99 115 116 114 0.98
Table 4 (continued)
GROSS INTAKE RATE (GIR)IN PRIMARY EDUCATION
(%)
GPI
Compulsoryeducation
(age group)
Legalguarantees
of freeeducation1
New entrants(000)
20062006 19991999
School year ending inSchool year ending in
Country or territory (F/M)FemaleMaleTotalGPI
(F/M)FemaleMaleTotal
Latin America and the Caribbean
90
02
Education f
or A
ll G
lobal M
onitorin
g R
eport
A N N E X
2 9 4

Cook Islands 5
DPR KoreaFiji
IndonesiaJapan 4
Kiribati 5
Lao PDRMacao, China
MalaysiaMarshall Islands 2,5
MicronesiaMyanmar 3
NauruNew Zealand 4
Niue 5
Palau 2,5
Papua New GuineaPhilippines 3
Republic of Korea 2,4
SamoaSingapore
Solomon IslandsThailand
Timor-Leste 3
Tokelau 5
TongaTuvalu 5
VanuatuViet Nam 3
Anguilla 3
Antigua and BarbudaArgentina 2,3
Aruba 5
BahamasBarbados
BelizeBermuda 5
Bolivia 3
Brazil 3
British Virgin Islands 5
Cayman Islands 8
Chile 2,3
Colombia 2
Costa Rica 3
CubaDominica 5
Dominican Republic 3
Ecuador 3
El Salvador 3
Grenada 5
Guatemala 3
Guyana 3
HaitiHonduras 2,3
JamaicaMexico 3
MontserratNetherlands Antilles
Nicaragua 3
Panama 3
… … … .… 51...z 49...z 53...z 1.08...z 11 11 11 10...z 10...z 10...z… … … .… … … … .… … … … … … …… … … .… 70...z 70...z 70...z 1.00...z … … … 13...z 13...z 13...z… … … .… 41 42 41 0.97 … … … 12 … …… … … .… … … … .… 14 15 14 15 15 15… … … .… … … … .… 12 11 12 12.z 12.z 13.z
52 53 51 0.96 66 66 66 1.00 8 9 7 9 10 863 61 65 1.07 78 78 79 1.02 12 12 12 15 16 14… … … .… … … … .… 12 12 12 13.z 12.z 13.z… … … .… … … … .… … … … … … …… … … .… … … … .… … … … … … …
90 … … .… … … … .… 8 7 8 … … …… … … .… … … … .… … … … 8.* 8.* 9.*… … … .… 100...z 100...z 100...z 1.00...z 17 17 18 19 19 20… … … .… … … … .… 12 12 12 12.z 12.z 12.z… … … .… … … … .… … … … … … …… … … .… … … … .… … … … … … …
46 47 45 0.95 45 42 47 1.12 12 11 12 12 11 1297 100 94 0.94 98 97 100 1.04 15 16 14 17 18 1577 77 77 1.00 … … … .… 12 12 13 … … …… … … .… … … … .… … … … … … …… … … .… … … … .… 7 8 7 8.z 9.z 8.z… … … .… … … … .… … … … 14 13 14… … … .… 39.z 39.z 38.z 0.97.z … … … … … …… … … .… … … … .… … … … 11...y 10...y 11...y
48 50 47 0.94 … … … .… 13 13 14 13...y 13...y 13...y… … … .… … … … .… … … … … … …… … … .… 55.y 56.y 54.y 0.97.y 9 … … 10...y 11...y 10...y
79 … … .… … … … .… 10 11 10 … … …
… … … .… 78...z … … .… … … … 11 11 11… … … .… … … … .… … … … … … …… … … .… 98.z 100.z 97.z 0.97.z 15 14 16 15.z 14.z 16.z
90 91 89 0.98 81...z 80...z 82...z 1.02...z 13 13 14 14 13 1484 85 82 0.96 70 67 73 1.09 … … … … … …
77 77 76 0.99 87 87 87 1.00 13 13 14 … … …
78 80 76 0.95 68 68 68 1.00 … … … 13...y 13...y 13...y… … … .… … … … .… … … … 13.z 13.z 14.z
69 68 69 1.03 71 71 72 1.01 13 … … … … …… … … .… … … … .… 14 14 14 14.z 14.z 15.z
73 70 76 1.09 70...z 66...z 74...z 1.12...z 16 15 17 17...z 15...z 19...z… … … .… … … … .… … … … … … …… … … .… … … … .… 13 13 13 14 14 1460 61 59 0.96 … … … .… 11 11 11 12 12 13… … … .… … … … .… 10 10 10 12.z 12.z 12.z
98 … … .… 99 98 100 1.02 12 12 13 16 15 1780 83 78 0.94 46.y 46.y 46.y 1.01.y 12 12 13 13...z 13...z 14...z
58 58 58 1.00 68.z 68.z 68.z 1.00.z … … … 12...y 12...y 13...y
84 83 84 1.01 89 89 89 1.00 … … … … … …… … … .… 60 60 61 1.01 11 11 11 12 12 12… … … .… … … … .… … … … 12...z 12...z 12...z
56 58 54 0.92 71 72 70 0.97 … … … 10 11 1091 90 93 1.03 … … … .… … … … 13...z 13...z 14...z… … … .… … … … .… … … … … … …… … … .… 70 69 72 1.05 … … … 11...y 11...y 12...y… … … .… 75...z 74...z 76...z 1.03...z … … … … … …
89 89 89 1.01 90.y 90.y 89.y 0.99.y 12 12 12 13 14 13… … … .… 56...z 42...z 73...z 1.76...z … … … 16 15 1677 72 82 1.14 … … … .… 15 14 15 … … …
39 40 38 0.95 67 66 68 1.04 … … … … … …
84 84 84 1.00 88...y 87...y 89...y 1.02...y 13 12 13 13 13 14
Country or territory
1999 2006
School year ending in
FemaleMaleTotal FemaleMaleTotal
NET INTAKE RATE (NIR)IN PRIMARY EDUCATION
(%)
SCHOOL LIFE EXPECTANCY(expected number of years of formal schooling
from primary to tertiary education)
GPI
20061999
School year ending in
(F/M)FemaleMaleTotalGPI
(F/M)FemaleMaleTotal
Latin America and the Caribbean
S TAT I S T I C A L TA B L E S
Ta b l e 4
2 9 5
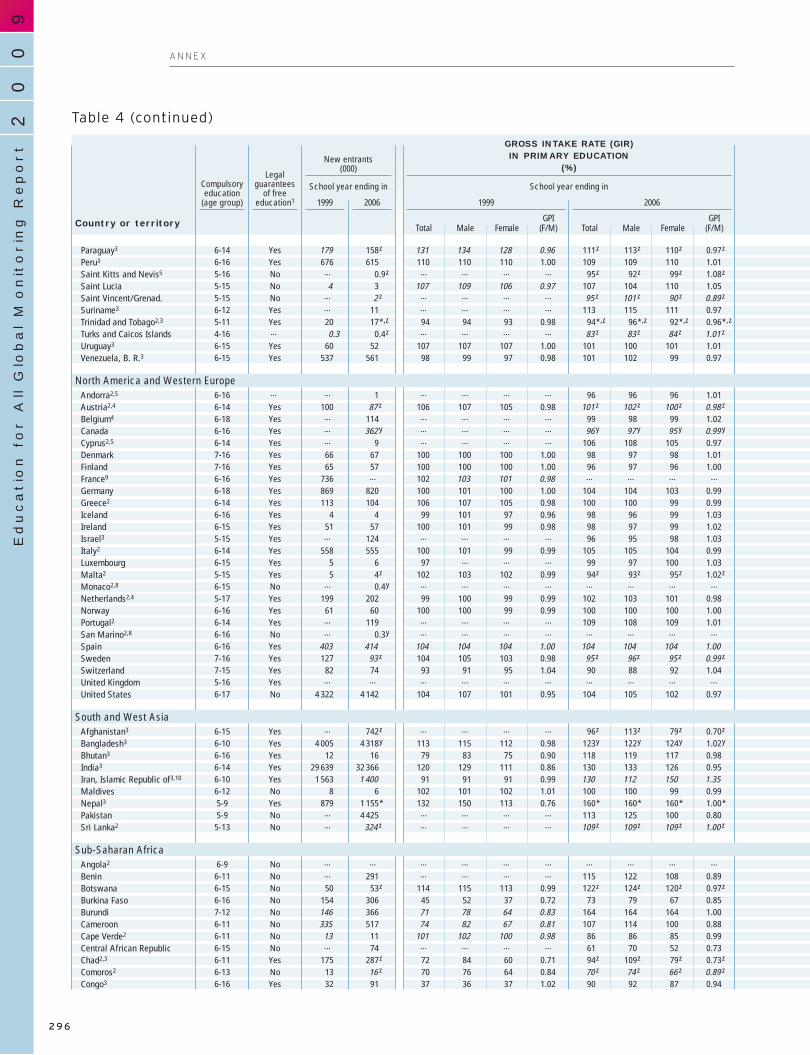
Paraguay3
Peru3
Saint Kitts and Nevis5
Saint LuciaSaint Vincent/Grenad.Suriname3
Trinidad and Tobago2,3
Turks and Caicos IslandsUruguay3
Venezuela, B. R.3
Andorra2,5
Austria2,4
Belgium4
CanadaCyprus2,5
DenmarkFinlandFrance9
GermanyGreece2
IcelandIrelandIsrael3
Italy2
LuxembourgMalta2
Monaco2,8
Netherlands2,4
NorwayPortugal2
San Marino2,8
SpainSwedenSwitzerlandUnited KingdomUnited States
Afghanistan3
Bangladesh3
Bhutan3
India3
Iran, Islamic Republic of3,10
MaldivesNepal3
PakistanSri Lanka2
Angola2
BeninBotswanaBurkina FasoBurundiCameroonCape Verde2
Central African RepublicChad2,3
Comoros2
Congo3
6-14 Yes 179 158.z 131 134 128 0.96 111.z 113.z 110.z 0.97.z
6-16 Yes 676 615 110 110 110 1.00 109 109 110 1.015-16 No … 0.9.z … … … .… 95.z 92.z 99.z 1.08.z
5-15 No 4 3 107 109 106 0.97 107 104 110 1.055-15 No … 2...z … … … .… 95...z 101...z 90...z 0.89...z
6-12 Yes … 11 … … … .… 113 115 111 0.975-11 Yes 20 17.*,z 94 94 93 0.98 94.*,z 96.*,z 92.*,z 0.96.*,.z
4-16 … 0.3 0.4.z … … … .… 83...z 83...z 84...z 1.01...z
6-15 Yes 60 52 107 107 107 1.00 101 100 101 1.016-15 Yes 537 561 98 99 97 0.98 101 102 99 0.97
6-16 … … 1 … … … .… 96 96 96 1.016-14 Yes 100 87...z 106 107 105 0.98 101...z 102...z 100...z 0.98...z
6-18 Yes … 114 … … … .… 99 98 99 1.026-16 Yes … 362...y … … … .… 96...y 97...y 95...y 0.99...y
6-14 Yes … 9 … … … .… 106 108 105 0.977-16 Yes 66 67 100 100 100 1.00 98 97 98 1.017-16 Yes 65 57 100 100 100 1.00 96 97 96 1.006-16 Yes 736 … 102 103 101 0.98 … … … .…
6-18 Yes 869 820 100 101 100 1.00 104 104 103 0.996-14 Yes 113 104 106 107 105 0.98 100 100 99 0.996-16 Yes 4 4 99 101 97 0.96 98 96 99 1.036-15 Yes 51 57 100 101 99 0.98 98 97 99 1.025-15 Yes … 124 … … … .… 96 95 98 1.036-14 Yes 558 555 100 101 99 0.99 105 105 104 0.996-15 Yes 5 6 97 … … .… 99 97 100 1.035-15 Yes 5 4.z 102 103 102 0.99 94.z 93.z 95.z 1.02.z
6-15 No … 0.4.y … … … .… … … … .…
5-17 Yes 199 202 99 100 99 0.99 102 103 101 0.986-16 Yes 61 60 100 100 99 0.99 100 100 100 1.006-14 Yes … 119 … … … .… 109 108 109 1.016-16 No … 0.3.y … … … .… … … … .…
6-16 Yes 403 414 104 104 104 1.00 104 104 104 1.007-16 Yes 127 93...z 104 105 103 0.98 95...z 96..z 95...z 0.99...z
7-15 Yes 82 74 93 91 95 1.04 90 88 92 1.045-16 Yes … … … … … .… … … … .…
6-17 No 4 322 4 142 104 107 101 0.95 104 105 102 0.97
6-15 Yes … 742.z … … … .… 96.z 113.z 79.z 0.70.z
6-10 Yes 4 005 4 318.y 113 115 112 0.98 123.y 122.y 124.y 1.02.y
6-16 Yes 12 16 79 83 75 0.90 118 119 117 0.986-14 Yes 29 639 32 366 120 129 111 0.86 130 133 126 0.956-10 Yes 1 563 1 400 91 91 91 0.99 130 112 150 1.356-12 No 8 6 102 101 102 1.01 100 100 99 0.995-9 Yes 879 1 155.* 132 150 113 0.76 160.* 160.* 160.* 1.00.*5-9 No … 4 425 … … … .… 113 125 100 0.80
5-13 No … 324...z … … … .… 109...z 109...z 109...z 1.00...z
6-9 No … … … … … .… … … … .…
6-11 No … 291 … … … .… 115 122 108 0.896-15 No 50 53.z 114 115 113 0.99 122.z 124.z 120.z 0.97.z
6-16 No 154 306 45 52 37 0.72 73 79 67 0.857-12 No 146 366 71 78 64 0.83 164 164 164 1.006-11 No 335 517 74 82 67 0.81 107 114 100 0.886-11 No 13 11 101 102 100 0.98 86 86 85 0.996-15 No … 74 … … … .… 61 70 52 0.736-11 Yes 175 287.z 72 84 60 0.71 94.z 109.z 79.z 0.73.z
6-13 No 13 16...z 70 76 64 0.84 70...z 74...z 66...z 0.89...z
6-16 Yes 32 91 37 36 37 1.02 90 92 87 0.94
Table 4 (continued)
GROSS INTAKE RATE (GIR)IN PRIMARY EDUCATION
(%)
GPI
Compulsoryeducation
(age group)
Legalguarantees
of freeeducation1
New entrants(000)
20062006 19991999
School year ending inSchool year ending in
Country or territory (F/M)FemaleMaleTotalGPI
(F/M)FemaleMaleTotal
North America and Western Europe
South and West Asia
Sub-Saharan Africa
90
02
Education f
or A
ll G
lobal M
onitorin
g R
eport
A N N E X
2 9 6

Paraguay 3
Peru 3
Saint Kitts and Nevis 5
Saint LuciaSaint Vincent/Grenad.
Suriname 3
Trinidad and Tobago 2,3
Turks and Caicos IslandsUruguay 3
Venezuela, B. R. 3
Andorra 2,5
Austria 2,4
Belgium 4
CanadaCyprus 2,5
DenmarkFinlandFrance 9
GermanyGreece 2
IcelandIreland
Israel 3
Italy 2
LuxembourgMalta 2
Monaco 2,8
Netherlands 2,4
NorwayPortugal 2
San Marino 2,8
SpainSweden
SwitzerlandUnited Kingdom
United States
Afghanistan 3
Bangladesh 3
Bhutan 3
India 3
Iran, Islamic Republic of 3,10
MaldivesNepal 3
PakistanSri Lanka 2
Angola 2
BeninBotswana
Burkina FasoBurundi
CameroonCape Verde 2
Central African RepublicChad 2,3
Comoros 2
Congo 3
… … … .… 69.z 68.z 70.z 1.04.z 11 11 11 12...z 12...z 12...z
79 79 79 1.00 82 81 82 1.02 … … … 14 14 14… … … .… 66...y 66...y 67...y 1.00...y … … … 12...z 12...z 13...z
76 76 75 0.99 75 73 77 1.05 … … … 14 13 14… … … .… 62...z 66...z 58...z 0.88...z … … … 12...z 12...z 12...z… … … .… 86 86 86 1.00 … … … … … …
67 66 67 1.02 65...z 64...z 66...z 1.03...z 11 11 12 11...z 11...z 11...z… … … .… 54...z 57...z 51...z 0.90...z … … … 11...z 11...z 12...z… … … .… … … … .… 14 13 15 15 14 1660 60 60 1.01 65 65 65 1.00 … … … 13 … …
… … … .… 47.z 48.z 46.z 0.97.z … … … 11 11 11… … … .… … … … .… 15 15 15 15 15 16… … … .… … … … .… 18 18 18 16 16 16… … … .… … … … .… … … … 17...y 17...y 17...y… … … .… … … … .… 13 12 13 14 13 14… … … .… 73.z 69.z 77.z 1.11.z 16 16 17 17 16 17… … … .… 93...z 91...z 95...z 1.04...z 17 17 18 17 17 18… … … .… … … … .… 16 15 16 16 16 17… … … .… … … … .… 16 16 16 16 16 1697 97 96 0.99 94...z 93...z 94...z 1.00...z 14 13 14 17 17 1798 100 96 0.97 96.z 98.z 95.z 0.97.z 17 16 17 18 17 19… … … .… … … … .… 16 16 17 18 17 18… … … .… … … … .… 15 15 15 15 15 16… … … .… … … … .… 15 15 15 16 16 17… … … .… … … … .… 14 13 14 14 13 14… … … .… … … … .… … … … 15.z 15.z 15.z… … … .… … … … .… … … … … … …… … … .… … … … .… 16 17 16 16 17 16… … … .… … … … .… 17 17 18 17 17 18… … … .… … … … .… 16 15 16 15 15 16… … … .… … … … .… … … … … … …… … … .… … … … .… 16 15 16 16 16 17… … … .… … … … .… 19 17 20 16 15 17… … … .… … … … .… 15 15 14 15 15 15… … … .… … … … .… 16 16 16 16 16 17… … … .… 70...z 69...z 72...z 1.03...z 16 … … 16 15 16
… … … .… … … … .… … … … 8...y 11...y 4...y
74 74 74 1.00 86.y 83.y 88.y 1.07.y 8 9 8 8.y 8.y 8.y
20 21 19 0.91 43 44 42 0.95 7 8 7 10 11 10… … … .… … … … .… … … … 10...z 11...z 9...z
44 45 43 0.97 94.z … … .… 12 12 11 13...z 13...z 13...z
87 86 87 1.01 78 78 79 1.01 12 12 12 12 12 12… … … .… … … … .… … … … … … …… … … .… 88 97 78 0.80 … … … 7 7 6… … … .… 97...y … … .… … … … … … …
… … … .… … … … .… 4 4 3 … … …… … … .… 48...z 51...z 45...z 0.89...z 6 8 5 8...z … …
23 21 25 1.20 31.z 28.z 34.z 1.22.z 11 11 12 12...z 12...z 12...z
19 22 16 0.71 27 30 25 0.83 3 4 3 5 5 4… … … .… 54 54 55 1.02 … … … 7 8 7… … … .… … … … .… 7 … … 9 10 865 64 66 1.03 70 70 71 1.01 … … … 12 11 12… … … .… … … … .… … … … … … …
22 25 18 0.72 … … … .… … … … 6...z 7...z 4...z
16 18 13 0.70 … … … .… 7 7 6 8...y 9...y 7...y… … … .… 53 54 52 0.96 … … … … … …
Country or territory
1999 2006
School year ending in
FemaleMaleTotal FemaleMaleTotal
NET INTAKE RATE (NIR)IN PRIMARY EDUCATION
(%)
SCHOOL LIFE EXPECTANCY(expected number of years of formal schooling
from primary to tertiary education)
GPI
20061999
School year ending in
(F/M)FemaleMaleTotalGPI
(F/M)FemaleMaleTotal
North America and Western Europe
South and West Asia
Sub-Saharan Africa
S TAT I S T I C A L TA B L E S
Ta b l e 4
2 9 7

Côte d’IvoireD. R. Congo3
Equatorial GuineaEritreaEthiopiaGabonGambia3
Ghana2,3
GuineaGuinea-Bissau3
KenyaLesothoLiberia2
Madagascar3
MalawiMali3
Mauritius3
MozambiqueNamibia3
Niger3
Nigeria3
Rwanda3
Sao Tome and PrincipeSenegal3
Seychelles5
Sierra LeoneSomaliaSouth AfricaSwazilandTogoUgandaUnited Republic of Tanzania3
ZambiaZimbabwe
World
Countries in transitionDeveloped countriesDeveloping countries
Arab StatesCentral and Eastern EuropeCentral AsiaEast Asia and the Pacific
East AsiaPacific
Latin America/CaribbeanCaribbeanLatin America
N. America/W. EuropeSouth and West AsiaSub-Saharan Africa
6-15 No 309 344 64 71 57 0.80 67 73 61 0.836-13 Yes 767 … 50 49 52 1.07 … … … .…
7-11 Yes … 15.z … … … .… 112.z 116.z 107.z 0.92.z
7-14 No 57 61 54 60 49 0.81 49 53 46 0.867-12 No 1 537 3 221 78 92 63 0.69 136 144 128 0.896-16 Yes … … … … … .… … … … .…
7-12 Yes 28 30 78 80 76 0.95 68 65 71 1.096-14 Yes 469 627 85 87 83 0.96 107 105 110 1.057-12 No 119 231 52 58 46 0.80 91 94 87 0.927-12 Yes 35 … 92 106 79 0.74 … … … .…
6-13 No 892 1 113...z 102 104 101 0.97 110...z 112...z 108...z 0.96...z
6-12 No 51 56 99 99 100 1.01 102 105 99 0.945-11 No 50 117 60 73 46 0.63 108 109 106 0.986-10 Yes 495 1 000 107 108 106 0.98 178 181 176 0.976-13 No 616 664 175 174 177 1.02 150 145 156 1.077-15 Yes 171 301 58 67 50 0.75 83 89 76 0.856-11 Yes 22 19 98 96 99 1.04 104 104 104 1.006-12 No 536 930 104 112 95 0.84 148 153 143 0.936-15 Yes 54 53 97 96 98 1.02 104 104 105 1.017-12 Yes 133 279 43 50 35 0.71 68 76 59 0.786-14 Yes 3 714 4 431.z 102 114 89 0.79 108.z 116.z 99.z 0.85.z
7-12 Yes 295 527 127 129 126 0.97 208 209 206 0.997-12 Yes 4 5 106 108 105 0.97 114 113 114 1.017-12 Yes 190 313 66 68 65 0.96 97 95 98 1.036-15 Yes 2 1 117 116 118 1.02 127 131 124 0.946-12 No … 296 … … … .… 180 188 172 0.92… No … … … … … .… … … … .…
7-15 No 1 157 1 173.y 115 117 114 0.97 115.y 118.y 112.y 0.95.y
6-12 Yes 31 31.z 99 101 97 0.96 107.z 111.z 103.z 0.92.z
6-15 No 139 178 91 97 86 0.88 98 101 95 0.946-12 No … 1 448 … … … .… 146 145 147 1.027-13 No 714 1 267 75 75 74 0.99 107 108 106 0.997-13 No 252 435 84 84 84 1.01 122 119 125 1.056-12 No 398 … 111 113 109 0.97 … … … .…
… … 130 195 135 340 104 109 100 0.92 111 114 108 0.95
… … 4 449 3 175 99 100 99 0.99 100 101 100 0.99… … 12 380 11 575 102 103 101 0.98 102 103 101 0.99… … 113 366 120 589 105 110 100 0.91 112 115 109 0.95
… … 6 297 7 191 90 93 87 0.93 100 102 98 0.96… … 5 635 4 370 97 99 96 0.97 98 98 97 0.99… … 1 795 1 416 101 101 101 1.00 102 103 100 0.98… … 37 045 31 830 103 103 102 0.99 98 99 97 0.98… … 36 513 31 288 103 103 102 0.99 98 99 97 0.98… … 533 542 102 104 101 0.97 101 103 99 0.96… … 13 176 13 142 119 122 116 0.95 119 122 117 0.96… … 565 585 156 153 159 1.04 157 157 156 0.99… … 12 612 12 557 118 121 115 0.95 118 120 115 0.96… … 9 328 8 932 103 104 101 0.97 103 103 102 0.99… … 40 522 44 823 114 123 104 0.85 127 130 123 0.94… … 16 397 23 637 90 96 84 0.87 111 116 106 0.92
Table 4 (continued)
GROSS INTAKE RATE (GIR)IN PRIMARY EDUCATION
(%)
GPI
Compulsoryeducation
(age group)
Legalguarantees
of freeeducation1
New entrants(000)
20062006 19991999
School year ending inSchool year ending in
Country or territory (F/M)FemaleMaleTotalGPI
(F/M)FemaleMaleTotal
90
02
Education f
or A
ll G
lobal M
onitorin
g R
eport
A N N E X
Weighted averageSum Sum
5. National population data were used to calculate enrolment ratios.6. Enrolment and population data exclude Transnistria.7. Children can enter primary school at age 6 or 7.8. Enrolment ratios were not calculated due to lack of United Nationspopulation data by age.
2 9 8
1. Source: Tomasevski (2006).2. Information on compulsory education comes from the Reports under the United Nations Human Rights Treaties.3. Some primary school fees continue to be charged despite the legal guarantee of free education (Bentaouet-Kattan, 2005; Tomasevski, 2006; World Bank, 2002).4. No tuition fees are charged but some direct costs have been reported (Bentaouet-Kattan, 2005; Tomasevski, 2006; World Bank, 2002).

Côte d’IvoireD. R. Congo 3
Equatorial GuineaEritrea
EthiopiaGabon
Gambia 3
Ghana 2,3
GuineaGuinea-Bissau 3
KenyaLesothoLiberia 2
Madagascar 3
MalawiMali 3
Mauritius 3
MozambiqueNamibia 3
Niger 3
Nigeria 3
Rwanda 3
Sao Tome and PrincipeSenegal 3
Seychelles 5
Sierra LeoneSomalia
South AfricaSwaziland
TogoUganda
United Republic of Tanzania 3
ZambiaZimbabwe
World
Countries in transitionDeveloped countries
Developing countries
Arab StatesCentral and Eastern Europe
Central AsiaEast Asia and the Pacific
East AsiaPacific
Latin America/CaribbeanCaribbean
Latin AmericaN. America/W. Europe
South and West AsiaSub-Saharan Africa
26 29 23 0.79 … … … .… 6 7 5 … … …
23 22 24 1.09 … … … .… 4 … … … … …… … … .… … … … .… … … … … … …
17 18 16 0.89 22 23 21 0.91 4 5 3 5...y 6...y 4...y
20 23 18 0.80 59 61 57 0.94 4 5 3 8 8 7… … … .… … … … .… 13 14 13 … … …
46 47 45 0.97 38 36 40 1.09 7 8 6 7...y 7...y 7...y
29 29 29 1.00 33 32 34 1.06 … … … 9 10 920 21 18 0.87 40 41 40 0.98 … … … 8 10 7… … … .… … … … .… … … … … … …
30 29 31 1.05 … … … .… … … … 10...y 10...y 9...y
26 25 27 1.06 48.z 48.z 49.z 1.01.z 9 9 10 10 10 10… … … .… … … … .… 8 10 7 … … …… … … .… 82 82 82 1.01 … … … 9 10 9… … … .… 62 60 65 1.09 11 12 10 9...y 10...y 9...y… … … .… 29 32 26 0.83 5 6 4 7 … …
72 71 73 1.03 91 91 91 1.00 12 12 12 14...z 14...z 13...z
18 19 17 0.93 53 53 53 0.99 5 … … 8...z 9...z 7...z
55 54 57 1.06 59 58 61 1.05 … … … 11 11 1127 32 22 0.68 45 51 39 0.76 … … … 4 5 3… … … .… 67...y 73...y 61...y 0.85...y 7 8 7 8...y 9...y 7...y… … … .… 96 97 95 0.99 6 … … 9...z 8...z 9...z… … … .… 45 44 46 1.04 … … … 10 10 1037 38 36 0.96 59 58 59 1.02 5 … … 7...z … …
75 74 77 1.03 96 97 94 0.97 14 14 14 15 14 15… … … .… … … … .… … … … … … …… … … .… … … … .… … … … … … …
44 45 43 0.95 52.y 53.y 51.y 0.98.y 13 13 14 13...y 13...y 13...y
42 40 43 1.06 48.z 48.z 47.z 0.99.z 10 10 9 10...z 10...z 10...z
37 40 35 0.87 42 44 41 0.94 9 11 7 … … …… … … .… 62 62 63 1.02 10 11 9 10...y 11...y 10...y
14 13 15 1.16 86 86 87 1.01 5 5 5 … … …
37 36 38 1.07 44 43 46 1.08 7 7 6 … … …… … … .… … … … .… 10 … … … … …
… … … … 68 67 68 1.01 10 10 9 11 11 11
… … … … … … … … 12 12 12 13 13 13… … … … … … … … 15 15 16 16 15 16… … … … 66 66 67 1.00 9 10 8 10 11 10
65 65 64 0.99 60 61 59 0.97 10 11 9 11 11 10… … … … … … … … 12 12 12 13 13 13… … … … 72 72 73 1.02 11 11 11 12 12 12… … … … … … … … 10 11 10 12 12 12… … … … 67 66 67 1.01 10 11 10 12 12 11… … … … … … … … 15 15 15 14 14 1477 72 82 1.14 70 66 74 1.12 13 12 13 13 13 14… … … … 70 67 73 1.09 11 11 11 11 11 1169 68 69 1.03 71 72 71 0.99 13 12 13 13 13 14… … … … … … … … 16 15 16 16 15 16… … … … 87 90 83 0.92 8 9 7 9 10 927 29 27 0.92 52 53 51 0.98 7 7 6 8 9 8
Country or territory
1999 2006
School year ending in
FemaleMaleTotal FemaleMaleTotal
NET INTAKE RATE (NIR)IN PRIMARY EDUCATION
(%)
SCHOOL LIFE EXPECTANCY(expected number of years of formal schooling
from primary to tertiary education)
GPI
20061999
School year ending in
(F/M)FemaleMaleTotalGPI
(F/M)FemaleMaleTotal
S TAT I S T I C A L TA B L E S
Median Weighted average
9. Data include French overseas departments and territories (DOM-TOM).10. The apparent increase in the gender parity index (GPI) is due to the recent inclusionin enrolment statistics of literacy programmes in which 80% of participants are women.Data in italic are UIS estimates.Data in bold are for the school year ending in 2007.
(z) Data are for the school year ending in 2005.(y) Data are for the school year ending in 2004.(*) National estimate.
2 9 9
Ta b l e 4

123456789
1011121314151617181920
212223242526272829303132333435363738394041
424344454647484950
51525354
90
02
Education f
or A
ll G
lobal M
onitorin
g R
eport
A N N E X
AlgeriaBahrainDjiboutiEgyptIraqJordanKuwaitLebanonLibyan Arab JamahiriyaMauritaniaMoroccoOmanPalestinian A. T.QatarSaudi ArabiaSudanSyrian Arab RepublicTunisiaUnited Arab EmiratesYemen
AlbaniaBelarusBosnia and HerzegovinaBulgariaCroatiaCzech RepublicEstoniaHungaryLatviaLithuaniaMontenegroPolandRepublic of Moldova3,4
RomaniaRussian Federation5
Serbia3
SlovakiaSloveniaTFYR MacedoniaTurkeyUkraine
ArmeniaAzerbaijanGeorgiaKazakhstanKyrgyzstanMongoliaTajikistanTurkmenistanUzbekistan
AustraliaBrunei DarussalamCambodiaChina6
6-11 3 799 4 779 47 4 197 47 ... – 105 110 100 0.916-11 75 76 49 90 49 19 25 107 106 108 1.016-11 122 38 41 54 44 9 13 33 39 28 0.716-11 9 466 8 086 47 9 988 48 … 8 102 106 97 0.916-11 4 535 3 604 44 4 430...z 44...z ... ....z 92 101 83 0.826-11 833 706 49 805 49 29 31 98 98 98 1.006-10 211 140 49 203 49 32 34 100 99 101 1.016-11 475 395 48 448 48 66 67 105 108 103 0.956-11 684 822 48 755 48 ... 5 120 121 118 0.986-11 458 346 48 466 50 2 7 89 89 88 0.996-11 3 720 3 462 44 3 944 46 4 7 86 95 77 0.816-11 349 316 48 288 49 5 5 91 93 89 0.976-9 463 368 49 382 49 9 9 105 105 106 1.01
6-11 68 61 48 71 49 37 63 102 104 100 0.966-11 3 220 … … … … … … … … … .…
6-11 5 878 2 513 45 3 881 46 2 5.z 49 53 45 0.856-9 1 806 2 738 47 2 280 48 4 4 102 107 98 0.92
6-11 1 048 1 443 47 1 134 48 0.7 1 113 116 111 0.956-10 262 270 48 272 49 44 65 90 92 89 0.976-11 3 747 2 303 35 3 220.z 42.z 1 2.z 71 91 51 0.56
6-9 217 292 48 250.y 48.y ... 4.y 103 104 102 0.986-9 383 632 48 368 48 0.1 0.1 111 111 110 0.996-9 198 … … … … … … … … … .…
7-10 272 412 48 273 48 0.3 0.4.z 106 108 105 0.987-10 197 203 49 195 49 0.1 0.2 92 93 92 0.986-10 474 655 49 473 48 0.8 1 103 104 103 0.997-12 80 127 48 80 48 1 3 102 103 100 0.977-10 428 503 48 416 48 5 7 102 103 101 0.987-10 83 141 48 79 48 1 1 100 101 99 0.987-10 159 220 48 150 48 0.4 0.5 102 103 101 0.98… … … … … … … … … … … .…
7-12 2 666 3 434 48 2 602 49 … 2 98 99 97 0.987-10 … 262 49 171 49 … 0.9 100 100 100 1.007-10 895 1 285 49 938 48 . 0.2 105 106 104 0.987-10 5 381 6 743 49 5 165 49 … 0.6 108 109 107 0.987-10 … 387 49 297 49 … … 112 112 111 0.996-9 235 317 49 235 48 4 5 103 103 102 0.99
6-10 93 92 48 93 48 0.1 0.1 100 100 99 0.997-10 109 130 48 110.z 48.z ... ..z 101 102 100 0.986-11 8 438 … … 7 950 48 … 2 … … … .…
6-9 1 717 2 200 49 1 754 49 0.3 0.5 109 110 109 0.99
7-9 124 255 … 121 48 … 2 100 … … .…
6-9 559 707 49 538 47 – 0.2 94 94 94 1.006-11 341 302 49 327 49 0.5 6 98 98 98 1.007-10 932 1 249 49 948 49 0.5 0.8 97 97 98 1.017-10 438 470 49 424 49 0.2 0.6 98 98 97 0.997-11 248 251 50 250 50 0.5 3.z 97 96 99 1.047-10 686 690 48 688 48 .. .. 98 101 96 0.957-9 295 … … … … … … … … … .…
7-10 2 313 2 570 49 2 165 49 … ... 98 99 98 1.00
5-11 1 849 1 885 49 1 939 49 27 29 100 100 100 1.006-11 43 46 47 46 48 36 36 114 115 112 0.976-11 2 113 2 127 46 2 582 47 2 0.9 97 104 90 0.877-11 97 931 … … 108 925 47 … 4 … … … .…
Table 5 Participation in primary education
GROSS ENROLMENT RATIO(GER) IN PRIMARY
EDUCATION (%)
Enrolment in privateinstitutions as %
of total enrolment
GPI
19991999 2006
School year ending inSchool year ending in
Country or territory (F/M)FemaleMaleTotal
ENROLMENT IN PRIMARY EDUCATION
Total2006 2005
% F
1999Agegroup
School-agepopulation1
(000)2006
School year ending in
(000)Total % F(000)
Arab States
Central and Eastern Europe
Central Asia
East Asia and the Pacific
3 0 0

1234567891011121314151617181920
212223242526272829303132333435363738394041
424344454647484950
51525354
S TAT I S T I C A L TA B L E S
Ta b l e 5
110 114 106 0.93 91 93 89 0.96 95 96 94 0.98 357 61 88 70120 120 119 1.00 96 95 97 1.03 98.z 98.z 98.z 1.00.z 1.0 6 0.4.z 33.z
44 49 39 0.81 27 32 23 0.73 38 42 34 0.82 83 53 75 53105 107 102 0.95 94 97 90 0.93 96 98 94 0.96 285 97 232 9699...z 109...z 90...z 0.83...z 85 91 78 0.85 89...z 95...z 82...z 0.86...z 605 71 508...z 78...z
97 96 98 1.02 91 91 91 1.01 90 89 90 1.02 40 46 53 4296 97 96 0.99 87 86 87 1.01 83 84 83 0.99 10 46 24 5094 96 93 0.97 86 88 85 0.96 82 82 82 0.99 44 55 81 50
110 113 108 0.95 … … … .… … … … .… … … … …
102 99 104 1.05 64 65 64 0.99 79 78 82 1.05 139 49 92 44106 112 100 0.89 70 76 65 0.85 88 91 85 0.94 1 183 59 429 61
82 82 83 1.01 81 81 81 1.00 74 73 75 1.02 61 48 82 4783 82 83 1.00 97 97 97 1.00 76 76 76 1.00 4 31 94 49
105 105 104 0.99 92 92 92 1.01 94 93 94 1.01 1.9 50 1.2 35… … … .… … … … .… … … … .… … … … …
66 71 61 0.87 … … … .… … … … .… … … … …
126 129 123 0.96 92 95 88 0.93 … … … .… 139 84 … …
108 110 107 0.97 93 94 92 0.98 96 96 97 1.01 82 55 27 34104 104 103 0.99 79 80 79 0.99 88 88 88 1.00 55 50 13 47
87.z 100.z 74.z 0.74.z 56 70 41 0.59 75.z 85.z 65.z 0.76.z 1 410 65 906.z 70.z
105.y 106.y 105.y 0.99.y 94 95 94 0.98 94.y 94.y 93.y 0.99.y 16 55 15.y 51.y
96 97 95 0.98 … … … .… 89 90 88 0.98 … … 39 53… … … .… … … … .… … … … .… … … … …
100 101 99 0.99 97 98 96 0.98 92 93 92 0.99 4 77 17 5199 99 99 1.00 85 86 85 0.98 90 91 90 0.99 18 52 2 7
100 100 100 0.99 97 96 97 1.00 93...z 91...z 94...z 1.03...z 21 46 37...z 41...z
99 100 98 0.98 96 96 95 0.98 94 95 94 0.99 0.1 66 2 4697 98 96 0.98 88 88 88 0.99 88 89 88 0.99 15 46 23 4895 96 93 0.96 97 98 96 0.98 90...z 89...z 92...z 1.03...z 2 56 7...z 37...z
95 95 94 0.99 95 96 95 0.99 89 90 89 0.99 4 44 13 48… … … .… … … … .… … … … .… … … … …
98 98 97 1.00 96 96 96 1.00 96 96 96 1.01 133 48 100 4597 97 96 0.99 93 … … .… 88 88 88 1.00 11 … 17 48
105 105 104 0.99 96 96 95 0.99 93 93 93 1.00 2 100 40 4796 96 96 1.00 … … … .… 91 91 91 1.00 … … 337 4497 97 97 1.00 … … … .… 95 95 95 1.00 … … 15 48
100 101 99 0.98 … … … .… 92...z 92...z 92...z 1.01...z … … 19...z 47...z
100 100 100 0.99 96 97 95 0.99 95 96 95 1.00 1.7 58 3 4898.z 98.z 98.z 1.00.z 93 94 92 0.98 92.z 92.z 92.z 1.00.z 1.4 95 3.z 45.z
94 96 92 0.95 … … … .… 91 93 89 0.96 … … 729 60102 102 102 1.00 … … … .… 90 90.* 90.* 1.00.* … … 161 49.*
98 96 100 1.04 … … … .… 82 80 84 1.05 … … 12 396 98 95 0.97 85 85 86 1.01 85 86 83 0.97 109 47 82 5396 94 97 1.03 77.* 77.* 77.* 1.00.* 89 88 91 1.03 70.* 49.* 33 41
105 105 105 1.00 … … … .… 90 90 90 1.00 … … 9 2997 97 96 0.99 88.* 89.* 87.* 0.99.* 86 86 85 0.99 28.* 50.* 29 49
101 99 102 1.02 89 87 90 1.04 91 90 93 1.02 22 38 7 15100 103 98 0.95 … … … .… 97 99 95 0.96 … … 19 89… … … .… … … … .… … … … .… … … … …
95 97 94 0.97 … … … .… … … … .… … … … …
105 105 105 1.00 94 94 94 1.01 96 96 97 1.01 108 46 63 44107 107 106 0.99 … … … .… 94 94 94 1.00 … … 1.1 42122 126 118 0.93 83 87 79 0.91 90 91 89 0.98 366 61 213 54111 112 111 0.99 … … … .… … … … .… … … … …
GROSS ENROLMENT RATIO (GER)IN PRIMARY EDUCATION
(%)
2006
School year ending in
GPI(F/M)FemaleMaleTotal
NET ENROLMENT RATIO (NER)IN PRIMARY EDUCATION
(%)
1999
School year ending in
GPI(F/M)FemaleMaleTotal
2006
GPI Total % F(F/M)FemaleMaleTotal
OUT-OF-SCHOOL CHILDREN(000)2
1999
School year ending in
(000)Total % F
2006
(000)
Arab States
Central and Eastern Europe
Central Asia
East Asia and the Pacific
3 0 1
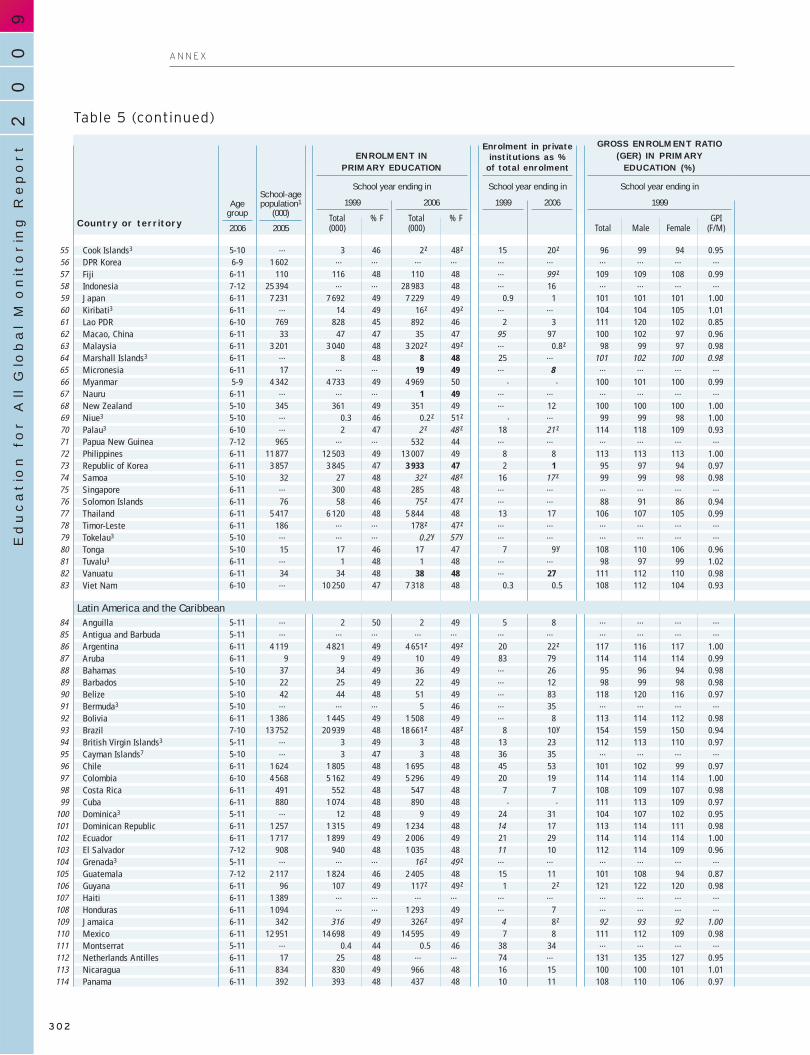
5556575859606162636465666768697071727374757677787980818283
84858687888990919293949596979899
100101102103104105106107108109110111112113114
Cook Islands3
DPR KoreaFijiIndonesiaJapanKiribati3
Lao PDRMacao, ChinaMalaysiaMarshall Islands3
MicronesiaMyanmarNauruNew ZealandNiue3
Palau3
Papua New GuineaPhilippinesRepublic of KoreaSamoaSingaporeSolomon IslandsThailandTimor-LesteTokelau3
TongaTuvalu3
VanuatuViet Nam
AnguillaAntigua and BarbudaArgentinaArubaBahamasBarbadosBelizeBermuda3
BoliviaBrazilBritish Virgin Islands3
Cayman Islands7
ChileColombiaCosta RicaCubaDominica3
Dominican RepublicEcuadorEl SalvadorGrenada3
GuatemalaGuyanaHaitiHondurasJamaicaMexicoMontserratNetherlands AntillesNicaraguaPanama
5-10 … 3 46 2.z 48.z 15 20.z 96 99 94 0.956-9 1 602 … … … … … … … … … .…
6-11 110 116 48 110 48 … 99...z 109 109 108 0.997-12 25 394 … … 28 983 48 … 16 … … … .…
6-11 7 231 7 692 49 7 229 49 0.9 1 101 101 101 1.006-11 … 14 49 16.z 49.z … … 104 104 105 1.016-10 769 828 45 892 46 2 3 111 120 102 0.856-11 33 47 47 35 47 95 97 100 102 97 0.966-11 3 201 3 040 48 3 202.z 49.z … 0.8.z 98 99 97 0.986-11 … 8 48 8 48 25 … 101 102 100 0.986-11 17 … … 19 49 … 8 … … … .…
5-9 4 342 4 733 49 4 969 50 ... ... 100 101 100 0.996-11 … … … 1 49 … … … … … .…
5-10 345 361 49 351 49 … 12 100 100 100 1.005-10 … 0.3 46 0.2.z 51.z ... … 99 99 98 1.006-10 … 2 47 2...z 48...z 18 21...z 114 118 109 0.937-12 965 … … 532 44 … … … … … .…
6-11 11 877 12 503 49 13 007 49 8 8 113 113 113 1.006-11 3 857 3 845 47 3 933 47 2 1 95 97 94 0.975-10 32 27 48 32...z 48...z 16 17...z 99 99 98 0.986-11 … 300 48 285 48 … … … … … .…
6-11 76 58 46 75.z 47.z … … 88 91 86 0.946-11 5 417 6 120 48 5 844 48 13 17 106 107 105 0.996-11 186 … … 178.z 47.z … … … … … .…
5-10 … … … 0.2...y 57...y … … … … … .…
5-10 15 17 46 17 47 7 9.y 108 110 106 0.966-11 … 1 48 1 48 … … 98 97 99 1.026-11 34 34 48 38 48 … 27 111 112 110 0.986-10 … 10 250 47 7 318 48 0.3 0.5 108 112 104 0.93
5-11 … 2 50 2 49 5 8 … … … .…
5-11 … … … … … … … … … … .…
6-11 4 119 4 821 49 4 651.z 49.z 20 22.z 117 116 117 1.006-11 9 9 49 10 49 83 79 114 114 114 0.995-10 37 34 49 36 49 … 26 95 96 94 0.985-10 22 25 49 22 49 … 12 98 99 98 0.985-10 42 44 48 51 49 … 83 118 120 116 0.975-10 … … … 5 46 … 35 … … … .…
6-11 1 386 1 445 49 1 508 49 … 8 113 114 112 0.987-10 13 752 20 939 48 18 661.z 48.z 8 10.y 154 159 150 0.945-11 … 3 49 3 48 13 23 112 113 110 0.975-10 … 3 47 3 48 36 35 … … … .…
6-11 1 624 1 805 48 1 695 48 45 53 101 102 99 0.976-10 4 568 5 162 49 5 296 49 20 19 114 114 114 1.006-11 491 552 48 547 48 7 7 108 109 107 0.986-11 880 1 074 48 890 48 .. ... 111 113 109 0.975-11 … 12 48 9 49 24 31 104 107 102 0.956-11 1 257 1 315 49 1 234 48 14 17 113 114 111 0.986-11 1 717 1 899 49 2 006 49 21 29 114 114 114 1.007-12 908 940 48 1 035 48 11 10 112 114 109 0.965-11 … … … 16...z 49...z … … … … … .…
7-12 2 117 1 824 46 2 405 48 15 11 101 108 94 0.876-11 96 107 49 117.z 49.z 1 2.z 121 122 120 0.986-11 1 389 … … … … … … … … … .…
6-11 1 094 … … 1 293 49 … 7 … … … .…
6-11 342 316 49 326.z 49.z 4 8.z 92 93 92 1.006-11 12 951 14 698 49 14 595 49 7 8 111 112 109 0.985-11 … 0.4 44 0.5 46 38 34 … … … .…
6-11 17 25 48 … … 74 … 131 135 127 0.956-11 834 830 49 966 48 16 15 100 100 101 1.016-11 392 393 48 437 48 10 11 108 110 106 0.97
Table 5 (continued)
GROSS ENROLMENT RATIO(GER) IN PRIMARY
EDUCATION (%)
Enrolment in privateinstitutions as %
of total enrolment
GPI
19991999 2006
School year ending inSchool year ending in
Country or territory (F/M)FemaleMaleTotal
ENROLMENT IN PRIMARY EDUCATION
Total2006 2005
% F
1999Agegroup
School-agepopulation1
(000)2006
School year ending in
(000)Total % F(000)
Latin America and the Caribbean
90
02
Education f
or A
ll G
lobal M
onitorin
g R
eport
A N N E X
3 0 2

5556575859606162636465666768697071727374757677787980818283
84858687888990919293949596979899100101102103104105106107108109110111112113114
80...z 79...z 80...z 1.01...z 85 87 83 0.96 74...z 73...z 75...z 1.03...z 0.4 54 0.7...z 45...z… … … .… … … … .… … … … .… … … … …
100 100 99 0.98 99 98 99 1.01 91 91 91 1.00 1.4 30 6 47114 116 112 0.96 … … … .… 96 97 94 0.96 … … 418 100100 100 100 1.00 100 100 100 1.00 100 100 100 1.00 3 100 16 …
113.z 112.z 114.z 1.01.z 97 96 98 1.01 … … … .… 0.1 … … …
116 123 109 0.89 76 79 73 0.92 84 86 81 0.94 178 56 125 57106 109 102 0.94 85 84 85 1.01 91 92 90 0.98 7 47 2.9 55100.z 101.z 100.z 1.00.z 98 99 97 0.98 100.z 100.z 100.z 1.00.z 70 70 4.z 100.z
93 94 92 0.97 … … … .… 66 67 66 0.99 … … 3 49110 109 110 1.01 … … … .… … … … .… … … … …
114 114 115 1.01 92 92 91 0.99 100 99 100 1.01 387 51 16 …
79 78 80 1.03 … … … .… … … … .… … … … …
102 102 102 1.00 99 99 99 1.00 99 99 99 1.00 2.0 45 2 44105.z 107.z 102.z 0.95.z 99 99 98 1.00 … … … .… 0.0 50 … …
104...z 107...z 101...z 0.94...z 97 99 94 0.94 … … … .… 0.05 91 … …
55 60 50 0.84 … … … .… … … … .… … … … …
110 110 109 0.99 92 92 92 1.00 91 90 92 1.02 895 48 953 42105 107 103 0.97 94 96 93 0.97 98 … … .… 215 62 57 …
100...z 100...z 100...z 1.00...z 92 92 91 0.99 90...y 90...y 91...y 1.00...y 1.6 50 0.3...y ….y… … … .… … … … .… … … … .… … … … …
101.z 102.z 98.z 0.96.z … … … .… 62.z 62.z 61.z 0.99.z … … 29.z 48.z
108 108 108 1.00 … … … .… 94 94 94 0.99 … … 0.9 10099.z 103.z 95.z 0.92.z … … … .… 68...z 70...z 67...z 0.96...z … … 57..z 51...z
93...y 79...y 107...y 1.35...y … … … .… … … … .… … … … …
113 116 110 0.95 88 90 86 0.96 96.z 97.z 94.z 0.97.z 1.8 56 0.2.z 100.z
106 106 105 0.99 … … … .… … … … .… … … … …
108 110 106 0.97 91 92 91 0.99 87 88 86 0.99 2.5 51 4 51… … … .… 95 … … .… … … … .… 447 … … …
93 94 92 0.99 … … … .… 92 92 91 1.00 … … 0.1 48… … … .… … … … .… … … … .… … … … …
112.z 113.z 112.z 0.99.z 99.* 99.* 99.* 1.00.* 99.z 99.z 98.z 0.99.z 10.* 52.* 36.z 86.z
115 116 113 0.98 98 97 100 1.03 100 99 100 1.00 0.1 7 0.04 2498 98 98 1.00 89 90 89 0.99 88 87 89 1.03 4 50 4 43
103 104 102 0.98 94 94 94 0.99 96 97 96 0.99 1.6 51 0.8 54123 125 121 0.97 94 94 94 0.99 97 97 97 1.01 1.7 49 0.4 12100 108 92 0.85 … … … .… 92 … … .… … … 0.3 …
109 109 109 1.00 95 95 95 1.00 95 94 95 1.01 52 51 52 43137.z 141.z 133.z 0.94.z 91 … … .… 94.z 93.z 95.z 1.02.z 1 033 … 597.z 36.z
112 114 110 0.97 96 95 97 1.02 95 95 95 1.00 0.04 42 0.1 46… … … .… … … … .… … … … .… … … … …
104 107 102 0.95 … … … .… … … … .… … … … …
116 117 115 0.99 89 89 90 1.01 88 89 88 1.00 369 46 367 48111 112 111 0.99 … … … .… … … … .… … … … …
101 102 100 0.97 97 97 98 1.01 97 96 97 1.01 9 … 27 4486 85 87 1.02 94 95 93 0.98 77 75 79 1.06 0.4 61 1.9 3998 101 96 0.95 84 83 84 1.01 77 76 78 1.03 174 47 255 45
117 117 117 1.00 97 97 98 1.01 97 96 97 1.01 17 16 11 …
114 116 112 0.96 … … … .… 94 94 94 1.00 … … 39 4593...z 94...z 91...z 0.96...z … … … .… 84...z 84...z 83...z 0.99...z … … 2...z 49...z
114 118 109 0.93 82 86 78 0.91 94 96 92 0.96 299 61 82 75124.z 125.z 124.z 0.99.z … … … .… … … … .… … … … …… … … .… … … … .… … … … .… … … … …
118 119 118 0.99 … … … .… 96 96 97 1.02 … … 33 3595.z 95.z 95.z 1.00.z 88 87 88 1.00 90...z 90...z 90...z 1.00...z 38 49 31...z 48...z
113 114 111 0.97 97 97 97 1.00 98 98 97 0.99 55 17 73 84114 114 114 1.00 … … … .… 99 … … .… … … 0.0 …
… … … .… … … … .… … … … .… … … … …
116 117 114 0.98 76 76 77 1.01 90 90 90 1.00 165 47 72 47112 113 110 0.97 96 96 96 0.99 98 99 98 0.99 11 53 3.7 60
GROSS ENROLMENT RATIO (GER)IN PRIMARY EDUCATION
(%)
2006
School year ending in
GPI(F/M)FemaleMaleTotal
NET ENROLMENT RATIO (NER)IN PRIMARY EDUCATION
(%)
1999
School year ending in
GPI(F/M)FemaleMaleTotal
2006
GPI Total % F(F/M)FemaleMaleTotal
OUT-OF-SCHOOL CHILDREN(000)2
1999
School year ending in
(000)Total % F
2006
(000)
Latin America and the Caribbean
S TAT I S T I C A L TA B L E S
Ta b l e 5
3 0 3

115116117118119120121122123124
125126127128129130131132133134135136137138139140141142143144145146147148149150
151152153154155156157158159
160161162163164165166167168169170
ParaguayPeruSaint Kitts and NevisSaint LuciaSaint Vincent/Grenad.SurinameTrinidad and TobagoTurks and Caicos IslandsUruguayVenezuela, Bolivarian Rep. of
Andorra3
AustriaBelgiumCanadaCyprus3
DenmarkFinlandFrance8
GermanyGreeceIcelandIrelandIsraelItalyLuxembourgMaltaMonaco7
NetherlandsNorwayPortugalSan Marino7
SpainSwedenSwitzerlandUnited KingdomUnited States
AfghanistanBangladeshBhutanIndiaIran, Islamic Republic of9
MaldivesNepalPakistanSri Lanka
AngolaBeninBotswanaBurkina FasoBurundiCameroonCape VerdeCentral African RepublicChadComorosCongo
6-11 844 951 48 934.z 48.z 15 17.z 119 121 116 0.966-11 3 459 4 350 49 4 026 49 13 18 122 123 121 0.995-11 … … … 6 54 … 20 … … … .…
5-11 20 26 49 24 48 2 3 109 110 108 0.985-11 16 … … 15 51 … 4 … … … .…
6-11 55 … … 66 48 … 47 … … … .…
5-11 133 172 49 130.*,z 49.*,z 72 70...z 96 96 95 1.006-11 … 2 49 2.z 51.z 18 30.z … … … .…
6-11 318 366 49 365 48 … 14 111 112 111 0.996-11 3 309 3 261 49 3 452 48 15 14 100 101 99 0.98
6-11 … … … 4 47 … 2 … … … .…
6-9 349 389 48 355 49 4 5 103 103 102 0.996-11 718 763 49 733 49 55 54 105 105 105 0.996-11 2 329 2 429 49 2 389...y 49...y 6 … 99 99 99 1.006-11 … 64 48 60 49 4 6 97.* 98.* 97.* 1.00*7-12 421 372 49 416 49 11 12 101 102 101 1.007-12 379 383 49 372 49 1 1 99 99 99 1.006-10 3 690 3 944 49 4 052 48 15 15 107 107 106 0.996-9 3 224 3 767 49 3 329 49 2 3 106 106 105 0.99
6-11 634 646 48 645 49 7 7 94 94 95 1.006-12 31 30 48 30 49 1 1 99 100 98 0.984-11 446 457 49 462 48 0.9 1 104 104 103 0.996-11 730 722 49 803 49 … ... 112 112 111 0.996-10 2 697 2 876 48 2 790 48 7 7 103 103 102 0.996-11 35 31 49 35 49 7 7 101 100 102 1.025-10 29 35 49 30.z 48.z 36 38.z 107 106 107 1.016-10 … 2 50 2.y … 31 26.y … … … .…
6-11 1 199 1 268 48 1 277 48.2 68 69.y 108 109 107 0.986-12 438 412 49 430 48.8 1 2.z 101 101 101 1.006-11 652 815 48 750 48 9 11 123 126 121 0.966-10 … … … 1.y … … ..y … … … .…
6-11 2 388 2 580 48 2 501 48 33 33 106 106 105 0.997-12 656 763 49 627 49 3 7 110 108 111 1.037-12 531 530 49 517 49 3 4 102 102 102 1.005-10 4 293 4 661 49 4 518 49 5 5 101 101 101 1.006-11 24 767 24 938 49 24 319 49 12 10 101 100 102 1.03
7-12 4 430 957 7 4 319.z 36.z … … 28 51 4 0.086-10 17 649 17 622 49 17 953.y 50.y 37 42.y 102 102 102 0.996-12 101 81 46 102 49 2 2 75 81 69 0.856-10 124 357 110 986 43 139 170 47 … … 93 100 85 0.846-10 6 176 8 667 47 7 274 55 … 5 96 99 94 0.956-12 47 74 49 55 48 3 2 134 134 135 1.015-9 3 571 3 588 42 4 503 47 … 15.z 114 128 98 0.775-9 19 837 … … 16 688 42 … 34 … … … .…
5-9 1 491 … … 1 635...z 49...z … 2...z … … … .…
6-9 1 913 1 057 46 … … 5 … 64 69 59 0.866-11 1 415 872 39 1 357 44 7 13 74 89 59 0.676-12 304 322 50 327.z 49.z 5 5.y 104 104 104 1.007-12 2 327 816 40 1 391 44 11 14 43 51 36 0.707-12 1 283 702 44 1 325 48 1 1 60 67 54 0.806-11 2 796 2 134 45 2 998 45 28 23 84 92 75 0.826-11 77 92 49 81 49 – 0.3 119 122 116 0.966-11 691 … … 419 41 … 10.z … … … .…
6-11 1 730 840 37 1 262.z 40.z 25 31.z 63 79 46 0.586-11 128 83 45 107...z 46...z 12 10...z 76 82 69 0.856-11 573 276 49 617 47 10 38 56 58 55 0.95
Table 5 (continued)
GROSS ENROLMENT RATIO(GER) IN PRIMARY
EDUCATION (%)
Enrolment in privateinstitutions as %
of total enrolment
GPI
19991999 2006
School year ending inSchool year ending in
Country or territory (F/M)FemaleMaleTotal
ENROLMENT IN PRIMARY EDUCATION
Total2006 2005
% F
1999Agegroup
School-agepopulation1
(000)2006
School year ending in
(000)Total % F(000)
North America and Western Europe
South and West Asia
Sub-Saharan Africa
90
02
Education f
or A
ll G
lobal M
onitorin
g R
eport
A N N E X
3 0 4

115116117118119120121122123124
125126127128129130131132133134135136137138139140141142143144145146147148149150
151152153154155156157158159
160161162163164165166167168169170
111.z 113.z 110.z 0.97.z 96 96 96 1.00 94.z 94.z 95.z 1.01.z 28 46 43.z 46.z
116 116 117 1.01 98 98 97 1.00 96 96 97 1.01 6 100 33 994 86 103 1.20 … … … .… 71 64 78 1.22 … … 2 35
118 121 114 0.94 96 97 96 0.99 98 99 97 0.98 0.7 52 0.2 7597 94 100 1.06 … … … .… 90.z 92.z 88.z 0.96.z … … 1.2.z 61.z
121 121 121 1.00 … … … .… 96 95 98 1.03 … … 1.9 2695.*,z 96.*,z 94.*,z 0.98.*,z 87 87 88 1.01 85.*,z 85.*,z 85.*,z 1.00.*,z 16 46 15.*,z 48.*,z
90...z 88...z 92...z 1.04...z … … … .… 78...z 75...z 81...z 1.07...z … … 0.5...z 42...z
115 117 113 0.97 … … … .… 100 100 100 1.00 … … 0.1 100104 106 103 0.98 86 85 86 1.01 91 91 91 1.00 424 47 226 46
90 90 90 1.00. … … … .… 83 83 83 1.01 … … 0.8 46102 102 101 0.99 97 97 98 1.01 97 97 98 1.01 10 38 9 38102 102 102 0.99 99 99 99 1.00 97 97 97 1.00 6 43 18 47100...y 100...y 99...y 0.99...y 99 99 99 1.00 … … … .… 30 42 … …
102 103 102 1.00 95 95 95 1.00 99 99 99 1.00 1.3 49 0.3 4999 99 99 1.00 97 97 97 1.00 96 95 96 1.01 8 42 16 4098 98 98 1.00 99 99 98 1.00 97 97 97 1.00 5 57 11 45
110 110 109 0.99 99 99 99 1.00 99 98 99 1.00 9 34 27 34103 103 103 1.00 … … … .… 98 98 98 1.00 … … 12 …
102 102 102 1.00 92 92 93 1.01 99 100 99 1.00 31 44 1.9 7198 98 97 0.99 99 100 98 0.98 98 98 97 0.99 0.3 100 0.7 63
104 104 103 0.99 94 93 94 1.01 95 94 95 1.01 28 45 23 44110 109 111 1.02 98 98 98 1.00 97 96 97 1.01 15 51 22 40103 104 103 0.99 99 99 99 0.99 99 99 98 0.99 7 100 17 72102 101 102 1.01 97 96 98 1.03 97 96 98 1.01 0.6 16 0.4 19100.z 101.z 99.z 0.98.z 95 94 96 1.02 91.z 92.z 91.z 0.99.z 1.7 41 2.6.z 51.z… … … .… … … … .… … … … .… … … … …
107 108 105 0.98 99 100 99 0.99 98 99 97 0.99 6.4 99 21 6998 98 98 1.01 100 100 100 1.00 98 98 98 1.01 0.6 60 8 42
115 118 112 0.95 … … … .… 98 98 98 0.99 … … 5 63… … … .… … … … .… … … … .… … … … …
105 106 104 0.98 100 100 100 1.00 100 100 99 1.00 6 69 7 8696 96 95 1.00 100 100 100 1.00 95 95 95 1.00 2 100 33 5097 98 97 0.99 94 94 94 1.00 89 89 89 0.99 10 37 35 48
105 105 106 1.01 100 100 100 1.00 98 98 99 1.01 2.0 25 16 0.198 98 99 1.01 94 94 94 1.00 92 91 93 1.02 1 215 49 1 683 42
101.z 126.z 75.z 0.59.z … … … .… … … … .… … … … …
103.y 101.y 105.y 1.03.y 83.* 83.* 83.* 1.00.* 89.*,y 87.*,y 90.*,y 1.04.*,y 2 350.* 48.* 1 371.*,y 39.*,y
102 103 101 0.98 56 60 53 0.89 79 79 79 1.00 47 53 20 49112 114 109 0.96 … … … .… 89 90 87 0.96 … … 7 208 64118 104 132 1.27 82 83 81 0.97 94 … … .… 1 616 52 391 …
116 118 114 0.97 98 97 98 1.01 97 97 97 1.00 1.1 41 0.9 46126 129 123 0.95 65.* 72.* 57.* 0.79.* 79...y 84...y 74...y 0.87...y 1 043.* 61.* 702...y 62...y
84 94 73 0.78 … … … .… 66 73 57 0.78 … … 6 821 60108...z 108...z 108...z 1.00...z … … … .… 97...y … … .… … … 51...y …
… … … .… … … … .… … … … .… … … … …
96 105 87 0.83 50.* 59.* 40.* 0.68.* 80 87 73 0.84 586.* 59.* 244 71107.z 107.z 106.z 0.99.z 80 79 82 1.04 84.z 83.z 85.z 1.03.z 55 44 49.z 45.z
60 66 54 0.82 35 41 28 0.70 47 52 42 0.82 1 231 54 1 215 54103 108 98 0.91 … … … .… 75 76 73 0.97 … … 324 53107 117 98 0.84 … … … .… … … … .… … … … …
106 108 103 0.95 99 99 98 0.98 88 88 87 0.99 0.8 90 9 5261 72 49 0.69 … … … .… 46 53 38 0.72 … … 375 5776.z 90.z 61.z 0.68.z 51 63 39 0.62 … … … .… 654 62 … …
85...z 91...z 80...z 0.88...z 49 54 45 0.85 … … … .… 53 54 … …
108 113 102 0.90 … … … .… 55 58 52 0.90 … … 243 53
GROSS ENROLMENT RATIO (GER)IN PRIMARY EDUCATION
(%)
2006
School year ending in
GPI(F/M)FemaleMaleTotal
NET ENROLMENT RATIO (NER)IN PRIMARY EDUCATION
(%)
1999
School year ending in
GPI(F/M)FemaleMaleTotal
2006
GPI Total % F(F/M)FemaleMaleTotal
OUT-OF-SCHOOL CHILDREN(000)2
1999
School year ending in
(000)Total % F
2006
(000)
North America and Western Europe
South and West Asia
Sub-Saharan Africa
S TAT I S T I C A L TA B L E S
Ta b l e 5
3 0 5

171172173174175176177178179180181182183184185186187188189190191192193194195196197198199200201202203204
I
IIIIIIV
VVI
VIIVIII
IXX
XIXII
XIIIXIVXV
XVI
Côte d’IvoireD. R. CongoEquatorial GuineaEritreaEthiopiaGabonGambiaGhanaGuineaGuinea-BissauKenyaLesothoLiberiaMadagascarMalawiMaliMauritiusMozambiqueNamibiaNigerNigeria10
RwandaSao Tome and PrincipeSenegalSeychelles3
Sierra LeoneSomaliaSouth AfricaSwazilandTogoUgandaUnited Republic of TanzaniaZambiaZimbabwe
World
Countries in transitionDeveloped countriesDeveloping countries
Arab StatesCentral and Eastern EuropeCentral AsiaEast Asia and the Pacific
East AsiaPacific
Latin America and the CaribbeanCaribbeanLatin America
North America and Western EuropeSouth and West AsiaSub-Saharan Africa
6-11 2 993 1 911 43 2 112 44 12 12 69 79 59 0.746-11 10 043 4 022 47 … … 19 … 48 51 46 0.907-11 64 75 44 76.z 49.z 33 30.z 142 159 125 0.797-11 585 262 45 364 44 11 8 52 57 47 0.827-12 13 142 5 168 38 12 175 47 … … 48 59 36 0.616-11 184 265 50 281...y 49...y 17 29...y 148 148 148 1.007-12 246 150 46 182 51 3 3.y 77 83 72 0.876-11 3 409 2 377 47 3 366 49 13 16 75 78 72 0.927-12 1 425 727 38 1 258 45 15 22 57 70 45 0.647-12 265 145 40 … … 19 … 70 84 56 0.676-11 5 763 4 782 49 6 101 49 … 4.z 93 94 91 0.976-12 371 365 52 425 50 … 0.4 102 98 106 1.086-11 588 396 42 538 47 38 … 85 98 73 0.746-10 2 652 2 012 49 3 699 49 22 19 93 95 92 0.976-11 2 461 2 582 49 2 934 50 … 1 137 140 134 0.967-12 2 009 959 41 1 610 44 22 38 59 70 49 0.705-10 119 133 49 121 49 24 26 105 105 106 1.006-12 3 983 2 302 43 4 173 46 … 2 70 80 59 0.746-12 376 383 50 403 50 4 4 104 104 105 1.017-12 2 226 530 39 1 127 41 4 4 31 37 25 0.686-11 23 631 17 907 44 22 267.z 45.z 4 … 88 98 78 0.797-12 1 443 1 289 50 2 020 51 … 1 92 93 91 0.987-12 24 24 49 31 49 – –. z 108 109 106 0.977-12 1 845 1 034 46 1 473 49 12 12 64 69 59 0.866-11 … 10 49 9 49 5 6 116.y 117 116 0.996-11 871 … … 1 322 48 … 3 … … … .…
6-12 1 520 … … … … … … … … … .…
7-13 7 116 7 935 49 7 444.y 49.y 2 2.y 116 117 114 0.976-12 207 213 49 222.z 48.z – ..z 100 102 97 0.956-11 1 027 954 43 1 052 46 36 43 112 127 96 0.756-12 6 309 6 288 47 7 364 50 … 9 125 130 119 0.927-13 7 217 4 190 50 8 317 49 0.2 1 67 67 67 1.007-13 2 292 1 556 48 2 679 49 … 3 80 84 77 0.926-12 2 417 2 460 49 2 446 50 88 … 100 101 98 0.97
… 654 297 648 135 47 688 173 47 7 7 99 103 95 0.92
… 13 348 16 469 49 13 165 49 0.2 0.6 104 105 103 0.99… 65 763 70 414 49 66 423 49 4 4 102 102 102 1.00… 575 186 561 252 46 608 585 47 11 10 99 103 94 0.91
… 41 219 35 402 46 40 150 47 4 7 90 96 84 0.87… 22 520 26 063 48 21 792 48 0.3 0.7 102 104 100 0.96… 5 938 6 884 49 5 957 48 0.3 0.7 98 99 98 0.99… 175 938 217 564 48 192 241 47 8 10 112 113 112 0.99… 172 464 214 392 48 189 096 47 2 3 113 113 112 0.99… 3 474 3 172 48 3 145 48 … 20 95 97 94 0.97… 58 255 70 206 48 68 553 48 15 17 121 123 119 0.97… 2 236 2 500 49 2 412 49 21 28 112 113 111 0.98… 56 019 67 705 48 66 141 48 15 14 122 123 120 0.97… 50 698 52 882 49 51 377 49 7 7 103 102 103 1.01… 177 659 157 510 44 192 040 47 … 5 90 98 82 0.84… 122 070 81 625 46 116 063 47 11 8 78 84 71 0.85
Table 5 (continued)
GROSS ENROLMENT RATIO(GER) IN PRIMARY
EDUCATION (%)
Enrolment in privateinstitutions as %
of total enrolment
GPI
19991999 2006
School year ending inSchool year ending in
Country or territory (F/M)FemaleMaleTotal
ENROLMENT IN PRIMARY EDUCATION
Total2006 2005
% F
1999Agegroup
School-agepopulation1
(000)2006
School year ending in
(000)Total % F(000)
90
02
Education f
or A
ll G
lobal M
onitorin
g R
eport
A N N E X
Weighted averageMedianSum Sum % F Sum % F
3 0 6
1. Data are for 2005 except for countries with a calendar school year, in which case data are for 2006.2. Data reflect the actual number of children not enrolled at all, derived from the age-specificenrolment ratios of primary school age children, which measures the proportion of those who areenrolled either in primary or in secondary schools (total primary NER).3. National population data were used to calculate enrolment ratios.4. Enrolment and population data exclude Transnistria.
5. In the Russian Federation two education structures existed in the past, bothstarting at age 7. The most common or widespread one lasted three years and wasused to calculate indicators; the second one, in which about one-third of primarypupils were enrolled, had four grades. Since 2004, the four-grade structure has beenextended all over the country.6. Children enter primary school at age 6 or 7. Since 7 is the most common entranceage, enrolment ratios were calculated using the 7-11 age group for population.

171172173174175176177178179180181182183184185186187188189190191192193194195196197198199200201202203204
I
IIIIIIV
VVIVIIVIIIIXXXIXIIXIIIXIVXVXVI
71 79 62 0.79 52 60 45 0.75 … … … .… 1 290 58 … …… … … .… … … … .… … … … .… … … … …
122.z 125.z 119.z 0.95.z 89 100 79 0.79 … … … .… 6 100 … …
62 69 56 0.81 33 36 31 0.86 47 50 43 0.87 335 52 308 5391 97 85 0.88 34 41 28 0.69 71 74 68 0.92 7 069 55 3 721 55
152...y 153...y 152...y 0.99...y … … … .… … … … .… … … … …
74 71 77 1.08 64 68 61 0.89 62 59 64 1.09 68 55 90 4698 98 97 0.99 57 58 55 0.96 72 73 71 0.97 1 349 50 967 5188 96 81 0.84 45 52 36 0.69 72 77 66 0.86 698 56 389 59… … … .… 45 53 37 0.71 … … … .… 114 57 … …
106 107 104 0.97 63 63 64 1.01 75 75 76 1.02 1 859 49 1 371 48114 115 114 1.00 57 54 61 1.12 72 71 74 1.04 152 46 101 47
91 96 87 0.90 42 47 36 0.77 39 40 39 0.97 268 55 356 50139 142 137 0.96 63 63 63 1.01 96 96 96 1.00 796 50 106 49119 117 121 1.04 98 99 97 0.98 91 88 94 1.06 20 100 202 33
80 90 71 0.79 46 55 38 0.70 61 67 54 0.79 862 58 793 59102 102 102 1.00 91 90 91 1.01 95 94 96 1.02 12 47 6 41105 113 97 0.86 52 58 46 0.79 76 79 73 0.93 1 574 56 954 56107 107 107 1.00 73 71 76 1.07 76 74 79 1.06 98 45 89 45
51 58 43 0.73 26 31 21 0.68 43 50 37 0.73 1 255 52 1 245 5596.z 105.z 87.z 0.83.z 58 64 52 0.82 63...z 68...z 59...z 0.86...z 8 218 57 8 097...z 56...z
140 137 142 1.04 … … … .… 79...z 76...z 81...z 1.06...z … … 303...z 45...z
127 128 127 1.00 86 86 85 0.99 98 97 98 1.01 2.7 50 0.6 3880 81 79 0.98 54 57 50 0.88 71 71 70 0.98 740 54 513 51
125 126 125 0.99 … … … .… 99.y 99.y 100.y 1.01.y … … 0.04.y ….y
147 155 139 0.90 … … … .… … … … .… … … … …… … … .… … … … .… … … … .… … … … …
106.y 108.y 103.y 0.96.y 94 93 94 1.01 88.y 88.y 88.y 1.00.y 97 2 469.y 44.106.z 110.z 102.z 0.93.z 74 73 75 1.02 78.z 78.z 79.z 1.01.z 54 48 45.z 49.z
102 110 95 0.86 79 89 70 0.79 80 86 75 0.87 148 81 176 68117 116 117 1.01 … … … .… … … … .… … … … …
112 113 111 0.98 50 49 50 1.04 98 98 97 0.99 3 148 49 143 65117 118 116 0.98 68 69 67 0.96 92 90 94 1.03 616 52 150 36101 102 101 0.99 83 83 83 1.01 88 87 88 1.01 406 49 281 47
105 108 102 0.95 82 85 80 0.93 86 88 85 0.97 103 223 58 75 177 55
99 99 98 0.99 88 88 87 0.99 90 90 89 0.99 1 555 51 899 49101 101 101 1.00 97 97 97 1.00 95 95 96 1.01 1 791 50 2 368 43106 109 103 0.94 81 84 77 0.92 85 87 84 0.96 99 877 58 71 911 55
97 102 92 0.90 78 82 74 0.90 84 87 81 0.93 7 980 59 5 708 6197 98 96 0.98 91 93 90 0.97 92 92 91 0.98 2 036 59 1 611 52
100 101 99 0.98 87 87 86 0.99 89 90 88 0.98 548 51 352 53109 110 108 0.99 96 96 96 1.00 93 94 93 1.00 6 079 51 9 535 49110 110 109 0.99 96 96 96 1.00 94 94 93 1.00 5 760 51 8 988 49
91 92 89 0.97 90 91 89 0.98 84 85 83 0.97 318 54 546 52118 120 116 0.97 92 93 91 0.98 94 94 94 1.00 3 522 54 2 631 47108 109 107 0.99 75 76 74 0.97 72 73 70 0.97 493 50 617 51118 120 116 0.97 93 94 92 0.98 95 95 95 1.00 3 029 55 2 014 46101 101 101 1.00 97 97 97 1.00 95 95 95 1.01 1 420 50 1 981 43108 111 105 0.95 75 81 69 0.84 86 88 83 0.95 36 618 64 18 203 59
95 101 89 0.89 56 60 53 0.89 70 73 67 0.92 45 021 54 35 156 54
GROSS ENROLMENT RATIO (GER)IN PRIMARY EDUCATION
(%)
2006
School year ending in
GPI(F/M)FemaleMaleTotal
NET ENROLMENT RATIO (NER)IN PRIMARY EDUCATION
(%)
1999
School year ending in
GPI(F/M)FemaleMaleTotal
2006
GPI Total % F(F/M)FemaleMaleTotal
OUT-OF-SCHOOL CHILDREN(000)2
1999
School year ending in
(000)Total % F
2006
(000)
S TAT I S T I C A L TA B L E S
Ta b l e 5
Weighted average Weighted average Weighted average Sum % FSum % F
3 0 7
7. Enrolment ratios were not calculated due to lack of United Nations population data by age.8. Data include French overseas departments and territories (DOM-TOM).9. The apparent increase in the gender parity index (GPI) is due to the recent inclusionin enrolment statistics of literacy programmes in which 80% of participants are women.10. Due to the continuing discrepancy in enrolment by single age, the net enrolment ratioin primary education is estimated using the age distribution of the 2004 DHS data.
Data in italic are UIS estimates.Data in bold are for the school year ending in 2007.(z) Data are for the school year ending in 2005.(y) Data are for the school year ending in 2004.(*) National estimate.
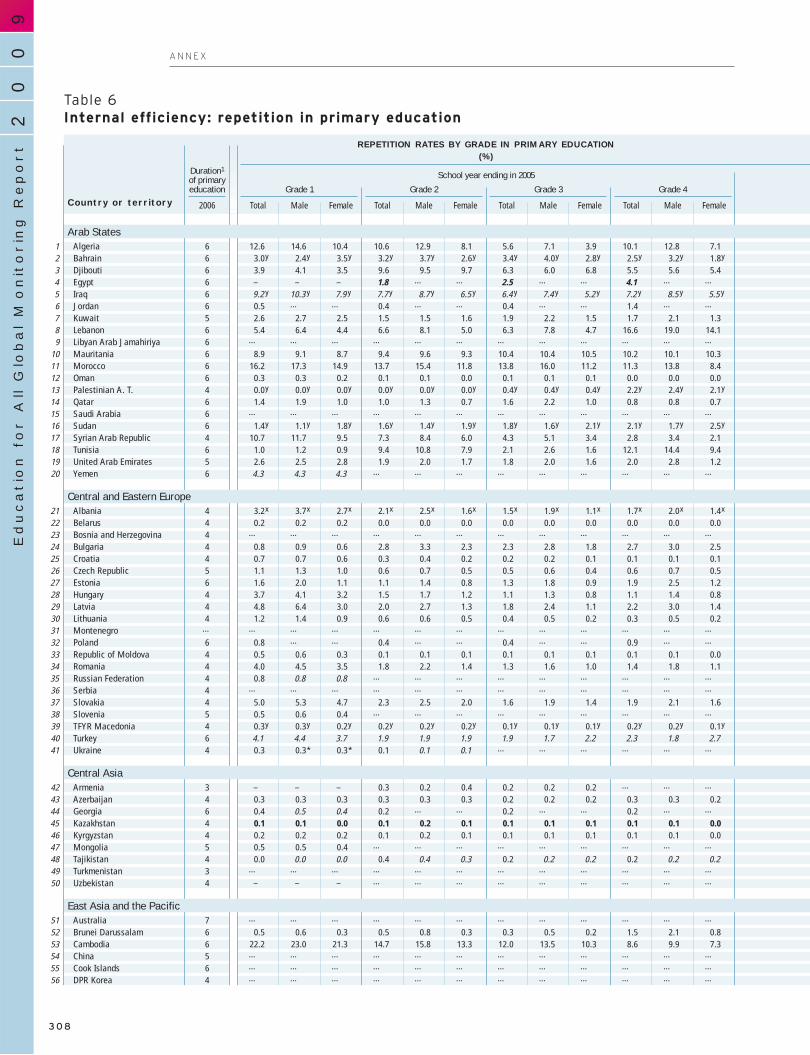
90
02
Education f
or A
ll G
lobal M
onitorin
g R
eport
A N N E X
AlgeriaBahrainDjiboutiEgyptIraqJordanKuwaitLebanonLibyan Arab JamahiriyaMauritaniaMoroccoOmanPalestinian A. T.QatarSaudi ArabiaSudanSyrian Arab RepublicTunisiaUnited Arab EmiratesYemen
AlbaniaBelarusBosnia and HerzegovinaBulgariaCroatiaCzech RepublicEstoniaHungaryLatviaLithuaniaMontenegroPolandRepublic of MoldovaRomaniaRussian FederationSerbiaSlovakiaSloveniaTFYR MacedoniaTurkeyUkraine
ArmeniaAzerbaijanGeorgiaKazakhstanKyrgyzstanMongoliaTajikistanTurkmenistanUzbekistan
AustraliaBrunei DarussalamCambodiaChinaCook IslandsDPR Korea
6 12.6 14.6 10.4 10.6 12.9 8.1 5.6 7.1 3.9 10.1 12.8 7.16 3.0.y 2.4.y 3.5.y 3.2.y 3.7.y 2.6.y 3.4.y 4.0.y 2.8.y 2.5.y 3.2.y 1.8.y
6 3.9 4.1 3.5 9.6 9.5 9.7 6.3 6.0 6.8 5.5 5.6 5.46 – – – 1.8 … … 2.5 … … 4.1 … …
6 9.2...y 10.3...y 7.9...y 7.7...y 8.7...y 6.5...y 6.4...y 7.4...y 5.2...y 7.2...y 8.5...y 5.5...y
6 0.5 … … 0.4 … … 0.4 … … 1.4 … …
5 2.6 2.7 2.5 1.5 1.5 1.6 1.9 2.2 1.5 1.7 2.1 1.36 5.4 6.4 4.4 6.6 8.1 5.0 6.3 7.8 4.7 16.6 19.0 14.16 … … … … … … … … … … … …
6 8.9 9.1 8.7 9.4 9.6 9.3 10.4 10.4 10.5 10.2 10.1 10.36 16.2 17.3 14.9 13.7 15.4 11.8 13.8 16.0 11.2 11.3 13.8 8.46 0.3 0.3 0.2 0.1 0.1 0.0 0.1 0.1 0.1 0.0 0.0 0.04 0.0.y 0.0.y 0.0.y 0.0.y 0.0.y 0.0.y 0.4.y 0.4.y 0.4.y 2.2.y 2.4.y 2.1.y
6 1.4 1.9 1.0 1.0 1.3 0.7 1.6 2.2 1.0 0.8 0.8 0.76 … … … … … … … … … … … …
6 1.4.y 1.1.y 1.8.y 1.6.y 1.4.y 1.9.y 1.8.y 1.6.y 2.1.y 2.1.y 1.7.y 2.5.y
4 10.7 11.7 9.5 7.3 8.4 6.0 4.3 5.1 3.4 2.8 3.4 2.16 1.0 1.2 0.9 9.4 10.8 7.9 2.1 2.6 1.6 12.1 14.4 9.45 2.6 2.5 2.8 1.9 2.0 1.7 1.8 2.0 1.6 2.0 2.8 1.26 4.3 4.3 4.3 … … … … … … … … …
4 3.2.x 3.7.x 2.7.x 2.1.x 2.5.x 1.6.x 1.5.x 1.9.x 1.1.x 1.7.x 2.0.x 1.4.x
4 0.2 0.2 0.2 0.0 0.0 0.0 0.0 0.0 0.0 0.0 0.0 0.04 … … … … … … … … … … … …
4 0.8 0.9 0.6 2.8 3.3 2.3 2.3 2.8 1.8 2.7 3.0 2.54 0.7 0.7 0.6 0.3 0.4 0.2 0.2 0.2 0.1 0.1 0.1 0.15 1.1 1.3 1.0 0.6 0.7 0.5 0.5 0.6 0.4 0.6 0.7 0.56 1.6 2.0 1.1 1.1 1.4 0.8 1.3 1.8 0.9 1.9 2.5 1.24 3.7 4.1 3.2 1.5 1.7 1.2 1.1 1.3 0.8 1.1 1.4 0.84 4.8 6.4 3.0 2.0 2.7 1.3 1.8 2.4 1.1 2.2 3.0 1.44 1.2 1.4 0.9 0.6 0.6 0.5 0.4 0.5 0.2 0.3 0.5 0.2
… … … … … … … … … … … … …
6 0.8 … … 0.4 … … 0.4 … … 0.9 … …
4 0.5 0.6 0.3 0.1 0.1 0.1 0.1 0.1 0.1 0.1 0.1 0.04 4.0 4.5 3.5 1.8 2.2 1.4 1.3 1.6 1.0 1.4 1.8 1.14 0.8 0.8 0.8 … … … … … … … … …
4 … … … … … … … … … … … …
4 5.0 5.3 4.7 2.3 2.5 2.0 1.6 1.9 1.4 1.9 2.1 1.65 0.5 0.6 0.4 … … … … … … … … …
4 0.3.y 0.3.y 0.2.y 0.2.y 0.2.y 0.2.y 0.1.y 0.1.y 0.1.y 0.2.y 0.2.y 0.1.y
6 4.1 4.4 3.7 1.9 1.9 1.9 1.9 1.7 2.2 2.3 1.8 2.74 0.3 0.3.* 0.3.* 0.1 0.1 0.1 … … … … … …
3 – – – 0.3 0.2 0.4 0.2 0.2 0.2 … … …
4 0.3 0.3 0.3 0.3 0.3 0.3 0.2 0.2 0.2 0.3 0.3 0.26 0.4 0.5 0.4 0.2 … … 0.2 … … 0.2 … …
4 0.1 0.1 0.0 0.1 0.2 0.1 0.1 0.1 0.1 0.1 0.1 0.04 0.2 0.2 0.2 0.1 0.2 0.1 0.1 0.1 0.1 0.1 0.1 0.05 0.5 0.5 0.4 … … … … … … … … …
4 0.0 0.0 0.0 0.4 0.4 0.3 0.2 0.2 0.2 0.2 0.2 0.23 … … … … … … … … … … … …
4 – – – … … … … … … … … …
7 … … … … … … … … … … … …
6 0.5 0.6 0.3 0.5 0.8 0.3 0.3 0.5 0.2 1.5 2.1 0.86 22.2 23.0 21.3 14.7 15.8 13.3 12.0 13.5 10.3 8.6 9.9 7.35 … … … … … … … … … … … …
6 … … … … … … … … … … … …
4 … … … … … … … … … … … …
Table 6Internal efficiency: repetition in primary education
Country or territoryGrade 4
FemaleMaleTotal
Grade 3
FemaleMaleTotal
Grade 2
FemaleMaleTotal
Grade 1
Duration1
of primaryeducation
School year ending in 2005
FemaleMaleTotal2006
REPETITION RATES BY GRADE IN PRIMARY EDUCATION(%)
Arab States
Central and Eastern Europe
Central Asia
East Asia and the Pacific
123456789
1011121314151617181920
212223242526272829303132333435363738394041
424344454647484950
515253545556
3 0 8

S TAT I S T I C A L TA B L E S
Ta b l e 6
12.1 15.2 8.4 17.3 19.7 14.7 . . . 11.9 14.6 8.7 12.0 14.4 9.22.8.y 3.5.y 2.1.y 1.9.y 3.1.y 0.8.y . . . 3.8 4.6 3.1 2.7 3.0 2.3
… … … … … … . . . 16.6 16.9 16.1 7.5 7.6 7.23.9 … … 6.8 … … . . . 6.0 7.1 4.6 3.1 3.9 2.2
13.1...y 15.2...y 10.2...y 4.2...y 4.4...y 3.8...y . . . 10.0 10.7 9.2 8.0...z 9.1...z 6.5...z
2.0 … … 2.1 … … . . . 0.7 0.7 0.7 1.1 1.1 1.12.7 3.8 1.4 … … … . . . 3.3 3.4 3.1 2.1 2.5 1.6
11.1 12.6 9.4 10.1 11.5 8.8 . . . 9.1 10.5 7.7 9.6 11.2 7.9… … … … … … . . . … … … … … …
12.3 11.8 12.8 18.2 17.4 19.0 . . . … … … 10.2 10.1 10.38.6 10.9 6.0 9.0 11.4 6.2 . . . 12.4 14.1 10.2 12.6 14.6 10.21.4 0.9 1.9 1.3 0.8 1.9 . . . 8.0 9.5 6.4 0.6 0.4 0.8
… … … … … … . . . 2.1 2.2 2.0 0.7.z 0.7.z 0.7.z
3.3 4.1 2.5 1.5 2.3 0.6 . . . 2.7 3.5 1.9 1.5 2.0 1.0… … … … … … . . . … … … … … …
1.8.y 1.5.y 2.2.y 1.9.y 1.5.y 2.4.y . . . 11.3 10.9 11.8 1.7.z 1.4.z 2.1.z… … … … … … . . . 6.5 7.2 5.6 6.4 7.3 5.4
2.3 2.8 1.7 7.0 8.5 5.3 . . . 18.3 20.0 16.4 6.1 7.3 4.71.8 2.5 1.0 … … … . . . 3.5 4.4 2.5 2.0 2.3 1.7
… … … 5.0 5.7 3.7 . . . 10.6 11.7.* 8.7.* 4.9 5.3 4.3
. . . . . . . . . 3.9 4.6 3.2 2.1.y 2.6.y 1.7.y
. . . . . . . . . 0.5 0.5 0.5 0.1 0.1 0.1
. . . . . . . . . … … … … … …
. . . . . . . . . 3.2 3.7 2.7 2.3 2.6 2.0
. . . . . . . . . 0.4 0.5 0.3 0.3 0.4 0.20.5 0.7 0.4 . . . . . . 1.2 1.5 1.0 0.7 0.8 0.62.2 3.0 1.4 3.2 4.7 1.5 . . . 2.5 3.5 1.4 2.1 2.9 1.3. . . . . . . . . 2.2 2.1 2.2 1.9 2.2 1.5. . . . . . . . . 2.1 2.7 1.3 2.8 3.8 1.8. . . . . . . . . 0.9 1.3 0.5 0.6 0.8 0.5
… … … … … … . . . … … … … … …
0.9 … … 0.5 … … . . . 1.2 … … 0.7 1.0 0.3. . . . . . . . . 0.9 0.9 0.9 0.2 0.2 0.1. . . . . . . . . 3.4 4.1 2.6 2.2 2.6 1.8. . . . . . . . . 1.4 … … 0.6 0.6 0.6. . . . . . . . . … … … … … …. . . . . . . . . 2.3 2.6 2.0 2.8 3.0 2.5. . . . . . . . . 1.0 1.3 0.7 0.5 0.6 0.3. . . . . . . . . 0.0 0.1 0.0 0.2.z 0.2.z 0.2.z
… … … … … … . . . … … … 2.9 2.7 3.1. . . . . . . . . 0.8 … … 0.1 0.1 0.1
. . . . . . . . . … … … 0.2 0.1 0.2
. . . . . . . . . 0.4 0.4 0.4 0.3 0.3 0.30.3 … … 0.3 0.4 0.2 . . . 0.3 0.5 0.2 0.3 0.4 0.2. . . . . . . . . 0.3 … … 0.1 0.1 0.1. . . . . . . . . 0.3 0.4 0.2 0.1 0.1 0.1
0.2 0.2 0.1 . . . . . . 0.9 1.0 0.8 0.3 0.3 0.3. . . . . . . . . 0.5 0.5 0.6 0.2 0.2 0.2. . . . . . . . . … … … … … …. . . . . . . . . 0.1 … … – – –
… … … … … … . . . … … … … … …
1.0 1.5 0.5 5.5 7.6 3.3 . . . . . . 1.6 2.2 0.95.9 6.8 4.8 2.7 3.1 2.2 . . . 24.6 25.4 23.5 12.7 13.8 11.4
… … … . . . . . . … … … 0.3 0.3 0.2… … … … … … . . . 2.6 … … –z –z –z
… … … . . . . . . … … … … … …
1999 2006
School year ending in
Grade 6
FemaleMaleTotal FemaleMaleTotal FemaleMaleTotal
Grade 5
School year ending in 2005
FemaleMaleTotal
REPETITION RATES BY GRADE IN PRIMARY EDUCATION(%)
REPEATERS, ALL GRADES(%)
Grade 7
FemaleMaleTotal
1234567891011121314151617181920
212223242526272829303132333435363738394041
424344454647484950
515253545556
Arab States
Central and Eastern Europe
Central Asia
East Asia and the Pacific
3 0 9

FijiIndonesiaJapanKiribatiLao PDRMacao, ChinaMalaysiaMarshall IslandsMicronesiaMyanmarNauruNew ZealandNiuePalauPapua New GuineaPhilippinesRepublic of KoreaSamoaSingaporeSolomon IslandsThailandTimor-LesteTokelauTongaTuvaluVanuatuViet Nam
AnguillaAntigua and BarbudaArgentinaArubaBahamasBarbadosBelizeBermudaBoliviaBrazilBritish Virgin IslandsCayman IslandsChileColombiaCosta RicaCubaDominicaDominican RepublicEcuadorEl SalvadorGrenadaGuatemalaGuyanaHaitiHondurasJamaicaMexicoMontserratNetherlands AntillesNicaraguaPanamaParaguayPeruSaint Kitts and Nevis
6 4.0 4.7 3.2 2.1 2.7 1.4 1.3 1.7 0.8 1.2 1.8 0.66 6.5 7.5 5.4 5.0 6.1 3.7 4.2 5.2 3.2 3.1 3.7 2.46 – – – … … … … … … … … …
6 ..y ...y ...y ...y ...y ...y … … … … … …
5 32.9 33.7 31.9 18.0 19.3 16.5 12.1 13.6 10.4 7.8 9.0 6.36 2.3 2.7 1.9 2.5 3.4 1.6 4.5 5.7 3.1 … … …
6 ...y ...y ...y ...y ...y ...y ...y ...y ...y ...y ...y ...y
6 ...x ...x ...x 0.0.x ...x 0.0.x 0.0.x ...x 0.0.x 0.0.x ...x 0.0.x
6 … … … … … … … … … … … …
5 0.8 0.8 0.8 0.5 0.6 0.5 0.5 0.6 0.4 0.4 0.7 0.16 … … … … … … … … … … … …
6 … … … … … … … … … … … …
6 … … … … … … … … … … … …
5 … … … … … … … … … … … …
6 … … … … … … … … … … … …
6 5.6 6.6 4.5 3.0 3.9 2.0 2.3 3.0 1.4 1.7 2.4 1.06 0.0 0.0 0.0 0.0 0.0 0.0 0.0 0.0 0.0 0.0 0.0 0.06 2.6...x 2.9...x 2.2...x … … … … … … … … …
6 … … … … … … … … … … … …
6 … … … … … … … … … … … …
6 … … … … … … … … … … … …
6 … … … … … … … … … … … …
6 . . . . . . . . . . . .6 . . . . . . . . . . . .6 . . . … … … … … … … … …
6 13.2...x 13.4...x 13.0...x … … … … … … … … …
5 2.9 … … 0.9 … … 0.7 … … 0.6 … …
7 1.4.y 3.2.y –.y –.y –.y –.y 0.5.y 0.9.y –.y –.y –.y –.y
7 … … … … … … … … … … … …
6 9.8.y 11.2.y 8.2.y 6.7.y 7.9.y 5.5.y 5.9.y 7.0.y 4.7.y 5.8.y 7.0.y 4.6.y
6 15.5 18.8 12.0 11.8 13.3 10.0 8.5 … … 8.0 … …
6 – – – – – – – – – – – –6 . . . . . . . . . . . .6 16.5 19.0 14.0 9.6 10.9 8.3 10.6 11.6 9.5 8.5 9.8 7.16 . … … . … … . … … . … …
6 1.4...x 1.5...x 1.4...x 1.3...x 1.4...x 1.2...x 1.6...x 1.6...x 1.5...x 1.5...x 1.6...x 1.3...x
4 27.3.x … … 20.5.x … … 15.4.x … … 15.4.x … …
7 8.3 … … 4.2 … … … … … … … …
6 1.3.y 2.1.y 0.4.y –.y –.y –.y –.y –.y –.y –.y –.y –.y
6 2.5 3.0 2.1 2.2 2.6 1.8 2.0 2.3 1.6 1.8 2.1 1.45 6.6 7.2 5.9 4.1 4.6 3.5 3.2 3.6 2.7 2.5 2.9 2.16 13.3 14.9 11.5 8.3 9.5 6.9 7.2 8.3 5.9 8.8 10.3 7.26 – – – 1.5 2.0 0.9 – – – 0.8 1.1 0.47 12.2 15.8 8.7 3.8 … … 2.7 … … 2.6 … …
6 6.5 7.8 5.0 8.0 9.8 5.9 12.4 15.3 9.1 7.4 9.6 5.16 3.1 3.5 2.8 2.0 2.3 1.7 1.4 1.6 1.1 1.0 1.1 0.86 14.7 16.1 13.1 6.7 7.9 5.5 5.4 6.2 4.6 5.3 6.4 4.27 1.7 2.6 0.8 3.0 3.3 2.6 2.9 3.7 2.0 … … …
6 24.4 25.7 22.9 13.5 14.6 12.4 10.1 11.0 9.1 7.0 7.8 6.26 1.1...y 1.2...y 1.0...y … … … … … … … … …
6 … … … … … … … … … … … …
6 16.4 17.6 15.1 9.5 10.8 8.2 6.4 7.2 5.5 4.1 4.6 3.56 3.9...y 5.1...y 2.6...y … … … … … … … … …
6 6.7 7.8 5.4 6.6 7.8 5.3 4.5 5.5 3.5 3.7 4.7 2.87 12.3.y … … … … … … … … … … …
6 … … … … … … … … … … … …
6 18.0 19.2 16.5 9.6 10.9 8.2 8.4 9.5 7.2 6.6 7.8 5.36 9.5 10.7 8.2 8.2 9.3 7.0 6.0 7.2 4.7 4.4 5.3 3.36 10.2.y 11.5.y 8.7.y 6.9.y 8.3.y 5.5.y 5.1.y 6.1.y 4.0.y 3.4.y 4.2.y 2.5.y
6 5.1 5.3 4.9 14.0 14.3 13.6 11.2 11.6 10.9 8.4 8.7 8.17 ..y ..y ..y ..y ..y ..y … … … … … …
Table 6 (continued)
Country or territoryGrade 4
FemaleMaleTotal
Grade 3
FemaleMaleTotal
Grade 2
FemaleMaleTotal
Grade 1
Duration1
of primaryeducation
School year ending in 2005
FemaleMaleTotal2006
REPETITION RATES BY GRADE IN PRIMARY EDUCATION(%)
Latin America and the Caribbean
575859606162636465666768697071727374757677787980818283
84858687888990919293949596979899
100101102103104105106107108109110111112113114115116117
90
02
Education f
or A
ll G
lobal M
onitorin
g R
eport
A N N E X
3 1 0
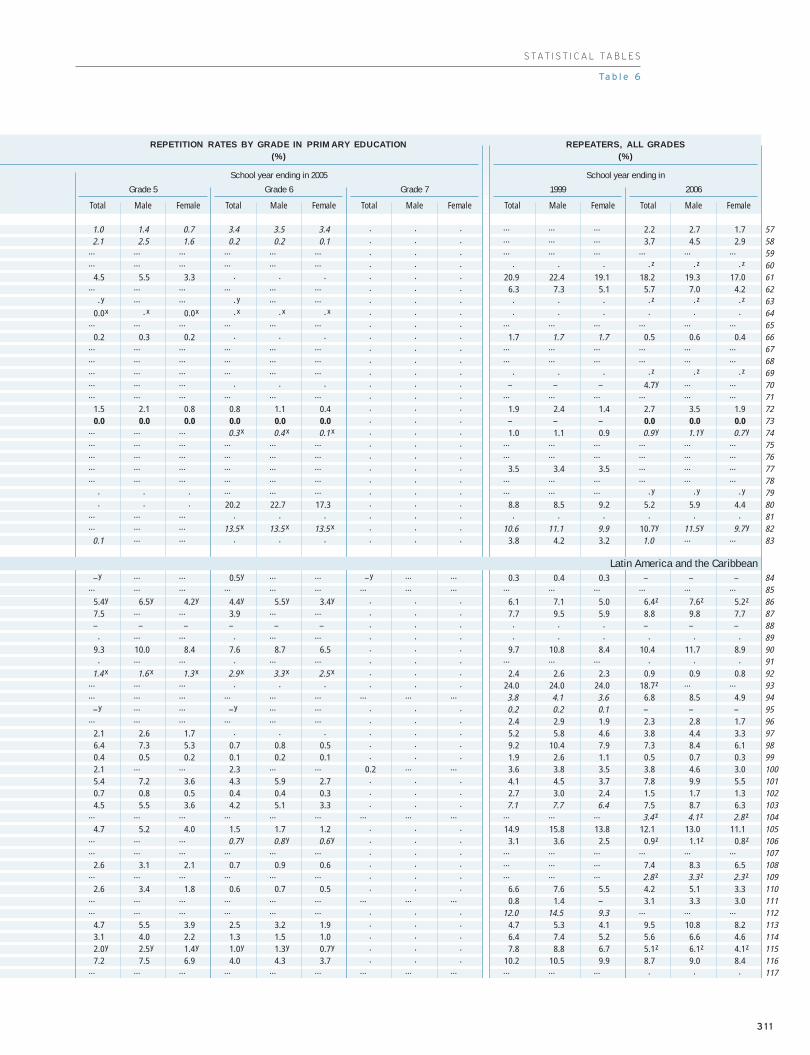
1.0 1.4 0.7 3.4 3.5 3.4 . . . … … … 2.2 2.7 1.72.1 2.5 1.6 0.2 0.2 0.1 . . . … … … 3.7 4.5 2.9
… … … … … … . . . … … … … … …… … … … … … . . . . . . ..z ..z ..z
4.5 5.5 3.3 . . . . . . 20.9 22.4 19.1 18.2 19.3 17.0… … … … … … . . . 6.3 7.3 5.1 5.7 7.0 4.2
..y … … ..y … … . . . . . . ..z ..z ..z
0.0.x ..x 0.0.x ..x ..x ..x . . . . . . . . .… … … … … … . . . … … … … … …
0.2 0.3 0.2 . . . . . . 1.7 1.7 1.7 0.5 0.6 0.4… … … … … … . . . … … … … … …… … … … … … . . . … … … … … …… … … … … … . . . . . . ..z ..z ..z… … … . . . . . . – – – 4.7.y … …… … … … … … . . . … … … … … …
1.5 2.1 0.8 0.8 1.1 0.4 . . . 1.9 2.4 1.4 2.7 3.5 1.90.0 0.0 0.0 0.0 0.0 0.0 . . . – – – 0.0 0.0 0.0
… … … 0.3...x 0.4...x 0.1...x . . . 1.0 1.1 0.9 0.9...y 1.1...y 0.7...y… … … … … … . . . … … … … … …… … … … … … . . . … … … … … …… … … … … … . . . 3.5 3.4 3.5 … … …… … … … … … . . . … … … … … …
. . . … … … . . . … … … ..y ..y ..y
. . . 20.2 22.7 17.3 . . . 8.8 8.5 9.2 5.2 5.9 4.4… … … . . . . . . . . . . . .… … … 13.5...x 13.5...x 13.5...x . . . 10.6 11.1 9.9 10.7.y 11.5...y 9.7...y
0.1 … … . . . . . . 3.8 4.2 3.2 1.0 … …
–.y … … 0.5.y … … –.y … … 0.3 0.4 0.3 – – –… … … … … … … … … … … … … … …
5.4.y 6.5.y 4.2.y 4.4.y 5.5.y 3.4.y . . . 6.1 7.1 5.0 6.4.z 7.6.z 5.2.z
7.5 … … 3.9 … … . . . 7.7 9.5 5.9 8.8 9.8 7.7– – – – – – . . . . . . – – –. … … . … … . . . . . . . . .
9.3 10.0 8.4 7.6 8.7 6.5 . . . 9.7 10.8 8.4 10.4 11.7 8.9. … … . … … . . . … … … . . .
1.4...x 1.6...x 1.3...x 2.9...x 3.3...x 2.5...x . . . 2.4 2.6 2.3 0.9 0.9 0.8… … … . . . . . . 24.0 24.0 24.0 18.7.z … …… … … … … … … … … 3.8 4.1 3.6 6.8 8.5 4.9
–.y … … –.y … … . . . 0.2 0.2 0.1 – – –… … … … … … . . . 2.4 2.9 1.9 2.3 2.8 1.7
2.1 2.6 1.7 . . . . . . 5.2 5.8 4.6 3.8 4.4 3.36.4 7.3 5.3 0.7 0.8 0.5 . . . 9.2 10.4 7.9 7.3 8.4 6.10.4 0.5 0.2 0.1 0.2 0.1 . . . 1.9 2.6 1.1 0.5 0.7 0.32.1 … … 2.3 … … 0.2 … … 3.6 3.8 3.5 3.8 4.6 3.05.4 7.2 3.6 4.3 5.9 2.7 . . . 4.1 4.5 3.7 7.8 9.9 5.50.7 0.8 0.5 0.4 0.4 0.3 . . . 2.7 3.0 2.4 1.5 1.7 1.34.5 5.5 3.6 4.2 5.1 3.3 . . . 7.1 7.7 6.4 7.5 8.7 6.3
… … … … … … … … … … … … 3.4...z 4.1...z 2.8...z
4.7 5.2 4.0 1.5 1.7 1.2 . . . 14.9 15.8 13.8 12.1 13.0 11.1… … … 0.7...y 0.8...y 0.6...y . . . 3.1 3.6 2.5 0.9.z 1.1.z 0.8.z… … … … … … . . . … … … … … …
2.6 3.1 2.1 0.7 0.9 0.6 . . . … … … 7.4 8.3 6.5… … … … … … . . . … … … 2.8...z 3.3...z 2.3...z
2.6 3.4 1.8 0.6 0.7 0.5 . . . 6.6 7.6 5.5 4.2 5.1 3.3… … … … … … … … … 0.8 1.4 – 3.1 3.3 3.0… … … … … … . . . 12.0 14.5 9.3 … … …
4.7 5.5 3.9 2.5 3.2 1.9 . . . 4.7 5.3 4.1 9.5 10.8 8.23.1 4.0 2.2 1.3 1.5 1.0 . . . 6.4 7.4 5.2 5.6 6.6 4.62.0.y 2.5.y 1.4.y 1.0.y 1.3.y 0.7.y . . . 7.8 8.8 6.7 5.1.z 6.1.z 4.1.z
7.2 7.5 6.9 4.0 4.3 3.7 . . . 10.2 10.5 9.9 8.7 9.0 8.4… … … … … … … … … … … … . . .
1999 2006
School year ending in
Grade 6
FemaleMaleTotal FemaleMaleTotal FemaleMaleTotal
Grade 5
School year ending in 2005
FemaleMaleTotal
REPETITION RATES BY GRADE IN PRIMARY EDUCATION(%)
REPEATERS, ALL GRADES(%)
Grade 7
FemaleMaleTotal
575859606162636465666768697071727374757677787980818283
84858687888990919293949596979899100101102103104105106107108109110111112113114115116117
S TAT I S T I C A L TA B L E S
Ta b l e 6
Latin America and the Caribbean
3 1 1

Saint LuciaSaint Vincent/Grenad.SurinameTrinidad and TobagoTurks and Caicos IslandsUruguayVenezuela, B. R.
AndorraAustriaBelgiumCanadaCyprusDenmarkFinlandFranceGermanyGreeceIcelandIrelandIsraelItalyLuxembourgMaltaMonacoNetherlandsNorwayPortugalSan MarinoSpainSwedenSwitzerlandUnited KingdomUnited States
AfghanistanBangladeshBhutanIndiaIran, Islamic Republic ofMaldivesNepalPakistanSri Lanka
AngolaBeninBotswanaBurkina FasoBurundiCameroonCape VerdeCentral African RepublicChadComorosCongoCôte d’IvoireD. R. CongoEquatorial GuineaEritrea
7 6.2 7.6 4.8 … … … … … … … … …
7 5.3.y 6.5.y 3.9.y … … … … … … … … …
6 … … … … … … … … … … … …
7 10.8.*,y 12.8.*,y 8.6.*,y 3.5.*,y 2.7.*,y 4.3.*,y 4.1.*,y 5.1.*,y 3.0.*,y 4.1.*,y 4.9.*,y 3.2.*,y
6 0.9.x 1.8.x –.x … … … … … … … … …
6 13.9 16.0 11.6 9.5 10.7 8.3 6.8 8.2 5.5 5.4 6.5 4.26 10.0 11.8 8.0 7.8 9.4 5.9 7.5 9.2 5.5 5.4 6.9 3.9
6 … … … … … … … … … … … …
4 1.2.x 1.4.x 1.1.x 1.3.x 1.5.x 1.2.x 1.3.x 1.5.x 1.0.x 1.0.x 1.1.x 0.9.x
6 6.5 6.9 6.1 4.4 4.4 4.4 … … … 2.5 2.7 2.36 … … … … … … … … … … … …
6 1.1 1.4 0.8 0.1 0.2 0.1 0.0 0.0 0.0 0.0 0.0 –6 ..y ..y ..y ..y ..y ..y ..y ..y ..y ..y ..y ..y
6 0.9 1.1 0.6 0.9 1.1 0.7 0.3 0.4 0.2 0.2 0.2 0.15 … … … … … … … … … … … …
4 1.2 1.3 1.1 1.2 1.2 1.1 1.4 1.5 1.3 0.8 0.8 0.76 1.3 1.4 1.2 0.7 0.7 0.6 0.5 0.6 0.4 0.4 0.5 0.47 – – – – – – – – – – – –8 1.8 2.0 1.7 1.2 1.4 1.1 0.7 0.9 0.6 0.4 0.5 0.46 1.7 2.1 1.2 0.8 1.0 0.6 0.9 1.2 0.6 1.2 1.5 0.95 0.4 0.5 0.3 0.2 0.2 0.1 0.1 0.2 0.1 0.1 0.2 0.16 5.4 6.3 4.6 5.2 6.3 4.1 5.1 5.2 5.1 4.0 4.5 3.56 0.8.y 0.8.y 0.8.y 0.8.y 0.9.y 0.7.y … … … … … …
5 –..x … … –..x … … –..x … … –..x … …
6 . . . … … … … … … … … …
7 – – – – – – – – – – – –6 – – – … … … … … … … … …
5 … … … … … … … … … … … …
6 – – – … … … … … … … … …
6 … … … … … … … … … … … …
6 … … … … … … … … … … … …
6 … … … … … … … … … … … …
6 – – – – – – – – – – – –
6 8.8...y 8.1...y 10.5...y … … … … … … … … …
5 7.1.x 6.8.x 7.4.x 6.7.x 6.6.x 6.7.x 9.2.x 9.4.x 8.9.x 7.7.x 8.2.x 7.3.x
7 8.1 8.6 7.5 7.8 8.9 6.6 7.9 8.7 7.1 5.9 6.5 5.45 3.7 3.7 3.7 … … … … … … … … …
5 4.0 4.9 3.2 … … … … … … … … …
7 0.5 … … 0.4 … … … … … … … …
5 37.0 36.8.* 37.3.* 19.3 18.5.* 20.1.* 15.0 15.0.* 15.1.* 15.9 15.9.* 16.0.*5 2.3 2.5 2.1 … … … … … … … … …
5 0.3...y … … 0.7...y … … … … … … … …
4 … … … … … … … … … . . .6 1.4 1.6 1.1 9.3 9.4 9.2 11.2 11.1 11.3 11.5 11.0 12.27 ..y ..y ..y ..y ..y ..y ..y ..y ..y ..y ..y ..y
6 6.4 6.5 6.3 9.6 9.8 9.3 11.9 12.1 11.6 14.0 14.0 13.96 36.5 36.1 37.0 35.1 35.4 34.7 32.7 32.5 32.9 31.8 31.5 32.26 31.8 33.4 29.8 … … … … … … … … …
6 1.4 1.6 1.2 24.8 29.0 19.8 13.4 15.7 11.0 16.8 19.1 14.26 29.6 29.8 29.3 23.5 23.9 23.0 31.3 30.3 32.7 27.6 27.1 28.46 23.2.y 22.8.y 23.7.y 21.9.y 21.2.y 22.7.y 21.5.y 19.5.y 24.7.y 21.3.y 20.3.y 22.8.y
6 33.3...y 35.0...y 31.2...y 28.9...y 27.5...y 30.4...y 28.5...y 30.4...y 26.2...y 24.1...y 26.0...y 21.9...y
6 27.7.y … … … … … … … … … … …
6 … … … … … … … … … … … …
6 … … … … … … … … … … … …
5 … … … … … … … … … … … …
5 13.7 13.9 13.5 14.2 14.4 14.0 13.5 13.8 13.2 14.8 14.8 14.7
Table 6 (continued)
Country or territoryGrade 4
FemaleMaleTotal
Grade 3
FemaleMaleTotal
Grade 2
FemaleMaleTotal
Grade 1
Duration1
of primaryeducation
School year ending in 2005
FemaleMaleTotal2006
REPETITION RATES BY GRADE IN PRIMARY EDUCATION(%)
North America and Western Europe
South and West Asia
Sub-Saharan Africa
118119120121122123124
125126127128129130131132133134135136137138139140141142143144145146147148149150
151152153154155156157158159
160161162163164165166167168169170171172173174
90
02
Education f
or A
ll G
lobal M
onitorin
g R
eport
A N N E X
3 1 2

… … … … … … … … … 2.4 2.8 2.0 2.2 2.6 1.7… … … … … … 16.0.y 21.9.y 11.2.y … … … 4.1.z 5.0.z 3.0.z… … … … … … . . . … … … 20.3.z 22.3.z 18.1.z
4.2.*,y 5.0.*,y 3.3.*,y 5.2.*,y 6.5.*,y 4.0.*,y 3.2*,y 2.9.*,y 3.4.*,y 4.7 4.9 4.4 5.2.*,z 6.0.*,z 4.4.*,z
… … … … … … . . . … … … 2.9.z 3.2.z 2.6.z
4.2 5.1 3.2 2.0 2.6 1.4 . . . 7.9 9.3 6.5 7.0 8.2 5.73.6 4.6 2.6 1.5 1.9 1.0 . . . 7.0 8.5 5.5 6.1 7.5 4.6
… … … … … … . . . … … … – – –. . . . . . . . . 1.5 1.8 1.3 1.2.y 1.4.y 1.1.y
2.5 2.7 2.3 1.1 1.2 1.1 . . . … … … 3.2 3.3 3.1… … … … … … . . . … … … … … …
0.0 – 0.1 0.1 0.1 0.1 . . . 0.4 0.5 0.3 0.2 0.3 0.2..y ..y ..y ..y ..y ..y . . . . . . – – –
0.2 0.2 0.1 0.2 0.2 0.1 . . . 0.4 0.6 0.3 0.4 0.5 0.3… … … … … … . . . 4.2 4.2 4.2 … … …
. . . . . . . . . 1.7 1.9 1.5 1.1 1.2 1.10.4 0.4 0.3 0.4 0.4 0.3 . . . – – – 0.6 0.7 0.5– – – – – – – – – – – – – – –0.5 0.5 0.5 0.4 … … 0.7 … … 1.8 2.1 1.6 0.7 0.8 0.71.3 1.7 0.9 0.9 1.2 0.7 . . . … … … 1.4 1.7 1.00.3 0.3 0.2 … … … . . . 0.4 0.5 0.3 0.2 0.3 0.23.9 4.7 3.1 0.9 1.0 0.9 . . . … … … 4.2 4.8 3.6
… … … … … … . . . 2.1 2.4 1.8 2.6.z 2.9.z 2.2.z
–.x … … … … … . . . – – – –.y … …… … … … … … . . . . . . . . .
– – – – – – – – – . . . – – –… … … … … … . . . … … … 10.2...z … …… … … … … … . . . … … … –.y … …… … … … … … . . . … … … 2.3...z 2.6...z 1.9...z… … … … … … . . . … … … … … …… … … … … … . . . 1.8 1.9 1.6 1.4 1.5 1.3… … … … … … . . . – – – – – –
– … … – … … . . . – – – – – –
… … … … … … . . . … … … 16.3.z 17.6.z 13.9.z
5.1.x 5.5.x 4.7.x . . . . . . 6.5 6.8 6.2 7.0.y 7.2.y 6.9.y
9.1 10.4 7.7 5.8 6.1 5.5 3.5 3.7 3.4 12.1 12.5 11.7 6.9 7.6 6.14.0 4.1 3.8 . . . . . . 4.0 4.0 4.1 3.4 3.4 3.4
… … … . . . . . . … … … 2.0 2.8 1.4… … … … … … . . . … … … 4.7 5.5 3.712.0 11.8.* 12.3.* . . . . . . 22.9 22.2 23.8 20.6 20.8.* 20.4.*
2.2 2.4 1.8 . . . . . . … … … 2.2 2.4 1.9… … … . . . . . . … … … 0.8...z 0.9...z 0.7...z
… … … . . . . . . 29.0 29.0 29.0 … … …
12.2 11.5 13.2 4.4 4.6 4.1 . . . … … … 7.8 7.9 7.8..y ..y ..y ..y ..y ..y ..y ..y ..y 3.3 3.9 2.7 ..z ..z ..z
15.1 14.6 15.8 32.1 31.0 33.4 . . . 17.7 17.5 18.0 12.0 12.1 11.842.2 40.7 44.1 46.3 44.2 48.9 . . . 20.3 20.3 20.4 28.8 29.2 28.4… … … 26.0 28.7 22.5 . . . 26.7 26.8 26.5 25.1 26.8 23.110.6 12.6 8.7 12.2 13.7 10.8 . . . 11.6 12.8 10.3 14.0 16.4 11.527.3 27.9 26.5 33.7 34.3 32.9 . . . … … … 28.2 28.2 28.222.6.y 21.1.y 25.1.y 23.2.y 22.9.y 23.9.y . . . 25.9 25.7 26.3 22.5.z 21.8.z 23.5.z
22.7...y 23.6...y 21.7...y 26.2...y 27.9...y 24.3...y . . . 26.0 26.4 25.5 27.1...z 28.2...z 25.9...z… … … … … … . . . 39.1 40.0 38.2 21.2 21.5 20.9… … … … … … . . . 23.7 22.8 24.9 23.5 23.4 23.7… … … … … … . . . … … … … … …… … … . . . . . . 11.8 9.3 14.9 25.6.z 25.5.z 25.6.z
8.9 9.1 8.7 . . . . . . 19.4 18.2 20.8 13.7 13.9 13.5
1999 2006
School year ending in
Grade 6
FemaleMaleTotal FemaleMaleTotal FemaleMaleTotal
Grade 5
School year ending in 2005
FemaleMaleTotal
REPETITION RATES BY GRADE IN PRIMARY EDUCATION(%)
REPEATERS, ALL GRADES(%)
Grade 7
FemaleMaleTotal
118119120121122123124
125126127128129130131132133134135136137138139140141142143144145146147148149150
151152153154155156157158159
160161162163164165166167168169170171172173174
S TAT I S T I C A L TA B L E S
Ta b l e 6
North America and Western Europe
South and West Asia
Sub-Saharan Africa
3 1 3
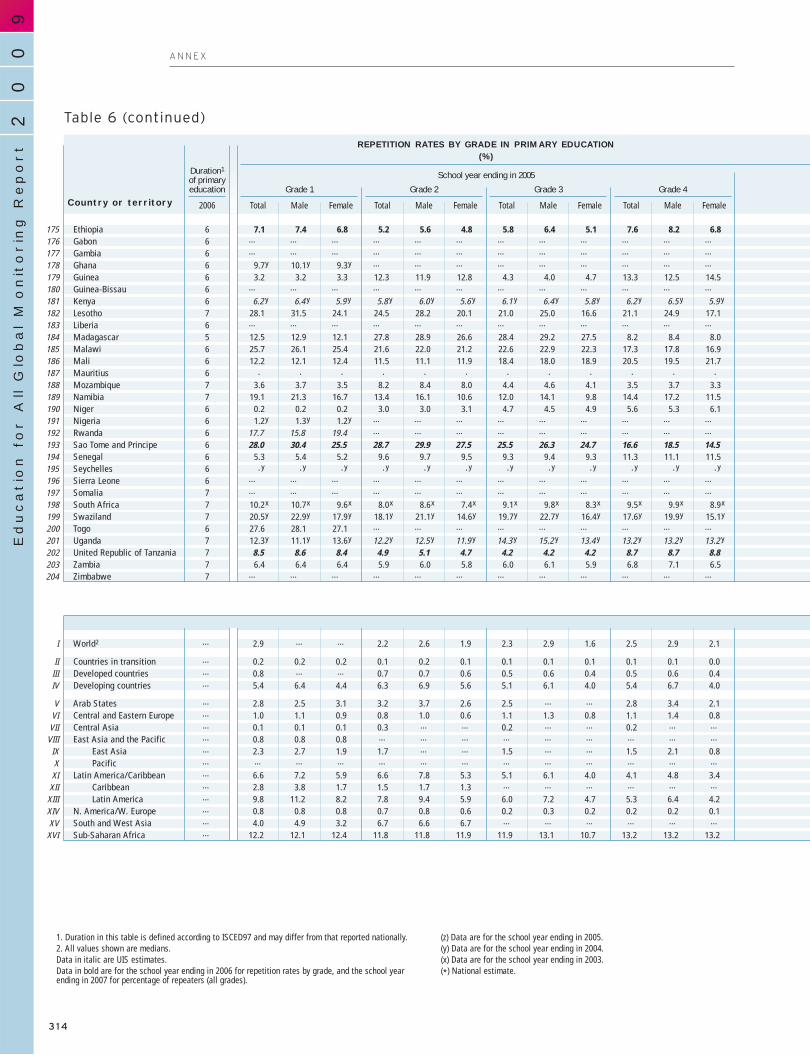
EthiopiaGabonGambiaGhanaGuineaGuinea-BissauKenyaLesothoLiberiaMadagascarMalawiMaliMauritiusMozambiqueNamibiaNigerNigeriaRwandaSao Tome and PrincipeSenegalSeychellesSierra LeoneSomaliaSouth AfricaSwazilandTogoUgandaUnited Republic of TanzaniaZambiaZimbabwe
World2
Countries in transitionDeveloped countriesDeveloping countries
Arab StatesCentral and Eastern EuropeCentral AsiaEast Asia and the Pacific
East AsiaPacific
Latin America/CaribbeanCaribbeanLatin America
N. America/W. EuropeSouth and West AsiaSub-Saharan Africa
6 7.1 7.4 6.8 5.2 5.6 4.8 5.8 6.4 5.1 7.6 8.2 6.86 … … … … … … … … … … … …
6 … … … … … … … … … … … …
6 9.7.y 10.1.y 9.3.y … … … … … … … … …
6 3.2 3.2 3.3 12.3 11.9 12.8 4.3 4.0 4.7 13.3 12.5 14.56 … … … … … … … … … … … …
6 6.2...y 6.4...y 5.9...y 5.8...y 6.0...y 5.6...y 6.1...y 6.4...y 5.8...y 6.2...y 6.5...y 5.9...y
7 28.1 31.5 24.1 24.5 28.2 20.1 21.0 25.0 16.6 21.1 24.9 17.16 … … … … … … … … … … … …
5 12.5 12.9 12.1 27.8 28.9 26.6 28.4 29.2 27.5 8.2 8.4 8.06 25.7 26.1 25.4 21.6 22.0 21.2 22.6 22.9 22.3 17.3 17.8 16.96 12.2 12.1 12.4 11.5 11.1 11.9 18.4 18.0 18.9 20.5 19.5 21.76 . . . . . . . . . . . .7 3.6 3.7 3.5 8.2 8.4 8.0 4.4 4.6 4.1 3.5 3.7 3.37 19.1 21.3 16.7 13.4 16.1 10.6 12.0 14.1 9.8 14.4 17.2 11.56 0.2 0.2 0.2 3.0 3.0 3.1 4.7 4.5 4.9 5.6 5.3 6.16 1.2.y 1.3.y 1.2.y … … … … … … … … …
6 17.7 15.8 19.4 … … … … … … … … …
6 28.0 30.4 25.5 28.7 29.9 27.5 25.5 26.3 24.7 16.6 18.5 14.56 5.3 5.4 5.2 9.6 9.7 9.5 9.3 9.4 9.3 11.3 11.1 11.56 ..y ..y ..y ..y ..y ..y ..y ..y ..y ..y ..y ..y
6 … … … … … … … … … … … …
7 … … … … … … … … … … … …
7 10.2.x 10.7.x 9.6.x 8.0.x 8.6.x 7.4.x 9.1.x 9.8.x 8.3.x 9.5.x 9.9.x 8.9.x
7 20.5.y 22.9.y 17.9.y 18.1.y 21.1.y 14.6.y 19.7.y 22.7.y 16.4.y 17.6.y 19.9.y 15.1.y
6 27.6 28.1 27.1 … … … … … … … … …
7 12.3.y 11.1.y 13.6.y 12.2...y 12.5...y 11.9...y 14.3...y 15.2...y 13.4...y 13.2...y 13.2...y 13.2...y
7 8.5 8.6 8.4 4.9 5.1 4.7 4.2 4.2 4.2 8.7 8.7 8.87 6.4 6.4 6.4 5.9 6.0 5.8 6.0 6.1 5.9 6.8 7.1 6.57 … … … … … … … … … … … …
… 2.9 … … 2.2 2.6 1.9 2.3 2.9 1.6 2.5 2.9 2.1
… 0.2 0.2 0.2 0.1 0.2 0.1 0.1 0.1 0.1 0.1 0.1 0.0… 0.8 … … 0.7 0.7 0.6 0.5 0.6 0.4 0.5 0.6 0.4… 5.4 6.4 4.4 6.3 6.9 5.6 5.1 6.1 4.0 5.4 6.7 4.0
… 2.8 2.5 3.1 3.2 3.7 2.6 2.5 … … 2.8 3.4 2.1… 1.0 1.1 0.9 0.8 1.0 0.6 1.1 1.3 0.8 1.1 1.4 0.8… 0.1 0.1 0.1 0.3 … … 0.2 … … 0.2 … …… 0.8 0.8 0.8 … … … … … … … … …… 2.3 2.7 1.9 1.7 … … 1.5 … … 1.5 2.1 0.8… … … … … … … … … … … … …… 6.6 7.2 5.9 6.6 7.8 5.3 5.1 6.1 4.0 4.1 4.8 3.4… 2.8 3.8 1.7 1.5 1.7 1.3 … … … … … …… 9.8 11.2 8.2 7.8 9.4 5.9 6.0 7.2 4.7 5.3 6.4 4.2… 0.8 0.8 0.8 0.7 0.8 0.6 0.2 0.3 0.2 0.2 0.2 0.1… 4.0 4.9 3.2 6.7 6.6 6.7 … … … … … …… 12.2 12.1 12.4 11.8 11.8 11.9 11.9 13.1 10.7 13.2 13.2 13.2
Table 6 (continued)
Country or territoryGrade 4
FemaleMaleTotal
Grade 3
FemaleMaleTotal
Grade 2
FemaleMaleTotal
Grade 1
Duration1
of primaryeducation
School year ending in 2005
FemaleMaleTotal2006
REPETITION RATES BY GRADE IN PRIMARY EDUCATION(%)
175176177178179180181182183184185186187188189190191192193194195196197198199200201202203204
I
IIIIIIV
VVI
VIIVIII
IXX
XIXII
XIIIXIVXV
XVI
90
02
Education f
or A
ll G
lobal M
onitorin
g R
eport
A N N E X
1. Duration in this table is defined according to ISCED97 and may differ from that reported nationally.2. All values shown are medians.Data in italic are UIS estimates.Data in bold are for the school year ending in 2006 for repetition rates by grade, and the school yearending in 2007 for percentage of repeaters (all grades).
(z) Data are for the school year ending in 2005.(y) Data are for the school year ending in 2004.(x) Data are for the school year ending in 2003.(*) National estimate.
3 1 4

9.0 9.6 8.3 7.1 8.1 5.7 . . . 10.6 9.8 11.9 6.0 6.6 5.4… … … … … … . . . … … … … … …… … … … … … . . . 12.2 12.1 12.3 6.1 6.3 5.9… … … … … … . . . 4.2 4.3 4.1 5.8.z 6.0.z 5.7.z
4.2 3.7 4.8 17.8 16.3 20.0 . . . 26.2 25.5 27.4 8.6 8.3 9.0… … … … … … . . . 24.0 23.6 24.5 … … …
5.9...y … … 5.5.y … … . . . … … … 5.8...z 6.0...z 5.6...z
17.6 20.4 14.9 13.4 15.1 12.1 16.0 14.5 17.1 20.3 22.9 17.9 18.6 21.3 15.8… … … … … … . . . … … … 5.7 5.6 5.822.1 22.0 22.1 . . . . . . 28.3 27.7 28.9 19.7 20.4 19.016.5 16.8 16.1 13.3 13.2 13.4 . . . 14.4 14.4 14.4 20.8 21.1 20.425.4 24.3 27.0 25.5 24.4 27.0 . . . 17.4 17.2 17.7 17.0 16.7 17.3
. . . 20.1 23.2 16.7 . . . 3.8 4.1 3.5 4.4 5.2 3.69.4 9.4 9.4 1.4 1.6 1.2 10.0 10.0 10.1 23.8 23.2 24.7 5.3 5.5 5.1
22.5 25.6 19.3 15.1 16.8 13.5 16.9 17.5 16.4 12.3 13.9 10.7 16.4 18.6 14.18.0 7.6 8.7 16.8 16.1 18.0 . . . 12.2 12.4 11.8 4.9 4.7 5.0
… … … 1.9...y 1.9...y 1.9...y . . . … … … 2.9...z 2.8...z 3.0...z… … … … … … . . . 29.1 29.2 29.0 14.6 14.6 14.624.7 24.7 24.7 33.6 33.1 34.1 . . . 30.7 32.6 28.7 25.9 27.4 24.512.0 11.8 12.2 22.2 21.8 22.7 . . . 14.4 14.5 14.2 10.6 10.8 10.5
..y ..y ..y ..y ..y ..y . . . . . . . . .… … … … … … . . . … … … 9.9 9.7 10.2… … … … … … . . . … … … … … …
7.3.x 7.8.x 6.7.x 5.8.x 5.7.x 5.8.x 5.4.x 5.6.x 5.3.x 10.4 11.6 9.2 8.0.y 8.4.y 7.5.y
18.3.y 20.0.y 16.6.y 16.8.y 18.0.y 15.6.y 7.3.y 7.7.y 7.0.y 17.1 19.5 14.5 17.3.z 19.5.z 15.0.z… … … 17.6 16.8 18.8 . . . 31.2 30.9 31.6 22.9 22.6 23.313.8...y 13.7...y 13.9...y 13.2...y 11.9...y 14.5...y 10.2...y 10.8...y 9.5...y … … … 13.1...z 13.0...z 13.3...z
0.1 0.1 0.1 0.0 0.0 0.0 0.0 0.0 0.0 3.2 3.1 3.2 4.2 4.3 4.26.6 6.8 6.5 7.6 7.8 7.4 12.6 13.2 11.6 6.1 6.4 5.8 6.9 7.2 6.5
… … … … … … … … … . . . … … …
1.8 1.5 2.2 0.5 … … . . . 3.8 4.2 3.2 2.9 2.7 3.1
. . . . . . . . . 0.5 0.5 0.5 0.2 0.2 0.1
. . . . . . . . . 1.2 … … 0.7 1.0 0.34.2 5.1 3.2 1.9 3.1 0.8 . . . 6.8 8.1 5.5 5.3 5.5 5.1
3.1 3.8 2.3 5.0 5.7 3.7 . . . 8.0 9.5 6.4 4.0 4.6 3.3… … … … … … . . . 1.2 1.5 1.0 0.7 0.9 0.4… … … … … … . . . 0.3 0.5 0.2 0.2 0.2 0.2… … … 0.0 0.0 0.0 . . . 1.7 1.7 1.7 1.0 … …
1.0 1.5 0.5 0.0 0.0 0.0 . . . 2.7 2.9 2.4 1.6 2.2 0.9… … … … … … . . . 0.0 0.0 0.0 0.0 0.0 0.02.9 3.7 2.0 1.1 1.4 0.8 . . . 4.7 5.3 4.1 4.1 5.1 3.1… … … … … … . . . 3.1 3.6 2.5 2.9 3.2 2.63.6 4.6 2.6 1.4 1.7 1.0 . . . 6.5 7.5 5.4 6.4 7.6 5.20.0 0.0 0.1 0.1 0.1 0.1 . . . 0.4 0.5 0.3 0.4 0.5 0.35.1 5.5 4.7 . . . . . . … … … 4.7 5.5 3.7
12.2 11.5 13.2 13.3 13.2 13.4 . . . 17.4 17.2 17.7 13.1 13.0 13.3
1999 2006
School year ending in
Grade 6
FemaleMaleTotal FemaleMaleTotal FemaleMaleTotal
Grade 5
School year ending in 2005
FemaleMaleTotal
REPETITION RATES BY GRADE IN PRIMARY EDUCATION(%)
REPEATERS, ALL GRADES(%)
Grade 7
FemaleMaleTotal
175176177178179180181182183184185186187188189190191192193194195196197198199200201202203204
I
IIIIIIV
VVIVIIVIIIIXXXIXIIXIIIXIVXVXVI
S TAT I S T I C A L TA B L E S
Ta b l e 6
3 1 5

AlgeriaBahrainDjiboutiEgyptIraqJordanKuwaitLebanonLibyan Arab JamahiriyaMauritaniaMoroccoOmanPalestinian A. T.QatarSaudi ArabiaSudanSyrian Arab RepublicTunisiaUnited Arab EmiratesYemen
AlbaniaBelarusBosnia and HerzegovinaBulgariaCroatiaCzech RepublicEstoniaHungaryLatviaLithuaniaMontenegroPolandRepublic of MoldovaRomaniaRussian FederationSerbiaSlovakiaSloveniaTFYR MacedoniaTurkeyUkraine
ArmeniaAzerbaijanGeorgiaKazakhstanKyrgyzstanMongoliaTajikistanTurkmenistanUzbekistan
AustraliaBrunei DarussalamCambodiaChina
6 1.2 1.7 0.6 1.0 0.7 1.4 0.7 0.3 1.2 1.5 1.9 1.0 3.9 4.5 3.36 –.y –.y –.y –.y –.y –.y 0.0.y –.y 0.4.y 0.2.y –.y 0.5.y 0.1.y –.y 0.2.y
6 4.1 1.5 7.0 2.7 2.7 2.7 2.3 2.0 2.8 0.7 1.0 0.4 … … …
6 1.9 2.4 1.3 – … … 0.3 … … 3.0 … … – … …
6 11.1...y 9.1...y 13.4...y 1.4...y –.y 3.7...y 1.1...y –.y 2.9...y 5.2...y 3.2...y 7.8...y 11.2...y 8.8...y 14.6...y
6 – … … 0.2 … … – … … 0.7 … … 3.6 … …
5 0.7 1.5 – – – – – – – 4.5 5.3 3.7 … … …
6 2.2 2.5 1.8 1.3 1.6 1.1 1.1 1.4 0.6 3.8 4.9 2.5 3.8 5.1 2.46 … … … … … … … … … … … … … … …
6 7.6 7.7 7.6 8.3 7.7 8.8 13.1 12.1 14.0 17.3 17.0 17.6 19.6 18.9 20.46 5.4 5.2 5.8 2.7 2.4 3.2 4.3 3.8 4.9 5.9 5.3 6.6 7.5 6.6 8.76 0.2 0.3 0.1 – – – – – – – – – 1.9 1.2 2.64 0.9.y 0.9.y 0.9.y –.y –.y –.y 1.2.y 1.2.y 1.4.y … … … … … …
6 4.9 5.5 4.3 5.5 6.1 5.0 3.2 0.6 5.9 – – – – – –6 … … … … … … … … … … … … … … …
6 6.1.y 6.7.y 5.3.y 6.3.y 5.6.y 7.1.y 4.9.y 4.8.y 5.0.y 5.7.y 6.6.y 4.6.y 5.5.y 5.8.y 5.0.y
4 4.4 4.1 4.7 1.5 1.7 1.3 1.4 1.7 1.0 … … … … … …
6 0.2 0.2 0.3 0.7 0.8 0.6 0.4 0.3 0.4 1.7 1.9 1.4 2.3 2.5 2.25 0.8 1.2 0.4 – – – – – – – – – … … …
6 13.5.y 15.1.y 11.5.y 8.9.y 8.5.y 9.4.y 6.7.y 5.4.y 8.5.y 7.9.y 6.7.y 9.9.y 9.6.y 8.4.y 11.7.y
4 3.5.x 4.1.x 2.8.x 3.4.x 3.8.x 3.1.x 3.3.x 3.5.x 3.0.x … … … . . .4 0.0 0.2 – 0.2 0.5 – 0.1 0.4 – … … … . . .4 … … … … … … … … … … … … . . .4 2.0 2.0 2.1 1.9 1.8 1.9 1.2 1.1 1.3 … … … . . .4 – – – – – – – – – … … … . . .5 0.5 0.5 0.5 – – – – – – – – – . . .6 1.0 1.1 0.8 0.7 0.8 0.5 0.6 0.6 0.5 0.9 0.6 1.3 0.6 1.1 0.14 1.7 1.9 1.4 0.2 0.2 0.2 0.2 0.3 0.1 … … … . . .4 1.4 1.6 1.2 0.3 – 0.8 0.1 0.4 – … … … . . .4 1.5 1.8 1.2 1.0 0.9 1.0 0.8 0.6 1.0 … … … . . .
… … … … … … … … … … … … … … … …
6 0.6 … … 0.2 … … 0.3 … … 0.3 … … 0.2 … …
4 0.7 0.9 0.4 1.3 2.0 0.7 1.0 1.2 0.8 … … … . . .4 3.1 3.2 3.0 1.7 1.9 1.4 1.5 1.6 1.3 … … … . . .4 2.7 3.4 2.0 … … … … … … … … … . . .4 … … … … … … … … … … … … . . .4 1.5 1.8 1.3 0.4 0.2 0.5 0.6 0.6 0.5 … … … . . .5 … … … … … … … … … … … … . . .4 1.0.y 1.5.y 0.5.y 0.1.y 0.0.y 0.3.y 0.6.y 0.8.y 0.5.y … … … . . .6 0.1.y 0.5.y –.y 0.8.y 0.7.y 0.9.y 1.0.y 0.9.y 1.2.y 1.1.y 0.6.y 1.6.y 2.9.y 1.9.y 3.9.y
4 1.2 1.4 1.0 0.7 0.7 0.7 … … … … … … . . .
3 1.2 1.1 1.3 – – – … … … . . . . . .4 0.5 – 1.6 0.9 0.2 1.6 0.3 – 1.5 … … … . . .6 0.3 … … – – – – – – 0.9 … … – – –4 – – – 0.3 0.2 0.3 – – – … … … . . .4 0.3 1.0 – 0.5 0.4 0.5 0.6 1.3 – … … … . . .5 5.6.x 5.5.x 5.7.x 2.0.x 1.9.x 2.0.x 1.7.x 2.2.x 1.2.x … … … … … …
4 – – – – – – 0.6 – 1.3 … … … . . .3 … … … … … … … … … … … … . . .4 0.2 0.7 – 0.7 0.9 0.5 0.4 0.4 0.5 … … … . . .
7 … … … … … … … … … … … … … … …
6 0.3 0.9 – 0.6 0.1 1.2 – – – – – – 1.5 1.5 1.56 9.4 9.3 9.6 9.5 9.8 9.2 9.2 9.8 8.5 10.1 10.6 9.5 10.8 11.0 10.55 … … … … … … … … … … … … … … …
Table 7Internal efficiency: primary education dropout and completion
Country or territoryGrade 5
Duration1
of primaryeducation
2006
DROPOUT RATES BY GRADE IN PRIMARY EDUCATION (%)
90
02
Education f
or A
ll G
lobal M
onitorin
g R
eport
A N N E X
FemaleMaleTotal
Grade 4
FemaleMaleTotal
Grade 3
FemaleMaleTotal
Grade 2
FemaleMaleTotal
Grade 1
FemaleMaleTotal
School year ending in 2005
Arab States
Central and Eastern Europe
Central Asia
East Asia and the Pacific
3 1 6

AlgeriaBahrainDjibouti
EgyptIraq
JordanKuwait
LebanonLibyan Arab Jamahiriya
MauritaniaMorocco
OmanPalestinian A. T.
QatarSaudi Arabia
SudanSyrian Arab Republic
TunisiaUnited Arab Emirates
Yemen
AlbaniaBelarus
Bosnia and HerzegovinaBulgariaCroatia
Czech RepublicEstonia
HungaryLatvia
LithuaniaMontenegro
PolandRepublic of Moldova
RomaniaRussian Federation
SerbiaSlovakiaSlovenia
TFYR MacedoniaTurkey
Ukraine
ArmeniaAzerbaijan
GeorgiaKazakhstanKyrgyzstan
MongoliaTajikistan
TurkmenistanUzbekistan
AustraliaBrunei Darussalam
CambodiaChina
95 94 96 95 95 96 91 90 93 91 90 92 86.y 84.y 88.y
97 97 98 99.y 100.y 98.y 92 91 93 99.y 100.y 97.y … … …
77 71 85 90 92 87 … … … … … … … … …
99 99 99 … … … 99 99 99 97 … … … … …
66 67 63 81...y 87...y 73...y 49 51 47 70...y 78...y 61...y 68...y 75...y 60...y
98 98 97 … … … 97 97 97 96 … … … … …… … … 96 95 97 94 93 95 96 95 97 86 83 9091 88 95 91 88 94 91 88 95 87 83 91 83 78 88… … … … … … … … … … … … … … …
68 70 66 57 59 56 61 … … 45 46 43 21.y 21.y 20.y
82 82 82 80 82 79 75 75 76 74 76 72 60 63 5694 94 94 100 100 100 92 92 92 99 100 99 98.y 98.y 97.y… … … … … … 99 100 99 98.y 99.y 97.y … … …… … … … … … … … … 89 89 89 … … …… … … … … … … … … … … … … … …
84 81 88 79.y 78.y 79.y 77 74 81 74.y 73.y 75.y … … …
92 92 91 … … … 87 87 87 92 92 93 … … …
92 91 93 97 96 97 87 86 88 94 94 95 … … …
92 93 92 99 98 100 90 90 89 99 98 100 98 … …
87 … … 66.y 67.y 65.y 80 … … 59.y 61.y 57.y … … …
… … … … … … 92 90 95 90.x 89.x 91.x … … …… … … … … … 99 99 99 99 99 100 97 96 100… … … … … … … … … … … … … … …… … … … … … 93 93 93 95 95 95 … … …… … … … … … 100 99 100 100 99 100 … … …
98 98 99 100 100 100 98 98 99 100 100 100 … … …
99 99 99 97 97 97 99 98 99 96 96 97 … … …… … … … … … 97 96 98 98 97 98 … … …… … … … … … 97 97 97 98 98 98 … … …… … … … … … 99 99 100 97 97 97 … … …… … … … … … … … … … … … … … …
99 … … 99 … … 98 … … 98 … … … … …… … … … … … 95 … … 97 96 98 … … …… … … … … … 96 95 96 94 93 94 … … …… … … … … … 95 … … … … … … … …… … … … … … … … … … … … … … …… … … … … … 97 96 98 97 97 98 … … …… … … … … … … … … … … … … … …… … … … … … 97 96 99 98.y 98.y 99.y … … …… … … 97.y 97.y 97.y … … … 94.y 95.y 93.y … … …… … … … … … 97 … … … … … … … …
… … … … … … … … … 99 100 99 … … …… … … … … … 97 96 98 97 100 94 96 100 93… … … 100 … … 99 99 100 100 … … 84 … …… … … … … … … … … 100 100 100 99 99 100… … … … … … 95.* 95.* 94.* 99 97 100 95 92 97… … … … … … 87 85 90 91.x 91.x 91.x … … …… … … … … … 97 100 94 99 100 97 97.y … …… … … … … … … … … … … … … … …… … … … … … 100 100 99 99 98 99 … … …
… … … … … … … … … … … … … … …… … … 100 100 100 … … … 98 98 99 83 81 8456 58 54 62 61 64 49 52 45 55 54 57 … … …… … … … … … … … … … … … … … …
Country or territory2005
School year ending in
FemaleMaleTotal
PRIMARY EDUCATION COMPLETION
S TAT I S T I C A L TA B L E S
Ta b l e 7
PRIMARY COHORTCOMPLETION RATE (%)
2005
School year ending in
FemaleMaleTotal
1999
FemaleMaleTotal
SURVIVAL RATE TO LAST GRADE(%)
2005
School year ending in
FemaleMaleTotal
1999
FemaleMaleTotal
SURVIVAL RATE TO GRADE 5(%)
Arab States
Central and Eastern Europe
Central Asia
East Asia and the Pacific
3 1 7

Cook IslandsDPR KoreaFijiIndonesiaJapanKiribatiLao PDRMacao, ChinaMalaysiaMarshall IslandsMicronesiaMyanmarNauruNew ZealandNiuePalauPapua New GuineaPhilippinesRepublic of KoreaSamoaSingaporeSolomon IslandsThailandTimor-LesteTokelauTongaTuvaluVanuatuViet Nam
AnguillaAntigua and BarbudaArgentinaArubaBahamasBarbadosBelizeBermudaBoliviaBrazilBritish Virgin IslandsCayman IslandsChileColombiaCosta RicaCubaDominicaDominican RepublicEcuadorEl SalvadorGrenadaGuatemalaGuyanaHaitiHondurasJamaicaMexicoMontserratNetherlands AntillesNicaraguaPanama
6 … … … … … … … … … … … … … … …
4 … … … … … … … … … … … … … … …
6 7.1 6.9 7.4 – – – 4.3 4.6 3.9 4.6 4.6 4.7 5.7 5.7 5.86 4.1 4.7 3.5 1.6 1.8 1.4 3.0 3.6 2.2 7.0 7.4 6.7 5.7 5.9 5.66 … … … … … … … … … … … … … … …
6 12.0.x 11.4.x 12.5.x 2.9.x 4.2.x 1.6.x 0.8.x 1.6.x 0.1.x 3.3.x 8.7.x –.x 0.6.x 1.5.x –.x
5 13.0 12.7 13.2 6.8 6.7 6.9 7.7 7.8 7.7 7.2 6.5 8.0 … … …
6 – – – – – – – – – … … … … … …
6 –.y –.y –.y –.y –.y –.y –.y –.y –.y 0.0.y 0.0.y 0.0.y –.y … …
6 … … … … … … … … … … … … … … …
6 … … … … … … … … … … … … … … …
5 11.3 12.0 10.6 5.9 4.9 6.9 6.7 7.3 6.2 7.9 8.1 7.7 … … …
6 … … … … … … … … … … … … … … …
6 … … … … … … … … … … … … … … …
6 … … … … … … … … … … … … … … …
5 … … … … … … … … … … … … … … …
6 … … … … … … … … … … … … … … …
6 14.4 15.9 12.8 4.9 5.7 4.1 4.0 5.0 2.9 4.0 5.0 2.9 4.7 6.0 3.46 – – – 0.2 0.2 0.2 0.3 0.3 0.2 0.4 0.4 0.3 0.4 0.4 0.46 … … … … … … … … … … … … … … …
6 … … … … … … … … … … … … … … …
6 … … … … … … … … … … … … … … …
6 … … … … … … … … … … … … … … …
6 … … … … … … … … … … … … … … …
6 … … … … … … … … … … … … … … …
6 4.2 4.3 4.0 1.6 0.2 3.1 2.8 3.8 1.5 – – – 1.3 2.3 0.26 … … … … … … … … … … … … … … …
6 … … … … … … … … … … … … … … …
5 2.1 … … 1.6 … … 2.0 … … 2.3 … … … … …
7 1.0.y 3.2.y –.y –.y –.y –.y 0.9.y –.y 1.9.y 1.0.y 0.9.y 1.3.y –.y … …
7 … … … … … … … … … … … … … … …
6 3.4.y 3.7.y 3.1.y 1.9.y 2.2.y 1.6.y 1.9.y 2.2.y 1.6.y 2.7.y 3.0.y 2.4.y 3.0.y 3.7.y 2.4.y
6 0.2 0.9 – 2.2 2.7 1.6 – … … – … … – … …
6 8.7 10.6 6.7 3.0 5.3 0.7 2.0 0.7 3.2 2.0 2.3 1.7 4.3 4.2 4.36 3.2 1.6 4.8 0.5 1.6 – 0.8 – 1.6 1.0 2.6 – – … …
6 4.0 2.5 5.6 0.7 0.7 0.7 1.4 3.3 – 0.8 1.3 0.2 – – –6 1.6 … … 1.4 … … 9.8 … … – – – 3.7 … …
6 7.9...x 8.2...x 7.7...x 1.6...x 1.5...x 1.6...x 3.8...x 3.6...x 4.0...x 2.6...x 2.4...x 2.8...x 2.7...x 1.7...x 3.8...x
4 8.4.x … … 2.0.x … … 5.5.x … … … … … … … …
7 1.4 … … 0.7 … … … … … … … … . . .6 5.6.y 4.9.y 6.3.y 5.7.y 1.9.y 9.9.y 6.6.y 7.8.y 5.4.y 6.4.y 9.8.y 2.0.y –.y … …
6 0.4.x 0.4.x 0.5.x 1.3.x 1.5.x 1.1.x –.x –.x –.x –.x –.x –.x 0.5.x 0.7.x 0.3.x
5 10.9 12.0 9.5 3.4 4.4 2.3 4.1 4.9 3.3 – – – … … …
6 2.3 2.5 2.0 0.8 1.3 0.3 0.4 0.2 0.6 2.2 2.3 2.2 3.3 3.7 2.96 1.4 1.9 1.0 1.3 2.1 0.4 – – – 0.1 – 0.3 0.1 0.2 0.17 4.6 3.5 5.6 – … … 3.5 … … 1.3 … … 3.5 … …
6 8.0 8.0 8.0 7.1 7.5 6.7 8.9 10.2 7.4 9.0 9.7 8.2 10.1 11.3 8.96 13.1 13.2 12.9 3.5 3.5 3.4 3.7 3.8 3.5 3.8 4.2 3.4 2.2 2.1 2.36 11.2 11.7 10.7 6.1 6.4 5.7 4.8 5.3 4.3 6.1 6.8 5.4 6.3 6.6 6.17 … … … … … … … … … … … … … … …
6 8.7 8.5 8.8 6.1 5.6 6.6 7.2 6.4 8.1 8.3 7.8 8.8 7.8 7.6 8.06 … … … … … … … … … … … … … … …
6 … … … … … … … … … … … … … … …
6 6.9 8.0 5.7 2.7 3.5 1.9 2.8 3.4 2.3 3.2 3.5 2.9 2.9 3.7 2.16 … … … … … … … … … … … … … … …
6 1.8 2.1 1.6 0.9 1.0 0.8 1.6 1.7 1.4 1.2 1.4 0.9 2.3 2.6 2.07 … … … … … … … … … … … … … … …
6 … … … … … … … … … … … … … … …
6 17.1 17.8 16.3 10.0 11.3 8.6 9.1 10.2 7.8 14.4 15.4 13.4 6.1 7.7 4.66 4.5 4.5 4.5 2.3 2.8 1.8 1.9 2.4 1.3 3.0 3.1 2.8 3.0 2.9 3.2
Table 7 (continued)
Country or territoryGrade 5
Duration1
of primaryeducation
2006
DROPOUT RATES BY GRADE IN PRIMARY EDUCATION (%)
FemaleMaleTotal
Grade 4
FemaleMaleTotal
Grade 3
FemaleMaleTotal
Grade 2
FemaleMaleTotal
Grade 1
FemaleMaleTotal
School year ending in 2005
Latin America and the Caribbean
90
02
Education f
or A
ll G
lobal M
onitorin
g R
eport
A N N E X
3 1 8

Cook IslandsDPR Korea
FijiIndonesia
JapanKiribati
Lao PDRMacao, China
MalaysiaMarshall Islands
MicronesiaMyanmar
NauruNew Zealand
NiuePalau
Papua New GuineaPhilippines
Republic of KoreaSamoa
SingaporeSolomon Islands
ThailandTimor-Leste
TokelauTongaTuvalu
VanuatuViet Nam
AnguillaAntigua and Barbuda
ArgentinaAruba
BahamasBarbados
BelizeBermuda
BoliviaBrazil
British Virgin IslandsCayman Islands
ChileColombia
Costa RicaCuba
DominicaDominican Republic
EcuadorEl Salvador
GrenadaGuatemala
GuyanaHaiti
HondurasJamaicaMexico
MontserratNetherlands Antilles
NicaraguaPanama
… … … … … … … … … … … … … … …… … … … … … … … … … … … … … …
87 89 86 86 85 87 82 82 82 81 80 82 … … …… … … 84 83 86 … … … 79 78 81 … … …… … … … … … … … … … … … … … …… … … 82.x 76.x 88.x … … … 81.x 75.x 89.x … … …
54 55 54 62 62 62 54 55 54 62 62 62 58.y 58.y 57.y… … … … … … … … … … … … … … …… … … 99.y 99.y 100.y … … … 99.y … … … … …… … … … … … … … … … … … … … …… … … … … … … … … … … … … … …… … … 72 71 72 … … … 72 71 72 70.y 68.y 71.y… … … … … … … … … … … … … … …… … … … … … … … … … … … … … …… … … … … … … … … … … … … … …… … … … … … … … … … … … … … …… … … … … … … … … … … … … … …… … … 74 70 78 … … … 70 66 75 … … …
100 100 100 99 99 99 100 100 100 99 99 99 … … …
94 91.* 96.* … … … 92 91.* 94.* … … … … … …… … … … … … … … … … … … … … …… … … … … … … … … … … … … … …… … … … … … … … … … … … … … …… … … … … … … … … … … … … … …… … … … … … … … … … … … … … …… … … 92 92 92 … … … 91 90 92 … … …… … … … … … … … … … … … … … …
72 72 72 … … … 69 67 71 … … … … … …
83 80 86 92 … … 83 80 86 92 … … … … …
… … … 97.y 94.y 100.y … … … 93.y … … 88.y … …… … … … … … … … … … … … … … …
90 90 90 90.y 88.y 91.y 89 88 89 87.y 85.y 89.y … … …… … … 97 … … 97 99 95 96 … … 95.y 93.y 97.y… … … 85 82 88 … … … 81 79 84 … … …… … … … … … 94 95 93 97 … … … … …
78 … … 92 … … 77 77 76 92 91 94 … … …… … … 90 … … … … … 86 … … … … …
82 83 81 85...x 85...x 85...x 80 82 77 82...x 83...x 81...x … … …… … … … … … … … … 80.x … … … … …… … … … … … … … … … … … … … …
74 … … … … … … … … 78.y … … … … …
100 100 100 99.x 99.x 99.x 100 99 100 98.x 98.x 98.x … … …
67 64 69 82 78 86 67 64 69 82 78 86 75.y 73.y 77.y
91 90 93 94 93 95 88 86 89 90 89 92 81 80 8394 94 94 97 96 98 93 92 93 97 96 98 … … …
91 … … 92 … … … … … 88 … … 83.x 83.x 83.x
75 71 79 68 66 71 71 66 75 61 58 65 … … …
77 77 77 77 77 78 75 74 75 76 75 76 70...x 70...x 71...x
65 64 66 72 70 74 62 63 62 67 65 70 63 60 65… … … … … … … … … … … … … … …
56 55 58 69 70 68 52 50 54 63 65 62 61.y 63.y 59.y
95 … … … … … 93 … … … … … … … …… … … … … … … … … … … … … … …… … … 83 80 87 … … … 81 77 85 … … …… … … … … … … … … … … … … … …
89 88 90 94 94 95 87 86 88 92 91 93 … … …… … … … … … … … … … … … … … …… … … … … … 84 78 91 … … … … … …
48 44 53 54 50 57 46 42 50 50 46 55 47.y 44.y 51.y
92 92 92 88 87 89 90 90 91 85 84 86 84 … …
Country or territory2005
School year ending in
FemaleMaleTotal
PRIMARY EDUCATION COMPLETION
PRIMARY COHORTCOMPLETION RATE (%)
2005
School year ending in
FemaleMaleTotal
1999
FemaleMaleTotal
SURVIVAL RATE TO LAST GRADE(%)
2005
School year ending in
FemaleMaleTotal
1999
FemaleMaleTotal
SURVIVAL RATE TO GRADE 5(%)
Latin America and the Caribbean
S TAT I S T I C A L TA B L E S
Ta b l e 7
3 1 9
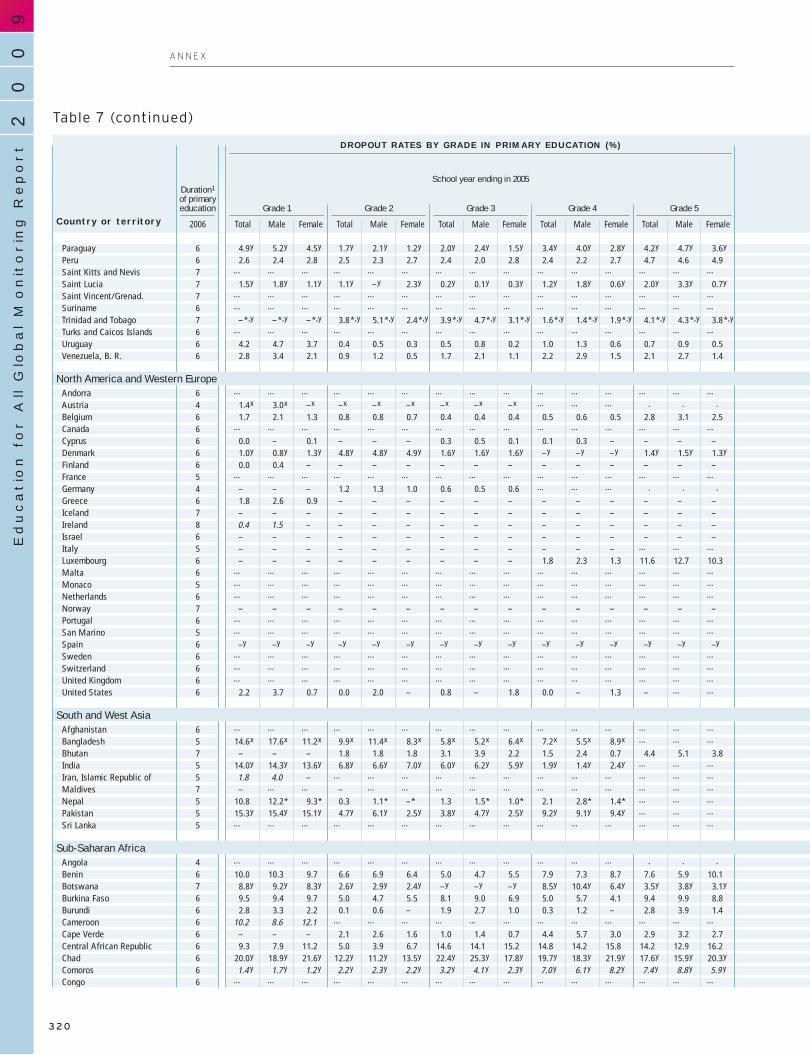
ParaguayPeruSaint Kitts and NevisSaint LuciaSaint Vincent/Grenad.SurinameTrinidad and TobagoTurks and Caicos IslandsUruguayVenezuela, B. R.
AndorraAustriaBelgiumCanadaCyprusDenmarkFinlandFranceGermanyGreeceIcelandIrelandIsraelItalyLuxembourgMaltaMonacoNetherlandsNorwayPortugalSan MarinoSpainSwedenSwitzerlandUnited KingdomUnited States
AfghanistanBangladeshBhutanIndiaIran, Islamic Republic ofMaldivesNepalPakistanSri Lanka
AngolaBeninBotswanaBurkina FasoBurundiCameroonCape VerdeCentral African RepublicChadComorosCongo
6 4.9.y 5.2.y 4.5.y 1.7.y 2.1.y 1.2.y 2.0.y 2.4.y 1.5.y 3.4.y 4.0.y 2.8.y 4.2.y 4.7.y 3.6.y
6 2.6 2.4 2.8 2.5 2.3 2.7 2.4 2.0 2.8 2.4 2.2 2.7 4.7 4.6 4.97 … … … … … … … … … … … … … … …
7 1.5.y 1.8.y 1.1.y 1.1.y –.y 2.3.y 0.2.y 0.1.y 0.3.y 1.2.y 1.8.y 0.6.y 2.0.y 3.3.y 0.7.y
7 … … … … … … … … … … … … … … …
6 … … … … … … … … … … … … … … …
7 –..*,y –..*,y –..*,y 3.8..*,y 5.1..*,y 2.4..*,y 3.9..*,y 4.7..*,y 3.1..*,y 1.6..*,y 1.4..*,y 1.9..*,y 4.1..*,y 4.3..*,y 3.8..*,y
6 … … … … … … … … … … … … … … …
6 4.2 4.7 3.7 0.4 0.5 0.3 0.5 0.8 0.2 1.0 1.3 0.6 0.7 0.9 0.56 2.8 3.4 2.1 0.9 1.2 0.5 1.7 2.1 1.1 2.2 2.9 1.5 2.1 2.7 1.4
6 … … … … … … … … … … … … … … …
4 1.4.x 3.0.x –.x –.x –.x –.x –.x –.x –.x … … … . . .6 1.7 2.1 1.3 0.8 0.8 0.7 0.4 0.4 0.4 0.5 0.6 0.5 2.8 3.1 2.56 … … … … … … … … … … … … … … …
6 0.0 – 0.1 – – – 0.3 0.5 0.1 0.1 0.3 – – – –6 1.0.y 0.8.y 1.3.y 4.8.y 4.8.y 4.9.y 1.6.y 1.6.y 1.6.y –.y –.y –.y 1.4.y 1.5.y 1.3.y
6 0.0 0.4 – – – – – – – – – – – – –5 … … … … … … … … … … … … … … …
4 – – – 1.2 1.3 1.0 0.6 0.5 0.6 … … … . . .6 1.8 2.6 0.9 – – – – – – – – – – – –7 – – – – – – – – – – – – – – –8 0.4 1.5 – – – – – – – – – – – – –6 – – – – – – – – – – – – – – –5 – – – – – – – – – – – – … … …
6 – – – – – – – – – 1.8 2.3 1.3 11.6 12.7 10.36 … … … … … … … … … … … … … … …
5 … … … … … … … … … … … … … … …
6 … … … … … … … … … … … … … … …
7 – – – – – – – – – – – – – – –6 … … … … … … … … … … … … … … …
5 … … … … … … … … … … … … … … …
6 –.y –.y –.y –.y –.y –.y –.y –.y –.y –.y –.y –.y –.y –.y –.y
6 … … … … … … … … … … … … … … …
6 … … … … … … … … … … … … … … …
6 … … … … … … … … … … … … … … …
6 2.2 3.7 0.7 0.0 2.0 – 0.8 – 1.8 0.0 – 1.3 – … …
6 … … … … … … … … … … … … … … …
5 14.6.x 17.6.x 11.2.x 9.9.x 11.4.x 8.3.x 5.8.x 5.2.x 6.4.x 7.2.x 5.5.x 8.9.x … … …
7 – – – 1.8 1.8 1.8 3.1 3.9 2.2 1.5 2.4 0.7 4.4 5.1 3.85 14.0.y 14.3.y 13.6.y 6.8.y 6.6.y 7.0.y 6.0.y 6.2.y 5.9.y 1.9.y 1.4.y 2.4.y … … …
5 1.8 4.0 – … … … … … … … … … … … …
7 – … … – … … … … … … … … … … …
5 10.8 12.2.* 9.3.* 0.3 1.1.* –.* 1.3 1.5.* 1.0.* 2.1 2.8.* 1.4.* … … …
5 15.3.y 15.4.y 15.1.y 4.7.y 6.1.y 2.5.y 3.8.y 4.7.y 2.5.y 9.2.y 9.1.y 9.4.y … … …
5 … … … … … … … … … … … … … … …
4 … … … … … … … … … … … … . . .6 10.0 10.3 9.7 6.6 6.9 6.4 5.0 4.7 5.5 7.9 7.3 8.7 7.6 5.9 10.17 8.8.y 9.2.y 8.3.y 2.6.y 2.9.y 2.4.y –.y –.y –.y 8.5.y 10.4.y 6.4.y 3.5.y 3.8.y 3.1.y
6 9.5 9.4 9.7 5.0 4.7 5.5 8.1 9.0 6.9 5.0 5.7 4.1 9.4 9.9 8.86 2.8 3.3 2.2 0.1 0.6 – 1.9 2.7 1.0 0.3 1.2 – 2.8 3.9 1.46 10.2 8.6 12.1 … … … … … … … … … … … …
6 – – – 2.1 2.6 1.6 1.0 1.4 0.7 4.4 5.7 3.0 2.9 3.2 2.76 9.3 7.9 11.2 5.0 3.9 6.7 14.6 14.1 15.2 14.8 14.2 15.8 14.2 12.9 16.26 20.0.y 18.9.y 21.6.y 12.2.y 11.2.y 13.5.y 22.4.y 25.3.y 17.8.y 19.7.y 18.3.y 21.9.y 17.6.y 15.9.y 20.3.y
6 1.4...y 1.7...y 1.2...y 2.2...y 2.3...y 2.2...y 3.2...y 4.1...y 2.3...y 7.0...y 6.1...y 8.2...y 7.4...y 8.8...y 5.9...y
6 … … … … … … … … … … … … … … …
Table 7 (continued)
Country or territoryGrade 5
Duration1
of primaryeducation
2006
DROPOUT RATES BY GRADE IN PRIMARY EDUCATION (%)
FemaleMaleTotal
Grade 4
FemaleMaleTotal
Grade 3
FemaleMaleTotal
Grade 2
FemaleMaleTotal
Grade 1
FemaleMaleTotal
School year ending in 2005
North America and Western Europe
South and West Asia
Sub-Saharan Africa
90
02
Education f
or A
ll G
lobal M
onitorin
g R
eport
A N N E X
3 2 0
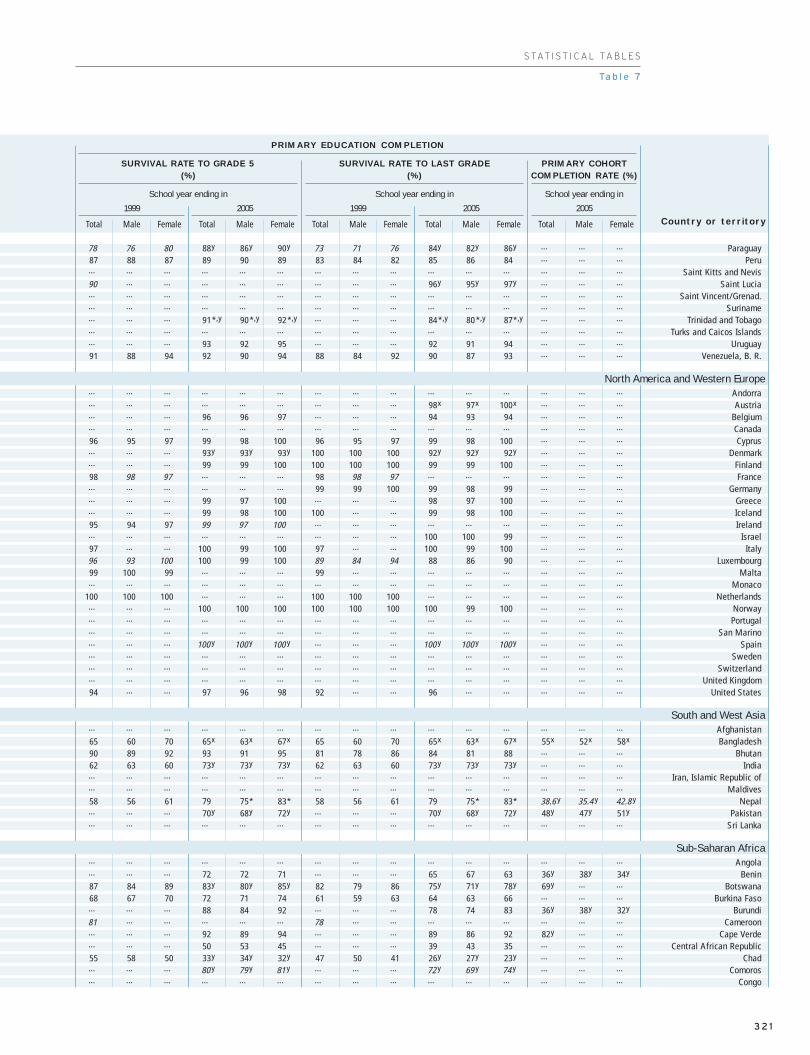
ParaguayPeru
Saint Kitts and NevisSaint Lucia
Saint Vincent/Grenad.Suriname
Trinidad and TobagoTurks and Caicos Islands
UruguayVenezuela, B. R.
AndorraAustria
BelgiumCanadaCyprus
DenmarkFinlandFrance
GermanyGreeceIcelandIreland
IsraelItaly
LuxembourgMalta
MonacoNetherlands
NorwayPortugal
San MarinoSpain
SwedenSwitzerland
United KingdomUnited States
AfghanistanBangladesh
BhutanIndia
Iran, Islamic Republic ofMaldives
NepalPakistan
Sri Lanka
AngolaBenin
BotswanaBurkina Faso
BurundiCameroon
Cape VerdeCentral African Republic
ChadComoros
Congo
78 76 80 88.y 86.y 90.y 73 71 76 84.y 82.y 86.y … … …
87 88 87 89 90 89 83 84 82 85 86 84 … … …… … … … … … … … … … … … … … …
90 … … … … … … … … 96.y 95.y 97.y … … …… … … … … … … … … … … … … … …… … … … … … … … … … … … … … …… … … 91..*,y 90..*,y 92..*,y … … … 84..*,y 80..*,y 87.*,y … … …… … … … … … … … … … … … … … …… … … 93 92 95 … … … 92 91 94 … … …
91 88 94 92 90 94 88 84 92 90 87 93 … … …
… … … … … … … … … … … … … … …… … … … … … … … … 98.x 97.x 100.x … … …… … … 96 96 97 … … … 94 93 94 … … …… … … … … … … … … … … … … … …
96 95 97 99 98 100 96 95 97 99 98 100 … … …… … … 93.y 93.y 93.y 100 100 100 92.y 92.y 92.y … … …… … … 99 99 100 100 100 100 99 99 100 … … …
98 98 97 … … … 98 98 97 … … … … … …… … … … … … 99 99 100 99 98 99 … … …… … … 99 97 100 … … … 98 97 100 … … …… … … 99 98 100 100 … … 99 98 100 … … …
95 94 97 99 97 100 … … … … … … … … …… … … … … … … … … 100 100 99 … … …
97 … … 100 99 100 97 … … 100 99 100 … … …
96 93 100 100 99 100 89 84 94 88 86 90 … … …
99 100 99 … … … 99 … … … … … … … …… … … … … … … … … … … … … … …
100 100 100 … … … 100 100 100 … … … … … …… … … 100 100 100 100 100 100 100 99 100 … … …… … … … … … … … … … … … … … …… … … … … … … … … … … … … … …… … … 100...y 100...y 100...y … … … 100...y 100...y 100...y … … …… … … … … … … … … … … … … … …… … … … … … … … … … … … … … …… … … … … … … … … … … … … … …
94 … … 97 96 98 92 … … 96 … … … … …
… … … … … … … … … … … … … … …
65 60 70 65.x 63.x 67.x 65 60 70 65.x 63.x 67.x 55.x 52.x 58.x
90 89 92 93 91 95 81 78 86 84 81 88 … … …
62 63 60 73.y 73.y 73.y 62 63 60 73.y 73.y 73.y … … …… … … … … … … … … … … … … … …… … … … … … … … … … … … … … …
58 56 61 79 75.* 83.* 58 56 61 79 75.* 83.* 38.6...y 35.4...y 42.8...y… … … 70.y 68.y 72.y … … … 70.y 68.y 72.y 48.y 47.y 51.y… … … … … … … … … … … … … … …
… … … … … … … … … … … … … … …… … … 72 72 71 … … … 65 67 63 36.y 38.y 34.y
87 84 89 83.y 80.y 85.y 82 79 86 75.y 71.y 78.y 69.y … …
68 67 70 72 71 74 61 59 63 64 63 66 … … …… … … 88 84 92 … … … 78 74 83 36.y 38.y 32.y
81 … … … … … 78 … … … … … … … …… … … 92 89 94 … … … 89 86 92 82.y … …… … … 50 53 45 … … … 39 43 35 … … …
55 58 50 33.y 34.y 32.y 47 50 41 26.y 27.y 23.y … … …… … … 80...y 79...y 81...y … … … 72...y 69...y 74...y … … …… … … … … … … … … … … … … … …
Country or territory2005
School year ending in
FemaleMaleTotal
PRIMARY EDUCATION COMPLETION
PRIMARY COHORTCOMPLETION RATE (%)
2005
School year ending in
FemaleMaleTotal
1999
FemaleMaleTotal
SURVIVAL RATE TO LAST GRADE(%)
2005
School year ending in
FemaleMaleTotal
1999
FemaleMaleTotal
SURVIVAL RATE TO GRADE 5(%)
North America and Western Europe
South and West Asia
Sub-Saharan Africa
S TAT I S T I C A L TA B L E S
Ta b l e 7
3 2 1
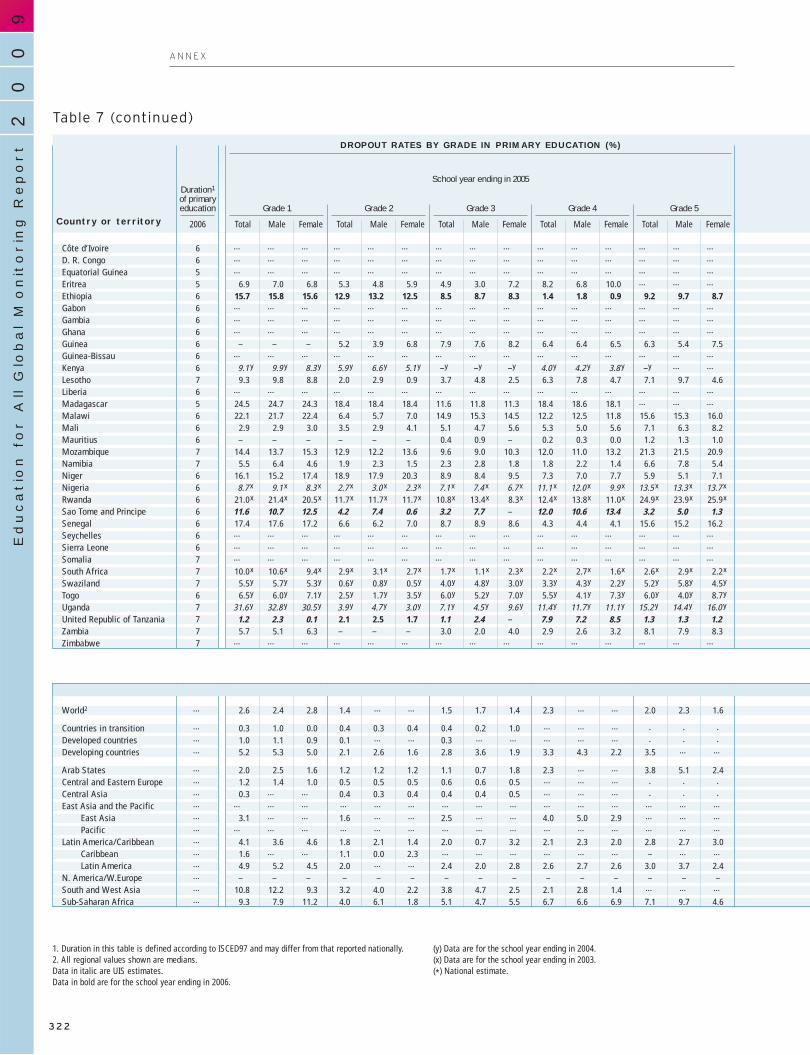
Côte d’IvoireD. R. CongoEquatorial GuineaEritreaEthiopiaGabonGambiaGhanaGuineaGuinea-BissauKenyaLesothoLiberiaMadagascarMalawiMaliMauritiusMozambiqueNamibiaNigerNigeriaRwandaSao Tome and PrincipeSenegalSeychellesSierra LeoneSomaliaSouth AfricaSwazilandTogoUgandaUnited Republic of TanzaniaZambiaZimbabwe
World2
Countries in transitionDeveloped countriesDeveloping countries
Arab StatesCentral and Eastern EuropeCentral AsiaEast Asia and the Pacific
East AsiaPacific
Latin America/CaribbeanCaribbeanLatin America
N. America/W.EuropeSouth and West AsiaSub-Saharan Africa
6 … … … … … … … … … … … … … … …
6 … … … … … … … … … … … … … … …
5 … … … … … … … … … … … … … … …
5 6.9 7.0 6.8 5.3 4.8 5.9 4.9 3.0 7.2 8.2 6.8 10.0 … … …
6 15.7 15.8 15.6 12.9 13.2 12.5 8.5 8.7 8.3 1.4 1.8 0.9 9.2 9.7 8.76 … … … … … … … … … … … … … … …
6 … … … … … … … … … … … … … … …
6 … … … … … … … … … … … … … … …
6 – – – 5.2 3.9 6.8 7.9 7.6 8.2 6.4 6.4 6.5 6.3 5.4 7.56 … … … … … … … … … … … … … … …
6 9.1...y 9.9...y 8.3...y 5.9...y 6.6...y 5.1...y –.y –.y –.y 4.0...y 4.2...y 3.8...y –.y … …
7 9.3 9.8 8.8 2.0 2.9 0.9 3.7 4.8 2.5 6.3 7.8 4.7 7.1 9.7 4.66 … … … … … … … … … … … … … … …
5 24.5 24.7 24.3 18.4 18.4 18.4 11.6 11.8 11.3 18.4 18.6 18.1 … … …
6 22.1 21.7 22.4 6.4 5.7 7.0 14.9 15.3 14.5 12.2 12.5 11.8 15.6 15.3 16.06 2.9 2.9 3.0 3.5 2.9 4.1 5.1 4.7 5.6 5.3 5.0 5.6 7.1 6.3 8.26 – – – – – – 0.4 0.9 – 0.2 0.3 0.0 1.2 1.3 1.07 14.4 13.7 15.3 12.9 12.2 13.6 9.6 9.0 10.3 12.0 11.0 13.2 21.3 21.5 20.97 5.5 6.4 4.6 1.9 2.3 1.5 2.3 2.8 1.8 1.8 2.2 1.4 6.6 7.8 5.46 16.1 15.2 17.4 18.9 17.9 20.3 8.9 8.4 9.5 7.3 7.0 7.7 5.9 5.1 7.16 8.7...x 9.1...x 8.3...x 2.7...x 3.0...x 2.3...x 7.1...x 7.4...x 6.7...x 11.1...x 12.0...x 9.9...x 13.5...x 13.3...x 13.7...x
6 21.0.x 21.4.x 20.5.x 11.7.x 11.7.x 11.7.x 10.8.x 13.4.x 8.3.x 12.4.x 13.8.x 11.0.x 24.9.x 23.9.x 25.9.x
6 11.6 10.7 12.5 4.2 7.4 0.6 3.2 7.7 – 12.0 10.6 13.4 3.2 5.0 1.36 17.4 17.6 17.2 6.6 6.2 7.0 8.7 8.9 8.6 4.3 4.4 4.1 15.6 15.2 16.26 … … … … … … … … … … … … … … …
6 … … … … … … … … … … … … … … …
7 … … … … … … … … … … … … … … …
7 10.0.x 10.6.x 9.4.x 2.9.x 3.1.x 2.7.x 1.7.x 1.1.x 2.3.x 2.2.x 2.7.x 1.6.x 2.6.x 2.9.x 2.2.x
7 5.5.y 5.7.y 5.3.y 0.6.y 0.8.y 0.5.y 4.0.y 4.8.y 3.0.y 3.3.y 4.3.y 2.2.y 5.2.y 5.8.y 4.5.y
6 6.5.y 6.0.y 7.1.y 2.5.y 1.7.y 3.5.y 6.0.y 5.2.y 7.0.y 5.5.y 4.1.y 7.3.y 6.0.y 4.0.y 8.7.y
7 31.6...y 32.8...y 30.5...y 3.9...y 4.7...y 3.0...y 7.1...y 4.5...y 9.6...y 11.4...y 11.7...y 11.1...y 15.2...y 14.4...y 16.0...y
7 1.2 2.3 0.1 2.1 2.5 1.7 1.1 2.4 – 7.9 7.2 8.5 1.3 1.3 1.27 5.7 5.1 6.3 – – – 3.0 2.0 4.0 2.9 2.6 3.2 8.1 7.9 8.37 … … … … … … … … … … … … … … …
… 2.6 2.4 2.8 1.4 … … 1.5 1.7 1.4 2.3 … … 2.0 2.3 1.6
… 0.3 1.0 0.0 0.4 0.3 0.4 0.4 0.2 1.0 … … … . . .… 1.0 1.1 0.9 0.1 … … 0.3 … … … … … . . .… 5.2 5.3 5.0 2.1 2.6 1.6 2.8 3.6 1.9 3.3 4.3 2.2 3.5 … …
… 2.0 2.5 1.6 1.2 1.2 1.2 1.1 0.7 1.8 2.3 … … 3.8 5.1 2.4… 1.2 1.4 1.0 0.5 0.5 0.5 0.6 0.6 0.5 … … … . . .… 0.3 … … 0.4 0.3 0.4 0.4 0.4 0.5 … … … . . .… … … … … … … … … … … … … … … …… 3.1 … … 1.6 … … 2.5 … … 4.0 5.0 2.9 … … …… … … … … … … … … … … … … … … …… 4.1 3.6 4.6 1.8 2.1 1.4 2.0 0.7 3.2 2.1 2.3 2.0 2.8 2.7 3.0… 1.6 … … 1.1 0.0 2.3 … … … … … … – … …… 4.9 5.2 4.5 2.0 … … 2.4 2.0 2.8 2.6 2.7 2.6 3.0 3.7 2.4… – – – – – – – – – – – – – – –… 10.8 12.2 9.3 3.2 4.0 2.2 3.8 4.7 2.5 2.1 2.8 1.4 … … …… 9.3 7.9 11.2 4.0 6.1 1.8 5.1 4.7 5.5 6.7 6.6 6.9 7.1 9.7 4.6
Table 7 (continued)
Country or territoryGrade 5
Duration1
of primaryeducation
2006
DROPOUT RATES BY GRADE IN PRIMARY EDUCATION (%)
FemaleMaleTotal
Grade 4
FemaleMaleTotal
Grade 3
FemaleMaleTotal
Grade 2
FemaleMaleTotal
Grade 1
FemaleMaleTotal
School year ending in 2005
90
02
Education f
or A
ll G
lobal M
onitorin
g R
eport
A N N E X
1. Duration in this table is defined according to ISCED97 and may differ from that reported nationally. 2. All regional values shown are medians.Data in italic are UIS estimates.Data in bold are for the school year ending in 2006.
(y) Data are for the school year ending in 2004.(x) Data are for the school year ending in 2003. (*) National estimate.
3 2 2

Côte d’IvoireD. R. Congo
Equatorial GuineaEritrea
EthiopiaGabon
GambiaGhana
GuineaGuinea-Bissau
KenyaLesothoLiberia
MadagascarMalawi
MaliMauritius
MozambiqueNamibia
NigerNigeria
RwandaSao Tome and Principe
SenegalSeychelles
Sierra LeoneSomalia
South AfricaSwaziland
TogoUganda
United Republic of TanzaniaZambia
Zimbabwe
World 2
Countries in transitionDeveloped countries
Developing countries
Arab StatesCentral and Eastern Europe
Central AsiaEast Asia and the Pacific
East AsiaPacific
Latin America/CaribbeanCaribbean
Latin AmericaN. America/W. Europe
South and West AsiaSub-Saharan Africa
69 73 65 … … … 62 67 56 … … … … … …… … … … … … … … … … … … … … …… … … … … … … … … … … … … … …
95 97 93 74 77 70 95 97 93 74 77 70 … … …
56 55 59 64 64 65 51 49 54 58 57 59 … … …… … … … … … … … … … … … … … …… … … … … … … … … … … … … … …… … … … … … … … … … … … … … …… … … 81 83 78 … … … 76 79 72 65.x 69.x 59.x… … … … … … … … … … … … … … …… … … … … … … … … 84...y … … 71...y … …
74 67 80 74 68 80 58 50 66 62 53 71 … … …… … … … … … … … … … … … … … …
51 51 52 36 35 37 51 51 52 36 35 37 27 … …
49 55 43 44 44 44 37 39 34 36 36 36 … … …
78 79 77 81 83 79 66 67 63 73 75 70 … … …
99 100 99 99 98 100 99 100 99 99 97 100 … … …
43 47 37 58 60 55 28 31 25 40 41 39 … … …
92 92 93 87 84 90 82 79 84 77 73 80 63...x 59...x 67...x… … … 56 58 54 … … … 53 55 50 39.y 40.y 36.y… … … 73...x 71...x 75...x … … … 63...x 61...x 64...x … … …
45 … … 46.x 43.x 49.x 30 … … 31.x 30.x 32.x 13.x 15.x 12.x… … … 64 58 71 … … … 61 54 69 … … …… … … 65 65 65 … … … 53 54 53 30 24 37… … … … … … 99 99 100 … … … … … …… … … … … … … … … … … … … … …… … … … … … … … … … … … … … …
65 65 64 82.x 82.x 83.x 57 59 56 77.x 75.x 79.x … … …
80 72 88 84.y 81.y 87.y 64 62 66 71.y 66.y 75.y … … …… … … 75.y 79.y 70.y … … … 68.y 74.y 62.y 63.y 70.y 55.y… … … 49...y 49...y 49...y … … … 25...y 26...y 25...y … … …… … … 87 85 89 … … … 83 81 85 … … …
81 83 78 89 92 87 66 70 62 76 79 73 … … …… … … … … … … … … … … … … … …
… … … … … … … … … 88 88 89 … … …
… … … … … … 97 … … 99 100 97 … … …… … … … … … 98 98 99 98 98 98 … … …… … … 83 80 87 … … … 81 79 83 … … …
92 90 93 … … … 90 89 92 92 92 93 … … …… … … … … … 97 96 98 97 97 98 … … …… … … … … … 97 98 96 99 99 98 … … …… … … … … … … … … … … … … … …… … … 84 83 86 … … … 79 78 81 … … …… … … … … … … … … … … … … … …
87 … … 90 88 91 84 78 91 85 84 86 … … …… … … … … … … … … … … … … … …
85 86 84 88 86 90 81 83 80 84 82 86 … … …… … … … … … … … … 99 98 100 … … …… … … 73 73 73 … … … 73 73 73 … … …… … … 74 77 70 … … … 67 71 62 … … …
Country or territory2005
School year ending in
FemaleMaleTotal
PRIMARY EDUCATION COMPLETION
PRIMARY COHORTCOMPLETION RATE (%)
2005
School year ending in
FemaleMaleTotal
1999
FemaleMaleTotal
SURVIVAL RATE TO LAST GRADE(%)
2005
School year ending in
FemaleMaleTotal
1999
FemaleMaleTotal
SURVIVAL RATE TO GRADE 5(%)
S TAT I S T I C A L TA B L E S
Ta b l e 7
3 2 3

76 74 79 12-17 4 450 … … 3 756...z 51...z –.z 464...z 39...z
96 95 98 12-17 72 59 51 74 50 17 15 3973 75 70 12-18 135 16 42 30 40 17 2 3786....x 83...x 89...x 12-17 9 457 7 671 47 8 330...y 47...y 5...y 2 525...y 44...y
70...y 73...y 66...y 12-17 3 953 1 105 38 1 751...z 39...z ..z 140...z 32...z
96 97 96 12-17 732 579 49 649 49 17 32 3598 95 100 11-17 267 235 49 236 50 29 5 886 83 88 12-17 449 372 52 366 52 55 50 40… … … 12-18 783 … … 733 53 2 … …
48 51 45 12-17 397 63 42 99.* 45.* 17.* 3.* 34.*77 78 77 12-17 3 930 1 470 43 2 061 … 5 119 …
98 99 98 12-17 338 229 49 299 48 1 . .98 98 99 10-17 730 444 50 686 50 4 6 3198 96 100 12-17 58 44 50 59 49 32.z 0.6 –… … … 12-17 2 958 … … … … … … …
97 94 100 12-16 4 281 965 … 1 447 48 8 44 4796 95 97 10-17 3 541 1 030 47 2 465 48 4 114 4288 86 90 12-18 1 469 1 059 49 1 247 51 5 113 3999 99 100 11-17 331 202 50 298 49 46 1 .83.y 83.y 82.y 12-17 3 281 1 042 26 1 455.z 32.z 2.z 10.z 6.z
100...x 100...x 99...x 10-17 502 364 48 397.y 48.y 3.y 24.y 34.y
100 99 100 10-16 914 978 50 879 49 0.1 6 27… … … 10-17 405 … … … … … … …
96 96 96 11-17 629 700 48 667 48 0.9.z 203 39100 100 100 11-18 434 416 49 396 50 1 151 47
99 99 99 11-18 1 005 928 50 966 49 7 381 4698 … … 13-18 120 116 50 120 49 2 19 3499 99 99 11-18 994 1 007 49 949 49 10 129 3897 97 97 11-18 262 255 50 258 49 1 38 3998 98 99 11-18 415 407 49 411 49 0.4 38 35… … … … … … … … … … … …
92 … … 13-18 3 332 3 984 49 3 317 48 3 779 3699 98 99 11-17 … 415 50 382 50 1 38 4398 98 98 11-18 2 344 2 218 49 2 013 49 0.7 683 44… … … 11-17 13 746 … … 11 548 48 0.6 1 958 37… … … 11-18 … 737 49 616 49 0.2 220 4798 97 98 10-18 679 674 50 640 49 8 220 46… … … 11-18 183 220 49 174 49 1 60 42
100.y 100.y 99.y 11-18 251 219 48 214.z 48.z 0.6.z 58.z 43.z
92.y 93.y 90.y 12-16 6 851 … … 5 388 44 2 1 112 38… … … 10-16 4 171 5 214 50.* 3 896 48.* 0.4 311 34.*
100 100 99 10-16 398 347 … 356 50 1 2 3399 100 98 10-16 1 267 929 49 1 052 48 0.4 3 2999 98 100 12-16 370 442 49 314 50 4 6 31
100 100 100 11-17 2 091 1 966 49 1 874 49 0.8 106 31100 100 100 11-17 832 633 50 719 50 1 29 35
97 95 99 12-17 368 205 55 329 52 4.z 22 4698 … … 11-17 1 209 769 46 999 45 . 25 28… … … 10-16 804 … … … … … … …
100 100 100 11-17 4 528 3 411 49 4 598 49 . 1 075 49
… … … 12-17 1 687 2 491 49 2 537 47 27 1 048 43.694 92 96 12-18 47 34 51 46 49 13 3 4081 83 80 12-17 2 162 318 34 825 43 3 26 43
AlgeriaBahrainDjiboutiEgyptIraqJordanKuwaitLebanonLibyan Arab JamahiriyaMauritaniaMoroccoOmanPalestinian A. T.QatarSaudi ArabiaSudanSyrian Arab RepublicTunisiaUnited Arab EmiratesYemen
AlbaniaBelarusBosnia and HerzegovinaBulgariaCroatiaCzech RepublicEstoniaHungaryLatviaLithuaniaMontenegroPolandRepublic of Moldova3,4
RomaniaRussian FederationSerbia3
SlovakiaSloveniaTFYR MacedoniaTurkeyUkraine
ArmeniaAzerbaijanGeorgiaKazakhstanKyrgyzstanMongoliaTajikistanTurkmenistanUzbekistan
Australia5
Brunei DarussalamCambodia
90
02
Education f
or A
ll G
lobal M
onitorin
g R
eport
A N N E X
Table 8Participation in secondary education1
TRANSITION FROM PRIMARY TO SECONDARYGENERAL EDUCATION (%)
ENROLMENT INSECONDARY EDUCATION
Enrolment in privateinstitutions as %
of total enrolmentTotal enrolment
Enrolment in technical and
vocational education
Country or territory(000)Total % F
(000)Total % F
(000)Total % FTotal Male Female 2006 2005
123456789
1011121314151617181920
212223242526272829303132333435363738394041
424344454647484950
515253
School year ending in2006
School year ending in20061999 2006
School year ending inSchool year ending in2005
Agegroup
School-agepopulation2
(000)
Arab States
Central and Eastern Europe
Central Asia
East Asia and the Pacific
3 2 4

108...z.z 111...z 105...z 0.95...z 58...z 50...z 67...z 1.36...z … … … .… 83...z 80...z 86...z 1.08...z 66.y 65...y 68...y 1.06...y
104 104 104 1.00 100 96 104 1.08 95 91 98 1.08 102 100 104 1.04 93 91 96 1.0527 32 22 0.69 16 20 13 0.63 14 16 12 0.72 22 27 18 0.67 22...z 26...z 17...z 0.66...z
98...y 102...y 95...y 0.93...y 77...y 79...y 75...y 0.95...y 82 86 79 0.92 88...y 91...y 85...y 0.94...y … … … .…
58...z 70...z 45...z 0.64...z 32...z 38...z 26...z 0.70...z 34 41 26 0.63 45...z 54...z 36...z 0.66...z 38...z 45...z 32...z 0.70...z
94 94 95 1.01 78 75 80 1.06 89 88 90 1.02 89 88 90 1.03 82 81 83 1.0391 91 92 1.01 85 80 90 1.12 98 98 99 1.02 89 87 91 1.05 77 75 78 1.0588 85 92 1.09 74 70 78 1.12 74 70 77 1.09 81 78 85 1.10 73 70 76 1.10
116 117 115 0.99 77 65 91 1.41 … … … .… 94 86 101 1.17 … … … .…
27 29 26 0.88 22.* 24.* 20.* 0.84.* 19 21 16 0.77 25.* 27.* 23.* 0.86.* 16 16 15 0.9069 … … .… 36 … … .… 37 41 32 0.79 52 … … .… … … … .…
94 96 92 0.95 83 84 82 0.97 75 75 75 1.00 89 90 87 0.96 77 77 77 0.99100 98 102 1.04 73 68 78 1.16 80 79 82 1.04 94 91 97 1.06 90 87 92 1.06101 103 100 0.97 101 103 100 0.97 87 83 92 1.11 101 103 100 0.97 91 91 90 0.99… … … .… … … … .… … … … .… … … … .… … … … .…
47 49 45 0.92 25 24 25 1.01 26 … … .… 34 34 33 0.96 … … … .…
92 95 89 0.94 33 33 33 0.99 40 42 38 0.91 70 71 68 0.95 63 64 61 0.95107 107 106 1.00 70 63 77 1.22 72 72 73 1.02 85 81 89 1.10 … … … .…
97 97 96 0.99 81 78 85 1.09 76 74 78 1.06 90 89 91 1.02 79 78 80 1.0251.z 67.z 34.z 0.52.z 40.z 54.z 25.z 0.46.z 41 58 22 0.37 46.z 61.z 30.z 0.49.z 37...z 48...z 26...z 0.53...z
97.y 98.y 97.y 0.98.y 56.y 58.y 53.y 0.93.y 71 72 70 0.98 77.y 78.y 75.y 0.96.y 73...y 74...y 72...y 0.97...y
109 111 107 0.97 71 65 77 1.19 85 83 87 1.05 96 95 97 1.02 88 87 89 1.02… … … .… … … … .… … … … .… … … … .… … … … .…
91 93 88 0.95 123 125 122 0.97 91 92 90 0.98 106 108 104 0.96 89 90 88 0.9898 97 99 1.02 85 83 86 1.04 84 84 85 1.02 91 90 93 1.03 87 86 88 1.02
100 100 100 1.00 92 91 94 1.03 83 81 84 1.04 96 95 97 1.01 … … … .…
110 113 107 0.95 92 87 96 1.10 93 91 95 1.04 100 99 101 1.02 91 90 92 1.0297 98 96 0.98 94 94 95 1.00 94 93 94 1.02 96 96 95 0.99 90 90 90 1.00
103 104 101 0.97 93 91 96 1.06 88 87 90 1.04 99 98 99 1.00 … … … .…
100 101 99 0.98 95 93 98 1.06 95 95 96 1.01 99 99 99 1.00 92 92 93 1.01… … … .… … … … .… … … … .… … … … .… … … … .…
101 102 100 0.98 98 99 98 0.99 99 100 99 0.99 100 100 99 0.99 94 93 94 1.0293 92 93 1.01 82 77 87 1.13 83 84 82 0.98 89 87 91 1.04 81 80 83 1.0498 99 98 0.98 77 76 78 1.03 79 79 80 1.01 86 86 86 1.00 73 74 73 0.9880 80 80 1.00 91 94 88 0.94 … … … .… 84 85 83 0.98 … … … .…
97 97 96 0.99 80 77 82 1.07 93 93 94 1.01 88 87 89 1.03 … … … .…
96 97 96 0.99 92 91 93 1.03 85 84 86 1.02 94 94 95 1.01 … … … .…
92 92 92 1.00 98 98 99 1.00 100 98 101 1.03 95 95 95 1.00 90 90 91 1.0194.z 93.z 94.z 1.01.z 75.z 77.z 72.z 0.95.z 82 83 81 0.97 84.z 85.z 83.z 0.98.z 81.z 82.z 80.z 0.98.z
88 94 83 0.88 72 80 63 0.79 … … … .… 79 86 71 0.83 69 74 64 0.8693 93.* 93.* 1.00.* 94 96.* 91.* 0.95.* 98 97.* 100.* 1.03.* 93 94.* 93.* 0.98.* 84 83.* 84.* 1.01.*
93 93 94 1.02 81 78 85 1.09 91 … … .… 90 88 91 1.04 86 84 88 1.0490 92 88 0.96 66 68 65 0.95 76 76 76 1.00 83 85 81 0.96 78 79 76 0.9693 92 94 1.03 74 72 76 1.06 79 80 78 0.98 85 83 86 1.04 79 77 81 1.05
103 102 103 1.00 71 74 69 0.94 92 92 92 1.00 93 93 92 0.99 86 86 86 1.0091 91 91 1.01 75 74 76 1.03 83 83 84 1.02 86 86 87 1.01 80 80 81 1.0294 90 98 1.09 81 74 88 1.19 58 51 65 1.27 89 84 95 1.12 82 77 87 1.1394 99 88 0.89 55 68 42 0.61 74 80 68 0.86 83 90 75 0.83 80 87 74 0.84… … … .… … … … .… … … … .… … … … .… … … … .…
97 98 96 0.98 115 116 114 0.98 86 87 86 0.98 102 103 101 0.98 … … … .…
114 114 114 0.99 223 234 211 0.90 157 158 157 1.00 150 154 146 0.95 87 87 88 1.02116 118 114 0.96 84 79 90 1.14 85 81 89 1.09 98 96 100 1.04 90 88 92 1.05
54 59 49 0.84 21 25 16 0.65 17 22 12 0.53 38 43 34 0.79 31 33 28 0.85
S TAT I S T I C A L TA B L E S
Ta b l e 8
Lowersecondary
(F/M) (F/M)GPITotal Male Female
GROSS ENROLMENT RATIO (GER)IN SECONDARY EDUCATION
(%)
NET ENROLMENT RATIO(NER) IN SECONDARY
EDUCATION (%)
1234567891011121314151617181920
212223242526272829303132333435363738394041
424344454647484950
515253
School year ending in2006
Uppersecondary
GPITotal Male Female(F/M)
Total secondaryTotal
secondary
GPITotal Male Female(F/M)GPITotal Male Female
(F/M)GPITotal Male Female
School year ending in2006
School year ending in20061999 2006
School year ending in
Arab States
Central and Eastern Europe
Central Asia
East Asia and the Pacific
3 2 5
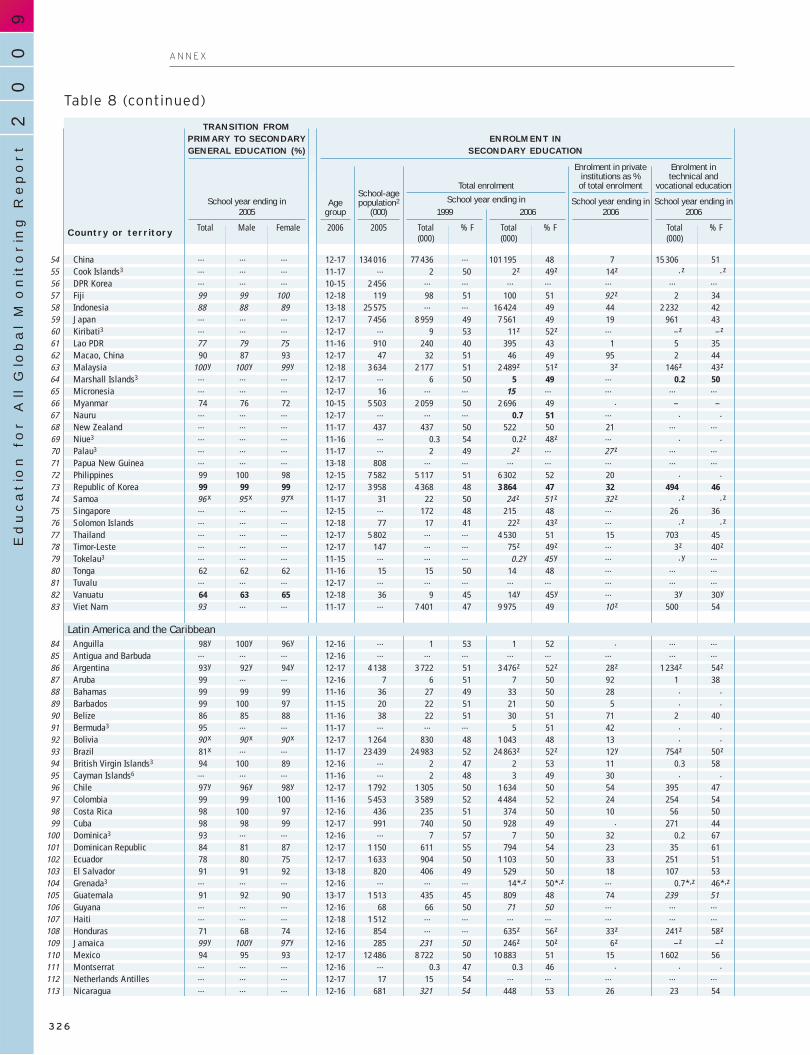
… … … 12-17 134 016 77 436 … 101 195 48 7 15 306 51… … … 11-17 … 2 50 2.z 49.z 14.z ..z ..z… … … 10-15 2 456 … … … … … … …
99 99 100 12-18 119 98 51 100 51 92...z 2 3488 88 89 13-18 25 575 … … 16 424 49 44 2 232 42… … … 12-17 7 456 8 959 49 7 561 49 19 961 43… … … 12-17 … 9 53 11.z 52.z … –.z –.z
77 79 75 11-16 910 240 40 395 43 1 5 3590 87 93 12-17 47 32 51 46 49 95 2 44
100...y 100...y 99...y 12-18 3 634 2 177 51 2 489.z 51.z 3.z 146.z 43.z… … … 12-17 … 6 50 5 49 … 0.2 50… … … 12-17 16 … … 15 … … … …
74 76 72 10-15 5 503 2 059 50 2 696 49 . – –… … … 12-17 … … … 0.7 51 … . .… … … 11-17 437 437 50 522 50 21 … …… … … 11-16 … 0.3 54 0.2.z 48.z … . .… … … 11-17 … 2 49 2...z … 27...z … …… … … 13-18 808 … … … … … … …
99 100 98 12-15 7 582 5 117 51 6 302 52 20 . .99 99 99 12-17 3 958 4 368 48 3 864 47 32 494 4696...x 95...x 97...x 11-17 31 22 50 24...z 51...z 32...z ..z ..z… … … 12-15 … 172 48 215 48 … 26 36… … … 12-18 77 17 41 22.z 43.z … ..z ..z… … … 12-17 5 802 … … 4 530 51 15 703 45… … … 12-17 147 … … 75.z 49.z … 3.z 40.z… … … 11-15 … … … 0.2...y 45...y … ..y …
62 62 62 11-16 15 15 50 14 48 … … …… … … 12-17 … … … … … … … …
64 63 65 12-18 36 9 45 14.y 45.y … 3.y 30.y
93 … … 11-17 … 7 401 47 9 975 49 10...z 500 54
98.y 100.y 96.y 12-16 … 1 53 1 52 . … …… … … 12-16 … … … … … … … …
93.y 92.y 94.y 12-17 4 138 3 722 51 3 476.z 52.z 28.z 1 234.z 54.z
99 … … 12-16 7 6 51 7 50 92 1 3899 99 99 11-16 36 27 49 33 50 28 . .99 100 97 11-15 20 22 51 21 50 5 . .86 85 88 11-16 38 22 51 30 51 71 2 4095 … … 11-17 … … … 5 51 42 . .90...x 90...x 90...x 12-17 1 264 830 48 1 043 48 13 . .81.x … … 11-17 23 439 24 983 52 24 863.z 52.z 12.y 754.z 50.z
94 100 89 12-16 … 2 47 2 53 11 0.3 58… … … 11-16 … 2 48 3 49 30 . .97.y 96.y 98.y 12-17 1 792 1 305 50 1 634 50 54 395 4799 99 100 11-16 5 453 3 589 52 4 484 52 24 254 5498 100 97 12-16 436 235 51 374 50 10 56 5098 98 99 12-17 991 740 50 928 49 . 271 4493 … … 12-16 … 7 57 7 50 32 0.2 6784 81 87 12-17 1 150 611 55 794 54 23 35 6178 80 75 12-17 1 633 904 50 1 103 50 33 251 5191 91 92 13-18 820 406 49 529 50 18 107 53… … … 12-16 … … … 14.*,z 50.*,z … 0.7.*,z 46.*,z
91 92 90 13-17 1 513 435 45 809 48 74 239 51… … … 12-16 68 66 50 71 50 … … …… … … 12-18 1 512 … … … … … … …
71 68 74 12-16 854 … … 635.z 56.z 33.z 241.z 58.z
99...y 100...y 97...y 12-16 285 231 50 246.z 50.z 6.z –.z –.z
94 95 93 12-17 12 486 8 722 50 10 883 51 15 1 602 56… … … 12-16 … 0.3 47 0.3 46 . . .… … … 12-17 17 15 54 … … … … …… … … 12-16 681 321 54 448 53 26 23 54
ChinaCook Islands3
DPR KoreaFijiIndonesiaJapanKiribati3
Lao PDRMacao, ChinaMalaysiaMarshall Islands3
MicronesiaMyanmarNauruNew ZealandNiue3
Palau3
Papua New GuineaPhilippinesRepublic of KoreaSamoaSingaporeSolomon IslandsThailandTimor-LesteTokelau3
TongaTuvaluVanuatuViet Nam
AnguillaAntigua and BarbudaArgentinaArubaBahamasBarbadosBelizeBermuda3
BoliviaBrazilBritish Virgin Islands3
Cayman Islands6
ChileColombiaCosta RicaCubaDominica3
Dominican RepublicEcuadorEl SalvadorGrenada3
GuatemalaGuyanaHaitiHondurasJamaicaMexicoMontserratNetherlands AntillesNicaragua
Table 8 (continued)
TRANSITION FROM PRIMARY TO SECONDARYGENERAL EDUCATION (%)
ENROLMENT INSECONDARY EDUCATION
Enrolment in privateinstitutions as %
of total enrolmentTotal enrolment
Enrolment in technical and
vocational education
Country or territory(000)Total % F
(000)Total % F
(000)Total % FTotal Male Female 2006 2005
545556575859606162636465666768697071727374757677787980818283
84858687888990919293949596979899
100101102103104105106107108109110111112113
School year ending in2006
School year ending in20061999 2006
School year ending inSchool year ending in2005
Agegroup
School-agepopulation2
(000)
Latin America and the Caribbean
90
02
Education f
or A
ll G
lobal M
onitorin
g R
eport
A N N E X
3 2 6

98 98 98 1.00 55 54 56 1.03 62 … … .… 76 75 76 1.01 … … … .…… … … .… … … … .… 60 58 63 1.08 72...z 71...z 74...z 1.04...z … … … .…… … … .… … … … .… … … … .… … … … .… … … … .…
99 96 102 1.06 63 57 69 1.19 80 76 84 1.11 84 80 88 1.10 79 76 83 1.1078 77 79 1.02 51 51 50 0.97 … … … .… 64 64 64 1.00 59 59 59 1.00
101 101 101 1.00 102 102 102 1.00 102 101 102 1.01 101 101 101 1.00 99 99 99 1.00112...z 109...z 115...z 1.06...z 65...z 57...z 74...z 1.30...z 84 77 91 1.18 88.z 82.z 94.z 1.14.z 68...z 65...z 72...z 1.11...z
52 58 46 0.80 35 39 29 0.75 33 39 27 0.69 43 49 38 0.78 35 38 32 0.86115 118 113 0.96 83 80 86 1.07 76 73 79 1.08 98 98 98 1.00 77 76 79 1.05
90.z 89.z 91.z 1.02.z 53.z 48.z 58.z 1.22.z 65 63 68 1.07 69.z 66.z 72.z 1.10.z 69.z 66.z 72.z 1.10.z
82 82 83 1.01 59 59 60 1.02 72 70 74 1.06 66 66 67 1.02 45 43 47 1.08100 100 99 0.99 … … … .… … … … .… 91 … … .… … … … .…
56 56 56 0.99 35 35 36 1.04 36 36 36 1.01 49 49 49 1.00 46 46 46 1.00… … … .… … … … .… … … … .… 46 42 50 1.19 … … … .…
104 104 103 1.00 141 134 148 1.11 113 110 115 1.05 120 117 123 1.05 … … … .…… … … .… … … … .… 98 93 103 1.10 99.z 96.z 102.z 1.07.z … … … .…
107...z … … .… 97...z 92...z 103...z 1.12...z 101 98 105 1.07 102...z … … .… … … … .…… … … .… … … … .… … … … .… … … … .… … … … .…
86 83 90 1.09 73 66 80 1.22 76 72 79 1.09 83 79 88 1.11 60 55 66 1.21101 106 97 0.91 93 94 92 0.97 100 100 100 1.01 98 100 94 0.94 96 99 93 0.94100...z 100...z 100...z 1.00...z 72...z 66...z 79...z 1.20...z 79 76 84 1.10 81...z 76...z 86...z 1.13...z 66...y 62...y 70...y 1.14...y
… … … .… … … … .… … … … .… … … … .… … … … .…
46.z 49.z 44.z 0.89.z 17.z 19.z 14.z 0.74.z 25 28 21 0.76 30.z 32.z 27.z 0.84.z … … … .…
98 96 100 1.04 59 55 64 1.18 … … … .… 78 75 82 1.09 71 68 75 1.1168.z 67.z 69.z 1.02.z 37.z 38.z 37.z 0.96.z … … … .… 53.z 53.z 53.z 1.00.z … … … .…… … … .… … … … .… … … … .… 101...y 107...y 94...y 0.88...y … … … .…
99 100 99 1.00 81 75 88 1.17 102 97 108 1.11 94 92 96 1.04 60 54 67 1.25… … … .… … … … .… … … … .… … … … .… … … … .…
46...y 46...y 47...y 1.04...y 31...y 39...y 23...y 0.58...y 30 32 28 0.87 40.y 43.y 37.y 0.86.y 38...y 41...y 35...y 0.87...y… … … .… … … … .… 62 65 58 0.90 … … … .… … … … .…
82 83 81 0.98 84 80 88 1.10 … … … .… 83 82 84 1.02 81...z 83...z 79...z 0.96...z… … … .… … … … .… … … … .… … … … .… … … … .…
102.z 99.z 104.z 1.05.z 67.z 61.z 73.z 1.21.z 94 91 97 1.07 84.z 80.z 89.z 1.11.z 78.z 75.z 82.z 1.10.z
119 126 111 0.88 88 80 96 1.20 99 96 103 1.07 100 98 102 1.04 74 70 77 1.1095 95 95 0.99 86 85 88 1.03 79 79 78 0.99 91 90 91 1.01 84 83 85 1.02
100 101 99 0.99 105 100 111 1.11 100 98 103 1.05 102 100 104 1.04 89 88 89 1.0287 85 89 1.05 61 59 64 1.09 64 62 67 1.08 79 77 81 1.06 67 64 69 1.0891 93 89 0.96 79 74 85 1.15 … … … .… 84 82 87 1.06 … … … .…
93 95 91 0.96 77 78 75 0.96 78 80 75 0.93 82 84 81 0.96 71 72 70 0.98114.z 111.z 116.z 1.05.z 95.z 87.z 103.z 1.19.z 99 94 104 1.11 105.z 100.z 111.z 1.10.z 79.z 75.z 83.z 1.11.z
115 110 121 1.10 93 85 101 1.18 99 103 94 0.91 107 100 113 1.13 88...z 82...z 95...z 1.16...z… … … .… … … … .… … … … .… … … … .… … … … .…
99 101 98 0.97 87 85 89 1.05 79 78 81 1.04 91 90 92 1.02 … … … .…
90 87 94 1.08 66 60 72 1.19 70 67 74 1.11 82 78 87 1.11 65 61 68 1.11104 102 105 1.03 60 56 65 1.15 57 55 60 1.09 86 83 89 1.06 … … … .…
96 98 95 0.97 91 89 94 1.07 77 75 80 1.07 94 93 94 1.02 87 86 88 1.03125 134 117 0.87 78 68 88 1.29 90 77 104 1.35 106 107 105 0.98 81 77 85 1.10
79 74 83 1.13 64 57 71 1.25 57 51 63 1.24 69 63 75 1.20 52 47 57 1.2277 78 76 0.98 58 56 60 1.07 57 56 57 1.03 68 67 68 1.02 57 57 58 1.0380 80 80 1.01 48 46 50 1.10 52 52 51 0.98 65 63 66 1.04 54 53 55 1.05
102...z 104...z 100...z 0.96...z 97.z 89.z 104.z 1.17.z … … … .… 100.z 99.z 102.z 1.03.z 79...z 78...z 80...z 1.02...z
58 62 54 0.87 46 46 47 1.01 33 36 30 0.84 53 56 51 0.92 38 40 37 0.92… … … .… 68 68 69 1.01 82 82 83 1.02 105 105 104 0.98 … … … .…… … … .… … … … .… … … … .… … … … .… … … … .…
65.z 60.z 70.z 1.18.z 93.z 75.z 110.z 1.45.z … … … .… 76.z 66.z 86.z 1.30.z … … … .…
93.z 93.z 93.z 1.00.z 77.z 73.z 81.z 1.11.z 88 87 88 1.02 87.z 86.z 88.z 1.03.z 78...z 76...z 80...z 1.05...z
112 109 114 1.04 61 61 61 1.00 70 69 70 1.01 87 86 88 1.02 70 71 70 0.99131 146 116 0.80 115 98 136 1.39 … … … .… 125 127 124 0.98 96.*,y … … .…
… … … .… … … … .… 92 85 99 1.16 … … … .… … … … .…
73 71 76 1.07 54 47 61 1.29 52 47 56 1.19 66 62 70 1.14 43 40 47 1.16
Lowersecondary
(F/M) (F/M)GPITotal Male Female
GROSS ENROLMENT RATIO (GER)IN SECONDARY EDUCATION
(%)
NET ENROLMENT RATIO(NER) IN SECONDARY
EDUCATION (%)
545556575859606162636465666768697071727374757677787980818283
84858687888990919293949596979899100101102103104105106107108109110111112113
School year ending in2006
Uppersecondary
GPITotal Male Female(F/M)
Total secondaryTotal
secondary
GPITotal Male Female(F/M)GPITotal Male Female
(F/M)GPITotal Male Female
School year ending in2006
School year ending in20061999 2006
School year ending in
S TAT I S T I C A L TA B L E S
Ta b l e 8
Latin America and the Caribbean
3 2 7

94 92 95 12-17 368 230 51 257 51 16 48 5089.y 89.y 89.y 12-17 803 425 50 529.z 50.z 21.z 47.z 47.z
95 97 94 12-16 2 921 2 278 48 2 760 50 24 220 6190...x … … 12-16 … … … 5 50 3 . .71...y 63...y 79...y 12-16 16 12 56 14 54 4 0.6 3784.y 79.y 88.y 12-16 13 … … 10.z 55.z 25.z 0.4.z 34.z… … … 12-18 60 … … 47 56 20 20 5193.*,y 94.*,y 92.*,y 12-16 121 117 52 97.*,z 50.*,z 24.*,z 0.9...z 28...z
88.y 84.y 92.y 12-16 … 1 51 2...z 48...z 16...z 0.1...z 48...z
81 76 87 12-17 320 284 53 323 53 11 50 4699 99 99 12-16 2 734 1 439 54 2 105 52 25 115 51
96.x 95.x 96.x 12-17 … … … 4 50 4 0.2 50… … … 10-17 768 748 48 783 48 10 303 44… … … 12-17 749 1 033 51 822 48 68 335 43… … … 12-17 2 592 … … 2 999...y 48...y … … …
100 100 100 12-17 … 63 49 65 49 14 4 17100.y 100.y 99.y 13-18 388 422 50 464 49 14 124 4499 98 99 13-18 387 480 51 433 50 7 125 46… … … 11-17 5 260 5 955 49 5 994 49 25 1 165 4299 99 99 10-18 8 128 8 185 48 8 185 48 8 1 813 4299 100 99 12-17 683 771 49 705 48 6 125 37
100 100 100 13-19 31 32 50 34 49 6 7 4199.y … … 12-16 281 346 50 313 51 0 50 5473 73 72 12-17 665 569 49 613 49 . 124 4399 100 99 11-18 4 519 4 450 49 4 532 48 5 1 676 40… … … 12-18 38 33 50 37 50 19 12 4894.y 93.y 94.y 11-17 38 … … 38.z 49.z 28.z 4.z 33.z… … … 11-17 … 3 51 3.y … 23.y 0.5.y …
98...x 96...x 100...x 12-17 1 204 1 365 48 1 423 48 83.y 657 46100 99 100 13-18 365 378 49 412 49 7.z 134 43… … … 12-17 679 848 51 662 51 16 111 42… … … 11-18 … … … … … … … …… … … 12-17 2 603 3 299 50 3 091 50 28 482 50… … … 13-18 727 946 55 751 49 11 210 44
100 … … 13-19 630 544 47 584 47 7 182 40… … … 11-17 5 470 5 192 49 5 358 49 25 976 49… … … 12-17 26 149 22 445 … 24 552 49 8 . .
… … … 13-18 3 589 … … 651.z 23.z … 9.z 10.z
89.x 86.x 92.x 11-17 24 010 9 912 49 10 355.y 50.y 96.y 168.y 27.y
93 92 94 13-18 92 20 44 45 48 8 0.7 3685.y 87.y 83.y 11-17 167 545 67 090 39 89 462.z 43.z … 742.z 15...z
88 93 83 11-17 11 922 9 727 47 9 942.z 47.z 8...z 876.z 38.z
81 76 85 13-17 39 15 51 33 50 12 … …
77...x 79...x 74...x 10-16 4 596 1 265 40 1 984 45 27.z 22 2272 69 75 10-16 28 057 … … 8 421 42 32 284 3998...y … … 10-17 2 602 … … 2 332...y 49...y … … …
… … … 10-16 2 915 300 43 … … … … …
71 72 70 12-18 1 377 213 31 435...z 35...z 25...z 58...z 43...z
97.y 97.y 98.y 13-17 220 158 51 169.z 51.z … 11.z 38.z
44 45 43 13-19 2 203 173 38 320 41 39 23 4934 37 31 13-19 1 347 … … 192 43 11 12 4933 32 34 12-18 2 941 626 45 698 44 28 118 3984 81 87 12-17 77 … … 61 53 14 2 4247 44 51 12-18 690 … … … … … … …
51...y 56...y 42...y 12-18 1 617 123 21 237...z 25...z … 3...z 41...z
63...y 70...y 55...y 12-18 125 29 44 43...z 43...z 41...z 0.2...z 7...z
PanamaParaguayPeruSaint Kitts and NevisSaint LuciaSaint Vincent/Grenad.SurinameTrinidad and TobagoTurks and Caicos IslandsUruguayVenezuela, B R.
Andorra3
AustriaBelgiumCanadaCyprus3
DenmarkFinlandFrance7
GermanyGreeceIcelandIrelandIsraelItalyLuxembourgMaltaMonaco6
NetherlandsNorwayPortugalSan MarinoSpainSwedenSwitzerlandUnited KingdomUnited States
AfghanistanBangladeshBhutanIndiaIran, Islamic Republic ofMaldivesNepalPakistanSri Lanka
AngolaBeninBotswanaBurkina FasoBurundiCameroonCape VerdeCentral African RepublicChadComoros
Table 8 (continued)
TRANSITION FROM PRIMARY TO SECONDARYGENERAL EDUCATION (%)
ENROLMENT INSECONDARY EDUCATION
Enrolment in privateinstitutions as %
of total enrolmentTotal enrolment
Enrolment in technical and
vocational education
Country or territory(000)Total % F
(000)Total % F
(000)Total % FTotal Male Female 2006 2005
114115116117118119120121122123124
125126127128129130131132133134135136137138139140141142143144145146147148149150
151152153154155156157158159
160161162163164165166167168169
School year ending in2006
School year ending in20061999 2006
School year ending inSchool year ending in2005
Agegroup
School-agepopulation2
(000)
North America and Western Europe
South and West Asia
Sub-Saharan Africa
90
02
Education f
or A
ll G
lobal M
onitorin
g R
eport
A N N E X
3 2 8

84 83 86 1.03 55 51 60 1.17 67 65 69 1.07 70 67 73 1.09 64 61 67 1.1179.z 79.z 80.z 1.01.z 53.z 52.z 55.z 1.05.z 58 57 59 1.04 66.z 66.z 67.z 1.03.z 57.z 56.z 59.z 1.06.z
109 107 112 1.05 72 73 71 0.97 84 87 81 0.94 94 93 96 1.03 72 72 72 1.00… … … .… … … … .… … … … .… 105 110 100 0.91 65 70 61 0.8794 87 100 1.15 78 69 87 1.26 71 62 79 1.29 87 80 95 1.19 73...z 65...z 80...z 1.24...z
90.z 83.z 96.z 1.16.z 54.z 44.z 64.z 1.46.z … … … .… 75.z 67.z 83.z 1.24.z 64...z 57...z 71...z 1.23...z
96 89 105 1.18 54 36 72 1.97 … … … .… 77 66 90 1.37 68...z 57...z 79...z 1.38...z
79.*,z 78.*,z 80.*,z 1.03.*,z 73.*,z 70.*,z 76.*,z 1.07.*,z 77 74 81 1.10 76.*,z 75.*,z 78.*,z 1.05.*,z 65...z 64...z 66...z 1.04...z
86...z 89...z 84...z 0.95...z 85...z 89...z 82...z 0.92...z … … … .… 86...z 89...z 83...z 0.94...z 70...z 72...z 69...z 0.96...z
109 105 113 1.08 93 82 104 1.26 92 84 99 1.17 101 94 109 1.16 … … … .…
87 84 91 1.08 61 55 68 1.23 56 51 62 1.22 77 73 82 1.12 66 62 71 1.14
91 92 91 0.99 72 65 78 1.20 … … … .… 85 83 87 1.04 74 73 75 1.03103 103 102 0.99 101 104 98 0.94 99 101 97 0.96 102 104 100 0.96 … … … .…
114 116 111 0.95 108 109 106 0.97 143 138 148 1.07 110 111 108 0.97 87 89 85 0.96100...y 101...y 100...y 0.99...y 134...y 137...y 132...y 0.97...y … … … .… 117...y 119...y 116...y 0.97...y … … … .…
96 96 97 1.00 97 95 98 1.03 93 92 95 1.03 97 96 97 1.02 94 93 95 1.02116 115 117 1.02 123 121 126 1.04 125 121 128 1.06 120 118 121 1.03 89 88 90 1.03102 102 102 1.00 121 117 126 1.08 121 116 126 1.09 112 109 114 1.04 96 96 96 1.00112 113 112 0.99 116 115 117 1.02 111 111 111 1.00 114 114 114 1.00 99 98 100 1.02101 101 101 1.00 100 103 96 0.94 98 99 97 0.98 101 102 99 0.98 … … … .…
101 103 100 0.97 105 106 104 0.98 90 89 92 1.04 103 104 102 0.97 92 92 93 1.01102 103 101 0.98 116 113 120 1.06 110 107 113 1.06 110 108 111 1.03 90 89 91 1.02107 105 108 1.03 119 112 126 1.13 107 104 111 1.06 112 108 116 1.07 87 85 90 1.05
76 76 76 1.00 109 109 108 0.99 90 90 90 1.00 92 93 92 0.99 89 88 89 1.00104 106 102 0.97 98 98 98 1.00 92 92 91 0.99 100 101 100 0.99 94 93 94 1.01107 107 108 1.01 88 85 91 1.08 98 96 99 1.04 96 94 98 1.04 84 82 86 1.05104.z 103.z 105.z 1.03.z 89.z 92.z 87.z 0.94.z … … … .… 99.z 99.z 100.z 1.00.z 87...z 84...z 90...z 1.07...z… … … .… … … … .… … … … .… … … … .… … … … .…
128 131 125 0.96 108 108 108 1.01 124 126 121 0.96 118 119 117 0.98 88 88 89 1.01100 100 101 1.00 126 127 125 0.99 120 118 121 1.02 113 113 112 0.99 96 96 97 1.01114 114 115 1.01 81 74 89 1.20 106 102 110 1.08 97 94 102 1.09 82 78 86 1.10… … … .… … … … .… … … … .… … … … .… … … … .…
116 116 117 1.00 123 114 133 1.17 108 105 112 1.07 119 115 122 1.06 94 92 96 1.03104 105 104 0.99 102 103 102 1.00 157 137 177 1.29 103 104 103 0.99 99 99 99 1.00109 108 110 1.03 80 85 75 0.87 94 98 90 0.92 93 95 90 0.95 82 84 80 0.96
99 99 100 1.01 97 95 99 1.04 101 101 101 1.00 98 97 99 1.03 92 90 94 1.04100 101 99 0.99 88 88 88 1.00 95 … … .… 94 94 94 0.99 88 88 88 1.00
25.z 37.z 13.z 0.35.z 12.z 18.z 5.z 0.28.z … … … .… 19.z 28.z 9.z 0.33.z … … … .…
60.y 57.y 63.y 1.10.y 31.y 32.y 30.y 0.94.y 45 45 45 1.01 44.y 43.y 45.y 1.03.y 41.y 40.y 42.y 1.04.y
59 60 58 0.97 29 34 24 0.70 37 41 33 0.81 49 51 46 0.91 38 38 39 1.0171.z 75.z 66.z 0.88.z 41.z 46.z 35.z 0.75.z 44 52 36 0.71 54.z 59.z 49.z 0.82.z … … … .…
86.z 90.z 82.z 0.91.z 77.z 79.z 76.z 0.96.z 78 81 75 0.93 81.z 83.z 78.z 0.94.z 77.z 79.z 75.z 0.94.z
124 117 132 1.13 … … … .… 43 42 44 1.07 83 80 86 1.07 67 64 70 1.0966 70 63 0.89 24 26 22 0.87 34 40 28 0.70 43 46 40 0.89 … … … .…
42 47 36 0.76 21 24 19 0.80 … … … .… 30 34 26 0.78 30 33 26 0.77103...y 100...y 106...y 1.05...y 73...y 74...y 72...y 0.97...y … … … .… 87...y 86...y 88...y 1.02...y … … … .…
… … … .… … … … .… 13 15 11 0.76 … … … .… … … … .…
41...z 51...z 30...z 0.58...z 20...z 27...z 14...z 0.52...z 19 26 12 0.47 32...z 41...z 23...z 0.57...z … … … .…
89.z 86.z 92.z 1.07.z 58.z 58.z 58.z 1.00.z 74 72 76 1.07 76.z 75.z 78.z 1.05.z 56...z 52...z 60...z 1.14...z
19 22 17 0.75 7 9 5 0.61 10 12 7 0.62 15 17 12 0.72 12 14 10 0.7119 22 17 0.77 7 9 6 0.64 … … … .… 14 16 12 0.74 … … … .…
30 33 26 0.80 15 17 13 0.78 25 27 23 0.83 24 26 21 0.79 … … … .…
99 93 104 1.11 61 55 67 1.22 … … … .… 80 75 86 1.15 59 56 63 1.1315.* 18.* 12.* 0.68.* … … … .… … … … .… … … … .… … … … .…
19...z 28...z 10...z 0.36...z 10...z 15...z 4...z 0.26...z 10 16 4 0.26 15...z 23...z 8...z 0.33...z … … … .…
41...z 47...z 35...z 0.75...z 27...z 30...z 24...z 0.78...z 25 28 22 0.81 35...z 40...z 30...z 0.76...z … … … .…
Lowersecondary
(F/M) (F/M)GPITotal Male Female
GROSS ENROLMENT RATIO (GER)IN SECONDARY EDUCATION
(%)
NET ENROLMENT RATIO(NER) IN SECONDARY
EDUCATION (%)
114115116117118119120121122123124
125126127128129130131132133134135136137138139140141142143144145146147148149150
151152153154155156157158159
160161162163164165166167168169
School year ending in2006
Uppersecondary
GPITotal Male Female(F/M)
Total secondaryTotal
secondary
GPITotal Male Female(F/M)GPITotal Male Female
(F/M)GPITotal Male Female
School year ending in2006
School year ending in20061999 2006
School year ending in
S TAT I S T I C A L TA B L E S
Ta b l e 8
North America and Western Europe
South and West Asia
Sub-Saharan Africa
3 2 9

58...y 58...y 58...y 12-18 572 … … 235...y 46...y 22...y 43...y 48...y… … … 12-18 3 169 592 35 … … … … …… … … 12-17 8 205 1 235 34 … … … … …… … … 12-18 74 20 27 … … … … …
83 86 79 12-18 733 115 41 228 38 5 2 4389 90 87 13-18 10 911 1 060 40 3 430 40 … 191 44… … … 12-18 209 87 46 … … … … …… … … 13-18 202 50 39 90 47 39.y – –… … … 12-17 3 171 1 024 44 1 581 46 13 32 5071 75 66 13-19 1 384 172 26 483 34 16 4 14… … … 13-17 178 … … … … … … …… … … 12-17 5 140 1 822 49 2 584 48 6...z 23 6268 68 68 13-17 254 74 57 94 56 3 2 53… … … 12-17 482 114 39 … … … … …
55 56 54 11-17 3 072 … … 730 49 43 32 3472 74 71 12-17 1 946 556 41 565 45 10 . .57 63 48 13-18 1 635 218 34 463 38 24 51 4167 61 72 11-17 146 104 49 128...z 49...z … 18...z 31...z
54 52 56 13-17 2 368 103 41 367 42 13 26 3175 72 77 13-17 268 116 53 153 53 5 . .60 61 58 13-19 1 939 105 38 217 39 10 6 48… … … 12-17 20 204 3 845 47 6 398.z 45.z … –.z –.z… … … 13-18 1 502 105 51 204...z 48...z … 73...z 48...z
55 53 56 13-17 18 … … 8 51 –.z 0.1 1850 52 48 13-19 1 883 237 39 447 43 23.z … …
95.x 93.x 97.x 12-16 … 8 50 8 50 6 . .… … … 12-17 738 … … 240 41 7 12 60… … … 13-17 876 … … … … … … …
90.x 89.x 91.x 14-18 4 886 4 239 53 4 593.y 52.y 3.y 276.y 40.y
88.y 88.y 89.y 13-17 153 62 50 71.z 50.z ..z ..z ..z
65 68 61 12-18 1 014 232 29 399...z 34...z 28...z 22...z 18...z
43 42 43 13-18 4 294 318 40 760...z 44...z 45.y 32...z 32...z
46 47 45 14-19 5 252 271 45 … … … … …
54 49 60 14-18 1 377 237 43 409...z 45...z 4.y 8...z 8...z… … … 13-18 2 080 835 47 831 48 … . .
93 92 94 … 782 637 437 287 47 513 261 47 11 51 575 46
100 100 99 … 30 758 31 633 49 27 229 48 0.6 3 389 3999 … … … 83 553 84 564 49 84 414 49 8 13 685 4388 93 83 … 668 325 321 090 46 401 618 47 14 34 502 47
92 90 93 … 41 613 22 682 46 28 208 47 5 3 449 4398 98 99 … 38 380 39 582 49 33 661 48 1 6 540 3999 99 99 … 11 868 9 270 49 10 853 48 0.9 1 098 45… … … … 216 003 133 770 47 162 445 48 19 21 564 4991 … … … 212 747 130 498 47 158 963 48 13 20 419 49… … … … 3 256 3 272 49 3 482 47 … 1 145 4493 … … … 66 038 52 953 51 59 033 51 22 5 964 5394 … … … 2 239 1 151 50 1 270 50 20 40 4992 92 92 … 63 799 51 802 51 57 764 51 23 5 924 5399 99 99 … 62 429 60 661 49 62 899 49 10 8 619 4387 90 83 … 242 452 97 783 41 123 089 44 19 2 336 3162 66 57 … 103 854 20 585 45 33 071 44 13 2 006 41
CongoCôte d’IvoireD. R. CongoEquatorial GuineaEritreaEthiopiaGabonGambiaGhanaGuineaGuinea-BissauKenyaLesothoLiberiaMadagascarMalawiMaliMauritiusMozambiqueNamibiaNigerNigeriaRwandaSao Tome and PrincipeSenegalSeychelles3
Sierra LeoneSomaliaSouth AfricaSwazilandTogoUgandaUnited Republic of TanzaniaZambiaZimbabwe
World
Countries in transitionDeveloped countriesDeveloping countries
Arab StatesCentral and Eastern EuropeCentral AsiaEast Asia and the Pacific
East AsiaPacific
Latin America/CaribbeanCaribbeanLatin America
N. America/W. EuropeSouth and West AsiaSub-Saharan Africa
Table 8 (continued)
TRANSITION FROM PRIMARY TO SECONDARYGENERAL EDUCATION (%)
ENROLMENT INSECONDARY EDUCATION
Enrolment in privateinstitutions as %
of total enrolmentTotal enrolment
Enrolment in technical and
vocational education
Country or territory(000)Total % F
(000)Total % F
(000)Total % FTotal Male Female 2006 2005
170171172173174175176177178179180181182183184185186187188189190191192193194195196197198199200201202203204
I
IIIIIIV
VVI
VIIVIII
IXX
XIXII
XIIIXIVXV
XVI
School year ending in2006
School year ending in20061999 2006
School year ending inSchool year ending in2005
Agegroup
School-agepopulation2
(000)
90
02
Education f
or A
ll G
lobal M
onitorin
g R
eport
A N N E X
1. Refers to lower and upper secondary education (ISCED levels 2 and 3).2. Data are for 2005 except for countries with a calendar school year,in which case data are for 2006.3. National population data were used to calculate enrolment ratios.
4. Enrolment and population data exclude Transnistria.5. Enrolment data for upper secondary education include adult education (students over age 25),particularly in pre-vocational/vocational programmes, in which males are in the majority. This explains the high level of GER and the relatively low GPI.
Median Sum Sum % F Sum % F Sum % FMedian
3 3 0

57.y 60.y 53.y 0.88.y 23...y 27...y 19...y 0.69...y … … … .… 43...y 47...y 39...y 0.84...y … … … .…… … … .… … … … .… 22 28 15 0.54 … … … .… … … … .…… … … .… … … … .… 18 24 12 0.52 … … … .… … … … .…… … … .… … … … .… 33 48 18 0.37 … … … .… … … … .…
46 56 36 0.63 19 25 14 0.54 21 25 17 0.69 31 39 23 0.60 25 30 20 0.6739 47 32 0.67 11 13 8 0.64 12 15 10 0.68 30 36 24 0.67 24 29 19 0.64… … … .… … … … .… 49 53 46 0.86 … … … .… … … … .…
60 62 59 0.95 28 31 25 0.80 32 38 25 0.66 45 47 43 0.90 38 40 37 0.9469 72 66 0.91 28 31 26 0.82 37 41 33 0.80 49 52 46 0.88 45 47 43 0.9143 54 31 0.58 23 32 13 0.42 14 21 8 0.37 35 45 24 0.53 28 35 20 0.57… … … .… … … … .… … … … .… … … … .… … … … .…
89 91 87 0.96 31 32 29 0.91 38 39 37 0.96 50 52 49 0.93 42 43 42 0.9745 40 51 1.29 24 22 27 1.22 31 26 35 1.35 37 33 41 1.27 24 19 29 1.55… … … .… … … … .… 29 35 23 0.65 … … … .… … … … .…
32 33 32 0.96 11 12 11 0.89 … … … .… 24 24 23 0.95 17 17 18 1.0439 42 36 0.87 17 20 15 0.77 36 42 30 0.70 29 32 27 0.84 24 25 23 0.9339 48 30 0.63 17 21 12 0.56 16 22 11 0.52 28 35 21 0.61 … … … .…
99.z 98.z 100.z 1.02.z 80...z 81...z 78...z 0.96...z 76 76 75 0.98 88...z 89...z 88...z 0.99...z 82...z 81...z 82...z 1.02...z
22 25 18 0.72 5 6 4 0.66 5 6 4 0.69 16 18 13 0.72 4 4 4 0.8974 68 79 1.16 30 29 32 1.12 55 52 58 1.12 57 53 61 1.15 35 30 40 1.3115 18 12 0.65 5 6 4 0.61 7 9 5 0.60 11 14 9 0.63 9 12 7 0.6335.z 38.z 32.z 0.84.z 30.z 33.z 26.z 0.79.z 23 24 22 0.89 32.z 36.z 29.z 0.82.z 26.z 28.z 23.z 0.84.z
18...z 19...z 17...z 0.89...z 10...z 10...z 9...z 0.89...z 9 10 9 0.99 13...z 14...z 13...z 0.89...z … … … .…
70 65 74 1.13 28 28 28 0.97 … … … .… 46 44 47 1.07 33.z 31.z 34.z 1.11.z
32 36 28 0.78 12 15 10 0.67 15 19 12 0.64 24 27 20 0.76 20 23 18 0.76116 111 121 1.09 106 96 116 1.21 113 111 115 1.04 112 105 119 1.13 94 … … .…
46 54 37 0.69 17 20 14 0.69 … … … .… 32 37 26 0.69 23 27 19 0.71… … … .… … … … .… … … … .… … … … .… … … … .…
98.y 96.y 100.y 1.05.y 92.y 89.y 96.y 1.08.y 89 83 94 1.13 95.y 92.y 98.y 1.07.y … … … .…
56.z 55.z 56.z 1.02.z 33.z 34.z 32.z 0.94.z 45 45 45 1.00 47.z 47.z 47.z 1.00.z 32.z 29.z 35.z 1.21.z
54.z 69.z 39.z 0.57.z 20...z 31...z 10...z 0.31...z 28 40 16 0.40 40...z 54...z 27...z 0.51...z … … … .…
22...z 24...z 20...z 0.84...z 10...z 12...z 8...z 0.68...z 10 12 8 0.66 18...z 20...z 16...z 0.81...z 16 17 15 0.91… … … .… … … … .… 6 7 5 0.82 … … … .… … … … .…
47.z 50.z 44.z 0.87.z 18...z 21...z 16...z 0.73...z 20 23 18 0.77 30...z 33...z 27...z 0.82...z 28...z 31...z 25...z 0.80...z
58 59 58 0.99 31 33 28 0.87 43 46 40 0.88 40 41 38 0.93 37 38 36 0.96
78 80 76 0.95 53 54 51 0.95 60 62 57 0.92 66 67 64 0.95 58 59 57 0.96
89 89 88 0.99 88 91 86 0.94 90 90 91 1.01 89 90 87 0.97 82 83 81 0.98103 104 103 0.99 99 99 99 1.00 100 100 100 1.00 101 101 101 1.00 91 90 91 1.01
75 77 72 0.94 46 48 45 0.93 52 55 49 0.89 60 62 58 0.94 53 54 51 0.95
81 85 77 0.90 54 55 53 0.97 60 63 57 0.89 68 70 65 0.92 59 61 57 0.9489 90 89 0.98 85 88 83 0.94 87 88 87 0.98 88 89 86 0.96 81 82 80 0.9795 96 93 0.97 84 87 81 0.93 83 84 82 0.98 91 93 90 0.96 83 85 82 0.9792 92 92 1.00 58 58 59 1.03 65 66 64 0.96 75 75 76 1.01 69 69 70 1.0192 92 92 1.00 57 57 58 1.03 64 65 63 0.96 75 74 75 1.01 69 69 70 1.0289 91 88 0.97 139 143 135 0.94 111 111 111 0.99 107 109 104 0.96 66 66 65 0.99
102 100 104 1.04 74 70 79 1.12 80 78 83 1.07 89 86 93 1.07 70 68 73 1.0772 71 72 1.02 43 42 44 1.05 53 53 54 1.03 57 56 57 1.03 40 39 42 1.07
103 101 105 1.05 76 71 80 1.13 81 78 84 1.07 91 87 94 1.07 71 69 74 1.07103 104 103 0.99 98 98 98 1.00 100 101 100 0.99 101 101 101 1.00 91 90 91 1.01
66 70 62 0.89 39 43 34 0.80 45 51 38 0.75 51 55 46 0.85 45 48 41 0.8638 43 34 0.79 24 27 21 0.80 24 26 21 0.82 32 35 28 0.80 25 27 23 0.83
Lowersecondary
(F/M) (F/M)GPITotal Male Female
GROSS ENROLMENT RATIO (GER)IN SECONDARY EDUCATION
(%)
NET ENROLMENT RATIO(NER) IN SECONDARY
EDUCATION (%)
170171172173174175176177178179180181182183184185186187188189190191192193194195196197198199200201202203204
I
IIIIIIV
VVIVIIVIIIIXXXIXIIXIIIXIVXVXVI
School year ending in2006
Uppersecondary
GPITotal Male Female(F/M)
Total secondaryTotal
secondary
GPITotal Male Female(F/M)GPITotal Male Female
(F/M)GPITotal Male Female
School year ending in2006
School year ending in20061999 2006
School year ending in
S TAT I S T I C A L TA B L E S
Ta b l e 8
Weighted average Weighted average
3 3 1
6. Enrolment ratios were not calculated due tolack of United Nations population data by age.7. Data include French overseas departmentsand territories (DOM-TOM).
Data in italic are UIS estimates.Data in bold are for the school year ending in 2006for transition rates, and the school year ending in2007 for enrolment and enrolment ratios.
(z) Data are for the school year ending in 2005.(y) Data are for the school year ending in 2004.(x) Data are for the school year ending in 2003.(*) National estimate.

AlgeriaBahrainDjiboutiEgyptIraqJordanKuwaitLebanonLibyan Arab JamahiriyaMauritaniaMoroccoOmanPalestinian A. T.QatarSaudi ArabiaSudanSyrian Arab RepublicTunisiaUnited Arab EmiratesYemen
AlbaniaBelarusBosnia and HerzegovinaBulgariaCroatiaCzech RepublicEstoniaHungaryLatviaLithuaniaMontenegroPolandRepublic of Moldova2,3
RomaniaRussian FederationSerbiaSlovakiaSloveniaTFYR MacedoniaTurkeyUkraine
ArmeniaAzerbaijanGeorgiaKazakhstanKyrgyzstanMongoliaTajikistanTurkmenistanUzbekistan
AustraliaBrunei DarussalamCambodiaChinaCook Islands
456 … 818 55 14 … … .… 22 19 24 1.2611 60 18 68 22 16 28 1.76 32 19 47 2.46
0.2 51 2 40 0.3 0.3 0.3 1.05 2 3 2 0.682 447 … 2 594...z … 37 … … .… 35...z … … .…
272 34 425...z 36...z 11 15 8 0.54 16...z 20...z 12...z 0.59...z… … 220 52 … … … .… 39 37 41 1.1132 68 38 65 23 14 33 2.40 18 11 26 2.32
113 50 173 53 33 33 33 1.00 48 45 51 1.16308 49 … … 50 51 50 0.98 … … … .…
13 … 10 26 5 … … .… 4 5 2 0.36273 42 385 45 9 11 8 0.71 12 13 11 0.81… … 68 50 … … … .… 25 25 26 1.0466 46 169 54 25 26 23 0.89 48 44 53 1.229 72 10 68 23 11 41 3.82 19 10 33 3.41
350 57 615 59 20 16 24 1.50 29 23 35 1.50201 47 … … 6 6 6 0.92 … … … .…… … … … … … … .… … … … .…
157 48 325 58 17 17 17 0.97 31 26 37 1.4240 67 … … 18 10 29 2.97 … … … .…
164 21 209 26 10 16 4 0.28 9 14 5 0.37
39 60 53.y 62.y 15 12 17 1.43 19.y 15.y 23.y 1.60.y
387 56 544 57 51 44 58 1.30 66 56 76 1.37… … … … … … … .… … … … .…
270 59 243 53 45 36 55 1.54 46 41 50 1.2196 53 137 54 31 28 33 1.16 44 40 49 1.23
231 50 338 54 26 26 27 1.03 50 45 55 1.2249 58 68 62 50 42 59 1.40 65 49 82 1.67
279 54 439 58 33 30 37 1.24 69 56 82 1.4782 62 131 63 50 38 63 1.65 74 53 95 1.80
107 60 199 60 44 35 53 1.53 76 60 93 1.56… … … … … … … .… … … … .…
1 399 57 2 146 57 45 38 52 1.38 66 55 77 1.40104 56 144 57 33 29 37 1.29 39 33 46 1.38408 51 835 55 22 21 23 1.09 52 46 59 1.30… … 9 167 57 … … … .… 72 61 83 1.36… … … … … … … .… … … … .…
123 52 198 58 26 25 28 1.11 45 38 53 1.4279 56 115 58 53 45 61 1.36 83 68 99 1.4635 55 49.z 57.z 22 19 24 1.28 30.z 25.z 35.z 1.38.z
1 465 40 2 343 42 22 25 17 0.68 35 39 30 0.751 737 53 2 740 54.* 47 44 50 1.15 73 65.* 81.* 1.23.*
61 54 99 55 24 22 25 1.11 32 29 34 1.18108 39 132 47 15 19 12 0.64 15 15 14 0.94130 52 145 52 36 35 37 1.07 38 36 41 1.13324 53 773 58 24 23 26 1.15 51 42 61 1.44131 51 233 56 29 28 30 1.04 43 38 48 1.27
65 65 138 61 26 18 34 1.88 47 37 58 1.5776 25 133 27 14 20 7 0.35 19 27 10 0.37… … … … … … … .… … … … .…
296 45 289 41 13 14 12 0.82 10 11 8 0.71
846 54 1 040 55 65 59 72 1.22 73 64 82 1.283.7 66 5 66 12 8 16 1.98 15 10 20 1.99
… … 76 33 … … … .… 5 6 3 0.506 366 … 23 361 47 6 … … .… 22 22 21 0.98
. . . . . . . . . . . .
90
02
Education f
or A
ll G
lobal M
onitorin
g R
eport
A N N E X
Total students enrolled(000)
Gross enrolment ratio (GER)(%)
GPI
1999
School year ending in
(F/M)FemaleMaleTotalGPI
2006
(F/M)FemaleMaleTotal
ENROLMENT IN TERTIARY EDUCATION
Total % F
1999 2006
School year ending in
(000)Total % F(000)
Table 9A Participation in tertiary education
Country or territory
Arab States
Central and Eastern Europe
Central Asia
East Asia and the Pacific
3 3 2

82 13 5 58 36 45 … … 6 …
92 8 0 70 51 – … … 0.7 4968 32 . 37 46 . – – – –… … … … … … … … … …
78...z 17...z 5...z 39...z 22...z 35...z … … 4.y 19.y
87 12 1 51 61 31 … … 22 2897 . 3 66 . 51 … … … …
84 15 1 54 49 38 16 … 17 54… … … … … … … … … …
97 3 . 26 12 . … … 0.2...y …
75 19 6 46 47 33 4 16 6 2680 20 1 51 46 25 … … 0.2 …
90 10 . 54 47 . 3 29 – –97...z 3...z 1.z … … … … … 2.z 61.z
84 14 2 65 21 40 6 25 13.z 33.z… … … … … … … … … …… … … … … … … … … …… … … … … … 3.j … 2.y …… … … … … … … … … …… … … … … … … … … …
99.y 1.y ./.1,y 62.y 73.y ./.1,y 0.8 27 0.5.y 25.y
71 28 1 58 54 54 3 … 4 …… … … … … … … … … …
88 10 2 54 54 50 8 42 9 4166 33 1 55 52 47 0.5.j … 3 …
84 9 7 53 68 38 5 41 21 5163 34 3 62 62 53 0.8 58 1 5692 6 2 58 66 47 9.j 54 14 4885 14 1 64 60 60 2.j … 2.z …
70 29 1 60 59 57 0.5 22 0.9.z 48.z… … … … … … … … … …
97 1 2 57 80 49 6.j 48 11 5289 10 1 58 56 63 2 … 2 3594 3 3 56 58 48 13 40 9 …
77 21 2 58 53 43 … … 77 …… … … … … … … … … …
93 1 5 58 67 43 … … 2 4654 45 1 62 54 46 0.7 40 1 5494.z 6.z –.z 57.z 50.z –.z 0.3 43 0.3.z 49.z
69 29 1 43 41 39 18.v 28 19 3280 18 1 55.* 52.* 54.* 18 … 27 …
98 . 2 55 . 37 … … 4 4299 . 1 48 . 27 2 35 3 2099 . 1 52 . 63 0.3 … 0.1 …
99 . 1 58 . 66 8 … 12 …
99 . 1 56 . 60 1 51 27 6295 3 1 61 66 58 0.3 50 1 5099 . 1 27 . 36 5 25 1 31… … … … … … … … … …
99 . 1 41 . 47 … … 0.1 …
81 15 4 55 53 50 117 49 207.z 46.z
62 38 0 69 62 19 0.1 53 0.2 54100 . – 33 . – 0.02 25 0.1 10… 46 … … 49 … … … 36 45
. . . . . . . . . .
S TAT I S T I C A L TA B L E S
Ta b l e 9 A
Total students
2006
School year ending in
Level 5A Level 5B Level 6
Percentage of females at each level
2006
School year ending in
Level 5A Level 5B Level 6
DISTRIBUTION OF STUDENTS BY ISCED LEVEL (%) FOREIGN STUDENTS
AlgeriaBahrainDjibouti
EgyptIraq
JordanKuwait
LebanonLibyan Arab Jamahiriya
MauritaniaMorocco
OmanPalestinian A. T.
QatarSaudi Arabia
SudanSyrian Arab Republic
TunisiaUnited Arab Emirates
Yemen
AlbaniaBelarus
Bosnia and HerzegovinaBulgariaCroatia
Czech RepublicEstonia
HungaryLatvia
LithuaniaMontenegro
PolandRepublic of Moldova 2,3
RomaniaRussian Federation
SerbiaSlovakiaSlovenia
TFYR MacedoniaTurkey
Ukraine
ArmeniaAzerbaijan
GeorgiaKazakhstanKyrgyzstan
MongoliaTajikistan
TurkmenistanUzbekistan
AustraliaBrunei Darussalam
CambodiaChina
Cook Islands
Country or territoryTotal % F
1999 2006
School year ending in
(000)Total % F(000)
Arab States
Central and Eastern Europe
Central Asia
East Asia and the Pacific
3 3 3

DPR KoreaFijiIndonesiaJapanKiribatiLao RDPMacao, ChinaMalaysiaMarshall IslandsMicronesiaMyanmarNauruNew ZealandNiuePalauPapua New GuineaPhilippinesRepublic of KoreaSamoaSingaporeSolomon IslandsThailandTimor-LesteTokelauTongaTuvaluVanuatuViet Nam
AnguillaAntigua and BarbudaArgentinaArubaBahamasBarbadosBelizeBermudaBoliviaBrazilBritish Virgin Islands2
Cayman Islands4
ChileColombiaCosta RicaCubaDominicaDominican RepublicEcuadorEl SalvadorGrenadaGuatemalaGuyanaHaitiHondurasJamaicaMexicoMontserratNetherlands AntillesNicaraguaPanamaParaguayPeru
… … … … … … … .… … … … .…… … 13...z 53...z … … … .… 15...z 14...z 17...z 1.20...z… … 3 657 … … … … .… 17 … … .…
3 941 45 4 085 46 45 49 41 0.85 57 61 54 0.88. . . . . . . . . . . .
12 32 57 40 2 3 2 0.49 9 11 7 0.687 46 23 46 28 32 24 0.76 57 64 51 0.81
473 50 697.z 56.z 23 23 23 1.02 29.z 25.z 32.z 1.29.z… … … … … … … .… … … … .…
2 … … … 14 … … .… … … … .…
335 61 … … 7 6 9 1.61 … … … .…. . . . . . . . . . . .
167 59 238 59 64 52 77 1.46 80 64 96 1.51. . . . . . . . . . . .
… … … … … … … .… … … … .…
10 35 … … 2 3 1 0.55 … … … .…
2 209 55 2 484 54 29 25 32 1.26 28 25 32 1.242 636 35 3 204 37 66 83 47 0.57 93 111 72 0.65
1.9 47 … … 11 11 12 1.04 … … … .…… … … … … … … .… … … … .…
. … . . . . . . . . . .1 814 53 2 339 51 33 31 36 1.16 46 44 47 1.07
… … … … … … … .… … … … .…. . . . . . . . . . . .
0.4 55 0.7...y 60...y 3 3 4 1.29 6...y 5...y 8...y 1.68...y
. … . . . . . . . . . .0.6 … 1...y 36...y 4 … … .… 5...y 6...y 4...y 0.59...y
810 43 1 355.z 41.z 11 12 9 0.76 … … … .…
. . 0.05 83 . . . . 5 2 8 4.86
. . ..y ..y . . . . ..y ..y ..y ..y
1 601 62 2 083.z 59.z 49 37 60 1.63 64.z 52.z 76.z 1.45.z
1.4 54 2 60 27 25 29 1.19 32 25 39 1.56… … … … … … … .… … … … .…
7 69 … … 33 20 45 2.28 … … … .…… … 0.7.y 70.y … … … .… 3.y 2.y 4.y 2.43.y… … 0.9 71 … … … .… … … … .…
253 … 346...y … 33 … … .… 41...y … … .…
2 457 … 4 572.z 56.z 14 13 16 1.26 25.z 22.z 29.z 1.30.z
0.9 70 1...z 69...z 60 36 86 2.40 75...z 46...z 106...z 2.28...z
0.4 74 0.6 72 … … … .… … … … .…
451 47 661 49 38 39 36 0.91 47 47 46 1.00878 52 1 315 51 22 21 23 1.11 31 30 32 1.09
59 53 111...z 54...z 16 15 17 1.17 25...z 23...z 28...z 1.26.z
153 53 682 61 21 19 22 1.19 88 67 110 1.65. . ..z ..z . . . . ..z ..z ..z ..z
… … 294...y 61...y … … … .… 35...y 27...y 42...y 1.59...y… … … … … … … .… … … … .…
118 55 125 55 18 16 20 1.24 21 19 23 1.21. . ..z ..z . . . . ..z ..z ..z ..z
… … 112.* 46.* … … … .… 9.* 10.* 8.* 0.82… … 7 69 … … … .… 12 7 16 2.17… … … … … … … .… … … … .…
85 56 123...y 59...y 14 13 16 1.24 17...y 14...y 20...y 1.41...y… … … … … … … .… … … … .…
1 838 … 2 447 50 18 19 17 0.91 26 27 25 0.93. . . . … … … .… . . . .
2 53 … … 19 18 20 1.11 … … … .…… … … … … … … .… … … … .…
109 61 131 61 41 31 50 1.59 45 35 56 1.6166 57 156...z 52...z 13 11 15 1.38 26...z 24...z 27...z 1.13...z… … 952 51 … … … .… 35 34 36 1.06
Total students enrolled(000)
Gross enrolment ratio (GER)(%)
GPI
1999
School year ending in
(F/M)FemaleMaleTotalGPI
2006
(F/M)FemaleMaleTotal
ENROLMENT IN TERTIARY EDUCATION
Total % F
1999 2006
School year ending in
(000)Total % F(000)
Table 9A (continued)
Country or territory
Latin America and the Caribbean
90
02
Education f
or A
ll G
lobal M
onitorin
g R
eport
A N N E X
3 3 4
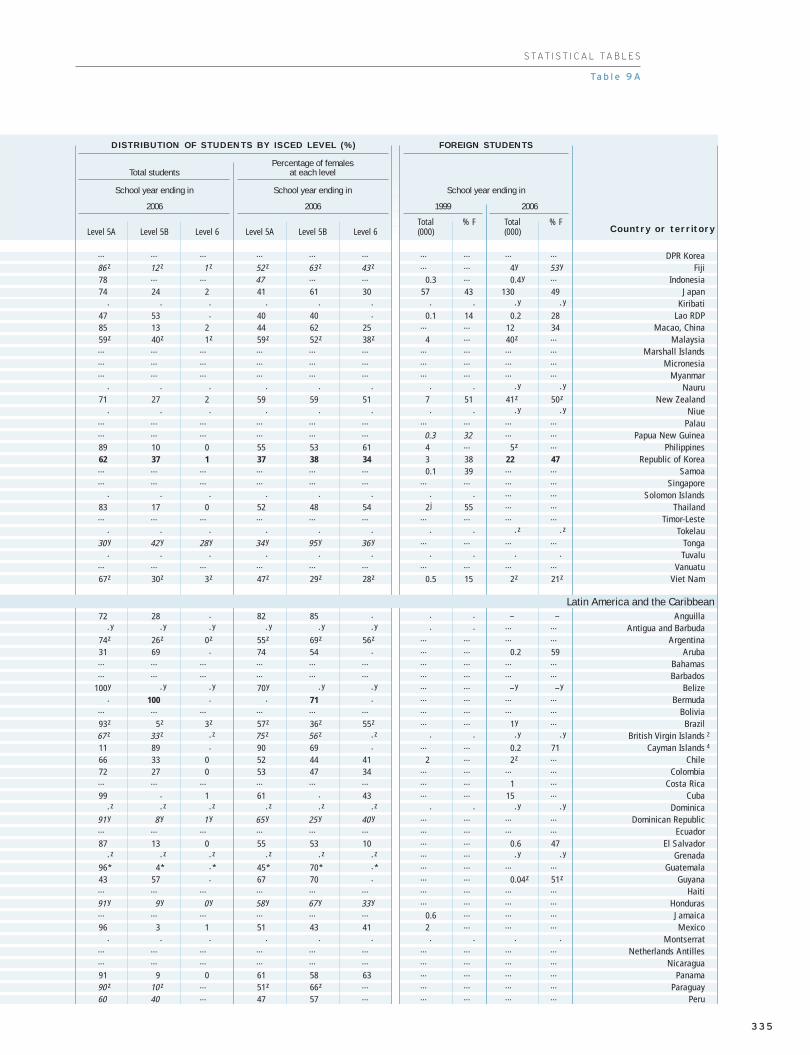
… … … … … … … … … …
86...z 12...z 1...z 52...z 63...z 43...z … … 4.y 53...y
78 … … 47 … … 0.3 … 0.4.y …
74 24 2 41 61 30 57 43 130 49. . . . . . . . ..y ..y
47 53 . 40 40 . 0.1 14 0.2 2885 13 2 44 62 25 … … 12 3459.z 40.z 1.z 59.z 52.z 38.z 4 … 40.z …… … … … … … … … … …… … … … … … … … … …… … … … … … … … … …
. . . . . . . . ..y ..y
71 27 2 59 59 51 7 51 41.z 50.z
. . . . . . . . ..y ..y… … … … … … … … … …… … … … … … 0.3 32 … …
89 10 0 55 53 61 4 … 5.z …
62 37 1 37 38 34 3 38 22 47… … … … … … 0.1 39 … …… … … … … … … … … …
. . . . . . . . … …
83 17 0 52 48 54 2.j 55 … …… … … … … … … … … …
. . . . . . . . ..z ..z
30...y 42...y 28...y 34...y 95...y 36...y … … … …. . . . . . . . . .
… … … … … … … … … …
67.z 30.z 3.z 47.z 29.z 28.z 0.5 15 2.z 21.z
72 28 . 82 85 . . . – –..y ..y ..y ..y ..y ..y . . … …
74.z 26.z 0.z 55.z 69.z 56.z … … … …
31 69 . 74 54 . … … 0.2 59… … … … … … … … … …… … … … … … … … … …
100.y ..y ..y 70.y ..y ..y … … –.y –.y
. 100 . . 71 . … … … …… … … … … … … … … …
93.z 5.z 3.z 57.z 36.z 55.z … … 1.y …
67...z 33...z ..z 75...z 56...z ..z . . ..y ..y
11 89 . 90 69 . … … 0.2 7166 33 0 52 44 41 2 … 2.z …
72 27 0 53 47 34 … … … …… … … … … … … … 1 …
99 . 1 61 . 43 … … 15 …..z ..z ..z ..z ..z ..z . . ..y ..y
91...y 8...y 1...y 65...y 25...y 40...y … … … …… … … … … … … … … …
87 13 0 55 53 10 … … 0.6 47..z ..z ..z ..z ..z ..z … … ..y ..y
96.* 4.* ..* 45.* 70.* ..* … … … …
43 57 . 67 70 . … … 0.04.z 51.z… … … … … … … … … …
91...y 9...y 0...y 58...y 67...y 33...y … … … …… … … … … … 0.6 … … …
96 3 1 51 43 41 2 … … …. . . . . . . . . .
… … … … … … … … … …… … … … … … … … … …
91 9 0 61 58 63 … … … …
90...z 10...z … 51.z 66.z … … … … …
60 40 … 47 57 … … … … …
Total students
2006
School year ending in
Level 5A Level 5B Level 6
Percentage of females at each level
2006
School year ending in
Level 5A Level 5B Level 6
DISTRIBUTION OF STUDENTS BY ISCED LEVEL (%) FOREIGN STUDENTS
DPR KoreaFiji
IndonesiaJapan
KiribatiLao RDP
Macao, ChinaMalaysia
Marshall IslandsMicronesia
MyanmarNauru
New ZealandNiue
PalauPapua New Guinea
PhilippinesRepublic of Korea
SamoaSingapore
Solomon IslandsThailand
Timor-LesteTokelau
TongaTuvalu
VanuatuViet Nam
AnguillaAntigua and Barbuda
ArgentinaAruba
BahamasBarbados
BelizeBermuda
BoliviaBrazil
British Virgin Islands 2
Cayman Islands 4
ChileColombia
Costa RicaCuba
DominicaDominican Republic
EcuadorEl Salvador
GrenadaGuatemala
GuyanaHaiti
HondurasJamaicaMexico
MontserratNetherlands Antilles
NicaraguaPanama
ParaguayPeru
Country or territoryTotal % F
1999 2006
School year ending in
(000)Total % F(000)
Latin America and the Caribbean
Ta b l e 9 A
S TAT I S T I C A L TA B L E S
3 3 5

Saint Kitts and NevisSaint LuciaSaint Vincent/Grenad.SurinameTrinidad and TobagoTurks and Caicos IslandsUruguayVenezuela, Bolivarian Rep. of
Andorra2
AustriaBelgiumCanadaCyprus2
DenmarkFinlandFrance5
GermanyGreeceIcelandIrelandIsraelItalyLuxembourgMaltaMonacoNetherlandsNorwayPortugalSan MarinoSpainSwedenSwitzerlandUnited KingdomUnited States
AfghanistanBangladeshBhutanIndiaIran, Islamic Republic ofMaldivesNepalPakistanSri Lanka
AngolaBeninBotswanaBurkina FasoBurundiCameroonCape VerdeCentral African RepublicChadComorosCongoCôte d’IvoireD. R. Congo
. . ..z ..z . . . . ..z ..z ..z ..z… … 1.6 85 … … … .… 10 3 16 5.46
. . ..z ..z . . . . ..z ..z ..z ..z… … … … … … … .… … … … .…
7.6 57 17...z 56...z 6 5 7 1.38 11...z 10...z 13...z 1.28...z
. . ..z ..z . . . . ..z ..z ..z ..z
91 63 113 62 34 25 44 1.76 46 35 58 1.68… … 1 381.* … … … … .… 52.* … … .…
… … 0.4 53 … … … .… 10 9 11 1.25253 50 253 54 54 52 55 1.05 50 45 55 1.21352 53 394 55 57 53 61 1.15 63 56 70 1.25
1 221 56 1 327...y 56...y 60 52 69 1.34 62...y 53...y 72...y 1.36...y
11 56 21 51 21 19 23 1.25 33 33 34 1.05190 56 229 57 56 48 64 1.33 80 67 93 1.39263 54 309 54 82 74 91 1.23 93 84 103 1.22
2 012 54 2 201 55 52 47 58 1.24 56 50 63 1.27… … … … … … … .… … … … .…
388 50 653 51 47 45 49 1.11 95 89 101 1.138 62 16 64 40 30 50 1.69 73 51 96 1.87
151 54 186 55 46 42 50 1.20 59 52 66 1.27247 58 310 55 48 40 57 1.44 58 51 65 1.29
1 797 55 2 029 57 47 41 53 1.28 67 56 78 1.382.7 52 3 52 11 10 11 1.10 10 10 11 1.126 51 9.z 56.z 20 18 21 1.13 32.z 27.z 36.z 1.35.z
. . . . . . . . . . . .470 49 580 51 49 49 50 1.01 60 58 62 1.08187 57 215 60 66 55 77 1.40 78 61 94 1.54357 56 367 55 45 39 51 1.30 55 48 61 1.28… . … … … … … .… … … … .…
1 787 53 1 789 54 57 52 62 1.18 67 61 74 1.23335 58 423 60 64 53 75 1.41 79 62 96 1.55156 42 205 47 36 41 30 0.73 46 48 43 0.90
2 081 53 2 336 57 60 55 64 1.16 59 50 69 1.4013 769 56 17 487 57 73 63 83 1.31 82 68 96 1.41
… … 28.y 20.y … … … .… 1.y 2.y 1.y 0.28.y
709 32 912.z 33.z 5 7 4 0.51 6.z 8.z 4.z 0.53.z
1.5 36 4 33 3 3 2 0.58 6 7 4 0.59… … 12 853 40 … … … .… 12 14 10 0.72
1 308 43 2 399 52 19 21 17 0.80 27 25 28 1.11. . – – . . . . – – – –
… … 147.y 28.y … … … .… 6.y 8.y 3.y 0.40.y… … 820 45 … … … .… 5 5 4 0.85… … … … … … … .… … … … .…
8 39 48.z … 0.6 0.7 0.5 0.63 3.z … … .…
19 20 43 … 3 5 1 0.25 5 … … .…
5.5 44 11.z 50.z 3 3 3 0.79 5.z 5.z 5.z 1.00.z
10 23 30 31 0.9 1.4 0.4 0.30 2 3 1 0.465 30 17 31 1.0 1.4 0.6 0.41 2 3 1 0.43
67 … 120 42 5 … … .… 7 8 6 0.720.7 … 4.6 52 2 … … .… 8 8 8 1.096 16 4 22 2 3 0.6 0.18 1 2 0.5 0.28
… … 10...z 13...z … … … .… 1...z 2...z 0.3...z 0.14...z
0.6 43 1.8...y 43...y 1.0 1.1 0.9 0.75 2...y 3...y 2...y 0.77...y
11 21 … … 4 6 1 0.26 … … … .…
97 26 … … 6 9 3 0.36 … … … .…
60 … … … 1 … … .… … … … .…
Total students enrolled(000)
Gross enrolment ratio (GER)(%)
GPI
1999
School year ending in
(F/M)FemaleMaleTotalGPI
2006
(F/M)FemaleMaleTotal
ENROLMENT IN TERTIARY EDUCATION
Total % F
1999 2006
School year ending in
(000)Total % F(000)
Table 9A (continued)
Country or territory
North America and Western Europe
South and West Asia
Sub-Saharan Africa
90
02
Education f
or A
ll G
lobal M
onitorin
g R
eport
A N N E X
3 3 6

..z ..z ..z ..z ..z ..z . . ..y ..y
75 25 . 91 64 . … … 0.1 33..z ..z ..z ..z ..z ..z . . ..z ..z
… … … … … … … … … …
51...z 34...z … 60...z 48...z … 1 46 1.0.y 55...y
..z ..z ..z ..z ..z ..z . . ..y ..y… … 0 … … 40 0.9 … … …
64.* 36.* … … … … … … 2.y …
40 60 . 59 49 . … … … …
84 9 7 53 68 46 30 49 39 5346 52 2 51 58 41 36 48 25 …
73...y 24...y 3...y 58.y 52...y 46.y 115 … … …
22 76 1 73 44 49 2 39 5 2485 12 2 59 46 46 12 61 12 5993 0 7 54 16 52 5 41 12 4372 24 3 56 56 46 131.± … 248 49… … … 48 61 … 178 46 260.z 50.z
59 37 3 53 48 44 … … 17 …
97 2 1 65 39 58 0.2 72 0.7 6468 29 3 58 49 48 7.eo 51 13 5179 18 3 55 55 52 … … … …
97 1 2 57 60 52 23 50 49 5868 … … … … … 0.7.j … 1 …
85.z 14.z 1.z 56.z 57.z 30.z 0.3.j 53 0.6.z 57.z
. . . . . . . . ..y ..y
99 . 1 51 . 41 14 46 27 5697 1 2 60 57 46 9 53 14 5893 1 6 55 57 56 … … 17 49… … … … … … … … … …
82 13 4 54 51 51 33 51 18 5490 5 5 61 50 49 24 45 21 4874 17 8 49 42 40 25 44 28 4774 22 4 55 66 45 233 47 330 4877 21 2 57 60 52 452 42 585 …
… … … … … … … … … …
91.z 9.z 0.z 35.z 20.z 28.z … … 1.z …
100 – . 33 – . … … – –100 – 0 40 – 40 … … 8.y …
69 30 1 56 43 28 … … 3 28– – – – – – . . … …
99...y ..y 1...y 28...y ..y 23...y … … … …
94 5 1 45 45 27 … … … …… … … … … … … … … …
100.z ..z –.z … … … … … … …… … … … … … … … … …
94.z 6.z –.z 52.z 16.z –.z … … 0.7.z …
70 30 – 33 27 – … … 0.9.z 38.z
35 64 0 39 26 19 0.1 … … …
87 12 2 … … … … … 2 …
100 . – 52 . – … … … …
77 23 . 20 30 . … … 0.5 9… … … … … … … … … …
68...y 32...y ..y 39...y 52...y ..y . . … …… … … … … … … … 0.1.y …… … … … … … … … … …… … … … … … … … … …
Total students
2006
School year ending in
Level 5A Level 5B Level 6
Percentage of females at each level
2006
School year ending in
Level 5A Level 5B Level 6
DISTRIBUTION OF STUDENTS BY ISCED LEVEL (%) FOREIGN STUDENTS
Saint Kitts and NevisSaint Lucia
Saint Vincent/Grenad.Suriname
Trinidad and TobagoTurks and Caicos Islands
UruguayVenezuela, Bolivarian Rep. of
Andorra 2
AustriaBelgiumCanadaCyprus 2
DenmarkFinlandFrance 5
GermanyGreeceIcelandIreland
IsraelItaly
LuxembourgMalta
MonacoNetherlands
NorwayPortugal
San MarinoSpain
SwedenSwitzerland
United KingdomUnited States
AfghanistanBangladesh
BhutanIndia
Iran, Islamic Republic ofMaldives
NepalPakistan
Sri Lanka
AngolaBenin
BotswanaBurkina Faso
BurundiCameroon
Cape VerdeCentral African Republic
ChadComoros
CongoCôte d’IvoireD. R. Congo
Country or territoryTotal % F
1999 2006
School year ending in
(000)Total % F(000)
North America and Western Europe
South and West Asia
Sub-Saharan Africa
S TAT I S T I C A L TA B L E S
Ta b l e 9 A
3 3 7

Equatorial GuineaEritreaEthiopiaGabonGambiaGhanaGuineaGuinea-BissauKenyaLesothoLiberiaMadagascarMalawiMaliMauritiusMozambiqueNamibiaNigerNigeriaRwandaSao Tome and PrincipeSenegalSeychellesSierra LeoneSomaliaSouth AfricaSwazilandTogoUgandaUnited Republic of TanzaniaZambiaZimbabwe
World
Countries in transitionDeveloped countriesDeveloping countries
Arab StatesCentral and Eastern EuropeCentral AsiaEast Asia and the Pacific
East AsiaPacific
Latin America/CaribbeanCaribbeanLatin America
N. America/W. EuropeSouth and West AsiaSub-Saharan Africa
… … … … … … … .… … … … .…
4.0 14 5.y 13.y 1.0 1.7 0.3 0.16 1.y 2.y 0.3.y 0.15.y
52 19 210 25 0.9 1.4 0.3 0.23 3 4 1 0.347.5 36 … … 7 9 5 0.54 … … … .…
1.2 23 1.5.y 19.y 1 2 0.5 0.30 1.y 2.y 0.4.y 0.24.y… … 140 34 … … … .… 6 8 4 0.54… … 43 21 … … … .… 5 8 2 0.28
0.5 16 … … 0.4 0.7 0.1 0.18 … … … .…… … 103.y 38.y … … … .… 3.y 3.y 2.y 0.60.y
4 64 9 55 2 2 3 1.65 4 3 4 1.1921 19 … … 8 13 3 0.24 … … … .…
31 46 50 47 2 2 2 0.84 3 3 3 0.873 28 5.y 35.y 0.3 0.4 0.2 0.37 0.4.y 0.5.y 0.3.y 0.55.y
19 32 33.z 31...z 2 3 1 0.45 3.z 4...z 2...z 0.45...z
7.6 46 17 53 7 7 6 0.88 17 16 18 1.1510 … 28.z 33.z 0.6 … … .… 1.z 2.z 1.z 0.49.z… … 13 47 … … … .… 6 6 5 0.88… … 11 27 … … … .… 1 2 0.5 0.29
699 43 1 392.z 41.z 6 7 5 0.76 10.z 12.z 8.z 0.69.z
6 … 26...z 39...z 1 … … .… 3...z 3...z 2...z 0.62...z
. . . . . . . . . . . .29 … 59.*,z … 3 … … .… 6.*,z … … .…
. . . . . . . . . . . .… … … … … … … .… … … … .…… … … … … … … .… … … … .…
633 54 741 55 14 13 15 1.16 15 14 17 1.245 48 6 50 5 5 4 0.86 4 4 4 0.98
15 17 … … 3 5 1 0.21 … … … .…
41 35 88.y 38.y 2 2 1 0.53 3.y 4.y 3.y 0.62.y
19 21 55 32 0.6 1.0 0.3 0.27 1 2 1 0.4823 32 … … 2 3 1 0.46 … … … .…
43 … … … 3 … … .… … … … .…
92 272 48 143 723 50 18 18 17 0.96 25 24 25 1.06
8 684 54 14 432 56 39 35 42 1.20 57 50 64 1.2936 358 53 43 961 55 55 51 60 1.19 67 58 75 1.2847 229 43 85 331 47 11 12 10 0.78 17 18 17 0.93
5 165 42 7 038 49 19 22 16 0.74 22 22 22 1.0012 421 53 20 125 55 38 35 41 1.18 60 53 66 1.25
1 223 48 1 974 52 18 19 18 0.93 25 24 26 1.1022 674 42 43 621 47 14 16 12 0.75 25 25 24 0.9421 635 41 42 313 47 13 15 11 0.73 24 25 23 0.94
1 039 55 1 308 55 47 42 52 1.24 52 45 59 1.3110 664 53 16 247 54 21 20 23 1.12 31 29 34 1.16
81 57 107 63 6 5 6 1.30 6 5 8 1.6910 583 53 16 140 53 22 21 23 1.12 32 30 34 1.1528 230 54 33 742 56 61 55 68 1.23 70 60 80 1.33
9 758 37 17 253 41 7 9 6 0.64 11 12 9 0.762 136 40 3 723 40 4 4 3 0.67 5 6 4 0.67
Total students enrolled(000)
Gross enrolment ratio (GER)(%)
GPI
1999
School year ending in
(F/M)FemaleMaleTotalGPI
2006
(F/M)FemaleMaleTotal
ENROLMENT IN TERTIARY EDUCATION
Total % F
1999 2006
School year ending in
(000)Total % F(000)
Table 9A (continued)
Country or territory
90
02
Education f
or A
ll G
lobal M
onitorin
g R
eport
A N N E X
Weighted average Weighted averageSum %F Sum %F
3 3 8
1. Data are included in ISCED level 5A.2. National population data were used to calculate enrolment ratios.3. Enrolment and population data exclude Transnistria.
4. Enrolment ratios were not calculated due to lack of United Nations population data by age.5. Data include French overseas departments and territories (DOM-TOM).

… … … … … … … … … …
77.y 23.y ..y 12.y 16.y ..y 0.1 16 … …
100 . 0 25 . 2 … … … …… … … … … … 0.4 … … …
100.y ..y ..y 19.y ..y ..y … … –.y –.y
73 26 0 35 33 26 … … 2 52… … … … … … … … 0.9 26… … … … … … … … … …
66.y 34.y –.y 35.y 43.y –.y … … … …
79 21 . 51 70 . 1 46 0.1 …… … … … … … … … … …
76 19 5 47 45 42 1 … 1 23100.y ..y ..y 35.y ..y ..y … … … …
95...z 5...z ..z 31...z 51...z ..z 1 … … …
56 43 1 53 54 38 … … 0.1.y 53.y
100.z ..z ..z 33.z ..z ..z … … … …
61 39 0 43 52 45 … … 0.2 …
80 20 – 22 45 – … … 0.2...z 25...z
52.z 47.z 1.z 36.z 46.z 24.z … … … …
65...z 35...z ..z 41...z 35...z ..z 0.1 … … …. . . . . . . . ..z ..z
… … … … … … 1 … … …. . . . . . . . . .
… … … … … … … … … …… … … … … … … … … …
62 36 1 55 56 42 … … 54 4899 . 1 50 . 50 0.1 … 0.1 …… … … … … … 0.5 33 … …
62.y 36.y 2.y 41.y 35.y 37.y … … … …… … … … … … … … 0.3.y 20.y… … … … … … … … … …… … … … … … … … … …
78 … … 52 39 22 … … … …
99 . 1 55 . 37 … … … …
82 13 4 56 57 30 … … … …
75 22 3 45 57 13 … … … …
84 15 1 53 47 31 … … … …
84 12 4 58 55 58 … … … …
99 – 1 54 – 53 … … … …
62 37 1 40 51 15 … … … …
74 24 2 47 29 28 … … … …. . . . . . … … … …
66 33 0 55 53 10 … … … …. . . . . . … … … …
90 10 0 55 53 10 … … … …
78 19 3 55 61 45 … … … …
94 5 1 35 20 28 … … … …
76 21 2 36 23 12 … … … …
Total students
2006
School year ending in
Level 5A Level 5B Level 6
Percentage of females at each level
2006
School year ending in
Level 5A Level 5B Level 6
DISTRIBUTION OF STUDENTS BY ISCED LEVEL (%) FOREIGN STUDENTS
Equatorial GuineaEritrea
EthiopiaGabon
GambiaGhana
GuineaGuinea-Bissau
KenyaLesothoLiberia
MadagascarMalawi
MaliMauritius
MozambiqueNamibia
NigerNigeria
RwandaSao Tome and Principe
SenegalSeychelles
Sierra LeoneSomalia
South AfricaSwaziland
TogoUganda
United Republic of TanzaniaZambia
Zimbabwe
World
Countries in transitionDeveloped countries
Developing countries
Arab StatesCentral and Eastern Europe
Central AsiaEast Asia and the Pacific
East AsiaPacific
Latin America/CaribbeanCaribbean
Latin AmericaN. America/W. Europe
South and West AsiaSub-Saharan Africa
Country or territoryTotal % F
1999 2006
School year ending in
(000)Total % F(000)
S TAT I S T I C A L TA B L E S
Ta b l e 9 A
Median Median Sum %F Sum %F
3 3 9
(eo) Full-time only.(j) Data refer to ISCED levels 5A and 6 only.(v) Data do not include ISCED level 6.
± Partial data.Data in italic are UIS estimates.Data in bold are for the school year ending in 2007.
(z) Data are for the school year ending in 2005.(y) Data are for the school year ending in 2004.(*) National estimate.
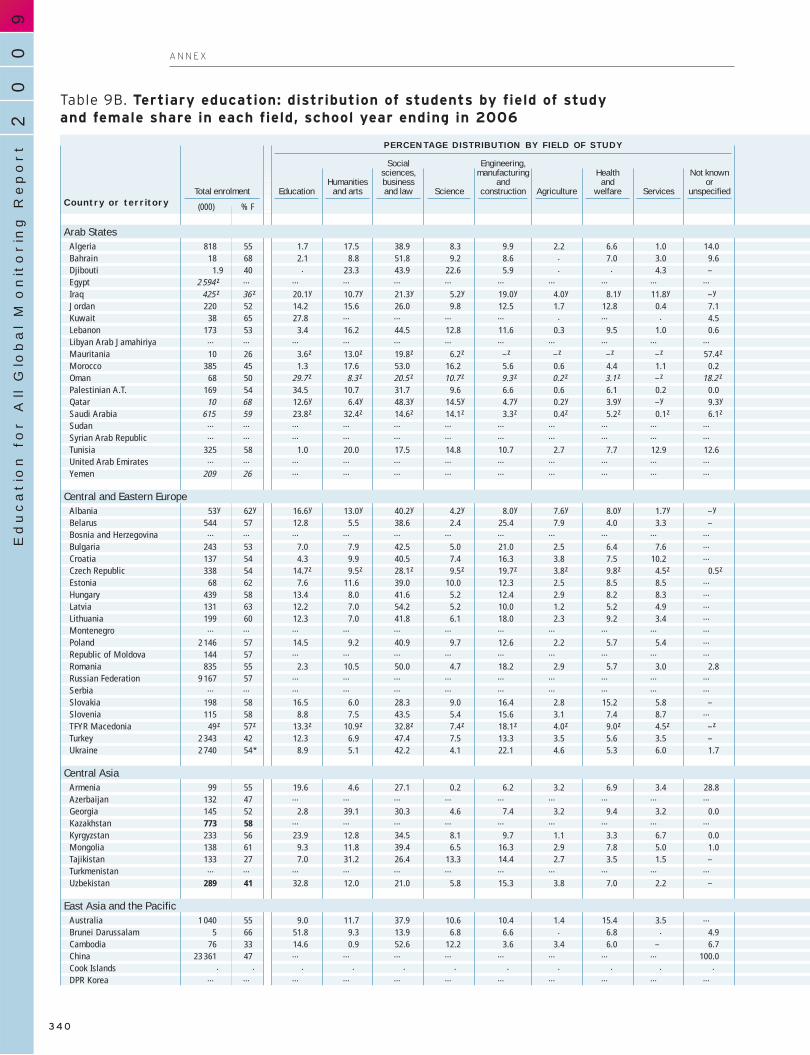
AlgeriaBahrainDjiboutiEgyptIraqJordanKuwaitLebanonLibyan Arab JamahiriyaMauritaniaMoroccoOmanPalestinian A.T.QatarSaudi ArabiaSudanSyrian Arab RepublicTunisiaUnited Arab EmiratesYemen
AlbaniaBelarusBosnia and HerzegovinaBulgariaCroatiaCzech RepublicEstoniaHungaryLatviaLithuaniaMontenegroPolandRepublic of MoldovaRomaniaRussian FederationSerbiaSlovakiaSloveniaTFYR MacedoniaTurkeyUkraine
ArmeniaAzerbaijanGeorgiaKazakhstanKyrgyzstanMongoliaTajikistanTurkmenistanUzbekistan
AustraliaBrunei DarussalamCambodiaChinaCook IslandsDPR Korea
818 55 1.7 17.5 38.9 8.3 9.9 2.2 6.6 1.0 14.018 68 2.1 8.8 51.8 9.2 8.6 . 7.0 3.0 9.6
1.9 40 . 23.3 43.9 22.6 5.9 . . 4.3 –2 594...z … … … … … … … … … …
425...z 36...z 20.1.y 10.7.y 21.3.y 5.2.y 19.0.y 4.0.y 8.1.y 11.8.y –.y
220 52 14.2 15.6 26.0 9.8 12.5 1.7 12.8 0.4 7.138 65 27.8 … … … … . … . 4.5
173 53 3.4 16.2 44.5 12.8 11.6 0.3 9.5 1.0 0.6… … … … … … … … … … …
10 26 3.6.z 13.0.z 19.8.z 6.2.z –.z –.z –.z –.z 57.4.z
385 45 1.3 17.6 53.0 16.2 5.6 0.6 4.4 1.1 0.268 50 29.7...z 8.3...z 20.5...z 10.7...z 9.3...z 0.2...z 3.1...z –.z 18.2...z
169 54 34.5 10.7 31.7 9.6 6.6 0.6 6.1 0.2 0.010 68 12.6.y 6.4.y 48.3.y 14.5.y 4.7.y 0.2.y 3.9.y –.y 9.3.y
615 59 23.8.z 32.4.z 14.6.z 14.1.z 3.3.z 0.4.z 5.2.z 0.1.z 6.1.z… … … … … … … … … … …… … … … … … … … … … …
325 58 1.0 20.0 17.5 14.8 10.7 2.7 7.7 12.9 12.6… … … … … … … … … … …
209 26 … … … … … … … … …
53.y 62.y 16.6.y 13.0.y 40.2.y 4.2.y 8.0.y 7.6.y 8.0.y 1.7.y –.y
544 57 12.8 5.5 38.6 2.4 25.4 7.9 4.0 3.3 –… … … … … … … … … … …
243 53 7.0 7.9 42.5 5.0 21.0 2.5 6.4 7.6 …
137 54 4.3 9.9 40.5 7.4 16.3 3.8 7.5 10.2 …
338 54 14.7.z 9.5.z 28.1.z 9.5.z 19.7.z 3.8.z 9.8.z 4.5.z 0.5.z
68 62 7.6 11.6 39.0 10.0 12.3 2.5 8.5 8.5 …
439 58 13.4 8.0 41.6 5.2 12.4 2.9 8.2 8.3 …
131 63 12.2 7.0 54.2 5.2 10.0 1.2 5.2 4.9 …
199 60 12.3 7.0 41.8 6.1 18.0 2.3 9.2 3.4 …… … … … … … … … … … …
2 146 57 14.5 9.2 40.9 9.7 12.6 2.2 5.7 5.4 …
144 57 … … … … … … … … …
835 55 2.3 10.5 50.0 4.7 18.2 2.9 5.7 3.0 2.89 167 57 … … … … … … … … …
… … … … … … … … … … …
198 58 16.5 6.0 28.3 9.0 16.4 2.8 15.2 5.8 –115 58 8.8 7.5 43.5 5.4 15.6 3.1 7.4 8.7 …
49.z 57.z 13.3.z 10.9.z 32.8.z 7.4.z 18.1.z 4.0.z 9.0.z 4.5.z –.z
2 343 42 12.3 6.9 47.4 7.5 13.3 3.5 5.6 3.5 –2 740 54.* 8.9 5.1 42.2 4.1 22.1 4.6 5.3 6.0 1.7
99 55 19.6 4.6 27.1 0.2 6.2 3.2 6.9 3.4 28.8132 47 … … … … … … … … …
145 52 2.8 39.1 30.3 4.6 7.4 3.2 9.4 3.2 0.0773 58 … … … … … … … … …
233 56 23.9 12.8 34.5 8.1 9.7 1.1 3.3 6.7 0.0138 61 9.3 11.8 39.4 6.5 16.3 2.9 7.8 5.0 1.0133 27 7.0 31.2 26.4 13.3 14.4 2.7 3.5 1.5 –… … … … … … … … … … …
289 41 32.8 12.0 21.0 5.8 15.3 3.8 7.0 2.2 –
1 040 55 9.0 11.7 37.9 10.6 10.4 1.4 15.4 3.5 …
5 66 51.8 9.3 13.9 6.8 6.6 . 6.8 . 4.976 33 14.6 0.9 52.6 12.2 3.6 3.4 6.0 – 6.7
23 361 47 … … … … … … … … 100.0. . . . . . . . . . .
… … … … … … … … … … …
(000) % F
Table 9B. Tertiary education: distribution of students by field of study and female share in each field, school year ending in 2006
Country or territory
90
02
Education f
or A
ll G
lobal M
onitorin
g R
eport
A N N E X
EducationHumanities
and arts
Socialsciences,business and law Science
Engineering,manufacturing
andconstruction Agriculture
Health and
welfare Services
Not known or
unspecifiedTotal enrolment
PERCENTAGE DISTRIBUTION BY FIELD OF STUDY
Arab States
Central and Eastern Europe
Central Asia
East Asia and the Pacific
3 4 0

70 74 58 57 31 47 59 26 3851 83 70 75 21 . 85 69 72
. 48 47 22 21 . . 49 –… … … … … … … … …
50.y 38.y 33.y 51.y 19.y 30.y 41.y 37.y –.y
84 66 40 41 27 55 47 54 6580 … … … … . … . 6495 66 52 49 21 48 66 50 60… … … … … … … … …
17.z 24.z 26.z 21.z –.z –.z –.z –.z 25.z
41 47 47 40 27 32 66 47 169...z 60...z 41...z 53...z 20...z 25...z 67...z –.z 40...z
70 66 40 46 28 18 57 31 4089.y 73.y 65.y 75.y 16.y –.y 100.y –.y 94.y
71.z 64.z 43.z 60.z 15.z 0.z 44.z 27.z 45.z… … … … … … … … …… … … … … … … … …… … … … … … … … …… … … … … … … … …… … … … … … … … …
82.y 71.y 60.y 74.y 26.y 39.y 74.y 21.y –.y
78 75 70 51 29 30 81 42 –… … … … … … … … …
68 63 60 49 32 43 67 47 …
92 71 64 42 25 45 74 26 …
74.z 63.z 60.z 36.z 21.z 54.z 75.z 38.z 11.z
90 75 65 39 27 53 89 51 …
73 66 65 31 19 45 76 59 …
85 77 67 30 21 49 86 52 …
78 73 68 34 25 47 84 43 …… … … … … … … … …
73 70 62 37 27 53 73 49 …… … … … … … … … …
75 69 62 54 30 37 67 46 47… … … … … … … … …… … … … … … … … …
75 59 63 36 29 40 81 44 –80 73 66 33 24 55 80 47 …
74.z 68.z 60.z 55.z 32.z 34.z 74.z 38.z –.z
53 46 45 40 19 44 61 31 –… … … … … … … … …
94 55 48 27 30 30 36 13 52… … … … … … … … …
55 62 44 57 28 33 75 13 22… … … … … … … … …
83 60 53 48 29 21 50 20 –77 71 64 47 39 61 80 36 53… … … … … … … … …… … … … … … … … …
57 63 24 56 12 15 46 30 –
74 63 54 35 21 53 76 52.z 67.z
71 59 63 58 37 . 78 . 7539 29 40 14 6 24 35 – 10… … … … … … … … 47
. . . . . . . . .… … … … … … … … …
Ta b l e 9 B
AlgeriaBahrainDjibouti
EgyptIraq
JordanKuwait
LebanonLibyan Arab Jamahiriya
MauritaniaMorocco
OmanPalestinian A.T.
QatarSaudi Arabia
SudanSyrian Arab Republic
TunisiaUnited Arab Emirates
Yemen
AlbaniaBelarus
Bosnia and HerzegovinaBulgariaCroatia
Czech RepublicEstonia
HungaryLatvia
LithuaniaMontenegro
PolandRepublic of Moldova
RomaniaRussian Federation
SerbiaSlovakiaSlovenia
TFYR MacedoniaTurkey
Ukraine
ArmeniaAzerbaijan
GeorgiaKazakhstanKyrgyzstan
MongoliaTajikistan
TurkmenistanUzbekistan
AustraliaBrunei Darussalam
CambodiaChina
Cook IslandsDPR Korea
Country or territory
S TAT I S T I C A L TA B L E S
EducationHumanities
and arts
Socialsciences,business and law Science
Engineering,manufacturing
andconstruction Agriculture
Health and
welfare ServicesNot known
or unspecified
PERCENTAGE FEMALE IN EACH FIELD
Arab States
Central and Eastern Europe
Central Asia
East Asia and the Pacific
3 4 1

FijiIndonesiaJapanKiribatiLao PDRMacao, ChinaMalaysiaMarshall IslandsMicronesiaMyanmarNauruNew ZealandNiuePalauPapua New GuineaPhilippinesRepublic of KoreaSamoaSingaporeSolomon IslandsThailandTimor-LesteTokelauTongaTuvaluVanuatuViet Nam
AnguillaAntigua and BarbudaArgentinaArubaBahamasBarbadosBelizeBermudaBoliviaBrazilBritish Virgin IslandsCayman IslandsChileColombiaCosta RicaCubaDominicaDominican RepublicEcuadorEl SalvadorGrenadaGuatemalaGuyanaHaitiHondurasJamaicaMexicoMontserratNetherlands AntillesNicaraguaPanamaParaguayPeruSaint Kitts and NevisSaint Lucia
13...z 53...z … … … … … … … … …
3 657 … … … … … … … … … …
4 085 46 7.2 15.8 29.3 2.9 16.1 2.1 12.2 5.7 8.7. . . . . . . . . . .
57 40 21.6 14.2 15.3 1.9 7.7 6.8 2.0 2.8 27.723 46 4.3 6.9 69.3 3.7 2.2 – 5.4 8.3 –
697.z 56.z 13.2.z 9.8.z 27.1.z 19.4.z 18.4.z 2.9.z 6.7.z 2.5.z –.z… … … … … … … … … … …… … … … … … … … … … …… … … … … … … … … … …
. . . . . . . . . . .238 59 10.2 17.5 34.8 13.9 6.6 1.0 12.6 2.7 0.7
. . . . . . . . . . .… … … … … … … … … … …… … … … … … … … … … …
2 484 54 16.9.y 3.2.y 28.0.y 11.8.y 15.5.y 3.2.y 13.2.y 0.7.y 7.3.y
3 204 37 6.3 18.3 21.6 8.6 28.9 1.3 8.8 6.2 –… … … … … … … … … … …… … … … … … … … … … …
. . . . . . . . . . .2 339 51 … … … … … … … … 100.0
… … … … … … … … … … …. . . . . . . . . . .
0.7...y 60...y … … … … … … … … …. . . . . . . . . . .
1.0...y 36...y … … … … … … … … …
1 355.z 41.z … … … … … … … … …
0.05 83 40.4 . 59.6 . . . . . ...y ..y … … … … … … … … …
2 083.z 59.z 10.7.z 12.5.z 39.6.z 10.0.z 8.1.z 3.5.z 12.6.z 2.9.z 0.2.z
2.1 60 17.9 . 44.2 . 19.5 . 18.5 . .… … … … … … … … … … …… … … … … … … … … … …
0.7.y 70.y 25.3.y 3.7.y 29.4.y 9.1.y 0.1.y –.y 8.9.y –.y 23.4.y
0.9 71 4.1 9.3 33.0 12.5 6.0 – 7.7 3.3 24.3346...y … … … … … … … … … …
4 572.z 56.z 19.8.z 3.4.z 40.5.z 8.3.z 7.5.z 2.1.z 13.6.z 2.1.z 2.7.z
1.2...z 69...z … … … … … … … … …
0.6 72 . . 81.0 16.4 . . . . 2.6661 49 13.8 7.7 25.7 8.0 18.5 4.5 14.8 7.1 …
1 315 51 8.8 4.2 42.8 3.3 32.3 – 8.5 – –111...z 54...z 26.5.y 4.0.y 25.7.y 8.5.y 14.9.y 3.0.y 11.1.y 3.3.y 3.0.y
682 61 16.6 1.3 24.0 2.5 2.1 1.0 17.3 6.7 28.5..z ..z … … … … … … … … …
294...y 61...y … … … … … … … … …… … … … … … … … … … …
125 55 8.3 4.4 47.1 11.2 11.9 1.1 16.0 0.0 –..z ..z ..z ..z ..z ..z ..z ..z ..z ..z ..z
112.* 46.* 13.1.* 0.7.* 46.0.* 2.3.* 18.6.* 2.9.* 7.0.* –.* 9.4.*7 69 30.5 2.9 41.7 9.9 6.5 2.2 4.9 0.8 0.7
… … … … … … … … … … …
123...y 59...y … … … … … … … … …… … … … … … … … … … …
2 447 50 10.6 4.3 39.6 12.6 18.6 2.5 8.4 2.8 …. . . . . . . . . . .
… … … … … … … … … … …… … … … … … … … … … …
131 61 14.9 9.8 39.6 8.0 11.2 1.1 8.0 6.9 0.5156...z 52...z … … … … … … … … …
952 51 10.3 … 5.9 6.7 0.6 1.2 9.0 … 66.3..z ..z … … … … … … … … …
1.6 85 15.5 0.3 19.1 0.1 . . . . 37.8
(000) % FCountry or territoryEducation
Humanitiesand arts
Socialsciences,business and law Science
Engineering,manufacturing
andconstruction Agriculture
Health and
welfare Services
Not known or
unspecifiedTotal enrolment
PERCENTAGE DISTRIBUTION BY FIELD OF STUDY
Latin America and the Caribbean
90
02
Education f
or A
ll G
lobal M
onitorin
g R
eport
A N N E X
Table 9B (continued)
3 4 2

… … … … … … … … …… … … … … … … … …
70 67 35 25 12 39 60 80 49. . . . . . . . .
49 41 38 40 11 24 57 22 4663 74 40 14 14 – 74 66 –61.z 55.z 60.z 56.z 39.z 79.z 66.z 70.z –.z… … … … … … … … …… … … … … … … … …… … … … … … … … …
. . . . . . . . .82 64 56 43 25 58 80 48.z 63
. . . . . . . . .… … … … … … … … …… … … … … … … … …… … … … … … … … …
70 56 36 29 16 32 63 31 –… … … … … … … … …… … … … … … … … …
. . . . . . . . .… … … … … … … … 51… … … … … … … … …
. . . . . . . . .… … … … … … … … …
. . . . . . . . .… … … … … … … … …… … … … … … … … …
89 . 79 . . . . . .… … … … … … … … …
81.z 65.z 58.z 47.z 31.z 42.z 68.z 57.z 54.z
79 . 63 . 12 . 87 . .… … … … … … … … …… … … … … … … … …… … … … –.y –.y … –.y …
89 72 78 59 4 – 93 62 75… … … … … … … … …
74.z 60.z 52.z 34.z 26.z 40.z 71.z 66.z 54.z… … … … … … … … …
. . 74 60 . . . . 8069 50 52 32 24 47 69 46 …
66 45 57 49 37 – 71 – –73.y 57.y 57.y 35.y 29.y 41.y 55.y 50.y 61.y
71 65 66 45 25 31 78 30 52… … … … … … … … …… … … … … … … … …… … … … … … … … …
75 54 57 37 25 36 73 59 –..z ..z ..z ..z ..z ..z ..z ..z ..z
56.* 68.* 51.* 61.* 25.* 17.* 59.* – 43.*85 75 71 44 16 36 73 68 73… … … … … … … … …… … … … … … … … …… … … … … … … … …
71 56 57 40 25 37 64 59 …. . . . . . . . .
… … … … … … … … …… … … … … … … … …
77 60 65 46 31 24 76 58 58… … … … … … … … …
63 … 55 42 19 30 80 … 46… … … … … … … … …
84 100 75 – . . . . 67
FijiIndonesia
JapanKiribati
Lao PDRMacao, China
MalaysiaMarshall Islands
MicronesiaMyanmar
NauruNew Zealand
NiuePalau
Papua New GuineaPhilippines
Republic of KoreaSamoa
SingaporeSolomon Islands
ThailandTimor-Leste
TokelauTongaTuvalu
VanuatuViet Nam
AnguillaAntigua and Barbuda
ArgentinaAruba
BahamasBarbados
BelizeBermuda
BoliviaBrazil
British Virgin IslandsCayman Islands
ChileColombia
Costa RicaCuba
DominicaDominican Republic
EcuadorEl Salvador
GrenadaGuatemala
GuyanaHaiti
HondurasJamaicaMexico
MontserratNetherlands Antilles
NicaraguaPanama
ParaguayPeru
Saint Kitts and NevisSaint Lucia
Country or territoryEducation
Humanities and arts
Socialsciences,business and law Science
Engineering,manufacturing
andconstruction Agriculture
Health and
welfare ServicesNot known
or unspecified
PERCENTAGE FEMALE IN EACH FIELD
Latin America and the Caribbean
S TAT I S T I C A L TA B L E S
Ta b l e 9 B
3 4 3

Saint Vincent/Grenad.SurinameTrinidad and TobagoTurks and Caicos IslandsUruguayVenezuela, B. R.
AndorraAustriaBelgiumCanadaCyprusDenmarkFinlandFrance1
GermanyGreeceIcelandIrelandIsraelItalyLuxembourgMaltaMonacoNetherlandsNorwayPortugalSan MarinoSpainSwedenSwitzerlandUnited KingdomUnited States
AfghanistanBangladeshBhutanIndiaIran, Islamic Republic ofMaldivesNepalPakistanSri Lanka
AngolaBeninBotswanaBurkina FasoBurundiCameroonCape VerdeCentral African RepublicChadComorosCongoCôte d’IvoireD. R. CongoEquatorial GuineaEritreaEthiopia
..z ..z ..z ..z ..z ..z ..z ..z ..z ..z ..z… … … … … … … … … … …
17...z 56...z 4.9.y 8.4.y 26.7.y 13.7.y 22.6.y 3.6.y 9.9.y 4.2.y 5.9.y
..z ..z ..y ..y ..y ..y ..y ..y ..y ..y ..y
113 62 20.2.z 4.5.z 40.0.z 5.3.z 11.1.z 2.9.z 11.5.z 0.6.z 3.6.z
1 381.* … … … … … … … 1.7.* … 98.3.*
0.4 53 – 6.7 55.1 24.7 – – 13.5 – –253 54 12.8 14.9 35.0 12.4 11.8 1.6 9.4 2.1 …
394 55 10.2 10.5 27.5 6.9 10.6 2.5 22.1 1.5 …
1 327...y 56...y … … … … … … … … …
21 51 9.4 8.5 47.4 12.7 6.1 0.1 6.6 9.2 …
229 57 11.4 15.0 29.5 8.0 10.1 1.5 22.2 2.3 –309 54 5.3 14.5 22.5 11.4 25.9 2.2 13.3 4.8 …
2 201 55 3.1 16.5 34.5 12.3 11.5 1.0 14.2 3.5 …… … 7.3 15.6 27.4 15.2 15.7 1.4 14.7 2.5 …
653 51 6.5.z 11.6.z 31.9.z 15.7.z 16.5.z 5.9.z 6.9.z 5.0.z –.z
16 64 17.4 14.8 38.0 8.0 7.3 0.5 12.4 1.5 …
186 55 5.3 15.7 23.1 11.6 10.4 1.2 12.8 4.5 …
310 55 13.8 11.1 38.7 9.6 17.9 0.6 7.2 . …
2 029 57 6.4 15.5 36.5 7.9 15.6 2.3 12.5 2.6 …
3 52 22.7 8.2 45.2 8.4 15.0 … 0.4 … …
9.z 56.z 15.7.z 13.5.z 41.6.z 5.9.z 7.8.z 0.8.z 14.5.z 0.2.z …. . ..y ..y ..y ..y ..y ..y ..y ..y ..y
580 51 14.6 8.3 37.5 6.6 8.2 1.2 16.2 5.8 1.8215 60 14.7.z 11.5.z 32.2.z 9.4.z 6.9.z 0.9.z 19.0.z 3.8.z 1.6.z
367 55 7.2 8.6 31.5 7.3 21.9 1.9 16.0 5.6 …… … … … … … … … … … …
1 789 54 9.2 10.4 31.9 11.4 17.8 3.4 9.9 5.6 0.5423 60 15.2 12.6 26.2 9.7 16.3 0.9 17.2 1.8 0.2205 47 10.3 13.0 37.1 10.7 13.4 1.2 10.2 3.8 …
2 336 57 8.9 17.0 27.0 13.7 8.2 0.9 18.8 0.7 4.917 487 57 9.4 10.6 27.3 8.9 6.7 0.6 13.9 5.1 …
28.y 20.y … … … … … … … … …
912.z 33.z 2.7.z 24.2.z 33.9.z 15.5.z 5.0.z 0.9.z 2.4.z 0.2.z 15.1.z
4 33 38.3 17.4 14.8 3.2 14.4 6.1 5.8 – –12 853 40 1.3.z 36.0.z 13.5.z 14.3.z 5.9.z –.z 2.2.z –.z 26.8.z
2 399 52 6.5 12.3 26.9 11.0 30.3 5.3 5.6 2.0 –– – … … … … … … … … …
147.y 28.y … … … … … … … … …
820 45 4.6 11.5 18.3 4.6 5.6 1.5 7.5 . 46.3… … … … … … … … … … …
48.z … … … … … … … … … …
43 … … … … … … … … … …
11.z 50.z 21.4.z 25.7.z 24.8.z 11.8.z 5.5.z –.z –.z 0.3.z 10.6.z
30 31 1.4 11.5 53.2 19.9 5.6 – 8.2 0.2 –17 31 … … … … … … … … …
120 42 0.9 7.7 64.5 19.7 4.9 0.6 1.3 0.4 0.15 52 … … … … … … … … …
4 22 … … … … … … … … …
10...z 13...z … … … … … … … … …
2...y 43...y … … … … … … … … …… … … … … … … … … … …… … … … … … … … … … …… … … … … … … … … … …… … … … … … … … … … …
5.y 13.y 21.9.y 1.8.y 23.7.y 9.3.y 27.9.y 9.0.y 6.5.y –.y –.y
210 25 26.8 2.9 36.9 7.0 8.0 8.5 9.1 . 0.8
(000) % FCountry or territoryEducation
Humanitiesand arts
Socialsciences,business and law Science
Engineering,manufacturing
andconstruction Agriculture
Health and
welfare Services
Not known or
unspecifiedTotal enrolment
PERCENTAGE DISTRIBUTION BY FIELD OF STUDY
Table 9B (continued)
90
02
Education f
or A
ll G
lobal M
onitorin
g R
eport
A N N E X
North America and Western Europe
South and West Asia
Sub-Saharan Africa
3 4 4

..z ..z ..z ..z ..z ..z ..z ..z ..z… … … … … … … … …
69.y 78.y 70.y 51.y 21.y 55.y 64.y 66.y 67.y
..y ..y ..y ..y ..y ..y ..y ..y ..y
78.z 67.z 63.z 49.z 36.z 41.z 72.z 12.z 62.z… … … … … … … … …
– 78 63 11 – – 78 – –75 66 55 34 21 61 67 51 …
73 56 53 32 24 51 72 45 …… … … … … … … … …
88 76 48 36 14 – 69 39 …
71 62 50 33 33 52 80 22 –81 71 63 40 19 51 84 70 …
75 69 61 36 23 41 71 40 …
69 66 49 35 18 47 74 51 …
70.z 73.z 55.z 39.z 28.z 44.z 74.z 44.z –.z
83 66 59 38 32 43 87 82 …
78 64 56 42 16 45 79 48 …
83 62 56 40 27 56 76 . …
87 72 57 50 28 45 66 48 …… … … … … … … … …
72.z 57.z 56.z 35.z 28.z 31.z 67.z 33.z …..y ..y ..y ..y ..y ..y ..y ..y ..y
74 54 47 16 15 50 74 49 4175.z 62.z 56.z 32.z 24.z 57.z 81.z 49.z 59.z
82 61 59 49 26 56 77 49 …… … … … … … … … …
78 61 59 34 28 54 76 57 4576 62 61 43 28 60 81 59 7471 59 46 29 15 49 69 51 …
74 62 55 37 20 61 78 65 6279 58 56 39 16 50 80 53 …
… … … … … … … … …
36.z 41.z 33.z 26.z 15.z 17.z 38.z 33.z 36.z
36 37 33 32 20 20 45 – –44.z 44.z 36.z 40.z 24.z –.z 35.z –.z 38.z
71 71 56 70 26 41 76 57 –… … … … … … … … …… … … … … … … … …
65 43 22 21 15 16 47 . 58… … … … … … … … …
… … … … … … … … …… … … … … … … … …
58.z 62.z 56.z 9.z 12.z –.z –.z 87.z 53.z
20 40 31 23 43 – 31 75 –… … … … … … … … …… … … … … … … … …… … … … … … … … …… … … … … … … … …… … … … … … … … …… … … … … … … … …… … … … … … … … …… … … … … … … … …… … … … … … … … …… … … … … … … … …
9.y 41.y 16.y 21.y 10.y 6.y 20.y –.y –.y
24 32 31 23 15 15 26 . 26
Saint Vincent/Grenad.Suriname
Trinidad and TobagoTurks and Caicos Islands
UruguayVenezuela, Bolivarian Rep. of
AndorraAustria
BelgiumCanadaCyprus
DenmarkFinlandFrance 1
GermanyGreeceIcelandIreland
IsraelItaly
LuxembourgMalta
MonacoNetherlands
NorwayPortugal
San MarinoSpain
SwedenSwitzerland
United KingdomUnited States
AfghanistanBangladesh
BhutanIndia
Iran, Islamic Republic ofMaldives
NepalPakistan
Sri Lanka
AngolaBenin
BotswanaBurkina Faso
BurundiCameroon
Cape VerdeCentral African Republic
ChadComoros
CongoCôte d’IvoireD. R. Congo
Equatorial GuineaEritrea
Ethiopia
Country or territoryEducation
Humanities and arts
Socialsciences,business and law Science
Engineering,manufacturing
andconstruction Agriculture
Health and
welfare ServicesNot known
or unspecified
PERCENTAGE FEMALE IN EACH FIELD
Ta b l e 9 B
S TAT I S T I C A L TA B L E S
North America and Western Europe
South and West Asia
Sub-Saharan Africa
3 4 5

GabonGambiaGhanaGuineaGuinea-BissauKenyaLesothoLiberiaMadagascarMalawiMaliMauritiusMozambiqueNamibiaNigerNigeriaRwandaSao Tome and PrincipeSenegalSeychellesSierra LeoneSomaliaSouth AfricaSwazilandTogoUgandaUnited Republic of TanzaniaZambiaZimbabwe
World
Countries in transitionDeveloped countriesDeveloping countries
Arab StatesCentral and Eastern EuropeCentral AsiaEast Asia and the Pacific
East AsiaPacific
Latin America/CaribbeanCaribbeanLatin America
N. America/W. EuropeSouth and West AsiaSub-Saharan Africa
… … … … … … … … … … …
2 19 3.6.y 34.6.y 18.8.y 20.5.y ..y ..y 15.1.y ..y 7.4.y
140 34 11.4.y 39.1.y 12.0.y 14.6.y 11.6.y 4.3.y 3.7.y 1.8.y 1.5.y
43 21 4.3 11.1 32.0 19.4 3.9 10.9 7.8 1.1 9.5… … … … … … … … … … …
103.y 38.y … … … … … … … … …
9 55 17.2 9.0 34.0 10.5 – 4.2 4.2 – 21.0… … … … … … … … … … …
50 47 2.9 11.2 57.7 12.1 6.0 2.7 7.1 0.1 0.35.y 35.y … … … … … … … … …
33.z 31...z … … … … … … … … …
17 53 18.6 19.3 35.2 8.9 15.4 1.9 0.1 0.3 0.428.z 33.z 7.6.z 11.1.z 43.9.z 13.9.z 9.9.z 5.2.z 5.2.z 2.7.z 0.5.z
13 47 … … … … … … … … …
11 27 … … … … … … … … …
1 392.z 41.z 0.0.z 0.0.z 0.2.z 0.2.z 0.0.z 0.0.z 0.0.z 0.0.z 99.5.z
26...z 39...z … … … … … … … … …. . ..z ..z ..z ..z ..z ..z ..z ..z ..z
59.*,z … … … … … … … … … …. . . . . . . . . . .
… … … … … … … … … … …… … … … … … … … … … …
741 55 13.3 4.9 52.9 10.4 9.5 1.8 5.9 1.2 0.06 50 10.7 21.1 45.5 5.7 3.1 6.1 7.0 0.8 .
… … … … … … … … … … …
88.y 38.y 32.1.y 5.3.y 40.3.y 3.3.y 7.2.y 1.6.y 4.4.y 3.7.y 2.1.y
55 32 12.9...z 7.1...z 20.2...z 15.2...z 9.0...z 4.7...z 6.6...z 1.7..z 22.4...z… … … … … … … … … … …… … … … … … … … … … …
143 723 50 10 11 27 7 11 2 22 2 …
14 432 56 13 6 39 2 25 8 4 3 –43 961 55 9 11 27 9 7 1 14 5 …
85 331 47 10 … 6 7 1 1 9 … 66
7 038 49 8 10 34 10 2 0.1 2 . 3320 125 55 12 7 45 7 16 3 7 3 –
1 974 52 14 8 33 3 11 3 7 4 1543 621 47 6 18 22 9 29 1 9 6 –42 313 47 14 5 40 16 11 3 6 1 3
1 308 55 . . . . . . . . .16 247 54 12 7 43 6 13 3 10 1 5
107 63 4 9 30 13 14 2 9 4 1516 140 53 13 4 36 5 19 4 11 4 …
33 742 56 9 10 37 11 6 0 10 7 …
17 253 41 5 12 18 5 6 2 8 . 463 723 40 … … … … … … … … …
(000) % FCountry or territoryEducation
Humanitiesand arts
Socialsciences,business and law Science
Engineering,manufacturing
andconstruction Agriculture
Health and
welfare Services
Not known or
unspecifiedTotal enrolment
PERCENTAGE DISTRIBUTION BY FIELD OF STUDY
Table 9B (continued)
90
02
Education f
or A
ll G
lobal M
onitorin
g R
eport
A N N E X
MedianSum % F
1. Data include French overseas departments and territories (DOM-TOM).Data in italic are UIS estimates.Data in bold are for the school year ending in 2007.
(z) Data are for the school year ending in 2005.(y) Data are for the school year ending in 2004.(*) National estimate.
3 4 6

… … … … … … … … …
2.y 19.y 14.y 14.y ..y ..y 13.y ..y 68.y
36.y 37.y 42.y 27.y 8.y 20.y 37.y 22.y 33.y
30 20 24 16 12 17 33 15 20… … … … … … … … …… … … … … … … … …… … … … … … … … …… … … … … … … … …
40 59 50 34 18 37 51 43 61… … … … … … … … …… … … … … … … … …
57 63 58 47 27 57 21 9 7833.z 36.z 41.z 21.z 10.z 27.z 54.z 21.z 23.z… … … … … … … … …… … … … … … … … …
49.z 38.z 31.z 4.z 11.z 23.z 33.z 29.z 41.z… … … … … … … … …
..z ..z ..z ..z ..z ..z ..z ..z ..z… … … … … … … … …
. . . . . . . . .… … … … … … … … …… … … … … … … … …
72 61 57 44 26 43 67 66 5053 63 49 36 9 18 65 62 .… … … … … … … … …
39.y 41.y 41.y 24.y 19.y 22.y 40.y 53.y 55.y
38.z 56.z 41.z 24.z 10.z 26.z 29.z 16.z 32...z… … … … … … … … …… … … … … … … … …
70 56 36 29 16 32 63 31 –
… … … … … … … … …
75 66 59 43 27 47 74 48 5355 66 50 49 17 17 62 31 22
70 74 58 57 31 47 59 26 3875 59 63 36 29 40 81 44 –77 71 64 47 39 61 80 36 53… … … … … … … … …… … … … … … … … …
. . . . . . . . .71 65 66 45 25 31 78 30 5269 78 70 51 21 55 64 66 6772 61 61 40 27 36 67 40 5775 62 56 32 24 57 81 49 5944 44 36 40 24 – 35 – 38… … … … … … … … …
GabonGambia
GhanaGuinea
Guinea-BissauKenya
LesothoLiberia
MadagascarMalawi
MaliMauritius
MozambiqueNamibia
NigerNigeria
RwandaSao Tome and Principe
SenegalSeychelles
Sierra LeoneSomalia
South AfricaSwaziland
TogoUganda
United Republic of TanzaniaZambia
Zimbabwe
World
Countries in transitionDeveloped countries
Developing countries
Arab StatesCentral and Eastern Europe
Central AsiaEast Asia and the Pacific
East AsiaPacific
Latin America/CaribbeanCaribbean
Latin AmericaN. America/W. Europe
South and West AsiaSub-Saharan Africa
Country or territoryEducation
Humanities and arts
Socialsciences,business and law Science
Engineering,manufacturing
andconstruction Agriculture
Health and
welfare ServicesNot known
or unspecified
PERCENTAGE FEMALE IN EACH FIELD
Ta b l e 9 B
S TAT I S T I C A L TA B L E S
Median
3 4 7

90
02
Education f
or A
ll G
lobal M
onitorin
g R
eport
A N N E X
AlgeriaBahrainDjiboutiEgyptIraqJordanKuwaitLebanonLibyan Arab JamahiriyaMauritaniaMoroccoOmanPalestinian A. T.QatarSaudi ArabiaSudanSyrian Arab RepublicTunisiaUnited Arab EmiratesYemen
AlbaniaBelarusBosnia and HerzegovinaBulgariaCroatiaCzech RepublicEstoniaHungaryLatviaLithuaniaMontenegroPolandRepublic of MoldovaRomaniaRussian FederationSerbiaSlovakiaSloveniaTFYR MacedoniaTurkeyUkraine
ArmeniaAzerbaijanGeorgiaKazakhstanKyrgyzstanMongoliaTajikistanTurkmenistanUzbekistan
AustraliaBrunei DarussalamCambodiaChina
1 93 7 69 … … … … … … 28 240.7 100 1 100 18 – 18 58 100 58 21 160.01 100 0.05 45 … … … 100.z 100.z 100.z 29 16
14 99 23 99 … … … … … … 24 255 100 6...z 100...z … … … 100.y ..y 100.y 15 16...z
3 100 5 99 … … … … … … 22 204 100 5 100 100 100 100 100 100 100 15 12
11 95 10 99 … … … 9 9 9 13 161 100 2 96 … … … … … … 8 9
… … 0.3...z 100...z … … … 100.y ..y 100.y … 19...z
40 40 40 57 … … … 100.z 100.z 100.z 20 170.4 100 0.5 100 93 . 93 100 . 100 20 183 100 3 99 … … … 100 100 100 29 260.4 96 0.9 99 … … … 36 67 35 21 18
… … … … … … … … … … … …
12 84 17 95 … … … 60 60 60 30 295 96 7 96 87 84 87 24 26 24 24 244 95 … … … … … … … … 20 …
3 100 5 100 59 71 59 50.z 80.z 50.z 19 180.8 93 1.z 97.z … … … … … … 17 15.z
4 100 4...y 100...y … … … … … … 20 21...y
53 … 44 99 … … … 64 64 64 5 6… … … … … … … … … … … …
19 100 18 100 … … … … … … 11 116 100 6 99 76 86 76 … … … 13 14
17 100 24 100 … … … … … … 18 127 100 6 100 … … … … … … 8 8
32 100 31 100 … … … … … … 12 117 99 6 100 … … … … … … 9 10
13 99 11 100 … … … … … … 7 8… … … … … … … … … … … …
77 … 49 98 … … … … … … 12 1713 100 10 100 92 . 92 90 . 90 8 1037 100 36 100 … … … … … … 17 18
642 … 628 100 … … … … … … 7 78 98 10 98 … … … … … … 21 17
16 100 11 100 … … … … … … 10 143 99 2 100 … … … … … … 18 183 99 3.z 99.z … … … … … … 10 11.z
17 99 21 94 … … … … … … 15 26143 100 124 99 … … … … … … 8 8
8 … 5 100 … … … 56.y 20.y 56.y 7 912 100 11 100 78 . 78 90 100 90 9 10
6 100 7 100 … … … … … … 13 1119 … 31 99 … … … … … … 9 11
3 100 2 100 32 – 32 41 40 41 18 243 100 3 99 99 75 99 … … … 25 295 100 5 100 … … … 82 . 82 11 13
… … … … … … … … … … … …
66 96 61 95 … … … 100 100 100 9 9
… … … … … … … … … … … …
0.6.* 83.* 0.6 95 … … … 69 93 67 20.* 192 99 4 96 … … … 85 … … 27 24
875 94 952 98 … … … … … … 27 23
Teaching staff Trained teachers (%)1 Pupil/teacher ratio2
1999
School year ending in School year ending in
FemaleMaleTotal
2006 1999 2006
FemaleMaleTotal
PRE-PRIMARY EDUCATION
Total % F
1999 2006
School year ending in
(000)Total % F(000)
Table 10ATeaching staff in pre-primary and primary education
Country or territory
Arab States
Central and Eastern Europe
Central Asia
East Asia and the Pacific
3 4 8
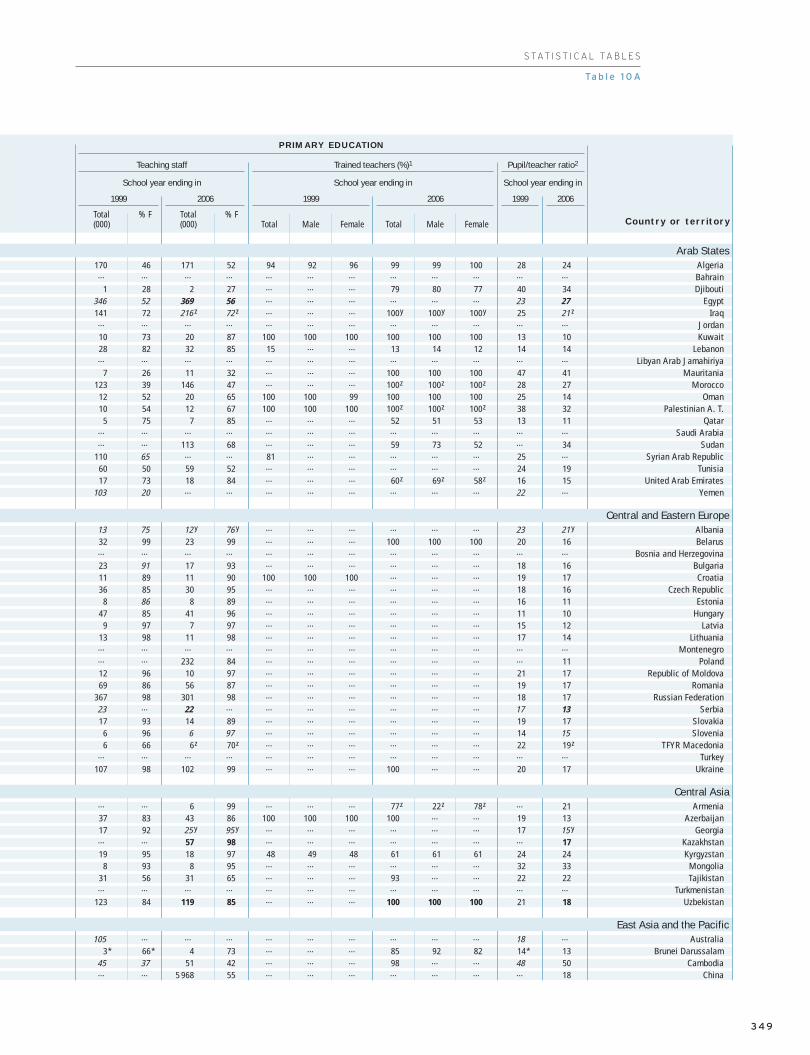
170 46 171 52 94 92 96 99 99 100 28 24… … … … … … … … … … … …
1 28 2 27 … … … 79 80 77 40 34346 52 369 56 … … … … … … 23 27141 72 216...z 72...z … … … 100.y 100.y 100.y 25 21...z… … … … … … … … … … … …
10 73 20 87 100 100 100 100 100 100 13 1028 82 32 85 15 … … 13 14 12 14 14… … … … … … … … … … … …
7 26 11 32 … … … 100 100 100 47 41123 39 146 47 … … … 100.z 100.z 100.z 28 27
12 52 20 65 100 100 99 100 100 100 25 1410 54 12 67 100 100 100 100.z 100.z 100.z 38 32
5 75 7 85 … … … 52 51 53 13 11… … … … … … … … … … … …… … 113 68 … … … 59 73 52 … 34
110 65 … … 81 … … … … … 25 …
60 50 59 52 … … … … … … 24 1917 73 18 84 … … … 60.z 69.z 58.z 16 15
103 20 … … … … … … … … 22 …
13 75 12...y 76...y … … … … … … 23 21...y
32 99 23 99 … … … 100 100 100 20 16… … … … … … … … … … … …
23 91 17 93 … … … … … … 18 1611 89 11 90 100 100 100 … … … 19 1736 85 30 95 … … … … … … 18 16
8 86 8 89 … … … … … … 16 1147 85 41 96 … … … … … … 11 10
9 97 7 97 … … … … … … 15 1213 98 11 98 … … … … … … 17 14… … … … … … … … … … … …… … 232 84 … … … … … … … 1112 96 10 97 … … … … … … 21 1769 86 56 87 … … … … … … 19 17
367 98 301 98 … … … … … … 18 1723 … 22 … … … … … … … 17 1317 93 14 89 … … … … … … 19 17
6 96 6 97 … … … … … … 14 156 66 6.z 70.z … … … … … … 22 19.z
… … … … … … … … … … … …
107 98 102 99 … … … 100 … … 20 17
… … 6 99 … … … 77.z 22.z 78.z … 2137 83 43 86 100 100 100 100 … … 19 1317 92 25...y 95...y … … … … … … 17 15...y… … 57 98 … … … … … … … 1719 95 18 97 48 49 48 61 61 61 24 24
8 93 8 95 … … … … … … 32 3331 56 31 65 … … … 93 … … 22 22… … … … … … … … … … … …
123 84 119 85 … … … 100 100 100 21 18
105 … … … … … … … … … 18 …
3.* 66.* 4 73 … … … 85 92 82 14.* 1345 37 51 42 … … … 98 … … 48 50… … 5 968 55 … … … … … … … 18
S TAT I S T I C A L TA B L E S
Ta b l e 1 0 A
AlgeriaBahrainDjibouti
EgyptIraq
JordanKuwait
LebanonLibyan Arab Jamahiriya
MauritaniaMorocco
OmanPalestinian A. T.
QatarSaudi Arabia
SudanSyrian Arab Republic
TunisiaUnited Arab Emirates
Yemen
AlbaniaBelarus
Bosnia and HerzegovinaBulgariaCroatia
Czech RepublicEstonia
HungaryLatvia
LithuaniaMontenegro
PolandRepublic of Moldova
RomaniaRussian Federation
SerbiaSlovakiaSlovenia
TFYR MacedoniaTurkey
Ukraine
ArmeniaAzerbaijan
GeorgiaKazakhstanKyrgyzstan
MongoliaTajikistan
TurkmenistanUzbekistan
AustraliaBrunei Darussalam
CambodiaChina
Country or territory
Teaching staff Trained teachers (%)1 Pupil/teacher ratio2
1999
School year ending in School year ending in
FemaleMaleTotal
2006 1999 2006
FemaleMaleTotal
PRIMARY EDUCATION
Total % F
1999 2006
School year ending in
(000)Total % F(000)
Arab States
Central and Eastern Europe
Central Asia
East Asia and the Pacific
3 4 9

Cook IslandsDPR KoreaFijiIndonesiaJapanKiribatiLao PDRMacao, ChinaMalaysiaMarshall IslandsMicronesiaMyanmarNauruNew ZealandNiuePalauPapua New GuineaPhilippinesRepublic of KoreaSamoaSingaporeSolomon IslandsThailandTimor-LesteTokelauTongaTuvaluVanuatuViet Nam
AnguillaAntigua and BarbudaArgentinaArubaBahamasBarbadosBelizeBermudaBoliviaBrazilBritish Virgin IslandsCayman IslandsChileColombiaCosta RicaCubaDominicaDominican RepublicEcuadorEl SalvadorGrenadaGuatemalaGuyanaHaitiHondurasJamaicaMexicoMontserratNetherlands AntillesNicaraguaPanama
0.03 100 0.02.z 91.z … … … 61.z –..z 67.z 14 21.z… … … … … … … … … … … …… … 0.5 … … … … … … … … 19
118 98 202 … … … … … … … 17 1696 … 107 98 … … … … … … 31 29… … … … … … … … … … … …
2 100 3 99 86 100 86 80 36 81 18 160.5 100 0.4 100 93 . 93 98 . 98 31 23
21 100 30.z 96.z … … … … … … 27 23.z
0.1 … … … … … … … … … 11 …… … … … … … … … … … … …
2 … 6 99 … … … 50 29 51 22 16… … 0.04 97 … … … 82 – 84 … 18
7 98 7 99 … … … … … … 15 140.01 100 … … … … … … … … 11 …
… … … … … … … … … … … …… … … … … … … … … … … …
18 92 28 97 100 … … … … … 33 3323 100 28 99 … … … … … … 24 20… … 0.1...y 94...y … … … … … … … 42...y… … … … … … … … … … … …… … … … … … … … … … … …
111 79 99 78 … … … … … … 25 25… … 0.2.z 97.z … … … … … … … 29.z… … 0.01...y 100...y … … … … … … … 14...y
0.1 100 … … … … … … … … 18 …… … … … … … … … … … … …… … 0.5 91 … … … … … … … 1194 100 160 98 44 . 44 71 … … 23 17
0.03 100 0.04 98 38 . 38 54 – 55 18 11… … … … … … … … … … … …
50 96 69.z 96.z … … … … … … 24 19.z
0.1 100 0.1 99 100 . 100 100 100 100 26 210.2 97 … … 53 50 53 … … … 9 …
0.3 93 0.4 95 … … … 63.z 29.z 65.z 18 180.2 98 0.3 99 … … … 10 33 9 19 17
… … … … … … … … … … … …
5 93 6...z 92..z … … … … … … 42 41...z
304 98 396.z 97.z … … … … … … 19 18.z
0.03 100 0.05 100 29 . 29 … … … 13 150.1 96 0.05 100 92 50 94 100 . 100 9 13
… … 20 98 … … … … … … … 2059 94 50 96 … … … . . . 18 22
4 97 7 94 92 … … 82 66.* 83.* 19 1526 98 27 100 98 – 100 100 . 100 19 17
0.1 100 0.2.z 100.z 75 . 75 78...y ..y 78...y 18 14.z
8 95 8 94 54 59 53 76 69 76 24 2610 90 15 87 … … … 73 61 75 18 17… … 7 91 … … … 90 62 93 … 33
0.2 96 0.3...z 99...z … … … … … … 18 10.z
12 … 18.* 91.* … … … … … … 26 25.*2 99 2 99 38 41 38 48.z 21.z 49.z 18 16
… … … … … … … … … … … …… … 8 … … … … 64.y 53.y 65.y … 26
5 … 7...z 98...z … … … … … … 25 22...z
150 94 159 96 … … … … … … 22 280.01 100 0.01 100 100 . 100 100 . 100 12 110.3 99 … … 100 100 100 … … … 21 …
6 97 9 92 32 19 33 33 33 33 26 253 98 5 95 36 35 36 45 8 47 19 19
Teaching staff Trained teachers (%)1 Pupil/teacher ratio2
1999
School year ending in School year ending in
FemaleMaleTotal
2006 1999 2006
FemaleMaleTotal
PRE-PRIMARY EDUCATION
Total % F
1999 2006
School year ending in
(000)Total % F(000)
Table 10A (continued)
Country or territory
Latin America and the Caribbean
90
02
Education f
or A
ll G
lobal M
onitorin
g R
eport
A N N E X
3 5 0

0.1 86 0.1.z 77.z … … … 95.z … … 18 16.z… … … … … … … … … … … …… … 4...z 57...z … … … … … … … 28...z… … 1 428 … … … … … … … … 20
367 … 386 65 … … … … … … 21 190.6 62 0.7.z 75.z … … … … … … 25 25.z
27 43 29 46 76 69 85 86 81 91 31 312 87 2 87 81 62 84 89 72 91 31 21
143 66 190.z 66.z … … … … … … 21 17.z
0.6 … … … … … … … … … 15 …… … 1 … … … … … … … … 17
155 73 166 82 60 60 60 98 98 98 31 30… … 0.05 91 … … … … … … … 2320 82 22 83 … … … … … … 18 16
0.02 100 0.02...z 100...z … … … … … … 16 12...z
0.1 82 0.2...z … … … … … … … 15 13...z… … 15 43 … … … … … … … 36
360 87 376 87 100 … … … … … 35 35124 64 148 76 … … … … … … 31 27
1 71 1...y 73...y … … … … … … 24 25...y
11 80 13 83 … … … … … … 27 233 41 … … … … … … … … 19 …
298 63 320 60 … … … … … … 21 18… … 5.z 31.z … … … … … … … 34.z… … 0.04...y 69...y … … … … … … … 6...y
0.8 67 0.8 … … … … … … … 21 220.1 … 0.1.y … … … … … … … 19 19.y
1 49 2.y 54.y … … … … … … 24 20.y
337 78 354 78 78 75 78 96 93 96 30 21
0.1 87 0.09 93 76 78 76 64 17 67 22 17… … … … … … … … … … … …
221 88 279.z 88.z … … … … … … 22 17.z
0.5 78 0.6 82 100 100 100 99 97 100 19 182 63 2 81 58 57 59 89 71 93 14 151 76 1 78 … … … 73.z 78.z 72.z 18 152 64 2 71 … … … 39 37 40 24 23
… … 0.6 89 … … … 100 100 100 … 858 61 64...y 61...y … … … … … … 25 24...y
807 93 887.z 88.z … … … … … … 26 21.z
0.2 86 0.2 88 72 55 75 74 30 80 18 150.2 89 0.3 88 98 96 98 97 94 98 15 12
56 77 66 78 … … … … … … 32 26215 77 188 76 … … … … … … 24 28
20 80 28 80 93 … … 88 88.* 88.* 27 2091 79 89 77 100 100 100 100 100 100 12 10
0.6 75 0.5 84 64 46 70 64 44 68 20 17… … 55 76 … … … 88 81 90 … 2371 68 89 70 … … … 71 70 71 27 23… … 26.* 70.* … … … 94.* 92.* 95.* … 40.*… … 0.9...z 76...z … … … 67...z 65...z 68...z … 18...z
48 … 78.* 64.* … … … … … … 38 31.*4 86 4.z 86.z 52 52 52 57.z 52.z 58.z 27 28.z
… … … … … … … … … … … …… … 46 … … … … 87.y 86.y 88.y … 28… … 12...z 89...z … … … … … … … 28...z
540 62 521 67 … … … … … … 27 280.02 84 0.03 100 100 100 100 77 – 77 21 171 86 … … 100 100 100 … … … 20 …
24 83 29 74 79 63 82 74 59 79 34 3315 75 18 76 79 86 77 91 94 90 26 25
Cook IslandsDPR Korea
FijiIndonesia
JapanKiribati
Lao PDRMacao, China
MalaysiaMarshall Islands
MicronesiaMyanmar
NauruNew Zealand
NiuePalau
Papua New GuineaPhilippines
Republic of KoreaSamoa
SingaporeSolomon Islands
ThailandTimor-Leste
TokelauTongaTuvalu
VanuatuViet Nam
AnguillaAntigua and Barbuda
ArgentinaAruba
BahamasBarbados
BelizeBermuda
BoliviaBrazil
British Virgin IslandsCayman Islands
ChileColombia
Costa RicaCuba
DominicaDominican Republic
EcuadorEl Salvador
GrenadaGuatemala
GuyanaHaiti
HondurasJamaicaMexico
MontserratNetherlands Antilles
NicaraguaPanama
Country or territory
Teaching staff Trained teachers (%)1 Pupil/teacher ratio2
1999
School year ending in School year ending in
FemaleMaleTotal
2006 1999 2006
FemaleMaleTotal
PRIMARY EDUCATION
Total % F
1999 2006
School year ending in
(000)Total % F(000)
Latin America and the Caribbean
S TAT I S T I C A L TA B L E S
Ta b l e 1 0 A
3 5 1
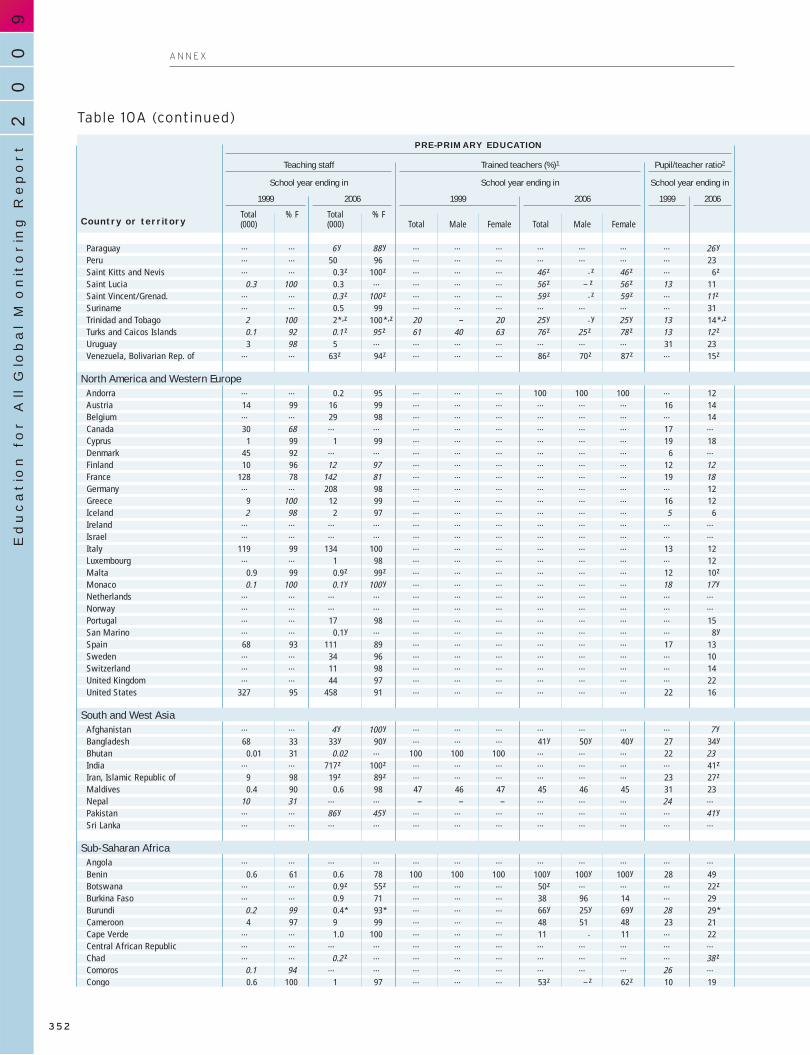
ParaguayPeruSaint Kitts and NevisSaint LuciaSaint Vincent/Grenad.SurinameTrinidad and TobagoTurks and Caicos IslandsUruguayVenezuela, Bolivarian Rep. of
AndorraAustriaBelgiumCanadaCyprusDenmarkFinlandFranceGermanyGreeceIcelandIrelandIsraelItalyLuxembourgMaltaMonacoNetherlandsNorwayPortugalSan MarinoSpainSwedenSwitzerlandUnited KingdomUnited States
AfghanistanBangladeshBhutanIndiaIran, Islamic Republic ofMaldivesNepalPakistanSri Lanka
AngolaBeninBotswanaBurkina FasoBurundiCameroonCape VerdeCentral African RepublicChadComorosCongo
… … 6...y 88...y … … … … … … … 26...y… … 50 96 … … … … … … … 23… … 0.3.z 100.z … … … 46...z ..z 46...z … 6.z
0.3 100 0.3 … … … … 56...z –....z 56...z 13 11… … 0.3...z 100...z … … … 59...z ..z 59...z … 11.z… … 0.5 99 … … … … … … … 31
2 100 2.*,z 100..*,z 20 – 20 25...y ..y 25...y 13 14..*,z
0.1 92 0.1...z 95...z 61 40 63 76...z 25...z 78...z 13 12...z
3 98 5 … … … … … … … 31 23… … 63.z 94.z … … … 86.z 70.z 87.z … 15.z
… … 0.2 95 … … … 100 100 100 … 1214 99 16 99 … … … … … … 16 14… … 29 98 … … … … … … … 1430 68 … … … … … … … … 17 …
1 99 1 99 … … … … … … 19 1845 92 … … … … … … … … 6 …
10 96 12 97 … … … … … … 12 12128 78 142 81 … … … … … … 19 18… … 208 98 … … … … … … … 12
9 100 12 99 … … … … … … 16 122 98 2 97 … … … … … … 5 6
… … … … … … … … … … … …… … … … … … … … … … … …
119 99 134 100 … … … … … … 13 12… … 1 98 … … … … … … … 12
0.9 99 0.9.z 99.z … … … … … … 12 10.z
0.1 100 0.1...y 100...y … … … … … … 18 17...y… … … … … … … … … … … …… … … … … … … … … … … …… … 17 98 … … … … … … … 15… … 0.1.y … … … … … … … … 8.y
68 93 111 89 … … … … … … 17 13… … 34 96 … … … … … … … 10… … 11 98 … … … … … … … 14… … 44 97 … … … … … … … 22
327 95 458 91 … … … … … … 22 16
… … 4...y 100...y … … … … … … … 7...y
68 33 33.y 90.y … … … 41.y 50.y 40.y 27 34.y
0.01 31 0.02 … 100 100 100 … … … 22 23… … 717.z 100.z … … … … … … … 41.z
9 98 19.z 89.z … … … … … … 23 27.z
0.4 90 0.6 98 47 46 47 45 46 45 31 2310 31 … … – – – … … … 24 …… … 86...y 45...y … … … … … … … 41...y… … … … … … … … … … … …
… … … … … … … … … … … …
0.6 61 0.6 78 100 100 100 100.y 100.y 100.y 28 49… … 0.9.z 55.z … … … 50.z … … … 22.z… … 0.9 71 … … … 38 96 14 … 29
0.2 99 0.4.* 93.* … … … 66.y 25.y 69.y 28 29.*4 97 9 99 … … … 48 51 48 23 21
… … 1.0 100 … … … 11 . 11 … 22… … … … … … … … … … … …… … 0.2...z … … … … … … … … 38...z
0.1 94 … … … … … … … … 26 …
0.6 100 1 97 … … … 53.z –..z 62.z 10 19
Teaching staff Trained teachers (%)1 Pupil/teacher ratio2
1999
School year ending in School year ending in
FemaleMaleTotal
2006 1999 2006
FemaleMaleTotal
PRE-PRIMARY EDUCATION
Total % F
1999 2006
School year ending in
(000)Total % F(000)
Table 10A (continued)
Country or territory
90
02
Education f
or A
ll G
lobal M
onitorin
g R
eport
A N N E X
North America and Western Europe
South and West Asia
Sub-Saharan Africa
3 5 2

… … 33...y 72...y … … … … … … … 28...y… … 184 64 … … … … … … … 22… … 0.4 87 … … … 64 … … … 15
1 84 1 86 … … … 80 98 77 22 24… … 1...z 73...z … … … 74...z 68...z 76...z … 18...z… … 4 91 … … … … … … … 16
8 76 8.*,z 72.*,z 71 74 71 81.*,y 72.*,y 84.*,y 21 17.*,z
0.1 92 0.1...z 89...z 81 63 82 82...z 81...z 83...z 18 15.z
18 92 19 … … … … … … … 20 20… … 184.z 81.z … … … 84.z 70.z 87.z … 19.z
… … 0.4 76 … … … 100 100 100 … 1029 89 29 89 … … … … … … 13 12… … 65 79 … … … … … … … 11
141 68 … … … … … … … … 17 …
4 67 4 83 … … … … … … 18 1637 63 … … … … … … … … 10 …
22 71 24 76 … … … … … … 17 16209 78 218 82 … … … … … … 19 19221 82 238 84 … … … … … … 17 14
48 57 61 64 … … … … … … 14 113 76 3 80 … … … … … … 11 10
21 85 27 85 … … … … … … 22 1754 … 60 86 … … … … … … 13 13
254 95 264 96 … … … … … … 11 11… … 3 72 … … … … … … … 11
2 87 3.z 86.z … … … … … … 20 12.z
0.1 87 0.1...y 80...y … … … … … … 16 14...y… … … … … … … … … … … …… … 41...y 73...y … … … … … … … 11...y… … 71 81 … … … … … … … 11… … 0.2.y … … … … … … … … 6.y
172 68 184 70 … … … … … … 15 1462 80 63 81 … … … … … … 12 10… … 41 79 … … … … … … … 13
244 76 250 81 … … … … … … 19 181 618 86 1 761 89 … … … … … … 15 14
26 – 52.z 34.z … … … 36.z … … 36 83.z
312 33 353.y 34.y 64 64 64 48.y 47.y 52.y 56 51.y
2 32 4 50 100 100 100 92 92 92 42 293 135.* 33.* 3 388...y 44...y … … … … … … 35.* 40...y
327 53 374 62 … … … 100.z 100.z 100.z 27 193 60 3 70 67 70 65 68 70 67 24 16
92 23 113 30 46 50 35 31.z 32.z 27.z 39 40… … 428 45 … … … 85 92 75 … 39… … 75...z 79...z … … … … … … … 22...z
… … … … … … … … … … … …
16 23 31 17 58 52 77 72 71 76 53 4412 81 13.z 78.z 90 81 92 87.z 89.z 86.z 27 24.z
17 25 30 30 … … … 87 85 91 49 4612 54 24 55 … … … 88.z 83.z 91.z 57 5441 36 67 40 … … … 62.* 58.* 67.* 52 453 62 3 66 … … … 81 77 84 29 25
… … … … … … … … … … … …
12 9 20.z 12.z … … … 27.z 21.z 70.z 68 63.z
2 26 3...z 33...z … … … … … … 35 35...z
5 42 11 47 … … … 89 84 95 61 55
ParaguayPeru
Saint Kitts and NevisSaint Lucia
Saint Vincent/Grenad.Suriname
Trinidad and TobagoTurks and Caicos Islands
UruguayVenezuela, Bolivarian Rep. of
AndorraAustria
BelgiumCanadaCyprus
DenmarkFinlandFrance
GermanyGreeceIcelandIreland
IsraelItaly
LuxembourgMalta
MonacoNetherlands
NorwayPortugal
San MarinoSpain
SwedenSwitzerland
United KingdomUnited States
AfghanistanBangladesh
BhutanIndia
Iran, Islamic Republic ofMaldives
NepalPakistan
Sri Lanka
AngolaBenin
BotswanaBurkina Faso
BurundiCameroon
Cape VerdeCentral African Republic
ChadComoros
Congo
Country or territory
Teaching staff Trained teachers (%)1 Pupil/teacher ratio2
1999
School year ending in School year ending in
FemaleMaleTotal
2006 1999 2006
FemaleMaleTotal
PRIMARY EDUCATION
Total % F
1999 2006
School year ending in
(000)Total % F(000)
S TAT I S T I C A L TA B L E S
Ta b l e 1 0 A
North America and Western Europe
South and West Asia
Sub-Saharan Africa
3 5 3
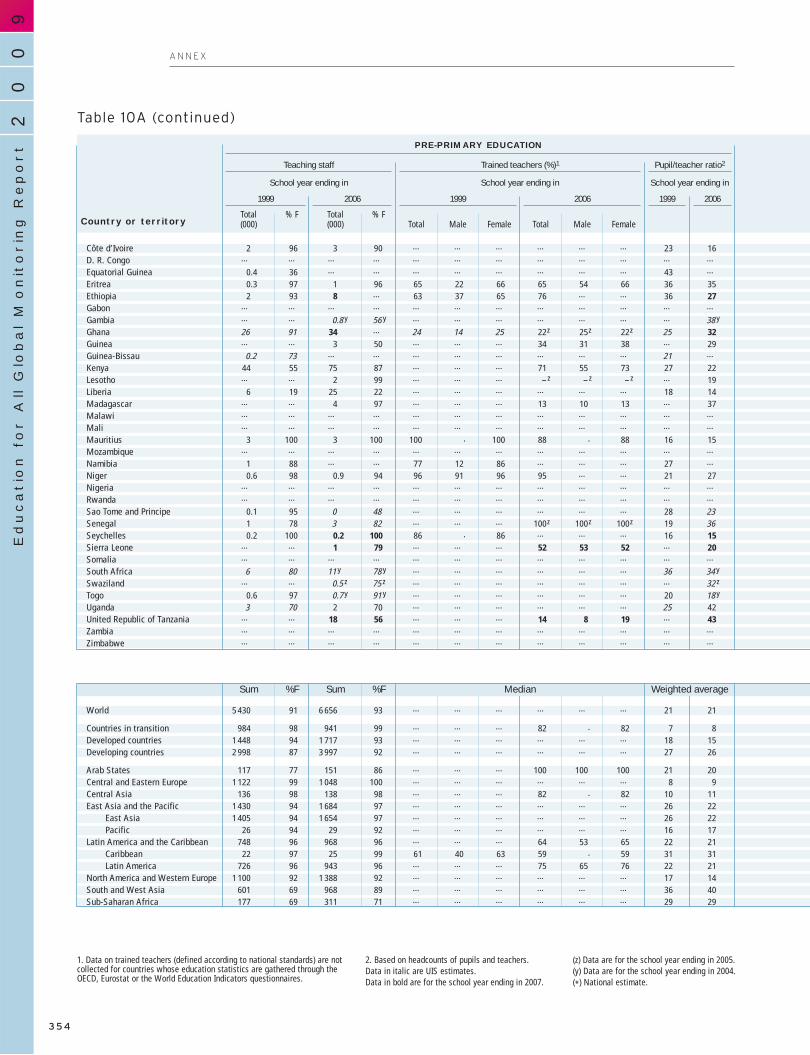
Côte d’IvoireD. R. CongoEquatorial GuineaEritreaEthiopiaGabonGambiaGhanaGuineaGuinea-BissauKenyaLesothoLiberiaMadagascarMalawiMaliMauritiusMozambiqueNamibiaNigerNigeriaRwandaSao Tome and PrincipeSenegalSeychellesSierra LeoneSomaliaSouth AfricaSwazilandTogoUgandaUnited Republic of TanzaniaZambiaZimbabwe
World
Countries in transitionDeveloped countriesDeveloping countries
Arab StatesCentral and Eastern EuropeCentral AsiaEast Asia and the Pacific
East AsiaPacific
Latin America and the CaribbeanCaribbeanLatin America
North America and Western EuropeSouth and West AsiaSub-Saharan Africa
2 96 3 90 … … … … … … 23 16… … … … … … … … … … … …
0.4 36 … … … … … … … … 43 …
0.3 97 1 96 65 22 66 65 54 66 36 352 93 8 … 63 37 65 76 … … 36 27
… … … … … … … … … … … …… … 0.8...y 56...y … … … … … … … 38...y
26 91 34 … 24 14 25 22.z 25.z 22.z 25 32… … 3 50 … … … 34 31 38 … 29
0.2 73 … … … … … … … … 21 …
44 55 75 87 … … … 71 55 73 27 22… … 2 99 … … … –..z –..z –..z … 19
6 19 25 22 … … … … … … 18 14… … 4 97 … … … 13 10 13 … 37… … … … … … … … … … … …… … … … … … … … … … … …
3 100 3 100 100 . 100 88 . 88 16 15… … … … … … … … … … … …
1 88 … … 77 12 86 … … … 27 …
0.6 98 0.9 94 96 91 96 95 … … 21 27… … … … … … … … … … … …… … … … … … … … … … … …
0.1 95 0 48 … … … … … … 28 231 78 3 82 … … … 100.z 100.z 100.z 19 360.2 100 0.2 100 86 . 86 … … … 16 15
… … 1 79 … … … 52 53 52 … 20… … … … … … … … … … … …
6 80 11...y 78...y … … … … … … 36 34...y… … 0.5...z 75...z … … … … … … … 32...z
0.6 97 0.7...y 91...y … … … … … … 20 18...y
3 70 2 70 … … … … … … 25 42… … 18 56 … … … 14 8 19 … 43… … … … … … … … … … … …… … … … … … … … … … … …
5 430 91 6 656 93 … … … … … … 21 21
984 98 941 99 … … … 82 . 82 7 81 448 94 1 717 93 … … … … … … 18 152 998 87 3 997 92 … … … … … … 27 26
117 77 151 86 … … … 100 100 100 21 201 122 99 1 048 100 … … … … … … 8 9
136 98 138 98 … … … 82 . 82 10 111 430 94 1 684 97 … … … … … … 26 221 405 94 1 654 97 … … … … … … 26 22
26 94 29 92 … … … … … … 16 17748 96 968 96 … … … 64 53 65 22 21
22 97 25 99 61 40 63 59 . 59 31 31726 96 943 96 … … … 75 65 76 22 21
1 100 92 1 388 92 … … … … … … 17 14601 69 968 89 … … … … … … 36 40177 69 311 71 … … … … … … 29 29
Teaching staff Trained teachers (%)1 Pupil/teacher ratio2
1999
School year ending in School year ending in
FemaleMaleTotal
2006 1999 2006
FemaleMaleTotal
PRE-PRIMARY EDUCATION
Total % F
1999 2006
School year ending in
(000)Total % F(000)
Table 10A (continued)
Country or territory
90
02
Education f
or A
ll G
lobal M
onitorin
g R
eport
A N N E X
Median Weighted averageSum %F Sum %F
1. Data on trained teachers (defined according to national standards) are notcollected for countries whose education statistics are gathered through theOECD, Eurostat or the World Education Indicators questionnaires.
2. Based on headcounts of pupils and teachers.Data in italic are UIS estimates.Data in bold are for the school year ending in 2007.
(z) Data are for the school year ending in 2005.(y) Data are for the school year ending in 2004.(*) National estimate.
3 5 4
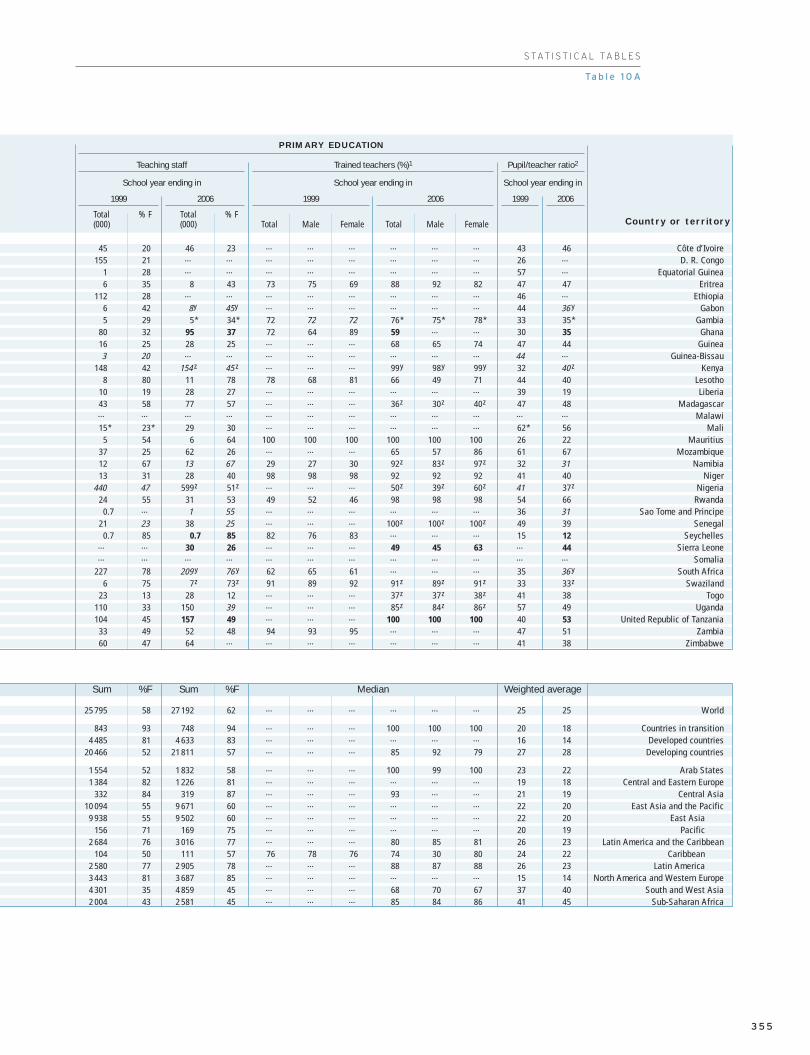
45 20 46 23 … … … … … … 43 46155 21 … … … … … … … … 26 …
1 28 … … … … … … … … 57 …
6 35 8 43 73 75 69 88 92 82 47 47112 28 … … … … … … … … 46 …
6 42 8.y 45.y … … … … … … 44 36...y
5 29 5.* 34.* 72 72 72 76.* 75.* 78.* 33 35.*80 32 95 37 72 64 89 59 … … 30 3516 25 28 25 … … … 68 65 74 47 443 20 … … … … … … … … 44 …
148 42 154...z 45...z … … … 99.y 98.y 99.y 32 40...z
8 80 11 78 78 68 81 66 49 71 44 4010 19 28 27 … … … … … … 39 1943 58 77 57 … … … 36.z 30.z 40.z 47 48… … … … … … … … … … … …
15.* 23.* 29 30 … … … … … … 62.* 565 54 6 64 100 100 100 100 100 100 26 22
37 25 62 26 … … … 65 57 86 61 6712 67 13 67 29 27 30 92.z 83.z 97.z 32 3113 31 28 40 98 98 98 92 92 92 41 40
440 47 599.z 51.z … … … 50.z 39.z 60.z 41 37.z
24 55 31 53 49 52 46 98 98 98 54 660.7 … 1 55 … … … … … … 36 31
21 23 38 25 … … … 100.z 100.z 100.z 49 390.7 85 0.7 85 82 76 83 … … … 15 12
… … 30 26 … … … 49 45 63 … 44… … … … … … … … … … … …
227 78 209...y 76...y 62 65 61 … … … 35 36...y
6 75 7.z 73.z 91 89 92 91.z 89.z 91.z 33 33.z
23 13 28 12 … … … 37.z 37.z 38.z 41 38110 33 150 39 … … … 85.z 84.z 86.z 57 49104 45 157 49 … … … 100 100 100 40 53
33 49 52 48 94 93 95 … … … 47 5160 47 64 … … … … … … … 41 38
25 795 58 27 192 62 … … … … … … 25 25
843 93 748 94 … … … 100 100 100 20 184 485 81 4 633 83 … … … … … … 16 14
20 466 52 21 811 57 … … … 85 92 79 27 28
1 554 52 1 832 58 … … … 100 99 100 23 221 384 82 1 226 81 … … … … … … 19 18
332 84 319 87 … … … 93 … … 21 1910 094 55 9 671 60 … … … … … … 22 20
9 938 55 9 502 60 … … … … … … 22 20156 71 169 75 … … … … … … 20 19
2 684 76 3 016 77 … … … 80 85 81 26 23104 50 111 57 76 78 76 74 30 80 24 22
2 580 77 2 905 78 … … … 88 87 88 26 233 443 81 3 687 85 … … … … … … 15 144 301 35 4 859 45 … … … 68 70 67 37 402 004 43 2 581 45 … … … 85 84 86 41 45
Côte d’IvoireD. R. Congo
Equatorial GuineaEritrea
EthiopiaGabon
GambiaGhana
GuineaGuinea-Bissau
KenyaLesothoLiberia
MadagascarMalawi
MaliMauritius
MozambiqueNamibia
NigerNigeria
RwandaSao Tome and Principe
SenegalSeychelles
Sierra LeoneSomalia
South AfricaSwaziland
TogoUganda
United Republic of TanzaniaZambia
Zimbabwe
World
Countries in transitionDeveloped countries
Developing countries
Arab StatesCentral and Eastern Europe
Central AsiaEast Asia and the Pacific
East AsiaPacific
Latin America and the CaribbeanCaribbean
Latin AmericaNorth America and Western Europe
South and West AsiaSub-Saharan Africa
Country or territory
Teaching staff Trained teachers (%)1 Pupil/teacher ratio2
1999
School year ending in School year ending in
FemaleMaleTotal
2006 1999 2006
FemaleMaleTotal
PRIMARY EDUCATION
Total % F
1999 2006
School year ending in
(000)Total % F(000)
Ta b l e 1 0 A
S TAT I S T I C A L TA B L E S
Median Weighted averageSum %F Sum %F
3 5 5

AlgeriaBahrainDjiboutiEgyptIraqJordanKuwaitLebanonLibyan Arab JamahiriyaMauritaniaMoroccoOmanPalestinian A. T.QatarSaudi ArabiaSudanSyrian Arab RepublicTunisiaUnited Arab EmiratesYemen
AlbaniaBelarusBosnia and HerzegovinaBulgariaCroatiaCzech Republic3
EstoniaHungaryLatviaLithuaniaMontenegroPolandRepublic of MoldovaRomaniaRussian FederationSerbiaSlovakiaSloveniaTFYR MacedoniaTurkeyUkraine
ArmeniaAzerbaijanGeorgiaKazakhstanKyrgyzstanMongoliaTajikistanTurkmenistanUzbekistan
AustraliaBrunei DarussalamCambodia
… … 113...y 51...y … … 64...y 46...y … … 176...y 49...y … … …… … … … … … … … … … … … … … …
0.5 24 … … 0.2 17 … … 0.7 22 1.0 23 … … …
207 44 231...y 45...y 247 38 257...y 38...y 454 41 488...y 41...y … … …
34 77 61...z 59...z 23 57 32...z 56...z 56 69 93...z 58..z 100.y 100.y 100.y… … … … 10 48 10.y 35.y … … … … … … …
11 58 … … 11 53 … … 22 56 24 53 100.z 100.z 100.z
27 57 19 61 15 42 22 47 42 51 41 53 12 14 11… … … … … … 74 71 … … … … … … …
1 11 2 11 1 10 2.* 11.* 2 10 4.* 11.* 100.* 100.* 100.*53 35 60...y 36...y 35 29 40...y 29...y 88 33 100...y 33...y … … …
7 48 12 54 5 51 7 48 13 50 19 52 100 100 10014 49 19 51 3 38 5 46 18 48 25 50 … … …
2 56 3 56 2 57 3 57 4 57 6 57 56 45 65… … … … … … … … … … … … … … …… … 30 67 18 47 36 42 … … 66 54 80 … …… … … … … … 40 47 54 … … … … … …
27 46 33 52 30 35 32 45 56 40 65 49 … … …
8 54 13 56 8 55 11 53 16 55 24 55 46.z 47.z 46.z
29 20 … … 19 18 … … 48 19 … … … … …
16 51 … … 6 54 … … 22 52 23...y 56...y … … …… … … … … … … … 107 77 103 80 … … …… … … … … … … … … … … … … … …
27 76 24 80 29 70 32 76 56 73 56 77 … … …
16 67 18 71 18 62 23 64 33 64 41 67 … … …… … 43 74 … … 48 57 … … 92 65 … … …
5 85 5 82 6 78 3 81 11 81 8 82 … … …
47 86 49 78 53 59 41 64 100 71 90 72 … … …
16 83 15 85 9 76 10 85 25 80 25 85 … … …
24 81 39 82 12 76 … … 36 79 41 81 … … …… … … … … … … … … … … … … … …… … 128 73 … … 134 65 … … 261 69 … … …
25 74 23 77 8 68 8 73 33 72 31 76 … … …
104 67 89 68 73 60 68 65 177 64 157 67 … … …… … … … … … … … … … 1 284 80 … … …
24 … 25 … 24 … 27 63 48 … 52 … … … …
29 77 27 76 25 66 23 69 54 72 50 73 … … …
7 77 … … 9 62 … … 17 69 16 71 … … …
8 46 9.z 51.z 5 53 6.z 56.z 13 49 15.z 53.z … … …… … … … … … 168 42 … … … … … … …… … … … … … … … 400 76 349 79.* … … …
… … … … … … … … … … 43 83 … … …… … … … … … … … 118 63 129 66 … … …… … … … … … … … 59 77 34...y 82...y … … …… … … … … … … … … … 180 85 … … …… … … … … … … … 48 68 53 73 78 76 78
8 69 11 75 3 67 5 70 11 69 16 73 … … …… … … … … … … … 47 43 61 47 92.y … …… … … … … … … … … … … … … … …… … … … … … … … 307 57 352 63 100 100 100
… … … … … … … … … … … … … … …
2.* 48.* … … 1.* 47.* … … 3 48 4 59 90 91 9014 28 21 33 4 24 9 31 18 27 29 32 95 … …
Lower secondary
Teaching staff
Total secondary
Trained teachers (%)1
2006
School year ending in
FemaleMaleTotal
SECONDARY EDUCATION
Total % F
1999 2006
School year ending in
(000)Total % F(000)
Table 10BTeaching staff in secondary and tertiary education
Country or territory
Upper secondary
Total % F
1999 2006
School year ending in
(000)Total % F(000)
Total secondary
Total % F
1999 2006
School year ending in
(000)Total % F(000)
90
02
Education f
or A
ll G
lobal M
onitorin
g R
eport
A N N E X
Arab States
Central and Eastern Europe
Central Asia
East Asia and the Pacific
3 5 6

AlgeriaBahrainDjibouti
EgyptIraq
JordanKuwait
LebanonLibyan Arab Jamahiriya
MauritaniaMorocco
OmanPalestinian A. T.
QatarSaudi Arabia
SudanSyrian Arab Republic
TunisiaUnited Arab Emirates
Yemen
AlbaniaBelarus
Bosnia and HerzegovinaBulgariaCroatia
Czech Republic 3
EstoniaHungary
LatviaLithuania
MontenegroPoland
Republic of MoldovaRomania
Russian FederationSerbia
SlovakiaSlovenia
TFYR MacedoniaTurkey
Ukraine
ArmeniaAzerbaijan
GeorgiaKazakhstanKyrgyzstan
MongoliaTajikistan
TurkmenistanUzbekistan
AustraliaBrunei Darussalam
Cambodia
… 21...y … 20...y … 21...y … … 30 34… … … … … … … … 0.8...z 41...z
26 … 16 … 23 31 0.02 30 0.1 1622 20...y 13 14...y 17 17...y … … 81...y …
22 19...z 16 19...z 20 19...z 12 31 19...z 35...z… … 17 17.y … … … … 8 2112 … 9 … 11 10 2 … 2 27
9 10 8 8 9 9 9 28 21 37… … … 5 … … 12 13 … …
28 28 24 24.* 26 26.* … … 0.4 419 20...y 14 17...y 17 19...y 16 23 19 2419 13 16 20 18 16 … … 3 3426 29 19 22 24 28 3 13 6 1713 10 8 9 10 10 0.7 32 0.7.z 32.z… … … … … … 20 36 27 33… 28 22 17 … 22 4 23 … …… … … 11 19 … … … … …
23 20 15 19 19 19 6 41 17 4114 14 10 10 12 12 … … … …
22 … 21 … 22 … 5 1 6...z 16...z
16 … 17 … 16 18...y 2 36 2...y 41...y… … … … 9 9 30 51 42 56… … … … … … … … … …
13 12 12 11 13 12 24 41 22 4614 11 11 8 12 10 7 35 9 41… 11 … 10 … 11 19 38 23 3811 11 10 19 10 14 6 49 6 4811 10 9 12 10 11 21 38 25 3910 10 10 11 10 10 6 52 6 5711 8 11 … 11 10 15 50 13 53… … … … … … … … … …… 13 … 13 … 13 76 … 98 4213 12 12 14 13 12 7 50 8 5512 11 13 15 13 13 26 37 32 43… … … … … 9 … … 656 5717 13 14 11 15 12 … … … …
13 13 12 13 13 13 11 38 13 4214 … 13 … 13 11 2 21 5 3416 14.z 16 16.z 16 15.z 3 42 3.z 44.z… … … 17 … … 60 35 85 39… … … … 13 11 133 … 192 …
… … … … … 8 9 42 13 46… … … … 8 8 13 36 16 41… … … … 8 9...y 14 49 12 39… … … … … 10 27 58 43 63… … … … 13 14 8 32 13 5619 21 17 19 19 20 6 47 8 55… … … … 16 16 6 29 9 32… … … … … … … … … …… … … … 11 13 17 36 23 36
… … … … … … … … … …
12.* … 10.* … 11 11 0.5 32 0.6 3916 30 21 25 18 28 1 19 3 11
Country or territory
Teaching staff
Total % F
1999 2006
School year ending in
(000)Total % F(000)
S TAT I S T I C A L TA B L E S
Ta b l e 1 0 B
Lower secondary
Pupil/teacher ratio2
SECONDARY EDUCATION TERTIARY EDUCATION
1999 2006
School year ending in
Upper secondary
1999 2006
School year ending in
Total secondary
1999 2006
School year ending in
Arab States
Central and Eastern Europe
Central Asia
East Asia and the Pacific
3 5 7
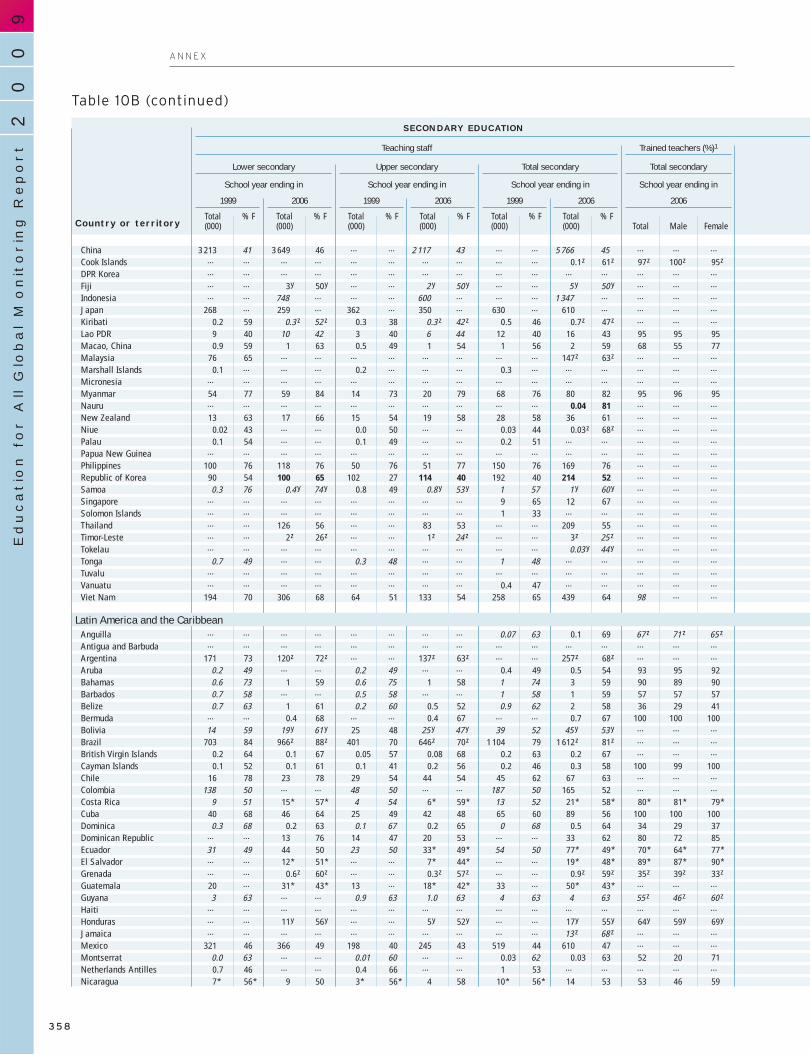
ChinaCook IslandsDPR KoreaFijiIndonesiaJapanKiribatiLao PDRMacao, ChinaMalaysiaMarshall IslandsMicronesiaMyanmarNauruNew ZealandNiuePalauPapua New GuineaPhilippinesRepublic of KoreaSamoaSingaporeSolomon IslandsThailandTimor-LesteTokelauTongaTuvaluVanuatuViet Nam
AnguillaAntigua and BarbudaArgentinaArubaBahamasBarbadosBelizeBermudaBoliviaBrazilBritish Virgin IslandsCayman IslandsChileColombiaCosta RicaCubaDominicaDominican RepublicEcuadorEl SalvadorGrenadaGuatemalaGuyanaHaitiHondurasJamaicaMexicoMontserratNetherlands AntillesNicaragua
3 213 41 3 649 46 … … 2 117 43 … … 5 766 45 … … …… … … … … … … … … … 0.1.z 61.z 97.z 100.z 95.z… … … … … … … … … … … … … … …… … 3.y 50.y … … 2...y 50...y … … 5...y 50...y … … …… … 748 … … … 600 … … … 1 347 … … … …
268 … 259 … 362 … 350 … 630 … 610 … … … …
0.2 59 0.3...z 52...z 0.3 38 0.3...z 42...z 0.5 46 0.7.z 47.z … … …
9 40 10 42 3 40 6 44 12 40 16 43 95 95 950.9 59 1 63 0.5 49 1 54 1 56 2 59 68 55 77
76 65 … … … … … … … … 147.z 63.z … … …
0.1 … … … 0.2 … … … 0.3 … … … … … …… … … … … … … … … … … … … … …
54 77 59 84 14 73 20 79 68 76 80 82 95 96 95… … … … … … … … … … 0.04 81 … … …
13 63 17 66 15 54 19 58 28 58 36 61 … … …
0.02 43 … … 0.0 50 … … 0.03 44 0.03.z 68.z … … …
0.1 54 … … 0.1 49 … … 0.2 51 … … … … …… … … … … … … … … … … … … … …
100 76 118 76 50 76 51 77 150 76 169 76 … … …
90 54 100 65 102 27 114 40 192 40 214 52 … … …
0.3 76 0.4...y 74...y 0.8 49 0.8...y 53...y 1 57 1...y 60...y … … …… … … … … … … … 9 65 12 67 … … …… … … … … … … … 1 33 … … … … …… … 126 56 … … 83 53 … … 209 55 … … …… … 2.z 26.z … … 1.z 24...z … … 3.z 25...z … … …… … … … … … … … … … 0.03...y 44...y … … …
0.7 49 … … 0.3 48 … … 1 48 … … … … …… … … … … … … … … … … … … … …… … … … … … … … 0.4 47 … … … … …
194 70 306 68 64 51 133 54 258 65 439 64 98 … …
… … … … … … … … 0.07 63 0.1 69 67...z 71...z 65...z… … … … … … … … … … … … … … …
171 73 120.z 72.z … … 137.z 63.z … … 257.z 68.z … … …
0.2 49 … … 0.2 49 … … 0.4 49 0.5 54 93 95 920.6 73 1 59 0.6 75 1 58 1 74 3 59 90 89 900.7 58 … … 0.5 58 … … 1 58 1 59 57 57 570.7 63 1 61 0.2 60 0.5 52 0.9 62 2 58 36 29 41
… … 0.4 68 … … 0.4 67 … … 0.7 67 100 100 10014 59 19...y 61...y 25 48 25...y 47...y 39 52 45...y 53...y … … …
703 84 966.z 88.z 401 70 646.z 70.z 1 104 79 1 612.z 81.z … … …
0.2 64 0.1 67 0.05 57 0.08 68 0.2 63 0.2 67 … … …
0.1 52 0.1 61 0.1 41 0.2 56 0.2 46 0.3 58 100 99 10016 78 23 78 29 54 44 54 45 62 67 63 … … …
138 50 … … 48 50 … … 187 50 165 52 … … …
9 51 15.* 57.* 4 54 6.* 59.* 13 52 21.* 58.* 80.* 81.* 79.*40 68 46 64 25 49 42 48 65 60 89 56 100 100 1000.3 68 0.2 63 0.1 67 0.2 65 0 68 0.5 64 34 29 37
… … 13 76 14 47 20 53 … … 33 62 80 72 8531 49 44 50 23 50 33.* 49.* 54 50 77.* 49.* 70.* 64.* 77.*… … 12.* 51.* … … 7.* 44.* … … 19.* 48.* 89.* 87.* 90.*… … 0.6.z 60.z … … 0.3.z 57.z … … 0.9.z 59.z 35.z 39.z 33.z
20 … 31.* 43.* 13 … 18.* 42.* 33 … 50.* 43.* … … …
3 63 … … 0.9 63 1.0 63 4 63 4 63 55...z 46...z 60...z… … … … … … … … … … … … … … …… … 11.y 56.y … … 5.y 52.y … … 17.y 55.y 64.y 59.y 69.y… … … … … … … … … … 13...z 68...z … … …
321 46 366 49 198 40 245 43 519 44 610 47 … … …
0.0 63 … … 0.01 60 … … 0.03 62 0.03 63 52 20 710.7 46 … … 0.4 66 … … 1 53 … … … … …
7.* 56.* 9 50 3.* 56.* 4 58 10.* 56.* 14 53 53 46 59
Lower secondary
Teaching staff
Total secondary
Trained teachers (%)1
2006
School year ending in
FemaleMaleTotal
SECONDARY EDUCATION
Total % F
1999 2006
School year ending in
(000)Total % F(000)
Table 10B (continued)
Country or territory
Upper secondary
Total % F
1999 2006
School year ending in
(000)Total % F(000)
Total secondary
Total % F
1999 2006
School year ending in
(000)Total % F(000)
Latin America and the Caribbean
90
02
Education f
or A
ll G
lobal M
onitorin
g R
eport
A N N E X
3 5 8

ChinaCook Islands
DPR KoreaFiji
IndonesiaJapan
KiribatiLao PDR
Macao, ChinaMalaysia
Marshall IslandsMicronesia
MyanmarNauru
New ZealandNiue
PalauPapua New Guinea
PhilippinesRepublic of Korea
SamoaSingapore
Solomon IslandsThailand
Timor-LesteTokelau
TongaTuvalu
VanuatuViet Nam
AnguillaAntigua and Barbuda
ArgentinaAruba
BahamasBarbados
BelizeBermuda
BoliviaBrazil
British Virgin IslandsCayman Islands
ChileColombia
Costa RicaCuba
DominicaDominican Republic
EcuadorEl Salvador
GrenadaGuatemala
GuyanaHaiti
HondurasJamaicaMexico
MontserratNetherlands Antilles
Nicaragua
17 17 … 18 … 18 504 … 1 332 42… … … … … 16.z . . . .… … … … … … … … … …… 22.y … 22...y … 22...y … … … …… 13 … 11 … 12 … … 272.z 39...z
16 14 13 11 14 12 465 … 511 1821 21...z 19 13...z 20 17.z . . . .20 23 22 27 20 25 1 31 3 3424 23 21 20 23 22 0.7 … 2 3218 … … … … 17.z … … 45.z 48.z
28 … 18 … 22 … … … … …… … … … … … 0.1 … … …
28 34 38 32 30 34 9 76 … …… … … … … 16 . . . .18 15 13 14 15 15 11 43 15 50
6 … 21 … 11 8.z . . . .14 … 12 … 13 … … … … …… … … … … … 1 20 … …
41 42 21 26 34 37 94 … 113...z 56...z
22 21 23 16 23 18 127 25 193 3126 25...y 17 19...y 20 21...y 0.2 41 … …… … … … 19 18 … … … …… … … … 13 … . . ..z ..z… 22 … 21 … 22 50 53 70 51… 28.z … 18.z … 24.z … … … …… … … … … 7...y . . . .15 … 13 … 15 … 0.07 21 … …… … … … … … . . . .… … … … 23 … … … … …
29 21 29 27 29 23 28 37 48.z 40.z
… … … … 15 10 . . 0.02 50… … … … … … . . ..y ..y
13 18.z … 10.z … 14.z 102 54 139...z 50...z
16 … 16 … 16 14 0.2 43 0.2 4623 13 23 12 23 13 … … … …
18 … 18 … 18 15 0.6 41 … …
24 18 23 15 24 17 … … 0.1.z 49...z… 6 … 6 … 6 … … 0.1 5524 … 20 24...y 21 … 13 … 18.y …
23 16.z 21 15.z 23 15.z 174 41 293.z 44.z
6 11 10 8 7 10 0.08 49 0.1...z 55...z
11 11 7 7 9 9 0.02 42 0.05 2432 25 27 24 29 24 … … … …
19 … 20 … 19 27 86 34 87.* 35.*18 18.* 18 17.* 18 18.* … … … …
12 10 10 11 11 10 24 48 116 5821 21 15 11 19 16 . . ..z ..z… 24 28 24 … 24 … … 11...y 41...y
17 14 17 14.* 17 14.* … … … …… 29.* … 26.* … 28.* 7 32 9 33… 14...z … 18.*,z … 15.*,z . . ..z ..z
15 17.* 11 14.* 13 16.* … … 4 3119 … 19 18 19 18 … … 0.5 48… … … … … … … … … …… 28.y … 45.y … 33.y … … 7...y 38...y… … … … … 18...z … … … …
18 20 14 15 17 18 192 … 262 …
11 … 10 … 10 12 . . . .12 … 21 … 15 … 0.2 42 … …
31.* 33 31 32 31 33 … … … …
Country or territory
Teaching staff
Total % F
1999 2006
School year ending in
(000)Total % F(000)
Ta b l e 1 0 B
Lower secondary
Pupil/teacher ratio2
SECONDARY EDUCATION TERTIARY EDUCATION
1999 2006
School year ending in
Upper secondary
1999 2006
School year ending in
Total secondary
1999 2006
School year ending in
Latin America and the Caribbean
S TAT I S T I C A L TA B L E S
3 5 9

PanamaParaguayPeruSaint Kitts and NevisSaint LuciaSaint Vincent/Grenad.SurinameTrinidad and TobagoTurks and Caicos IslandsUruguayVenezuela, B. R.
AndorraAustriaBelgiumCanadaCyprusDenmarkFinlandFranceGermanyGreeceIcelandIrelandIsraelItalyLuxembourgMaltaMonacoNetherlandsNorwayPortugalSan MarinoSpainSwedenSwitzerlandUnited KingdomUnited States
AfghanistanBangladeshBhutanIndiaIran, Islamic Republic ofMaldivesNepalPakistanSri Lanka
AngolaBeninBotswanaBurkina FasoBurundiCameroonCape VerdeCentral African RepublicChadComoros
8 55 9 60 6 55 7 54 14 55 16 58 90 88 92… … … … … … … … … … 44...y 62...y … … …… … … … … … … … … … 173 45 … … …… … … … … … … … … … 0.4 66 46 … …
0.4 65 0.8 64 0.3 62 … … 0.7 64 1 64 57 53 59… … 0.4...z 58...z … … 0.2...z 57...z … … 1...z 58...z 55...z 58...z 53...z… … 2 64 … … 1 52 … … 3 59 … … …
3 61 3...z 62...z 2 55 2...z 62...z 6 59 6...z 62...z 56...y 58...y 54...y
0.1 61 0.1...z 61...z 0.05 63 0.07...z 64...z 0.1 62 0.2...z 62...z 100...z 100...z 100...z
14 75 14 … 5 65 7 … 19 72 21 … … … …… … 116.z 65.z … … 72.z 60.z … … 188.z 63.z 83.z 76.z 86.z
… … 0.4.z 61.z … … 0.07.z 51.z … … 0.5.z 59.z … … …
43 64 43 69 30 49 29 51 73 57 72 62 … … …… … 43 60 … … … … … … 82 57 … … …
71 68 … … 68 68 … … 139 68 … … … … …
2 54 3 68 2 49 3 55 5 51 6 61 … … …
20 63 … … 24 30 … … 44 45 … … … … …
20 71 21.z 72.z … … 14...z 59...z … … 35...z 67...z … … …
255 … … … 240 … … … 495 57 524 58 … … …
365 57 412 61 168 39 182 47 533 51 594 57 … … …
37 64 42 66 38 49 44 48 75 56 86 57 … … …
1 78 1 80 1 44 2 53 3 58 3 65 … … …… … … … … … … … … … 30 62 … … …
19 … 21 79 36 … 30 65 55 … 51 71 … … …
177 73 178 76 245 59 249 60 422 65 427 67 … … …… … … … … … … … … … 4 47 … … …
3 50 3.z 60.z 0.2 31 … … 4 48 4.z 57.z … … …
0.2 69 … … 0.2 54 … … 0.4 61 0.4...y 66...y … … …… … … … … … … … … … 107 46 … … …… … 20...y 73...y 26 44 26...y 47...y … … 46...y 58...y … … …… … 47 67 … … 47 65 … … 94 66 … … …… … 0.1.y 69.y … … … … … … … … … … …… … 161 62 … … 121 50 … … 282 57 … … …
28 … 40 66 35 50 39 51 63 … 79 59 … … …… … 32 49 … … … … … … 42 47 … … …
142 55 153.z 61.z 212 56 235.z 61.z 355 56 388.z 61.z … … …
764 60 921 68 740 51 758 56 1 504 56 1 680 62 … … …
… … 32.z ….z … … … … … … … … … … …
136 13 186.y 17.y 129 13 192.y 19.y 265 13 378.y 18.y 32.y 31.y 35.y
0.4 32 1 49 0.2 32 0.8 28 0.6 32 2 41 92 92 92… … 1 312.y 37.y … … 1 274.y 31.y 1 995 34 2 586.y 34.y … … …
179 45 236.z 49.z 143 44 294.z 47.z 322 45 530.z 48.z 100.z 100.z 100.z
0.8 25 3 39 0.05 27 … … 0.9 25 … … … … …
22 12 30.y 16.y 18 7 … … 40 9 … … … … …… … … … … … … … … … 197.*,y 51.*,y … … …… … 67...y 64...y … … 52...y 62...y … … 119...y 63...y … … …
… … … … … … … … 16 33 … … … … …
6 12 10...y 11...y 3 14 4...y 15...y 9 12 14...y 12...y … … …… … … … … … … … 9 45 12...z 54...z … … …
5 … … … 1 … … … 6 … 11 17 26 25 30… … … … … … … … … … 8...y 21...y … … …
13 28 … … 13 28 … … 26 28 43 26 … … …… … 2 40 … … 1 36 … … 3 38 62.z 60.z 65.z… … … … … … … … … … … … … … …
2 5 … … 1 6 … … 4 5 7...z … … … …… … 2...z 16...z … … 1...z 9...z … … 3...z 13...z … … …
Lower secondary
Teaching staff
Total secondary
Trained teachers (%)1
2006
School year ending in
FemaleMaleTotal
SECONDARY EDUCATION
Total % F
1999 2006
School year ending in
(000)Total % F(000)
Table 10B (continued)
Country or territory
Upper secondary
Total % F
1999 2006
School year ending in
(000)Total % F(000)
Total secondary
Total % F
1999 2006
School year ending in
(000)Total % F(000)
North America and Western Europe
South and West Asia
Sub-Saharan Africa
90
02
Education f
or A
ll G
lobal M
onitorin
g R
eport
A N N E X
3 6 0

PanamaParaguay
PeruSaint Kitts and Nevis
Saint LuciaSaint Vincent/Grenad.
SurinameTrinidad and Tobago
Turks and Caicos IslandsUruguay
Venezuela, B. R.
AndorraAustria
BelgiumCanadaCyprus
DenmarkFinlandFrance
GermanyGreeceIcelandIreland
IsraelItaly
LuxembourgMalta
MonacoNetherlands
NorwayPortugal
San MarinoSpain
SwedenSwitzerland
United KingdomUnited States
AfghanistanBangladesh
BhutanIndia
Iran, Islamic Republic ofMaldives
NepalPakistan
Sri Lanka
AngolaBenin
BotswanaBurkina Faso
BurundiCameroon
Cape VerdeCentral African Republic
ChadComoros
17 17 15 15 16 16 8 … 12 46… … … … … 12...y … … … …… … … … … 16 … … … …… … … … … 11 . . ..z ..z
19 11 16 … 18 17 … … 0.2 47… 18...z … 18...z … 18...z . . ..z ..z… 16 … 11 … 14 … … … …
22 16...z 19 16...z 21 16...z 0.5 31 2...z 33...z
9 9...z 9 9...z 9 9...z . . ..z ..z
12 13 23 20 15 15 11 … 14 …… 12.z … 9.z … 11.z … … 109.* …
… 7.z … 14.z … 8.z … … 0.08 409 9 12 14 10 11 26 … 40 35
… 7 … … … 10 … … 26 4117 … … … … … 129 41 … …
14 11 12 11 13 11 1 34 2 4010 … 9 … 10 … … … … …
10 10.z … 17...z … 12...z 18 46 19 4613 … 11 … 12 11 102 40 136.y 39.y
15 13 16 16 15 14 272 30 288 3510 8 10 8 10 8 17 31 29 3511 10 14 12 13 11 1 43 2 44… … … … … 11 10 33 12 3812 12 9 12 10 12 … … … …
10 10 11 11 11 11 73 28 100 34… … … … … 10 … … … …… 8.z … … … 10.z 0.7 25 0.7...z 23...z
10 … 7 … 8 9...y . . . .… … … … … 13 … … 44 36… 9...y 8 8...y … 9...y 14 36 18 40… 8 … 6 … 7 … … 37 43… 6.y … … … … … … … …… 12 … 9 … 11 108 35 146 3912 10 18 9 15 9 29 … 36 43… 9 … … … 14 8 16 33 3116 15.z 14 14.z 15 15.z 92 32 126 4116 14 14 15 15 15 992 41 1 290 45
… 14.z … … … … … … 2.y 12.y
43 34.y 32 21.y 37 27.y 45 14 52.z 15.z
35 30 27 12 32 23 0.2 … 0.4 …… 37.y … 28.y 34 33.y … … 539.y 40.y
30 19.z 31 19.z 30 19.z 65 17 122 2018 11 9 … 17 … . . – –38 40.y 24 … 32 … … … … …… … … … … 42...y … … 45 37… 20...y … 19...y … 20...y … … … …
… … … … 18 … 0.8 20 … …
27 27...y 15 16...y 24 24...y 0.7 9 … …… … … … 18 14...z 0.5 28 0.5.z 37.z
29 … 23 … 28 30 0.8 … 1 7… … … … … 19...y 0.4 … 0.7...z 14...z
26 … 21 … 24 16 3 … 3.z …… 21 … 17 … 19 … … 0.5 43… … … … … … 0.3 5 … …
41 … 23 … 34 34...z … … 1...z 3...z… 16...z … 11...z … 14...z 0.1 10 0.1...y 15...y
Country or territory
Teaching staff
Total % F
1999 2006
School year ending in
(000)Total % F(000)
Ta b l e 1 0 B
Lower secondary
Pupil/teacher ratio2
SECONDARY EDUCATION TERTIARY EDUCATION
1999 2006
School year ending in
Upper secondary
1999 2006
School year ending in
Total secondary
1999 2006
School year ending in
North America and Western Europe
South and West Asia
Sub-Saharan Africa
S TAT I S T I C A L TA B L E S
3 6 1
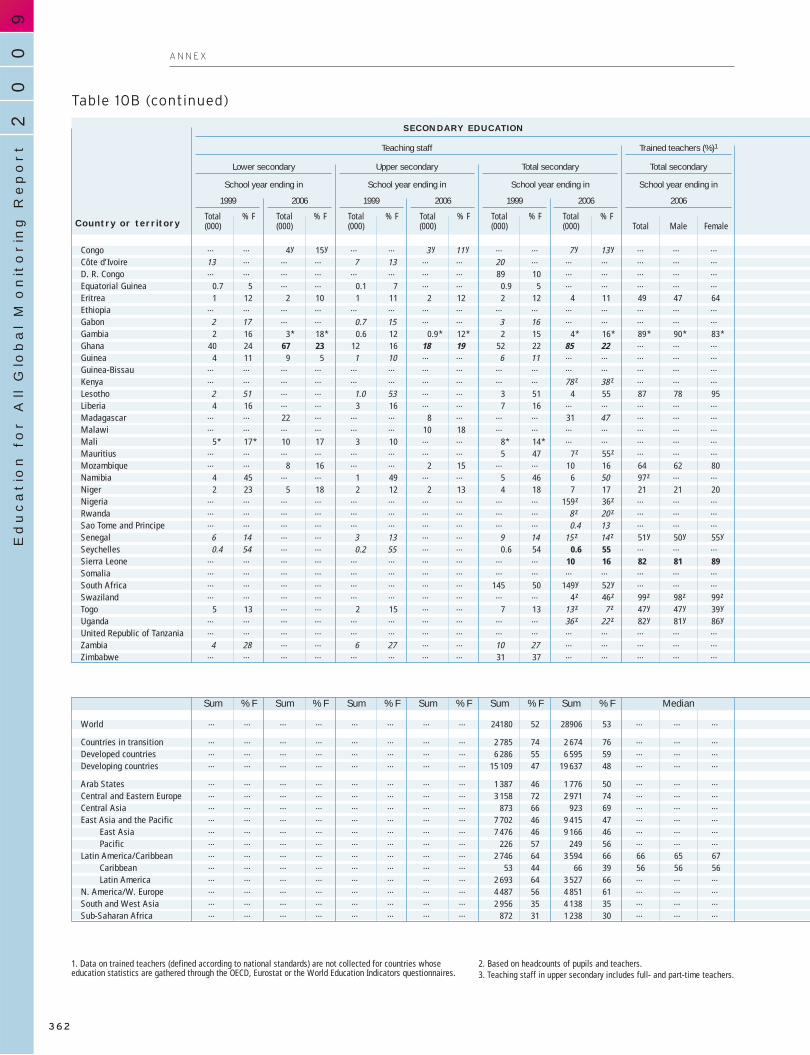
CongoCôte d’IvoireD. R. CongoEquatorial GuineaEritreaEthiopiaGabonGambiaGhanaGuineaGuinea-BissauKenyaLesothoLiberiaMadagascarMalawiMaliMauritiusMozambiqueNamibiaNigerNigeriaRwandaSao Tome and PrincipeSenegalSeychellesSierra LeoneSomaliaSouth AfricaSwazilandTogoUgandaUnited Republic of TanzaniaZambiaZimbabwe
World
Countries in transitionDeveloped countriesDeveloping countries
Arab StatesCentral and Eastern EuropeCentral AsiaEast Asia and the Pacific
East AsiaPacific
Latin America/CaribbeanCaribbeanLatin America
N. America/W. EuropeSouth and West AsiaSub-Saharan Africa
… … 4.y 15.y … … 3...y 11...y … … 7...y 13...y … … …
13 … … … 7 13 … … 20 … … … … … …… … … … … … … … 89 10 … … … … …
0.7 5 … … 0.1 7 … … 0.9 5 … … … … …
1 12 2 10 1 11 2 12 2 12 4 11 49 47 64… … … … … … … … … … … … … … …
2 17 … … 0.7 15 … … 3 16 … … … … …
2 16 3.* 18.* 0.6 12 0.9.* 12.* 2 15 4.* 16.* 89.* 90.* 83.*40 24 67 23 12 16 18 19 52 22 85 22 … … …
4 11 9 5 1 10 … … 6 11 … … … … …… … … … … … … … … … … … … … …… … … … … … … … … … 78...z 38...z … … …
2 51 … … 1.0 53 … … 3 51 4 55 87 78 954 16 … … 3 16 … … 7 16 … … … … …
… … 22 … … … 8 … … … 31 47 … … …… … … … … … 10 18 … … … … … … …
5.* 17.* 10 17 3 10 … … 8.* 14.* … … … … …… … … … … … … … 5 47 7.z 55.z … … …… … 8 16 … … 2 15 … … 10 16 64 62 80
4 45 … … 1 49 … … 5 46 6 50 97.z … …
2 23 5 18 2 12 2 13 4 18 7 17 21 21 20… … … … … … … … … … 159.z 36.z … … …… … … … … … … … … … 8...z 20...z … … …… … … … … … … … … … 0.4 13 … … …
6 14 … … 3 13 … … 9 14 15...z 14...z 51.y 50.y 55.y
0.4 54 … … 0.2 55 … … 0.6 54 0.6 55 … … …… … … … … … … … … … 10 16 82 81 89… … … … … … … … … … … … … … …… … … … … … … … 145 50 149.y 52.y … … …… … … … … … … … … … 4.z 46.z 99.z 98.z 99.z
5 13 … … 2 15 … … 7 13 13...z 7...z 47.y 47.y 39.y… … … … … … … … … … 36...z 22...z 82.y 81.y 86.y… … … … … … … … … … … … … … …
4 28 … … 6 27 … … 10 27 … … … … …… … … … … … … … 31 37 … … … … …
… … … … … … … … 24180 52 28906 53 … … …
… … … … … … … … 2 785 74 2 674 76 … … …… … … … … … … … 6 286 55 6 595 59 … … …… … … … … … … … 15 109 47 19 637 48 … … …
… … … … … … … … 1 387 46 1 776 50 … … …… … … … … … … … 3 158 72 2 971 74 … … …… … … … … … … … 873 66 923 69 … … …… … … … … … … … 7 702 46 9 415 47 … … …… … … … … … … … 7 476 46 9 166 46 … … …… … … … … … … … 226 57 249 56 … … …… … … … … … … … 2 746 64 3 594 66 66 65 67… … … … … … … … 53 44 66 39 56 56 56… … … … … … … … 2 693 64 3 527 66 … … …… … … … … … … … 4 487 56 4 851 61 … … …… … … … … … … … 2 956 35 4 138 35 … … …… … … … … … … … 872 31 1 238 30 … … …
Lower secondary
Teaching staff
Total secondary
Trained teachers (%)1
2006
School year ending in
FemaleMaleTotal
SECONDARY EDUCATION
Total % F
1999 2006
School year ending in
(000)Total % F(000)
Table 10B (continued)
Country or territory
Upper secondary
Total % F
1999 2006
School year ending in
(000)Total % F(000)
Total secondary
Total % F
1999 2006
School year ending in
(000)Total % F(000)
90
02
Education f
or A
ll G
lobal M
onitorin
g R
eport
A N N E X
3 6 2
MedianSum % F Sum % F Sum % F Sum % F Sum % F Sum % F
1. Data on trained teachers (defined according to national standards) are not collected for countries whoseeducation statistics are gathered through the OECD, Eurostat or the World Education Indicators questionnaires.
2. Based on headcounts of pupils and teachers.3. Teaching staff in upper secondary includes full- and part-time teachers.

CongoCôte d’IvoireD. R. Congo
Equatorial GuineaEritrea
EthiopiaGabon
GambiaGhana
GuineaGuinea-Bissau
KenyaLesothoLiberia
MadagascarMalawi
MaliMauritius
MozambiqueNamibia
NigerNigeria
RwandaSao Tome and Principe
SenegalSeychelles
Sierra LeoneSomalia
South AfricaSwaziland
TogoUganda
United Republic of TanzaniaZambia
Zimbabwe
World
Countries in transitionDeveloped countries
Developing countries
Arab StatesCentral and Eastern Europe
Central AsiaEast Asia and the Pacific
East AsiaPacific
Latin America/CaribbeanCaribbean
Latin AmericaN. America/W. Europe
South and West AsiaSub-Saharan Africa
… 45.y … 18...y … 34...y 0.4 5 … …
34 … 21 … 29 … … … … …… … … … 14 … 4 6 … …
25 … 15 … 23 … … … … …
55 59 45 47 51 54 0.2 13 0.4.y 14.y… … … … … … 2 6 8 928 … 28 … 28 … 0.6 17 … …
20 23.* 25 28.* 22 24.* 0.1 15 0.1.y 16.y
20 17 19 25 20 19 2 13 4 1131 40 26 … 30 … … … 1 3… … … … … … 0.03 18 … …… … … … … 32...z … … … …
24 … 17 … 22 25 0.4 45 0.6 4717 … 18 … 17 … 0.6 15 … …… 27 … 16 … 24 1 31 2 28… … … 16 … … 0.5 25 0.4.y 32.y
31.* 35 24 … 28.* … 1.0 … 1...z …… … … … 20 17...z 0.6 26 … …… 39 … 24 … 36 … … 3.z 21.z
25 … 21 … 24 25 … … 0.8 4234 33 12 20 24 30 … … 1 6… … … … … 40.z 52 31 37.y 17.y… … … … … 26...z 0.4 10 2...z 12...z… … … … … 22 . . . .29 … 19 … 25 26...z … … … …
14 … 14 … 14 13 . . . .… … … … … 24 … … … …… … … … … … … … … …… … … … 29 31.y … … 44 51… … … … … 17.z 0.2 32 0.5 4040 … 23 … 35 30...z 0.4 10 … …… … … … … 21...z 2 17 4.y 19.y… … … … … … 2 14 3 1829 … 19 … 23 … … … … …… … … … 27 … … … … …
… … … … 18 18 6 422 39 9 156 41
… … … … 11 10 744 54 1 032 55… … … … 13 13 2 784 34 3 414 38… … … … 21 20 2 893 39 4 711 41
… … … … 16 16 205 33 280 34… … … … 13 11 941 50 1 255 52… … … … 11 12 102 44 142 49… … … … 17 17 1 608 33 2 701 37… … … … 17 17 1 533 33 2 628 37… … … … 14 14 75 44 73 43… … … … 19 16 832 45 1 249 46… … … … 22 19 6 47 8 50… … … … 19 16 826 45 1 241 46… … … … 14 13 2 043 38 2 600 41… … … … 33 30 573 31 777 35… … … … 24 27 116 29 153 28
Country or territory
Teaching staff
Total % F
1999 2006
School year ending in
(000)Total % F(000)
Ta b l e 1 0 B
Lower secondary
Pupil/teacher ratio2
SECONDARY EDUCATION TERTIARY EDUCATION
1999 2006
School year ending in
Upper secondary
1999 2006
School year ending in
Total secondary
1999 2006
School year ending in
S TAT I S T I C A L TA B L E S
3 6 3
Weighted average Sum % F Sum % F
Data in italic are UIS estimates.Data in bold are for the school year ending in 2007.
(z) Data are for the school year ending in 2005.(y) Data are for the school year ending in 2004.(*) National estimate.
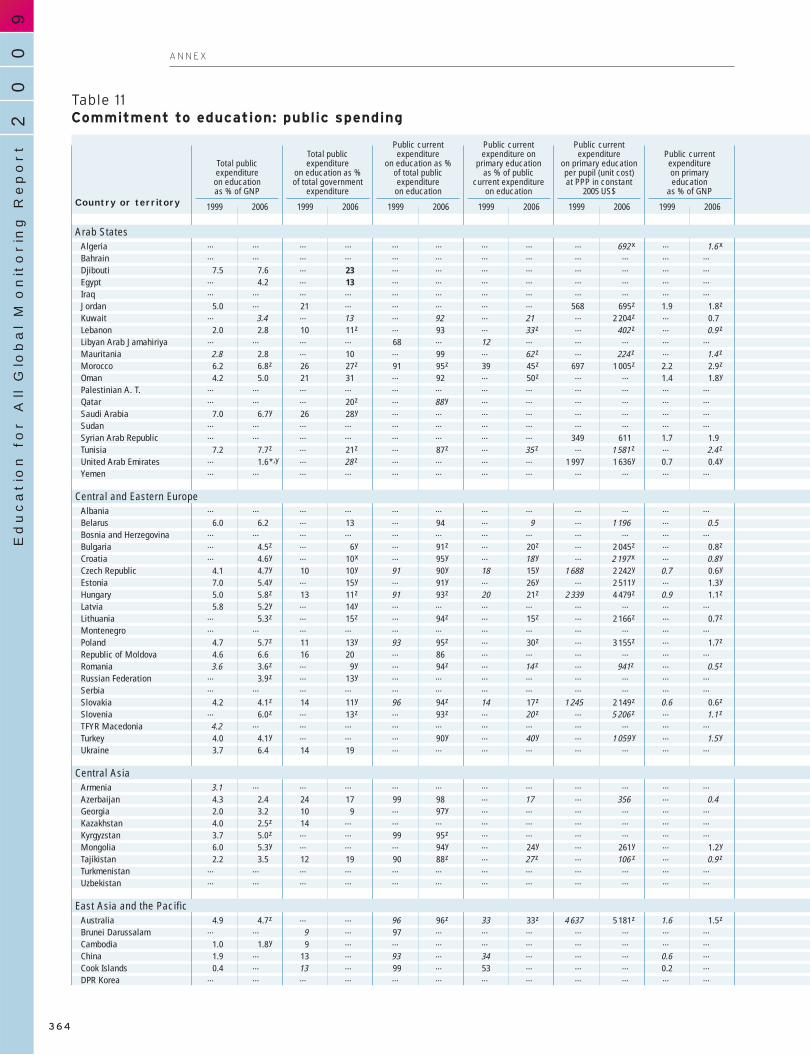
AlgeriaBahrainDjiboutiEgyptIraqJordanKuwaitLebanonLibyan Arab JamahiriyaMauritaniaMoroccoOmanPalestinian A. T.QatarSaudi ArabiaSudanSyrian Arab RepublicTunisiaUnited Arab EmiratesYemen
AlbaniaBelarusBosnia and HerzegovinaBulgariaCroatiaCzech RepublicEstoniaHungaryLatviaLithuaniaMontenegroPolandRepublic of MoldovaRomaniaRussian FederationSerbiaSlovakiaSloveniaTFYR MacedoniaTurkeyUkraine
ArmeniaAzerbaijanGeorgiaKazakhstanKyrgyzstanMongoliaTajikistanTurkmenistanUzbekistan
AustraliaBrunei DarussalamCambodiaChinaCook IslandsDPR Korea
… … … … … … … … … 692...x … 1.6...x… … … … … … … … … … … …
7.5 7.6 … 23 … … … … … … … …… 4.2 … 13 … … … … … … … …… … … … … … … … … … … …
5.0 … 21 … … … … … 568 695.z 1.9 1.8.z… 3.4 … 13 … 92 … 21 … 2 204.z … 0.7
2.0 2.8 10 11.z … 93 … 33...z … 402...z … 0.9...z… … … … 68 … 12 … … … … …
2.8 2.8 … 10 … 99 … 62...z … 224...z … 1.4...z
6.2 6.8.z 26 27.z 91 95.z 39 45.z 697 1 005.z 2.2 2.9.z
4.2 5.0 21 31 … 92 … 50.z … … 1.4 1.8.y… … … … … … … … … … … …… … … 20.z … 88...y … … … … … …
7.0 6.7.y 26 28.y … … … … … … … …… … … … … … … … … … … …… … … … … … … … 349 611 1.7 1.9
7.2 7.7.z … 21.z … 87.z … 35...z … 1 581...z … 2.4...z… 1.6.*,y … 28...z … … … … 1 997 1 636.y 0.7 0.4.y… … … … … … … … … … … …
… … … … … … … … … … … …
6.0 6.2 … 13 … 94 … 9 … 1 196 … 0.5… … … … … … … … … … … …… 4.5.z … 6.y … 91.z … 20.z … 2 045.z … 0.8.z… 4.6.y … 10.x … 95.y … 18...y … 2 197...x … 0.8...y
4.1 4.7.y 10 10.y 91 90.y 18 15.y 1 688 2 242.y 0.7 0.6.y
7.0 5.4.y … 15.y … 91.y … 26.y … 2 511.y … 1.3.y
5.0 5.8.z 13 11.z 91 93.z 20 21.z 2 339 4 479.z 0.9 1.1.z
5.8 5.2.y … 14.y … … … … … … … …… 5.3.z … 15.z … 94.z … 15.z … 2 166.z … 0.7.z… … … … … … … … … … … …
4.7 5.7.z 11 13.y 93 95.z … 30.z … 3 155.z … 1.7.z
4.6 6.6 16 20 … 86 … … … … … …
3.6 3.6.z … 9.y … 94.z … 14...z … 941.z … 0.5...z… 3.9.z … 13.y … … … … … … … …… … … … … … … … … … … …
4.2 4.1.z 14 11.y 96 94.z 14 17.z 1 245 2 149.z 0.6 0.6.z… 6.0.z … 13.z … 93.z … 20...z … 5 206...z … 1.1...z
4.2 … … … … … … … … … … …
4.0 4.1.y … … … 90.y … 40...y … 1 059....y … 1.5...y
3.7 6.4 14 19 … … … … … … … …
3.1 … … … … … … … … … … …
4.3 2.4 24 17 99 98 … 17 … 356 … 0.42.0 3.2 10 9 … 97.y … … … … … …
4.0 2.5.z 14 … … … … … … … … …
3.7 5.0.z … … 99 95.z … … … … … …
6.0 5.3.y … … … 94.y … 24.y … 261.y … 1.2.y
2.2 3.5 12 19 90 88.z … 27...z … 106....z … 0.9...z… … … … … … … … … … … …… … … … … … … … … … … …
4.9 4.7.z … … 96 96.z 33 33.z 4 637 5 181.z 1.6 1.5.z… … 9 … 97 … … … … … … …
1.0 1.8.y 9 … … … … … … … … …
1.9 … 13 … 93 … 34 … … … 0.6 …
0.4 … 13 … 99 … 53 … … … 0.2 …… … … … … … … … … … … …
1999 2006
Table 11Commitment to education: public spending
Country or territory
Total publicexpenditure
on educationas % of GNP
1999 2006
Total publicexpenditure
on education as % of total government
expenditure
1999 2006
Public currentexpenditure
on education as % of total publicexpenditure
on education
1999 2006
Public currentexpenditure on
primary education as % of public
current expenditure on education
1999 2006
Public currentexpenditure
on primary education per pupil (unit cost) at PPP in constant
2005 US$
1999 2006
Public currentexpenditure on primary education
as % of GNP
Arab States
Central and Eastern Europe
Central Asia
East Asia and the Pacific
00
2Education f
or A
ll G
lobal M
onitorin
g R
eport
A N N E X
3 6 4
9
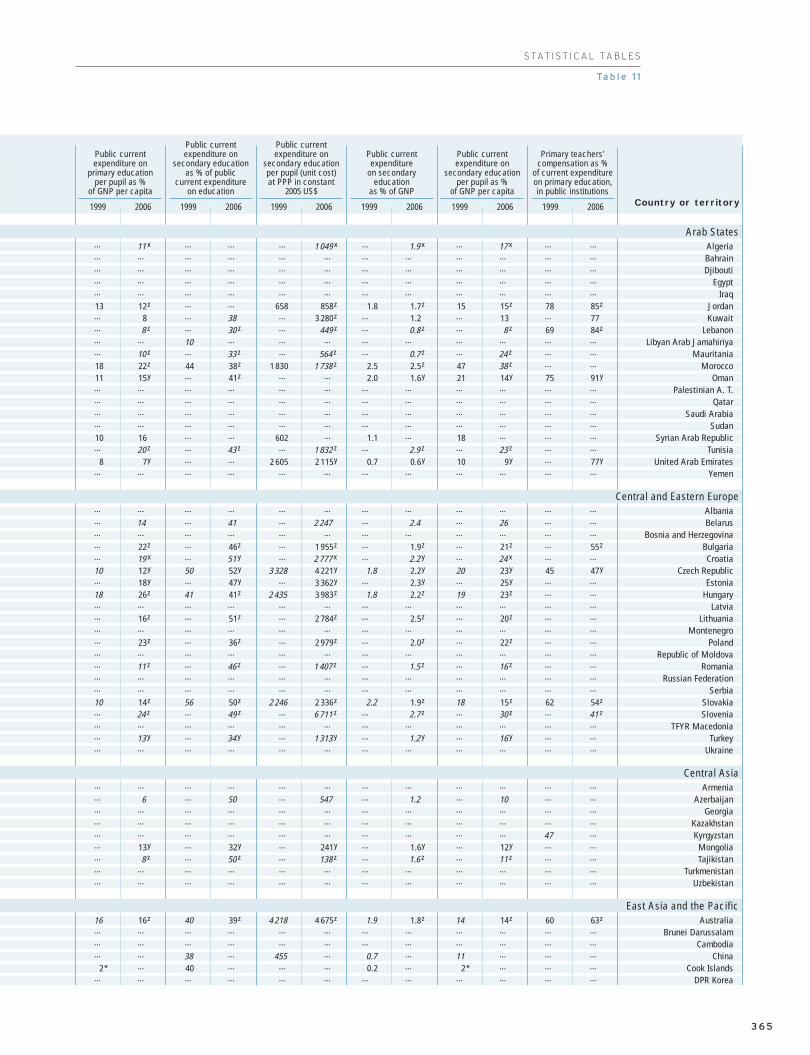
AlgeriaBahrainDjibouti
EgyptIraq
JordanKuwait
LebanonLibyan Arab Jamahiriya
MauritaniaMorocco
OmanPalestinian A. T.
QatarSaudi Arabia
SudanSyrian Arab Republic
TunisiaUnited Arab Emirates
Yemen
AlbaniaBelarus
Bosnia and HerzegovinaBulgariaCroatia
Czech RepublicEstonia
HungaryLatvia
LithuaniaMontenegro
PolandRepublic of Moldova
RomaniaRussian Federation
SerbiaSlovakiaSlovenia
TFYR MacedoniaTurkey
Ukraine
ArmeniaAzerbaijan
GeorgiaKazakhstanKyrgyzstan
MongoliaTajikistan
TurkmenistanUzbekistan
AustraliaBrunei Darussalam
CambodiaChina
Cook IslandsDPR Korea
… 11...x … … … 1 049...x … 1.9...x … 17...x … …… … … … … … … … … … … …… … … … … … … … … … … …… … … … … … … … … … … …… … … … … … … … … … … …
13 12.z … … 658 858.z 1.8 1.7.z 15 15.z 78 85.z… 8 … 38 … 3 280.z … 1.2 … 13 … 77… 8...z … 30...z … 449...z … 0.8...z … 8...z 69 84.z… … 10 … … … … … … … … …… 10...z … 33...z … 564...z … 0.7...z … 24...z … …
18 22.z 44 38.z 1 830 1 738...z 2.5 2.5.z 47 38...z … …
11 15.y … 41.z … … 2.0 1.6.y 21 14.y 75 91.y… … … … … … … … … … … …… … … … … … … … … … … …… … … … … … … … … … … …… … … … … … … … … … … …
10 16 … … 602 … 1.1 … 18 … … …… 20...z … 43...z … 1 832...z … 2.9...z … 23...z … …
8 7.y … … 2 605 2 115.y 0.7 0.6.y 10 9.y … 77.y… … … … … … … … … … … …
… … … … … … … … … … … …… 14 … 41 … 2 247 … 2.4 … 26 … …… … … … … … … … … … … …… 22.z … 46.z … 1 955.z … 1.9.z … 21.z … 55.z… 19...x … 51...y … 2 777...x … 2.2...y … 24...x … …
10 12.y 50 52.y 3 328 4 221.y 1.8 2.2.y 20 23.y 45 47.y… 18.y … 47.y … 3 362.y … 2.3.y … 25.y … …
18 26.z 41 41.z 2 435 3 983.z 1.8 2.2.z 19 23.z … …… … … … … … … … … … … …… 16.z … 51.z … 2 784.z … 2.5.z … 20.z … …… … … … … … … … … … … …… 23.z … 36.z … 2 979.z … 2.0.z … 22.z … …… … … … … … … … … … … …… 11...z … 46...z … 1 407...z … 1.5...z … 16...z … …… … … … … … … … … … … …… … … … … … … … … … … …
10 14.z 56 50.z 2 246 2 336.z 2.2 1.9.z 18 15.z 62 54.z… 24...z … 49...z … 6 711...z … 2.7...z … 30...z … 41...z… … … … … … … … … … … …… 13...y … 34...y … 1 313...y … 1.2...y … 16...y … …… … … … … … … … … … … …
… … … … … … … … … … … …… 6 … 50 … 547 … 1.2 … 10 … …… … … … … … … … … … … …… … … … … … … … … … … …… … … … … … … … … … 47 …… 13.y … 32.y … 241.y … 1.6.y … 12.y … …… 8...z … 50...z … 138...z … 1.6...z … 11...z … …… … … … … … … … … … … …… … … … … … … … … … … …
16 16.z 40 39.z 4 218 4 675.z 1.9 1.8.z 14 14.z 60 63.z… … … … … … … … … … … …… … … … … … … … … … … …… … 38 … 455 … 0.7 … 11 … … …
2.* … 40 … … … 0.2 … 2.* … … …… … … … … … … … … … … …
Ta b l e 1 1
Country or territory1999 2006
Public currentexpenditure on
primary education per pupil as %
of GNP per capita
1999 2006
Public currentexpenditure on
secondary education as % of public
current expenditure on education
1999 2006
Public currentexpenditure on
secondary education per pupil (unit cost) at PPP in constant
2005 US$
1999 2006
Public currentexpenditure
on secondary education
as % of GNP
1999 2006
Public currentexpenditure on
secondary education per pupil as %
of GNP per capita
1999 2006
Primary teachers’compensation as %
of current expenditure on primary education,in public institutions
Arab States
Central and Eastern Europe
Central Asia
East Asia and the Pacific
S TAT I S T I C A L TA B L E S
3 6 5

FijiIndonesiaJapanKiribatiLao PDRMacao, ChinaMalaysiaMarshall IslandsMicronesiaMyanmarNauruNew ZealandNiuePalauPapua New GuineaPhilippinesRepublic of KoreaSamoaSingaporeSolomon IslandsThailandTimor-LesteTokelauTongaTuvaluVanuatuViet Nam
AnguillaAntigua and BarbudaArgentinaArubaBahamasBarbadosBelizeBermudaBoliviaBrazilBritish Virgin IslandsCayman IslandsChileColombiaCosta RicaCubaDominicaDominican RepublicEcuadorEl SalvadorGrenadaGuatemalaGuyanaHaitiHondurasJamaicaMexicoMontserratNetherlands AntillesNicaraguaPanamaParaguayPeruSaint Kitts and NevisSaint Lucia
5.7 6.5.y 18 … … 97.y … 40.y … 1 143.y … 2.5.y… 3.8 … 18 … … … … … … … …
3.6 3.5.z 9 9.z … … … … … … … …
7.7 … … … … … … … … … … …
1.0 3.4 … 14 … 37 … 46.z … 61.z … 0.5.z
3.6 … 14 14.z … 89.y … … … … … …
6.1 6.6.y 25 25.y … 88.y … 29.y … 1 324.y … 1.7.y
13.3 9.5...y … 16.x … … … … … … … …
6.5 … … … … … … … … … … …
0.6 … 8 … 64 … … … … … … …… … … … … … … … … … … …
7.2 6.1 … 15.z 95 100 27 24 3 971 4 831 1.8 1.5… … … … 100 … 32 … … … … …… … … … … … … … … … … …… … … … … … … … … … … …… 2.3.z … 15.z … 93.z … 54.z … 418.z … 1.2.z
3.8 4.6.y 13 16.y 80 88.y 44 34.y 2 621 3 379.y 1.3 1.4.y
4.5 … 13 … 99 … 32 … 443 … 1.4 …… … … … … … … … … … … …
3.3 … … … … … … … … … … …
5.1 4.3.z 28 25.z … … … … … … … …… … … … … … … … … … … …… … … 15.x … … … … … … … …
6.7 4.9.y … 13.x … … … … … … … …… … … … … … … … … … … …
6.7 10.0.x 17 … 84 … 39 … 409 … 2.2 …… … … … … … … … … … … …
… 4.0.z … 14.z … 90.z … 30.z … … … 1.1.z
3.5 … … … 100 … … … … … … …
4.6 4.0.y 13 13.y 94 99.y 37 37.y 1 637 1 703.z 1.6 1.5.z… 5.1.z 14 15.z 90 84.z 30 30.z … … … 1.3.z… … … … … … … … … … … …
5.3 7.2.z 15 16.z 92 96.z 21 28...z … … 1.0 2.0...z
5.7 5.8.y 17 18.x … 88.y … 47.y … 846.y … 2.4.y… 1.2 … … … 97.z … 41...z … … … 0.8...z
5.8 6.6.x 16 18.x 84 96.x 41 46.x 295 435.x 2.0 2.9.x
4.0 4.1.y 10 … 95 94.y 33 32.y 788 1 005.y 1.3 1.3.y… 4.0 … 12.z … 95 … 27 … … … 1.0… 2.9 … … … … … … … … … …
4.0 3.6 16 16 88 95 45 36 1 256 1 287 1.5 1.24.5 4.9 17 11.z … 99 … 41 … 1 257 … 2.05.5 4.9 … 21 100 79.y 47 56.y 1 469 1 623.y 2.6 2.3.y
7.7 9.3 14 14 … 88 … 32 … … … 2.65.5 … … … … … … … … … … …
… 3.9 … 17 … 96 … … … 644...z … 1.2...z
2.0 … 10 … 93.* … … … … … … …
2.4 3.2 17 … … 89 … 48 … 478 … 1.4… 6.0.x … 13.x … 87...x … 35...x … 766...x … 1.8...x… 2.6 … … … 92 … 66 … 390 … 1.6
9.3 8.6 18 15 … 91 … 27 … 752.z … 2.1… … … … … … … … … … … …… … … … … … … … … … … …… 5.6.z … 9.z … 97.z … 34.z … 547.z … 1.8.z
4.5 5.6.z 23 26.y 95 97.z 41 39.z 1 114 1 604.z 1.8 2.2.z… … 11 … 47 65.y … … … … … …… … 14 … 94 … … … … … … …
4.0 3.3...x 6 … … … … … … 331 … 1.65.1 4.1...y … 9...y … … … … 867 … 1.9 …
5.1 4.1.y 9 10.y 88 96.y … 46.y … 518.y … 1.8.y
3.4 2.7 21 15 88 93 40 42 366 446 1.2 1.15.6 10.8.z 13 13.x … 37.z … … … … … …
8.0 7.1 21 19 79 74 53 39 1 197 949 3.3 2.0
1999 2006
Table 11 (continued)
Country or territory
Total publicexpenditure
on educationas % of GNP
1999 2006
Total publicexpenditure
on education as % of total government
expenditure
1999 2006
Public currentexpenditure
on education as % of total publicexpenditure
on education
1999 2006
Public currentexpenditure on
primary education as % of public
current expenditure on education
1999 2006
Public currentexpenditure
on primary education per pupil (unit cost) at PPP in constant
2005 US$
1999 2006
Public currentexpenditure on primary education
as % of GNP
Latin America and the Caribbean
00
2Education f
or A
ll G
lobal M
onitorin
g R
eport
A N N E X
3 6 6
9
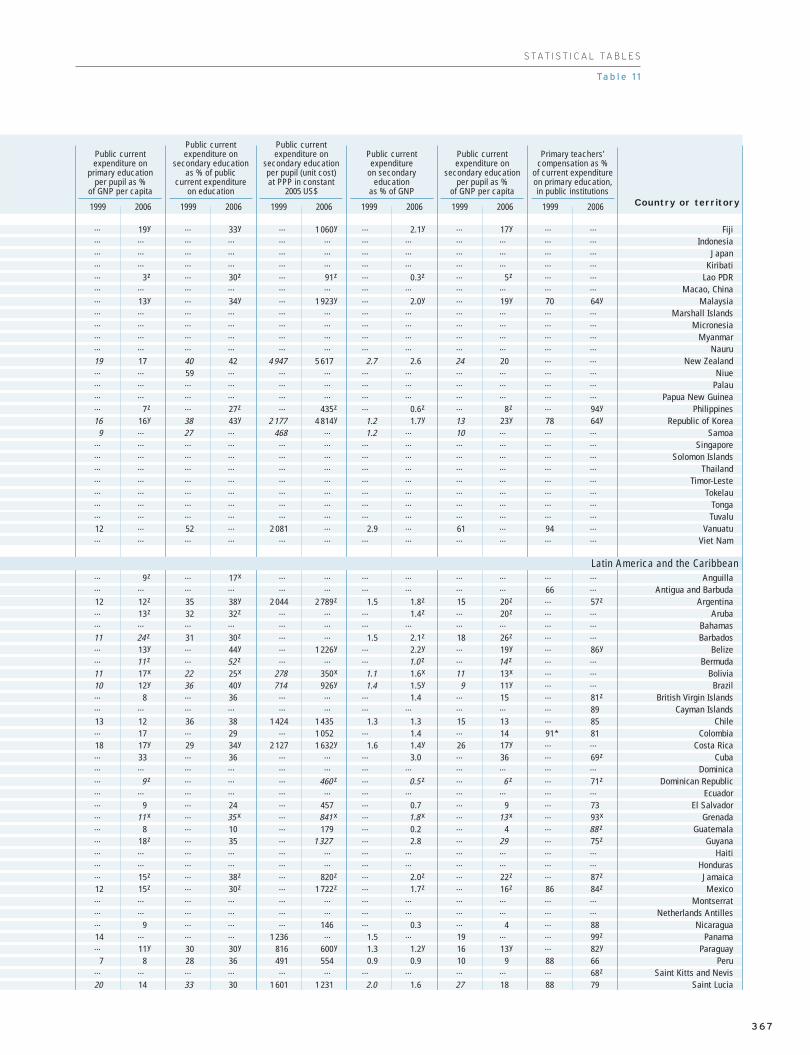
FijiIndonesia
JapanKiribati
Lao PDRMacao, China
MalaysiaMarshall Islands
MicronesiaMyanmar
NauruNew Zealand
NiuePalau
Papua New GuineaPhilippines
Republic of KoreaSamoa
SingaporeSolomon Islands
ThailandTimor-Leste
TokelauTongaTuvalu
VanuatuViet Nam
AnguillaAntigua and Barbuda
ArgentinaAruba
BahamasBarbados
BelizeBermuda
BoliviaBrazil
British Virgin IslandsCayman Islands
ChileColombia
Costa RicaCuba
DominicaDominican Republic
EcuadorEl Salvador
GrenadaGuatemala
GuyanaHaiti
HondurasJamaicaMexico
MontserratNetherlands Antilles
NicaraguaPanama
ParaguayPeru
Saint Kitts and NevisSaint Lucia
… 19.y … 33.y … 1 060.y … 2.1.y … 17.y … …… … … … … … … … … … … …… … … … … … … … … … … …… … … … … … … … … … … …… 3.z … 30.z … 91.z … 0.3.z … 5.z … …… … … … … … … … … … … …… 13.y … 34.y … 1 923.y … 2.0.y … 19.y 70 64.y… … … … … … … … … … … …… … … … … … … … … … … …… … … … … … … … … … … …… … … … … … … … … … … …
19 17 40 42 4 947 5 617 2.7 2.6 24 20 … …… … 59 … … … … … … … … …… … … … … … … … … … … …… … … … … … … … … … … …… 7.z … 27.z … 435.z … 0.6.z … 8.z … 94.y
16 16.y 38 43.y 2 177 4 814.y 1.2 1.7.y 13 23.y 78 64.y
9 … 27 … 468 … 1.2 … 10 … … …… … … … … … … … … … … …… … … … … … … … … … … …… … … … … … … … … … … …… … … … … … … … … … … …… … … … … … … … … … … …… … … … … … … … … … … …… … … … … … … … … … … …
12 … 52 … 2 081 … 2.9 … 61 … 94 …… … … … … … … … … … … …
… 9.z … 17.x … … … … … … … …… … … … … … … … … … 66 …
12 12.z 35 38.y 2 044 2 789.z 1.5 1.8.z 15 20.z … 57.z… 13.z 32 32.z … … … 1.4.z … 20.z … …… … … … … … … … … … … …
11 24...z 31 30.z … … 1.5 2.1.z 18 26.z … …… 13.y … 44.y … 1 226.y … 2.2.y … 19.y … 86.y… 11...z … 52...z … … … 1.0...z … 14...z … …
11 17.x 22 25.x 278 350.x 1.1 1.6.x 11 13.x … …
10 12.y 36 40.y 714 926.y 1.4 1.5.y 9 11.y … …… 8 … 36 … … … 1.4 … 15 … 81.z… … … … … … … … … … … 8913 12 36 38 1 424 1 435 1.3 1.3 15 13 … 85… 17 … 29 … 1 052 … 1.4 … 14 91.* 8118 17.y 29 34.y 2 127 1 632.y 1.6 1.4.y 26 17.y … …… 33 … 36 … … … 3.0 … 36 … 69.z… … … … … … … … … … … …… 9...z … … … 460...z … 0.5...z … 6...z … 71.z… … … … … … … … … … … …… 9 … 24 … 457 … 0.7 … 9 … 73… 11...x … 35...x … 841...x … 1.8...x … 13...x … 93.x… 8 … 10 … 179 … 0.2 … 4 … 88...z… 18.z … 35 … 1 327 … 2.8 … 29 … 75.z… … … … … … … … … … … …… … … … … … … … … … … …… 15.z … 38.z … 820.z … 2.0.z … 22.z … 87.z
12 15.z … 30.z … 1 722.z … 1.7.z … 16.z 86 84.z… … … … … … … … … … … …… … … … … … … … … … … …… 9 … … … 146 … 0.3 … 4 … 8814 … … … 1 236 … 1.5 … 19 … … 99.z… 11.y 30 30.y 816 600.y 1.3 1.2.y 16 13.y … 82.y
7 8 28 36 491 554 0.9 0.9 10 9 88 66… … … … … … … … … … … 68.z
20 14 33 30 1 601 1 231 2.0 1.6 27 18 88 79
Country or territory1999 2006
Public currentexpenditure on
primary education per pupil as %
of GNP per capita
1999 2006
Public currentexpenditure on
secondary education as % of public
current expenditure on education
1999 2006
Public currentexpenditure on
secondary education per pupil (unit cost) at PPP in constant
2005 US$
1999 2006
Public currentexpenditure
on secondary education
as % of GNP
1999 2006
Public currentexpenditure on
secondary education per pupil as %
of GNP per capita
1999 2006
Primary teachers’compensation as %
of current expenditure on primary education,in public institutions
Latin America and the Caribbean
S TAT I S T I C A L TA B L E S
Ta b l e 1 1
3 6 7

Saint Vincent/Grenad.SurinameTrinidad and TobagoTurks and Caicos IslandsUruguayVenezuela, B. R.
AndorraAustriaBelgiumCanadaCyprusDenmarkFinlandFranceGermanyGreeceIcelandIrelandIsraelItalyLuxembourgMaltaMonacoNetherlandsNorwayPortugalSan MarinoSpainSwedenSwitzerlandUnited KingdomUnited States
AfghanistanBangladeshBhutanIndiaIran, Islamic Republic ofMaldivesNepalPakistanSri Lanka
AngolaBeninBotswanaBurkina FasoBurundiCameroonCape VerdeCentral African RepublicChadComorosCongoCôte d’IvoireD. R. CongoEquatorial GuineaEritreaEthiopiaGabon
7.2 8.8.z … 16.z … 68.z … 50.z … 1 227.z … 3.0.z… … … … … … … … … … … …
3.9 … 16 … 96 … 40 … 1 012 … 1.5 …… … 17 12.z 73 88.z 30 20...z … … … …
2.8 3.0 … 12 92 … 32 … 748 … 0.8 …… 3.7 … … … 92 … 30 … 583 … 1.0
… 2.3 … … … 94 … 25 … … … 0.56.4 5.5.z 12 11.z 94 96.z 19 19.z 7 112 7 596.z 1.1 1.0.z
… 6.0.y … 12.y … 98.y … 24.y … 6 303.y … 1.4.y
6.0 5.1.z … … 98 95.z … … … … … …
5.4 6.5.y … 15.z 86 87.z 34 30.z … … 1.6 1.7.y
8.2 8.3.z 15 16.z … 95.z … 22.z 7 345 7 949.z 1.6 1.8.z
6.3 6.4.z 12 13.z 94 94.z 21 20.z 4 615 5 373.z 1.2 1.2.z
5.7 5.7.z 11 11.z 91 91.z 20 21.z 4 697 5 224.z 1.1 1.1.z
4.5 4.6.y 10 10.y … 98.y … 15.y … 4 837.y … 0.7.y
3.5 4.4.z 7 9.z 78 78.z 25 26...z 2 148 3 562...z 0.7 0.9...z… 7.9.y … 17.y … 90.y … 34.y … 7 788.y … 2.4.y
4.9 5.6.z 13 14.z 91 92.z 32 33.z 3 112 5 100.z 1.4 1.7.z
7.5 7.1.y 14 14.x 94 95.y 34 36.y 4 835 5 135.y 2.4 2.4.y
4.7 4.5.z 10 9.z 94 94.z 26 25.z 6 425 6 347.z 1.2 1.0.z
3.7 … 8 … … … … … … 9 953...z … 1.4...z
4.9 5.2.y … 11.y … 95.y … 22.y … 2 549.y … 1.1.y… … 5 … 92 91.y 18 17.y … … … …
4.5 5.2.z 10 11.z 96 94.z 26 26.z 4 606 5 572.z 1.1 1.3.z
7.2 7.1.z 16 17.z 90 92.z 25 24.z 6 456 7 072.z 1.6 1.6.z
5.4 5.5.z 13 11.z 93 98.z 31 31.z 3 872 4 908.z 1.5 1.7.z… … … … … … … … … … … …
4.4 4.3.z 11 11.z 91 91.z 28 26.z 4 112 4 800.z 1.1 1.0.z
7.5 7.2.z 14 13.y … 100.z … 26.z … 8 415.z … 1.9.z
5.0 5.3.z 15 13.x 90 92.z 32 29.z 7 066 7 811.z 1.4 1.4.z
4.6 5.5.z 11 12.z … 93.z … 26.z … 5 596.z … 1.3.z
5.0 5.3.z … 14.z … … … … … … … …
… … … … … … … … … … … …
2.3 2.6.z 15 14.z 64 79.z 39 35...z 64 115...z 0.6 0.7...z… 7.2.z … 17.z … 59.z … 27.z … … … 1.1.z
4.5 3.3.z 13 11.x 98 … 30 … 288 … 1.3 …
4.5 5.2 19 19 91 93 … 29 … 927 … 1.4… 8.3 … 15.z … 81...z … 54...z … … … 3.5...z
2.9 3.2.x 12 15.x 74 77.x 53 49...x 97 119...x 1.1 1.2...x
2.6 2.7 … 12 89 75 … … … … … …… … … … … … … … … … … …
3.4 2.7.z 6 … 89 42.z … 20.z … … … 0.2.z
3.0 4.4.y 16 17.y 88 82.y … 50.y … 120...z … 1.7...z… 9.3 … 21 … 75 … 19 … 1 158.z … 1.3… 4.2 … 15 … 95 … 66 … 328 … 2.6
3.5 5.2.z … 18.z 94 98.z 39 52.z 85 132.z 1.3 2.7.z
2.1 3.3 10 17 … 74 … 34 128 107 1.0 0.8… 6.6 … 16 … 74 … 58 … 1 052 … 2.8… 1.4 … … … 98 … 52 … 88 … 0.71.7 2.3.z … 10.z … 50.z … 48.z … 54.z … 0.6.z
… … … … … … … … … … … …
6.0 2.5.z 22 8.z 93 91.z 36 27.z 191 39.z 2.0 0.6.z
5.6 … … … 74 … 43 … 274 … 1.8 0.1...z… … … … … … … … … … … …… 1.4...x … 4...x … 90...x … … … … … …
5.3 2.4 … … 70 80 … 39 … 99 … 0.83.6 6.0 … 18 … 65 … 51 … 130 … 2.03.5 … … … 87 … … … … … … …
1999 2006
Table 11 (continued)
Country or territory
Total publicexpenditure
on educationas % of GNP
1999 2006
Total publicexpenditure
on education as % of total government
expenditure
1999 2006
Public currentexpenditure
on education as % of total publicexpenditure
on education
1999 2006
Public currentexpenditure on
primary education as % of public
current expenditure on education
1999 2006
Public currentexpenditure
on primary education per pupil (unit cost) at PPP in constant
2005 US$
1999 2006
Public currentexpenditure on primary education
as % of GNP
North America and Western Europe
South and West Asia
Sub-Saharan Africa
00
2Education f
or A
ll G
lobal M
onitorin
g R
eport
A N N E X
3 6 8
9

Saint Vincent/Grenad.Suriname
Trinidad and TobagoTurks and Caicos Islands
UruguayVenezuela, B. R.
AndorraAustria
BelgiumCanadaCyprus
DenmarkFinlandFrance
GermanyGreeceIcelandIreland
IsraelItaly
LuxembourgMalta
MonacoNetherlands
NorwayPortugal
San MarinoSpain
SwedenSwitzerland
United KingdomUnited States
AfghanistanBangladesh
BhutanIndia
Iran, Islamic Republic ofMaldives
NepalPakistan
Sri Lanka
AngolaBenin
BotswanaBurkina Faso
BurundiCameroon
Cape VerdeCentral African Republic
ChadComoros
CongoCôte d’IvoireD. R. Congo
Equatorial GuineaEritrea
EthiopiaGabon
… 20.z … 30.z … 1 235.z … 1.8.z … 20.z … 85.z… … … … … … … … … … … …
11 … 31 … 1 163 … 1.2 … 13 … 78 …… … 40 30.z … … … … … … 63 …
8 … 37 … 1 100 … 1.0 … 11 … 71 52.y… 8 … 18 … 588 … 0.6 … 8 … …
… 9 … 22 … … … 0.5 … 9 … 5023 23.z 45 47.z 8 768 8 608.z 2.7 2.5.z 29 26.z 71 55.z… 19.y … 43.y … 10 662.y … 2.5.y … 33.y … 66.y… … … … … … … … … … … …
17 21.y 53 49.z … … 2.4 2.9.y 27 34.y … 78.z
23 23.z … 36.z 11 578 11 440.z 2.9 2.9.z 37 33.z 49 51.z
17 17.z 39 41.z 6 858 9 755.z 2.3 2.5.z 25 30.z 59 58.z
16 16.z 50 47.z 7 678 7 774.z 2.6 2.4.z 26 24.z … 53.z… 16.y … 49.y … 6 427.y … 2.2.y … 22.y … …
12 16...z 38 37.z 2 674 4 578.z 1.0 1.3.z 14 20.z … 91.z… 23.y … 35.y … 7 556.y … 2.5.y … 22.y … …
12 15.z 37 35.z 4 685 7 731.z 1.6 1.8.z 18 23.z 83 76.z
20 21.y 30 30.y 5 422 5 429.y 2.1 2.0.y 23 22.y … …
23 22.z 47 47.z 7 398 7 429.z 2.1 2.0.z 26 26.z … 65.z… 18...z … … … 12 142.z … 1.7.z … 22.z … 74...z… 14.y … 42.y … 3 622.y … 2.0.y … 20.y … 58.y… … 51 46.y … … … … … … … …
14 16.z 39 40.z 6 619 7 861.z 1.7 2.0.z 20 23.z … …
17 17.z 32 35.z 9 082 11 072.z 2.1 2.3.z 24 27.z … 79.z
19 24.z 44 41.z 5 280 7 224.z 2.2 2.2.z 26 35.z … 85.z… … … … … … … … … … … …
17 18.z 47 41.z 5 435 5 909.z 1.9 1.6.z 23 22.z 78 73.z… 26.z … 38.z … 10 973.z … 2.7.z … 34.z 50 54.z
19 20.z 40 38.z 8 790 9 382.z 1.8 1.9.z 24 24.z 72 72.z… 17.z … 35.z … 6 096.z … 1.8.z … 18.z 52 53.z… … … … … … … … … … 56 55.z
… … … … … … … … … … … …
4 6...z 42 47.z 140 265.z 0.6 1.0.z 8 13.z … …… … … 44.z … … … 1.9.z … … … …
12 … 38 … 600 … 1.7 … 24 … 79 80.y… 13 … 47 … 720.z … 2.3 … 11.z … …… 20...z … … … … … … … … … …
7 8...x 29 28.x 151 144.x 0.6 0.7.x 11 10.x … …… … … … … … … … … … … …… … … … … … … … … … … …
… … … 66.z … … … 0.8.z … … … …… 11...z … 28...y … 267...y … 1.0...y … 24...y … …… 11.z … 48 … 3 732...z … 3.4 … 37...z … …… 25 … 12 … 264 … 0.5 … 20 … …
12 19.z 37 33.z … 506...z 1.2 1.7.z … 74...z … …
7 5 … 55 279 746 0.6 1.4 15 32 … …… 18 … 36 … 861 … 1.8 … 15 … 86… 7 … 24 … … … 0.3 … … … …… 4.z … 29.z … 177...z … 0.3.z … 14...z … …… … … … … … … … … … … …
24 4.z 24 41.z … … 1.3 0.9.z … … … …
16 … 36 … 743 … 1.5 0.5.z 42 … … …… … … … … … … … … … … …… … … … … … … … … … … …… 9 … 13 … 52 … 0.2 … 5 … …… 13 … 10 … 95 … 0.4 … 9 … …… … … … … … … … … … … …
Country or territory1999 2006
Public currentexpenditure on
primary education per pupil as %
of GNP per capita
1999 2006
Public currentexpenditure on
secondary education as % of public
current expenditure on education
1999 2006
Public currentexpenditure on
secondary education per pupil (unit cost) at PPP in constant
2005 US$
1999 2006
Public currentexpenditure
on secondary education
as % of GNP
1999 2006
Public currentexpenditure on
secondary education per pupil as %
of GNP per capita
1999 2006
Primary teachers’compensation as %
of current expenditure on primary education,in public institutions
North America and Western Europe
South and West Asia
Sub-Saharan Africa
Ta b l e 1 1
S TAT I S T I C A L TA B L E S
3 6 9

GambiaGhanaGuineaGuinea-BissauKenyaLesothoLiberiaMadagascarMalawiMaliMauritiusMozambiqueNamibiaNigerNigeriaRwandaSao Tome and PrincipeSenegalSeychellesSierra LeoneSomaliaSouth AfricaSwazilandTogoUgandaUnited Republic of TanzaniaZambiaZimbabwe
World1
Countries in transitionDeveloped countriesDeveloping countries
Arab StatesCentral and Eastern EuropeCentral AsiaEast Asia and the Pacific
East AsiaPacific
Latin America/CaribbeanCaribbeanLatin America
N. America/W. EuropeSouth and West AsiaSub-Saharan Africa
3.1 2.1...y 14 … 87 86...x … … … … … …
4.2 5.5.z … … … 86.z … 34.z … 300.z … 1.6.z
2.1 1.7.z … … … … … … … … … …
5.6 … 12 … 41 … … … … … … …
5.4 6.9 … 18.z 95 94 … 55 … 237 … 3.610.2 10.8 26 30.z 74 91 43 38 566 663 3.2 3.8… … … … … … … … … … … …
2.5 3.1 … 25.z … 84 … 46 … 57 … 1.24.7 5.9.x 25 … 82 82.x … 63.x … 90.x … 3.0.x
3.0 4.4 … 17 90 73 49 60 136 183 1.3 1.94.2 3.9 18 13 91 88 32 28 1 067 1 205 1.2 1.02.5 5.3.z … 23.y … 77.z … 70.y … 156.y … 2.6.y
7.9 6.8.x … … 94 … 59 … 1 416 944.x 4.4 3.9.x… 3.3 … 18 … 81 … 64 … 178 … 1.7… … … … … … … … … … … …… 3.8.z … 19 … 94 … 45 … 109.z … 1.9.z… … … … … … … … … … … …
3.5 5.0 … 26 … 92 … 46.z … 299.z … 2.1.z
5.5 6.8 … 13 … 88 … 21 … 2 399...y … 1.3… 3.9...z … … … 99...z … 52...x … … … 2.3...x… … … … … … … … … … … …
6.2 5.5 22 18 98 97 45 45 1 403.* 1 383.z 2.7 2.45.7 6.9.z … … 100 100.y 33 38...y 437 484...y 1.9 2.3...y
4.3 … 26 … 97 … 43 … 150 … 1.8 …… 5.3...y … 18...y … 75...y … 62...y … 110...y … 2.5...y
2.2 … … … … … … … … … … …
2.0 2.1.z … 15.y … 99.z … 59.z … 55.z … 1.3.z… … … … … … … … … … … …
4.5 4.9 … 15 … 92.1 … 33 … 1 005 … 1.4
3.7 3.9 14 17 … 94.2 … … … … … …
4.9 5.3 11 12 … 93.8 … 24 … 5 100 … 1.14.5 4.4 … 16 … 89.5 … … … … … 1.7
… 4.6 … 21 … … … … … … … 1.74.4 5.3 … 13 … 93.0 … 19 … 2 182 … 0.83.7 3.4 … … … 94.6 … … … … … …
4.7 … … … … … … … … … … …
3.6 3.6 13 16 … … … … … … … …
6.5 … … … … … … … … … … …
4.9 4.1 16 15 … 91.9 … 37 … … … 1.7… 5.8 … 15 … 88.0 … 32 … … … 1.84.5 4.0 15 15 93 94.5 … 41 … 614 … 1.65.0 5.5 12 12 92 93.6 26 25 4 697 5 584 1.3 1.32.9 3.3 … 15 89 77.9 … 35 … … … 1.23.6 4.4 … 18 … 86.4 … 48 … 167 … 1.9
1999 2006
Table 11 (continued)
Country or territory
Total publicexpenditure
on educationas % of GNP
1999 2006
Total publicexpenditure
on education as % of total government
expenditure
1999 2006
Public currentexpenditure
on education as % of total publicexpenditure
on education
1999 2006
Public currentexpenditure on
primary education as % of public
current expenditure on education
1999 2006
Public currentexpenditure
on primary education per pupil (unit cost) at PPP in constant
2005 US$
1999 2006
Public currentexpenditure on primary education
as % of GNP
00
2Education f
or A
ll G
lobal M
onitorin
g R
eport
A N N E X
9
1. All regional values shown are medians.Data in italic are UIS estimates.Data in bold are for 2007.
(z) Data are for 2005.(y) Data are for 2004.(x) Data are for 2003.(*) National estimate.
3 7 0

GambiaGhana
GuineaGuinea-Bissau
KenyaLesothoLiberia
MadagascarMalawi
MaliMauritius
MozambiqueNamibia
NigerNigeria
RwandaSao Tome and Principe
SenegalSeychelles
Sierra LeoneSomalia
South AfricaSwaziland
TogoUganda
United Republic of TanzaniaZambia
Zimbabwe
World 1
Countries in transitionDeveloped countries
Developing countries
Arab StatesCentral and Eastern Europe
Central AsiaEast Asia and the Pacific
East AsiaPacific
Latin America/CaribbeanCaribbean
Latin AmericaN. America/W. Europe
South and West AsiaSub-Saharan Africa
… … … … … … … … … … … 75.y… 12.z … 37.z … 707...z … 1.8.z … 29...z … …… … … … … … … … … … … …… … … … … … … … … … … …… 20 … 23 … 245 … 1.5 … 21 … …
15 16 24 19 1 655 1 439 1.9 1.8 45 35 84 …… … … … … … … … … … … …… 6 … 21 … 134 … 0.6 … 14 … …… 13.x … 10.x … 80...x … 0.5.x … 12...x … …
16 17 34 27 412 291 0.9 0.9 48 27 … …
11 10 37 43 1 576 1 778 1.4 1.5 16 14 … …… 14.y … 17.y … 538.y … 0.6.y … 49.y … 93.y
21 19.x 28 … 2 313 1 140.x 2.1 1.6.x 34 23.x … …… 22 … 25 … 366 … 0.7 … 45 … …… … … … … … … … … … … …… 9...z … 20 … 197...z … 0.4.z … 17...z … …… … … … … … … … … … … …… 17.z … 26.z … 590.z … 1.2.z … 34.z … …… 15...y … 21 … 2 828...y … 1.3 … 18...y … 68… … … 27...x … … … 1.2...x … … … …… … … … … … … … … … … …
14.* 14.z 34 31 1 973.* 1 726.z 2.0 1.6 20.* 17.z … 789 12...y 27 28...y 1 237 1 203...y 1.5 1.7...y 25 31.y … …
10 … 34 … 484 … 1.4 … 31 … 79 …… 9...y … 20...y … 376...y … 0.8.y … 30...y … …… … … … … … … … … … … …… 6.z … 15.z … 84...z … 0.3.z … 9...z … 93.y… … … … … … … … … … … …
… 14 … 36 … … … 1.6 … 20 … …
… … … … … … … … … … … …… 17 … 42 … 6 427 … 2.2 … 23 … …… 13 … … … … … 1.4 … … … …
… 12 … … … … … … … … … …… 17 … 46 … 1 203 … 1.4 … 21 … …… … … … … … … … … … … …… … … … … … … … … … … …… … … … … … … … … … … …… … … … … … … … … … … …… 12 … 32 … … … 1.4 … 14 … 82… 13 … 33 … … … … … … … …… 12 … 30 … 594 … 1.3 … 13 … 8117 18 42 40 6 858 7 753 2.1 2.1 25 24 … 65… … … … … … … … … … … …… 13 … 26 … 376 … 1.0 … 20 … …
Country or territory1999 2006
Public currentexpenditure on
primary education per pupil as %
of GNP per capita
1999 2006
Public currentexpenditure on
secondary education as % of public
current expenditure on education
1999 2006
Public currentexpenditure on
secondary education per pupil (unit cost) at PPP in constant
2005 US$
1999 2006
Public currentexpenditure
on secondary education
as % of GNP
1999 2006
Public currentexpenditure on
secondary education per pupil as %
of GNP per capita
1999 2006
Primary teachers’compensation as %
of current expenditure on primary education,in public institutions
Ta b l e 1 1
S TAT I S T I C A L TA B L E S
3 7 1

… 3 15 89 0.88 91 0.96 95 0.98 74 0.72.* 92 0.9527 36 52 99 1.00 96 1.03 98.z 1.00.z 97 0.99.* 100 1.00
0.6 0.4 2 29 0.72 27 0.73 38 0.82 … .… … .…
6 11 17 86 0.84 94 0.93 96 0.96 63 0.76.* 85 0.898 5 6...z 94 0.88 85 0.85 89...z 0.86...z … .… 85 0.91.*
21 29 32 94 1.01 91 1.01 90 1.02 … .… 99 1.0033 78 75 49 0.93 87 1.01 83 0.99 87 0.93.* 99 1.00.*… 61 64 66 0.97 86 0.96 82 0.99 … .… … .…… 5 9 93 0.96 … .… … .… 95 0.92 99 0.98… … 2...z 36 0.78 64 0.99 79 1.05 … .… 66 0.8858 62 59 56 0.70 70 0.85 88 0.94 58 0.64.* 74 0.78
3 6 8 69 0.95 81 1.00 74 1.02 … .… 98 0.9921 39 30 … … 97 1.00 76 1.00 … .… 99 1.0028 25 43 89 0.98 92 1.01 94 1.01 90 1.03.* 97 1.01
7 … … 59 0.80 … .… … .… 88 0.86.* 97 0.9818 19 24 40 0.75 … .… … .… … .… 77 0.84.*
6 8 11 91 0.91 92 0.93 … .… … .… 93 0.968 14 … 93 0.93 93 0.98 96 1.01 … .… 95 0.97
56 64 78 99 0.98 79 0.99 88 1.00 82 1.04.* 97 0.980.7 0.7 0.9.z 50 0.38 56 0.59 75.z 0.76.z 60 0.43.* 79 0.69
59 40 49.y 95 1.01 94 0.98 94.y 0.99.y … .… 99 1.0084 75 103 85 0.96 … .… 89 0.98 100 1.00.* 100 1.00… … … 79 1.00 … .… … .… … .… 100 1.00.*91 67 82 85 1.00 97 0.98 92 0.99 … .… 98 1.0028 40 50 79 1.00 85 0.98 90 0.99 100 1.00.* 100 1.0095 90 114 87 1.00 97 1.00 93...z 1.03...z … .… … .…
76 87 93 100 0.99 96 0.98 94 0.99 100 1.00.* 100 1.00113 78 86 91 1.01 88 0.99 88 0.99 … .… … .…
47 53 89 94 0.99 97 0.98 90...z 1.03...z 100 1.00.* 100 1.0058 50 69 … … 95 0.99 89 0.99 100 1.00.* 100 1.00… … … … … … .… … .… … .… … .…
47 50 57 97 1.00 96 1.00 96 1.01 … .… … .…
70 48 71 86 1.01 93 .… 88 1.00 100 1.00.* 100 1.0076 62 72 81 1.00 96 0.99 93 1.00 99 1.00.* 98 1.0074 68 87 98 1.00 … .… 91 1.00 100 1.00.* 100 1.00… 54 59 … … … .… 95 1.00 … .… … .…
86 82 93 … … … .… 92...z 1.01...z … .… … .…
66 75 81 96 1.01 96 0.99 95 1.00 100 1.00.* 100 1.00… 27 33.z 94 0.99 93 0.98 92.z 1.00.z 99 0.99.* 99 1.00
4 6 13 89 0.92 … .… 91 0.96 93 0.92.* 96 0.96.*86 50 90 81 1.00 … .… 90 1.00.* … .… 100 1.00
37 26 36 … … … .… 82 1.05 100 1.00.* 100 1.0019 21 32 89 0.99 85 1.01 85 0.97 … .… 100 1.0059 36 55 97 1.00 77.* 1.00.* 89 1.03 … .… … .…
73 14 38 88 0.99 … .… 90 1.00 100 1.00.* 100 1.0034 10 14 92 1.00 88.* 0.99.* 86 0.99 … .… 100 1.0039 25 54 90 1.02 89 1.04 91 1.02 … .… 96 1.0316 8 9 77 0.98 … .… 97 0.96 100 1.00.* 100 1.00… … … … … … .… … .… … .… 100 1.0073 24 27 78 0.99 … .… … .… … .… 99 1.00.*
71 … 104 99 1.00 94 1.01 96 1.01 … .… … .…
48 50 51 92 0.98 … .… 94 1.00 98 1.00.* 100 1.004 5 11 72 0.84 83 0.91 90 0.98 … .… 85 0.92
AlgeriaBahrainDjiboutiEgyptIraqJordanKuwaitLebanonLibyan Arab JamahiriyaMauritaniaMoroccoOmanPalestinian A. T.QatarSaudi ArabiaSudan2
Syrian Arab RepublicTunisiaUnited Arab EmiratesYemen
AlbaniaBelarusBosnia and HerzegovinaBulgariaCroatiaCzech RepublicEstoniaHungaryLatviaLithuaniaMontenegroPolandRepublic of Moldova3,4
RomaniaRussian Federation5
Serbia3
SlovakiaSloveniaTFYR MacedoniaTurkeyUkraine
ArmeniaAzerbaijanGeorgiaKazakhstanKyrgyzstanMongoliaTajikistanTurkmenistanUzbekistan
AustraliaBrunei DarussalamCambodia
Table 12Trends in basic or proxy indicators to measure EFA goals 1, 2, 3, 4 and 5
90
02
Education f
or A
ll G
lobal M
onitorin
g R
eport
A N N E X
GROSS ENROLMENT RATIO (GER)IN PRE-PRIMARY EDUCATION (%)
Early childhood care and education
GOAL 1
Total Total
1991 1999School year ending in
Total
2006
Country or territory
NET ENROLMENT RATIO (NER) IN PRIMARY EDUCATION
Universal primary education Learning needs of all youth and adults
GOAL 2 GOAL 3
Total GPI
1991School year ending in
YOUTH LITERACY RATE (15-24)
(%)(%)(%)(%) (F/M)Total GPI
1999
(%) (F/M) (F/M)Total GPI
2006
(%)Total GPI
1985-19941
(%) (F/M) (F/M)Total GPI
2000-20061
(%)
Arab States
Central and Eastern Europe
Central Asia
East Asia and the Pacific
3 7 2

50 0.57.* 75 0.78 96 0.85 105 0.91 110 0.93 60 0.80 … .… 83...z 1.08...z
84 0.87.* 88 0.95 110 1.00 107 1.01 120 1.00 100 1.04 95 1.08 102 1.04… .… … .… 34 0.72 33 0.71 44 0.81 11 0.66 14 0.72 22 0.6744 0.55.* 71 0.72 94 0.83 102 0.91 105 0.95 71 0.79 82 0.92 88...y 0.94...y… .… 74 0.76.* 108 0.83 92 0.82 99...z 0.83...z 44 0.63 34 0.63 45...z 0.66...z… .… 93 0.92 101 1.01 98 1.00 97 1.02 63 1.04 89 1.02 89 1.0374 0.88.* 93 0.96.* 60 0.95 100 1.01 96 0.99 43 0.98 98 1.02 89 1.05… .… … .… 97 0.97 105 0.95 94 0.97 … .… 74 1.09 81 1.1076 0.71 86 0.82 101 0.94 120 0.98 110 0.95 80 .… … .… 94 1.17… .… 55 0.76 52 0.77 89 0.99 102 1.05 14 0.49 19 0.77 25.* 0.86.*42 0.52.* 55 0.62 64 0.69 86 0.81 106 0.89 36 0.72 37 0.79 52 .…… .… 84 0.86 85 0.92 91 0.97 82 1.01 45 0.81 75 1.00 89 0.96… .… 92 0.91 … .… 105 1.01 83 1.00 … .… 80 1.04 94 1.0676 0.94.* 90 1.00 101 0.93 102 0.96 105 0.99 84 1.06 87 1.11 101 0.9771 0.72.* 84 0.89 73 0.85 … … … .… 44 0.80 … .… … .…… .… 61 0.73.* 49 0.77 49 0.85 66 0.87 21 0.79 26 .… 34 0.96… .… 83 0.85 101 0.90 102 0.92 126 0.96 48 0.73 40 0.91 70 0.95… .… 77 0.79 113 0.90 113 0.95 108 0.97 45 0.79 72 1.02 85 1.1071 0.95.* 90 0.98 114 0.97 90 0.97 104 0.99 68 1.16 76 1.06 90 1.0237 0.30.* 57 0.51 63 0.35 71 0.56 87.z 0.74.z … .… 41 0.37 46.z 0.49.z
… .… 99 0.99 100 1.00 103 0.98 105.y 0.99.y 78 0.86 71 0.98 77.y 0.96.y
98 0.97.* 100 1.00 95 0.96 111 0.99 96 0.98 93 .… 85 1.05 96 1.02… .… 97 0.95.* … .… … … … .… … .… … .… … .…… .… 98 0.99 97 0.98 106 0.98 100 0.99 75 1.04 91 0.98 106 0.9697 0.96.* 99 0.98 85 0.99 92 0.98 99 1.00 76 1.10 84 1.02 91 1.03… .… … .… 97 1.00 103 0.99 100 0.99 91 0.97 83 1.04 96 1.01
100 1.00.* 100 1.00 112 0.97 102 0.97 99 0.98 100 1.08 93 1.04 100 1.02… .… … .… 95 1.00 102 0.98 97 0.98 79 1.01 94 1.02 96 0.9999 0.99.* 100 1.00 98 1.00 100 0.98 95 0.96 92 1.02 88 1.04 99 1.0098 0.99.* 100 1.00 92 0.95 102 0.98 95 0.99 92 .… 95 1.01 99 1.00… .… … .… … .… … … … .… … .… … .… … .…… .… … .… 98 0.99 98 0.98 98 1.00 81 1.05 99 0.99 100 0.9996 0.96.* 99 0.99 90 1.02 100 1.00 97 0.99 78 1.10 83 0.98 89 1.0497 0.96.* 98 0.98 91 1.00 105 0.98 105 0.99 92 0.99 79 1.01 86 1.0098 0.97.* 100 1.00 108 1.00 108 0.98 96 1.00 93 1.06 … .… 84 0.98… .… … .… … .… 112 0.99 97 1.00 … .… 93 1.01 88 1.03… .… … .… … .… 103 0.99 100 0.98 … .… 85 1.02 94 1.01
100 1.00.* 100 1.00 100 .… 100 0.99 100 0.99 89 .… 100 1.03 95 1.0094 0.94.* 97 0.97 99 0.98 101 0.98 98.z 1.00.z 56 0.99 82 0.97 84.z 0.98.z
79 0.76.* 88 0.84.* 99 0.92 … … 94 0.95 48 0.63 … .… 79 0.83… .… 100 1.00 89 1.00 109 0.99 102 1.00 94 .… 98 1.03.* 93 0.98.*
99 0.99.* 99 1.00 … .… 100 … 98 1.04 … .… 91 .… 90 1.04… .… 99 0.99 111 0.99 94 1.00 96 0.97 88 1.01 76 1.00 83 0.96… .… … .… 97 1.00 98 1.00 96 1.03 95 0.97 79 0.98 85 1.0498 0.97.* 100 1.00 89 0.99 97 1.01 105 1.00 100 1.03 92 1.00 93 0.99… .… 99 1.00 … .… 98 0.99 97 0.99 100 1.02 83 1.02 86 1.01… .… 97 1.01 97 1.02 97 1.04 101 1.02 82 1.14 58 1.27 89 1.1298 0.98.* 100 1.00 91 0.98 98 0.95 100 0.95 102 .… 74 0.86 83 0.83… .… 99 1.00 … .… … … … .… … .… … .… … .…… .… 97 0.98.* 81 0.98 98 1.00 95 0.97 99 0.91 86 0.98 102 0.98
… .… … .… 108 0.99 100 1.00 105 1.00 83 1.03 157 1.00 150 0.9588 0.89.* 95 0.96 114 0.94 114 0.97 107 0.99 77 1.09 85 1.09 98 1.04… .… 76 0.78 90 0.81 97 0.87 122 0.93 25 0.43 17 0.53 38 0.79
AlgeriaBahrainDjibouti
EgyptIraq
JordanKuwait
LebanonLibyan Arab Jamahiriya
MauritaniaMorocco
OmanPalestinian A. T.
QatarSaudi Arabia
Sudan 2
Syrian Arab RepublicTunisia
United Arab EmiratesYemen
AlbaniaBelarus
Bosnia and HerzegovinaBulgariaCroatia
Czech RepublicEstonia
HungaryLatvia
LithuaniaMontenegro
PolandRepublic of Moldova 3,4
RomaniaRussian Federation 5
Serbia 3
SlovakiaSlovenia
TFYR MacedoniaTurkey
Ukraine
ArmeniaAzerbaijan
GeorgiaKazakhstanKyrgyzstan
MongoliaTajikistan
TurkmenistanUzbekistan
AustraliaBrunei Darussalam
Cambodia
Ta b l e 1 2
S TAT I S T I C A L TA B L E S
Country or territory
GROSS ENROLMENT RATIO (GER)
Gender parity in primary education
GOAL 5
Total GPI
1991School year ending in
(%) (F/M)Total GPI
1999
(%) (F/M) (F/M)Total GPI
2006
(%)
GROSS ENROLMENT RATIO (GER)
Gender parity in secondary education
Total GPI
1991School year ending in
(%) (F/M)Total GPI
1999
(%) (F/M) (F/M)Total GPI
2006
(%)
Improving levels of adult literacy
GOAL 4
ADULT LITERACY RATE (15 and over)
Total GPI
1985-19941
(%) (F/M) (F/M)Total GPI
2000-20061
(%)
Arab States
Central and Eastern Europe
Central Asia
East Asia and the Pacific
3 7 3

22 38 39 98 0.96 … .… … .… 94 0.94.* 99 1.00… 86 94...z … … 85 0.96 74...z 1.03...z … .… … .…… … … … … … .… … .… … .… … .…
14 16 16 … … 99 1.01 91 1.00 … .… … .…
18 23 37 96 0.96 … .… 96 0.96 96 0.98.* 99 1.0048 83 86 100 1.00 100 1.00 100 1.00 … .… … .…… … 75...y … … 97 1.01 … .… … .… … .…
7 8 11 62 0.86 76 0.92 84 0.94 … .… 82 0.9389 87 87 81 0.98 85 1.01 91 0.98 … .… 100 1.0037 108 125.z 93 0.99 98 0.98 100.z 1.00.z 96 0.99.* 98 1.00… 59 45 … … … .… 66 0.99 … .… … .…… 37 … 98 1.04 … .… … .… … .… … .…… 2 6 99 … 92 0.99 100 1.01 … .… 95 0.98.*… … 89 … … … .… … .… … .… … .…
76 85 92 98 1.00 99 1.00 99 1.00 … .… … .…… 154 119.z … … 99 1.00 … .… … .… … .…… 63 64...z … … 97 0.94 … .… … .… … .…
0.3 … … 66 0.86 … .… … .… … .… 64 1.0312 30 45 96 0.99 92 1.00 91 1.02 97 1.01.* 94 1.0255 80 101 100 1.01 94 0.97 98 .… … .… … .…… 53 48...y … … 92 0.99 90...y 1.00...y 99 1.00.* 99 1.00… … … 96 0.99 … .… … .… 99 1.00.* 100 1.0036 35 … 84 0.86 … .… 62.z 0.99.z … .… … .…
49 97 92 88 0.99 … .… 94 0.99 … .… 98 1.00… … 10.z … … … .… 68...z 0.96...z … .… … .…… … 125...y … … … .… … .… … .… … .…… 30 23...z 97 0.97 88 0.96 96.z 0.97.z … .… 100 1.00… … 107 … … … .… … .… … .… … .…… … 29 71 1.01 91 0.99 87 0.99 … .… … .…
28 39 … 90 0.92 95 .… … .… 94 0.99.* 94 0.99.*
… … 103 … … … .… 92 1.00 … .… … .…… … … … … … .… … .… … .… … .…
50 57 66.z 94 1.00 99.* 1.00.* 99.z 0.99.z 98 1.00.* 99 1.00… 99 99 … … 98 1.03 100 1.00 … .… 99 1.00… 12 … 90 1.03 89 0.99 88 1.03 … .… … .…… 74 94 79 0.98 94 0.99 96 0.99 … .… … .…
23 27 34 94 0.99 94 0.99 97 1.01 76 1.01.* … .…… … … … … … .… 92 .… … .… … .…
32 45 50 91 0.92 95 1.00 95 1.01 94 0.95.* 98 0.9948 58 69.z 85 0.95 91 .… 94.z 1.02.z … .… 98 1.02.*… 62 93 … … 96 1.02 95 1.00 … .… … .…… … … … … … .… … .… … .… … .…
72 77 55 89 0.98 … .… … .… 98 1.01.* 99 1.0013 37 40 68 1.15 89 1.01 88 1.00 91 1.03.* 98 1.01.*65 84 70 87 1.01 … .… … .… … .… 98 1.01
102 109 113 94 1.00 97 1.01 97 1.01 … .… 100 1.00… 80 77.z … … 94 0.98 77 1.06 … .… … .…… 32 32 56 2.15 84 1.01 77 1.03 … .… 96 1.0242 64 90 98 1.01 97 1.01 97 1.01 96 0.99.* 96 1.0121 43 51 75 1.01 … .… 94 1.00 85 1.00.* 95 1.01.*… 93 81...z 100 1.00 … .… 84...z 0.99...z … .… … .…
25 46 29 64 0.91 82 0.91 94 0.96 76 0.87.* 85 0.9474 124 99 89 1.00 … .… … .… … .… … .…
33 … … 21 1.05 … .… … .… … .… … .…
13 … 38 88 1.01 … .… 96 1.02 … .… 90 1.0678 78 92.z 96 1.00 88 1.00 90...z 1.00...z … .… 94 1.0863 74 106 98 0.97 97 1.00 98 0.99 95 0.99.* 98 1.00.*… … 91 … … … .… 99 .… … .… … .…… 111 … … … … .… … .… 97 1.01.* 98 1.0013 27 52 70 1.03 76 1.01 90 1.00 … .… 88 1.07
China6
Cook Islands3
DPR KoreaFijiIndonesiaJapanKiribati3
Lao PDRMacao, ChinaMalaysiaMarshall Islands3
MicronesiaMyanmarNauruNew ZealandNiue3
Palau3
Papua New GuineaPhilippinesRepublic of KoreaSamoaSingaporeSolomon IslandsThailandTimor-LesteTokelau3
TongaTuvalu3
VanuatuViet Nam
AnguillaAntigua and BarbudaArgentinaArubaBahamasBarbadosBelizeBermuda3
BoliviaBrazilBritish Virgin Islands3
Cayman Islands7
ChileColombiaCosta RicaCubaDominica3
Dominican RepublicEcuadorEl SalvadorGrenada3
GuatemalaGuyanaHaitiHondurasJamaicaMexicoMontserratNetherlands AntillesNicaragua
Table 12 (continued)
GROSS ENROLMENT RATIO (GER)IN PRE-PRIMARY EDUCATION (%)
Early childhood care and education
GOAL 1
Total Total
1991 1999School year ending in
Total
2006
Country or territory
NET ENROLMENT RATIO (NER) IN PRIMARY EDUCATION
Universal primary education Learning needs of all youth and adults
GOAL 2 GOAL 3
Total GPI
1991School year ending in
YOUTH LITERACY RATE (15-24)
(%) (F/M)Total GPI
1999
(%) (F/M) (F/M)Total GPI
2006
(%)Total GPI
1985-19941
(%) (F/M) (F/M)Total GPI
2000-20061
(%)
Latin America and the Caribbean
00
2Education f
or A
ll G
lobal M
onitorin
g R
eport
A N N E X
3 7 4
9
(%)(%)(%)

78 0.78.* 93 0.93 126 0.93 … … 111 0.99 49 0.75 62 .… 76 1.01… .… … .… … .… 96 0.95 80...z 1.01...z … .… 60 1.08 72...z 1.04...z… .… … .… … .… … … … .… … .… … .… … .…… .… … .… 133 1.00 109 0.99 100 0.98 64 0.95 80 1.11 84 1.1082 0.86.* 91 0.92 114 0.98 … … 114 0.96 45 0.83 … .… 64 1.00… .… … .… 100 1.00 101 1.00 100 1.00 97 1.02 102 1.01 101 1.00… .… … .… … .… 104 1.01 113.z 1.01.z … .… 84 1.18 88.z 1.14.z… .… 72 0.83 103 0.79 111 0.85 116 0.89 23.* 0.62.* 33 0.69 43 0.78… .… 93 0.94 99 0.96 100 0.96 106 0.94 65.* 1.11.* 76 1.08 98 1.0083 0.87.* 92 0.95 93 0.99 98 0.98 100.z 1.00.z 57 1.05 65 1.07 69.z 1.10.z… .… … .… … .… 101 0.98 93 0.97 … .… 72 1.06 66 1.02… .… … .… … .… … … 110 1.01 … .… … .… 91 .…… .… 90 0.92.* 114 0.97 100 0.99 114 1.01 23 0.99 36 1.01 49 1.00… .… … .… … .… … … 79 1.03 … .… … .… 46 1.19… .… … .… 102 0.99 100 1.00 102 1.00 90 1.02 113 1.05 120 1.05… .… … .… … .… 99 1.00 105.z 0.95.z … .… 98 1.10 99.z 1.07.z… .… … .… … .… 114 0.93 104...z 0.94...z … .… 101 1.07 102...z .…… .… 57 0.85 65 0.85 … … 55 0.84 12 0.62 … .… … .…
94 0.99.* 93 1.01 109 0.99 113 1.00 110 0.99 71 1.04 76 1.09 83 1.11… .… … .… 105 1.01 95 0.97 105 0.97 90 0.97 100 1.01 98 0.9498 0.99.* 99 0.99 124 1.02 99 0.98 100...z 1.00...z 33 1.96 79 1.10 81...z 1.13...z
89 0.87.* 94 0.94 103 0.97 … … … .… 67 0.93 … .… … .…… .… … .… 88 0.87 88 0.94 101.z 0.96.z 15 0.61 25 0.76 30.z 0.84.z… .… 94 0.96 113 0.98 106 0.99 108 1.00 33 0.96 … .… 78 1.09… .… … .… … .… … … 99.z 0.92.z … .… … .… 53.z 1.00.z… .… … .… … .… … … 93...y 1.35...y … .… … .… 101...y 0.88...y… .… 99 1.00 112 0.98 108 0.96 113 0.95 98 1.04 102 1.11 94 1.04… .… … .… … .… 98 1.02 106 0.99 … .… … .… … .…… .… … .… 95 0.96 111 0.98 108 0.97 18 0.80 30 0.87 40.y 0.86.y
88 0.89.* 90 0.93.* 107 0.93 108 0.93 … .… 32 .… 62 0.90 … .…
… .… … .… … .… … … 93 0.99 … .… … .… 83 1.02… .… … .… … .… … … … .… … .… … .… … .…
96 1.00.* 98 1.00 108 .… 117 1.00 112.z 0.99.z 72 .… 94 1.07 84.z 1.11.z… .… 98 1.00 … .… 114 0.99 115 0.98 … .… 99 1.07 100 1.04… .… … .… 96 1.03 95 0.98 98 1.00 … .… 79 0.99 91 1.01… .… … .… 92 1.00 98 0.98 103 0.98 … .… 100 1.05 102 1.0470 1.00.* … .… 112 0.98 118 0.97 123 0.97 44 1.15 64 1.08 79 1.06… .… … .… … .… … … 100 0.85 … .… … .… 84 1.0680 0.82.* 90 0.89 97 0.92 113 0.98 109 1.00 … .… 78 0.93 82 0.96… .… 90 1.01.* 104 .… 154 0.94 137.z 0.94.z 40 .… 99 1.11 105.z 1.10.z… .… … .… … .… 112 0.97 112 0.97 … .… 99 0.91 107 1.13… .… … .… … .… … … … .… … .… … .… … .…
94 0.99.* 96 1.00 101 0.98 101 0.97 104 0.95 73 1.07 79 1.04 91 1.0281 1.00.* 92 1.00.* 103 1.02 114 1.00 116 0.99 50 1.19 70 1.11 82 1.11… .… 96 1.00 103 0.99 108 0.98 111 0.99 45 1.06 57 1.09 86 1.06… .… 100 1.00 100 0.97 111 0.97 101 0.97 94 1.15 77 1.07 94 1.02… .… … .… … .… 104 0.95 86 1.02 … .… 90 1.35 106 0.98… .… 89 1.01 91 1.00 113 0.98 98 0.95 … .… 57 1.24 69 1.2088 0.95.* 92 0.98 116 0.99 114 1.00 117 1.00 55.* .… 57 1.03 68 1.0274 0.92.* 84 0.93.* 81 1.01 112 0.96 114 0.96 25 1.22 52 0.98 65 1.04… .… … .… 117 0.85 … … 93...z 0.96...z 100 1.16 … .… 100.z 1.03.z
64 0.80.* 72 0.86 81 0.87 101 0.87 114 0.93 23 .… 33 0.84 53 0.92… .… … .… 94 0.99 121 0.98 124.z 0.99.z 79 1.06 82 1.02 105 0.98… .… … .… 46 0.95 … … … .… 21.* 0.94.* … .… … .…… .… 83 1.01 107 1.04 … … 118 0.99 33 1.23 … .… 76.z 1.30.z… .… 85 1.13 101 0.99 92 1.00 95.z 1.00.z 65 1.06 88 1.02 87.z 1.03.z
88 0.94.* 92 0.96.* 112 0.97 111 0.98 113 0.97 53 0.99 70 1.01 87 1.02… .… … .… … .… … … 114 1.00 … .… … .… 125 0.9895 1.00.* 96 1.00 … .… 131 0.95 … .… 93 1.19 92 1.16 … .…… .… 80 1.02 91 1.06 100 1.01 116 0.98 42 1.20 52 1.19 66 1.14
China 6
Cook Islands 3
DPR KoreaFiji
IndonesiaJapan
Kiribati 3
Lao PDRMacao, China
MalaysiaMarshall Islands
MicronesiaMyanmar
NauruNew Zealand
Niue 3
Palau 3
Papua New GuineaPhilippines
Republic of KoreaSamoa
SingaporeSolomon Islands
ThailandTimor-Leste
Tokelau 3
TongaTuvalu 3
VanuatuViet Nam
AnguillaAntigua and Barbuda
ArgentinaAruba
BahamasBarbados
BelizeBermuda 3
BoliviaBrazil
British Virgin Islands 3
Cayman Islands 7
ChileColombia
Costa RicaCuba
Dominica 3
Dominican RepublicEcuador
El SalvadorGrenada 3
GuatemalaGuyana
HaitiHondurasJamaicaMexico
MontserratNetherlands Antilles
Nicaragua
Country or territory
GROSS ENROLMENT RATIO (GER)
Gender parity in primary education
GOAL 5
Total GPI
1991School year ending in
(%) (F/M)Total GPI
1999
(%) (F/M) (F/M)Total GPI
2006
(%)
GROSS ENROLMENT RATIO (GER)
Gender parity in secondary education
Total GPI
1991School year ending in
(%) (F/M)Total GPI
1999
(%) (F/M) (F/M)Total GPI
2006
(%)
Improving levels of adult literacy
GOAL 4
ADULT LITERACY RATE (15 and over)
Total GPI
1985-19941
(%) (F/M) (F/M)Total GPI
2000-20061
(%)
Latin America and the Caribbean
S TAT I S T I C A L TA B L E S
Ta b l e 1 2
3 7 5
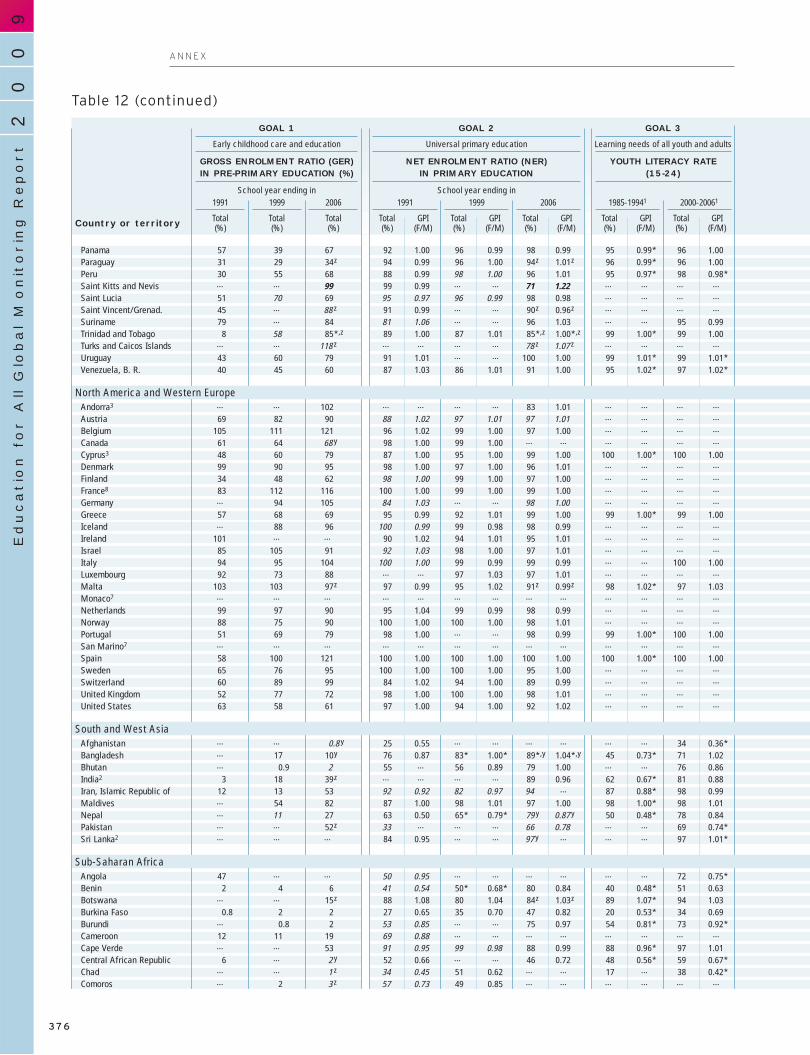
57 39 67 92 1.00 96 0.99 98 0.99 95 0.99.* 96 1.0031 29 34.z 94 0.99 96 1.00 94.z 1.01.z 96 0.99.* 96 1.0030 55 68 88 0.99 98 1.00 96 1.01 95 0.97.* 98 0.98.*… … 99 99 0.99 … .… 71 1.22 … .… … .…
51 70 69 95 0.97 96 0.99 98 0.98 … .… … .…
45 … 88...z 91 0.99 … .… 90.z 0.96.z … .… … .…
79 … 84 81 1.06 … .… 96 1.03 … .… 95 0.998 58 85.*,z 89 1.00 87 1.01 85.*,z 1.00.*,z 99 1.00.* 99 1.00
… … 118...z … … … .… 78...z 1.07...z … .… … .…
43 60 79 91 1.01 … .… 100 1.00 99 1.01.* 99 1.01.*40 45 60 87 1.03 86 1.01 91 1.00 95 1.02.* 97 1.02.*
… … 102 … … … .… 83 1.01 … .… … .…
69 82 90 88 1.02 97 1.01 97 1.01 … .… … .…
105 111 121 96 1.02 99 1.00 97 1.00 … .… … .…
61 64 68...y 98 1.00 99 1.00 … .… … .… … .…
48 60 79 87 1.00 95 1.00 99 1.00 100 1.00.* 100 1.0099 90 95 98 1.00 97 1.00 96 1.01 … .… … .…
34 48 62 98 1.00 99 1.00 97 1.00 … .… … .…
83 112 116 100 1.00 99 1.00 99 1.00 … .… … .…… 94 105 84 1.03 … .… 98 1.00 … .… … .…
57 68 69 95 0.99 92 1.01 99 1.00 99 1.00.* 99 1.00… 88 96 100 0.99 99 0.98 98 0.99 … .… … .…
101 … … 90 1.02 94 1.01 95 1.01 … .… … .…
85 105 91 92 1.03 98 1.00 97 1.01 … .… … .…
94 95 104 100 1.00 99 0.99 99 0.99 … .… 100 1.0092 73 88 … … 97 1.03 97 1.01 … .… … .…
103 103 97.z 97 0.99 95 1.02 91.z 0.99.z 98 1.02.* 97 1.03… … … … … … .… … .… … .… … .…
99 97 90 95 1.04 99 0.99 98 0.99 … .… … .…
88 75 90 100 1.00 100 1.00 98 1.01 … .… … .…
51 69 79 98 1.00 … .… 98 0.99 99 1.00.* 100 1.00… … … … … … .… … .… … .… … .…
58 100 121 100 1.00 100 1.00 100 1.00 100 1.00.* 100 1.0065 76 95 100 1.00 100 1.00 95 1.00 … .… … .…
60 89 99 84 1.02 94 1.00 89 0.99 … .… … .…
52 77 72 98 1.00 100 1.00 98 1.01 … .… … .…
63 58 61 97 1.00 94 1.00 92 1.02 … .… … .…
… … 0.8...y 25 0.55 … .… … .… … .… 34 0.36.*… 17 10.y 76 0.87 83.* 1.00.* 89.*,y 1.04.*,y 45 0.73.* 71 1.02… 0.9 2 55 … 56 0.89 79 1.00 … .… 76 0.86
3 18 39.z … … … .… 89 0.96 62 0.67.* 81 0.8812 13 53 92 0.92 82 0.97 94 .… 87 0.88.* 98 0.99… 54 82 87 1.00 98 1.01 97 1.00 98 1.00.* 98 1.01… 11 27 63 0.50 65.* 0.79.* 79...y 0.87...y 50 0.48.* 78 0.84… … 52.z 33 … … .… 66 0.78 … .… 69 0.74.*… … … 84 0.95 … .… 97...y .… … .… 97 1.01.*
47 … … 50 0.95 … .… … .… … .… 72 0.75.*2 4 6 41 0.54 50.* 0.68.* 80 0.84 40 0.48.* 51 0.63
… … 15.z 88 1.08 80 1.04 84.z 1.03.z 89 1.07.* 94 1.030.8 2 2 27 0.65 35 0.70 47 0.82 20 0.53.* 34 0.69
… 0.8 2 53 0.85 … .… 75 0.97 54 0.81.* 73 0.92.*12 11 19 69 0.88 … .… … .… … .… … .…… … 53 91 0.95 99 0.98 88 0.99 88 0.96.* 97 1.01
6 … 2...y 52 0.66 … .… 46 0.72 48 0.56.* 59 0.67.*… … 1...z 34 0.45 51 0.62 … .… 17 .… 38 0.42.*… 2 3...z 57 0.73 49 0.85 … .… … .… … .…
PanamaParaguayPeruSaint Kitts and NevisSaint LuciaSaint Vincent/Grenad.SurinameTrinidad and TobagoTurks and Caicos IslandsUruguayVenezuela, B. R.
Andorra3
AustriaBelgiumCanadaCyprus3
DenmarkFinlandFrance8
GermanyGreeceIcelandIrelandIsraelItalyLuxembourgMaltaMonaco7
NetherlandsNorwayPortugalSan Marino7
SpainSwedenSwitzerlandUnited KingdomUnited States
AfghanistanBangladeshBhutanIndia2
Iran, Islamic Republic ofMaldivesNepalPakistanSri Lanka2
AngolaBeninBotswanaBurkina FasoBurundiCameroonCape VerdeCentral African RepublicChadComoros
Table 12 (continued)
GROSS ENROLMENT RATIO (GER)IN PRE-PRIMARY EDUCATION (%)
Early childhood care and education
GOAL 1
Total Total
1991 1999School year ending in
Total
2006
Country or territory
NET ENROLMENT RATIO (NER) IN PRIMARY EDUCATION
Universal primary education Learning needs of all youth and adults
GOAL 2 GOAL 3
Total GPI
1991School year ending in
YOUTH LITERACY RATE (15-24)
(%) (F/M)Total GPI
1999
(%) (F/M) (F/M)Total GPI
2006
(%)Total GPI
1985-19941
(%) (F/M) (F/M)Total GPI
2000-20061
(%)
North America and Western Europe
South and West Asia
Sub-Saharan Africa
00
2Education f
or A
ll G
lobal M
onitorin
g R
eport
A N N E X
3 7 6
9
(%)(%)(%)

89 0.99.* 93 0.99 105 .… 108 0.97 112 0.97 62 .… 67 1.07 70 1.0990 0.96.* 94 0.98 106 0.97 119 0.96 111.z 0.97.z 31 1.05 58 1.04 66.z 1.03.z
87 0.88.* 89 0.89.* 118 0.97 122 0.99 116 1.01 67 0.94 84 0.94 94 1.03… .… … .… 119 1.02 … … 94 1.20 85 1.11 … .… 105 0.91… .… … .… 139 0.94 109 0.98 118 0.94 53 1.45 71 1.29 87 1.19… .… … .… 112 0.98 … … 97 1.06 58 1.24 … .… 75.z 1.24.z… .… 90 0.95 104 1.03 … … 121 1.00 58 1.16 … .… 77 1.3797 0.98.* 99 0.99 94 1.00 96 1.00 95.*,z 0.98.*,z 82 1.04 77 1.10 76.*,z 1.05.*,z
… .… … .… … .… … … 90...z 1.04...z … .… … .… 86...z 0.94...z
95 1.01.* 98 1.01.* 108 0.99 111 0.99 115 0.97 84 .… 92 1.17 101 1.1690 0.98.* 93 0.99.* 95 1.03 100 0.98 104 0.98 34 1.38 56 1.22 77 1.12
… .… … .… … .… … … 90 1.00 … .… … .… 85 1.04… .… … .… 101 1.00 103 0.99 102 0.99 102 0.93 99 0.96 102 0.96… .… … .… 100 1.01 105 0.99 102 0.99 101 1.01 143 1.07 110 0.97… .… … .… 104 0.98 99 1.00 100...y 0.99...y 101 1.00 … .… 117...y 0.97...y
94 0.93.* 98 0.97 90 1.00 97 1.00 102 1.00 72 1.02 93 1.03 97 1.02… .… … .… 98 1.00 101 1.00 99 1.00 109 1.01 125 1.06 120 1.03… .… … .… 99 0.99 99 1.00 98 1.00 116 1.19 121 1.09 112 1.04… .… … .… 108 0.99 107 0.99 110 0.99 98 1.05 111 1.00 114 1.00… .… … .… 101 1.01 106 0.99 103 1.00 98 0.97 98 0.98 101 0.9893 0.93.* 97 0.98 98 0.99 94 1.00 102 1.00 94 0.98 90 1.04 103 0.97… .… … .… 101 0.99 99 0.98 98 0.99 100 0.96 110 1.06 110 1.03… .… … .… 102 1.00 104 0.99 104 0.99 100 1.09 107 1.06 112 1.07… .… … .… 98 1.03 112 0.99 110 1.02 88 1.08 90 1.00 92 0.99… .… 99 0.99 104 1.00 103 0.99 103 0.99 83 1.00 92 0.99 100 0.99… .… … .… 91 1.08 101 1.02 102 1.01 75 .… 98 1.04 96 1.0488 1.01.* 91 1.04 108 0.96 107 1.01 100.z 0.98.z 83 0.94 … .… 99.z 1.00.z… .… … .… … .… … … … .… … .… … .… … .…… .… … .… 102 1.03 108 0.98 107 0.98 120 0.92 124 0.96 118 0.98… .… … .… 100 1.00 101 1.00 98 1.01 103 1.03 120 1.02 113 0.9988 0.92.* 95 0.96 119 0.95 123 0.96 115 0.95 66 1.16 106 1.08 97 1.09… .… … .… … .… … … … .… … .… … .… … .…
96 0.97.* 97 0.98 106 0.99 106 0.99 105 0.98 105 1.07 108 1.07 119 1.06… .… … .… 100 1.00 110 1.03 96 1.00 90 1.05 157 1.29 103 0.99… .… … .… 90 1.01 102 1.00 97 0.99 99 0.95 94 0.92 93 0.95… .… … .… 105 1.01 101 1.00 105 1.01 87 1.04 101 1.00 98 1.03… .… … .… 103 0.98 101 1.03 98 1.01 92 1.01 95 .… 94 0.99
… .… 28 0.29.* 29 0.55 28 0.08 101.z 0.59.z 16 0.51 … .… 19.z 0.33.z
35 0.58.* 52 0.81 … .… 102 0.99 103.y 1.03.y … .… 45 1.01 44.y 1.03.y… .… 54 0.61 … .… 75 0.85 102 0.98 … .… 37 0.81 49 0.9148 0.55.* 65 0.70 94 0.77 93 0.84 112 0.96 42 0.60 44 0.71 54.z 0.82.z
66 0.76.* 84 0.88 109 0.90 96 0.95 118 1.27 57 0.75 78 0.93 81.z 0.94.z
96 1.00.* 97 1.00 … .… 134 1.01 116 0.97 … .… 43 1.07 83 1.0733 0.35.* 55 0.61 110 0.63 114 0.77 126 0.95 34 0.46 34 0.70 43 0.89… .… 54 0.59.* … .… … … 84 0.78 25 0.48 … .… 30 0.78… .… 91 0.96.* 115 0.96 … … 108...z 1.00...z 71 1.09 … .… 87...y 1.02...y
… .… 67 0.65.* 80 0.92.* 64 0.86 … .… 11 .… 13 0.76 … .…
27 0.42.* 40 0.52 54 0.51 74 0.67 96 0.83 10 0.42 19 0.47 32...z 0.57...z
69 1.09.* 82 1.00 107 1.07 104 1.00 107.z 0.99.z 48 1.18 74 1.07 76.z 1.05.z
14 0.42.* 26 0.52 33 0.64 43 0.70 60 0.82 7 0.54 10 0.62 15 0.7237 0.57.* 59 0.78.* 71 0.84 60 0.80 103 0.91 5 0.58 … .… 14 0.74… .… 68 0.78.* 94 0.86 84 0.82 107 0.84 26 0.71 25 0.83 24 0.7963 0.71.* 83 0.88 111 0.94 119 0.96 106 0.95 21.* .… … .… 80 1.1534 0.42.* 49 0.52.* 63 0.64 … … 61 0.69 11 0.40 … .… … .…
12.* .… 26 0.31.* 51 0.45 63 0.58 76.z 0.68.z 7 0.20 10 0.26 15...z 0.33...z… .… … .… 75 0.73 76 0.85 85...z 0.88...z 18 0.65 25 0.81 35...z 0.76...z
PanamaParaguay
PeruSaint Kitts and Nevis
Saint LuciaSaint Vincent/Grenad.
SurinameTrinidad and Tobago
Turks and Caicos IslandsUruguay
Venezuela, B. R.
Andorra 3
AustriaBelgiumCanadaCyprus 3
DenmarkFinlandFrance 8
GermanyGreeceIcelandIreland
IsraelItaly
LuxembourgMalta
Monaco 7
NetherlandsNorwayPortugal
San Marino 7
SpainSweden
SwitzerlandUnited Kingdom
United States
AfghanistanBangladesh
BhutanIndia 2
Iran, Islamic Republic ofMaldives
NepalPakistan
Sri Lanka 2
AngolaBenin
BotswanaBurkina Faso
BurundiCameroon
Cape VerdeCentral African Republic
ChadComoros
Country or territory
GROSS ENROLMENT RATIO (GER)
Gender parity in primary education
GOAL 5
Total GPI
1991School year ending in
(%) (F/M)Total GPI
1999
(%) (F/M) (F/M)Total GPI
2006
(%)
GROSS ENROLMENT RATIO (GER)
Gender parity in secondary education
Total GPI
1991School year ending in
(%) (F/M)Total GPI
1999
(%) (F/M) (F/M)Total GPI
2006
(%)
Improving levels of adult literacy
GOAL 4
ADULT LITERACY RATE (15 and over)
Total GPI
1985-19941
(%) (F/M) (F/M)Total GPI
2000-20061
(%)
North America and Western Europe
South and West Asia
Sub-Saharan Africa
S TAT I S T I C A L TA B L E S
Ta b l e 1 2
3 7 7

3 2 9 82 0.94 … .… 55 0.90 94 0.95 98 0.990.9 2 3 45 0.71 52 0.75 … .… 49 0.63.* 61 0.74.*
… … … 54 0.78 … .… … .… … .… 70 0.81.*… 34 44.z 96 0.97 89 0.79 … .… … .… 95 1.00.*… 5 14 15 1.00 33 0.86 47 0.87 … .… … .…
1 1 3 22 0.75 34 0.69 71 0.92 34 0.71.* 50 0.62.*… … … 94 1.00 … .… … .… 93 0.98.* 97 0.98… 18 17...y 46 0.72 64 0.89 62 1.09 … .… … .…… 39 60 54 0.89 57 0.96 72 0.97 … .… 77 0.94… … 7 27 0.52 45 0.69 72 0.86 … .… 47 0.57.*… 3 … 38 0.56 45 0.71 … .… … .… … .…
35 44 49 76 1.01 63 1.01 75 1.02 … .… 80 1.01.*… 21 18 72 1.24 57 1.12 72 1.04 … .… … .…… 41 100 … … 42 0.77 39 0.97 51 0.84 70 1.10… 3 8 64 1.00 63 1.01 96 1.00 … .… 70 0.94.*… … … 49 0.93 98 0.98 91 1.06 59 0.70.* 82 0.98… 2 3 25 0.60 46 0.70 61 0.79 … .… 29 0.61… 96 101 91 1.00 91 1.01 95 1.02 91 1.01.* 96 1.02… … … 42 0.79 52 0.79 76 0.93 … .… 52 0.7913 21 22 86 1.08 73 1.07 76 1.06 88 1.06.* 93 1.04
1 1 2 24 0.61 26 0.68 43 0.73 … .… 38 0.46… … 14.y 55 0.77 58 0.82 63...z 0.86...z 71 0.77.* 86 0.95… … … 67 0.94 … .… 79...z 1.06...z 75 .… 78 0.98.*… 25 34 96 0.94 86 0.99 98 1.01 94 0.96.* 95 1.00
2 3 9 45 0.75 54 0.88 71 0.98 38 0.57.* 51 0.74… 109 109 … … … .… 99.y 1.01.y 99 1.01.* 99 1.01.*… … 5 43 0.73 … .… … .… … .… 52 0.66… … … 9 0.55 … .… … .… … .… … .…
21 21 38.y 90 1.03 94 1.01 88.y 1.00.y … .… 95 1.02… … 17...z 75 1.05 74 1.02 78.z 1.01.z 84 1.01.* 88 1.03.*
3 2 2...y 64 0.71 79 0.79 80 0.87 … .… 74 0.76.*… 4 3 51 0.83 … .… … .… 70 0.82.* 85 0.94… … 32 51 1.02 50 1.04 98 0.99 82 0.90.* 78 0.96… … … 78 0.96 68 0.96 92 1.03 66 0.97.* 69 0.91.*… 41 … 84 1.00 83 1.01 88 1.01 95 0.98.* 98 1.01
… 33 41 81 0.88 82 0.93 86 0.97 84 0.90 89 0.95
… 46 62 89 0.99 88 0.99 90 0.99 100 1.00 100 1.00… 73 79 96 1.00 97 1.00 95 1.01 99 1.00 99 1.00… 27 36 78 0.86 81 0.92 85 0.96 80 0.88 87 0.94
… 15 18 73 0.81 78 0.90 84 0.93 76 0.80 86 0.89… 49 62 91 0.98 91 0.97 92 0.98 98 0.98 99 0.99… 21 28 84 0.99 87 0.99 89 0.98 100 1.00 99 1.00… 40 45 97 0.97 96 1.00 93 1.00 95 0.96 98 1.00… 40 44 97 0.97 96 1.00 94 1.00 95 0.96 98 1.00… 61 74 91 0.97 90 0.98 84 0.97 92 0.98 91 1.00… 56 65 86 0.99 92 0.98 94 1.00 94 1.01 97 1.01… 65 79 51 1.02 75 0.97 72 0.97 78 1.07 86 1.09… 55 64 87 0.99 93 0.98 95 1.00 94 1.01 97 1.01… 75 81 96 1.00 97 1.00 95 1.01 99 1.00 99 1.00… 21 39 70 0.67 75 0.84 86 0.95 61 0.69 79 0.88… 9 14 54 0.86 56 0.89 70 0.92 64 0.83 71 0.87
CongoCôte d’IvoireD. R. CongoEquatorial GuineaEritreaEthiopiaGabonGambiaGhanaGuineaGuinea-BissauKenyaLesothoLiberiaMadagascarMalawiMaliMauritiusMozambiqueNamibiaNigerNigeriaRwandaSao Tome and PrincipeSenegalSeychelles3
Sierra LeoneSomaliaSouth AfricaSwazilandTogoUgandaUnited Republic of TanzaniaZambiaZimbabwe
World
Countries in transitionDeveloped countriesDeveloping countries
Arab StatesCentral and Eastern EuropeCentral AsiaEast Asia and the Pacific
East AsiaPacific
Latin America/CaribbeanCaribbeanLatin America
N. America/W. EuropeSouth and West AsiaSub-Saharan Africa
Table 12 (continued)
GROSS ENROLMENT RATIO (GER)IN PRE-PRIMARY EDUCATION (%)
Early childhood care and education
GOAL 1
Total Total
1991 1999School year ending in
Total
2006
Country or territory
NET ENROLMENT RATIO (NER) IN PRIMARY EDUCATION
Universal primary education Learning needs of all youth and adults
GOAL 2 GOAL 3
Total GPI
1991School year ending in
YOUTH LITERACY RATE (15-24)
(%) (F/M)Total GPI
1999
(%) (F/M) (F/M)Total GPI
2006
(%)Total GPI
1985-19941
(%) (F/M) (F/M)Total GPI
2000-20061
(%)
00
2Education f
or A
ll G
lobal M
onitorin
g R
eport
A N N E X
9
3. National population data were used to calculate enrolment ratios.4. Enrolment and population data used to calculate enrolment rates exclude Transnistria. 5. In the Russian Federation two education structures existed in the past, both startingat age 7. The most common or widespread one lasted three years and was used tocalculate indicators; the second one, in which about one-third of primary pupils wereenrolled, had four grades. Since 2004, the four-grade structure has been extended allover the country.
3 7 8
1. Data are for the most recent year available during the period specified. See the web version of the introduction to the statistical tables for a broader explanation of national literacy definitions,assessment methods, and sources and years of data. For countries indicated with (*), nationalobserved literacy data are used. For all others, UIS literacy estimates are used. The estimates weregenerated using the UIS Global Age-specific Literacy Projections model. Those in the most recentperiod refer to 2006 and are based on the most recent observed data available for each country.2. Literacy data for the most recent year do not include some geographic regions.
(%)(%)(%)
Weighted average Weighted average Weighted average

74 0.79 86 0.88 121 0.90 56 0.95 108 0.90 46 0.72 … .… 43...y 0.84...y
34 0.53.* 49 0.63.* 64 0.71 69 0.74 71 0.79 21.* 0.48 22 0.54 … .…… .… 67 0.67.* 70 0.75 48 0.90 … .… … .… 18 0.52 … .…… .… 87 0.86.* 173 0.96 142 0.79 122.z 0.95.z … .… 33 0.37 … .…… .… … .… 20 0.95 52 0.82 62 0.81 … .… 21 0.69 31 0.6027 0.51.* 36 0.46.* 30 0.66 48 0.61 91 0.88 13 0.75 12 0.68 30 0.6772 0.82.* 85 0.91 155 0.98 148 1.00 152...y 0.99...y … .… 49 0.86 … .…… .… … .… 59 0.70 77 0.87 74 1.08 17 0.50 32 0.66 45 0.90… .… 64 0.80 74 0.85 75 0.92 98 0.99 34 0.65 37 0.80 49 0.88… .… 29 0.43.* 37 0.48 57 0.64 88 0.84 10 0.34 14 0.37 35 0.53… .… … .… 50 0.55 70 0.67 … .… … .… … .… … .…… .… 74 0.90.* 94 0.96 93 0.97 106 0.97 28 0.77 38 0.96 50 0.93… .… 82 1.23.* 109 1.22 102 1.08 114 1.00 24 1.42 31 1.35 37 1.2741 0.57 54 0.83 … .… 85 0.74 91 0.90 … .… 29 0.65 … .…… .… 71 0.85.* 93 0.98 93 0.97 139 0.96 17 0.97 … .… 24 0.9549 0.51.* 71 0.80 66 0.84 137 0.96 119 1.04 8 0.46 36 0.70 29 0.84… .… 23 0.50 30 0.59 59 0.70 80 0.79 8 0.50 16 0.52 28 0.6180 0.88.* 87 0.94 109 1.00 105 1.00 102 1.00 55 1.04 76 0.98 88...z 0.99...z… .… 44 0.56 60 0.74 70 0.74 105 0.86 7 0.57 5 0.69 16 0.7276 0.95.* 88 0.98 128 1.03 104 1.01 107 1.00 45 1.22 55 1.12 57 1.15… .… 30 0.36 28 0.61 31 0.68 51 0.73 7 0.37 7 0.60 11 0.6355 0.65.* 71 0.79 83 0.79 88 0.79 96.z 0.83.z 24 0.72 23 0.89 32.z 0.82.z
58 .….* 65 0.84.* 71 0.93 92 0.98 140 1.04 9 0.73 9 0.99 13...z 0.89...z
73 0.73.* 87 0.88 … .… 108 0.97 127 1.00 … .… … .… 46 1.0727 0.48.* 42 0.60 55 0.73 64 0.86 80 0.98 15 0.53 15 0.64 24 0.7688 1.02.* 92 1.01.* … .… 116 0.99 125 0.99 … .… 113 1.04 112 1.13… .… 37 0.52 53 0.70 … … 147 0.90 17 0.57 … .… 32 0.69… .… … .… … .… … … … .… … .… … .… … .…… .… 88 0.98 109 0.99 116 0.97 106.y 0.96.y 69 1.18 89 1.13 95.y 1.07.y
67 0.94.* 80 0.97.* 94 0.99 100 0.95 106.z 0.93.z 42 0.96 45 1.00 47.z 1.00.z… .… 53 0.56.* 94 0.65 112 0.75 102 0.86 20 0.34 28 0.40 40...z 0.51...z
56 0.66.* 73 0.79 70 0.84 125 0.92 117 1.01 11 0.59 10 0.66 18...z 0.81...z
59 0.67.* 72 0.83 70 0.98 67 1.00 112 0.98 5 0.77 6 0.82 … .…
65 0.79.* 68 0.78.* 95 .… 80 0.92 117 0.98 23 .… 20 0.77 30...z 0.82...z
84 0.88.* 91 0.94 106 0.97 100 0.97 101 0.99 49 0.79 43 0.88 40 0.93
76 0.85 84 0.89 98 0.89 99 0.92 105 0.95 51 0.83 60 0.92 66 0.95
98 0.98 99 1.00 97 0.99 104 0.99 99 0.99 95 1.03 90 1.01 89 0.9799 0.99 99 1.00 102 0.99 102 1.00 101 1.00 93 1.01 100 1.00 101 1.0068 0.77 79 0.85 97 0.87 99 0.91 106 0.94 42 0.75 52 0.89 60 0.94
58 0.66 72 0.75 84 0.80 90 0.87 97 0.90 51 0.76 60 0.89 68 0.9296 0.96 97 0.97 98 0.98 102 0.96 97 0.98 82 0.98 87 0.98 88 0.9698 0.98 99 0.99 90 0.99 98 0.99 100 0.98 98 0.99 83 0.98 91 0.9682 0.84 93 0.94 118 0.95 112 0.99 109 0.99 52 0.83 65 0.96 75 1.0182 0.84 93 0.94 118 0.95 113 0.99 110 0.99 51 0.83 64 0.96 75 1.0194 0.99 93 0.99 98 0.97 95 0.97 91 0.97 66 1.00 111 0.99 107 0.9687 0.98 91 0.98 103 0.97 121 0.97 118 0.97 51 1.09 80 1.07 89 1.0766 1.02 74 1.05 70 0.98 112 0.98 108 0.99 44 1.03 53 1.03 57 1.0387 0.97 91 0.98 104 0.97 122 0.97 118 0.97 52 1.09 81 1.07 91 1.0799 0.99 99 1.00 104 0.99 103 1.01 101 1.00 94 1.02 100 0.99 101 1.0048 0.57 64 0.71 89 0.77 90 0.84 108 0.95 39 0.60 45 0.75 51 0.8553 0.71 62 0.75 72 0.84 78 0.85 95 0.89 21 0.75 24 0.82 32 0.80
CongoCôte d’IvoireD. R. Congo
Equatorial GuineaEritrea
EthiopiaGabon
GambiaGhana
GuineaGuinea-Bissau
KenyaLesothoLiberia
MadagascarMalawi
MaliMauritius
MozambiqueNamibia
NigerNigeria
RwandaSao Tome and Principe
SenegalSeychelles 3
Sierra LeoneSomalia
South AfricaSwaziland
TogoUganda
United Republic of TanzaniaZambia
Zimbabwe
World
Countries in transitionDeveloped countries
Developing countries
Arab StatesCentral and Eastern Europe
Central AsiaEast Asia and the Pacific
East AsiaPacific
Latin America/CaribbeanCaribbean
Latin AmericaN. America/W. Europe
South and West AsiaSub-Saharan Africa
Country or territory
GROSS ENROLMENT RATIO (GER)
Gender parity in primary education
GOAL 5
Total GPI
1991School year ending in
(%) (F/M)Total GPI
1999
(%) (F/M) (F/M)Total GPI
2006
(%)
GROSS ENROLMENT RATIO (GER)
Gender parity in secondary education
Total GPI
1991School year ending in
(%) (F/M)Total GPI
1999
(%) (F/M) (F/M)Total GPI
2006
(%)
Improving levels of adult literacy
GOAL 4
ADULT LITERACY RATE (15 and over)
Total GPI
1985-19941
(%) (F/M) (F/M)Total GPI
2000-20061
(%)
S TAT I S T I C A L TA B L E S
Ta b l e 1 2
3 7 9
6. Children enter primary school at age 6 or 7. Since 7 is the most commonentrance age, enrolment ratios were calculated using the 7-11 age groupfor both enrolment and population. 7. Enrolment ratios were not calculated due to lack of United Nationspopulation data by age.8. Data include French overseas departments and territories (DOM-TOM).
Data in italic are UIS estimates.Data in bold are for the school year ending in 2007.(z) Data are for the school year ending in 2005.(y) Data are for the school year ending in 2004.(*) National estimate.
Weighted average Weighted average Weighted average

95 0.99 95 1.02 95 1.01 28 28 2489 1.01 97 1.01 99.y 0.98.y 19 … …
87 1.81 77 1.19 90 0.94 43 40 34… … 99 1.01 … .… 24 23 27… … 66 0.94 81...y 0.84...y 25 25 21...z… … 98 0.99 … .… 25 … …… … … .… 96 1.02 18 13 10… … 91 1.07 91 1.06 … 14 14… … … .… … .… 14 … …
75 0.99 68 0.94 57 0.96 45 47 4175 1.02 82 1.00 80 0.97 27 28 2797 0.99 94 1.00 100 1.00 28 25 14… … … .… … .… … 38 3264 1.02 … .… … .… 11 13 1183 1.03 … .… … .… 16 … …
94 1.09 84 1.10 79.y 1.02.y 34 … 3496 0.98 92 0.99 … .… 25 25 …
86 0.83 92 1.02 97 1.01 28 24 1980 0.99 92 0.99 99 1.02 18 16 15… … 87 .… 66.y 0.96.y … 22 …
… … … .… … .… 19 23 21...y… … … .… … .… … 20 16… … … .… … .… … … …
91 0.99 … .… … .… 15 18 16… … … .… … .… 19 19 17… … 98 1.01 100 1.00 23 18 16… … 99 1.01 97 1.00 … 16 1198 1.26 … .… … .… 12 11 10… … … .… … .… 15 15 12… … … .… … .… 18 17 14… … … .… … .… … … …
98 1.08 99 .… 99 .… 16 … 11… … … .… … .… 23 21 17… … … .… … .… 22 19 17… … … .… … .… 22 18 17… … … .… … .… … 17 13… … … .… … .… … 19 17… … … .… … .… … 14 15… … … .… … .… 21 22 19.z
98 0.99 … .… 97.y 0.99.y 30 … …… … … .… … .… 22 20 17
… … … .… … .… … … 21… … … .… … .… … 19 13… … … .… 100 .… 17 17 15...y… … … .… … .… 21 … 17… … … .… … .… … 24 24… … … .… … .… 28 32 33… … … .… … .… 21 22 22… … … .… … .… … … …… … … .… … .… 24 21 18
99 1.01 … .… … .… 17 18 …… … … .… 100 1.00 15 14.* 13… … 56 0.93 62 1.05 33 48 50
00
2Education f
or A
ll G
lobal M
onitorin
g R
eport
A N N E X
PUPIL/TEACHER RATIOIN PRIMARY EDUCATION1
School year ending in1991 1999 2006
SURVIVAL RATE TO GRADE 5
School year ending in1991 1999 2005
Total GPI(%) (F/M)
Total GPI(%) (F/M)
Total GPI(%) (F/M)
AlgeriaBahrainDjiboutiEgyptIraqJordanKuwaitLebanonLibyan Arab JamahiriyaMauritaniaMoroccoOmanPalestinian A. T.QatarSaudi ArabiaSudanSyrian Arab RepublicTunisiaUnited Arab EmiratesYemen
AlbaniaBelarusBosnia and HerzegovinaBulgariaCroatiaCzech RepublicEstoniaHungaryLatviaLithuaniaMontenegroPolandRepublic of MoldovaRomaniaRussian FederationSerbiaSlovakiaSloveniaTFYR MacedoniaTurkeyUkraine
ArmeniaAzerbaijanGeorgiaKazakhstanKyrgyzstanMongoliaTajikistanTurkmenistanUzbekistan
AustraliaBrunei DarussalamCambodia
Table 13Trends in basic or proxy indicators to measure EFA goal 6
Country or territory
Arab States
Central and Eastern Europe
Central Asia
East Asia and the Pacific
9
123456789
1011121314151617181920
212223242526272829303132333435363738394041
424344454647484950
515253
3 8 0
GOAL 6 Educational quality

39 46 52 94 99 4.5 … 1.6...x 1 560 … 692...x
54 … … … … … … .… … … …
37 28 27 … 79 1.8 … .… 1 006 … …
52 52 56 … … … … .… … … …
70 72 72...z … 100.y … … .… … … …
62 … … … … … 1.9 1.8.z … 568 695.z
61 73 87 100 100 1.5 … 0.7 … … 2 204.z… 82 85 15 13 … … 0.9...z … … 402...z… … … … … … … .… … … …
18 26 32 … 100 … … 1.4...z … … 224...z
37 39 47 … 100.z 1.6 2.2 2.9.z 607 697 1 005.z
47 52 65 100 100 1.5 1.4 1.8.y … … …… 54 67 100 100.z … … .… … … …
72 75 85 … 52 … … .… … … …
48 … … … … … … .… … … …
51 … 68 … 59 … … .… … … …
64 65 … 81 … … 1.7 1.9 … 349 61145 50 52 … … … … 2.4...z … … 1 581...z
64 73 84 … 60.z … 0.7 0.4.y … 1 997 1 636.y… 20 … … … … … .… … … …
55 75 76...y … … … … .… … … …… 99 99 … 100 1.8 … 0.5 … … 1 196… … … … … … … .… … … …
77 91 93 … … 2.8 … 0.8.z … … 2 045.z
75 89 90 100 … … … 0.8...y … … 2 197...x… 85 95 … … … 0.7 0.6.y … 1 688 2 242.y… 86 89 … … … … 1.3.y … … 2 511.y
84 85 96 … … 2.4 0.9 1.1.z 2 480 2 339 4 479.z… 97 97 … … … … .… … … …
94 98 98 … … … … 0.7.z … … 2 166.z… … … … … … … .… … … …… … 84 … … 1.8 … 1.7.z 1 011 … 3 155.z
97 96 97 … … … … .… … … …
84 86 87 … … … … 0.5...z … … 941...z
99 98 98 … … … … .… … … …… … … … … … … .… … … …… 93 89 … … … 0.6 0.6.z … 1 245 2 149.z… 96 97 … … 1.0 … 1.1...z 2 487 … 5 206...z… 66 70.z … … … … .… … … …
43 … … … … 1.3 … 1.5...y 657 … 1 059...y
98 98 99 … 100 … … .… … … …
… … 99 … 77.z … … .… … … …… 83 86 100 100 … … 0.4 … … 35692 92 95...y … … … … .… … … …
96 … 98 … … … … .… … … …
81 95 97 48 61 … … .… … … …
90 93 95 … … … … 1.2.y … … 261.y
49 56 65 … 93 … … 0.9...z … … 106...z… … … … … … … .… … … …
79 84 85 … 100 … … .… … … …
72 … … … … … 1.6 1.5.z … 4 637 5 181.z
57 66.* 73 … 85 0.5 … .… … … …
31 37 42 … 98 … … .… … … …
S TAT I S T I C A L TA B L E S
Ta b l e 1 3
PUBLIC CURRENT EXPENDITURE ONPRIMARY EDUCATION PER PUPIL
(unit cost) at PPP in constant 2005 US$
School year ending in1991 1999 2006
PUBLIC CURRENT EXPENDITUREON PRIMARY EDUCATION
as % of GNP
School year ending in1991 1999 2006
% FEMALE TEACHERSIN PRIMARY EDUCATION
School year ending in1991 1999 2006
TRAINED PRIMARY-SCHOOLTEACHERS2
as % of total
School year ending in1999 2006
Arab States
Central and Eastern Europe
Central Asia
East Asia and the Pacific
1234567891011121314151617181920
212223242526272829303132333435363738394041
424344454647484950
515253
3 8 1
GOAL 6 Educational quality

86 1.36 … .… … .… 22 … 18… … … .… … .… … 18 16.z… … … .… … .… … … …
87 0.97 87 0.96 86 1.02 31 … 28...z
84 2.27 … .… 84 1.04 23 … 20100 1.00 … .… … .… 21 21 1992 … … .… 82.x 1.16.x 29 25 25.z… … 54 0.98 62 0.99 27 31 31… … … .… … .… … 31 2197 1.00 … .… 99.y 1.01.y 20 21 17.z… … … .… … .… … 15 …… … … .… … .… … … 17… … … .… 72 1.01 48 31 30… … … .… … .… … … 23… … … .… … .… 17 18 16… … … .… … .… 20 16 12...z… … … .… … .… … 15 13...z
69 0.97 … .… … .… 31 … 36… … … .… 74 1.11 33 35 3599 1.00 100 1.00 99 1.00 36 31 27… … 94 1.05.* … .… 26 24 25...y… … … .… … .… 26 27 2388 1.28 … .… … .… 21 19 …… … … .… … .… 22 21 18… … … .… … .… … … 34.z… … … .… … .… … … 6...y… … … .… 92 1.00 23 21 22… … … .… … .… … 19 19.y… … 72 0.99 … .… 29 24 20.y… … 83 1.08 92 .… 35 30 21
… … … .… 97.y 1.06.y … 22 17… … … .… … .… … … …… … 90 1.00 90.y 1.03.y … 22 17.z… … … .… 97 .… … 19 1884 … … .… 85 1.07 … 14 15… … … .… … .… 18 18 1567 0.96 78 .… 92 .… 26 24 23… … … .… 90 .… … … 8… … 82 0.97 85...x 1.00...x 24 25 24...y
73 … … .… … .… 23 26 21.z… … … .… … .… 19 18 15… … 74 .… … .… … 15 1292 0.97 100 1.00 99.x 1.00.x 25 32 2676 … 67 1.08 82 1.10 30 24 2884 1.02 91 1.03 94 1.02 32 27 2092 … 94 1.00 97 1.02 13 12 1075 … 91 .… 92 .… 29 20 17… … 75 1.11 68 1.09 … … 23… … 77 1.01 77 1.02 30 27 2358 1.08 65 1.02 72 1.06 … … 40.*… … … .… … .… … … 18...z… … 56 1.06 69 0.96 34 38 31.*… … 95 .… … .… 30 27 28.z… … … .… … .… 23 … …… … … .… 83 1.08 38 … 28… … … .… … .… 34 … 28...z
80 2.06 89 1.02 94 1.02 31 27 28… … … .… … .… … 21 17… … … .… … .… … 20 …
44 3.33 48 1.19 54 1.14 36 34 33
PUPIL/TEACHER RATIOIN PRIMARY EDUCATION1
School year ending in1991 1999 2006
SURVIVAL RATE TO GRADE 5
School year ending in1991 1999 2005
Total GPI(%) (F/M)
Total GPI(%) (F/M)
Total GPI(%) (F/M)
ChinaCook IslandsDPR KoreaFijiIndonesiaJapanKiribatiLao PDRMacao, ChinaMalaysiaMarshall IslandsMicronesiaMyanmarNauruNew ZealandNiuePalauPapua New GuineaPhilippinesRepublic of KoreaSamoaSingaporeSolomon IslandsThailandTimor-LesteTokelauTongaTuvaluVanuatuViet Nam
AnguillaAntigua and BarbudaArgentinaArubaBahamasBarbadosBelizeBermudaBoliviaBrazilBritish Virgin IslandsCayman IslandsChileColombiaCosta RicaCubaDominicaDominican RepublicEcuadorEl SalvadorGrenadaGuatemalaGuyanaHaitiHondurasJamaicaMexicoMontserratNetherlands AntillesNicaragua
Country or territory
Latin America and the Caribbean
545556575859606162636465666768697071727374757677787980818283
84858687888990919293949596979899
100101102103104105106107108109110111112113
GOAL 6 Educational quality
Table 13 (continued)
00
2Education f
or A
ll G
lobal M
onitorin
g R
eport
A N N E X
9
3 8 2
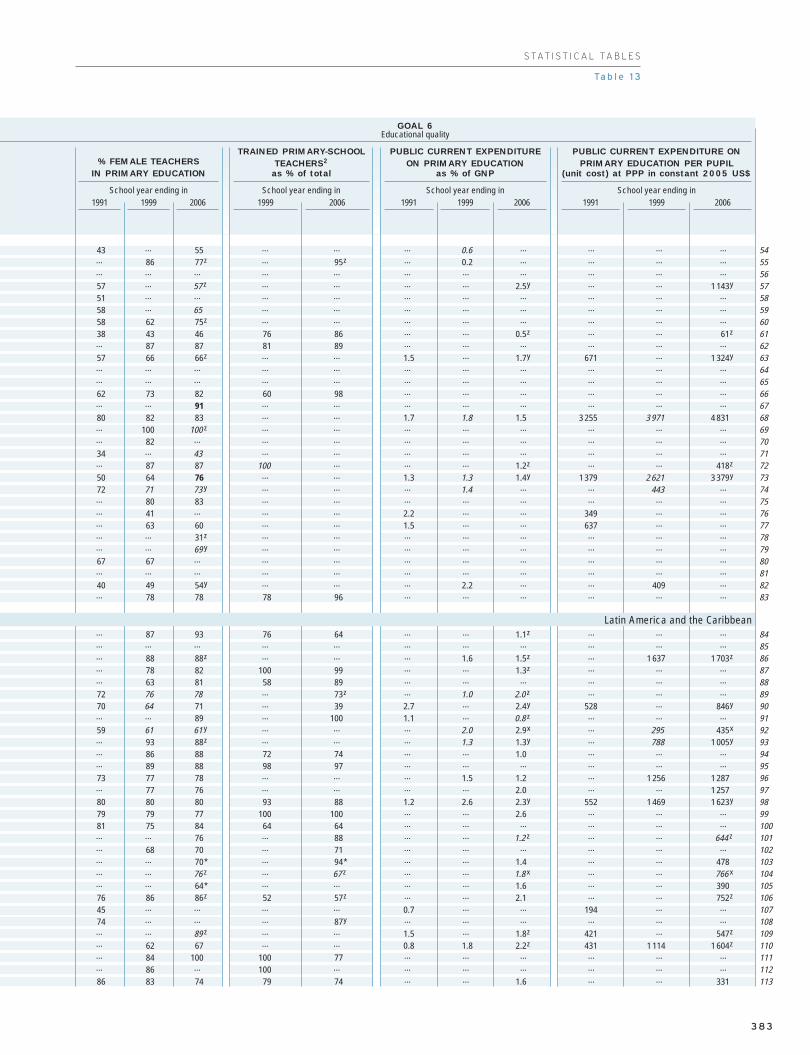
43 … 55 … … … 0.6 .… … … …… 86 77.z … 95.z … 0.2 .… … … …… … … … … … … .… … … …
57 … 57...z … … … … 2.5.y … … 1 143.y
51 … … … … … … .… … … …
58 … 65 … … … … .… … … …
58 62 75.z … … … … .… … … …
38 43 46 76 86 … … 0.5.z … … 61.z… 87 87 81 89 … … .… … … …
57 66 66.z … … 1.5 … 1.7.y 671 … 1 324.y… … … … … … … .… … … …… … … … … … … .… … … …
62 73 82 60 98 … … .… … … …… … 91 … … … … .… … … …
80 82 83 … … 1.7 1.8 1.5 3 255 3 971 4 831… 100 100...z … … … … .… … … …… 82 … … … … … .… … … …
34 … 43 … … … … .… … … …… 87 87 100 … … … 1.2.z … … 418.z
50 64 76 … … 1.3 1.3 1.4.y 1 379 2 621 3 379.y
72 71 73...y … … … 1.4 .… … 443 …… 80 83 … … … … .… … … …… 41 … … … 2.2 … .… 349 … …… 63 60 … … 1.5 … .… 637 … …… … 31.z … … … … .… … … …… … 69...y … … … … .… … … …
67 67 … … … … … .… … … …… … … … … … … .… … … …
40 49 54.y … … … 2.2 .… … 409 …… 78 78 78 96 … … .… … … …
… 87 93 76 64 … … 1.1.z … … …… … … … … … … .… … … …… 88 88.z … … … 1.6 1.5.z … 1 637 1 703.z… 78 82 100 99 … … 1.3.z … … …… 63 81 58 89 … … .… … … …
72 76 78 … 73.z … 1.0 2.0...z … … …
70 64 71 … 39 2.7 … 2.4.y 528 … 846.y… … 89 … 100 1.1 … 0.8...z … … …
59 61 61...y … … … 2.0 2.9.x … 295 435.x… 93 88.z … … … 1.3 1.3.y … 788 1 005.y… 86 88 72 74 … … 1.0 … … …… 89 88 98 97 … … .… … … …
73 77 78 … … … 1.5 1.2 … 1 256 1 287… 77 76 … … … … 2.0 … … 1 25780 80 80 93 88 1.2 2.6 2.3.y 552 1 469 1 623.y
79 79 77 100 100 … … 2.6 … … …
81 75 84 64 64 … … .… … … …… … 76 … 88 … … 1.2...z … … 644...z… 68 70 … 71 … … .… … … …… … 70.* … 94.* … … 1.4 … … 478… … 76...z … 67...z … … 1.8...x … … 766...x… … 64.* … … … … 1.6 … … 39076 86 86.z 52 57.z … … 2.1 … … 752.z
45 … … … … 0.7 … .… 194 … …
74 … … … 87.y … … .… … … …… … 89...z … … 1.5 … 1.8.z 421 … 547.z… 62 67 … … 0.8 1.8 2.2.z 431 1 114 1 604.z… 84 100 100 77 … … .… … … …… 86 … 100 … … … .… … … …
86 83 74 79 74 … … 1.6 … … 331
PUBLIC CURRENT EXPENDITURE ONPRIMARY EDUCATION PER PUPIL
(unit cost) at PPP in constant 2005 US$
School year ending in1991 1999 2006
PUBLIC CURRENT EXPENDITUREON PRIMARY EDUCATION
as % of GNP
School year ending in1991 1999 2006
% FEMALE TEACHERSIN PRIMARY EDUCATION
School year ending in1991 1999 2006
TRAINED PRIMARY-SCHOOLTEACHERS2
as % of total
School year ending in1999 2006
Latin America and the Caribbean
545556575859606162636465666768697071727374757677787980818283
84858687888990919293949596979899100101102103104105106107108109110111112113
GOAL 6 Educational quality
S TAT I S T I C A L TA B L E S
Ta b l e 1 3
3 8 3

… … 92 1.01 88 1.03 … 26 2574 1.02 78 1.05 88.y 1.05.y 25 … 28...y… … 87 0.98 89 0.98 29 … 22… … … .… … .… 22 … 1596 … 90 .… … .… 29 22 24… … … .… … .… 20 … 18.z… … … .… … .… 22 … 16… … … .… 91.*,y 1.03.*,y 26 21 17.*,z
… … … .… … .… … 18 15...z
97 1.03 … .… 93 1.03 22 20 2086 1.09 91 1.08 92 1.05 23 … 19.z
… … … .… … .… … … 10… … … .… … .… 11 13 1291 1.02 … .… 96 1.01 … … 1197 1.04 … .… … .… 15 17 …
100 1.00 96 1.03 99 1.02 21 18 1694 1.00 … .… 93.y 1.00.y … 10 …
100 1.00 … .… 99 1.01 … 17 1696 1.37 98 0.99 … .… … 19 19… … … .… … .… … 17 14100 1.00 … .… 99 1.03 19 14 11… … … .… 99 1.02 … 11 10100 1.01 95 1.03 99 1.03 27 22 17… … … .… … .… 15 13 13… … 97 .… 100 1.01 12 11 11… … 96 1.08 100 1.01 13 … 1199 1.01 99 0.99 … .… 21 20 12.z
83 0.81 … .… … .… … 16 14...y… … 100 1.00 … .… 17 … …
100 1.01 … .… 100 1.00 … … 11...y… … … .… … .… 14 … 1188 … … .… … .… 6 … 6.y… … … .… 100...y 1.00...y 22 15 14100 1.00 … .… … .… 10 12 10… … … .… … .… … … 13… … … .… … .… 20 19 18… … 94 .… 97 1.03 … 15 14
… … … .… … .… … 36 83.z… … 65 1.16 65.x 1.07.x … 56 51.y… … 90 1.04 93 1.04 … 42 29… … 62 0.95 73.y 1.00.y 47 35.* 40...y
90 0.98 … .… … .… 31 27 19… … … .… … .… … 24 1651 0.99 58 1.10 79 1.10.* 39 39 40… … … .… 70.y 1.07.y … … 3992 1.01 … .… … .… 31 … 22...z
… … … .… … .… 32 … …
55 1.02 … .… 72 0.98 36 53 4484 1.06 87 1.06 83.y 1.05.y 30 27 24.z
70 0.96 68 1.05 72 1.03 57 49 4662 0.89 … .… 88 1.09 67 57 54… … 81 .… … .… 51 52 45… … … .… 92 1.06 … 29 2523 0.90 … .… 50 0.86 77 … …
51 0.74 55 0.86 33.y 0.94.y 66 68 63.z… … … .… 80...y 1.02...y 37 35 35...z
PUPIL/TEACHER RATIOIN PRIMARY EDUCATION1
School year ending in1991 1999 2006
SURVIVAL RATE TO GRADE 5
School year ending in1991 1999 2005
Total GPI(%) (F/M)
Total GPI(%) (F/M)
Total GPI(%) (F/M)
PanamaParaguayPeruSaint Kitts and NevisSaint LuciaSaint Vincent/Grenad.SurinameTrinidad and TobagoTurks and Caicos IslandsUruguayVenezuela, Bolivarian Rep. of
AndorraAustriaBelgiumCanadaCyprusDenmarkFinlandFranceGermanyGreeceIcelandIrelandIsraelItalyLuxembourgMaltaMonacoNetherlandsNorwayPortugalSan MarinoSpainSwedenSwitzerlandUnited KingdomUnited States
AfghanistanBangladeshBhutanIndiaIran, Islamic Republic ofMaldivesNepalPakistanSri Lanka
AngolaBeninBotswanaBurkina FasoBurundiCameroonCape VerdeCentral African RepublicChadComoros
Country or territory
North America and Western Europe
South and West Asia
Sub-Saharan Africa
114115116117118119120121122123124
125126127128129130131132133134135136137138139140141142143144145146147148149150
151152153154155156157158159
160161162163164165166167168169
GOAL 6 Educational quality
Table 13 (continued)
00
2Education f
or A
ll G
lobal M
onitorin
g R
eport
A N N E X
9
3 8 4

… 75 76 79 91 1.7 1.9 .… 615 867 …… … 72...y … … … … 1.8.y … … 518.y… … 64 … … … 1.2 1.1 … 366 44674 … 87 … 64 1.1 … .… … … …
83 84 86 … 80 2.5 3.3 2.0 536 1 197 94967 … 73...z … 74...z 3.0 … 3.0.z 724 … 1 227.z
84 … 91 … … … … .… … … …
70 76 72.*,z 71 81.*,y … 1.5 .… … 1 012 …… 92 89...z 81 82...z … … .… … … …… 92 … … … 0.9 0.8 .… 634 748 …
74 … 81.z … 84.z … … 1.0 … … 583
… … 76 … 100 … … 0.5 … … …
82 89 89 … … 0.9 1.1 1.0.z 4 812 7 112 7 596.z… … 79 … … 1.1 … 1.4.y 4 158 … 6 303.y
69 68 … … … … … .… … … …
60 67 83 … … 1.2 1.6 1.7.y … … …… 63 … … … … 1.6 1.8.z … 7 345 7 949.z… 71 76 … … 1.7 1.2 1.2.z 5 132 4 615 5 373.z… 78 82 … … 0.9 1.1 1.1.z 3 099 4 697 5 224.z… 82 84 … … … … 0.7.y … … 4 837.y
52 57 64 … … 0.6 0.7 0.9...z 1 248 2 148 3 562...z… 76 80 … … … … 2.4.y … … 7 788.y
77 85 85 … … 1.5 1.4 1.7.z 2 082 3 112 5 100.z
82 … 86 … … 1.9 2.4 2.4.y 2 609 4 835 5 135.y
91 95 96 … … 0.8 1.2 1.0.z 3 770 6 425 6 347.z
51 … 72 … … … … 1.4...z … … 9 953...z
79 87 86.z … … 0.9 … 1.1.y 1 306 … 2 549.y… 87 80...y … … … … .… … … …
53 … … … … 0.9 1.1 1.3.z 3 315 4 606 5 572.z… … 73...y … … 2.5 1.6 1.6.z 9 534 6 456 7 072.z
81 … 81 … … 1.7 1.5 1.7.z 2 779 3 872 4 908.z
89 … … … … … … .… … … …
73 68 70 … … 0.8 1.1 1.0.z 2 253 4 112 4 800.z
77 80 81 … … 3.1 … 1.9.z 10 960 … 8 415.z… … 79 … … 2.1 1.4 1.4.z 12 056 7 066 7 811.z
78 76 81 … … 1.2 … 1.3.z 3 440 … 5 596.z… 86 89 … … … … .… … … …
… – 34...z … 36.z … … .… … … …… 33 34.y 64 48.y … 0.6 0.7...z … 64 115...z… 32 50 100 92 … … 1.1.z … … …
28 33.* 44...y … … … 1.3 .… … 288 …
53 53 62 … 100.z … … 1.4 … … 927… 60 70 67 68 … … 3.5...z … … …
14 23 30 46 31.z … 1.1 1.2...x … 97 119...x
27 … 45 … 85 … … .… … … …… … 79...z … … … … .… … … …
… … … … … … … 0.2.z … … …
25 23 17 58 72 … … 1.7...z … … 120...z
78 81 78.z 90 87.z … … 1.3 … … 1 158.z
27 25 30 … 87 … … 2.6 … … 32846 54 55 … 88.z 1.5 1.3 2.7.z 140 85 132.z
30 36 40 … 62.* … 1.0 0.8 … 128 107… 62 66 … 81 … … 2.8 … … 1 05225 … … … … 1.2 … 0.7 167 … 88
6 9 12.z … 27.z 0.7 … 0.6.z 82 … 54.z… 26 33...z … … … … .… … … …
PUBLIC CURRENT EXPENDITURE ONPRIMARY EDUCATION PER PUPIL
(unit cost) at PPP in constant 2005 US$
School year ending in1991 1999 2006
PUBLIC CURRENT EXPENDITUREON PRIMARY EDUCATION
as % of GNP
School year ending in1991 1999 2006
% FEMALE TEACHERSIN PRIMARY EDUCATION
School year ending in1991 1999 2006
TRAINED PRIMARY-SCHOOLTEACHERS2
as % of total
School year ending in1999 2006
North America and Western Europe
South and West Asia
Sub-Saharan Africa
114115116117118119120121122123124
125126127128129130131132133134135136137138139140141142143144145146147148149150
151152153154155156157158159
160161162163164165166167168169
GOAL 6 Educational quality
S TAT I S T I C A L TA B L E S
Ta b l e 1 3
3 8 5

60 1.16 … .… … .… 65 61 5573 0.93 69 0.89 … .… 37 43 4655 0.86 … .… … .… 40 26 …… … … .… … .… … 57 …… … 95 0.95 74 0.90 38 47 4718 1.47 56 1.06 64 1.03 36 46 …… … … .… … .… … 44 36...y… … … .… … .… 31 33 35.*80 0.98 … .… … .… 29 30 3559 0.76 … .… 81 0.94 40 47 44… … … .… … .… … 44 …
77 1.04 … .… … .… 32 32 40.z
66 1.26 74 1.20 74 1.18 54 44 40… … … .… … .… … 39 1921 0.96 51 1.02 36 1.05 40 47 4864 0.80 49 0.77 44 1.00 61 … …
70 0.95 78 0.97 81 0.96 47 62.* 5697 1.01 99 0.99 99 1.02 21 26 2234 0.87 43 0.79 58 0.93 55 61 6762 1.08 92 1.02 87 1.07 … 32 3162 1.06 … .… 56 0.92 42 41 4089 … … .… 73...x 1.05...x 39 41 37.z
60 0.97 45 .… 46.x 1.13.x 57 54 66… … … .… 64 1.22 … 36 3185 … … .… 65 1.00 53 49 3993 1.03 … .… … .… … 15 12… … … .… … .… 35 … 44… … … .… … .… … … …… … 65 0.99 82.x 1.02.x 27 35 36...y
77 1.09 80 1.22 84.y 1.08.y 32 33 33.z
48 0.80 … .… 75.y 0.89.y 58 41 3836 … … .… 49...y 0.99...y 33 57 4981 1.02 … .… 87 1.05 36 40 53… … 81 0.94 89 0.95 … 47 5176 1.12 … .… … .… 39 41 38
… … … … … … 26 25 25
… … … … … … 22 20 18… … … … … … 17 16 14… … … … 83 1.08 29 27 28
86.9 1.00 92 1.03 … … 25 23 22… … … … … … 21 19 18… … … … … … 21 21 19… … … … … … 23 22 20… … … … 84 1.04 23 22 20… … … … … … 19 20 19… … 87 … 90 1.03 25 26 23… … … … … … 25 24 22
79.5 … 85 0.98 88 1.04 25 26 23… … … … … … 16 15 14… … … … 73 1.00 45 37 40
63.4 0.93 … … 74 0.90 37 41 45
PUPIL/TEACHER RATIOIN PRIMARY EDUCATION1
School year ending in1991 1999 2006
SURVIVAL RATE TO GRADE 5
School year ending in1991 1999 2005
Total GPI(%) (F/M)
Total GPI(%) (F/M)
Total GPI(%) (F/M)
CongoCôte d’IvoireD. R. CongoEquatorial GuineaEritreaEthiopiaGabonGambiaGhanaGuineaGuinea-BissauKenyaLesothoLiberiaMadagascarMalawiMaliMauritiusMozambiqueNamibiaNigerNigeriaRwandaSao Tome and PrincipeSenegalSeychellesSierra LeoneSomaliaSouth AfricaSwazilandTogoUgandaUnited Republic of TanzaniaZambiaZimbabwe
World
Countries in transitionDeveloped countriesDeveloping countries
Arab StatesCentral and Eastern EuropeCentral AsiaEast Asia and the Pacific
East AsiaPacific
Latin America and the CaribbeanCaribbeanLatin America
North America and Western EuropeSouth and West AsiaSub-Saharan Africa
Country or territory
GOAL 6 Educational quality
Table 13 (continued)
00
2Education f
or A
ll G
lobal M
onitorin
g R
eport
A N N E X
9
3 8 6
Weighted averageMedian
2. Data on trained teachers (defined according to national standards) are not collected for countries whoseeducation statistics are gathered through the OECD, Eurostat or the World Education Indicators questionnaires.
1. Based on headcounts of pupils and teachers.
170171172173174175176177178179180181182183184185186187188189190191192193194195196197198199200201202203204
I
IIIIIIV
VVI
VIIVIII
IXX
XIXII
XIIIXIVXV
XVI

32 42 47 … 89 … 2.0 0.6.z … 191 39.z
18 20 23 … … … 1.8 0.1...z … 274 …
24 21 … … … … … .… … … …… 28 … … … … … .… … … …
45 35 43 73 88 … … 0.8 … … 9924 28 … … … 1.1 … 2.0 168 … 130… 42 45...y … … … … .… … … …
31 29 34.* 72 76.* 1.3 … .… 254 … …
36 32 37 72 59 … … 1.6.z … … 300.z
22 25 25 … 68 … … .… … … …… 20 … … … … … .… … … …
38 42 45...z … 99.y 3.1 … 3.6 172 … 23780 80 78 78 66 … 3.2 3.8 … 566 663… 19 27 … … … … .… … … …… 58 57 … 36.z … … 1.2 … … 5731 … … … … 1.1 … 3.0.x 38 … 90.x
25 23.* 30 … … … 1.3 1.9 … 136 18345 54 64 100 100 1.3 1.2 1.0 696 1 067 1 20523 25 26 … 65 … … 2.6.y … … 156.y… 67 67 29 92.z … 4.4 3.9.x … 1 416 944.x
33 31 40 98 92 … … 1.7 … … 17843 47 51.z … 50.z … … .… … … …
46 55 53 49 98 … … 1.9.z … … 109...z… … 55 … … … … .… … … …
27 23 25 … 100.z 1.7 … 2.1.z 303 … 299.z… 85 85 82 … … … 1.3 … … 2 399...y… … 26 … 49 … … 2.3...x … … …… … … … … … … .… … … …
58 78 76...y 62 … … 2.7 2.4 1 843 1 403.* 1 383.z
78 75 73.z 91 91.z 1.4 1.9 2.3...y 301 437 484...y
19 13 12 … 37.z … 1.8 .… … 150 …… 33 39 … 85.z … … 2.5...y … … 110...y
40 45 49 … 100 … … .… … … …… 49 48 94 … … … 1.3.z … … 55.z
40 47 … … … 4.3 … .… 625 … …
56 58 62 … … … … 1.4 … … 1 005
93 93 94 … 100 … … … … … …
78 81 83 … … … … 1.1 … … 5 10049 52 57 … 85 … … 1.7 … … …
52 52 58 … 100 … … 1.7 … … …
81 82 81 … … … … 0.8 … … 2 18285 84 87 … 93 … … … … … …
48 55 60 … … … … … … … …
48 55 60 … … … … … … … …
67 71 75 … … … … … … … …
77 76 77 … 80 … … 1.7 … … …
65 50 57 76 74 … … 1.8 … … …
77 77 78 … 88 … … 1.6 … … 61480 81 85 … … 1.2 1.3 1.3 3 378 4 697 5 58431 35 45 … 68 … … 1.2 … … …
40 43 45 … 85 … … 1.9 … … 167
PUBLIC CURRENT EXPENDITURE ONPRIMARY EDUCATION PER PUPIL
(unit cost) at PPP in constant 2005 US$
School year ending in1991 1999 2006
PUBLIC CURRENT EXPENDITUREON PRIMARY EDUCATION
as % of GNP
School year ending in1991 1999 2006
% FEMALE TEACHERSIN PRIMARY EDUCATION
School year ending in1991 1999 2006
TRAINED PRIMARY-SCHOOLTEACHERS2
as % of total
School year ending in1999 2006
GOAL 6 Educational quality
S TAT I S T I C A L TA B L E S
Ta b l e 1 3
3 8 7
Weighted average Median Median Median
Data in italic are UIS estimates.Data in bold are for the school year ending in 2006 for survival rates tograde 5, and the school year ending in 2007 for the remaining indicators.
(z) Data are for the school year ending in 2005.(y) Data are for the school year ending in 2004.
(x) Data are for the school year ending in 2003.(*) National estimate.
170171172173174175176177178179180181182183184185186187188189190191192193194195196197198199200201202203204
I
IIIIIIV
VVIVIIVIIIIXXXIXIIXIIIXIVXVXVI

A I D TA B L E S
I n t r o d u c t i o n
3 8 9
Most of the data on aid used in this Report
are derived from the OECD’s International
Development Statistics (IDS) database,
which records information provided
annually by all member countries of
the OECD Development Assistance Committee (DAC).
The IDS comprises the DAC database, which provides
aggregate data, and the Creditor Reporting System,
which provides project- and activity-level data. The IDS
is available online at www.oecd.org/dac/stats/idsonline.
It is updated frequently. The data presented in this
Report were downloaded between March and June 2008.
The focus of this section of the annex on aid data is
official development assistance. This term and others
used in describing aid data are explained below to help
in understanding the tables in this section and the data
presented in Chapter 4. Private funds are not included.
Aid recipients and donors
Official development assistance (ODA) is public funds
provided to developing countries to promote their
economic and social development. It is concessional:
that is, it takes the form either of a grant or of a loan
carrying a lower rate of interest than is available in the
market and, usually, a longer than normal repayment
period. ODA may be provided directly by a government
(bilateral ODA) or through an international agency
(multilateral ODA). ODA can include technical
cooperation (see below).
Developing countries are those in Part I of the DAC
List of Aid Recipients, which essentially comprises all
low- and middle-income countries. Twelve central and
eastern European countries, including new independent
states of the former Soviet Union, plus a set of more
advanced developing countries are in Part II of the list,
and aid to them is referred to as official aid (OA).
The data presented in this Report do not include OA
unless indicated.
Bilateral donors are countries that provide development
assistance directly to recipient countries. The majority
(Australia, Austria, Belgium, Canada, Denmark, Finland,
France, Germany, Greece, Ireland, Italy, Japan,
Luxembourg, the Netherlands, New Zealand, Norway,
Portugal, Spain, Sweden, Switzerland, the United
Kingdom and the United States) are members of the
DAC, a forum of major bilateral donors established to
promote the volume and effectiveness of aid. Non-DAC
bilateral donors include the Republic of Korea and
some Arab states. Bilateral donors also contribute
substantially to the financing of multilateral donors
through contributions recorded as multilateral ODA.
The financial flows from multilateral donors to recipient
countries are also recorded as ODA receipts.
Multilateral donors are international institutions with
government membership that conduct all or a significant
part of their activities in favour of developing countries.
They include multilateral development banks (e.g. the
World Bank and the Inter-American Development Bank),
United Nations agencies (e.g. UNDP and UNICEF) and
regional groupings (e.g. the European Commission and
Arab agencies). The development banks also make
non-concessional loans to several middle- and higher-
income countries, and these are not counted as
part of ODA.
Types of aid
Unallocated aid: some contributions are not susceptible
to allocation by sector and are reported as non-sector-
allocable aid. Examples are aid for general development
purposes (direct budget support), balance-of-payments
support, action relating to debt (including debt relief)
and emergency assistance.
Basic education: the definition of basic education varies
by agency. The DAC defines it as covering primary
education, basic life skills for youth and adults, and
early childhood education.
Education, level unspecified: the aid to education
reported in the DAC database includes basic, secondary
and post-secondary education, and a subcategory called
‘education, level unspecified’. This subcategory covers
aid related to any activity that cannot be attributed solely
to the development of a single level of education.
Aid tables
Introduction

90
02
Education f
or A
ll G
lobal M
onitorin
g R
eport
A N N E X
3 9 0
Sector budget funding: funds contributed directly to the
budget of a ministry of education are often reported by
donors in this subcategory. Although in practice this aid
will mainly be used for specific levels of education, such
information is not available in the DAC database. This
reduces accuracy in assessing the amount of resources
made available for each specific level of education.
Technical cooperation (sometimes referred to as
technical assistance): according to the DAC Directives,
technical cooperation is the provision of know-how in the
form of personnel, training, research and associated
costs. It includes (a) grants to nationals of aid recipient
countries receiving education or training at home or
abroad; and (b) payments to consultants, advisers and
similar personnel as well as teachers and administrators
serving in recipient countries (including the cost of
associated equipment). Where such assistance is related
specifically to a capital project, it is included with project
and programme expenditure, and is not separately
reported as technical cooperation. The aid activities
reported in this category vary by donor, as interpretations
of the definition are broad.
Debt relief: this includes debt forgiveness, i.e. the
extinction of a loan by agreement between the creditor
(donor) and the debtor (aid recipient), and other action
on debt, including debt swaps, buy-backs and refinancing.
In the DAC database, debt forgiveness is reported as a
grant. It raises gross ODA but not necessarily net ODA
(see below).
Commitments and disbursements: a commitment is
a firm obligation by a donor, expressed in writing and
backed by the necessary funds, to provide specified
assistance to a country or multilateral organization.
The amount specified is recorded as a commitment.
Disbursement is the release of funds to, or purchase
of goods or services for, a recipient; in other words,
the amount spent. Disbursements record the actual
international transfer of financial resources or of goods
or services valued by the donor. As the aid committed
in a given year can be disbursed later, sometimes
over several years, the annual aid figures based on
commitments differ from those based on disbursements.
Gross and net disbursements: gross disbursements are
the total aid extended. Net disbursements are the total
aid extended minus amounts of loan principal repaid by
recipients or cancelled through debt forgiveness.
Current and constant prices: aid figures in the DAC
database are expressed in US$. When other currencies
are converted into dollars at the exchange rates
prevailing at the time, the resulting amounts are at
current prices and exchange rates. When comparing aid
figures between different years, adjustment is required
to compensate for inflation and changes in exchange
rates. Such adjustments result in aid being expressed
in constant dollars, i.e. in dollars fixed at the value they
held in a given reference year, including their external
value in terms of other currencies. Thus, amounts of aid
for any year and in any currency expressed in 2006
constant dollars reflect the value of that aid in terms of
the purchasing power of dollars in 2006. In this Report,
most aid data are presented in 2006 constant dollars.
The indices used for adjusting currencies and years
(called deflators) are derived from Table 36 of the
statistical annex of the 2007 DAC Annual Report (OECD-
DAC, 2008b). In previous editions of the EFA Global
Monitoring Report, amounts of aid were based on the
constant prices of different years (the 2007 Report used
2003 constant prices), so amounts for a given country
for a given year in these editions differ from the amounts
presented in this Report for the same year.
For more detailed and precise definitions of terms used
in the DAC database, see the DAC Directives, available
at www.oecd.org/dac/stats/dac/directives.
Source: OECD-DAC (2008c).

A I D TA B L E S
Ta b l e 1
1 576 1 476 1 796 0.27 0.25 0.30 0.30 1 170 1 083 1 317 10 7 380708 1 289 1 083 0.24 0.52 0.47 0.49 366 249 264 219 895 718696 1 625 1 545 0.33 0.53 0.50 0.43 452 830 855 64 516 403
1 971 3 065 2 678 0.27 0.34 0.29 0.28 864 1 487 1 323 55 511 2451 271 1 652 1 369 1.04 0.81 0.80 0.81 970 1 329 742 14 68 256
314 705 606 0.32 0.46 0.40 0.40 184 486 394 24 1 25 965 9 110 9 944 0.34 0.47 0.47 0.39 3 718 3 796 4 705 1 403 3 867 3 8974 879 9 396 9 477 0.27 0.36 0.36 0.37 3 719 4 694 5 677 327 4 015 3 034
136 215 189 0.18 0.17 0.17 0.16 0 144 149 0 0 0243 501 632 0.30 0.42 0.54 0.54 67 327 413 7 0 0
1 019 2 768 2 508 0.14 0.29 0.20 0.19 457 458 0 248 1 828 011 981 16 169 13 612 0.28 0.28 0.25 0.17 8 325 8 779 8 105 899 5 327 3 781
147 202 205 0.69 0.86 0.89 0.90 0 134 128 0 0 03 536 3 610 10 831 0.82 0.82 0.81 0.81 1 350 2 359 5 011 243 0 1 478
142 296 297 0.26 0.27 0.27 0.27 0 165 204 0 0 01 713 2 247 2 648 0.82 0.94 0.89 0.95 1 095 1 506 1 702 29 3 226
468 231 217 0.26 0.21 0.21 0.19 220 234 160 190 3 01 446 2 473 2 438 0.23 0.27 0.32 0.41 1 113 1 147 1 644 105 653 5261 806 2 592 3 103 0.75 0.94 1.02 0.93 718 1 761 1 920 0 54 292
995 1 378 1 243 0.35 0.44 0.39 0.37 607 652 712 0 225 983 467 8 809 9 274 0.28 0.47 0.51 0.36 3 578 3 722 4 832 160 4 746 2 557
11 830 28 564 24 293 0.10 0.23 0.18 0.16 7 316 17 391 16 860 119 4 221 1 686
56 308 98 374 99 990 0.22 0.33 0.31 0.20 36 289 52 734 57 117 4 116 26 941 19 577
818 1 563 1 670 … … … … 670 1 201 1 374 … … …
1 282 1 450 1 175 … … … … 1 225 1 243 1 175 … … …
8 908 11 670 12 311 … … … … 5 666 8 056 9 185 … … …
0 52 85 … … … … 0 52 85 … … …
6 824 8 957 8 716 … … … … 5 542 4 317 7 151 … … …
350 508 362 … … … … 350 498 362 … … …
199 760 775 … … … … 175 495 531 … … …
19 102 26 613 27 394 … … … … 14 299 17 515 22 137 … … …
75 410 124 987 127 384 … … … … 50 588 70 248 79 254 … … …
Table 1: Bilateral and multilateral ODA
AustraliaAustriaBelgiumCanadaDenmarkFinlandFranceGermanyGreeceIrelandItalyJapanLuxembourgNetherlandsNew ZealandNorwayPortugalSpainSwedenSwitzerlandUnited KingdomUnited States
Total DAC
African Development Fund
Asian Development Fund
European Commission
Fast Track Initiative
International DevelopmentAssociation
Inter-American DevelopmentBank Special Fund
UNICEF
Total multilaterals
Total
Total ODANet disbursements
as % of GNI Sector-allocable ODA
Constant 2006US$ millions
Constant 2006US$ millions
Debt relief and other actions relating to debt
Constant 2006US$ millions
1999–2000annual
average 2005 2006
1999–2000annual
average 2005 2006
1999–2000annual
average 2005 2006 2007
1999–2000annual
average 2005 2006
Notes: (…) indicates that data are not available.All data represent commitments unless otherwise specified.Source: OECD-DAC (2008c).
3 9 1

90
02
Education f
or A
ll G
lobal M
onitorin
g R
eport
A N N E X
248 143 155 77 38 74 248 142 155 64 21 33 22 15 4126 97 104 6 4 5 126 97 104 4 3 3 41 1 5
93 150 164 16 37 42 90 148 161 5 23 29 11 18 11104 269 270 52 206 213 103 254 266 30 159 196 18 3 20
73 133 44 44 73 27 66 129 16 36 34 12 19 21 026 54 46 12 29 19 25 51 33 3 10 5 1 1 3
1 607 1 537 1 862 364 240 308 1 584 1 509 1 790 95 203 105 297 154 72847 419 1 388 122 162 155 844 411 1 367 99 117 108 99 84 214
0 40 24 0 6 3 0 40 23 0 0 0 0 0 018 65 68 9 40 45 18 60 64 4 23 37 1 3 954 0 0 15 0 0 51 0 0 1 0 0 12 0 0
327 815 920 122 254 243 307 788 899 43 145 101 34 46 610 31 30 0 14 11 0 31 30 0 3 5 0 6 13
280 600 1 357 181 396 1 129 242 512 1 296 131 299 1 083 10 9 400 63 60 0 46 20 0 58 58 0 42 17 0 3 3
153 224 266 94 126 135 149 200 234 80 85 101 9 6 838 67 66 10 11 9 36 67 66 4 4 6 4 6 9
238 229 233 72 86 88 238 227 231 22 59 42 32 45 4270 178 211 45 65 153 45 148 178 24 1 107 1 5 245 24 69 19 5 28 45 24 60 14 3 18 20 7 18
456 352 1 170 335 261 834 331 267 906 245 170 526 16 1 1366 732 553 200 565 403 344 639 477 181 458 275 45 40 0
5 167 6 223 9 058 1 795 2 662 3 944 4 892 5 802 8 416 1 083 1 862 2 811 693 475 535
77 127 206 48 64 70 70 68 147 19 0 29 0 0 66
130 321 190 9 34 26 130 291 190 0 19 0 108 272 138
725 975 683 463 487 302 521 741 590 344 319 197 62 63 105
0 52 85 0 52 85 0 52 85 0 52 85 0 0 0
818 674 1 026 422 321 597 633 290 721 149 74 216 55 20 48
6 23 0 3 0 0 6 23 0 0 0 0 0 23 0
29 70 40 29 69 39 29 70 40 29 69 38 0 1 0
1 791 2 241 2 231 976 1 027 1 119 1 395 1 535 1 774 541 532 565 226 379 358
6 958 8 464 11 289 2 771 3 689 5 063 6 287 7 337 10 190 1 624 2 395 3 376 919 854 893
Table 2: Bilateral and multilateral aid to education
AustraliaAustriaBelgiumCanadaDenmarkFinlandFranceGermanyGreeceIrelandItalyJapanLuxembourgNetherlandsNew ZealandNorwayPortugalSpainSwedenSwitzerlandUnited KingdomUnited States
Total DAC
African Development Fund
Asian Development Fund
European Commission
Fast Track Initiative
International DevelopmentAssociation
Inter-American DevelopmentBank Special Fund
UNICEF
Total multilaterals
Total
Total aidto education
Total aid to basic education
Direct aidto education
Constant 2006US$ millions
Constant 2006US$ millions
Constant 2006US$ millions
Direct aid to basic education
Constant 2006US$ millions
Direct aid to secondary education
Constant 2006US$ millions
1999–2000annual
average 2005 2006
1999–2000annual
average 2005 2006
1999–2000annual
average 2005 2006
1999–2000annual
average 2005 2006
1999–2000annual
average 2005 2006
Notes:(…) indicates that data are not available.Data for sector-allocable aid include general budget support.All data represent commitments unless otherwise specified.Source: OECD-DAC (2008c).
3 9 2

A I D TA B L E S
Ta b l e 2
136 73 37 25 32 81 16 10 9 21 13 12 31 26 4877 91 93 4 2 4 18 8 10 34 39 39 4 4 555 82 99 20 24 21 13 9 11 21 18 19 17 25 2511 13 19 44 78 31 5 9 10 12 18 20 50 77 79
0 1 2 10 74 1 6 8 3 7 10 6 61 55 624 4 9 17 36 16 8 8 8 14 11 12 44 54 41
677 1 105 1 280 515 47 333 27 17 19 43 40 40 23 16 17603 129 972 43 82 73 17 4 15 23 9 24 14 39 11
0 27 18 0 12 5 0 18 13 … 27 16 … 15 122 4 6 11 30 13 7 13 11 27 20 17 51 62 66
13 0 0 25 0 0 5 0 0 12 0 … 28 … …
93 406 474 139 191 263 3 5 7 4 9 11 37 31 260 0 0 0 21 11 0 15 14 … 23 23 … 44 36
38 98 142 63 106 32 8 17 13 21 25 27 65 66 830 11 34 0 3 4 0 21 20 … 38 30 … 73 33
36 51 88 25 58 36 9 10 10 14 15 16 62 56 5119 44 44 9 12 6 8 29 30 17 29 41 26 16 1484 70 57 100 53 89 16 9 10 21 20 14 30 38 38
2 44 9 17 97 60 4 7 7 10 10 11 65 37 731 9 13 10 5 12 5 2 6 7 4 10 43 21 41
14 0 28 57 96 352 13 4 13 13 9 24 74 74 71101 21 22 16 119 179 3 3 2 5 4 3 55 77 73
1 968 2 286 3 447 1 148 1 178 1 623 9 6 9 14 12 16 35 43 44
0 0 29 51 68 22 9 8 12 12 11 15 62 50 34
4 0 0 18 0 52 10 22 16 11 26 16 7 10 14
82 256 171 33 103 117 8 8 6 13 12 7 64 50 44
0 0 0 0 0 0 … 100 100 … 100 100 … 100 100
68 85 0 362 112 457 12 8 12 15 16 14 52 48 58
0 0 0 6 0 0 2 4 0 2 5 0 50 0 …
0 0 0 0 0 3 14 9 5 16 14 8 100 99 97
154 341 200 474 283 651 9 8 8 13 13 10 55 46 50
2 121 2 627 3 647 1 622 1 462 2 274 9 7 9 14 12 14 40 44 45
AustraliaAustria
BelgiumCanada
DenmarkFinlandFrance
GermanyGreeceIreland
ItalyJapan
LuxembourgNetherlands
New ZealandNorwayPortugal
SpainSweden
SwitzerlandUnited Kingdom
United States
Total DAC
African Development Fund
Asian Development Fund
European Commission
Fast Track Initiative
International DevelopmentAssociation
Inter-American DevelopmentBank Special Fund
UNICEF
Total multilaterals
Total
Direct aid to post-secondary education
Constant 2006US$ millions
1999–2000annual
average 2005 2006
Education,level unspecified
Constant 2006US$ millions
1999–2000annual
average 2005 2006
Share of educationin total ODA
(%)
1999–2000annual
average 2005 2006
Share of educationin total sector-allocable
ODA
(%)
1999–2000annual
average 2005 2006
Share of basic educationin total aid
to education
(%)
1999–2000annual
average 2005 2006
3 9 3

90
02
Education f
or A
ll G
lobal M
onitorin
g R
eport
A N N E X
6 706 29 567 16 653 25 97 54 5 344 11 549 10 913 501 14 168 3 063
258 573 491 9 17 15 232 479 449 0 39 201 0 0 1 0 0 1 0 0 0 0 0
105 99 83 166 124 102 85 85 75 2 0 01 753 958 1 598 26 13 22 1 447 808 1 259 304 133 134
124 20 687 7 295 5 718 256 18 5 905 4 293 0 13 856 2 875612 592 529 125 104 92 449 370 337 84 12 17148 254 626 42 71 154 131 225 236 0 0 0
2 5 34 0 1 6 2 5 34 0 0 0263 257 302 99 84 99 182 138 273 21 43 3954 930 1 185 32 30 38 865 884 1 158 66 0 2
7 10 7 3 4 3 7 9 6 0 0 0603 997 1 064 189 269 273 523 644 762 0 0 0
4 7 11 0 0 0 4 7 10 0 0 0312 2 755 2 049 10 76 54 65 964 816 5 7 3128 105 129 8 6 7 125 99 123 0 0 0670 469 475 71 46 47 655 352 420 0 2 0475 348 314 26 17 14 356 253 270 19 76 10
6 056 5 492 5 604 39 34 38 3 376 4 638 4 567 297 200 466
615 332 251 196 106 79 413 315 248 2 0 00 58 63 … 6 6 0 53 57 0 0 0
1 239 442 484 311 113 123 645 379 471 295 0 098 211 232 21 46 51 82 202 228 0 0 0
164 204 190 38 48 50 119 162 159 0 0 0384 184 198 189 91 97 223 159 196 0 0 0822 1 580 1 124 12 22 15 624 1 486 1 066 0 0 0
0 592 500 0 13 11 0 580 496 0 0 0
1 970 2 073 2 596 26 27 33 1 484 1 715 2 310 1 41 18
272 384 479 72 127 159 229 301 427 0 24 1292 453 262 36 54 31 245 404 254 0 0 0317 306 681 60 68 154 236 225 575 0 0 5209 143 131 13 10 9 206 129 117 1 0 0262 194 233 53 37 44 167 168 208 0 8 11276 143 239 109 54 92 146 108 228 0 8 0155 246 256 25 38 39 84 186 202 0 0 0
25 22 16 5 4 3 21 21 15 0 0 0162 145 124 7 5 5 150 139 120 0 0 0
13 659 13 486 11 706 7 7 6 11 506 10 588 10 398 146 559 156
521 555 584 40 39 41 410 515 549 0 0 02 673 1 978 2 471 2 2 2 2 538 1 861 2 383 0 0 0
3 14 13 140 783 924 3 12 6 0 0 0204 67 46 9 3 2 7 17 11 0 0 0
23 43 54 28 50 65 21 41 50 0 0 02 060 4 073 3 153 10 18 14 1 100 2 259 2 542 100 451 98
23 27 15 281 273 166 23 27 15 0 0 00 0 0 0 0 0 0 0 0 0 0 0
219 327 249 41 55 43 193 289 226 3 4 01 163 745 115 52 29 4 1 163 742 112 0 0 0
61 53 56 1 193 862 972 27 52 52 0 0 00 0 0 0 0 0 0 0 0 0 0 0
60 141 142 1 3 3 36 73 103 12 4 40 17 19 12 1 219 1 902 0 14 18 0 0 01 31 8 519 21 618 4 789 1 14 8 0 0 0
Table 3: ODA recipients
Arab States
AlgeriaBahrainDjiboutiEgyptIraqJordanLebanonLibyan Arab JamahiriyaMauritaniaMoroccoOmanPalestinian A. T.Saudi ArabiaSudanSyrian Arab RepublicTunisiaYemen
Central andEastern EuropeAlbaniaBelarusBosnia and HerzegovinaCroatiaRepublic of MoldovaTFYR MacedoniaoTurkeyUkraine
Central Asia
ArmeniaAzerbaijanGeorgiaKazakhstanKyrgyzstanMongoliaTajikistanTurkmenistanUzbekistan
East Asiaand the PacificCambodiaChinaCook IslandsDPR KoreaFijiIndonesiaKiribatiKorea, Rep.Lao PDRMalaysiaMarshall IslandsMicronesiaMyanmarNauruNiue
Total ODA Per capita ODA Sector-allocable ODA
Constant 2006US$ millionsConstant 2006 US$
Constant 2006US$ millions
Debt relief and other actions relating to debt
Constant 2006US$ millions
1999–2000annual
average 2005 2006
1999–2000annual
average 2005 2006
1999–2000annual
average 2005 2006
1999–2000annual
average 2005 2006
3 9 4

A I D TA B L E S
Ta b l e 3
36 28 33 1 887 1 426 1 636 23 18 22 0 0 0516 264 304 107 45 49 479 257 294 0 0 0
1 601 522 448 21 6 5 1 521 489 391 0 0 032 67 43 202 364 230 32 66 40 0 0 0
118 171 201 264 357 415 84 164 198 0 4 01 475 597 348 23 9 5 1 338 521 299 0 0 0
322 193 205 437 203 184 214 166 175 0 0 00 14 11 … 10 195 8 069 0 2 5 0 0 0
17 18 27 174 176 270 17 16 25 0 0 07 18 6 710 1 714 545 7 17 5 0 0 0
44 76 112 221 359 509 40 74 109 1 0 02 227 2 816 2 596 29 33 30 2 063 2 491 2 367 31 96 54
9 194 8 751 9 080 18 16 16 7 079 6 462 7 707 562 1 088 424
6 2 10 542 172 838 6 2 10 0 0 08 3 0 124 39 3 8 3 0 0 0 0
119 109 77 3 3 2 64 100 74 0 0 00 0 0 2 0 0 0 0 0 0 0 02 3 7 8 9 22 2 2 6 0 0 0
39 21 17 171 78 59 37 18 16 0 2 01 055 700 706 127 76 75 702 552 574 248 77 68
257 331 288 2 2 2 246 300 274 0 0 073 69 48 5 4 3 68 59 44 1 0 0
956 989 1 584 23 22 35 924 857 1 463 3 0 057 88 199 14 20 45 46 81 194 9 0 076 66 52 7 6 5 52 52 46 0 0 020 35 7 279 441 99 15 33 7 0 1 0
373 119 258 45 13 27 295 111 174 1 1 14194 234 234 15 18 18 148 203 208 0 8 3218 237 182 35 34 27 172 206 162 2 1 1
14 26 11 153 250 100 11 23 10 0 0 0385 352 575 34 28 44 316 276 308 0 0 179169 123 63 222 164 85 128 107 52 21 9 1273 960 575 34 113 61 193 621 495 4 17 1978 1 415 473 152 196 68 654 577 275 89 694 141125 72 73 49 27 27 80 44 66 5 16 0218 297 455 2 3 4 209 285 449 0 0 0
43 5 24 10 806 1 021 4 131 30 5 24 0 0 0778 751 1 023 153 137 185 545 490 884 62 177 13
36 47 57 13 14 17 36 41 51 0 0 0205 64 322 37 10 54 49 60 288 0 0 0
1 099 484 700 43 17 25 882 379 644 118 81 15 6 4 144 131 74 5 6 4 0 0 0
28 45 11 192 282 68 20 43 10 0 0 013 7 11 117 62 95 10 7 11 0 0 039 51 40 94 113 88 37 51 36 0 0 0
9 40 38 7 31 29 8 38 38 0 0 05 1 13 282 38 532 5 1 0 0 0 0
19 65 23 6 19 7 19 59 21 0 2 0143 42 36 6 2 1 113 36 34 0 0 0
76 176 28 194 439 68 75 169 27 0 0 0
2 0 0 4 … … 2 0 0 0 0 0
6 764 14 476 13 893 5 9 9 5 378 9 641 11 433 590 179 346
187 3 476 3 257 9 116 125 55 2 647 2 770 0 0 02 059 2 038 2 374 15 14 15 1 660 1 660 1 898 156 39 245
Table 3 (continued)
PalauPapua New GuineaPhilippinesSamoaSolomon IslandsThailandTimor-LesteTokelauTongaTuvaluVanuatuViet Nam
Latin Americaand the CaribbeanAnguillaAntigua and BarbudaArgentinaArubaBarbadosBelizeBoliviaBrazilChileColombiaCosta RicaCubaDominicaDominican RepublicEcuadorEl SalvadorGrenadaGuatemalaGuyanaHaitiHondurasJamaicaMexicoMontserratNicaraguaPanamaParaguayPeruSaint Kitts and NevisSaint LuciaSt Vincent/Grenad.SurinameTrinidad and TobagoTurks and Caicos IslandsUruguayVenezuela, B. R.
North Americaand Western EuropeMalta
South and West Asia
AfghanistanBangladesh
Total ODA Per capita ODA Sector-allocable ODA
Constant 2006US$ millionsConstant 2006 US$
Constant 2006US$ millions
Debt relief and other actions relating to debt
Constant 2006US$ millions
1999–2000annual
average 2005 2006
1999–2000annual
average 2005 2006
1999–2000annual
average 2005 2006
1999–2000annual
average 2005 2006
3 9 5

90
02
Education f
or A
ll G
lobal M
onitorin
g R
eport
A N N E X
73 80 69 35 37 107 72 78 53 0 0 02 314 3 656 4 518 2 3 4 2 032 2 993 4 446 1 0 0
150 62 117 2 1 2 126 46 69 0 0 033 76 56 113 230 188 32 16 18 0 0 0
495 517 481 21 19 17 467 433 405 17 32 31857 2 928 2 205 6 19 14 384 1 009 1 193 416 0 5598 1 608 769 32 78 40 551 756 544 0 108 65
20 023 35 882 37 772 33 51 51 13 082 17 321 19 635 1 978 11 240 10 821
368 442 249 28 28 15 202 270 209 1 0 0427 556 810 68 66 92 325 441 697 32 55 11
46 116 78 30 66 42 40 109 71 3 5 5610 961 728 53 73 51 465 448 521 40 55 17187 320 565 29 42 69 100 105 354 9 22 9669 465 1 884 45 28 104 370 197 566 153 235 1 121151 345 140 353 681 270 109 297 110 1 1 1154 112 252 42 28 59 96 77 134 21 7 12376 443 267 48 45 26 313 289 113 12 14 7
30 66 36 42 82 44 20 53 30 3 2 2138 1 600 361 46 400 98 42 105 89 77 1 421 233687 268 418 43 15 22 325 115 185 252 54 60190 2 044 2 037 4 36 34 111 882 753 16 532 869
33 42 38 72 84 77 28 25 35 3 13 2267 332 104 73 75 22 152 148 63 0 0 0906 2 144 2 212 14 28 27 426 1 022 1 833 3 207 32115 67 162 94 49 123 87 49 159 28 10 0
64 94 71 49 62 43 52 90 65 1 1 01 054 1 438 1 369 55 65 59 739 550 865 7 547 7
288 216 223 35 23 24 242 142 182 27 29 1699 80 77 83 50 47 48 40 59 11 6 7
933 1 146 1 576 30 33 43 699 1 014 1 211 17 26 6993 94 119 46 52 60 89 86 115 0 0 045 226 350 15 69 98 23 106 192 0 0 0
655 1 372 636 41 74 33 339 626 454 90 537 28696 1 033 651 62 80 48 456 692 471 29 46 17609 984 757 54 73 63 482 675 594 37 97 26
48 48 79 42 39 63 48 46 78 0 0 01 723 1 466 1 317 94 74 63 1 021 929 939 272 83 83
127 113 209 72 56 102 120 107 204 0 0 0302 667 541 28 48 39 186 319 361 34 65 13600 6 573 8 509 5 50 59 581 953 1 171 0 5 586 7 330513 539 734 67 60 78 230 316 421 20 55 59
48 22 26 347 140 167 42 17 22 2 1 2923 974 1 001 98 84 83 637 702 781 204 243 166
7 13 14 84 161 160 7 8 11 0 0 2313 398 252 71 72 44 108 245 120 0 12 53129 176 427 15 21 51 45 54 91 3 1 1547 977 890 13 21 18 522 932 877 0 0 0
28 67 41 30 65 37 22 64 40 0 0 0106 72 60 23 12 9 78 56 46 18 6 6
1 150 1 437 1 216 49 50 41 761 936 801 99 129 61 354 1 883 2 656 39 49 67 840 1 214 1 036 185 149 31 179 1 949 1 543 113 167 132 573 724 853 265 987 544
239 225 338 19 17 26 213 137 265 0 0 0
9 257 14 777 24 235 … … … 3 482 8 264 12 307 57 73 1 779
73 705 124 681 121 566 15 24 22 50 807 70 347 79 296 4 132 27 548 17 072
Table 3 (continued)
BhutanIndiaIran, Islamic Republic ofMaldivesNepalPakistanSri Lanka
Sub-Saharan Africa
AngolaBeninBotswanaBurkina FasoBurundiCameroonCape VerdeC. A. R.ChadComorosCongoCôte d'IvoireD. R. CongoEquatorial GuineaEritreaEthiopiaGabonGambiaGhanaGuineaGuinea-BissauKenyaLesothoLiberiaMadagascarMalawiMaliMauritiusMozambiqueNamibiaNigerNigeriaRwandaSao Tome and PrincipeSenegalSeychellesSierra LeoneSomaliaSouth AfricaSwazilandTogoUgandaU. R. TanzaniaZambiaZimbabwe
Unallocatedby countries
Total
Total ODA Per capita ODA Sector-allocable ODA
Constant 2006US$ millionsConstant 2006 US$
Constant 2006US$ millions
Debt relief and other actions relating to debt
Constant 2006US$ millions
1999–2000annual
average 2005 2006
1999–2000annual
average 2005 2006
1999–2000annual
average 2005 2006
1999–2000annual
average 2005 2006
3 9 6

A I D TA B L E S
Ta b l e 3
3 915 5 177 4 514 11 13 11 3 465 4 871 3 964 41 20 7
25 893 44 189 30 766 11 18 13 19 726 23 236 23 933 1 338 15 714 4 092
140 0 0 3 0 0 132 0 0 0 0 0
11 914 18 518 28 883 … … … 5 535 10 833 15 983 58 74 1 780
19 607 33 667 31 214 29 44 40 12 804 20 315 20 950 1 676 3 581 2 289
31 843 56 797 57 403 15 23 23 21 948 31 407 35 416 2 694 11 740 11 193
29 808 49 365 35 280 11 17 12 23 191 28 107 27 897 1 379 15 734 4 099
73 705 124 681 121 566 15 24 22 50 807 70 347 79 296 4 132 27 548 17 072
6 706 29 567 16 653 25 97 54 5 344 11 549 10 913 501 14 168 3 063
6 056 5 492 5 604 39 34 38 3 376 4 638 4 567 297 200 466
1 970 2 073 2 596 26 27 33 1 484 1 715 2 310 1 41 18
13 659 13 486 11 706 7 7 6 11 506 10 588 10 398 146 559 156
9 194 8 751 9 080 18 16 16 7 079 6 462 7 707 562 1 088 424
76 176 28 194 439 68 75 169 27 0 0 0
6 764 14 476 13 893 5 9 9 5 378 9 641 11 433 590 179 346
20 023 35 882 37 772 33 51 51 13 082 17 321 19 635 1 978 11 240 10 821
9 257 14 777 24 235 … … … 3 482 8 264 12 307 57 73 1 779
73 705 124 681 121 566 15 24 22 50 807 70 347 79 296 4 132 27 548 17 072
Table 3 (continued)
Upper middleincome countries
Low middleincome countries
High income countries
Unallocatedby income
Least developedcountries
Low incomecountries
Middle incomecountries
Total
Arab States
Central andEastern Europe
Central Asia
East Asiaand the Pacific
Latin Americaand the Caribbean
North Americaand Western Europe
South andWest Asia
Sub-Saharan Africa
Unallocatedby region
Total
Total ODA Per capita ODA Sector-allocable ODA
Constant 2006US$ millionsConstant 2006 US$
Constant 2006US$ millions
Debt relief and other actions relating to debt
Constant 2006US$ millions
1999–2000annual
average 2005 2006
1999–2000annual
average 2005 2006
1999–2000annual
average 2005 2006
1999–2000annual
average 2005 2006
3 9 7
Notes:(…) indicates that data are not available.All data represent commitments unless otherwise specified.Totals may not match those presented in Table 1 due to the use of different databases.Source: OECD-DAC (2008c).

1 094 1 310 1 672 319 479 549 8 12 13 1 073 1 215 1 625 146 375 318
125 183 197 38 26 19 8 7 5 125 183 197 0 25 01 0 0 0 0 0 0 0 0 1 0 0 0 0 0
48 55 41 14 33 16 118 271 128 45 55 41 1 31 13149 99 154 40 79 120 5 8 13 149 99 154 37 74 119
8 135 61 1 93 26 0 21 6 8 135 61 0 92 223 58 104 1 34 70 1 41 85 23 19 70 0 13 5343 50 65 9 5 5 23 10 11 43 50 65 1 1 5
2 3 6 0 0 0 0 0 0 2 3 6 0 0 041 36 93 12 28 42 29 63 93 33 36 92 1 28 13
266 243 315 65 36 34 16 9 9 265 243 315 11 32 131 1 1 0 0 0 0 0 1 1 1 1 0 0 0
56 108 93 29 53 52 81 119 112 55 73 92 18 21 282 4 7 0 1 2 0 0 1 2 4 7 0 0 2
21 38 174 5 21 88 1 4 15 13 37 173 1 7 1139 23 66 4 1 2 2 1 1 39 23 66 0 0 1
180 210 162 45 16 7 36 15 7 179 190 152 29 4 166 42 65 50 40 57 15 11 15 66 42 64 41 39 55
409 312 427 131 33 49 11 3 4 372 297 412 87 12 28
32 21 42 11 4 10 38 17 45 25 21 42 2 2 70 8 23 0 1 0 0 1 0 0 8 23 0 0 0
37 34 31 11 3 2 61 14 9 28 34 31 2 1 120 13 19 0 0 0 2 2 1 20 13 19 0 0 010 10 30 4 1 12 13 3 64 3 10 28 0 0 1125 16 19 11 4 5 86 37 50 13 12 19 4 2 5
222 104 107 84 5 2 10 1 0 222 104 107 78 1 10 31 66 0 0 1 0 0 0 0 31 66 0 0 0
102 115 211 24 55 73 3 9 12 86 101 190 9 40 43
11 7 38 2 1 6 7 9 47 9 6 33 0 0 07 9 6 2 5 0 3 8 0 6 5 6 0 2 0
21 11 46 5 4 12 15 11 35 13 6 32 0 1 416 10 11 2 3 1 1 3 1 16 10 11 2 0 0
8 19 21 3 13 11 6 29 25 3 19 21 0 11 613 27 43 5 17 19 18 65 78 13 26 43 4 15 11
8 15 18 3 10 12 5 14 18 7 14 16 1 8 114 3 1 0 0 0 1 1 1 4 3 1 0 0 0
14 13 26 2 2 12 1 1 5 14 13 26 1 1 10
1 113 1 244 1 948 300 439 634 2 3 4 1 069 1 153 1 892 155 264 414
38 56 61 14 27 47 6 13 22 33 56 61 7 10 45169 318 854 27 11 131 0 0 1 169 318 854 17 4 64
0 2 3 0 1 2 0 284 574 0 2 3 0 0 11 1 2 0 0 0 0 0 0 1 1 2 0 0 07 6 9 1 1 3 9 13 31 7 6 9 1 1 0
208 205 423 73 77 280 3 3 11 197 166 403 56 40 2187 1 2 3 0 1 218 13 65 7 1 2 0 0 00 0 0 0 0 0 0 0 0 0 0 0 0 0 0
30 22 19 4 8 5 5 11 6 30 20 17 2 4 185 18 86 1 3 2 0 1 1 85 18 86 0 0 0
4 13 13 2 7 7 227 808 750 0 13 13 0 0 00 0 0 0 0 0 0 0 0 0 0 0 0 0 03 14 20 2 7 16 0 2 4 3 14 20 1 3 150 1 2 0 0 1 0 220 548 0 1 2 0 0 00 4 0 0 2 0 0 12 091 183 0 1 0 0 0 0
Table 4: Recipients of aid to education
90
02
Education f
or A
ll G
lobal M
onitorin
g R
eport
A N N E X
Arab States
AlgeriaBahrainDjiboutiEgyptIraqJordanLebanonLibyan Arab JamahiriyaMauritaniaMoroccoOmanPalestinian A. T.Saudi ArabiaSudanSyrian Arab RepublicTunisiaYemen
Central andEastern EuropeAlbaniaBelarusBosnia and HerzegovinaCroatiaRepublic of MoldovaTFYR MacedoniaoTurkeyUkraine
Central Asia
ArmeniaAzerbaijanGeorgiaKazakhstanKyrgyzstanMongoliaTajikistanTurkmenistanUzbekistan
East Asiaand the PacificCambodiaChinaCook IslandsDPR KoreaFijiIndonesiaKiribatiKorea, Rep.Lao PDRMalaysiaMarshall IslandsMicronesiaMyanmarNauruNiue
Total aidto education
Total aid to basic education
Total aid to basic education per primary
school-age child
Constant 2006 US$Constant 2006US$ millions
Constant 2006US$ millions
Direct aidto education
Constant 2006US$ millions
Direct aid to basic education
Constant 2006US$ millions
1999–2000annual
average 2005 2006
1999–2000annual
average 2005 2006
1999–2000annual
average 2005 2006
1999–2000annual
average 2005 2006
1999–2000annual
average 2005 2006
3 9 8
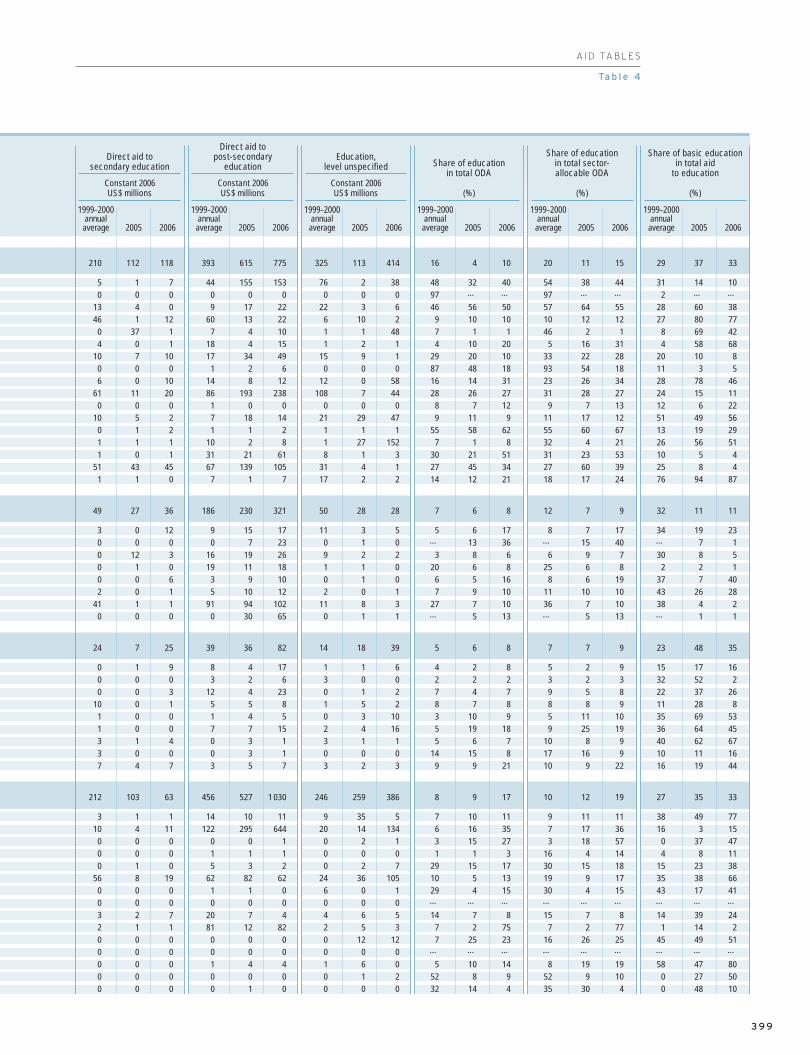
210 112 118 393 615 775 325 113 414 16 4 10 20 11 15 29 37 33
5 1 7 44 155 153 76 2 38 48 32 40 54 38 44 31 14 100 0 0 0 0 0 0 0 0 97 … … 97 … … 2 … …
13 4 0 9 17 22 22 3 6 46 56 50 57 64 55 28 60 3846 1 12 60 13 22 6 10 2 9 10 10 10 12 12 27 80 77
0 37 1 7 4 10 1 1 48 7 1 1 46 2 1 8 69 424 0 1 18 4 15 1 2 1 4 10 20 5 16 31 4 58 68
10 7 10 17 34 49 15 9 1 29 20 10 33 22 28 20 10 80 0 0 1 2 6 0 0 0 87 48 18 93 54 18 11 3 56 0 10 14 8 12 12 0 58 16 14 31 23 26 34 28 78 46
61 11 20 86 193 238 108 7 44 28 26 27 31 28 27 24 15 110 0 0 1 0 0 0 0 0 8 7 12 9 7 13 12 6 22
10 5 2 7 18 14 21 29 47 9 11 9 11 17 12 51 49 560 1 2 1 1 2 1 1 1 55 58 62 55 60 67 13 19 291 1 1 10 2 8 1 27 152 7 1 8 32 4 21 26 56 511 0 1 31 21 61 8 1 3 30 21 51 31 23 53 10 5 4
51 43 45 67 139 105 31 4 1 27 45 34 27 60 39 25 8 41 1 0 7 1 7 17 2 2 14 12 21 18 17 24 76 94 87
49 27 36 186 230 321 50 28 28 7 6 8 12 7 9 32 11 11
3 0 12 9 15 17 11 3 5 5 6 17 8 7 17 34 19 230 0 0 0 7 23 0 1 0 … 13 36 … 15 40 … 7 10 12 3 16 19 26 9 2 2 3 8 6 6 9 7 30 8 50 1 0 19 11 18 1 1 0 20 6 8 25 6 8 2 2 10 0 6 3 9 10 0 1 0 6 5 16 8 6 19 37 7 402 0 1 5 10 12 2 0 1 7 9 10 11 10 10 43 26 28
41 1 1 91 94 102 11 8 3 27 7 10 36 7 10 38 4 20 0 0 0 30 65 0 1 1 … 5 13 … 5 13 … 1 1
24 7 25 39 36 82 14 18 39 5 6 8 7 7 9 23 48 35
0 1 9 8 4 17 1 1 6 4 2 8 5 2 9 15 17 160 0 0 3 2 6 3 0 0 2 2 2 3 2 3 32 52 20 0 3 12 4 23 0 1 2 7 4 7 9 5 8 22 37 26
10 0 1 5 5 8 1 5 2 8 7 8 8 8 9 11 28 81 0 0 1 4 5 0 3 10 3 10 9 5 11 10 35 69 531 0 0 7 7 15 2 4 16 5 19 18 9 25 19 36 64 453 1 4 0 3 1 3 1 1 5 6 7 10 8 9 40 62 673 0 0 0 3 1 0 0 0 14 15 8 17 16 9 10 11 167 4 7 3 5 7 3 2 3 9 9 21 10 9 22 16 19 44
212 103 63 456 527 1 030 246 259 386 8 9 17 10 12 19 27 35 33
3 1 1 14 10 11 9 35 5 7 10 11 9 11 11 38 49 7710 4 11 122 295 644 20 14 134 6 16 35 7 17 36 16 3 15
0 0 0 0 0 1 0 2 1 3 15 27 3 18 57 0 37 470 0 0 1 1 1 0 0 0 1 1 3 16 4 14 4 8 110 1 0 5 3 2 0 2 7 29 15 17 30 15 18 15 23 38
56 8 19 62 82 62 24 36 105 10 5 13 19 9 17 35 38 660 0 0 1 1 0 6 0 1 29 4 15 30 4 15 43 17 410 0 0 0 0 0 0 0 0 … … … … … … … … …
3 2 7 20 7 4 4 6 5 14 7 8 15 7 8 14 39 242 1 1 81 12 82 2 5 3 7 2 75 7 2 77 1 14 20 0 0 0 0 0 0 12 12 7 25 23 16 26 25 45 49 510 0 0 0 0 0 0 0 0 … … … … … … … … …
0 0 0 1 4 4 1 6 0 5 10 14 8 19 19 58 47 800 0 0 0 0 0 0 1 2 52 8 9 52 9 10 0 27 500 0 0 0 1 0 0 0 0 32 14 4 35 30 4 0 48 10
A I D TA B L E S
Ta b l e 4
Direct aid to secondary education
Constant 2006US$ millions
1999–2000annual
average 2005 2006
Direct aid to post-secondary
education
Constant 2006US$ millions
1999–2000annual
average 2005 2006
Education, level unspecified
Constant 2006US$ millions
1999–2000annual
average 2005 2006
Share of educationin total ODA
(%)
1999–2000annual
average 2005 2006
Share of educationin total sector-allocable ODA
(%)
1999–2000annual
average 2005 2006
Share of basic educationin total aid
to education
(%)
1999–2000annual
average 2005 2006
3 9 9

2 3 3 1 2 2 376 931 988 0 1 1 0 0 092 69 34 60 59 21 74 63 22 90 69 34 53 52 14
166 57 43 58 36 21 5 3 2 166 57 43 5 31 137 11 21 3 9 6 122 291 192 7 11 21 1 9 0
13 22 4 4 20 1 56 264 17 7 22 4 0 20 127 36 34 3 4 2 0 1 0 25 36 34 0 0 0
8 16 31 2 4 20 17 23 107 8 14 30 1 1 150 2 1 0 1 1 0 4 748 2 777 0 0 0 0 0 02 5 15 0 3 10 19 183 692 2 5 15 0 2 91 2 0 0 1 0 271 484 29 1 2 0 0 0 0
12 17 11 1 4 5 17 109 144 12 17 11 0 3 2177 302 220 28 134 35 3 16 4 175 261 191 6 78 12
592 703 785 266 279 280 5 5 5 571 660 741 182 168 155
3 0 0 0 0 0 260 0 0 3 0 0 0 0 02 3 0 1 0 0 … 0 0 2 3 0 0 0 0
16 30 17 3 15 2 1 4 1 16 30 17 0 14 10 0 0 0 0 0 0 0 0 0 0 0 0 0 00 0 0 0 0 0 1 1 0 0 0 0 0 0 01 1 1 1 0 0 20 10 7 1 1 1 1 0 0
41 86 42 30 39 17 23 28 12 39 83 40 26 5 1246 39 62 11 8 12 1 1 1 46 39 62 5 3 820 12 18 3 2 3 1 1 2 20 12 18 1 1 235 30 46 12 5 8 3 1 2 35 30 46 4 5 7
4 3 6 0 1 1 1 2 2 4 3 6 0 1 18 4 4 1 0 1 1 1 1 8 4 4 0 0 01 1 0 0 0 0 41 13 2 0 1 0 0 0 0
22 13 88 7 6 41 6 5 32 22 13 79 7 3 510 15 36 2 3 12 1 2 7 10 15 36 1 2 314 11 19 7 5 8 9 6 9 14 11 19 5 3 2
0 12 0 0 12 0 4 692 1 0 12 0 0 12 031 41 23 20 30 9 11 15 4 31 41 23 18 27 8
7 1 6 1 0 5 8 2 52 6 1 4 0 0 432 67 53 19 22 12 14 16 9 28 54 51 11 8 522 62 22 13 42 17 12 39 16 21 43 22 5 28 1522 6 6 18 4 5 52 13 14 16 6 6 15 3 422 23 47 4 3 4 0 0 0 22 23 47 1 2 4
2 0 0 1 0 0 3 466 0 0 0 0 0 0 0 075 48 113 61 35 81 74 41 97 75 41 96 54 30 5914 4 3 1 0 1 3 1 2 14 4 3 1 0 0
4 14 15 2 5 7 3 5 8 4 14 8 2 3 228 31 66 9 11 13 3 3 4 28 31 63 6 7 8
0 0 0 0 0 0 0 0 0 0 0 0 0 0 02 1 1 1 0 1 59 22 27 1 1 1 0 0 01 0 0 1 0 0 31 11 6 1 0 0 0 0 01 15 2 0 7 0 1 120 0 1 15 2 0 0 01 0 35 0 0 0 0 0 0 1 0 35 0 0 02 0 3 2 0 1 … 149 … 2 0 0 2 0 05 3 4 1 0 1 3 1 3 5 3 4 0 0 1
23 7 10 2 0 1 1 0 0 23 7 10 0 0 1
3 0 0 0 0 0 5 8 0 3 0 0 0 0 0
1 0 0 0 0 0 1 0 0 1 0 0 0 0 0
842 1 175 986 448 575 478 3 3 3 827 949 839 342 374 326
8 253 143 2 180 105 0 42 24 8 221 140 1 156 82134 360 237 82 126 75 5 7 4 134 319 209 77 80 59
PalauPapua New GuineaPhilippinesSamoaSolomon IslandsThailandTimor-LesteTokelauTongaTuvaluVanuatuViet Nam
Latin Americaand the CaribbeanAnguillaAntigua and BarbudaArgentinaArubaBarbadosBelizeBoliviaBrazilChileColombiaCosta RicaCubaDominicaDominican RepublicEcuadorEl SalvadorGrenadaGuatemalaGuyanaHaitiHondurasJamaicaMexicoMontserratNicaraguaPanamaParaguayPeruSaint Kitts and NevisSaint LuciaSt Vincent/Grenad.SurinameTrinidad and TobagoTurks and Caicos IslandsUruguayVenezuela, B. R.
North Americaand Western EuropeMalta
South and West Asia
AfghanistanBangladesh
90
02
Education f
or A
ll G
lobal M
onitorin
g R
eport
A N N E X
Table 4 (continued)
Total aidto education
Total aid to basic education
Total aid to basic education per primary
school-age child
Constant 2006 US$Constant 2006US$ millions
Constant 2006US$ millions
Direct aidto education
Constant 2006US$ millions
Direct aid to basic education
Constant 2006US$ millions
1999–2000annual
average 2005 2006
1999–2000annual
average 2005 2006
1999–2000annual
average 2005 2006
1999–2000annual
average 2005 2006
1999–2000annual
average 2005 2006
4 0 0

A I D TA B L E S
Ta b l e 4
0 0 0 0 0 0 0 1 0 4 11 8 7 18 13 40 54 579 1 2 17 1 4 12 14 14 18 26 11 19 27 11 65 86 62
31 6 5 23 11 8 107 9 16 10 11 9 11 12 11 35 62 501 1 1 1 1 8 4 1 11 23 17 49 23 17 52 46 81 292 0 0 4 2 3 1 0 0 11 13 2 16 14 2 29 88 305 1 1 18 29 30 2 7 3 2 6 10 2 7 11 9 10 50 4 1 5 5 5 1 5 10 3 8 15 4 9 17 29 27 650 0 0 0 0 0 0 0 0 93 18 13 93 109 31 0 44 430 0 1 2 1 2 0 2 3 12 28 57 12 33 62 14 54 680 0 0 0 1 0 1 1 0 16 11 1 16 11 2 34 35 505 10 0 5 2 3 1 1 5 28 22 10 30 23 10 4 22 44
83 60 11 44 51 151 42 72 17 8 11 8 9 12 9 16 44 16
59 87 96 183 226 283 148 180 206 6 8 9 8 11 10 45 40 36
2 0 0 0 0 0 1 0 0 52 1 0 54 1 0 12 … …
0 3 0 0 0 0 2 0 0 21 96 4 21 98 5 50 0 03 3 1 9 11 12 4 2 2 14 28 22 26 30 23 15 50 140 0 0 0 0 0 0 0 0 … … … … … … … … …
0 0 0 0 0 0 0 0 0 4 3 2 4 4 2 23 25 00 0 0 0 0 0 0 0 0 3 3 3 3 4 3 77 63 551 7 13 7 6 7 5 65 8 4 12 6 6 16 7 73 45 404 2 4 25 24 41 12 10 9 18 12 21 19 13 23 24 21 203 1 1 13 9 13 4 2 1 27 18 36 29 21 40 13 17 152 5 6 12 18 30 16 2 3 4 3 3 4 3 3 35 18 181 0 1 2 2 4 0 1 1 6 3 3 8 4 3 11 29 202 1 0 4 3 4 1 0 0 11 6 8 16 8 9 10 12 120 0 0 0 0 0 0 0 0 5 2 4 7 2 5 48 20 7
11 3 3 3 1 9 1 7 62 6 11 34 7 12 51 33 46 462 6 6 5 5 10 2 2 18 5 7 15 7 8 17 19 21 322 1 2 3 2 3 4 5 13 7 5 10 8 5 12 51 49 440 0 0 0 0 0 0 0 0 1 47 1 1 53 1 47 99 292 2 2 7 6 9 4 6 4 8 12 4 10 15 7 65 73 415 0 0 0 0 0 0 0 0 4 0 10 5 0 12 10 29 792 23 8 4 7 26 11 16 11 12 7 9 16 11 11 59 33 231 2 1 2 3 1 14 11 5 2 4 5 3 11 8 56 68 780 0 0 1 0 0 0 2 1 18 8 8 28 13 9 81 78 811 1 4 15 18 38 5 2 1 10 8 10 10 8 10 17 14 90 0 0 0 0 0 0 0 0 4 … … 6 … … 54 … …
3 6 7 3 2 2 14 3 28 10 6 11 14 10 13 82 73 721 2 1 11 1 1 0 1 1 38 8 5 38 9 6 7 10 220 7 2 1 2 2 2 3 3 2 22 5 9 24 5 56 32 475 8 30 11 9 16 6 7 9 3 6 9 3 8 10 33 34 200 0 0 0 0 0 0 0 0 0 0 1 0 0 1 5 0 00 0 0 0 0 0 0 0 0 8 2 10 12 2 11 58 60 500 0 0 0 0 0 1 0 0 9 6 3 12 7 3 50 40 280 0 0 1 2 2 0 13 0 3 29 5 3 29 6 6 44 10 0 0 1 0 35 0 0 0 9 1 91 11 1 92 9 4 00 0 0 0 0 0 0 0 0 35 36 20 35 36 … 100 100 …
1 1 1 3 2 2 2 0 0 28 4 16 28 4 17 16 11 271 1 2 18 5 7 3 1 1 16 17 29 20 20 31 8 6 11
0 0 0 2 0 0 0 0 0 4 0 0 4 0 0 6 50 0
0 0 0 1 0 0 0 0 0 39 … … 40 … … 7 … …
114 254 196 174 145 159 197 176 158 12 8 7 16 12 9 53 49 49
0 5 9 5 43 7 1 16 42 4 7 4 14 10 5 22 71 7339 177 136 8 11 11 9 51 3 6 18 10 8 22 13 61 35 32
Direct aid to secondary education
Constant 2006US$ millions
1999–2000annual
average 2005 2006
Direct aid to post-secondary
education
Constant 2006US$ millions
1999–2000annual
average 2005 2006
Aid to education, level unspecified
Constant 2006US$ millions
1999–2000annual
average 2005 2006
Share of educationin total ODA
(%)
1999–2000annual
average 2005 2006
Share of educationin total sector-allocable ODA
(%)
1999–2000annual
average 2005 2006
Share of basic educationin total aid
to education
(%)
1999–2000annual
average 2005 2006
4 0 1

5 7 9 1 1 3 10 9 33 5 7 6 0 0 0462 82 160 295 18 76 2 0 1 448 82 160 205 16 50
79 19 50 4 1 1 0 0 0 79 19 50 0 0 115 8 5 0 1 2 6 22 41 15 8 5 0 0 160 19 56 50 10 27 16 3 7 60 16 56 49 7 1027 287 276 10 195 185 0 10 9 27 141 164 5 107 12052 139 48 4 43 5 3 28 3 52 136 48 4 6 3
2 352 2 840 3 811 1 186 1 474 2 070 11 12 17 1 842 2 207 3 051 658 891 1 205
22 67 38 8 57 22 5 31 12 22 67 38 3 54 2038 71 80 18 26 44 15 19 31 29 63 62 9 8 3314 66 2 0 33 0 1 107 2 14 66 2 0 0 068 166 194 36 98 137 19 44 59 54 84 165 25 54 114
6 22 45 2 11 26 2 9 20 5 11 26 0 2 13113 72 153 29 28 32 11 10 11 95 72 116 6 19 12
27 47 32 7 10 2 91 127 30 22 39 29 2 1 128 17 24 7 10 10 11 15 14 22 15 6 2 9 132 20 7 11 12 2 8 7 1 23 14 7 6 9 2
7 28 11 3 11 1 29 85 9 6 28 10 0 0 016 31 21 7 8 1 15 13 1 16 23 21 0 3 1
129 39 35 46 10 8 16 4 3 115 38 35 23 10 715 59 32 7 26 13 1 3 1 15 38 31 3 13 1110 9 8 4 5 3 84 83 54 10 9 8 3 3 035 98 2 28 83 0 55 145 0 35 98 2 26 68 054 61 402 26 33 306 2 3 23 53 42 400 19 18 23352 25 34 16 4 4 86 20 20 52 25 34 11 4 011 1 13 10 1 9 48 3 38 10 1 13 8 1 9
120 110 345 88 60 181 28 18 53 92 56 253 73 30 3543 47 33 20 25 9 15 18 6 43 47 33 16 14 914 18 6 5 7 2 24 29 6 8 16 6 2 1 166 66 207 40 51 111 8 9 19 35 66 207 23 46 5016 3 9 2 1 9 5 4 25 16 2 9 1 1 9
2 3 17 1 3 9 3 5 15 2 3 17 1 3 175 132 103 26 74 59 12 29 22 43 101 83 1 44 47
142 98 56 98 51 21 51 21 9 109 63 38 71 22 1187 77 308 45 39 256 27 20 127 75 50 289 21 14 22125 17 19 3 2 1 26 15 11 25 17 19 0 2 1
155 285 182 84 193 113 25 50 28 113 207 131 34 114 7425 6 6 17 4 4 46 10 10 25 6 6 14 3 332 85 47 13 52 24 8 24 11 19 45 35 3 31 973 12 80 42 7 18 2 0 1 72 12 80 24 7 1078 42 121 38 17 59 26 12 41 41 16 76 5 3 12
6 5 12 1 1 4 53 23 148 5 5 12 0 0 0143 247 309 77 27 129 47 15 70 135 247 303 42 21 39
1 1 0 1 0 0 65 31 16 1 1 0 0 0 024 31 12 12 17 8 17 20 9 2 9 7 0 3 5
5 6 15 3 5 13 2 3 9 5 6 15 0 4 1386 131 80 40 88 32 6 12 4 86 131 80 35 70 20
1 26 0 0 26 0 0 123 1 1 26 0 0 26 013 18 19 5 6 3 6 6 3 12 18 18 2 6 3
154 103 158 92 37 91 18 6 14 104 74 125 49 18 6183 128 387 42 53 213 7 8 30 33 42 79 16 6 56
138 190 91 93 153 70 48 68 30 76 152 71 56 124 5824 5 6 8 1 2 3 1 1 23 5 6 1 1 2
452 564 679 98 153 158 … … … 444 554 669 46 71 116
6 958 8 464 11 289 2 771 3 689 5 063 5 6 9 6 287 7 337 10 190 1 624 2 395 3 376
BhutanIndiaIran, Islamic Republic ofMaldivesNepalPakistanSri Lanka
Sub-Saharan Africa
AngolaBeninBotswanaBurkina FasoBurundiCameroonCape VerdeC. A. R.ChadComorosCongoCôte d’IvoireD. R. CongoEquatorial GuineaEritreaEthiopiaGabonGambiaGhanaGuineaGuinea-BissauKenyaLesothoLiberiaMadagascarMalawiMaliMauritiusMozambiqueNamibiaNigerNigeriaRwandaSao Tome and PrincipeSenegalSeychellesSierra LeoneSomaliaSouth AfricaSwazilandTogoUgandaU. R. TanzaniaZambiaZimbabwe
Unallocated by countries
Total
Total aidto education
Total aid to basic education
Total aid to basic education per primary
school-age child
Constant 2006 US$Constant 2006US$ millions
Constant 2006US$ millions
Direct aidto education
Constant 2006US$ millions
Direct aid to basic education
Constant 2006US$ millions
1999–2000annual
average 2005 2006
1999–2000annual
average 2005 2006
1999–2000annual
average 2005 2006
1999–2000annual
average 2005 2006
1999–2000annual
average 2005 2006
90
02
Education f
or A
ll G
lobal M
onitorin
g R
eport
A N N E X
Table 4 (continued)
4 0 2

2 4 0 1 1 2 2 1 3 7 9 13 8 9 17 21 13 3612 7 5 65 56 53 166 4 52 20 2 4 23 3 4 64 22 47
0 1 1 70 17 48 8 1 0 53 31 43 63 42 72 6 4 210 6 1 5 0 0 0 1 3 47 11 9 49 50 28 2 14 38
4 0 1 5 5 12 1 3 33 12 4 12 13 4 14 83 53 481 0 9 12 5 18 9 28 16 3 10 13 7 28 23 35 68 67
45 53 33 2 6 7 1 72 4 9 9 6 9 18 9 9 31 10
224 242 229 413 542 647 546 532 970 12 8 10 18 16 19 50 52 54
1 0 4 7 7 9 10 6 5 6 15 15 11 25 18 38 85 595 6 1 6 20 24 10 29 4 9 13 10 12 16 12 47 37 552 0 1 12 0 0 0 65 1 30 57 2 35 60 2 3 50 26
10 2 20 12 21 14 7 7 17 11 17 27 15 37 37 53 59 710 0 0 2 3 6 2 6 7 3 7 8 6 21 13 32 50 574 1 3 56 35 99 30 17 3 17 16 8 30 37 27 26 38 213 1 2 11 27 26 5 11 0 18 14 23 25 16 29 26 21 7
10 0 0 8 6 5 2 0 0 18 15 10 30 22 18 23 59 402 0 0 13 5 4 2 0 0 8 4 2 10 7 6 36 60 261 0 0 0 7 9 5 20 1 23 43 30 34 53 36 45 37 110 0 1 2 19 20 14 0 0 12 2 6 39 30 24 44 24 3
23 0 1 37 28 27 32 0 0 19 14 8 40 34 19 35 27 221 8 2 4 12 14 7 5 5 8 3 2 13 7 4 46 44 422 0 0 1 1 1 3 5 6 29 21 21 34 35 23 47 58 423 0 1 2 0 1 3 29 0 13 30 2 23 66 3 80 85 134 3 4 17 10 19 13 12 144 6 3 18 13 6 22 48 54 76
18 0 1 14 21 25 9 0 7 45 36 21 60 50 21 30 15 110 0 2 0 0 1 1 0 2 18 1 18 22 1 20 84 62 72
11 4 4 7 16 14 1 6 199 11 8 25 16 20 40 73 55 538 0 0 12 11 23 6 21 1 15 22 15 18 33 18 45 54 271 1 1 4 4 4 1 11 0 14 22 8 28 45 11 37 41 242 5 22 6 7 13 4 9 122 7 6 13 9 7 17 62 77 54
13 0 0 1 0 0 1 2 0 18 3 8 18 3 8 12 56 980 1 0 0 0 0 1 0 15 4 1 5 8 3 9 67 81 518 0 3 15 27 29 18 30 4 11 10 16 22 21 23 35 57 57
15 6 24 1 13 1 22 22 4 20 10 9 31 14 12 69 52 3811 0 2 7 13 16 36 23 50 14 8 41 18 11 52 52 51 83
0 0 2 18 15 16 6 0 0 51 36 24 51 37 24 13 11 78 4 19 13 9 10 58 81 28 9 19 14 15 31 19 54 68 633 1 2 3 1 1 5 1 0 20 5 3 21 5 3 67 68 566 7 1 3 6 8 7 2 17 11 13 9 17 27 13 42 60 513 1 46 10 4 10 34 1 14 12 0 1 13 1 7 57 58 224 1 1 4 10 15 28 3 49 15 8 16 34 13 29 48 41 481 0 1 2 4 4 1 0 7 12 21 48 14 27 56 21 12 299 154 19 22 61 70 61 11 175 16 25 31 23 35 40 54 11 420 0 0 0 0 0 1 0 0 18 5 3 18 8 4 47 36 280 0 0 1 0 1 0 5 1 8 8 5 22 12 10 49 55 640 0 1 0 0 0 4 2 1 4 4 4 11 12 16 51 76 90
11 17 12 29 8 25 11 36 23 16 13 9 17 14 9 46 67 391 0 0 0 0 0 0 1 0 5 39 1 7 41 1 7 99 470 0 1 3 12 15 7 0 1 12 24 32 17 32 41 41 34 173 6 22 16 42 15 36 8 27 13 7 13 20 11 20 60 35 586 6 3 8 22 14 3 7 6 6 7 15 10 11 37 51 41 554 4 2 4 5 7 13 19 3 12 10 6 24 26 11 67 80 773 0 0 5 3 4 13 1 1 10 2 2 11 4 2 35 27 28
27 22 130 275 306 349 96 156 75 5 4 3 13 7 6 22 27 23
919 854 893 2 121 2 627 3 647 1 622 1 462 2 274 9 7 9 14 12 14 40 44 45
Direct aid to secondary education
Constant 2006US$ millions
1999–2000annual
average 2005 2006
Direct aid to post-secondary
education
Constant 2006US$ millions
1999–2000annual
average 2005 2006
Aid to education, level unspecified
Constant 2006US$ millions
1999–2000annual
average 2005 2006
Share of educationin total ODA
(%)
1999–2000annual
average 2005 2006
Share of educationin total sector-allocable ODA
(%)
1999–2000annual
average 2005 2006
Share of basic educationin total aid
to education
(%)
1999–2000annual
average 2005 2006
A I D TA B L E S
Ta b l e 4
4 0 3
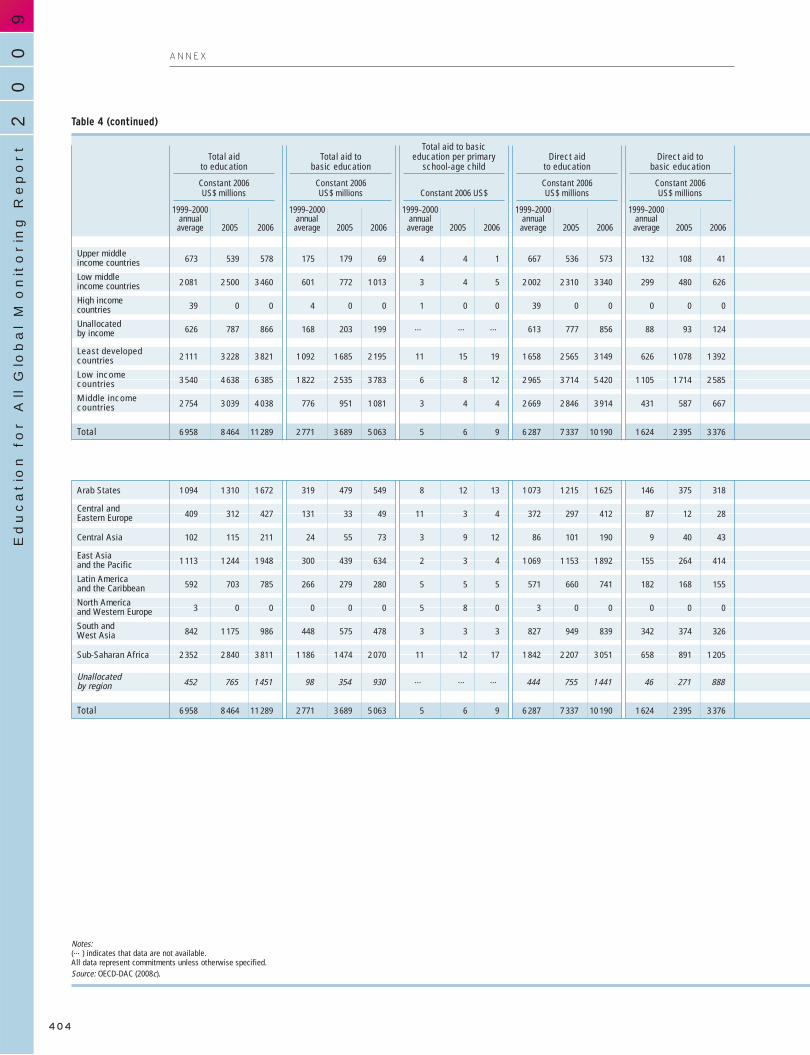
673 539 578 175 179 69 4 4 1 667 536 573 132 108 41
2 081 2 500 3 460 601 772 1 013 3 4 5 2 002 2 310 3 340 299 480 626
39 0 0 4 0 0 1 0 0 39 0 0 0 0 0
626 787 866 168 203 199 … … … 613 777 856 88 93 124
2 111 3 228 3 821 1 092 1 685 2 195 11 15 19 1 658 2 565 3 149 626 1 078 1 392
3 540 4 638 6 385 1 822 2 535 3 783 6 8 12 2 965 3 714 5 420 1 105 1 714 2 585
2 754 3 039 4 038 776 951 1 081 3 4 4 2 669 2 846 3 914 431 587 667
6 958 8 464 11 289 2 771 3 689 5 063 5 6 9 6 287 7 337 10 190 1 624 2 395 3 376
1 094 1 310 1 672 319 479 549 8 12 13 1 073 1 215 1 625 146 375 318
409 312 427 131 33 49 11 3 4 372 297 412 87 12 28
102 115 211 24 55 73 3 9 12 86 101 190 9 40 43
1 113 1 244 1 948 300 439 634 2 3 4 1 069 1 153 1 892 155 264 414
592 703 785 266 279 280 5 5 5 571 660 741 182 168 155
3 0 0 0 0 0 5 8 0 3 0 0 0 0 0
842 1 175 986 448 575 478 3 3 3 827 949 839 342 374 326
2 352 2 840 3 811 1 186 1 474 2 070 11 12 17 1 842 2 207 3 051 658 891 1 205
452 765 1 451 98 354 930 … … … 444 755 1 441 46 271 888
6 958 8 464 11 289 2 771 3 689 5 063 5 6 9 6 287 7 337 10 190 1 624 2 395 3 376
Upper middleincome countries
Low middleincome countries
High income countries
Unallocatedby income
Least developedcountries
Low incomecountries
Middle incomecountries
Total
Arab States
Central andEastern Europe
Central Asia
East Asiaand the Pacific
Latin Americaand the Caribbean
North Americaand Western Europe
South andWest Asia
Sub-Saharan Africa
Unallocatedby region
Total
90
02
Education f
or A
ll G
lobal M
onitorin
g R
eport
A N N E X
Total aidto education
Total aid to basic education
Total aid to basic education per primary
school-age child
Constant 2006 US$Constant 2006US$ millions
Constant 2006US$ millions
Direct aidto education
Constant 2006US$ millions
Direct aid to basic education
Constant 2006US$ millions
1999–2000annual
average 2005 2006
1999–2000annual
average 2005 2006
1999–2000annual
average 2005 2006
1999–2000annual
average 2005 2006
1999–2000annual
average 2005 2006
Table 4 (continued)
4 0 4
Notes:(…) indicates that data are not available.All data represent commitments unless otherwise specified.Source: OECD-DAC (2008c).

A I D TA B L E S
Ta b l e 4
98 42 43 356 248 439 80 139 50 17 10 13 19 11 15 26 33 12
385 240 269 793 1 195 1 792 526 396 654 8 6 11 11 11 14 29 31 29
0 0 0 30 0 0 9 0 0 28 … … 29 … … 11 … …
38 30 139 340 444 453 148 210 140 5 4 3 11 7 5 27 26 23
231 451 314 322 484 509 479 552 933 11 10 12 16 16 18 52 52 57
399 542 442 602 740 963 859 718 1 430 11 8 11 16 15 18 51 55 59
483 281 312 1 150 1 443 2 231 606 534 703 9 6 11 12 11 14 28 31 27
919 854 893 2 121 2 627 3 647 1 622 1 462 2 274 9 7 9 14 12 14 40 44 45
10 112 118 393 615 775 325 113 414 16 4 10 20 11 15 29 37 33
49 27 36 186 230 321 50 28 28 7 6 8 12 7 9 32 11 11
24 7 25 39 36 82 14 18 39 5 6 8 7 7 9 23 48 35
212 103 63 456 527 1 030 246 259 386 8 9 17 10 12 19 27 35 33
59 87 96 183 226 283 148 180 206 6 8 9 8 11 10 45 40 36
0 0 0 2 0 0 0 0 0 4 0 0 4 0 0 6 50 0
114 254 196 174 145 159 197 176 158 12 8 7 16 12 9 53 49 49
224 242 229 413 542 647 546 532 970 12 8 10 18 16 19 50 52 54
27 22 130 275 306 349 96 156 75 5 5 6 13 9 12 22 46 64
919 854 893 2 121 2 627 3 647 1 622 1 462 2 274 9 7 9 14 12 14 40 44 45
Direct aid to secondary education
Constant 2006US$ millions
1999–2000annual
average 2005 2006
Direct aid to post-secondary
education
Constant 2006US$ millions
1999–2000annual
average 2005 2006
Aid to education, level unspecified
Constant 2006US$ millions
1999–2000annual
average 2005 2006
Share of educationin total ODA
(%)
1999–2000annual
average 2005 2006
Share of educationin total sector-allocable ODA
(%)
1999–2000annual
average 2005 2006
Share of basic educationin total aid
to education
(%)
1999–2000annual
average 2005 2006
4 0 5

90
02
Education f
or A
ll G
lobal M
onitorin
g R
eport
4 0 6
Mexico’s Oportunidadesprogramme reaches out to poor and indigenoushouseholds
© K
eith
Dan
nem
iller
/CO
RB
IS

Achievement. Performance on standardized tests or
examinations that measure knowledge or competence
in a specific subject area. The term is sometimes used
as an indication of education quality within an education
system or when comparing a group of schools.
Adult education. Educational activities, offered through
formal, non-formal or informal frameworks, targeted
at adults and aimed at advancing, or substituting for,
initial education and training. The purpose may be
to (a) complete a given level of formal education or
professional qualification; (b) acquire knowledge and
skills in a new field (not necessarily for a qualification);
and/or (c) refresh or update knowledge and skills.
See also Basic education and Continuing education.
Adult literacy rate. Number of literate persons aged 15
and above, expressed as a percentage of the total
population in that age group. Different ways of defining
and assessing literacy yield different results regarding
the number of persons designated as literate.
Age-specific enrolment ratio (ASER). Enrolment of
a given age or age group, regardless of the level of
education in which pupils or students are enrolled,
expressed as a percentage of the population of the
same age or age group.
Basic education. The whole range of educational
activities taking place in various settings (formal,
non-formal and informal) that aim to meet basiclearning needs; in the Dakar Framework the term
is synonymous with the broad EFA agenda. Similarly,
the OECD-DAC and standard aid classifications use
a definition that includes early childhood education,
primary education, and basic life skills for youths and
adults, including literacy. According to the InternationalStandard Classification of Education (ISCED), basic
education comprises primary education (first stage
of basic education) and lower secondary education
(second stage).
Basic learning needs. As defined in the World
Declaration on Education for All (Jomtien, Thailand,
1990): essential learning tools (literacy, oral expression,
numeracy, problem-solving) and basic learning content
(knowledge, skills, values, attitudes) required by human
beings to survive, develop their full capacities, live and
work in dignity, participate fully in development,
G L O S S A R Y
4 0 7
Glossary

90
02
Education f
or A
ll G
lobal M
onitorin
g R
eport
improve the quality of their lives, make informed
decisions and continue learning. The scope of basic
learning needs and how they should be met varies
by country and culture, and changes over time.
Charter school. A public school that is not subject
to some of the local and state regulations applied
to conventional public schools, allowing parents,
community leaders, educational entrepreneurs or
others greater autonomy over decisions in defined
areas. Charter schools are sponsored by local, state
or other organizations, which monitor their quality
and hold them accountable for academic results and
good financial practice as specified in their charters.
Child labour. A term often defined as work that deprives
children of their childhood, their potential and their
dignity, and that is harmful to their physical and mental
development. The term refers to work that is mentally,
physically, socially or morally dangerous, that harms
children and that interferes with their schooling by
depriving them of the opportunity to attend school,
obliging them to leave school prematurely or requiring
them to try to combine school attendance with
excessively long and heavy work hours.
Child- or under-5 mortality rate. Probability of dying
between birth and the fifth birthday, expressed per
1,000 live births.
Cognitive development. Development of the mental
action or process of acquiring knowledge through
thought, experience and senses.
Compulsory education or attendance. Educational
programmes that children and young people are legally
obliged to attend, usually defined in terms of a number
of grades or an age range, or both.
Constant prices. A way to express financial values
in real terms, that enables comparisons over time.
To measure changes in real national income or
product, economists calculate the value of total
production in each year at constant prices using
a set of prices that are applied in a chosen base year.
Continuing or further education. A general term
referring to a wide range of educational activities
designed to meet the learning needs of adults.
See also Adult education.
Disability. A temporary or permanent physical or mental
condition that may limit a person’s opportunities
to take part in the community on an equal level
with others.
Dropout rate by grade. Percentage of pupils or students
who drop out of a given grade in a given school year.
It is the difference between 100% and the sum of the
promotion and repetition rates.
Early childhood. The period of a child’s life from birth
to age 8.
Early childhood care and education (ECCE).Programmes that, in addition to providing children
with care, offer a structured and purposeful set
of learning activities either in a formal institution
(pre-primary or ISCED 0) or as part of a non-formal
child development programme. ECCE programmes
are normally designed for children from age 3 and
include organized learning activities that constitute,
on average, the equivalent of at least 2 hours per day
and 100 days per year.
Education attainment rate. The percentage of a
population belonging to a particular age group that
has attained or completed a specified education level
(typically primary, secondary or tertiary) or grade
in school.
EFA Development Index (EDI). Composite index aimed
at measuring overall progress towards EFA. At
present, the EDI incorporates four of the most easily
quantifiable EFA goals – universal primary education
as measured by the total primary net enrolment ratio,
adult literacy as measured by the adult literacy rate,
gender parity as measured by the gender-specific EFAindex and quality of education as measured by the
survival rate to grade 5. Its value is the arithmetic
mean of the observed values of these four indicators.
EFA Inequality Index for Income Groups (EIIIG). A
composite index measuring inequality in overall EFA
achievement across different population groups. The
EIIIG measures the (unequal) distribution of overall EFA
achievement within countries according to household
wealth and other socio-demographic markers, using
a set of indicators from household surveys that differs
from those in the EDI.
Elementary education. See primary education.
A N N E X
4 0 8

Enrolment. Number of pupils or students enrolled at
a given level of education, regardless of age. See also
Gross enrolment ratio and Net enrolment ratio.
Entrance age (official). Age at which pupils or students
would enter a given programme or level of education,
assuming they had started at the official entrance age
for the lowest level, studied full time throughout and
progressed through the system without repeating or
skipping a grade. The theoretical entrance age for a
given programme or level may be very different from
the actual or even the most common entrance age.
Equity. As used in the report, the term describes
fairness in the distribution of opportunities for
education. Enhanced equity implies a reduction
in disparities based on gender, poverty, residence,
ethnicity, language or other characteristics and
circumstances that should not influence education
outcomes.
Equivalency education. Programmes primarily
organized for children and youth who did not have
access to, or who dropped out of, formal primary/basic
education. Typically, these programmes aim at
providing equivalency to formal primary/basic
education and at mainstreaming the target groups
into the formal system upon successful completion
of the programme.
Fields of study in tertiary or higher education.
Education: teacher training and education science.
Humanities and arts: humanities, religion and theology,
fine and applied arts.
Social sciences, business and law: social and
behavioural sciences, journalism and information,
business and administration, law.
Science: life and physical sciences, mathematics,
statistics and computer sciences.
Engineering, manufacturing and construction:
engineering and engineering trades, manufacturing
and processing, architecture and building.
Agriculture: agriculture, forestry and fishery,
veterinary studies.
Health and welfare: medical sciences and health-
related sciences, social services.
Services: personal services, transport services,
environmental protection, security services.
Foreign students. Students enrolled in an education
programme in a country of which they are not
permanent residents.
Gender parity index (GPI). Ratio of female to male values
(or male to female, in certain cases) of a given
indicator. A GPI of 1 indicates parity between sexes;
a GPI above or below 1 indicates a disparity in favour
of one sex over the other.
Gender-specific EFA index (GEI). A composite index
measuring gender parity in total participation in
primary and secondary education, and in adult literacy.
The GEI is calculated as the arithmetic mean of the
gender parity indices of the primary and secondary
gross enrolment ratios and of the adult literacy rate.
General education. Programmes designed to lead
students to a deeper understanding of a subject
or group of subjects, especially, but not necessarily,
with a view to preparing them for further education
at the same or a higher level. These programmes
are typically school-based and may or may not contain
vocational elements. Their successful completion may
or may not provide students with a labour-market-
relevant qualification.
Grade. Stage of instruction usually equivalent to
one complete school year.
Graduate. A person who has successfully completed the
final year of a level or sub-level of education. In some
countries completion occurs as a result of passing
an examination or a series of examinations. In other
countries it occurs after a requisite number of course
hours have been accumulated. Sometimes both types
of completion occur within a country.
Gross enrolment ratio (GER). Total enrolment in a
specific level of education, regardless of age, expressed
as a percentage of the population in the official age
group corresponding to this level of education. For the
tertiary level, the population used is that of the five-year
age group following on from the secondary school
leaving age. The GER can exceed 100% due to early
or late entry and/or grade repetition.
Gross intake rate (GIR). Total number of new entrants to
a given grade of primary education, regardless of age,
expressed as a percentage of the population at the
official school entrance age for that grade.
G L O S S A R Y
4 0 9

90
02
Education f
or A
ll G
lobal M
onitorin
g R
eport
Gross domestic product (GDP). The value of all final
goods and services produced in a country in one year
(see also Gross national product). GDP can be
measured by aggregating an economy’s (a) income
(wages, interest, profits, rents) or (b) expenditure
(consumption, investment, government purchases),
plus net exports (exports minus imports). The results
should be the same because one person’s expenditure
is always another person’s income; the sum of all
income must equal the sum of all expenditure.
Gross domestic product per capita. GDP divided by
the total population at mid-year.
Gross national product (GNP). The value of all final goods
and services produced in a country in one year (gross
domestic product) plus income that residents have
received from abroad, minus income claimed by non-
residents. GNP may be much less than GDP if much of
the income from a country’s production flows to foreign
persons or firms. But if the people or firms of a country
hold large amounts of the stocks and bonds of firms
or governments of other countries, and receive income
from them, GNP may be greater than GDP.
Gross national product per capita. GNP divided by
the total population at mid-year.
HIV prevalence rate. Estimated number of people of
a given age group living with HIV/AIDS at the end of
a given year, expressed as a percentage of the total
population of the corresponding age group.
Household survey. Survey whose purpose is to compile
socio-economic and demographic information on
households and individual household members in
such areas as education, health, income, employment,
mortality and fertility. In the area of education,
large-scale household surveys supplement information
derived from administrative sources, censuses and
school surveys. They are conducted using standard
sampling procedures.
Illiterate. See Literate.
Indigenous language. A language that originated in a
specified territory or community and was not brought
in from elsewhere.
Infant mortality rate. Probability of dying between
birth and the first birthday, expressed as deaths
per 1,000 live births.
Infectious diseases. Diseases that are caused by
pathogenic micro-organisms, such as bacteria, fungi,
parasites or viruses, and that can be spread directly
or indirectly from one person to another. They include
influenza, dengue, hepatitis, malaria, measles,
tuberculosis and yellow fever.
Informal education. Learning that takes place in daily
life without clearly stated objectives. The term refers
to a lifelong process whereby all individuals acquire
attitudes, values, skills and knowledge from daily
experience, and from the educative influence and
resources in their environment.
International Standard Classification of Education(ISCED). Classification system designed to serve as an
instrument for assembling, compiling and presenting
comparable indicators and statistics of education both
within countries and internationally. The system,
introduced in 1976, was revised in 1997 (ISCED97).
Labour force participation rate. The share of employed
plus unemployed people in comparison with the
working age population.
Least developed countries (LDCs). Low-income countries
that, according to the United Nations, have human
resource weaknesses (based on indicators of nutrition,
health, education and adult literacy) and are
economically vulnerable. The category is used to guide
donors and countries in allocating foreign assistance.
Life expectancy at birth. Approximate number of years
a newborn infant would live if prevailing patterns of
age-specific mortality rates in the year of birth were
to stay the same throughout the child’s life.
Literacy. According to UNESCO’s 1958 definition, the
term refers to the ability of an individual to read and
write with understanding a simple short statement
related to his/her everyday life. The concept of literacy
has since evolved to embrace multiple skill domains,
each conceived on a scale of different mastery levels
and serving different purposes. Many today view
literacy as the ability to identify, interpret, create,
communicate and compute, using printed and written
materials in various contexts. Literacy is a process of
learning that enables individuals to achieve personal
goals, develop their knowledge and potential, and
participate fully in the community and wider society.
A N N E X
4 1 0

Literate/illiterate. As used in the statistical tables,
the term refers to a person who can/cannot read
and write with understanding a simple statement
related to his/her everyday life.
Literate environment. The term can have at least two
meanings: (a) the availability of written, printed and
visual materials in learners’ surrounding environment,
enabling them to make use of their basic reading and
writing skills; and/or (b) the prevalence of literacy in
households and communities, enhancing the prospects
of successful literacy acquisition by learners.
Lower-secondary education (ISCED level 2). See Secondary education.
Net attendance rate (NAR). Number of pupils in the
official age group for a given level of education who
attend school in that level, expressed as a percentage
of the population in that age group.
Net enrolment ratio (NER). Enrolment of the official age
group for a given level of education, expressed as
a percentage of the population in that age group.
Net intake rate (NIR). New entrants to the first grade
of primary education who are of the official primary
school entrance age, expressed as a percentage
of the population of that age.
New entrants. Pupils entering a given level of education
for the first time; the difference between enrolment
and repeaters in the first grade of the level.
New entrants to the first grade of primary educationwith ECCE experience. Number of new entrants to
the first grade of primary school who have attended
the equivalent of at least 200 hours of organized ECCE
programmes, expressed as a percentage of the total
number of new entrants to the first grade.
Non-formal education. Learning activities typically
organized outside the formal education system. The
term is generally contrasted with formal and informal
education. In different contexts, non-formal education
covers educational activities aimed at imparting adult
literacy, basic education for out-of-school children
and youth, life skills, work skills and general culture.
Such activities usually have clear learning objectives,
but vary in duration, in organizational structure and
in conferring certification for acquired learning.
Out-of-school children. Children in the official primary
school age range who are not enrolled in either
primary or secondary school.
Post-secondary non-tertiary education (ISCED level 4).Programmes that lie between the upper secondary
and tertiary levels from an international point of view,
even though they might clearly be considered upper
secondary or tertiary programmes in a national
context. They are often not significantly more advanced
than programmes at ISCED level 3 (upper secondary)
but they serve to broaden the knowledge of students
who have completed a programme at that level. The
students are usually older than those at ISCED level 3.
ISCED 4 programmes typically last between six months
and two years.
Pre-primary education (ISCED level 0). Programmes
at the initial stage of organized instruction, primarily
designed to introduce very young children, aged at least
3 years, to a school-type environment and provide a
bridge between home and school. Variously referred
to as infant education, nursery education, pre-school
education, kindergarten or early childhood education,
such programmes are the more formal component of
ECCE. Upon completion of these programmes, children
continue their education at ISCED 1 (primary
education).
Primary cohort completion rate. The number of pupils
who complete the final year of primary school,
expressed as a percentage of the number who entered
the first year.
Primary education (ISCED level 1). Programmes
normally designed on a unit or project basis to give
pupils a sound basic education in reading, writing and
mathematics, and an elementary understanding of
subjects such as history, geography, natural sciences,
social sciences, art and music. Religious instruction
may also be featured. These subjects serve to develop
pupils’ ability to obtain and use information they need
about their home, community or country. Also known
as elementary education.
Private enrolment/institutions. Number of
pupils/students enrolled in private institutions,
that is, in institutions that are not operated by public
authorities but are controlled and managed, whether
for profit or not, by private bodies such as non-
government organizations, religious bodies, special
interest groups, foundations or business enterprises.
G L O S S A R Y
4 1 1

90
02
Education f
or A
ll G
lobal M
onitorin
g R
eport
Public enrolment/institutions. Number of students
enrolled in public institutions, that is, institutions
controlled and managed by public authorities or
agencies (national/federal, state/provincial or local),
whatever the origins of their financial resources.
Public expenditure on education. Total current and
capital expenditure on education by local, regional
and national governments, including municipalities.
Household contributions are excluded. The term covers
public expenditure for both public and private
institutions. Current expenditure includes expenditure
for goods and services that are consumed within a
given year and have to be renewed the following year,
such as staff salaries and benefits; contracted or
purchased services; other resources, including books
and teaching materials; welfare services and items
such as furniture and equipment, minor repairs, fuel,
telecommunications, travel, insurance and rent. Capital
expenditure includes expenditure for construction,
renovation and major repairs of buildings, and the
purchase of heavy equipment or vehicles.
Pupil. A child enrolled in pre-primary or primary
education. Youth and adults enrolled at more advanced
levels are often referred to as students.
Pupil/teacher ratio (PTR). Average number of pupils
per teacher at a specific level of education, based
on headcounts for both pupils and teachers.
Pupil/trained-teacher ratio. Average number of pupils
per trained teacher at a specific level of education,
based on headcounts for both pupils and trained
teachers. See also Trained teacher.
Purchasing power parity (PPP). An exchange rate
that accounts for price differences among countries,
allowing international comparisons of real output
and incomes.
Quintile. In statistics, any of five equal groups into which
a population can be divided according to the
distribution of values of a variable.
Repeaters. Number of pupils enrolled in the same
grade or level as the previous year, expressed as a
percentage of the total enrolment in that grade or level.
Repetition rate by grade. Number of repeaters in
a given grade in a given school year, expressed as a
percentage of enrolment in that grade the previous
school year.
School-age population. Population of the age group
officially corresponding to a given level of education,
whether enrolled in school or not.
School life expectancy (SLE). Number of years a child
of school entrance age is expected to spend in school
or university, including years spent on repetition.
It is the sum of the age-specific enrolment ratios
for primary, secondary, post-secondary non-tertiary
and tertiary education.
Secondary education (ISCED levels 2 and 3). Programme
made up of two stages: lower and upper secondary.
Lower secondary education (ISCED 2) is generally
designed to continue the basic programmes of the
primary level but the teaching is typically more subject-
focused, requiring more specialized teachers for each
subject area. The end of this level often coincides with
the end of compulsory education. In upper secondary
education (ISCED 3), the final stage of secondary
education in most countries, instruction is often
organized even more along subject lines and teachers
typically need a higher or more subject-specific
qualification than at ISCED level 2.
Sector-wide approach (SWAp). A development approach
in which all significant donor funding for a given sector
supports a single sector policy and expenditure
programme, under the leadership of the recipient
government. Donor support for a SWAp may take the
form of project aid, technical assistance, basket/pooled
funding or budget support. There is commonly a
commitment to progress towards reliance on
government procedures to disburse and account
for donor funds.
Stunting rate. Proportion of children in a given age
group whose height for their age is between two and
three standard deviations (moderate stunting) or three
or more standard deviations (severe stunting) below the
reference median established by the National Center
for Health Statistics and the World Health Organization.
Low height for age is a basic indicator of malnutrition.
Survival rate by grade. Percentage of a cohort of
students who are enrolled in the first grade of an
education cycle in a given school year and are expected
to reach a specified grade, regardless of repetition.
A N N E X
4 1 2

Teacher compensation. A base teaching salary plus
bonuses. Base salary refers to the minimum scheduled
gross annual salary for a full-time teacher with the
minimum training necessary to be qualified at the
beginning of his or her teaching career. Reported base
salaries are defined as the total sum of money paid
by the employer for the labour supplied, minus the
employer contribution to social and pension funding.
Bonuses that are a regular part of the annual salary,
like a thirteenth month or holiday bonus, are usually
included in the base salary.
Teachers/teaching staff. Number of persons employed
full time or part time in an official capacity to guide and
direct the learning experience of pupils and students,
irrespective of their qualifications or the delivery
mechanism (i.e. face to face and/or at a distance).
Excludes education personnel who have no active
teaching duties (e.g. headmasters, headmistresses
or principals who do not teach) and persons who work
occasionally or in a voluntary capacity.
Technical and vocational education and training (TVET).Programmes designed mainly to prepare students for
direct entry into a particular occupation or trade (or
class of occupations or trades). Successful completion
of such programmes normally leads to a labour-
market-relevant vocational qualification recognized
by the education ministry, employers’ associations or
other authorities in the country in which it is obtained.
Tertiary or higher education (ISCED levels 5 and 6).Programmes with an educational content more
advanced than what is offered at ISCED levels 3 and 4.
The first stage of tertiary education, ISCED level 5,
includes level 5A, composed of largely theoretically
based programmes intended to provide sufficient
qualifications for gaining entry to advanced research
programmes and professions with high skill
requirements; and level 5B, where programmes
are generally more practical, technical and/or
occupationally specific. The second stage of tertiary
education, ISCED level 6, comprises programmes
devoted to advanced study and original research and
leading to the award of an advanced research
qualification.
Total debt service. Sum of principal repayments and
interest paid in foreign currency, goods or services
on long-term debt, or interest paid on short-term debt,
as well as repayments (repurchases and charges)
to the International Monetary Fund.
Total fertility rate. Average number of children that
would be born to a woman if she were to live to the end
of her childbearing years (15 to 49) and bear children
at each age in accordance with prevailing age-specific
fertility rates.
Total primary net attendance rate (TNAR). Number
of pupils of the official primary school age group who
attend school in either primary or secondary education,
expressed as a percentage of the population in that
age group.
Total primary net enrolment ratio (TNER). Enrolment
of children of the official primary school age group
in either primary or secondary schools, expressed
as a percentage of the population in that age group.
Trained teacher. Teacher who has received the minimum
organized teacher training normally required for
teaching at the relevant level in a given country.
Transition rate to secondary education. New entrants
to the first grade of secondary education in a given
year, expressed as a percentage of the number of
pupils enrolled in the final grade of primary education
in the previous year.
Undernutrition/malnutrition. The condition of people
whose dietary energy intake is below that needed
to maintain a healthy life and carry out light physical
activity. Malnutrition refers to food deficiencies either
in terms of quantity or quality (lack of specific nutrients
or vitamins).
Upper-secondary education (ISCED level 3). See Secondary education.
Variance. A measure of dispersion of a given distribution.
Youth literacy rate. Number of literate persons aged 15
to 24, expressed as a percentage of the total population
in that age group.
G L O S S A R Y
4 1 3

90
02
Education f
or A
ll G
lobal M
onitorin
g R
eport
Abadzi, H. 2006. Efficient Learning for the Poor: Insights from the Frontier of Cognitive Neuroscience. Washington, DC,World Bank. (Directions in Development.)
_ 2007. Absenteeism and Beyond: Instructional Time Loss and Consequences. Washington, DC, World Bank, Independent Evaluation Group Sector, Thematic and Global Evaluation Division. (Policy Research Working Paper, 4376.)
Abkula, D. T. 2002. Jumping on the train: the pastoralist experience in Kenya’s PRSP. PPLA Notes, Vol. 43, pp. 31–3.
Abu-Duhou, I. 1999. School-Based Management. Paris, UNESCO International Institute for Educational Planning. (Fundamentals of Educational Planning, 62.)
Academy for Education Development and USAID Ethiopia. 2004. Ethiopian Second National Learning Assessment of Grade4 Students. Addis Ababa, National Organization for Examination.
Acharya, S. 2007. Social Inclusion: Gender and Equity in Education SWAps in South Asia – Nepal Case Study. Kathmandu,UNICEF Regional Office for South Asia.
Ackers, J., Migoli, J. and Nzomo, J. 2001. Identifying and addressing the causes of declining participation rates in Kenyanprimary schools. International Journal of Educational Development, Vol. 21, No. 4, pp. 361–74.
Adams, S. J. 2005. Vietnam’s Health Care System: A Macroeconomic Perspective. International Symposium on HealthCare Systems in Asia, Hitotsubashi University, Tokyo, International Monetary Fund, 21–22 January.
Adediran, S., Anyanwu, S., Foot, S., Maiyashi, T., Nwobodo, E. and Umar, A. 2008. Study of States Access to and Utilisationof Universal Basic Education Intervention Funds. Abuja, Universal Basic Education Commission, Capacity for UniversalBasic Education.
Advisory Board for Irish Aid. 2008. Final Synthesis Report. Good Governance, Aid Modalities and Poverty Reduction: FromBetter Theory to Better Practice. Dublin, Advisory Board for Irish Aid. (Good Governance, Aid Modalities and PovertyReduction: Linkages to the Millennium Development Goals and Implications for Irish Aid, Research project [RP-05-GG]of the Advisory Board for Irish Aid.)
Agüero, J. M., Carter, M. R. and Woolard, I. 2006. The Impact of Unconditional Cash Transfers on Nutrition: The SouthAfrican Child Support Grant. Washington, DC, Center for Global Development.
Ahmed, M., Ahmed, K. S., Islam Khan, N. and Ahmed, R. 2007. Access to Education in Bangladesh: Country AnalyticReview of Primary and Secondary Education. Brighton, UK/Dhaka, University of Sussex, Sussex School of Education,Centre for International Education, Consortium for Research on Educational Access, Transitions & Equity/BRACUniversity, Institute of Educational Development.
Aide et Action. 2008. Back 2 Basics – Study Report. Paris, Aide et Action.
Akyeampong, K. 2008. Public Private Partnership in the Provision of Basic Education for Poor and Disadvantaged Groupsin Ghana and Rwanda: Possibilities and Constraints. Brighton, UK, University of Sussex, Sussex School of Education,Centre for International Education. (Unpublished paper.)
Akyeampong, K., Djangmah, J., Oduro, A., Seidu, A. and Hunt, F. 2007. Access to Basic Education in Ghana: The Evidenceand the Issues. Country Analytic Report. Brighton, UK/Winneba, Ghana, University of Sussex, Sussex School ofEducation, Centre for International Education, Consortium for Research on Educational Access, Transitions &Equity/Ghana University of Education.
Al-Samarrai, S. 2007. Changes in Employment in Bangladesh, 2000–2005: The Impacts on Poverty and Gender Equity.Washington, DC, World Bank, South Asia Region. (Background paper for the Bangladesh Poverty Assessment.Draft for comments.)
Albó, X. and Anaya, A. 2003. Niños Alegres, Libres, Expresivos: La Audacia de la Educación Intercultural Bilingüe enBolivia [Children, Free, Expressive Children: The Audacity of Intercultural Bilingual Education in Bolivia]. La Paz,Centro de Investigación y Promoción del Campesinado. (Cuadernos de investigación, 59.) (In Spanish.)
Alderman, H. and King, E. M. 1998. Gender differences in parental investment in education. Structural Change andEconomic Dynamics, Vol. 9, No. 4, pp. 453–68.
Alexander, R. J. 2008. Education for All, the Quality Imperative and the Problem of Pedagogy. Brighton, UK/London,University of Sussex, Sussex School of Education, Centre for International Education, Consortium for Research onEducational Access, Transitions & Equity/University of London, Institute of Education. (CREATE Pathways to AccessResearch Monograph, 20.)
Alsop, R. and Kurey, B. 2005. Local Organizations in Decentralized Development: Their Functions and Performancein India. Washington, DC, World Bank.
A N N E X
4 1 4
References*
* All background papers for EFA Global Monitoring Report 2009 are available at www.efareport.unesco.org

Altinok, N. 2008. An international perspective on trends in the quality of learning achievement (1965–2007).Background paper for EFA Global Monitoring Report 2009.
Anderson, L. W., Ryan, D. W. and Shapiro, B. J. (eds). 1989. The IEA Classroom Environmental Study. Oxford, UK,Pergamon Press.
Andrabi, T., Das, J. and Khwaja, A. I. 2006. A Dime a Day: The Possibilities and Limits of Private Schooling in Pakistan.Washington, DC, World Bank. (Policy Research Working Paper, 4066.)
Andrabi, T., Das, J., Khwaja, A. I., Vishwanath, T., Zajonc, T. and The LEAPS Team. 2008. Pakistan. Learning andEducational Achievements in Punjab Schools (LEAPS): Insights to Inform the Education Policy Debate. Washington,DC, World Bank.
Appleton, S. and Balihuta, A. 1996. Education and agricultural productivity: evidence from Uganda. Journal of InternationalDevelopment, Vol. 8, No. 3, pp. 415–44.
Armecin, G., Behrman, J. R., Duazo, P., Ghuman, S., Gualtiano, S., King, E. M. and Lee, N. 2006. Early ChildhoodDevelopment through an Integrated Program: Evidence from the Philippines. Washington, DC, World Bank.(Policy Research Working Paper, WPS3922-IE.)
Arsen, D. and Ni, Y. 2008. The Competitive Effect of School Choice Policies on Performance in Traditional Public Schools.Tempe, Ariz./Boulder, Colo., Arizona State University, College of Education, Division of Educational Leadership andPolicy Studies, Education Policy Research Unit/University of Colorado, School of Education, Education and the PublicInterest Center.
Arze del Granado, F. J., Fengler, W., Ragatz, A. and Yavuz, E. 2007. Investing in Indonesia’s Education: Allocation, Equityand Efficiency of Public Expenditures. Washington, DC, World Bank, Poverty Reduction and Economic Managementand Human Development of the East Asia and Pacific Region. (Policy Research Working Paper, WPS4329.)
Asian Development Bank. 2007. Key Indicators 2007: Inequality in Asia. Manila, Asian Development Bank.
Aslam, M. 2007. The Relative Effectiveness of Government and Private Schools in Pakistan: Are Girls Worse Off?Cambridge, UK, University of Cambridge, Faculty of Education, Research Consortium on Education Outcomesand Poverty. (RECOUP Working Paper, WP07/04.)
Aslam, M., Kingdon, G. and Söderbom, M. Forthcoming. Is education a path to gender equality in the labor market?Evidence from Pakistan. World Bank (ed.), Education as a Path to Gender Equality. Washington, DC, World Bank.
Ayyar, R. V. V. 2008. Country-agency relationship in development cooperation: an Indian experience. Background paperfor EFA Global Monitoring Report 2009.
Azevedo de Aguiar, G., Barker, G., Nascimento, M. and Segundo, M. 2007. Early Childhood in Brazil: General Overviewand Current Issues. The Hague, Bernard van Leer Foundation. (Working Papers in Early Childhood Development, 44.)
Baines, S. 2005. Controlling Corruption: Lessons from the School Improvement Grants Program in Indonesia.International Conference ‘Education Finance and Decentralization’, Washington, DC, World Bank, 13–14 January.
Baker, D. P., Goesling, B. and LeTendre, G. K. 2002. Socioeconomic status, school quality and national economicdevelopment: a cross-national analysis of the ‘Heyneman-Loxley effect’ on mathematics and science achievement.Comparative Education Review, Vol. 46, No. 3, pp. 291–312.
Baker, D. P. and Jones, D. P. 1993. Creating gender equality: cross-national gender stratification and mathematicperformance. Sociology of Education, Vol. 66, No. 2, pp. 91–103.
Banerjee, A. V., Banerji, R., Duflo, E., Glennerster, R. and Khemani, S. 2006. Can Information Campaigns Spark LocalParticipation and Improve Outcomes? A Study of Primary Education in Uttar Pradesh, India. Washington, DC,World Bank. (Policy Research Working Paper, 3967.)
_ 2008. Pitfalls of Participatory Programs: Evidence from a Randomized Evaluation in Education in India. Washington, DC, World Bank, Development Research Group, Human Development and Public Services Team. (Impact Evaluation Series, 21. Policy Research Working Paper, 4584.)
Bangladesh Bureau of Educational Information and Statistics. 2006. Key Educational Indicators. Dhaka, Bureau ofEducational Information and Statistics. http://www.banbeis.gov.bd/db_bb.htm (Accessed 19 September 2008.)
Bangladesh Bureau of Statistics and UNICEF. 2007. Bangladesh Multiple Indicator Cluster Survey: Progotir Pathey 2006.Volume I: Technical Report. Dhaka, Ministry of Planning, Planning Division, Bangladesh Bureau of Statistics/UNICEF.(Monitoring the Situation of Children and Women.)
Bano, M. 2007. Pakistan country case study. Background paper for EFA Global Monitoring Report 2008.
_ 2008. Public Private Partnerships (PPPs) as ‘anchor’ of educational reforms: lessons from Pakistan.Background paper for EFA Global Monitoring Report 2009.
Barber, N. 2006. Is the effect of national wealth on academic achievement mediated by mass media and computers?Cross-Cultural Research, Vol. 40, No. 2, pp. 130–51.
Barro, R. J. and Lee, J.-W. 2000. International Data on Educational Attainment Updates and Implications.Cambridge, Mass., National Bureau of Economic Research. (Working Paper, 7911.)
R E F E R E N C E S
4 1 5

90
02
Education f
or A
ll G
lobal M
onitorin
g R
eport
Bedard, K. and Cho, I. 2007. The Gender Test Score Gap Across OECD Countries. Santa Barbara, Calif., Universityof California, Santa Barbara, Department of Economics.
Behrman, J. R., Birdsall, N. and Szekely, M. 2003. Economic Policy and Wage Differentials in Latin America.Washington, DC, Center for Global Development. (Working Paper, 29.)
Behrman, J. R. and Hoddinott, J. 2005. Programme evaluation with unobserved heterogeneity and selectiveimplementation: the Mexican Progresa impact on child nutrition. Oxford Bulletin of Economics and Statistics,Vol. 67, No. 4, pp. 547–69.
Behrman, J. R., Parker, S. W. and Todd, P. E. 2004. Medium-Term Effects of the Oportunidades Program Package,Including Nutrition, on Education of Rural Children Age 0–8 in 1997. Philadelphia, Penn., University of Pennsylvania.(Technical Document Number 9 on the Evaluation of Oportunidades 2004.)
Belfield, C. R. 2007. Introduction to the special issue ‘The Economics of Early Childhood Education’.Economics of Education Review, Vol. 26, No. 1, pp. 1–2.
Bellei, C. 2005. The Private-Public School Controversy: The Case of Chile. Conference on ‘Mobilizing the Private Sectorfor Public Education’, Cambridge, Mass., Harvard University, Kennedy School of Government, Program on EducationPolicy and Governance/World Bank, 5–6 October.
Benavot, A. and Tanner, E. 2007. The growth of national learning assessments in the world, 1995–2006. Backgroundpaper for EFA Global Monitoring Report 2008.
Bennell, P. 1998. Rates of return to education in Asia: a review of the evidence. Education Economics, Vol. 6, No. 2, pp. 107–20.
_ 2005a. The impact of the AIDS epidemic on the schooling of orphans and other directly affected children in sub-Saharan Africa. Journal of Development Studies, Vol. 41, No. 3, pp. 467-88.
_ 2005b. Teacher Mortality in sub-Saharan Africa: An Update. Brighton, UK, Knowledge and Skills for Development.
_ 2006. Anti-Retroviral Drugs are Driving Down Teacher Mortality in sub-Saharan Africa. Brighton, UK, Knowledgeand Skills for Development.
Bennell, P. and Akyeampong, K. 2007. Teacher Motivation in sub-Saharan Africa and South Asia. London, UK Departmentfor International Development, Central Research Department. (Educational Papers. Researching the Issues, 71.)
Bennell, P., Anyanwu, S., Ayara, N., Ayuba, A., Aigbokhan, B., Bashir, Y., Chete, L., Dandago, K., Jimoh, A., Muhammed, M.,Oladeji, S., Onyukwu, O., Sagagi, M. and Tella, S. 2007. Nigeria: Education Public Expenditure Review. A Synthesis ofthe Main Findings and Recommendations from Nine State Reports. Brighton, UK, University of Sussex, Sussex Schoolof Education, Centre for International Education. (First draft.)
Benson, T. 2004. Africa's Food and Nutrition Security Situation: Where Are We and How Did We Get Here?Washington, DC, International Food Policy Research Institute. (2020 Discussion Paper, 37.)
Bentaouet-Kattan, R. 2005. Primary school fees: an update. Background paper for EFA Global Monitoring Report 2006.
Benveniste, L. 2002. The political structuration of assessment: negotiating state power and legitimacy.Comparative Education Review, Vol. 46, No. 1, pp. 89–118.
Benveniste, L., Marshall, J. and Santibañez, L. 2008. Teaching in Lao PDR. Washington, DC/Vientiane, World Bank, EastAsia and the Pacific Region, Human Development Sector/Lao People’s Democratic Republic Ministry of Education.
Berlinski, S., Galiani, S. and Gertler, P. J. 2006. The Effect of Pre-Primary Education on Primary School Performance.London, Institute for Fiscal Studies. (Working Paper, 06/04.)
Bernard, J. M. and Michaelowa, K. 2006. How can countries use cross-national research results to address ‘the big policyissues’? Ross, K. N. and Genevois, I. J. (eds), Cross-National Studies of the Quality of Education: Planning Their Designand Managing Their Impact. Paris, UNESCO International Institute for Educational Planning.
Berry, C. 2007. Education Aid in Fragile States: Delivering It Effectively. London, Overseas Development Institute,Strategic Policy Impact and Research Unit. (Briefing Paper, 1.)
Bicego, G. T., Rutstein, S. and Johnson, K. 2003. Dimensions of the emerging orphan crisis in sub-Saharan Africa.Social Science & Medicine, Vol. 56, No. 6, pp. 1235–47.
Bird, R. M. and Smart, M. 2001. Intergovernmental Fiscal Transfers: Some Lessons from International Experience.Toronto, Ont., University of Toronto, Rotman School of Management, International Tax Program.
Bjork, C. 2004. Decentralisation in education, institutional culture and teacher autonomy in Indonesia.International Review of Education, Vol. 50, No. 3-4, pp. 245–62.
Björklund, A., Edin, P.-A., Fredriksson, P. and Krueger, A. 2004. Education, Equality and Efficiency – An Analysis ofSwedish School Reforms During the 1990s. Uppsala, Sweden, Institute for Labour Market Policy Evaluation.
Black, R. 2004. Migration and Pro-Poor Policy in Africa. Brighton, UK, University of Sussex, Development Research Centreon Migration, Globalisation and Policy. (Working Paper, C6.)
Black, R. E., Allen, L. H., Bhutta, Z. A., Caulfield, L. E., de Onis, M., Ezzati, M., Mathers, C. and Rivera, J. 2008. Maternaland child undernutrition: global and regional exposures and health consequences. The Lancet, Vol. 371, No. 9608,pp. 243–60. (Maternal and Child Undernutrition 1)
A N N E X
4 1 6
Blondiaux, M., Diallo, A., Diallo, M. K., Diallo, F. K., Dramé, M. B., Fernandez, S., Sow, A., Tinguiano, J. S. and Traoré, G.2006. Les Compétences des Elèves de 4A en Compréhension des Textes Ecrits [Grade 4A Pupils' Competencies inComprehension of Written Texts]. Conakry, Guinea Ministry of Education, National Education Systems CoordinationUnit. (In French.)
Bloom, D. E. 2006. Measuring global educational progress. Cohen, J. E., Bloom, D. E. and Malin, M. B. (eds), Educating AllChildren: A Global Agenda. Cambridge, Mass., American Academy of Arts and Sciences/MIT Press, pp. 33–120.
Blumberg, R. L. 2007. Gender bias in textbooks: a hidden obstacle on the road to equality in education. Background paperfor EFA Global Monitoring Report 2008.
Böhlmark, A. and Lindahl, M. 2007. The Impact of School Choice on Pupil Achievement, Segregation and Costs:Swedish Evidence. Bonn, Germany, Institute for the Study of Labor. (IZA Discussion Paper, 2786.)
Bonnet, G. 2007. What do recent evaluations tell us about the state of teachers in sub-Saharan countries?Background paper for EFA Global Monitoring Report 2008.
Booth, D. and Curran, Z. 2005. Developing the Empirical Evidence for DFID’s Strategy on Exclusion: Aid Instrumentsand Exclusion. London, Overseas Development Institute.
Bosnia and Herzegovina Directorate for Economic Planning, Republika Srpska Ministry of Health and Social Welfare,Bosnia and Herzegovina Ministry of Health, UNICEF and DFID. 2007. Bosnia and Herzegovina: Multiple IndicatorCluster Survey 2006. Sarajevo, Directorate for Economic Planning/Ministry of Health and Social Welfare/Ministryof Health/UNICEF/DFID. (Monitoring the Situation of Children and Women.)
Bossert, T. J., Larrañaga, O., Giedion, U., Arbelaez, J. J. and Bowser, D. M. 2003. Decentralisation and equity of resourceallocation: evidence from Colombia and Chile. Bulletin of the World Health Organization, Vol. 81, No. 2, pp. 95–100.
Bourguignon, F. 2000. Can Redistribution Accelerate Growth and Development? ABCDE Europe, Paris, 26–28 June.
Bracho, T. 2006. Evaluación Externa del Programa Escuelas de Calidad (PEC) 2006–2007 [External Evaluation ofthe Quality Schools Programme (PEC) 2006–2007]. México, DF, Centro de Investigación y Docencia Económicas,División de Administración Pública. (In Spanish.)
Bradshaw, J. and Finch, N. 2002. A Comparison of Child Benefit Packages in 22 Countries. Huddersfield, UK,UK Department for Work and Pensions. (Research Report, 174.)
Bray, M. 2003. Adverse Effects of Private Supplementary Tutoring: Dimensions, Implications and Government Responses.Paris, UNESCO International Institute for Educational Planning.
Breman, J. G., Mills, A., Snow, R. W., Mulligan, J.-A., Lengeler, C., Mendis, K., Sharp, B., Morel, C., Marchesini, P., White,N. J., Steketee, R. W. and Doumbo, O. K. 2006. Conquering malaria. Jamison, D. T., Breman, J. G., Measham, A. R.,Alleyne, G., Claeson, M., Evans, D. B., Jha, P., Mills, A. and Musgrove, P. (eds), Disease Control Priorities in DevelopingCountries, 2nd edn. Washington, DC/New York, World Bank/Oxford University Press, pp. 413–21.
Briggs, K. L. and Wohlstetter, P. 2003. Key elements of a successful school-based management strategy.School Effectiveness and School Improvement, Vol. 14, No. 3, pp. 351–72.
Bruneforth, M. 2008. Interpreting the distribution of out-of-school children by past and expected future school enrolment.Background paper for EFA Global Monitoring Report 2009.
Bruns, B., Mingat, A. and Rakotomalala, R. 2003. Achieving Universal Primary Education by 2015: A Chance for EveryChild. Washington, DC, World Bank.
Burd-Sharps, S., Lewis, K. and Borges Martins, E. 2008. The Measure of America: American Human Development Report,2008–2009. New York, Columbia University Press.
Burkina Faso Ministry of Economy and Development. 2004. Poverty Reduction Strategy Paper. Ouagadougou,Ministry of Economy and Development.
Burkina Faso Ministry of Economy and Finance. 2000. Poverty Reduction Strategy Paper. Ouagadougou,Ministry of Economy and Finance.
Caillods, F. and Hallak, J. 2004. Education and PRSPs: A Review of Experiences. Paris, UNESCO International Institutefor Educational Planning.
Caldwell, B. J. 2005. School-Based Management. Brussels/Paris, International Academy of Education/UNESCOInternational Institute for Educational Planning. (Education Policy Series, 3.)
Cambodia Council for Social Development. 2002. National Poverty Reduction Strategy 2003–2005. Phnom Penh,Council for Social Development.
Cambodia Education Sector Support Project. 2006. Student Achievement and Education Policy: Results fromthe Grade Three Assessment. Phnom Penh, Ministry of Education.
Cambodia Government. 2005. National Strategic Development Plan 2006–2010. Phnom Penh, Government of Cambodia.
Cambodia Ministry of Education, Youth and Sports and Interdepartmental Committee on HIV/AIDS. 2007. HIV/AIDS in theEducation Sector in Cambodia: Fact Sheet 1. Phnom Penh, Ministry of Education, Youth and Sports/InterdepartmentalCommittee on HIV/AIDS.
R E F E R E N C E S
4 1 7

90
02
Education f
or A
ll G
lobal M
onitorin
g R
eport
Cárdenas, S. 2008. School based management in Latin America. Background paper for EFA Global Monitoring Report 2009.
Carnoy, M., Brodziak, I., Molina, A. and Socias, M. 2007. The limitations of teacher pay incentive programs based on inter-cohort comparisons: the case of Chile's SNED. Education Finance and Policy, Vol. 2, No. 3, pp. 189–227.
Carnoy, M., Gove, A. K., Loeb, S., Marshall, J. H. and Socias, M. 2008. How schools and students respond to schoolimprovement programs: the case of Brazil's PDE. Economics of Education Review, Vol. 27, No. 1, pp. 22–38.
Carnoy, M., Jacobsen, R., Mishel, L. and Rothstein, R. 2005. The Charter School Dust-Up: Examining the Evidence onEnrollment and Achievement. Washington, DC/New York, Economic Policy Institute/Teachers College Press.
Carr, M., Jessup, D. L. and Fuller, D. 1999. Gender differences in first-grade mathematic strategy use: parent and teachercontributions. Journal for Research in Mathematics Education, Vol. 30, No. 1, pp. 28–57.
Carr-Hill, R. 2005. Analyses of literacy data. Background paper for EFA Global Monitoring Report 2006.
Carroli, G., Rooney, C. and Villar, J. 2001. How effective is antenatal care in preventing maternal mortality and seriousmorbidity? An overview of the evidence. Paediatric & Perinatal Epidemiology, Vol. 15, Supplement 1, pp. 1–42.
Case, A., Hosegood, V. and Lund, F. 2005. The reach and impact of child support grants: evidence from KwaZulu-Natal.Development Southern Africa, Vol. 22, No. 4, pp. 467–82.
Castello-Climent, A. 2006. On the Distribution of Education and Democracy. Valencia, Spain, University of Valencia,International Economics Institute.
Center on Education Policy. 2007. Answering the Question That Matters Most: Has Student Achievement Increased SinceNo Child Left Behind? Washington, DC, Center on Education Policy.
Chakrabarti, R. 2007. Can Increasing Private School Participation and Monetary Loss in a Voucher Program Affect Public SchoolPerformance? Evidence from Milwaukee. New York, Federal Reserve Bank of New York. (FRBNY Staff Reports, 300.)
Chandani, T., Balan, J., Smith, M. and Donahue, M. 2007. Strengthening the Private Basic Education Sector:A Case for USAID Support and Financing through the Development Credit Authority. New York, Banyan Global.
Chapman, D. W., Weidman, J., Cohen, M. and Mercer, M. 2005. The search for quality: a five country study of nationalstrategies to improve educational quality in Central Asia. International Journal of Educational Development, Vol. 25,No. 5, pp. 514–30.
Chaudhury, N., Hammer, J., Kremer, M., Muralidharan, K. and Rogers, F. H. 2006. Missing in action: teacher and healthworker absence in developing countries. Journal of Economic Perspectives, Vol. 20, No. 1, pp. 91–116.
Chinyama, V. 2006. Kenya’s Abolition of School Fees Offers Lessons for Rest of Africa. Nairobi, UNICEF Kenya.http://www.unicef.org/infobycountry/kenya_33391.html
Choudhry, M. A. 2005. Pakistan: where and who are the world’s illiterates? Background paper for EFA Global MonitoringReport 2006.
Chronic Poverty Research Centre. 2008. The Chronic Poverty Report 2008-09: Escaping Poverty Traps. Manchester, UK,University of Manchester, School of Environment and Development, Institute for Development Policy and Management,Chronic Poverty Research Centre.
Clark, D. and Bundy, D. 2004. The EFA Fast-Track Initiative: Responding to the Challenge of HIV and AIDS to the EducationSector. London/Washington, DC, UK Department for International Development/World Bank.
_ 2006. The EFA Fast Track Initiative: An Assessment of the Responsiveness of Endorsed Education Sector Plans to HIVand AIDS. New York, UNICEF Inter-Agency Task Team on Children and HIV and AIDS.
Colclough, C. 2007. Global Gender Goals and the Construction of Equality: Conceptual Dilemmas and Policy Practice.Cambridge, UK/London, University of Cambridge, Faculty of Education, Research Consortium on EducationalOutcomes and Poverty/UK Department for International Development. (RECOUP Working Paper, WP07/02.)
Commonwealth Education Fund. 2007. Funding Change: Sustaining Civil Society Advocacy in Education. London,Commonwealth Education Fund.
Contreras, D. 2001. Evaluating a Voucher System in Chile: Individual, Family and School Characteristics. Santiago,Universidad de Chile, Departamento de Economía. (Documento de Trabajo, 175.)
Côte d’Ivoire National Institute of Statistics. 2007. Enquête à indicateurs multiples, Côte d’Ivoire 2006, Rapport final[Multiple Indicator Cluster Survey, Côte d'Ivoire 2006, Final Report]. Abidjan, Côte d’Ivoire, Ministry of State, Ministryof Planning and of Development, National Institute of Statistics. (In French.)
Council of the European Union. 2008. The EU as a Global Partner for Pro-Poor and Pro-Growth Development:EU Agenda for Action on MDGs. Brussels, Council of the European Union. (11096/08.)
Creemers, B. 1997. Effective Schools and Effective Teachers: An International Perspective. Coventry, UK, Universityof Warwick, Centre for Cultural Policy Studies, Centre for Research in Elementary and Primary Education.(CREPE Occasional Papers, 4.)
Crouch, L. 2006. Education sector: standards, accountability and support. Cotlear, D. (ed.), A New Social Contract for Peru:An Agenda for Improving Education, Health Care and the Social Safety Net. Washington, DC, World Bank, pp. 71–105.(A World Bank Country Study.)
A N N E X
4 1 8

Crouch, L. and Winkler, D. 2007. Governance, management and financing of Education for All: basic frameworks and casestudies. Background paper for EFA Global Monitoring Report 2009 (through Research Triangle Institute).
Das, J., Pandey, P. and Zajonc, T. 2006. Learning Levels and Gaps in Pakistan. Washington, DC, World Bank.(Policy Research Working Paper, WPS4067.)
Das, J. and Zajonc, T. 2008. India Shining and Bharat Drowning: Comparing Two Indian States to the WorldwideDistribution in Mathematics Achievement. Washington, DC, World Bank, Development Research Group, HumanDevelopment and Public Services Team. (Policy Research Working Paper, WPS4644.)
De Grauwe, A. 2008. The role of monitoring and evaluation systems for education quality improvements for all.Background paper for EFA Global Monitoring Report 2009.
De Grauwe, A., Lugaz, C., Baldé, D., Diakhaté, C., Dougnon, D., Moustapha, M. and Odushina, D. 2005.Does decentralization lead to school improvement? Findings and lessons from research in West-Africa.Journal of Education for International Development Vol. 1, No. 1. http://www.equip123.net/JEID/articles/1/1-1.pdf(Accessed 4 August 2008.)
de Heus, M., Dronkers, J. and Levels, M. 2008. Educational Systems as a Resource or Hindrance for Immigrants?The Effects of Educational System Characteristics of Both Countries of Origin and Destination on the Scientific Literacyof Immigrant Children in Western Countries. RC28 Spring Meeting 2008 'Social Stratification and Insiders/Outsiders:Cross-National Comparisons within and between Continents' and 'Dutch-Fleming Meeting of Sociology 2008',Florence, Italy/Leuven, Belgium, European University Institute, 15–18 May/29 May.
de Janvry, A., Finan, F., Sadoulet, E. and Vakis, R. 2006a. Can conditional cash transfer programs serve as safety netsin keeping children at school and from working when exposed to shocks? Journal of Development Economics, Vol. 79,No. 2, pp. 349–73.
de Janvry, A., Sadoulet, E., Solomon, P. and Vakis, R. 2006b. Uninsured Risk and Asset Protection: Can Conditional CashTransfer Programs Serve as Safety Nets? Washington, DC, World Bank. (Social Protection Discussion Paper, 0604.)
de Mello, L. and Hoppe, M. 2005. Education Attainment in Brazil: The Experience of FUNDEF. Paris, Organisation forEconomic Co-operation and Development. (OECD Economics Department Working Paper, ECO/WKP[2005]11.)
De Renzio, P., Booth, D., Rogerson, A. and Curran, Z. 2005. Incentives for Harmonisation and Alignment in Aid Agencies.London, Overseas Development Institute.
Deaton, A. and Drèze, J. 2008. Nutrition in India: Facts and Interpretations. Princeton, NJ/Allahabad, India, PrincetonUniversity, Research Program in Development Studies, Center for Health and Wellbeing/Allahabad University,Department of Economics.
Denny, K., Harmon, C. and O’Sullivan, V. 2003. Education, Earnings and Skills: A Multi-Country Comparison. London,Institute for Fiscal Studies. (WP04/08.)
DFID. 2006. Eliminating World Poverty. Making Governance Work for the Poor. London, UK Department for InternationalDevelopment.
DFID and VSO. 2008. Listening to Teachers: The Motivation and Morale of Education Workers in Mozambique. London, UK Department for International Development/Voluntary Service Overseas.
Di Gropello, E. 2006. A Comparative Analysis of School-Based Management in Central America. Washington, DC,World Bank. (Working Paper, 72.)
Di Gropello, E. and Marshall, J. H. 2005. Teacher effort and schooling outcomes in rural Honduras. Vega, E. (ed.),Incentives to Improve Teaching: Lessons from Latin America. Washington, DC, World Bank, pp. 307–59.(Directions in Development.)
Diagne, A. W. 2008. Préparation du Document de Politique de Formation des Enseignants de l'Education Non Formelle:Analyse de la Situation de la Formation des Enseignants du Non Formel dans les Pays LIFE [Preparation of the Non-Formal Education Teachers Policy Document: Analysis of the Situation Regarding Trainning of Non-Formal EducationTeachers in LIFE Countries]. Dakar, UNESCO Teacher Training Initiative for Sub-Saharan Africa. (In French.)
Dikhanov, Y. 2005. Human Development Report 2005: Trends in Global Income Distribution, 1970–2000, and Scenarios for2015. New York, United Nations Development Program, Human Development Report Office. (Occasional Paper, 2005/8.)
Dominican Republic Secretary of State for Economy Planning and Development. 2008. Encuesta Nacional de Hogaresde Propósitos Múltiples (ENHOGAR 2006): Informe General [National Household Multiple Indicator Cluster Survey(ENHOGAR 2006): General Findings]. Santo Domingo, Secretary of State for Economy Planning and Development,National Statistics Office, Census and Surveys Manager's Office, Department of Surveys/UNICEF. (In Spanish.)
Downey, D. B. 1994. The school performance of children from single-mother and single-father families: economicor interpersonal deprivation? Journal of Family Issues, Vol. 15, No. 1, pp. 129–47.
Dronkers, J. and Robert, P. 2008. Differences in scholastic achievement of public, private government-dependentand private independent schools: a cross-national analysis. Educational Policy, Vol. 22, No. 4, pp. 541–77.
Duflo, E., Hanna, R. and Ryan, S. 2007. Monitoring Works: Getting Teachers to Come to School. Boston, Mass./Paris/ New York, Department of Economics and Poverty Action Lab, Massachusetts Institute of Technology/Wagner Schoolof Public Service, New York University and Poverty Action Lab.
R E F E R E N C E S
4 1 9

90
02
Education f
or A
ll G
lobal M
onitorin
g R
eport
Dumay, X. and Dupriez, V. 2007. Accounting for class effect using the TIMSS 2003 8th grade database: net effectof group composition, net effect of class processes and joint effect. School Effectiveness and School Improvement,Vol. 18, No. 4, pp. 383–408.
Duncan, G. J. and Brooks-Gunn, J. (eds). 1997. Consequences of Growing Up Poor. New York, Russell Sage Foundation.
Dunne, M., Akyeampong, K. and Humphreys, S. 2007. School Processes, Local Governance and Community Participation:Understanding Access. Brighton, UK, University of Sussex, Sussex School of Education, Centre for InternationalEducation, Consortium for Research on Educational Access, Transitions & Equity. (CREATE Pathways to AccessResearch Monograph, 6.)
Dutch Coalition on Disability and Development. 2006. All Equal, All Different. Inclusive Education: A DCDD Publicationabout Education for All. Utrecht, Netherlands, Dutch Coalition on Disability and Development. (Towards an InclusivePolicy. A DCDD Publication Series on Integrating Disability in Policy and Practice.)
Duthilleul, Y. 2005. Lessons Learnt in the Use of 'Contract' Teachers. Paris, UNESCO International Institutefor Educational Planning.
Education Commission of the States. 2008. ECS State Policies for Charter Schools Database. Denver, Colo.,Education Commission of the States. http://www.ecs.org/html/educationIssues/CharterSchools/CHDB_intro.asp
Education Policy and Data Center. 2008a. 2008 series of education projections to 2015 and 2025. Background paperfor EFA Global Monitoring Report 2009.
_ 2008b. Efficiency: pupil performance and age. A study of promotion-, repetition-, and dropout rates among pupilsin four age-groups in 35 developing countries. Background paper for EFA Global Monitoring Report 2009.
Education Support Program. 2006. Education in a Hidden Marketplace: Monitoring of Private Tutoring. Budapest,Open Society Institute, Education Support Program.
Educational Research Network for West and Central Africa and USAID. 2002. A Transnational View of Basic Education:Issues of Access, Quality, and Community Participation in West and Central Africa. Washington, DC,ERNWACA/USAID, Office of Sustainable Development, Support for Analysis and Research in Africa (SARA) Project.
Edward, M. and Michael, K. 2004. Worms: identifying impacts on education and health in the presence of treatmentexternalities. Econometrica, Vol. 72, No. 1, pp. 159–217.
Egypt Ministry of Education. 2006. Critical Thinking Achievement and Problem-Solving (CAPS) Test: Baseline 2006 Report.Cairo, Ministry of Education, National Center for Examinations and Educational Evaluation, Education ReformProgramme/USAID.
Ekwè, D. 2007. Vincent Bikono: Contract Worker and Not Proud of It. UNESCO Courier, No. 10.http://portal.unesco.org/en/ev.php-URL_ID=41199&URL_DO=DO_TOPIC&URL_SECTION=201.html(Accessed 11 August 2008.)
El-Zanaty, F. and Gorin, S. 2007. Egypt Household Education Survey 2005–06. Cairo, El-Zanaty and Associates/MacroInternational Inc.
Elacqua, G. 2004. School Choice in Chile: An Analysis of Parental Preferences and Search Behavior. New York,Columbia University, National Center for the Study of Privatization in Education.
Ellis, S. 2006. EFA Goal 3: some initial concepts. Background paper for EFA Global Monitoring Report 2006.
Epple, D., Figlio, D. and Romano, R. 2004. Competition between private and public schools: testing stratificationand pricing predictions. Journal of Public Economics, Vol. 88, No. 7-8, pp. 1215–45.
Espínola, V. 2000. Regional. Autonomía Escolar: Factores que Contribuyen a una Escuela Más Efectiva [Regional. School Autonomy: Contributing Factors for a More Effective School]. Washington, DC, Banco Interamericanode Desarrollo, Departamento Regional de Operaciones, División de Programas Sociales. (In Spanish.)
Ethiopia Ministry of Finance and Economic Development. 2002. Ethiopia: Sustainable Development and Poverty ReductionProgram (SDPRP). Addis Ababa, Ministry of Finance and Economic Development.
_ 2006. Ethiopia: Building on Progress. A Plan for Accelerated and Sustained Development to End Poverty (PASDEP)2005/6–2009/10. Addis Ababa, Ministry of Finance and Economic Development.
_ 2007. Ethiopia: Building on Progress. A Plan for Accelerated and Sustained Development to End Poverty (PASDEP).Annual Progress Report 2006/07. Addis Ababa, Ministry of Finance and Economic Development.
European Commission. 2007a. The European Labor Force Survey 2006. Brussels, European Commission.http://circa.europa.eu/irc/dsis/employment/info/data/eu_lfs/index.htm (Accessed 27 September 2008.)
_ 2007b. More and Better Aid to Education. A Discussion Paper for the Meeting of the European Experts of the EUMember States, Norway and Switzerland, Brussels, European Commission, 7 November.
Evans, G. and Rose, P. 2007a. Education and Support for Democracy in sub-Saharan Africa: Testing Mechanismsof Influence. Paper presented at 'The Micro-Foundations of Mass Politics in Africa', East Lansing, Mich., MichiganState University, 12–13 May.
_ 2007b. Support for democracy in Malawi: does schooling matter? World Development, Vol. 35, No. 5, pp. 904–19.
A N N E X
4 2 0

Ezeamama, A. E., Friedman, J. F., Acosta, L. P., Bellinger, D. C., Langdon, G. C., Manalo, D. L., Olveda, R. M., Kurtis, J. D.and McGarvey, S. T. 2005. Helminth infection and cognitive impairment among Filipino children. The American Journalof Tropical Medicine and Hygiene, Vol. 72, No. 5, pp. 540–8.
Farah, M. J., Noble, K. G. and Hurt, H. 2005. Poverty, privilege and brain development: empirical findings and ethicalimplications. Illes, J. (ed.), Neuroethics: Defining the Issues in Theory, Practice and Policy. New York, Oxford UniversityPress.
Fernald, L. C., Gertler, P. J. and Neufeld, L. M. 2008. Role of cash in conditional cash transfer programmes for childhealth, growth, and development: an analysis of Mexico’s Oportunidades. The Lancet, Vol. 371, No. 9615, pp. 828–37.
Fernando, S. D., Gunawardena, D. M., Bandara, M. R. S. S., De Silva, D., Carter, R., Mendis, K. N. and Wickremasinghe, A. R.2003. The impact of repeated malaria attacks on the school performance of children. American Journal of TropicalMedicine and Hygiene, Vol. 69, No. 6, pp. 582–8.
Filmer, D. 2008. Disability, poverty, and schooling in developing countries: results from 14 household surveys.Economic Review, Vol. 22, No. 1, pp. 141–63.
Filmer, D., Hasan, A. and Pritchett, L. 2006. A Millennium Learning Goal: Measuring Real Progress in Education.Washington, DC, Center for Global Development. (Working Paper, 97.)
Filmer, D. and Pritchett, L. 1999. The effect of household wealth on educational attainment: evidence from 35 countries.Population and Development Review, Vol. 25, No. 1, pp. 85–120.
Financial Management Reform Programme. 2005. Social Sector Performance Surveys. Secondary Educationin Bangladesh: Assessing Service Delivery. Oxford, UK, Oxford Policy Management.
_ 2006a. Primary Education in Bangladesh: Assessing Service Delivery. Dhaka, Oxford Policy Management. (Final report.)
_ 2006b. Social Sector Performance Surveys: Primary Education in Bangladesh: Assessing Service Delivery.Dhaka, Oxford Policy Management.
Flores-Crespo, P. 2007. Ethnicity, identity and educational achievement in Mexico. International Journal of EducationalDevelopment, Vol. 27, No. 3, pp. 331–9.
Fomba, C. O. 2006. Evaluation du Niveau d’acquisition en Français, en Mathématiques et en Sciences des Elèves desEcoles Traditionnelles du Cycle de Base 1 [Evaluation of Achievement Level in French, Mathematics and Sciencesof Students in Traditional Basic Cycle 1 Schools]. Niamey, Niger Ministry of Basic Education and Literacy, Examsand Examinations Evaluation Direction, Division of Evaluation and Monitoring of Student Achievement. (In French.)
Forum on China-Africa Cooperation. 2006. Action plan adopted at China-Africa summit, mapping cooperation course.Beijing Summit & Third Ministerial Conference of Forum on China-Africa Cooperation.http://english.focacsummit.org/2006-11/05/content_5167.htm (Accessed 17 July 2008.)
Forum on Educational Accountability. 2004. Joint Organizational Statement on No Child Left Behind (NCLB) Act.October 21, 2004 (List of 144 Signers Updated April 8, 2008), Forum on Educational Accountability.http://www.edaccountability.org/Joint_Statement.html (Accessed 19 September 2008.)
Foster, M. 2008. Achieving Quality Primary Education For All By 2015: What More Could the UK Government Do?A study for the Global Campaign for Education UK. Chelmsford, UK, Mick Foster Economics Ltd.
France Ministry of External and European Affairs. 2008. Déclarations Officielles de politique étrangère. Sommet Franco-Britannique: Declaration Finale [Official External Policy Statement. Anglo French Summit: Final Declaration].Bulletin of Current Affairs, No. 1 April.https://pastel.diplomatie.gouv.fr/editorial/actual/ael2/bulletin.asp?liste=20080401.html&xtor=EPR-7#Chapitre1(Accessed 16 July 2008.) (In French)
Fraser, A. 2006. Aid-Recipient Sovereignty in Historical Perspective. Oxford, UK, The University of Oxford & UniversityCollege, The Global Economic Governance Programme.
Fredriksen, B. 2007. School Grants: One Efficient Instrument to Address Key Barriers to Attaining Education for All.Capacity Development Workshop 'Country Leadership and Implementation for Results in the EFA FTI Partnership',Cape Town, South Africa, 16–19 July.
FTI Secretariat. 2006. Education For All Fast Track Initiative: Analysis of Official Development Assistance. Washington, DC,Fast Track Initiative Secretariat.
_ 2007a. Catalytic Fund Beneficiary Countries Implementation Progress Report. An Update. Washington, DC, Fast TrackInitiative Secretariat.
_ 2007b. Quality Assurance in the Fast Track Initiative. Washington, DC, Fast Track Initiative Secretariat.
_ 2008. Education Sector Survey 2008. Synthesis Report – Final Draft August 2008. Washington, DC, Fast Track InitiativeSecretariat.
Fuchs, T. and Wößmann, L. Forthcoming. What accounts for international differences in student performance? A re-examination using PISA data. Empirical Economics, Vol. 32, No. 3, pp. 433–64.
Fuller, B. 1987. What school factors raise achievement in the third world? Review of Educational Research, Vol. 57, No. 3, pp. 255–92.
R E F E R E N C E S
4 2 1

90
02
Education f
or A
ll G
lobal M
onitorin
g R
eport
Fuller, B. and Clarke, P. 1994. Raising school effects while ignoring culture? Local conditions and the influenceof classroom tools, rules and pedagogy. Review of Educational Research, Vol. 64, No. 1, pp. 119–57.
Fuller, B. and Rivarola, M. 1998. Nicaragua's Experiment to Decentralize Schools: Views of Parents, Teachers andDirectors. Washington, DC, World Bank, Development Economics Research Group. (Working Paper Series on ImpactEvaluation of Education Reforms, 5.)
Galiani, S., Gertler, P. and Schargrodsky, E. Forthcoming. School decentralization: helping the good get better,but leaving the poor behind. Journal of Public Economics.
Gambia Bureau of Statistics. 2007. The Gambia Multiple Indicator Cluster Survey 2005/2006 Report. Banjul, Bureauof Statistics/UNICEF/World Bank.
Gambia Department of State for Finance and Economic Affairs. 2002. Strategy for Poverty Alleviation (SPAII) (PRSP).Banjul, Department of State for Finance and Economic Affairs, Strategy for Poverty Alleviation Co-ordinating Office.
_ 2006. Poverty Reduction Strategy: 2007–2011. Banjul, Department of State for Finance and Economic Affairs.(Approved copy.)
GAVI Alliance. 2008. Successes in Global Immunisation Boosts Progress Towards MDGs. Geneva, Switzerland,GAVI Alliance. http://www.gavialliance.org/media_centre/press_releases/2008_06_20_annual_report.php(Accessed 27 September 2008.)
Gershberg, A. I. and Maikish, A. 2008. Targeting education funding to the poor: universal primary education, educationdecentralization and local level outcomes in Ghana. Background paper for EFA Global Monitoring Report 2009.
Gershberg, A. I. and Winkler, D. R. 2003. Education Decentralisation in Africa: A Review of Recent Policy and Practice.Washington, DC, World Bank.
Gertler, P. 2004. Do conditional cash transfers improve child health? Evidence from Progresa's control randomizedexperiment. American Economic Review, Vol. 94, No. 2, pp. 336–41.
Gertler, P., Patrinos, H. and Rubio-Codina, M. 2006. Empowering Parents to Improve Education: Evidence from RuralMexico. Washington, DC, World Bank. (Policy Research Working Papers, 3935, Impact Evaluation Series, 4.)
Ghana National Development Planning Commission. 2003. Ghana Poverty Reduction Strategy 2003–2005: An Agenda forGrowth and Prosperity. Volume I: Analysis and Policy Statement. Accra, National Development Planning Commission.
_ 2005. Growth and Poverty Reduction Strategy (GPRSII) (2006–2009): Economic Development and Poverty Reductionin Ghana. Accra, National Development Planning Commission.
Gibbons, S., Machin, S. and Silva, O. 2006. Competition, Choice and Student Achievement. London, London Schoolof Economics, Centre for the Economics of Education.
Giffard-Lindsay, K. 2008. Poverty reduction strategies and governance with equity for education. Four case studies:Cambodia, Ethiopia, Ghana and Nepal. Background paper for EFA Global Monitoring Report 2009.
Gilmore, A. 2005. The Impact of PIRLS (2001) and TIMSS (2003) in Low-Income and Middle-Income Countries: AnEvaluation of the Value of World Bank Support for International Surveys of Reading Literacy (PIRLS) and Mathematicsand Science (TIMSS). Amsterdam, International Association for the Evaluation of Educational Achievement.
Giordano, E. A. 2008. School Clusters and Teacher Resource Centres. Paris, UNESCO International Institute forEducational Planning. (Fundamentals of Educational Planning, 86.)
Glaeser, E. L., Ponzetto, G. and Shleifer, A. 2006. Why Does Democracy Need Education? Cambridge, Mass., NationalBureau of Economic Research. (Working Paper, 12128.)
Glewwe, P., Ilias, N. and Kremer, M. 2003. Teacher Incentives. Cambridge, Mass., National Bureau of Economic Research.(Working Paper, 9671.)
Glewwe, P., Jacoby, H. G. and King, E. M. 2001. Early childhood nutrition and academic achievement: a longitudinalanalysis. Journal of Public Economics, Vol. 81, No. 3, pp. 345–68.
Global Fund to Fight AIDS, Tuberculosis and Malaria. 2008. Global Fund Investments Support AIDS Treatmentfor 1.75 Million People. Geneva, Switzerland, Global Fund to Fight AIDS, Tuberculosis and Malaria.http://www.theglobalfund.org/en/media_center/press/pr_080609.asp (Accessed 27 September 2008.)
Global March Against Child Labour and International Center on Child Labor and Education. 2006. Review of Child Labour,Education and Poverty Agenda: India Country Report. New Delhi/Washington, DC, Global March Against ChildLabour/International Center on Child Labor and Education.
Goetz, A.-M. and Jenkins, R. 2005. Reinventing Accountability: Making Democracy Work for Human Development.Basingstoke, UK, Palgrave Macmillan.
Goldring, E. and Rowley, K. J. 2006. Parent Preferences and Parent Choices: The Public-Private Decision about SchoolChoice. Paper presented at the Annual Meeting of the American Educational Research Association, San Francisco,Calif., 8 April.
González, P. 2008. Governance, management and financing of educational equity-focused policies in Chile. Backgroundpaper for EFA Global Monitoring Report 2009.
A N N E X
4 2 2

Gordon, N. and Vegas, E. 2005. Educational finance equalization, spending, teacher quality, and student outcomes:The case of Brazil's FUNDEF. Vegas, E. (ed.), Incentives to Improve Teaching: Lessons from Latin America.Washington, DC, World Bank, pp. 151–86.
Göttelmann-Duret, G. and Tournier, B. 2008. Crucial management aspects of equitable teacher provision.Background paper for EFA Global Monitoring Report 2009.
Govinda, R. and Bandyopadhyay, M. 2008. Access to Elementary Education in India: Country Analytical Review. Brighton,UK/New Delhi, University of Sussex, Sussex School of Education, Centre for International Education, Consortium forResearch on Educational Access, Transitions & Equity/National University of Educational Planning and Administration.
Govinda, R. and Josephine, Y. 2004. Para Teachers in India: A Review. Paris, UNESCO International Institute forEducational Planning. (Draft, IIEP/Prg.YD/04.XX.)
Gragnolati, M., Shekar, M., Das Gupta, M., Bredenkamp, C. and Lee, Y.-K. 2006. India's Undernourished Children:A Call for Reform and Action. Washington, DC, World Bank. (Health, Nutrition and Population Series.)
Grant, U. and Marcus, R. 2006. Chronic Poverty and PRSs – A Desk Study. Manchester, UK, University of Manchester,School of Environment and Development, Institute for Development Policy and Management, Chronic PovertyResearch Centre. (Mimeo.)
Grantham-McGregor, S. 1995. A review of studies of the effects of severe malnutrition on mental development.Journal of Nutrition, Vol. 125, No. 8, pp. 2233–8.
Grantham-McGregor, S. and Baker-Henningham, H. 2005. Review of the evidence linking protein and energy to mentaldevelopment. Public Health Nutrition, Vol. 8, No. 7A, pp. 1191–201.
Grantham-McGregor, S., Cheung, Y. B., Cueto, S., Glewwe, P., Richter, L., Strupp, B. and International Child DevelopmentSteering Group. 2007. Developmental potential in the first 5 years for children in developing countries. The Lancet,Vol. 369, No. 9555, pp. 60–70.
Greaney, V. and Kellaghan, T. 2008. Assessing National Achievement Levels in Education. Washington, DC, World Bank.
Greeley, M. 2007a. Financing Primary Education in Afghanistan. London, International Save the Children Alliance.
_ 2007b. Financing Primary Education in the Democratic Republic of the Congo. London, International Save the ChildrenAlliance.
Grenier, S., Jones, S., Strucker, J., Murray, T. S., Gervais, G. and Brink, S. 2008. International Adult Literacy Survey.Learning Literacy in Canada: Evidence from the International Survey of Reading Skills. Ottawa, Minister of Industry,Statistics Canada, Human Resources and Social Development Canada.
Grindle, M. S. 2004. Good enough governance: poverty reduction and reform in developing countries. Governance:An International Journal of Policy, Administration and Institutions, Vol. 17, No. 4, pp. 525–48.
Group of 8. 2005. Africa. G8 Summit 2005, Gleneagles, UK, Group of 8, 6–8 July.
_ 2007. Growth and Responsibility in Africa: Summit Declaration. G8 Summit 2007, Heiligendamm, Germany,Group of G8, 8 June.
Guarcello, L., Lyon, S. and Rosati, F. C. 2006. Child Labour and Education For All: An Issue Paper.Rome, ILO/UNICEF/World Bank, Understanding Children’s Work Project/University of Rome Tor Vergata,Faculty of Economics. (Working Paper.)
Guinea Government. 2002. Poverty Reduction Strategy Paper: Republic of Guinea. Conakry, Governmentof the Republic of Guinea.
Guinea Ministry of the Economy, Finances and Planning. 2007. Poverty Reduction Strategy Paper PRSP-2 (2007–2010).Conakry, Ministry of the Economy, Finances and Planning.
Guinea-Bissau Ministry of Economy. 2006. Enquête par Grappes à Indicateurs Multiples, Guinée-Bissau, 2006, RapportFinal [Multiple Indicator Cluster Survey, Guinea-Bissau, 2006, Final Report]. Bissau, Ministry of Economy, Secretary ofState for Planning and Regional Integration. (In French.)
Guiso, L., Monte, F., Sapienza, P. and Zingales, L. 2008. Diversity: culture, gender and math. Science, Vol. 320, No. 5880,pp. 1164–5.
Gunnarsson, L. V., Orazem, P., Sanchez, M. and Verdisco, A. 2004. Does Local School Control Raise Student Outcomes?Theory and Evidence on the Roles of School Autonomy and Community Participation. Ames, Iowa, Iowa StateUniversity, Department of Economics. (Staff General Research Papers, 11417.)
Gwatkin, D. R., Rutstein, S., Johnson, K., Suliman, E., Wagstaff, A. and Amouzou, A. 2007a. Socio-Economic Differencesin Health, Nutrition and Population within Developing Countries: An Overview. Washington, DC, World Bank, HumanDevelopment Network, Health, Nutrition and Population/Government of the Netherlands/Swedish InternationalDevelopment Cooperation Agency. (Country Reports on HNP and Poverty.)
_ 2007b. Socio-Economic Differences in Health, Nutrition and Population. Bangladesh: 1996/97, 1999/2000, 2004.Washington, DC, World Bank, Human Development Network, Health, Nutrition and Population. (Country Reportson HNP and Poverty.)
R E F E R E N C E S
4 2 3