Embed Size (px)
Citation preview
0
0
Overview of Financial Inclusion in Malaysia
• Background of financial inclusion in Malaysia
• Challenges and strategies to further financial inclusion
• Current status of financial inclusion
Development Finance and Enterprise Department Bank Negara Malaysia
1
1
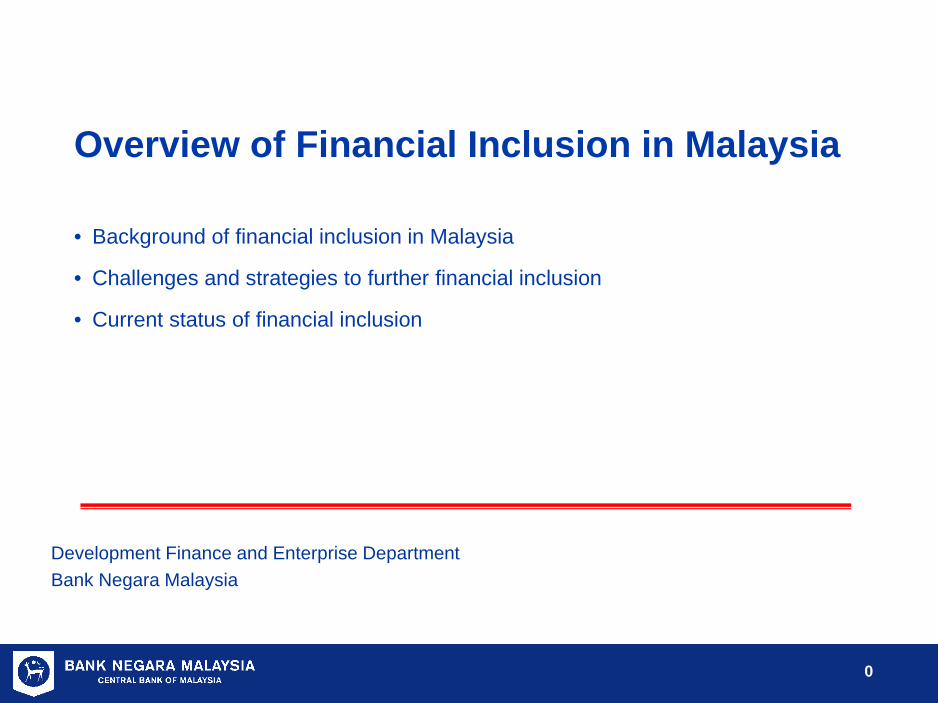
Malaysia – General introduction
• Geographic coordinates: – 2 30 N, 112 30 E
• Area: – Total: 329,758 km2
• Population: – 29.7 million (2013)
• Demography: – 51% male – 49% female
• Median age: – Median age: total: 27.4 years – Male: 27.2 years – Female: 27.6 years (2013 est.)
• Urbanisation – Urban population: 72% of total
population (2010) – Rate of urbanisation: 2.4% annual
rate of change (2010-2015 est.) • Life expectancy at birth
– Total population: 74.04 years • Literacy (2000)
– Total population: 88% – Male: 92% – Female: 85%
2
2
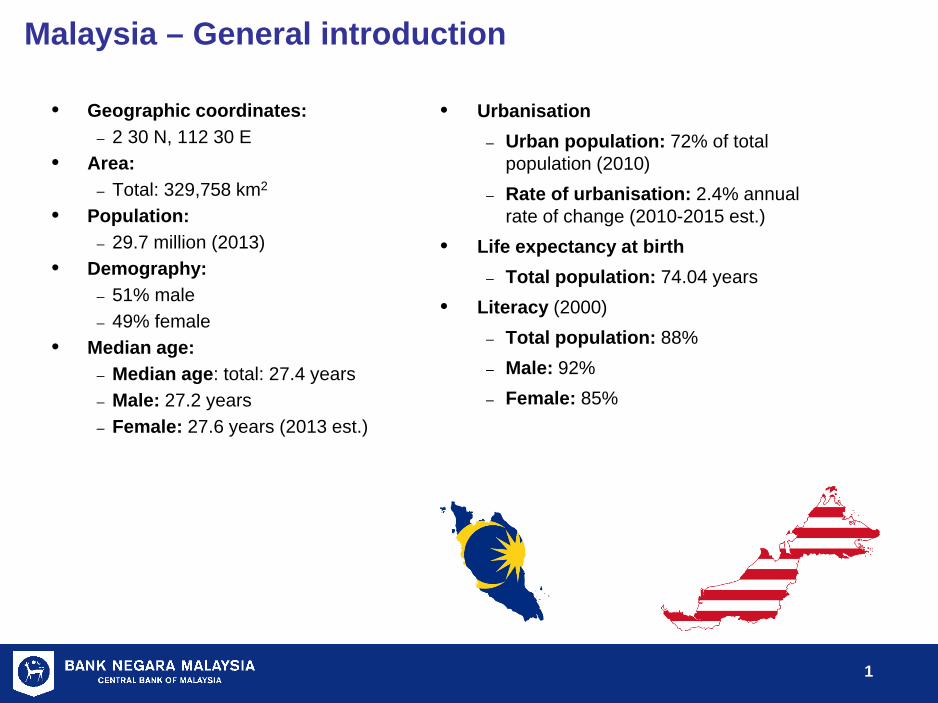
Malaysia – Economic Data
GDP (current prices): RM984 billion ($299 billion) (2013)
GDP - composition, by sector of origin:
• agriculture: 11.2% • industry: 40.6% • services: 48.1% (2013 est.)
GDP (real growth rate): 4.7% (2013)
Gross national savings: 31.2% of GDP (2013 est.)
Labor force: 12.92 million (2012 est.)
Unemployment rate: 3.1% (2012 est.)
Population below poverty line: 3.8% (2009)
Inflation rate (consumer price): 2.1% (2013)
Exchange rates: Malaysian ringgit (MYR) per US dollar - 3.29 (2013)
3
3
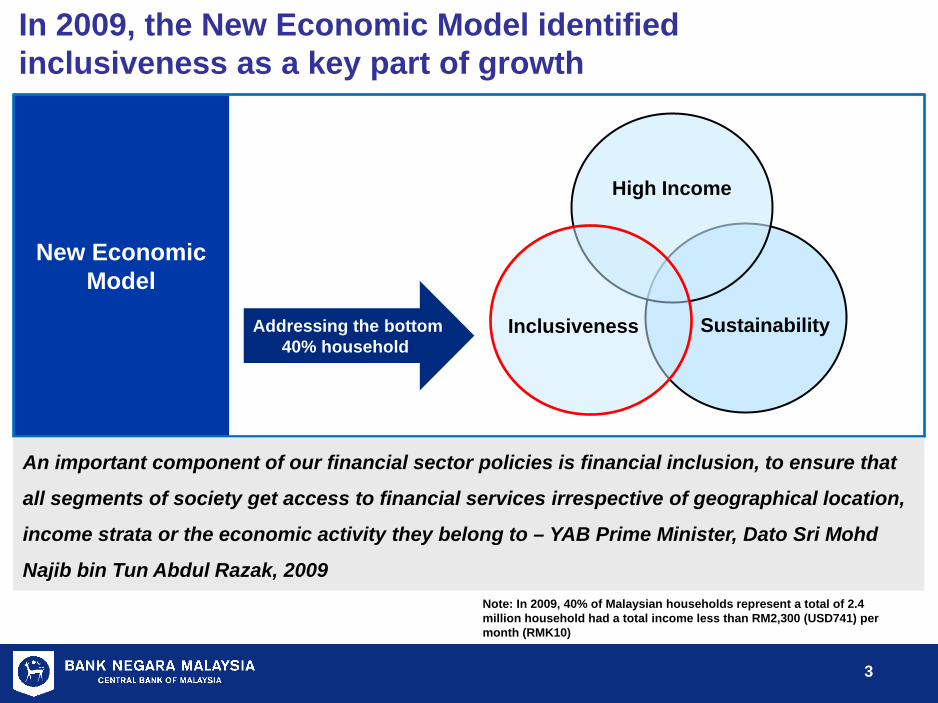
New Economic Model
An important component of our financial sector policies is financial inclusion, to ensure that
all segments of society get access to financial services irrespective of geographical location,
income strata or the economic activity they belong to – YAB Prime Minister, Dato Sri Mohd
Najib bin Tun Abdul Razak, 2009
In 2009, the New Economic Model identified inclusiveness as a key part of growth
Note: In 2009, 40% of Malaysian households represent a total of 2.4 million household had a total income less than RM2,300 (USD741) per month (RMK10)
Inclusiveness Sustainability
High Income
Addressing the bottom 40% household
4
4
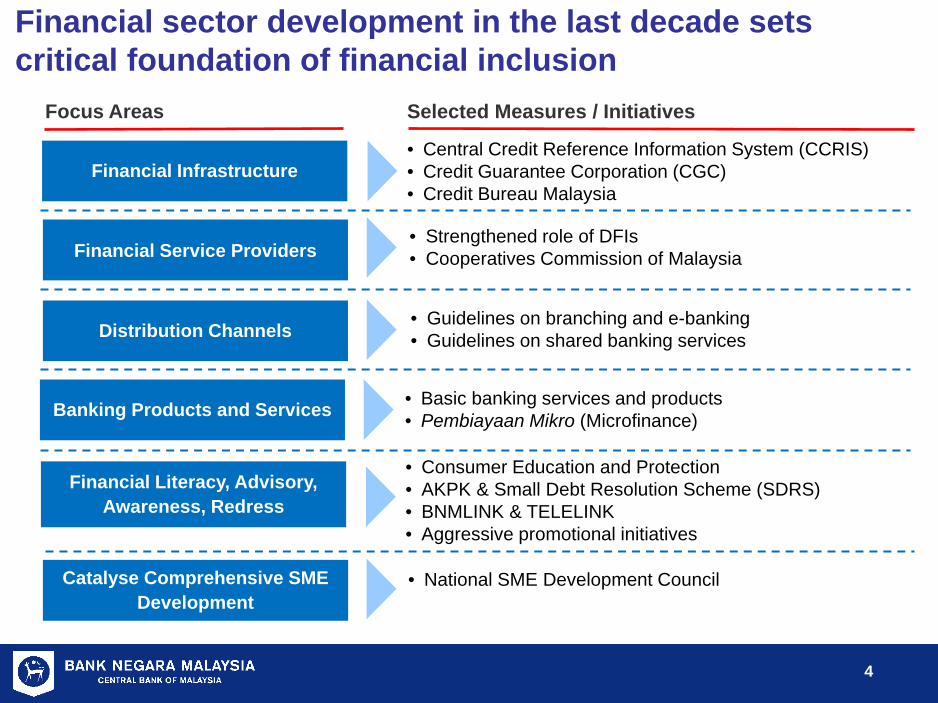
Financial sector development in the last decade sets critical foundation of financial inclusion
Financial Service Providers • Strengthened role of DFIs • Cooperatives Commission of Malaysia
Distribution Channels • Guidelines on branching and e-banking • Guidelines on shared banking services
Banking Products and Services
Financial Literacy, Advisory, Awareness, Redress
• Consumer Education and Protection • AKPK & Small Debt Resolution Scheme (SDRS) • BNMLINK & TELELINK • Aggressive promotional initiatives
Financial Infrastructure
• Basic banking services and products • Pembiayaan Mikro (Microfinance)
Selected Measures / Initiatives Focus Areas
• Central Credit Reference Information System (CCRIS) • Credit Guarantee Corporation (CGC) • Credit Bureau Malaysia
Catalyse Comprehensive SME Development
• National SME Development Council
5
5
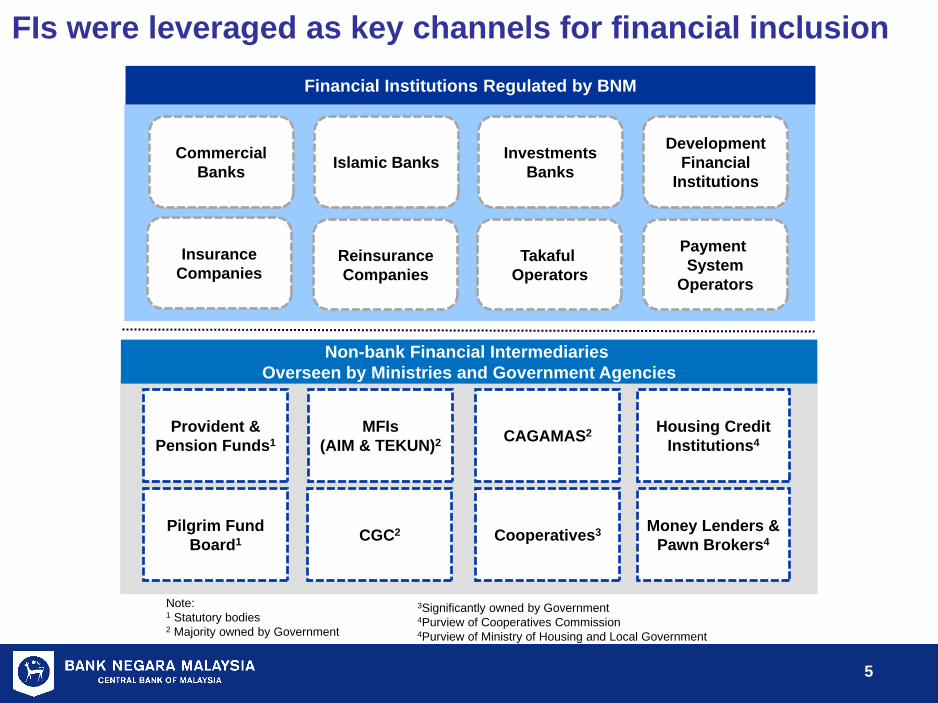
FIs were leveraged as key channels for financial inclusion
Note: 1 Statutory bodies 2 Majority owned by Government
Financial Institutions Regulated by BNM
Commercial Banks Islamic Banks Investments
Banks
Development Financial
Institutions
Provident & Pension Funds1
MFIs (AIM & TEKUN)2
Cooperatives3 CGC2 Pilgrim Fund Board1
Housing Credit Institutions4
Money Lenders & Pawn Brokers4
Non-bank Financial Intermediaries Overseen by Ministries and Government Agencies
Insurance Companies
Reinsurance Companies
Takaful Operators
Payment System
Operators
3Significantly owned by Government 4Purview of Cooperatives Commission 4Purview of Ministry of Housing and Local Government
CAGAMAS2
6
6
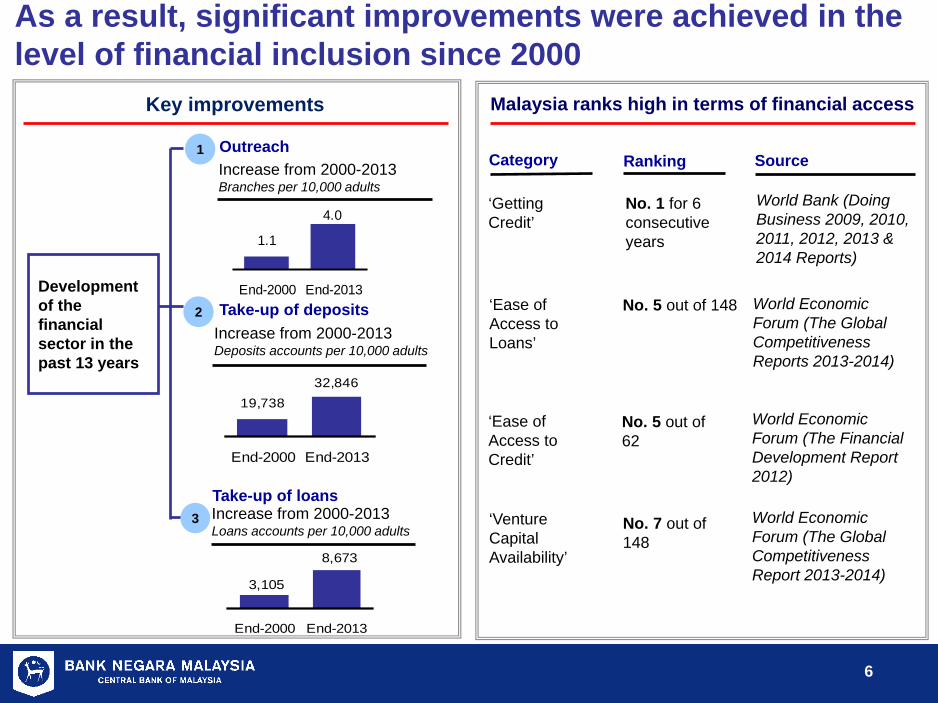
As a result, significant improvements were achieved in the level of financial inclusion since 2000
Key improvements
Category
‘Getting Credit’
‘Venture Capital Availability’
‘Ease of Access to Loans’
Malaysia ranks high in terms of financial access
Ranking
No. 1 for 6 consecutive years
No. 7 out of 148
No. 5 out of 148
Source
World Bank (Doing Business 2009, 2010, 2011, 2012, 2013 & 2014 Reports)
World Economic Forum (The Global Competitiveness Report 2013-2014)
World Economic Forum (The Global Competitiveness Reports 2013-2014)
‘Ease of Access to Credit’
No. 5 out of 62
World Economic Forum (The Financial Development Report 2012)
Take-up of deposits
Outreach
Increase from 2000-2013 Deposits accounts per 10,000 adults
Increase from 2000-2013 Branches per 10,000 adults
2
1
Development of the financial sector in the past 13 years
Take-up of loans 3 Increase from 2000-2013
Loans accounts per 10,000 adults
4.0
1.1
End-2000 End-2013
32,84619,738
End-2000 End-2013
3,105
8,673
End-2000 End-2013
7
7
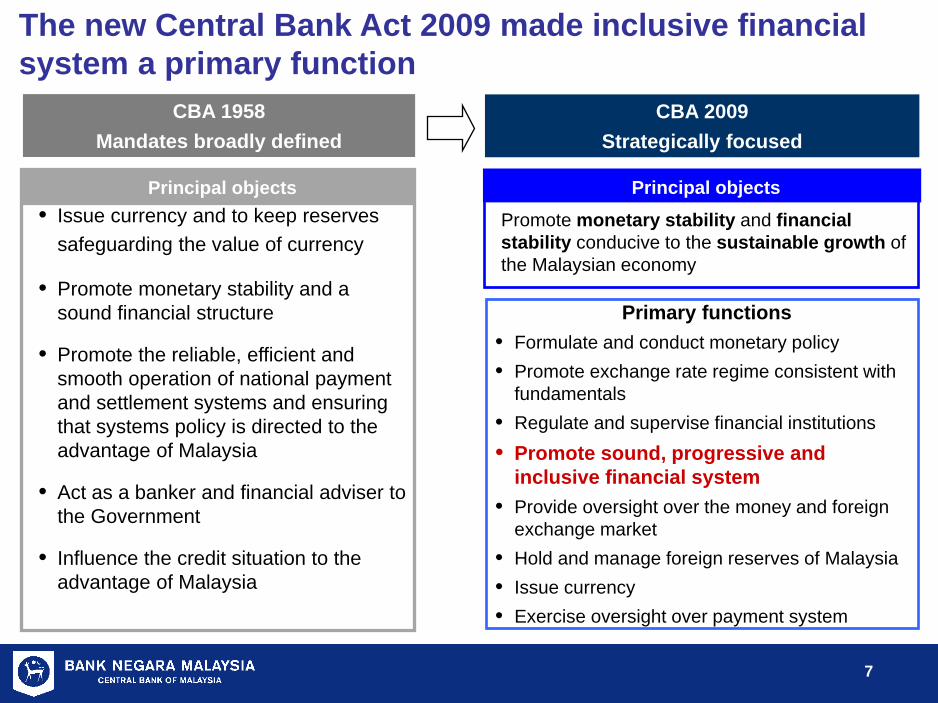
Principal objects Promote monetary stability and financial stability conducive to the sustainable growth of the Malaysian economy
Principal objects • Issue currency and to keep reserves
safeguarding the value of currency
• Promote monetary stability and a sound financial structure
• Promote the reliable, efficient and smooth operation of national payment and settlement systems and ensuring that systems policy is directed to the advantage of Malaysia
• Act as a banker and financial adviser to the Government
• Influence the credit situation to the advantage of Malaysia
The new Central Bank Act 2009 made inclusive financial system a primary function
Primary functions • Formulate and conduct monetary policy • Promote exchange rate regime consistent with
fundamentals • Regulate and supervise financial institutions • Promote sound, progressive and
inclusive financial system • Provide oversight over the money and foreign
exchange market • Hold and manage foreign reserves of Malaysia • Issue currency • Exercise oversight over payment system
CBA 1958 Mandates broadly defined
CBA 2009 Strategically focused
8
8
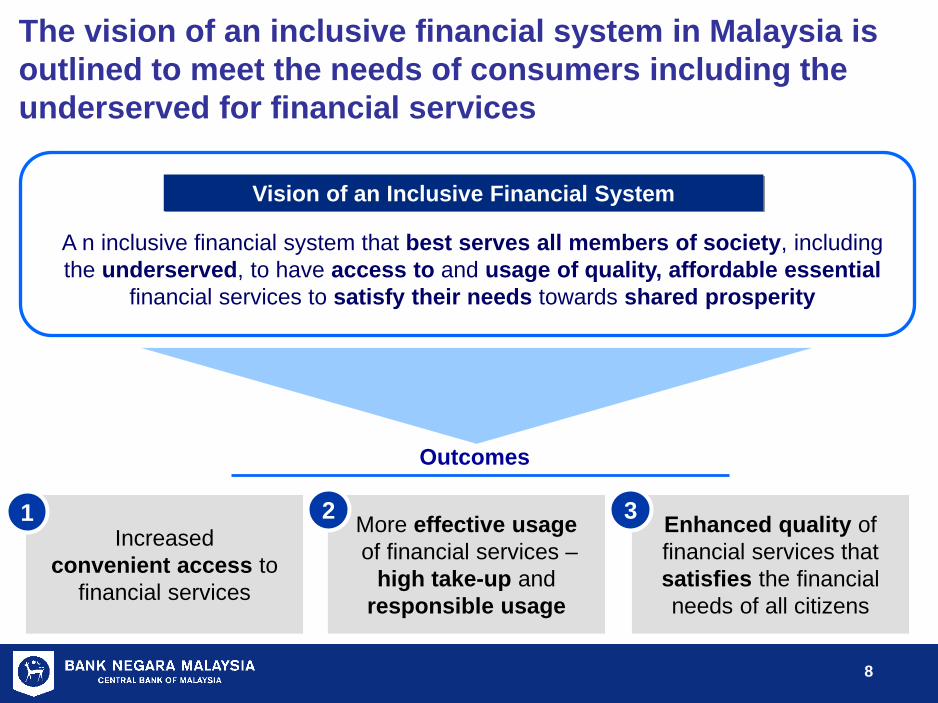
The vision of an inclusive financial system in Malaysia is outlined to meet the needs of consumers including the underserved for financial services
Vision of an Inclusive Financial System
A n inclusive financial system that best serves all members of society, including the underserved, to have access to and usage of quality, affordable essential
financial services to satisfy their needs towards shared prosperity
Outcomes
Increased convenient access to
financial services
Enhanced quality of financial services that satisfies the financial needs of all citizens
More effective usage of financial services –
high take-up and responsible usage
1 2 3
9
9
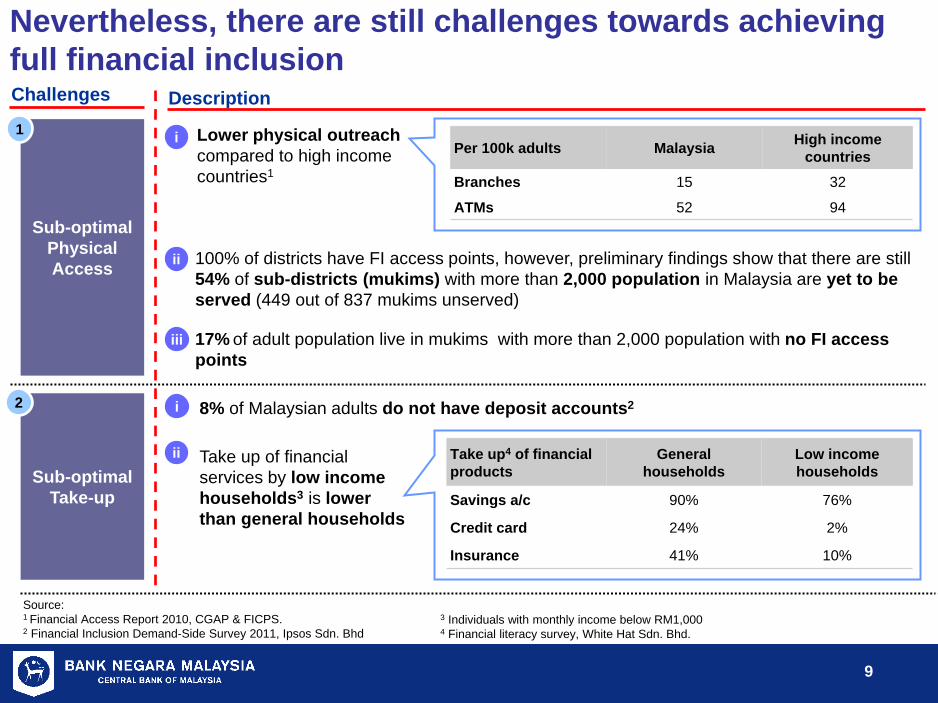
Nevertheless, there are still challenges towards achieving full financial inclusion
Source: 1 Financial Access Report 2010, CGAP & FICPS. 2 Financial Inclusion Demand-Side Survey 2011, Ipsos Sdn. Bhd
Description Challenges
Sub-optimal Physical Access
• Lower physical outreach compared to high income countries1
Per 100k adults Malaysia High income countries
Branches 15 32
ATMs 52 94
• 100% of districts have FI access points, however, preliminary findings show that there are still 54% of sub-districts (mukims) with more than 2,000 population in Malaysia are yet to be served (449 out of 837 mukims unserved)
• 17% of adult population live in mukims with more than 2,000 population with no FI access points
Sub-optimal Take-up
• 8% of Malaysian adults do not have deposit accounts2
• Take up of financial services by low income households3 is lower than general households
Take up4 of financial products
General households
Low income households
Savings a/c 90% 76%
Credit card 24% 2%
Insurance 41% 10%
i
ii
i
2
1
ii
iii
3 Individuals with monthly income below RM1,000 4 Financial literacy survey, White Hat Sdn. Bhd.
10
10
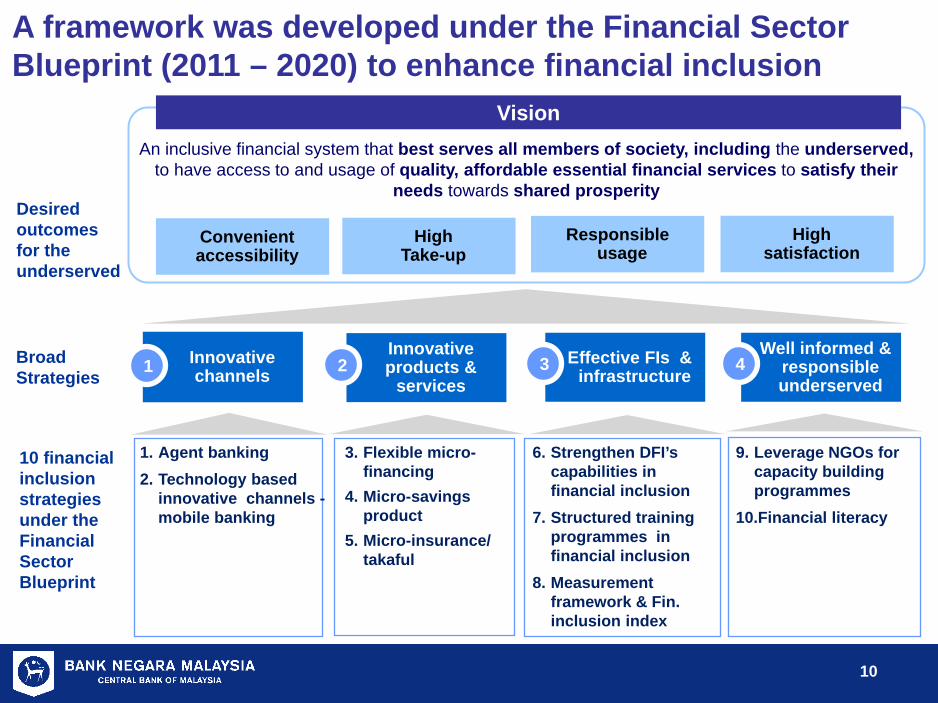
A framework was developed under the Financial Sector Blueprint (2011 – 2020) to enhance financial inclusion
Innovative products &
services Innovative channels
Effective FIs & infrastructure
10 financial inclusion strategies under the Financial Sector Blueprint
Broad Strategies
An inclusive financial system that best serves all members of society, including the underserved, to have access to and usage of quality, affordable essential financial services to satisfy their
needs towards shared prosperity
1 2 3
High Take-up
Convenient accessibility
Responsible usage
High satisfaction
Desired outcomes for the underserved
Well informed & responsible underserved
4
Vision
1. Agent banking 2. Technology based
innovative channels - mobile banking
3. Flexible micro-financing
4. Micro-savings product
5. Micro-insurance/ takaful
6. Strengthen DFI’s capabilities in financial inclusion
7. Structured training programmes in financial inclusion
8. Measurement framework & Fin. inclusion index
9. Leverage NGOs for capacity building programmes
10.Financial literacy
11
11
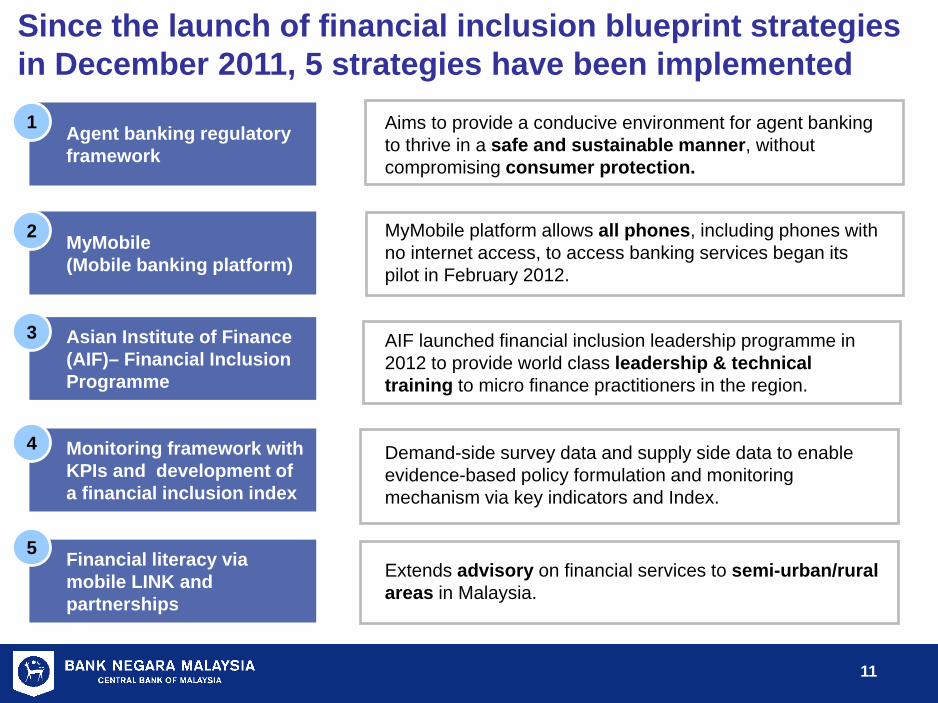
Aims to provide a conducive environment for agent banking to thrive in a safe and sustainable manner, without compromising consumer protection.
MyMobile platform allows all phones, including phones with no internet access, to access banking services began its pilot in February 2012.
AIF launched financial inclusion leadership programme in 2012 to provide world class leadership & technical training to micro finance practitioners in the region.
Demand-side survey data and supply side data to enable evidence-based policy formulation and monitoring mechanism via key indicators and Index.
Extends advisory on financial services to semi-urban/rural areas in Malaysia.
Since the launch of financial inclusion blueprint strategies in December 2011, 5 strategies have been implemented
Agent banking regulatory framework
MyMobile (Mobile banking platform)
Asian Institute of Finance (AIF)– Financial Inclusion Programme
Monitoring framework with KPIs and development of a financial inclusion index
Financial literacy via mobile LINK and partnerships
1
2
3
4
5
12
12
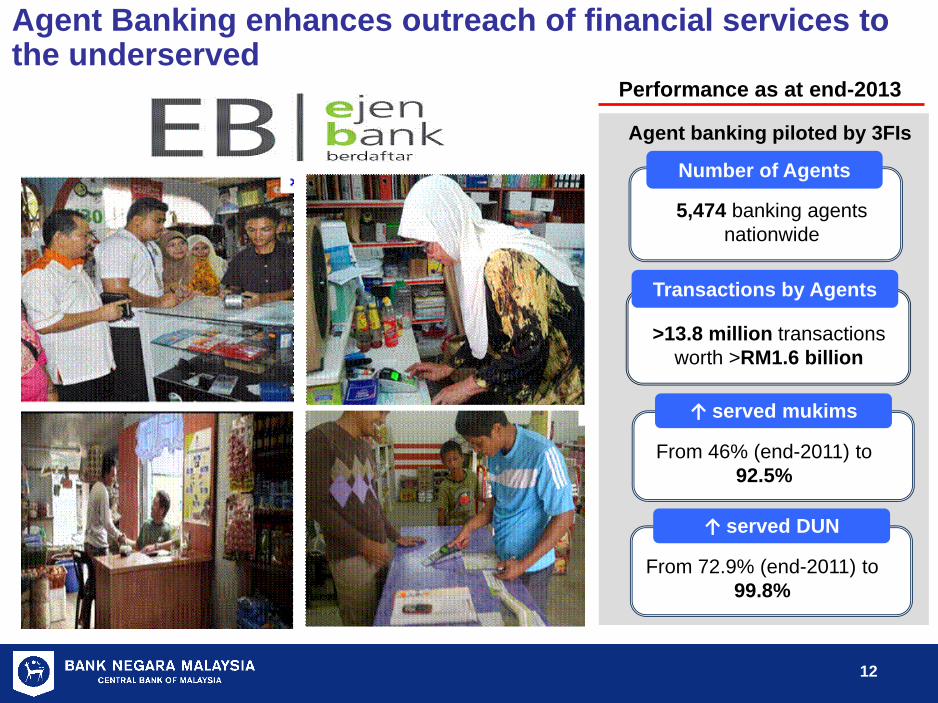
Performance as at end-2013
5,474 banking agents nationwide
>13.8 million transactions worth >RM1.6 billion
↑ served mukims
Transactions by Agents
Number of Agents
From 46% (end-2011) to 92.5%
Agent banking piloted by 3FIs
Agent Banking enhances outreach of financial services to the underserved
↑ served DUN
From 72.9% (end-2011) to 99.8%
13
13
Malaysians can access financial services anytime through MyMobile (pilot stage)
Opportunity
Types of services
Benefits
• Mobile banking can cover all mukims • Adoption of mobile banking has been
increasing
• Available on all mobile phones • Internet connection is not required • Safe and secure • Consumers are educated on how to use
MyMobile System
Achievements • View transaction history & balances • Fund transfers (e.g. same bank & inter-bank) • Bill payments • Credit card repayment • Airtime reload transactions • Mobile to mobile transactions
132,275 users
3 Telcos (Maxis,
Celcom & Digi)
Government
3 FIs (Maybank, CIMB & Public Bank)
MyMobile *500*888#
• 3 participating FIs • 3 participating Telcos • 132,275 registered users as at end-2013 • 1.5 million transactions, of which 254,237 are
financial transactions valued at RM21.3 million
14
14
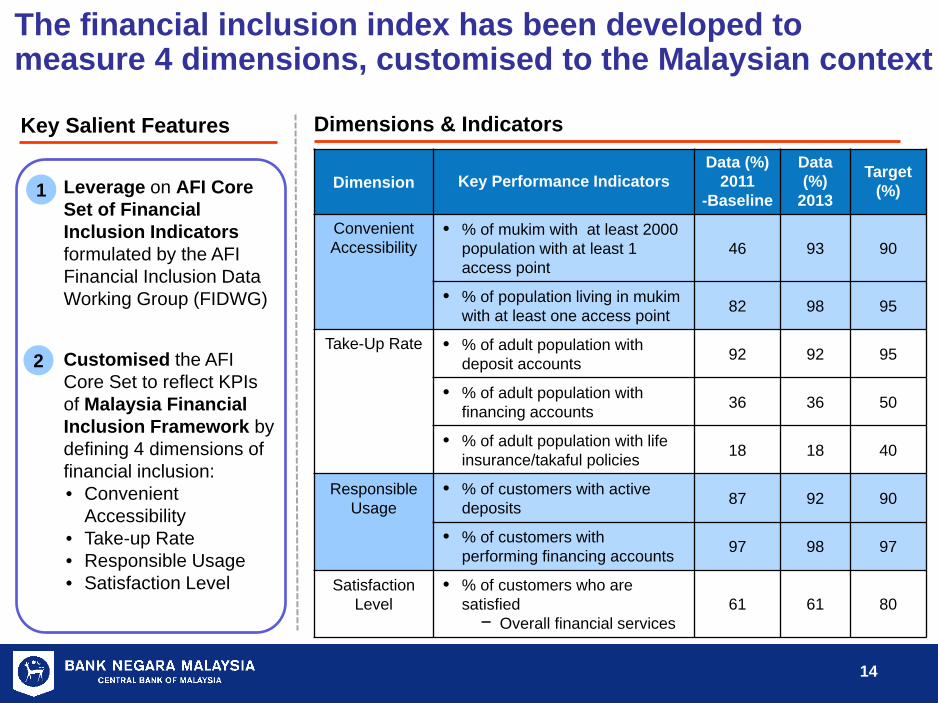
1. Leverage on AFI Core Set of Financial Inclusion Indicators formulated by the AFI Financial Inclusion Data Working Group (FIDWG)
1. Customised the AFI
Core Set to reflect KPIs of Malaysia Financial Inclusion Framework by defining 4 dimensions of financial inclusion: • Convenient
Accessibility • Take-up Rate • Responsible Usage • Satisfaction Level
The financial inclusion index has been developed to measure 4 dimensions, customised to the Malaysian context
1
2
Dimensions & Indicators Key Salient Features
Dimension Key Performance Indicators Data (%)
2011 -Baseline
Data (%)
2013
Target (%)
Convenient Accessibility
• % of mukim with at least 2000 population with at least 1 access point
46 93 90
• % of population living in mukim with at least one access point 82 98 95
Take-Up Rate • % of adult population with deposit accounts 92 92 95
• % of adult population with financing accounts 36 36 50
• % of adult population with life insurance/takaful policies 18 18 40
Responsible Usage
• % of customers with active deposits 87 92 90
• % of customers with performing financing accounts 97 98 97
Satisfaction Level
• % of customers who are satisfied
− Overall financial services 61 61 80
15
15
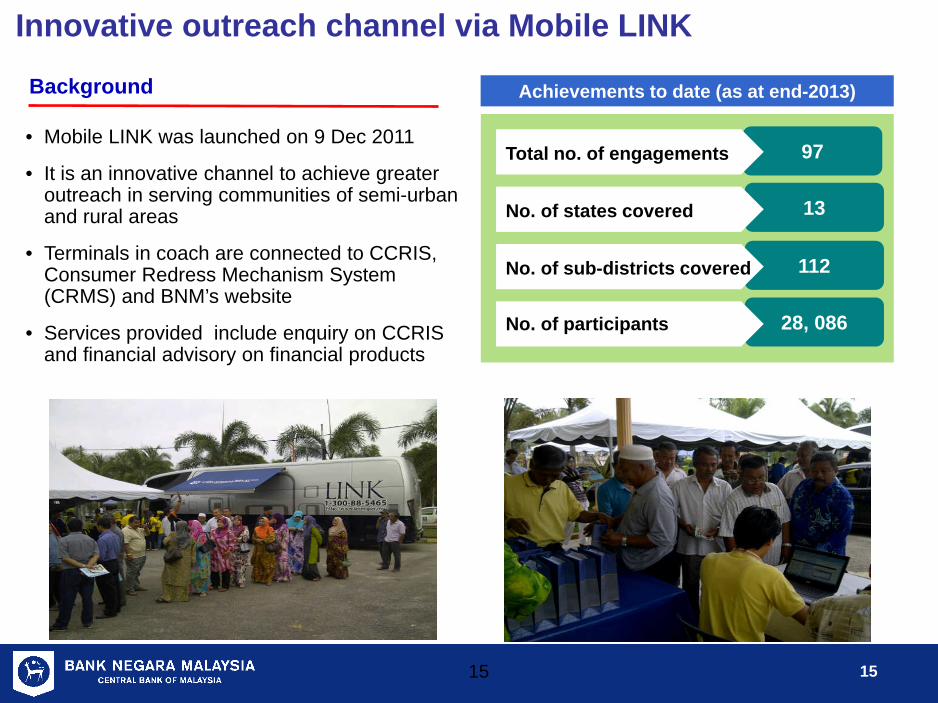
• Mobile LINK was launched on 9 Dec 2011
• It is an innovative channel to achieve greater outreach in serving communities of semi-urban and rural areas
• Terminals in coach are connected to CCRIS, Consumer Redress Mechanism System (CRMS) and BNM’s website
• Services provided include enquiry on CCRIS and financial advisory on financial products
Background Achievements to date (as at end-2013)
97
13
112
28, 086
No. of sub-districts covered
No. of participants
No. of states covered
Total no. of engagements
15
Innovative outreach channel via Mobile LINK
16
16
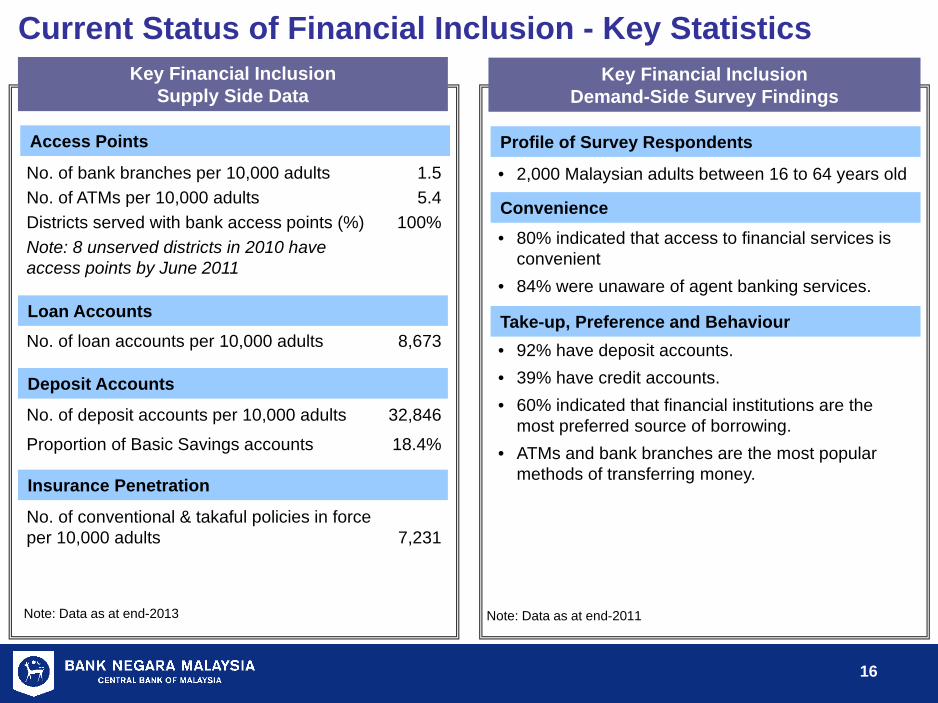
Current Status of Financial Inclusion - Key Statistics Key Financial Inclusion
Supply Side Data
No. of bank branches per 10,000 adults 1.5 No. of ATMs per 10,000 adults 5.4 Districts served with bank access points (%) 100% Note: 8 unserved districts in 2010 have access points by June 2011
No. of loan accounts per 10,000 adults 8,673
No. of deposit accounts per 10,000 adults 32,846 Proportion of Basic Savings accounts 18.4%
No. of conventional & takaful policies in force per 10,000 adults 7,231
Access Points
Loan Accounts
Deposit Accounts
Insurance Penetration
Key Financial Inclusion Demand-Side Survey Findings
• 2,000 Malaysian adults between 16 to 64 years old
• 80% indicated that access to financial services is
convenient • 84% were unaware of agent banking services.
• 92% have deposit accounts. • 39% have credit accounts. • 60% indicated that financial institutions are the
most preferred source of borrowing. • ATMs and bank branches are the most popular
methods of transferring money.
Profile of Survey Respondents
Convenience
Take-up, Preference and Behaviour
Note: Data as at end-2013 Note: Data as at end-2011
17
17
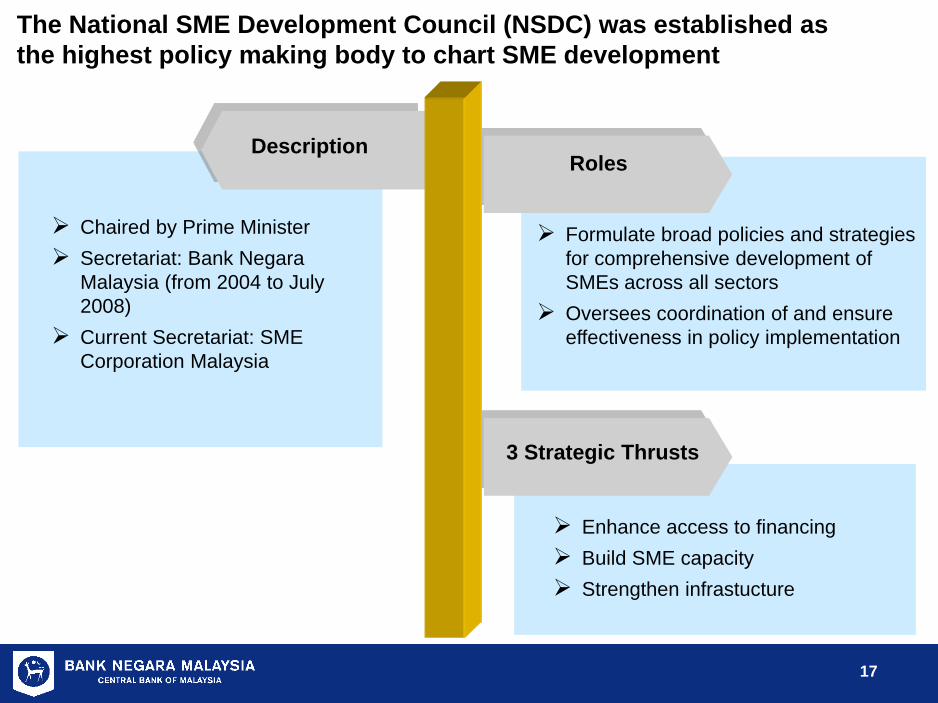
Description
Chaired by Prime Minister Secretariat: Bank Negara
Malaysia (from 2004 to July 2008)
Current Secretariat: SME Corporation Malaysia
The National SME Development Council (NSDC) was established as the highest policy making body to chart SME development
3 Strategic Thrusts
Enhance access to financing Build SME capacity Strengthen infrastucture
Roles
Formulate broad policies and strategies for comprehensive development of SMEs across all sectors
Oversees coordination of and ensure effectiveness in policy implementation
18
18
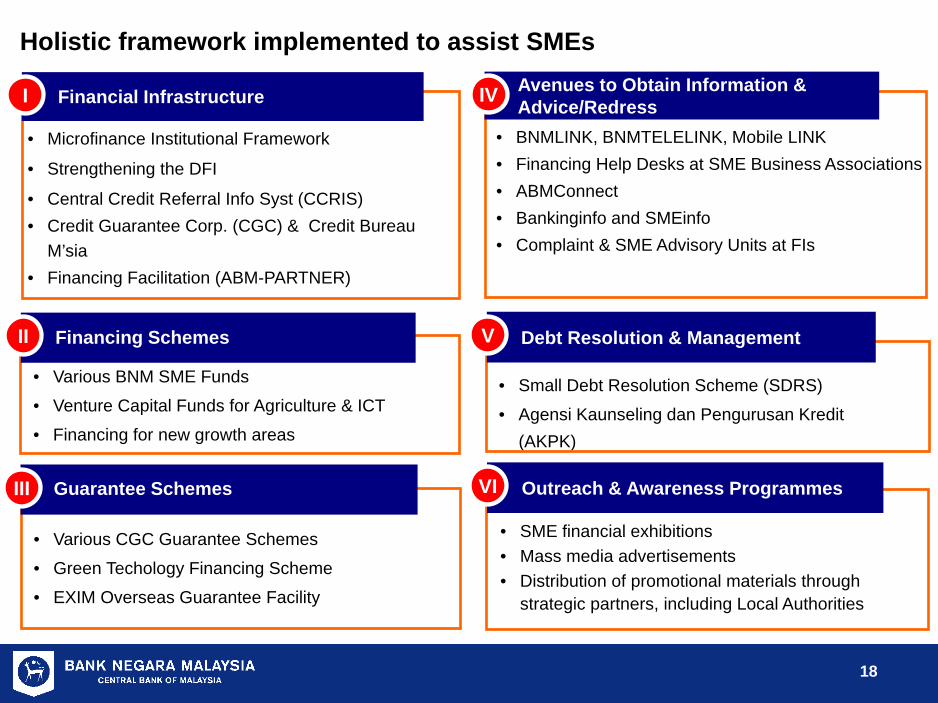
• Various CGC Guarantee Schemes • Green Techology Financing Scheme • EXIM Overseas Guarantee Facility
• SME financial exhibitions • Mass media advertisements • Distribution of promotional materials through
strategic partners, including Local Authorities
• Small Debt Resolution Scheme (SDRS) • Agensi Kaunseling dan Pengurusan Kredit
(AKPK)
• BNMLINK, BNMTELELINK, Mobile LINK • Financing Help Desks at SME Business Associations • ABMConnect • Bankinginfo and SMEinfo • Complaint & SME Advisory Units at FIs
• Various BNM SME Funds • Venture Capital Funds for Agriculture & ICT • Financing for new growth areas
• Microfinance Institutional Framework
• Strengthening the DFI
• Central Credit Referral Info Syst (CCRIS) • Credit Guarantee Corp. (CGC) & Credit Bureau
M’sia • Financing Facilitation (ABM-PARTNER)
Financial Infrastructure I
Financing Schemes
II
Guarantee Schemes III
Avenues to Obtain Information & Advice/Redress IV
Debt Resolution & Management V
Outreach & Awareness Programmes VI
Holistic framework implemented to assist SMEs
19
19
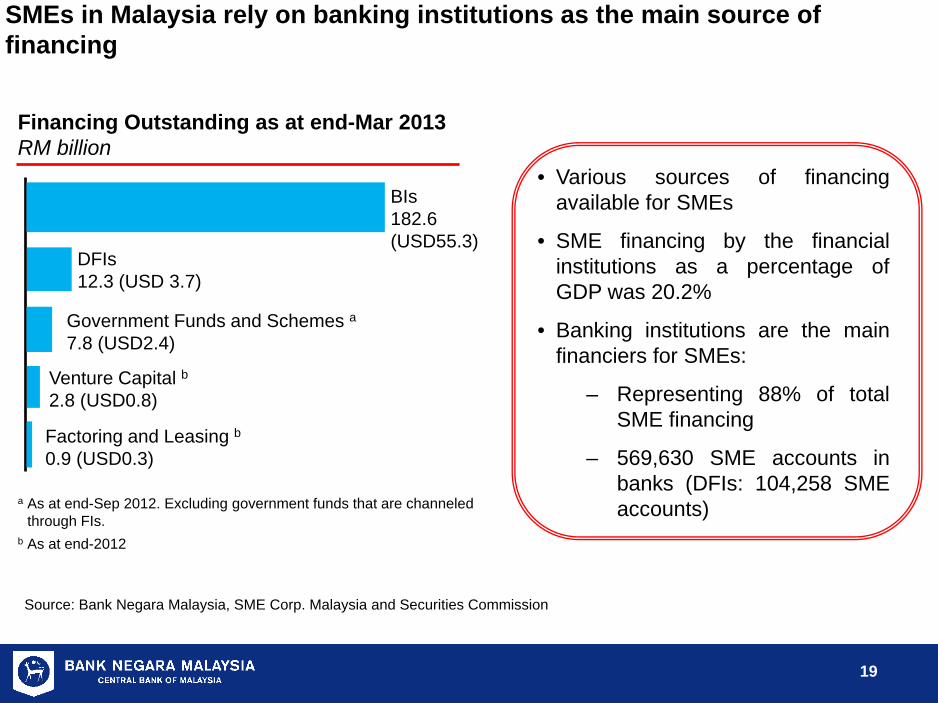
SMEs in Malaysia rely on banking institutions as the main source of financing
Source: Bank Negara Malaysia, SME Corp. Malaysia and Securities Commission
Financing Outstanding as at end-Mar 2013 RM billion
DFIs
12.3 (USD 3.7)
Government Funds and Schemes a
7.8 (USD2.4)
Venture Capital b
2.8 (USD0.8)
a As at end-Sep 2012. Excluding government funds that are channeled through FIs.
b As at end-2012
• Various sources of financing available for SMEs
• SME financing by the financial institutions as a percentage of GDP was 20.2%
• Banking institutions are the main financiers for SMEs:
– Representing 88% of total SME financing
– 569,630 SME accounts in banks (DFIs: 104,258 SME accounts)
Factoring and Leasing b
0.9 (USD0.3)
BIs 182.6 (USD55.3)
20
20
Source: SME Corp Malaysia and Bank Negara Malaysia
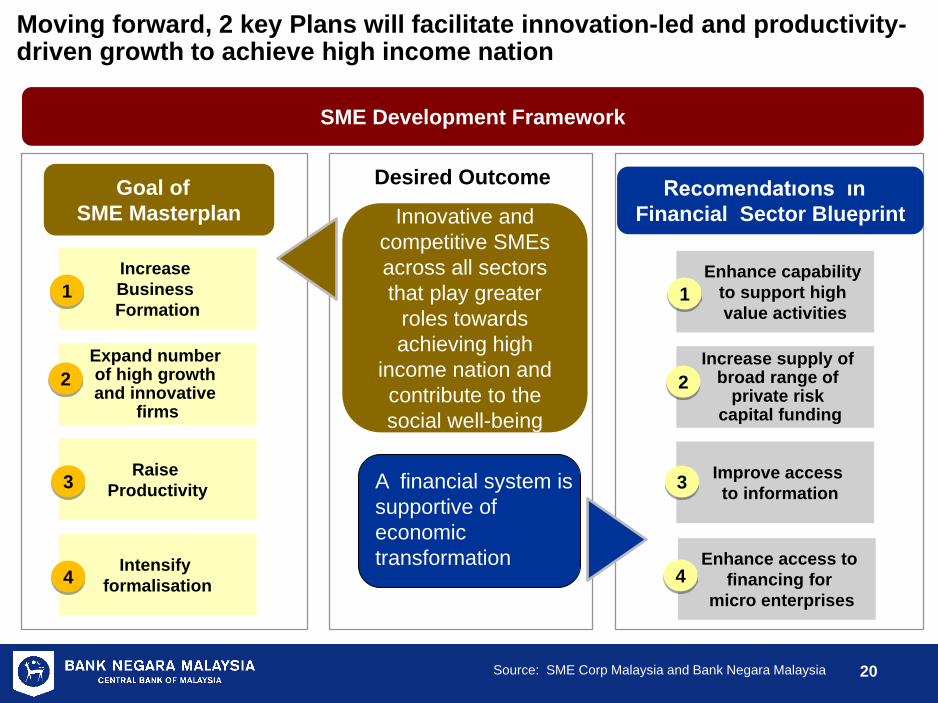
Moving forward, 2 key Plans will facilitate innovation-led and productivity-driven growth to achieve high income nation
Expand number of high growth and innovative
firms
Raise
Productivity
Intensify
formalisation
Increase Business Formation
1
2
3
4
Innovative and competitive SMEs across all sectors that play greater
roles towards achieving high
income nation and contribute to the social well-being
SME Development Framework
Goal of SME Masterplan
Recomendatıons ın Financial Sector Blueprint
Increase supply of broad range of
private risk capital funding
Improve access to information
Enhance access to financing for
micro enterprises
Enhance capability to support high value activities
1
2
3
4
A financial system is supportive of economic transformation
Desired Outcome
21
21
Thank you