Embed Size (px)
Citation preview

Overview of fracture prediction tools
John A Kanis1,2, Nicholas C Harvey3, Helena Johansson1,3, Anders Odén1, Eugene V. McCloskey1, and William D. Leslie4
1Centre for Metabolic Bone Diseases, University of Sheffield Medical School, UK
2Institute of Health and Ageing, Australian Catholic University, Melbourne, Australia
2MRC Lifecourse Epidemiology Unit, University of Southampton, Southampton, UK
3Centre for Bone and Arthritis Research (CBAR), Sahlgrenska Academy, University of Gothenburg, Gothenburg, Sweden
4University of Manitoba, Winnipeg, Canada
Abstract
The characterisation of risk factors for fracture that contribute significantly to fracture risk, over
and above that provided by BMD, has stimulated the development of risk assessment tools. The
more adequately evaluated tools, all available online include the FRAX® tool, the Garvan fracture
risk calculator and, in the UK only, QFracture®. Differences in the input variables, output and
model construct give rise to marked differences in the computed risks from each calculator.
Reasons for the differences include the derivation of fracture probability (FRAX) rather than
incidence (Garvan, QFracture), limited calibration (Garvan) and inappropriate source information
(QFracture). These differences need to be taken into account in the evaluation of assessment
guidelines.
Keywords
calibration; fracture risk; FRAX; Garvan fracture risk calculator; QFracture
Introduction
A significant advance over the past 15 years has been the development of medical
interventions that have been shown in high quality randomised controlled trials to decrease
the risk of fragility fractures [1, 2]. Unfortunately, a minority of men and women receive
treatment even after sustaining a fragility fracture [1, 3]. The reason for a large treatment gap
(the difference between the number of individuals at high risk and the proportion of the
*Correspondence to: Prof John A Kanis, Centre for Metabolic Bone Diseases, University of Sheffield Medical School, Beech Hill Road, Sheffield S10 2RX, UK; Tel: +44 114 285 1109; Fax: +44 114 285 1813; [email protected].
Competing InterestsProfessor Kanis led the team that developed FRAX as director of the WHO Collaborating Centre for Metabolic Bone Diseases; he has no financial interest in FRAX. Professors McCloskey, Oden, Harvey and Dr Johansson are members of the FRAX team. Professors Kanis, Harvey and McCloskey are members of the advisory body the National Osteoporosis Guideline Group. Professor Leslie led the team that developed the Canadian FRAX tool and co-led the Osteoporosis Canada guidelines that endorsed the use of FRAX.
Europe PMC Funders GroupAuthor ManuscriptJ Clin Densitom. Author manuscript; available in PMC 2018 January 14.
Published in final edited form as:J Clin Densitom. 2017 ; 20(3): 444–450. doi:10.1016/j.jocd.2017.06.013.
Europe PM
C Funders A
uthor Manuscripts
Europe PM
C Funders A
uthor Manuscripts

population that receives treatment) is complex and multifactorial. One of the reasons is,
however, limitations in the assessment of fracture risk.
Although the diagnosis of the disease relies on the quantitative assessment of bone mineral
density (BMD), a major determinant of bone strength, the clinical significance of
osteoporosis lies in the fractures that arise. The causation of fractures is, however
multifactorial. In this respect, there are some analogies with other multifactorial chronic
diseases. For example, hypertension is diagnosed on the basis of blood pressure whereas an
important clinical consequence of hypertension is stroke, the likelihood of which is
dependent on multiple fractures including hypertension.
Despite many guidelines using BMD thresholds to determine whether treatments should be
recommended, the multifactorial nature of fracture risk means that BMD does not capture
non-skeletal determinants of fracture risk such as liability to fall. A number of risk factors
for fracture has been identified that contribute significantly to fracture risk over and above
that provided by BMD [4]. A good example is age where the same BMD has a different
significance at different ages, such that fracture risk is much higher in the elderly than in the
young [5, 6]. This is because age contributes to risk independently of BMD. The realisation
that independent risk factors in combination with BMD predict fractures with greater
accuracy than BMD alone [4] has led to the development of risk prediction tools to better
categorise individuals at high or low risk and, in turn to optimise clinical decision making
with regard to therapeutic intervention. This paper reviews the strengths and weaknesses of
the most commonly espoused risk assessment tools.
Fracture risk prediction tools
Several assessment tools have been derived most of which have been poorly validated [7, 8].
The more adequately evaluated tools, all available online include the FRAX® tool [7], the
Garvan fracture risk calculator [9, 10] and, in the UK, QFracture® [11, 12].
FRAX
The FRAX algorithm is based on a series of meta-analyses of data from 12 independent
fracture studies from North America, Europe, Asia, and Australia [13–18], which comprised
a total of 60,000 men and women with more than 250,000 person-years of follow-up, and
included more than 1100 cases of hip fracture and 3300 osteoporotic fractures [7].
After the fracture risk algorithm had been constructed using primary data from these studies,
a validation study was performed using individual-level data from 11 independent
population-based cohorts that were not used in the development of the original model [19].
The latter comprised a total of 230,000 individuals with more than 1.2 million person-years
of follow up. By reason of its large numbers, its international character, and the care taken in
its construction and implementation, the FRAX algorithm is considered to have unique
authority [20]. The algorithm provides information on the 10-year probabilities of hip
fracture and any major osteoporotic fracture (defined as a hip, wrist, humerus, or clinical
vertebral fracture). Further details are provided in an accompanying paper in this volume.
Kanis et al. Page 2
J Clin Densitom. Author manuscript; available in PMC 2018 January 14.
Europe PM
C Funders A
uthor Manuscripts
Europe PM
C Funders A
uthor Manuscripts

QFracture
The QFracture tool is based on a UK prospective open cohort study of routinely collected
data from 357 general practices on over 2 million men and women aged 30-85 years
(www.qfracture.org) [11]. Like the FRAX tool it takes into account history of smoking,
alcohol, corticosteroid use, parental history (of hip fracture or osteoporosis) and several
secondary causes of osteoporosis. Unlike FRAX it also includes a history of falls (yes/no
only over an unspecified time frame), utilises a large number of clinical risk factors and no
provision is made for BMD. It has been internally validated (i.e. from a stratum of the same
population), and externally validated in a similar population (routinely collected data in
general practitioner records). The performance characteristics and calibration in the UK have
been compared with FRAX with comparable results for hip fracture. The tool is not
calibrated to the epidemiology of other countries. A feature of QFracture is that it is more
cumbersome (more questions), and does not accommodate the inclusion of BMD. BMD
measurements are dismissed as “expensive and inconvenient tests” [11] and so the model
ignores a wealth of data demonstrating the utility of BMD testing in fracture risk
assessment.
Garvan
The Garvan tool (www.garvan.org.au) is based on many fewer men and women from a
single study, the Australian Dubbo Osteoporosis Epidemiology Study (DOES) of
approximately 2500 men and women age 60 years or more. It differs from FRAX by
including a history of falls (categorised as 0, 1, 2, >2 in the previous year), and the number
of previous fragility fractures (categorised as 0, 1, 2, >2), but does not include other FRAX
variables such as parental history of hip fracture, secondary osteoporosis, rheumatoid
arthritis, glucocorticoid use, smoking and intake of alcohol. The output of the tool differs
from FRAX in that it reports the risk of a larger number of fracture sites (additionally
includes fractures of the distal femur, proximal tibia/fibula, distal tibia/fibula, patella, pelvis,
ribs sternum, hands and feet excluding digits). Further details are provided in an
accompanying paper in this volume.
Comparative features
There are important differences in the input variables, output and model features that make
comparison of the models problematic. A summary of input variables is given in Table 1.
With regard to input variables, both Garvan and QFracture include a history of falls whereas
this is not an input variable in FRAX. Indeed the Garvan tool weights the number of falls in
the past year. Whereas falls are a strong risk factor for fracture, the incorporation of falls into
FRAX is problematic for several reasons. First, at the time of the release of FRAX, existing
falls data were not of adequate quality, including the heterogeneous construct of questions
on falls. Second, falls risk is inherently taken into account in the algorithm, though not as an
input variable. Thus, the fracture probability given for any combination of risk factors
assumes that the falls risk is that observed (but not documented) in the cohorts used to
construct FRAX. Third, the interrelationship of falls risk with the other FRAX variables has
Kanis et al. Page 3
J Clin Densitom. Author manuscript; available in PMC 2018 January 14.
Europe PM
C Funders A
uthor Manuscripts
Europe PM
C Funders A
uthor Manuscripts

been inadequately explored on an international basis. Fourth, the relationship between the
risk variable and mortality needs to be accounted for, but there are no data available.
These technical problems aside, risk assessment tools are intended to identify a risk that is
amenable to a therapeutic intervention. However, falls as a risk variable does not consistently
pass the test of reversibility of risk [21–23], a necessary feature of any risk variable used in
in tools to direct interventions [7, 24]. Recently, an analysis in elderly men, available as a
meeting abstract, indicated that the predictive value of falls for fracture waned significantly
with time [25]. If the phenomenon is replicated more generally, then this would further
question the utility of falls history in the long term (e.g. 10-year) assessment of fracture risk.
Thus, a useful role of falls history in fracture risk assessment remains sub judice. There are
also few data that many of the QFracture risk factors (cardiovascular disease, type 2
diabetes, asthma, tricyclic antidepressants usage, history of falls or liver disease)
characterises a risk that is amenable to bone-targeted interventions.
Other important differences between models include the question construct for fracture
history given as past fragility fracture (for FRAX), fractures since the age of 50 years
(Garvan) or past wrist, spine, hip or shoulder fracture (QFracture). For BMD, the femoral
neck is the reference site for FRAX and for Garvan but is not an input variable for
QFracture.
Important differences in the output and model features are given in Table 2. The Garvan
instrument includes many more fracture outcomes than QFracture or FRAX. Compared with
FRAX, the inclusion of these additional fractures is expected to inflate fracture risks in
women by 34-45% depending on age [26].
The outcome variable differs between models, not only in the fracture sites but also in the
metric. In the case of FRAX, the algorithm computes a fracture probability (i.e. a metric that
incorporates the death hazard) which is not synonymous with simple fracture incidence. This
is illustrated in Figure 1 that shows the difference in outcome between hip fracture
probability as estimated by FRAX and incidence calculated using the Garvan instrument. As
a result, the comparisons are problematic [27].
Comparison of output
A comparison of the performance characteristics of the three models is beyond the scope of
this review, but for hip fracture risk appear to be rather comparable [28] taking into account
the methodological flaws in most of the comparative studies [27]. Given the considerations
above, it is not surprising that each model identifies different segments of populations at
high risk. Of equal importance is that very different estimates are derived in single
populations. For example, the three models were compared in a referral population from
Denmark. For hip fracture prediction, the mean 10-year risk (with interquartile range) was
11.0% (5.6-17.0%) for FRAX, 14.5% (7.3-23.0%) for QFracture and 26.4% (10.4-53.3%)
for Garvan [29]. Irrespective of the model constructs, these differences are not surprising
given that neither QFracture nor Garvan are calibrated for the country in which they were
used.
Kanis et al. Page 4
J Clin Densitom. Author manuscript; available in PMC 2018 January 14.
Europe PM
C Funders A
uthor Manuscripts
Europe PM
C Funders A
uthor Manuscripts

When QFracture and FRAX are applied to the UK population, there is reasonable
concordance for hip fracture risk since both are calibrated to the UK, though in different
ways. The Garvan instrument is calibrated only to Dubbo and is the outlier (Figure 2). The
concordance of the Garvan and FRAX tools reported in Canada [30] is thus a fortuitous
accident occasioned by the similar epidemiology between Canada and Dubbo. The claim of
good calibration in Norway is not supported by the evidence [31].
Whereas QFracture and FRAX are comparably calibrated for hip fracture risk [11, 12], a
quite different pattern is evident for major osteoporotic fractures where the probabilities
derived from FRAX are markedly higher than the incidences from QFracture. The Garvan
instrument gives even higher values as shown in Figure 3 for the same clinical scenarios as
in Figure 2. The Garvan tool provides the highest risks, in part because the output is the 10-
year incidence of all fractures (minus those at the digits). QFracture gives the lowest
estimates. This is confirmed in Figure 4 where the 10-year hip fracture rates/probabilities are
shown in women at each decile of risk category [32, 33, 34].
The reason for the discrepancy is that QFracture is derived from General Practitioner records
that are often incomplete for some important variables [34]. For example, GP records are
reasonably accurate for the documentation of hip fracture but notoriously unreliable for
other major fractures, particularly vertebral fractures [35]. Thus, the prevalence of a prior
major fracture in the QFracture data base is 1.9% [12], whereas prior fracture is estimated at
21-45% in women from the UK, depending on age [36]. Of these, approximately half will be
major fractures. For a parental history of osteoporosis or hip fracture the prevalence is given
at 0.3% in the QFracture data base whereas meta-analysis of prospective studies gives a
prevalence of parental hip fracture at 13% [15]. The impact of the inaccuracies is difficult to
quantify but is likely to decrease the median of the distribution of 10-year risk in the
population. Empirical observation supports this view in that at each tenth of risk category,
QFracture risk is lower than FRAX-based probabilities (see Figure 4).
The poor and inaccurate capture of clinical risk factors is likely to bias the weights for both
hip fracture risk and major fracture risk. In the case of FRAX and Garvan, the probability of
fracture is approximately doubled with a prior history of fracture consistent with worldwide
observation [13, 37]. In the case of major fracture incidence, QFracture determines an
increase in risk ratio of approximately only 8%, rather than the expected doubling of risk
[34]. As expected from meta-analysis, the impact of a prior fracture is somewhat greater at
younger ages [13] and is accommodated in FRAX. In contrast, the weighting given for a
prior fracture as a risk fracture is unrealistic for QFracture and does not vary with age (the
latter, also the case for Garvan).
A further problem arises in considering the pattern of fractures with age. As expected,
FRAX probabilities of a major fracture exceed that of hip fracture at all ages. In the case of
QFracture the incidence of hip fracture and the incidence of major fracture are identical
from the age of 85 years. This implies that no fractures of the spine, humerus or distal
forearm arise in women from the age of 85 years. Again, this contrasts with empirical
observation [26, 38, 39]. Indeed, fragility fractures other than hip fracture account for
64-67% of fractures in women and men (respectively) aged 85-89 years [26].
Kanis et al. Page 5
J Clin Densitom. Author manuscript; available in PMC 2018 January 14.
Europe PM
C Funders A
uthor Manuscripts
Europe PM
C Funders A
uthor Manuscripts
These considerations indicate that little credence can be afforded for estimates of major
fracture using the QFracture algorithm. They further indicate that the weights given to
several of the clinical risk factors are inappropriate. Both factors result in a large
underestimation of major fracture risk by QFracture. In contrast, the prevalence and weight
of clinical risk factors, and the pattern of fractures with age of major fractures has been
extensively validated with the use of FRAX [26, 38–41]. In summary, FRAX is well
calibrated whereas QFracture under-predicts the risk of major fractures at all levels of risk.
Conclusion
There are important differences between the FRAX tool, the Garvan fracture risk calculator
and QFracture® that make their comparison problematic. Differences in the input variables,
output and model construct give rise to marked differences in the computed risks from each
calculator. Reasons for the differences include the derivation of fracture probability (FRAX)
rather than incidence (Garvan, QFracture), poor calibration (Garvan) and inappropriate
source information (QFracture).
Acknowledgements
Some content in this review is taken from Kanis JA, et al (2016) Calcif Tissue Int 98: 417-25 with kind permission from Springer Science+Business Media B.V.
References
1. Hernlund E, Svedbom A, Ivergård M, et al. Osteoporosis in the European Union: Medical Management, Epidemiology and Economic Burden. A report prepared in collaboration with the International Osteoporosis Foundation (IOF) and the European Federation of Pharmaceutical Industry Associations (EFPIA). Arch Osteoporos. 2013; 8:136. [PubMed: 24113837]
2. Kanis JA, Borgström F, Compston J, et al. SCOPE: a scorecard for osteoporosis in Europe. Arch Osteoporos. 2013; 8:144. [PubMed: 24030479]
3. Elliot-Gibson V, Bogoch ER, Jamal SA, Beaton DE. Practice patterns in the diagnosis and treatment of osteoporosis after a fragility fracture: a systematic review. Osteoporos Int. 2004; 15:767–778. [PubMed: 15258724]
4. Kanis JA. Diagnosis of osteoporosis and assessment of fracture risk. Lancet. 2002; 359:1929–36. [PubMed: 12057569]
5. Hui SL, Slemenda CW, Johnston CC Jr. Age and bone mass as predictors of fracture in a prospective study. J Clin Invest. 1988; 81:1804–9. [PubMed: 3384952]
6. Kanis JA, Johnell O, Oden A, Dawson A, De Laet C, Jonsson B. Ten year probabilities of osteoporotic fractures according to BMD and diagnostic thresholds. Osteoporos Int. 2001; 12:989–995. [PubMed: 11846333]
7. Kanis, JA., on behalf of the World Health Organization Scientific Group. Assessment of osteoporosis at the primary health-care level. Technical Report. World Health Organization Collaborating Centre for Metabolic Bone Diseases, University of Sheffield; UK: 2007. Accessed https://www.shef.ac.uk/FRAX/reference.aspx 14 July 2015
8. Kanis JA, McCloskey EV, Johansson H, Cooper C, Rizzoli R, Reginster J-Y, on behalf of the Scientific Advisory Board of the European Society for Clinical and Economic Aspects of Osteoporosis and Osteoarthritis (ESCEO) and the Committee of Scientific Advisors of the International Osteoporosis Foundation ( IOF). European guidance for the diagnosis and management of osteoporosis in postmenopausal women. Osteoporos Int. 2013; 24:23–57. [PubMed: 23079689]
Kanis et al. Page 6
J Clin Densitom. Author manuscript; available in PMC 2018 January 14.
Europe PM
C Funders A
uthor Manuscripts
Europe PM
C Funders A
uthor Manuscripts
9. Nguyen ND, Frost SA, Center JR, Eisman JA, Nguyen TV. Development of prognostic nomograms for individualizing 5-year and 10-year fracture risks. Osteoporos Int. 2008; 19:1431–44. [PubMed: 18324342]
10. Nguyen TV, Center JR, Eisman JA. Individualized fracture risk assessment: progresses and challenges. Curr Opin Rheumatol. 2013; 25:532–41. [PubMed: 23656708]
11. Hippisley-Cox J, Coupland C. Predicting risk of osteoporotic fracture in men and women in England and Wales: prospective derivation and validation of QFractures Scores. Br Med J. 2009; 339:b4229. [PubMed: 19926696]
12. Hippisley-Cox J, Coupland C. Derivation and validation of updated QFracture algorithm to predict risk of osteoporotic fracture in primary care in the United Kingdom: prospective open cohort study. Br Med J. 2012; 344:e3427. [PubMed: 22619194]
13. Kanis JA, Johnell O, De Laet C, et al. A meta-analysis of previous fracture and subsequent fracture risk. Bone. 2004; 35:375–382. [PubMed: 15268886]
14. Kanis JA, Johansson H, Oden A, et al. A meta-analysis of prior corticosteroid use and fracture risk. J Bone Miner Res. 2004; 19:893–899. [PubMed: 15125788]
15. Kanis JA, Johansson H, Oden A, et al. A family history of fracture and fracture risk: a meta-analysis. Bone. 2004; 35:1029–1037. [PubMed: 15542027]
16. Kanis JA, Johnell O, Oden A, et al. Smoking and fracture risk: a meta-analysis. Osteoporos Int. 2005; 16:155–162. [PubMed: 15175845]
17. Kanis JA, Johansson H, Johnell O, et al. Alcohol intake as a risk factor for fracture. Osteoporos Int. 2005; 16:737–742. [PubMed: 15455194]
18. De Laet C, Kanis JA, Oden A, et al. Body mass index as a predictor of fracture risk: a meta-analysis. Osteoporos Int. 2005; 16:1330–1338. [PubMed: 15928804]
19. Kanis JA, Oden A, Johnell O, et al. The use of clinical risk factors enhances the performance of BMD in the prediction of hip and osteoporotic fractures in men and women. Osteoporos Int. 2007; 18:1033–46. [PubMed: 17323110]
20. Blake GM, Fogelman I. An Update on dual-energy X-ray absorptiometry. Semin Nucl Med. 2010; 40:62–73. [PubMed: 19958851]
21. McClung MR, Geusens P, Miller PD, et al. Effect of risedronate on the risk of hip fracture in elderly women. Hip Intervention Program Study Group. N Engl J Med. 2001; 344:333–340. [PubMed: 11172164]
22. Kayan K, Johansson H, Oden A, et al. Can fall risk be incorporated into fracture risk assessment algorithms: a pilot study of responsiveness to clodronate. Osteoporos Int. 2009; 20:2055–2061. [PubMed: 19436939]
23. Gillespie LD, Robertson MC, Gillespie WJ, et al. Interventions for preventing falls in older people living in the community. Cochrane Database Syst Rev. 2009:CD007146. [PubMed: 19370674]
24. Kanis JA, McCloskey E, Johansson H, Oden A, Leslie WD. FRAX with and without BMD. Calcif Tissue Int. 2012; 90:1–13. [PubMed: 22057815]
25. Johansson J, Harvey N, Odén A, et al. The predictive value of falls history for incident fracture decreases with time: MrOs Sweden. J Bone Miner Res. 2015; 30:S424.
26. Kanis JA, Oden A, Johnell O, Jonsson B, de Laet C, Dawson A. The burden of osteoporotic fractures: a method for setting intervention thresholds. Osteoporos Int. 2001; 12:417–427. [PubMed: 11444092]
27. Kanis JA, Oden A, Johansson H, McCloskey E. Pitfalls in the external validation of FRAX. Osteoporos Int. 2012; 23:423–31. [PubMed: 22120907]
28. Leslie WB, Lix LM. Comparison between various risk assessment tools. Osteoporos Int. 2014; 25:1–21. [PubMed: 23797847]
29. Thomsen K, Ryg J, Matzen L, Hermann AP, Masud T. Choice of osteoporosis guideline has important implications for the treatment decision in elderly women referred to a fall clinic. Dan Med J. 2014; 61:A4980. [PubMed: 25441734]
30. Langsetmo L, Nguyen TV, Nguyen ND, et al. Independent external validation of nomograms for predicting risk of low trauma fracture and hip fracture. CMAJ. 2011; 183:E107. [PubMed: 21173069]
Kanis et al. Page 7
J Clin Densitom. Author manuscript; available in PMC 2018 January 14.
Europe PM
C Funders A
uthor Manuscripts
Europe PM
C Funders A
uthor Manuscripts
31. Ahmed LA, Nguyen ND, Bjørnerem A, et al. External Validation of the Garvan Nomograms for Predicting Absolute Fracture Risk: The Tromsø Study. PLoS ONE. 2014; 9(9):e107695. [PubMed: 25255221]
32. Davis S, Martyn-St James M, Sanderson J, et al. Bisphosphonates for preventing osteoporotic fragility fractures (including a partial update of NICE technology appraisal guidance 160 and 161). Technology Assessment Report: Final report to the National Institute for Health and Care Excellence. 2015
33. Hippisley-Cox, J., Coupland, C. [accessed 15 May 2015] Validation of QFracture compared with FRAX. Analysis prepared for NICE, 2011. 2011. http://www.qfracture.org/Validation-of-QFracture-vs-FRAX-for-NICE-2011.pdf
34. Kanis JA, Compston J, Cooper C, et al. SIGN guidelines for Scotland. BMD vs. FRAX vs. QFracture. Calcif Tissue Int. 2016; 98:417–25. [PubMed: 26650822]
35. DeLusignan S, Valentin T, Chan T, et al. Problems with primary care data quality: Osteoporosis as an exemplar. Informatics in Primary Care. 2004; 12:147–156.
36. Johansson H, Kanis JA, Oden A, Compston J, McCloskey E. A comparison of case-finding strategies in the UK for the management of hip fractures. Osteoporos Int. 2012; 23:907–915. [PubMed: 22234810]
37. Klotzbuecher CM, Ross PD, Landsman PB, Abbott TA, Berger M. Patients with prior fractures have an increased risk of future fractures: a summary of the literature and statistical synthesis. J Bone Miner Res. 2000; 15(4):721–739. [PubMed: 10780864]
38. Siggeirsdottir K, Aspelund T, Johansson H, et al. The incidence of a first major osteoporotic fracture in Iceland and implications for FRAX. Osteoporos Int. 2014; 25:2445–2451. [PubMed: 24980183]
39. Lam A, Leslie WD, Lix LM, Yogendran M, Morin SN, Majumdar SR. Major osteoporotic to hip fracture ratios in Canadian men and women with Swedish comparisons: a population-based analysis. J Bone Miner Res. 2014; 29:1067–73. [PubMed: 24243719]
40. Leslie WD, Lix LM, Johansson H, Oden A, McCloskey E, Kanis JA. Manitoba bone density program. Independent clinical validation of a Canadian FRAX((R)) tool: Fracture prediction and model calibration. J Bone Miner Res. 2010; 25:2350–8. [PubMed: 20499367]
41. Brennan SL, Leslie WD, Lix LM, et al. FRAX provides robust fracture prediction regardless of socioeconomic adversity. Osteoporos Int. 2014; 25:61–9. [PubMed: 24190425]
Kanis et al. Page 8
J Clin Densitom. Author manuscript; available in PMC 2018 January 14.
Europe PM
C Funders A
uthor Manuscripts
Europe PM
C Funders A
uthor Manuscripts

Figure 1. The risk of hip fracture with age in a model that considers 10-year fracture risk alone (the
Garvan tool) and FRAX which computes the probability of hip fracture from the fracture
and death hazards (FRAX). The T-scores are set differently in the two models so that the
risks are approximately equal at the age of 60 years. Data are computed from the respective
web sites. [27] with kind permission from Springer Science+Business Media B.V]
Kanis et al. Page 9
J Clin Densitom. Author manuscript; available in PMC 2018 January 14.
Europe PM
C Funders A
uthor Manuscripts
Europe PM
C Funders A
uthor Manuscripts
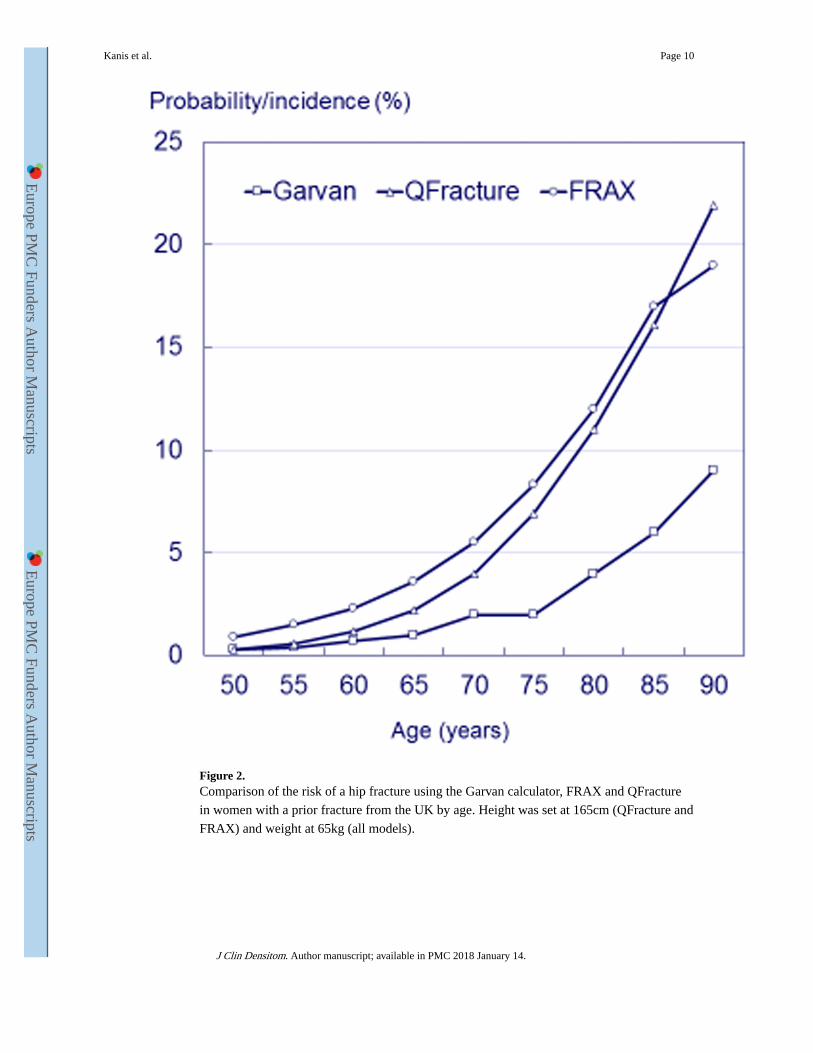
Figure 2. Comparison of the risk of a hip fracture using the Garvan calculator, FRAX and QFracture
in women with a prior fracture from the UK by age. Height was set at 165cm (QFracture and
FRAX) and weight at 65kg (all models).
Kanis et al. Page 10
J Clin Densitom. Author manuscript; available in PMC 2018 January 14.
Europe PM
C Funders A
uthor Manuscripts
Europe PM
C Funders A
uthor Manuscripts
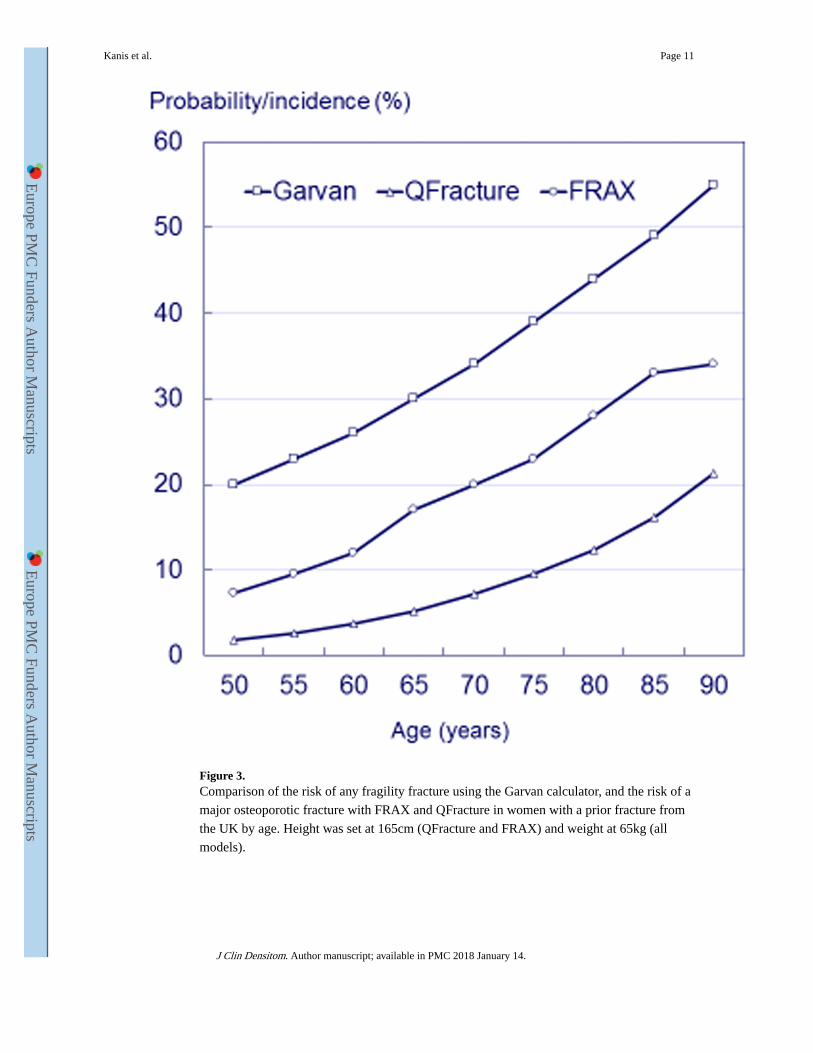
Figure 3. Comparison of the risk of any fragility fracture using the Garvan calculator, and the risk of a
major osteoporotic fracture with FRAX and QFracture in women with a prior fracture from
the UK by age. Height was set at 165cm (QFracture and FRAX) and weight at 65kg (all
models).
Kanis et al. Page 11
J Clin Densitom. Author manuscript; available in PMC 2018 January 14.
Europe PM
C Funders A
uthor Manuscripts
Europe PM
C Funders A
uthor Manuscripts

Figure 4. Comparison of the distribution of FRAX and QFracture (QF) model output by decile of risk
in women for hip fracture (left panel [12] and major fracture (right panel) [33]. The diagonal
line shows the line of identity. [34 with kind permission from Springer Science+Business
Media B.V].
Kanis et al. Page 12
J Clin Densitom. Author manuscript; available in PMC 2018 January 14.
Europe PM
C Funders A
uthor Manuscripts
Europe PM
C Funders A
uthor Manuscripts

Europe PM
C Funders A
uthor Manuscripts
Europe PM
C Funders A
uthor Manuscripts
Kanis et al. Page 13
Table 1
Input risk variables for FRAX, QFracture and the Garvan assessment tools.
Risk factor FRAX Garvan QFracture Comments
Age + + +
Sex + + +
Height + - +
Weight + +* + * only when BMD is not entered
Ethnicity +* - + *US and Singapore
Previous fragility fracture + +* +** *from the age of 50y*also number of prior fractures**prior hip, spine or shoulder
BMD + +* - * site of BMD not specified on website but elsewhere stated to be femoral neck
Parental history of hip fracture + - +* * Also, parental history of OP
Smoking +* - +** *current**categories of exposure
Alcohol intake +* - +** *≥3 units per day**categories of exposure
Taking steroid tablets regularly +* - + *currently exposed to oral glucocorticoids or has been exposed to oral glucocorticoids for more than 3 months at a dose of prednisolone of 5mg daily or more
Osteogenesis imperfecta +* - - * grouped as secondary OP
Diabetes +* - +** *Type 1 grouped as secondary OP** Type 1, type 2
In nursing home - - +
Falls history - +* + *categories of exposure
Dementia - - +
Cancer - - +
Asthma or COPD - - +
Heart attack, angina, stroke or TIA - - +
Chronic liver disease +* - + *grouped as secondary OP
Chronic kidney disease - - +* *stage 4 or 5
Parkinson's disease - - +
Rheumatoid arthritis or SLE +* - + *RA alone
Malabsorption +* - +** *grouped as secondary OP**Crohn's disease, ulcerative colitis, coeliac disease, steatorrhea or blind loop syndrome
Endocrine disorders +* - +** * untreated long-standing hyperthyroidism, hypogonadism**thyrotoxicosis, hyperparathyroidism, Cushing's syndrome
Premature menopause +* - - * (<45 years) grouped as secondary OP
Epilepsy or taking anticonvulsants - - +
Taking antidepressants - - +
Chronic malnutrition +* - - *grouped as secondary OP
HRT - - +* * oestrogen only
J Clin Densitom. Author manuscript; available in PMC 2018 January 14.

Europe PM
C Funders A
uthor Manuscripts
Europe PM
C Funders A
uthor Manuscripts
Kanis et al. Page 14
HRT hormone replacement therapy; OP osteoporosis: SLE systemic lupus erythematosus
J Clin Densitom. Author manuscript; available in PMC 2018 January 14.

Europe PM
C Funders A
uthor Manuscripts
Europe PM
C Funders A
uthor Manuscripts
Kanis et al. Page 15
Table 2
Comparative features of the Garvan tool, QFracture and FRAX.
Garvan QFracture FRAX
Externally validated Yes (Canada) Yes (UK only) Yes, internationally
Calibrated No Yes (hip only) Yes
Applicability Uncertain UK 58 countries
Falls as an input variable Yes Yes No
BMD as an input variable Yes* No Yes
Prior fracture as an input variable Yes Yes Yes
Family history as an input variable No Yes Yes
Outcome All fractures excluding digits Hip, forearm, spine, shoulder Hip, forearm, spine, humerus
Outcome metric Incidence Incidence Probability
*site of BMD not specified on website
J Clin Densitom. Author manuscript; available in PMC 2018 January 14.