Embed Size (px)
Citation preview
Overview of Retinal Prosthesis Lecture
• Eye structure and function, emphasis on the retina
• Eye disease• Retinal prostheses as a potential solution
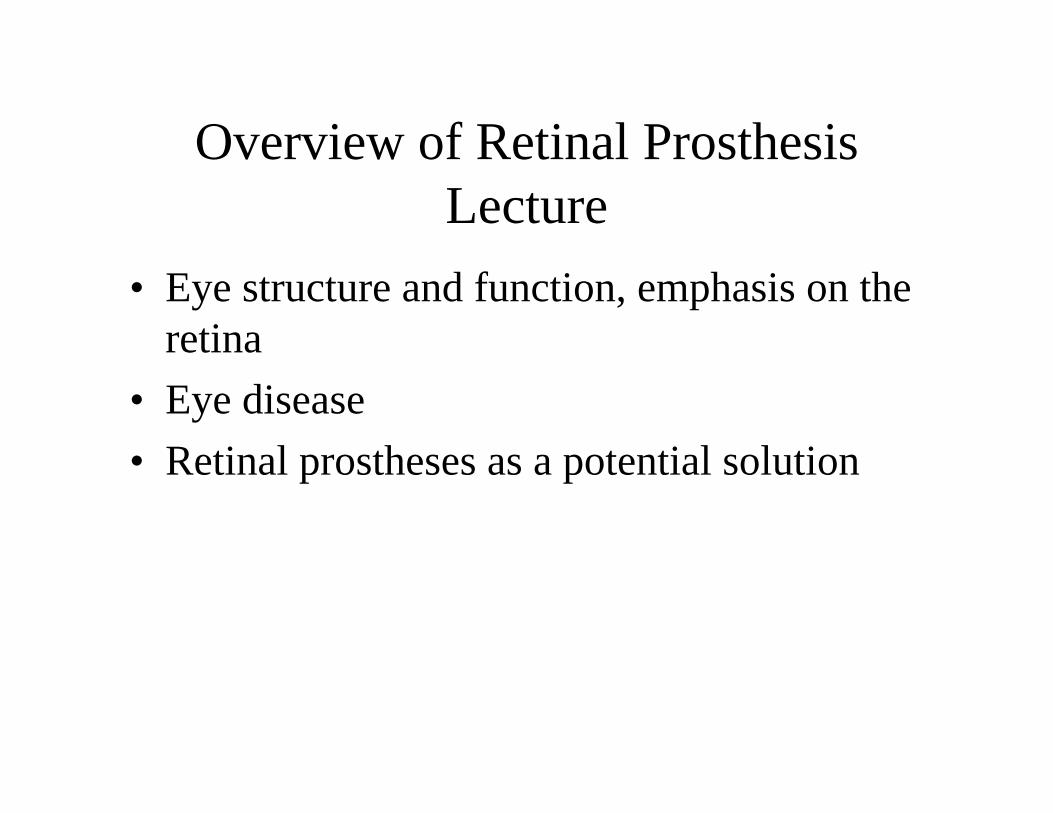
Outside the EyeD
E
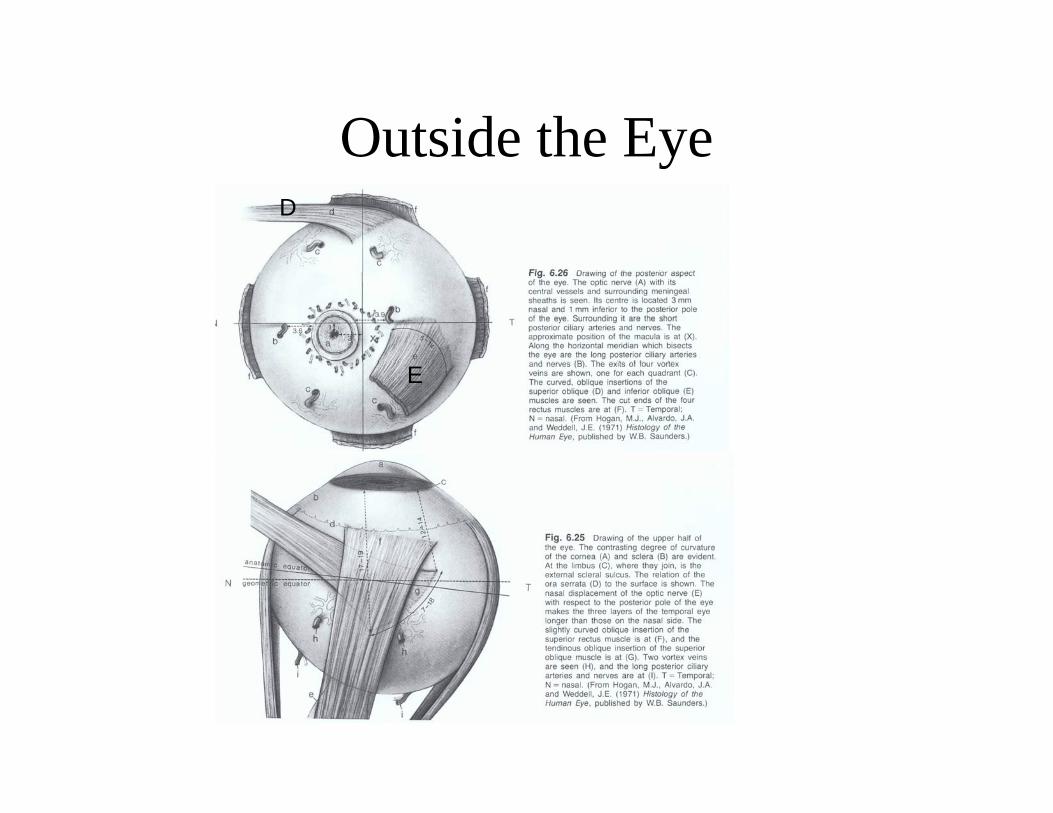
Layers of the Eyeball
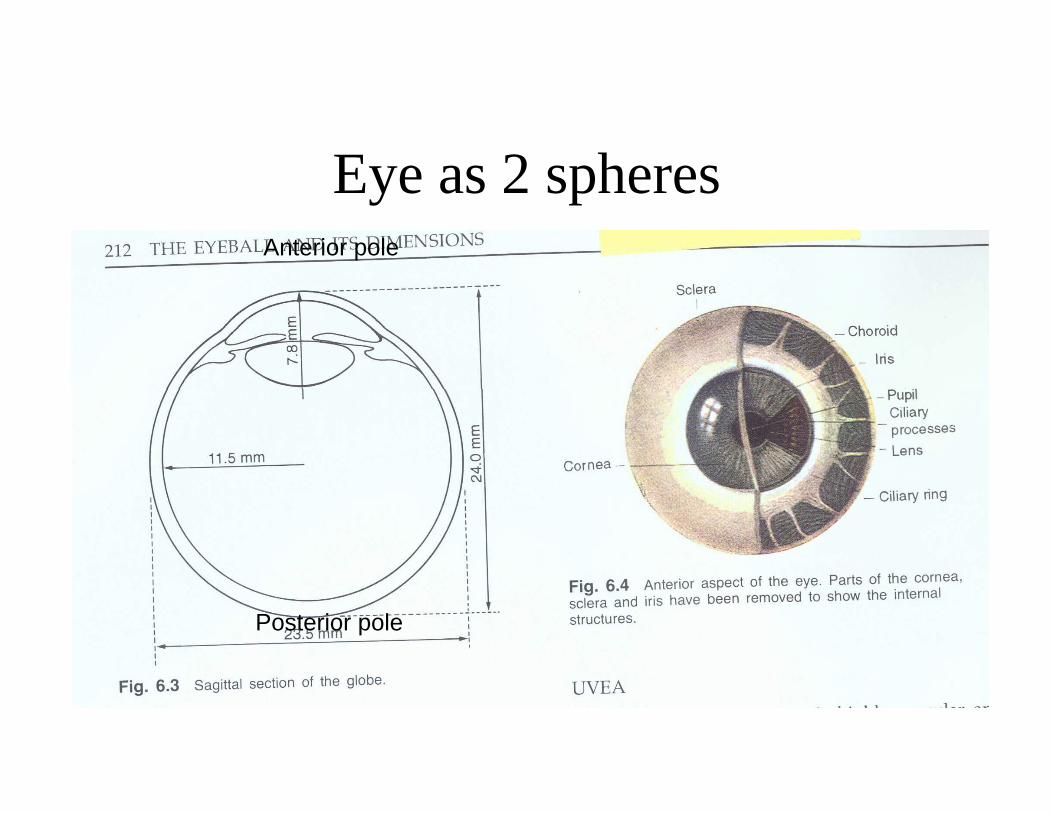
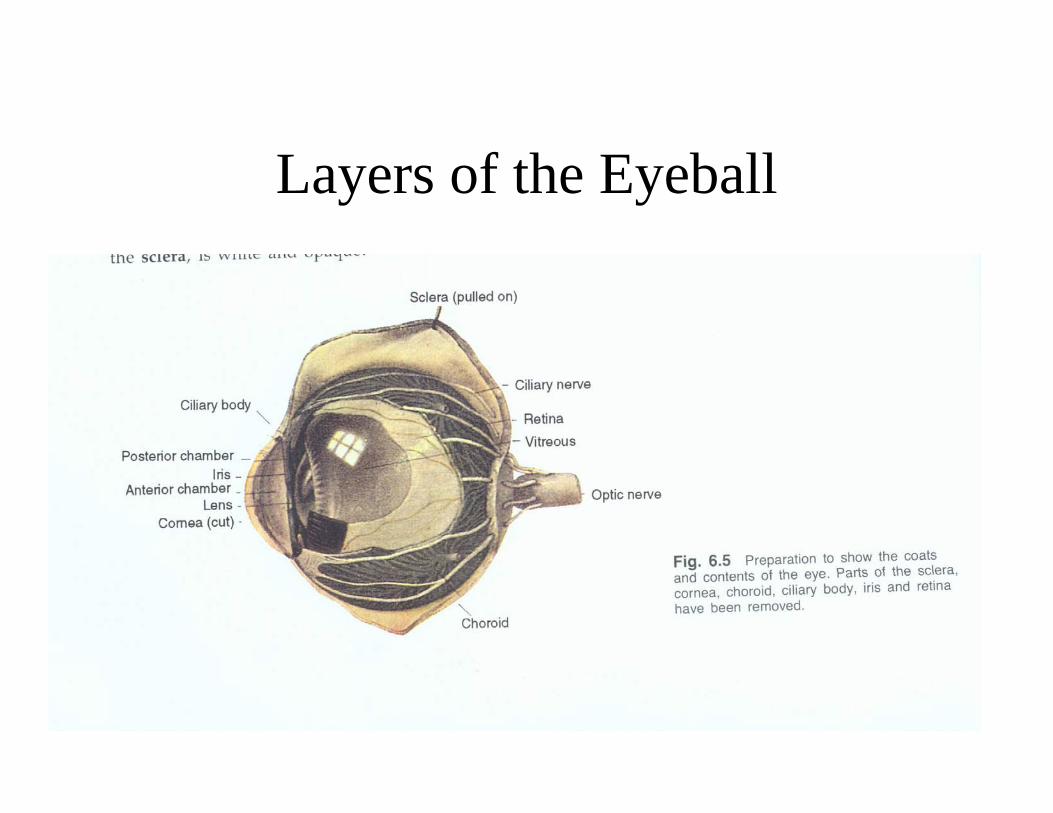
Eye as 2 spheresAnterior pole
Posterior pole
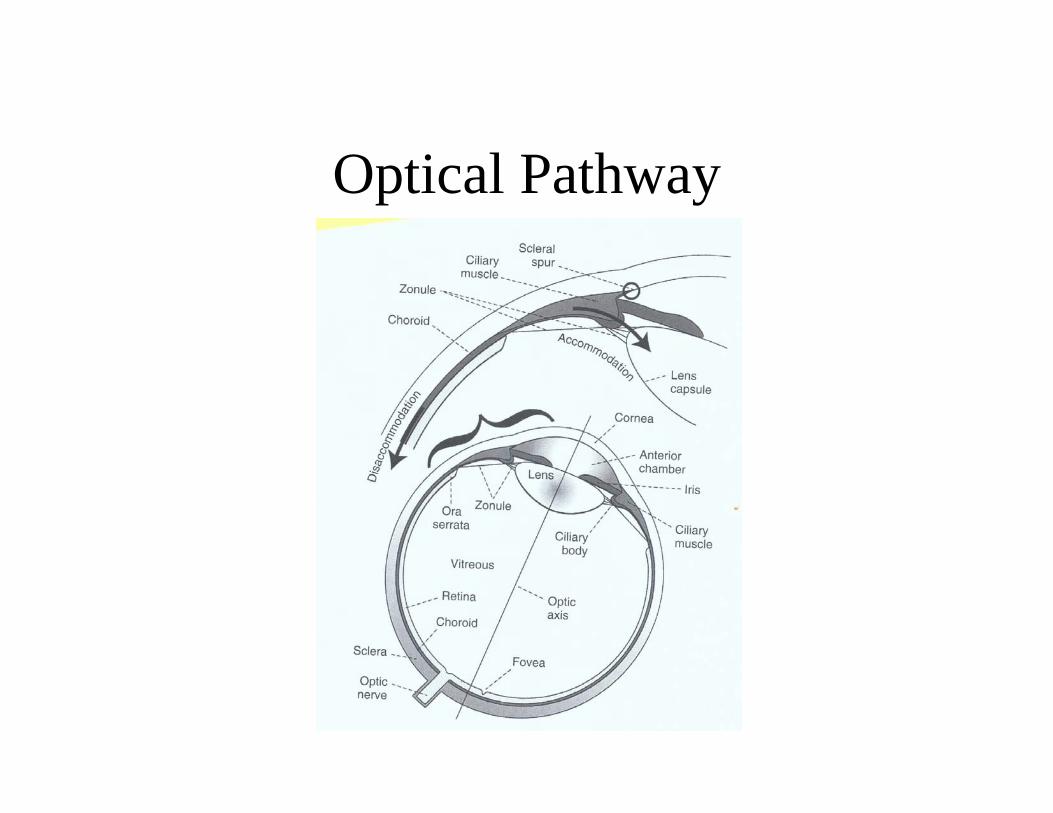
Optical Pathway
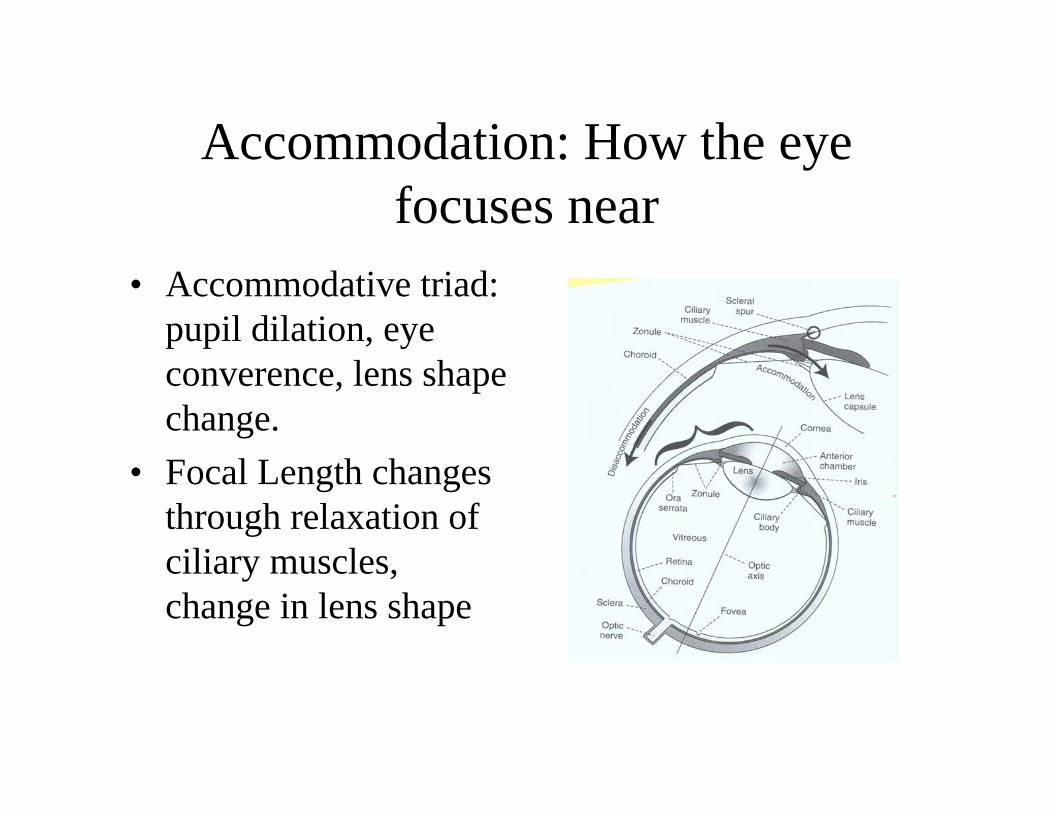
Accommodation: How the eye focuses near
• Accommodative triad: pupil dilation, eye converence, lens shape change.
• Focal Length changes through relaxation of ciliary muscles, change in lens shape
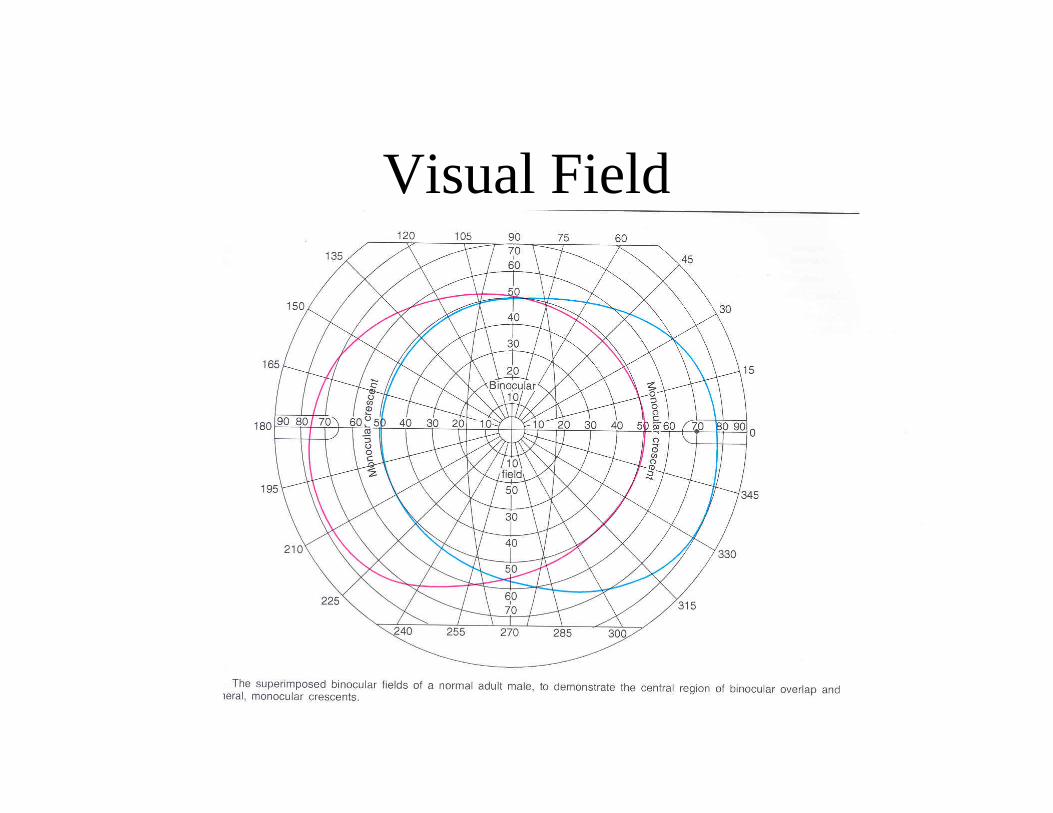
Visual Field
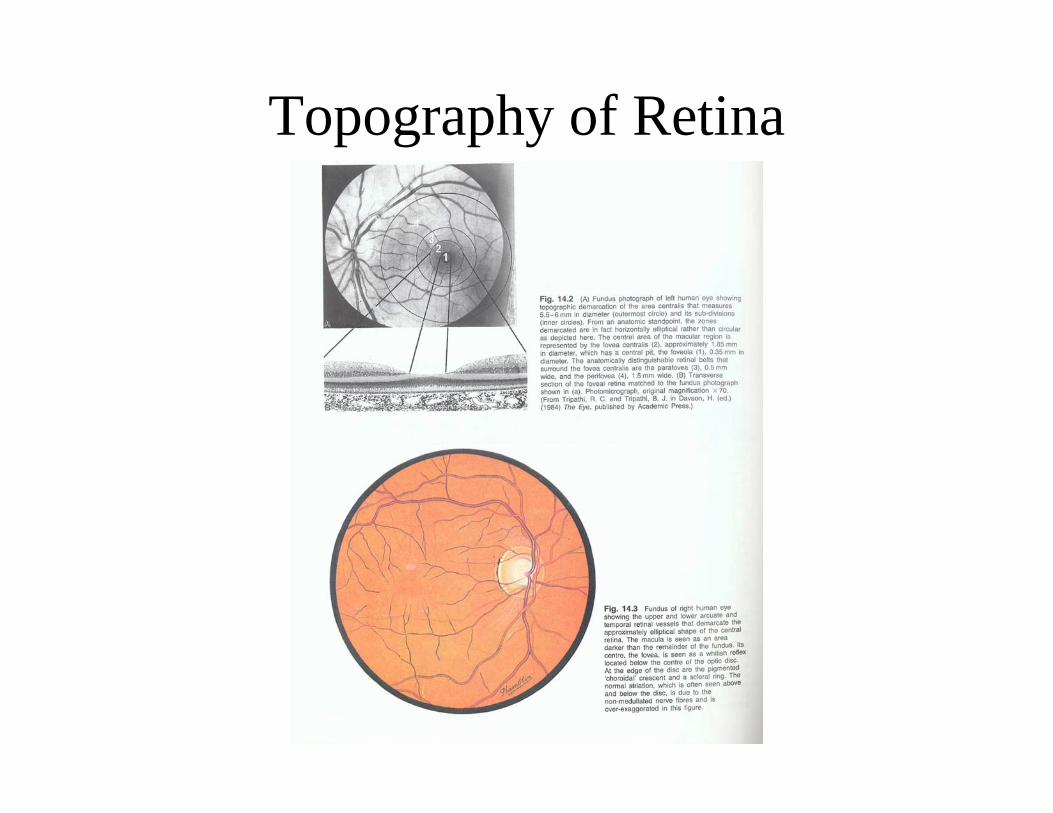
Topography of Retina
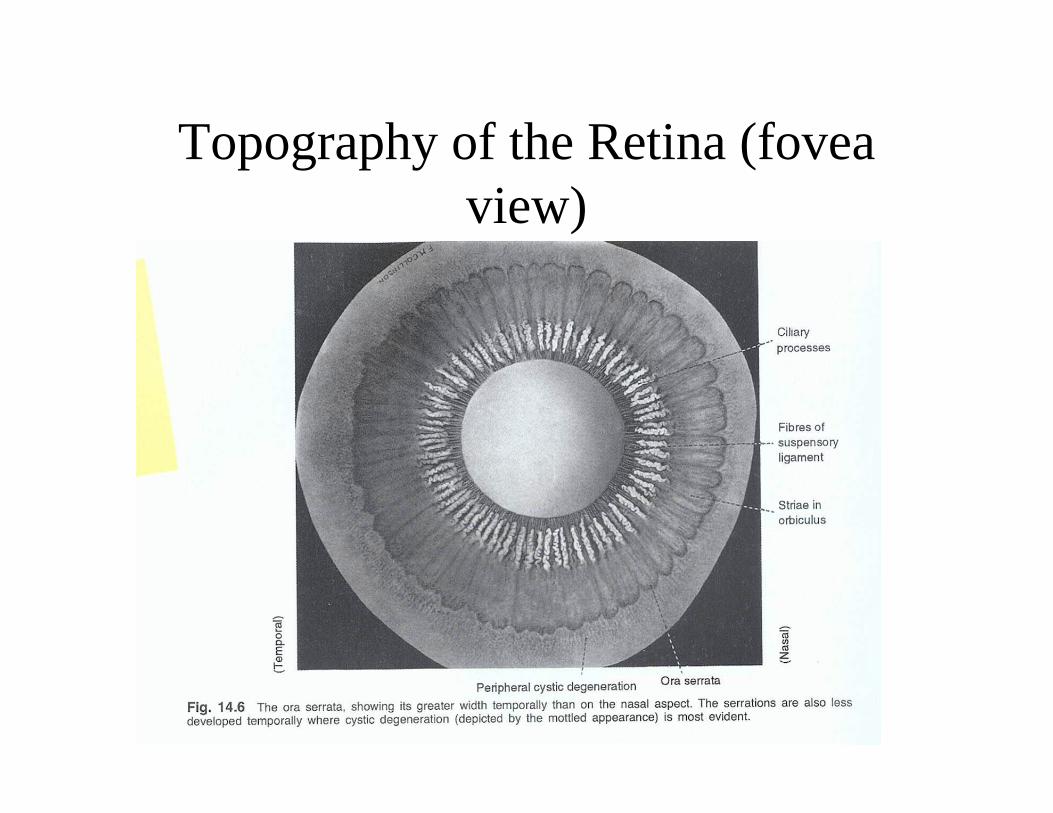
Topography of the Retina (fovea view)
Blind Spot
1 2
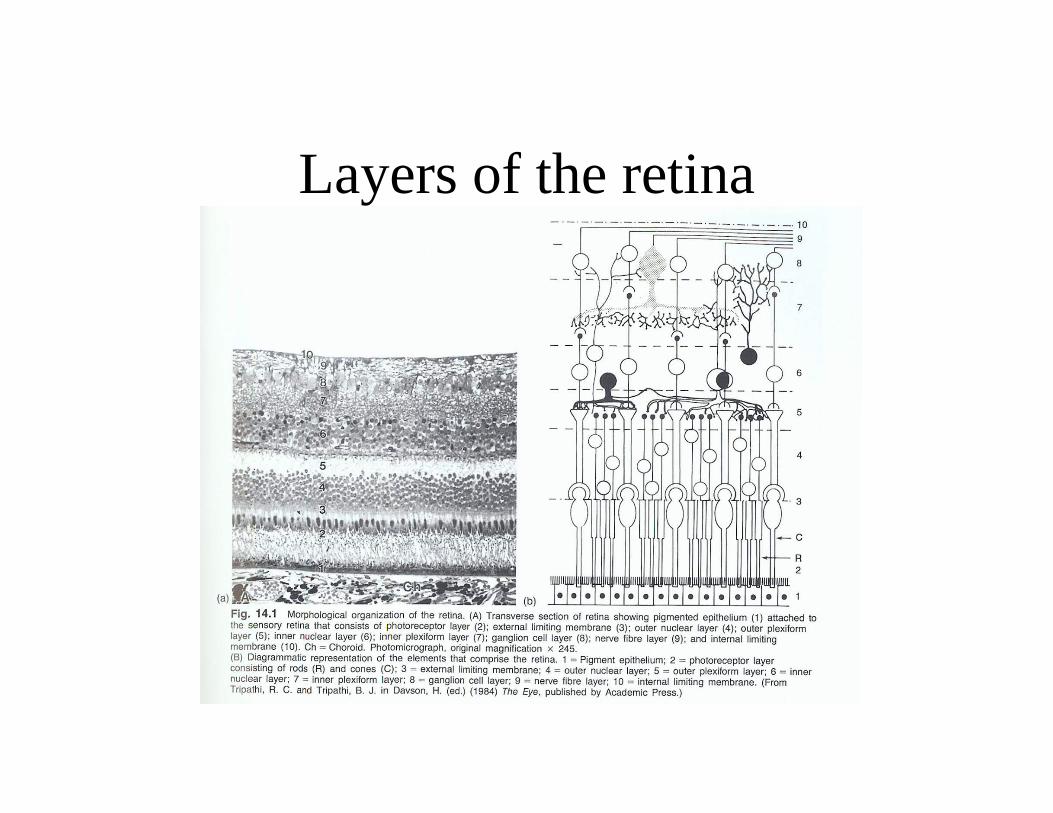
Layers of the retina
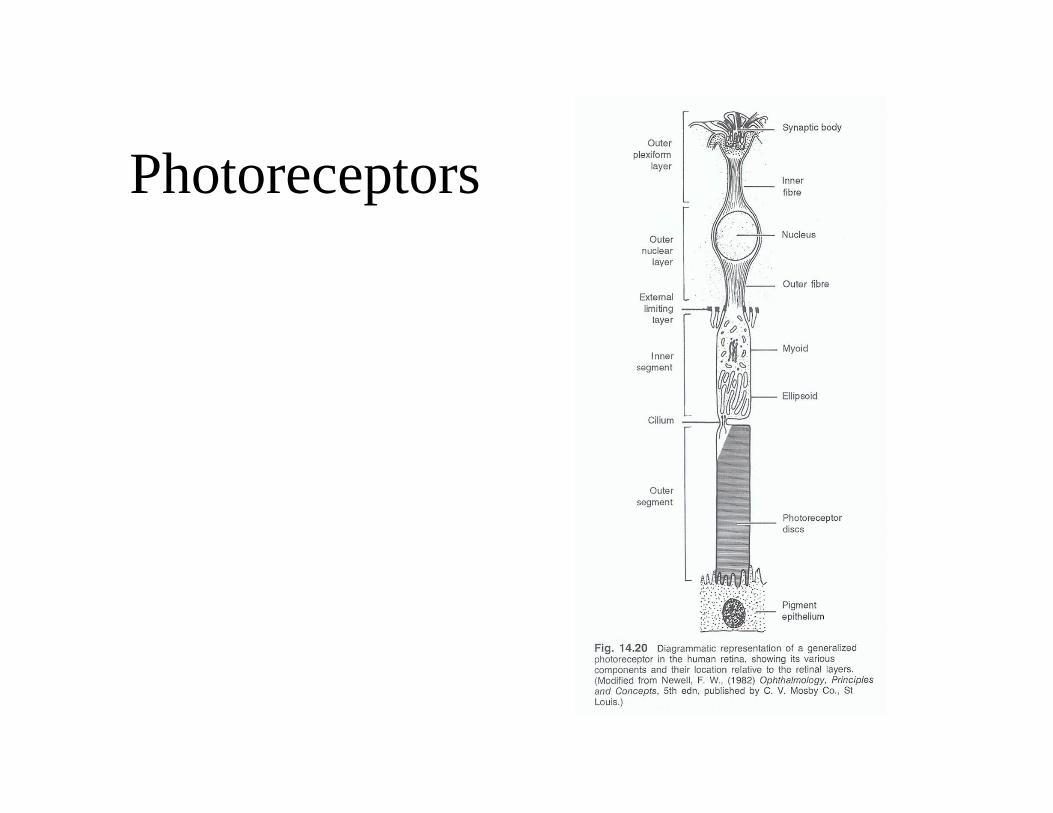
Photoreceptors
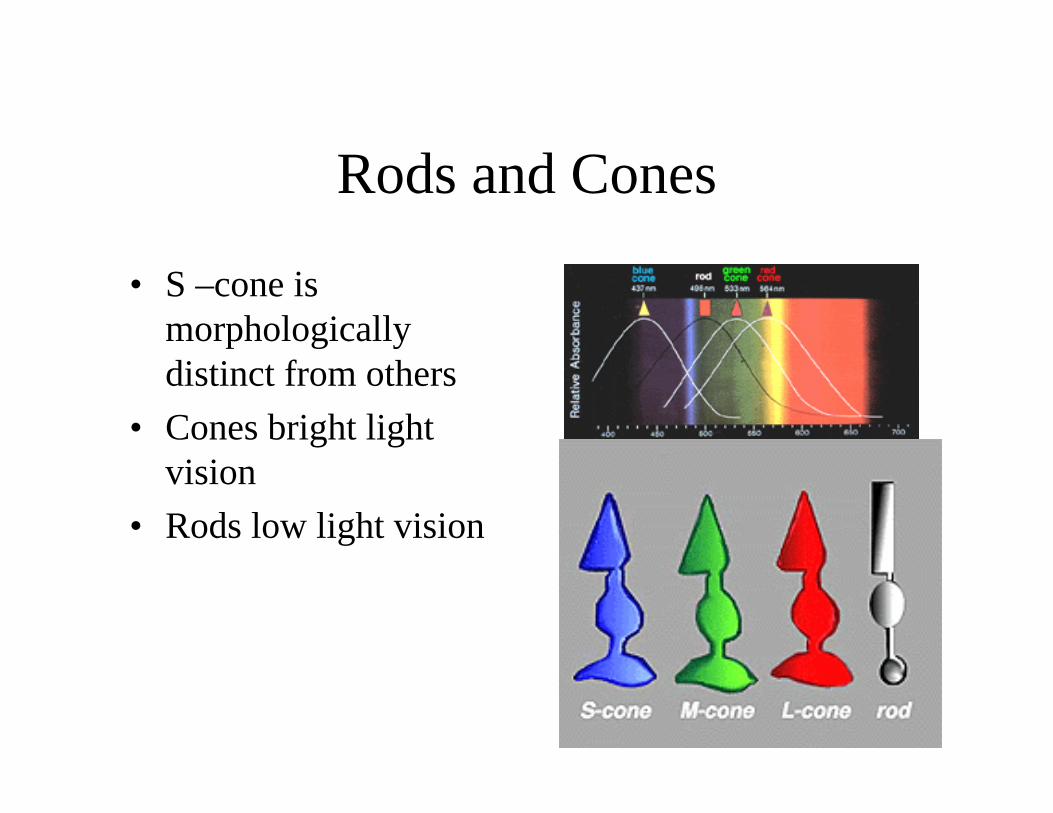
Rods and Cones
• S –cone is morphologically distinct from others
• Cones bright light vision
• Rods low light vision
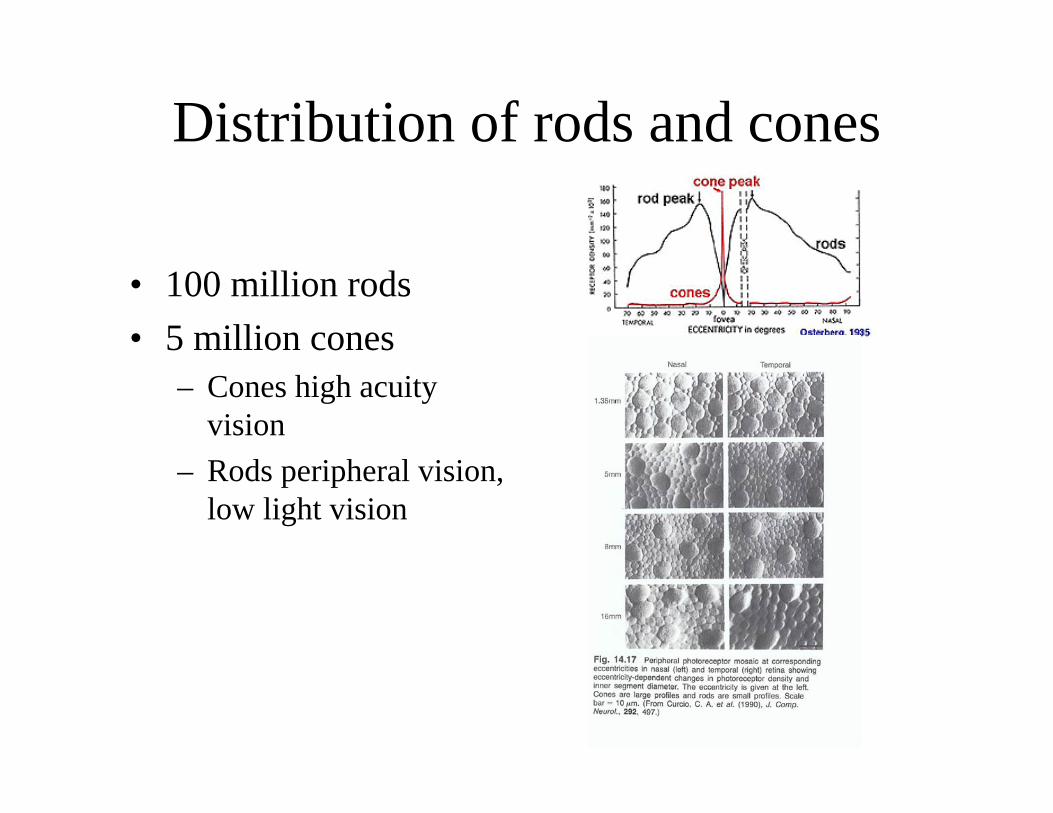
Distribution of rods and cones
• 100 million rods• 5 million cones
– Cones high acuity vision
– Rods peripheral vision, low light vision
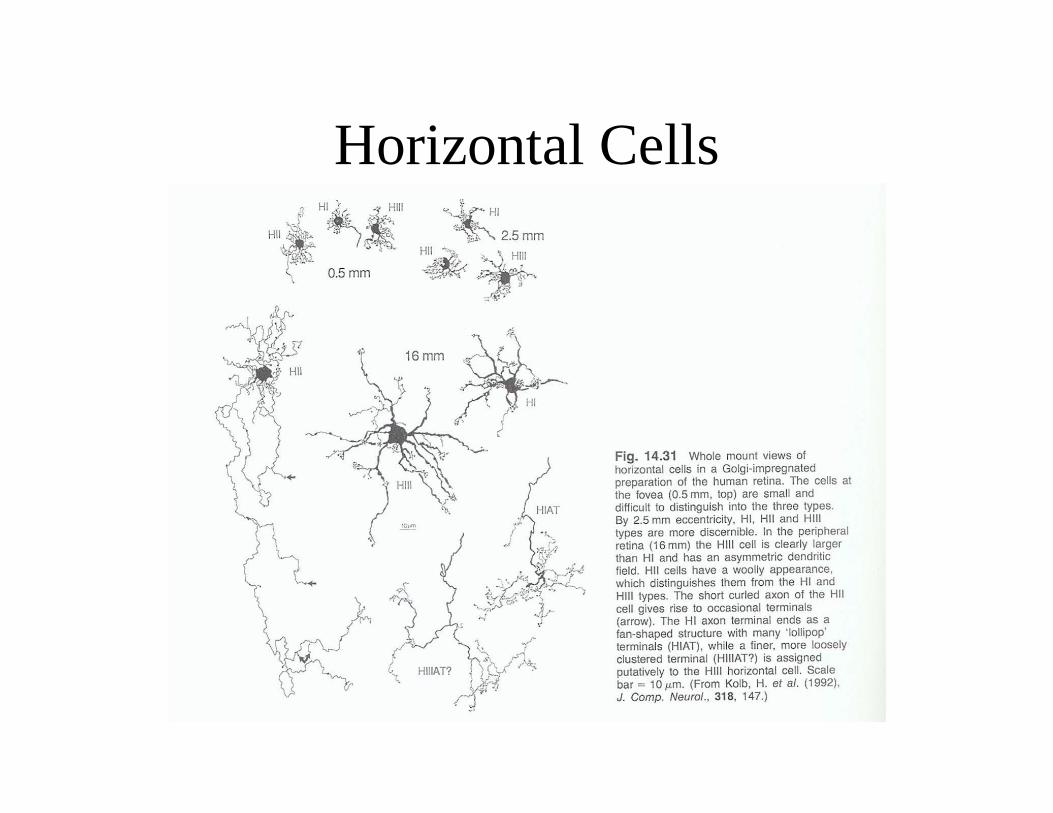
Horizontal Cells
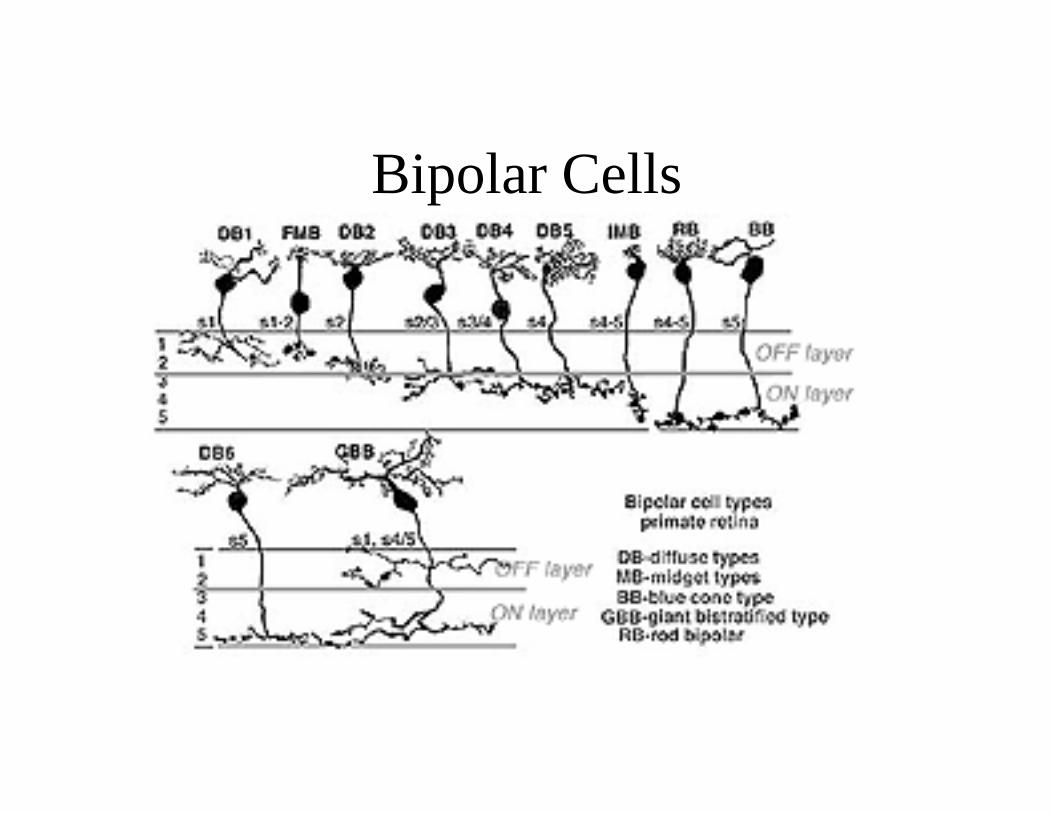
Bipolar Cells
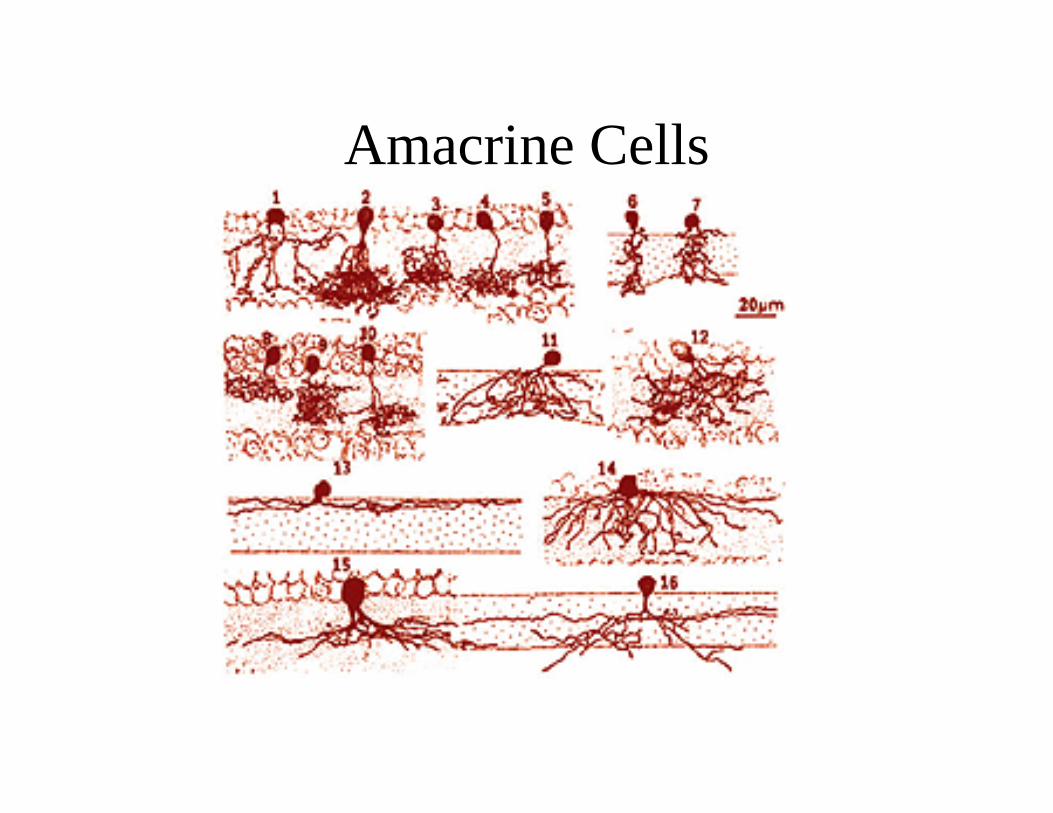
Amacrine Cells
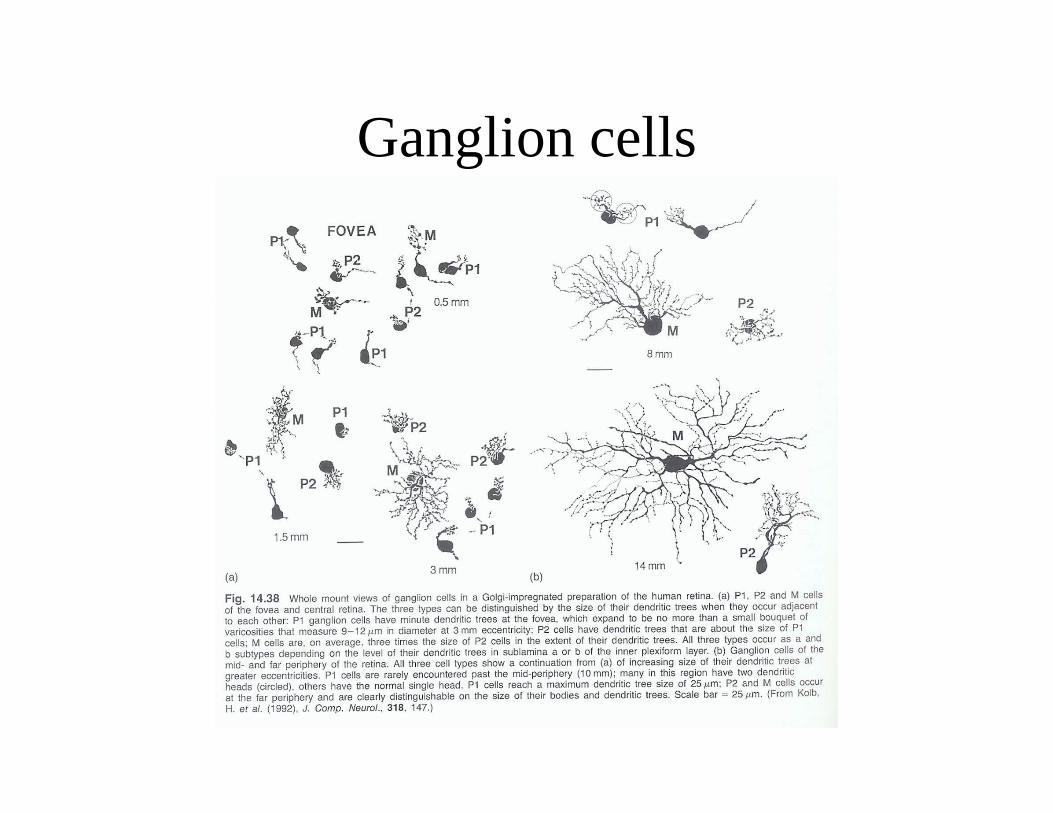
Ganglion cells
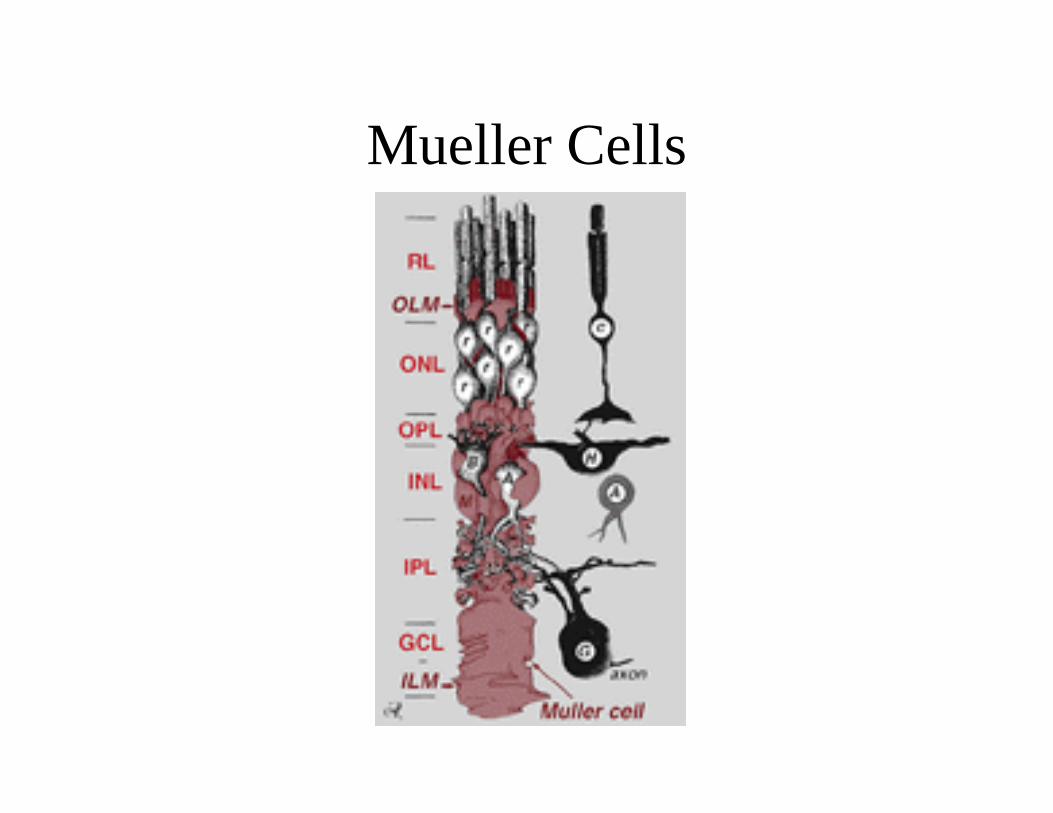
Mueller Cells
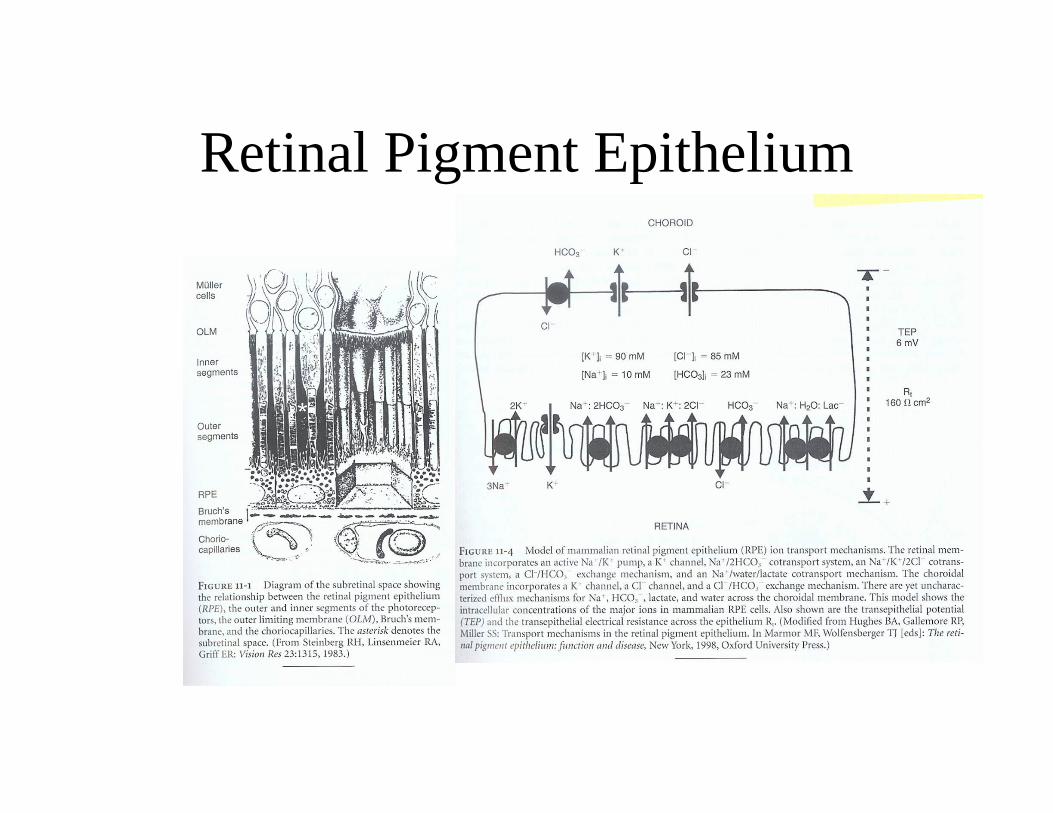
Retinal Pigment Epithelium
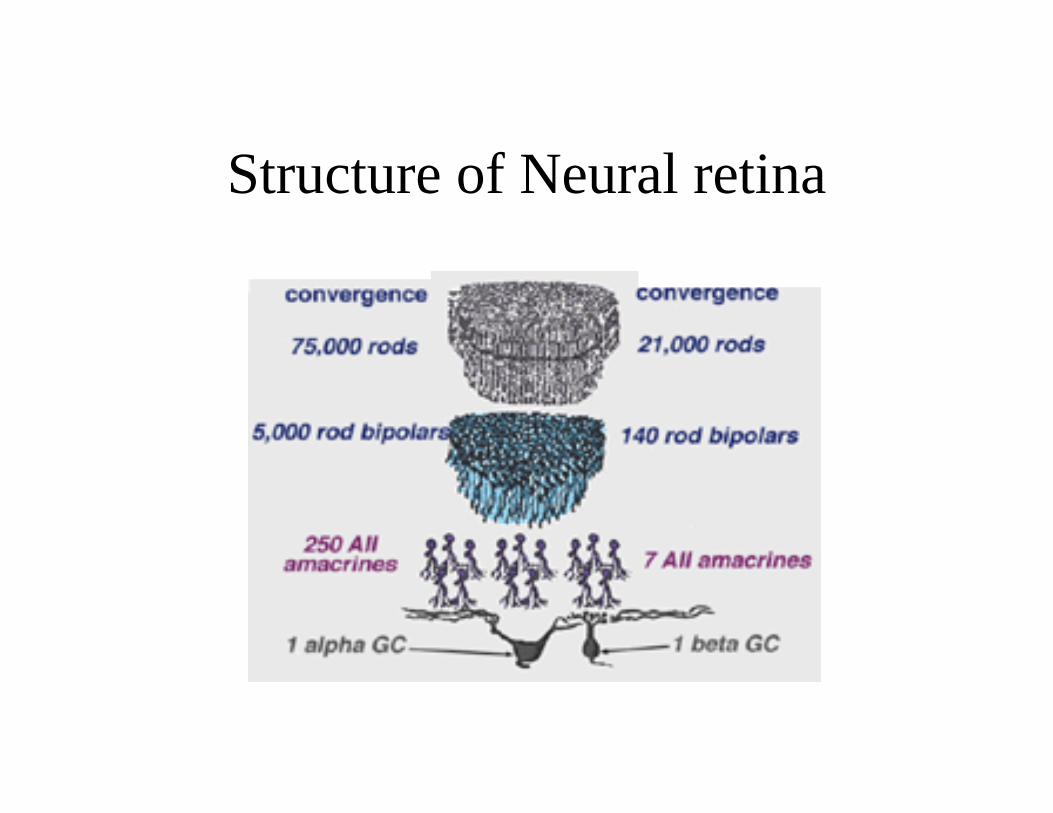
Structure of Neural retina
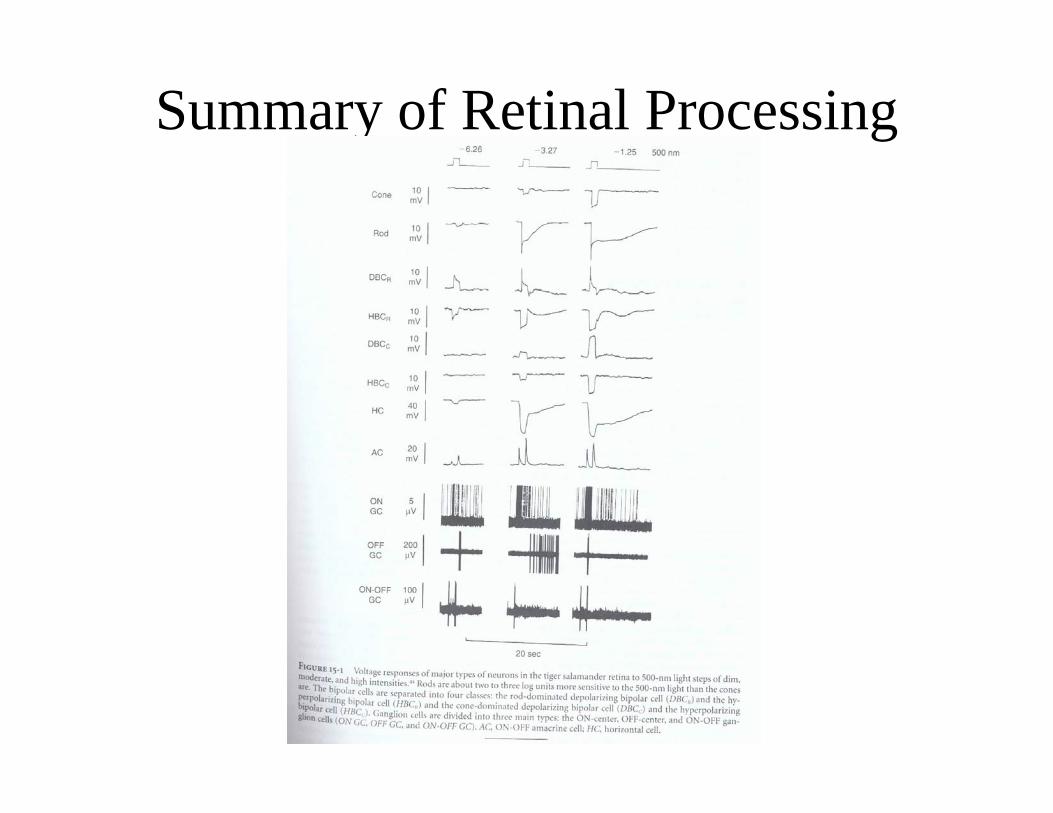
Summary of Retinal Processing
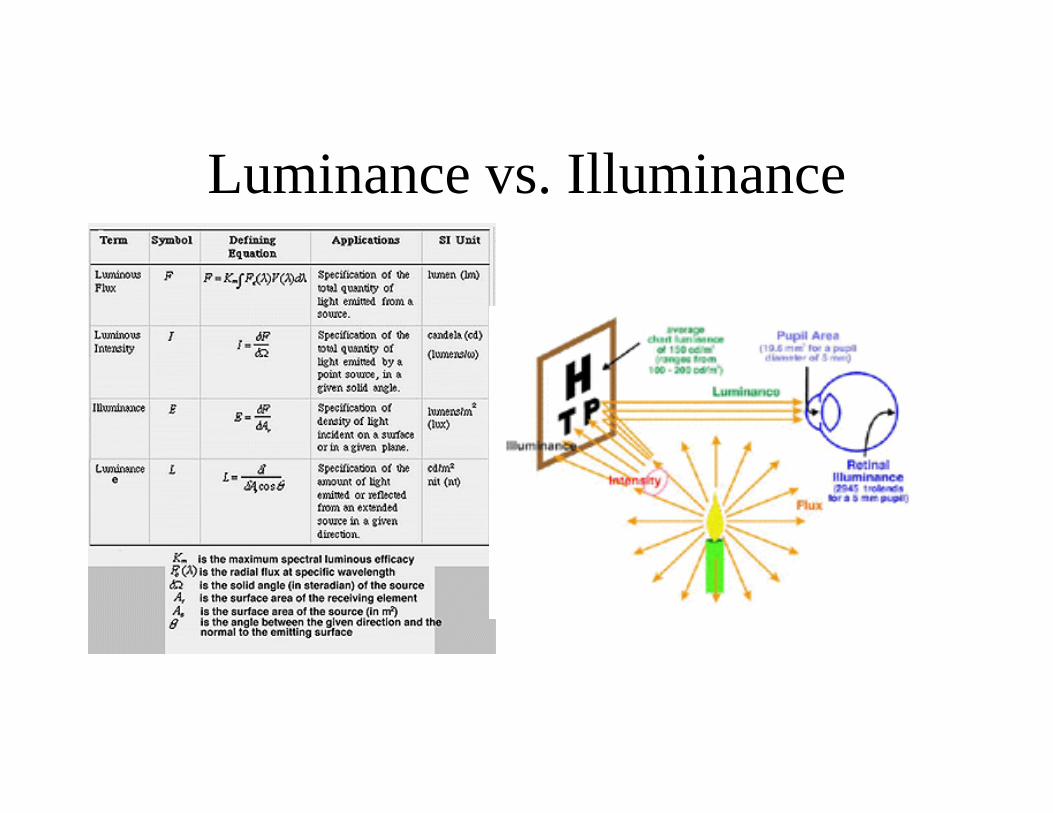
Luminance vs. Illuminance
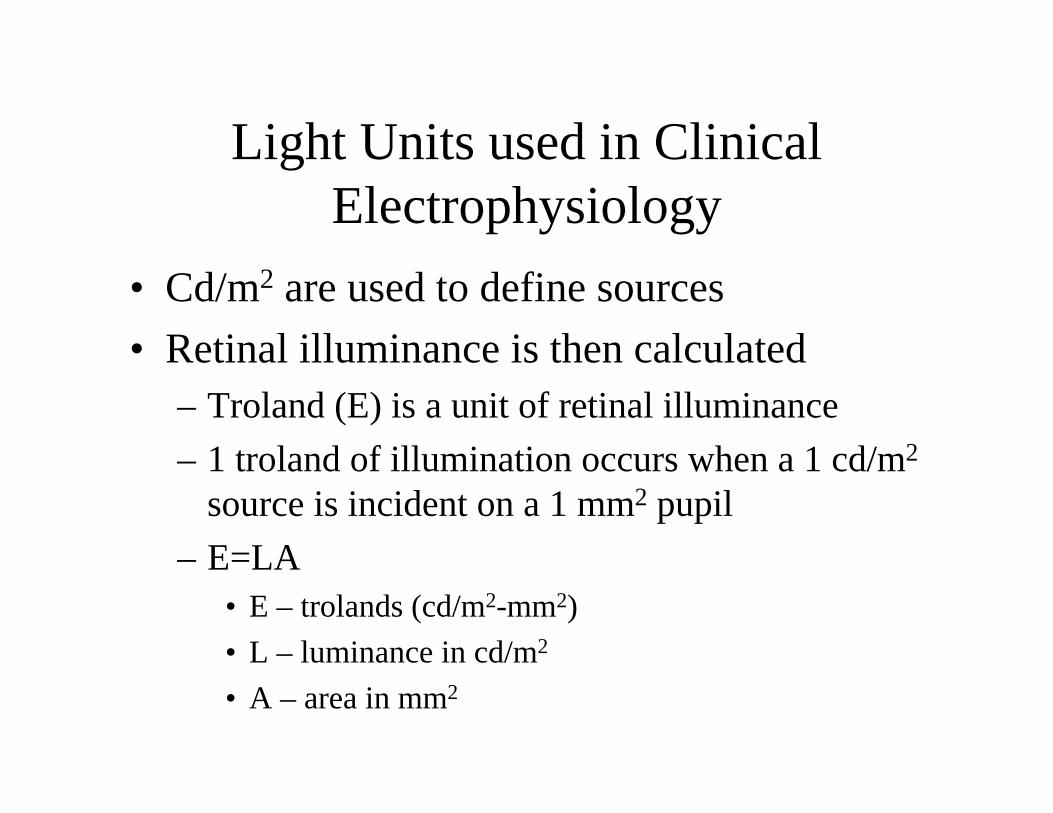
Light Units used in Clinical Electrophysiology
• Cd/m2 are used to define sources• Retinal illuminance is then calculated
– Troland (E) is a unit of retinal illuminance– 1 troland of illumination occurs when a 1 cd/m2
source is incident on a 1 mm2 pupil– E=LA
• E – trolands (cd/m2-mm2)• L – luminance in cd/m2
• A – area in mm2
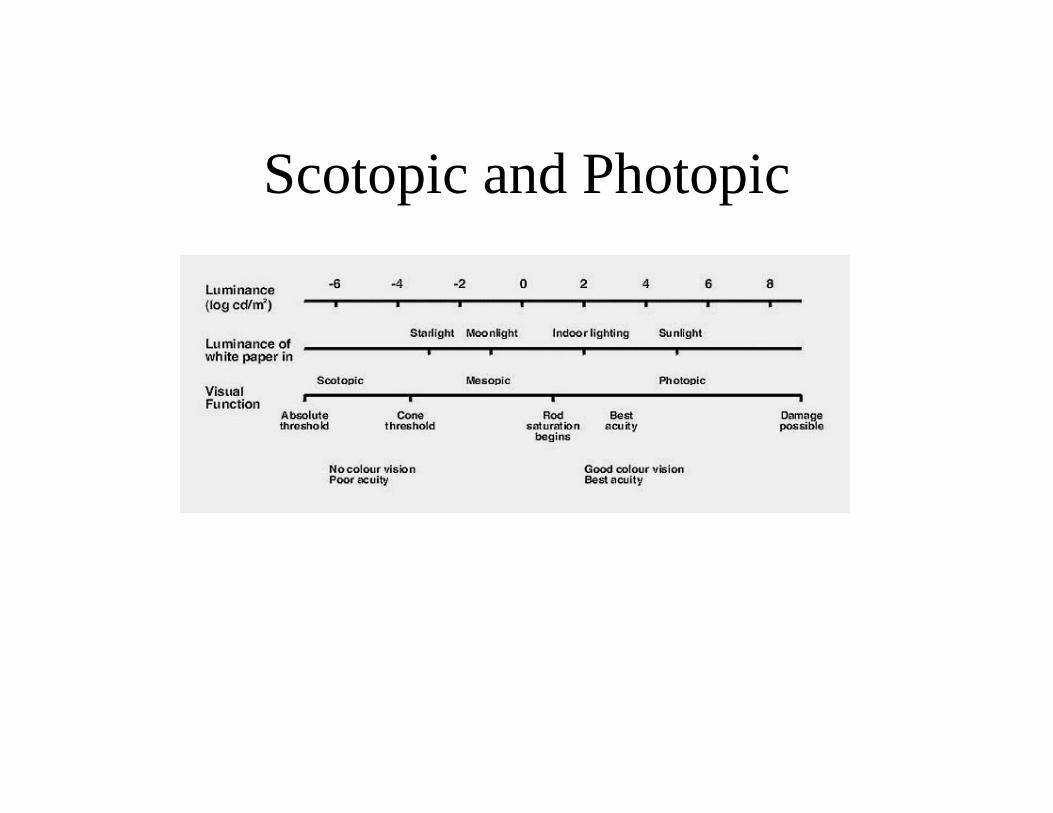
Scotopic and Photopic
Temporal Resolution
• It takes 40-50 ms for a light flash to be processed by the retina (i.e. response seen in optic nerve, dependent of light intensity, object size, and image eccentricity.
• If the rate at which light changes is fast enough, we perceive it as continuous. If the rate is too slow, we see the flicker. The slowest rate at which it appears continuous is the critical flicker fusion.
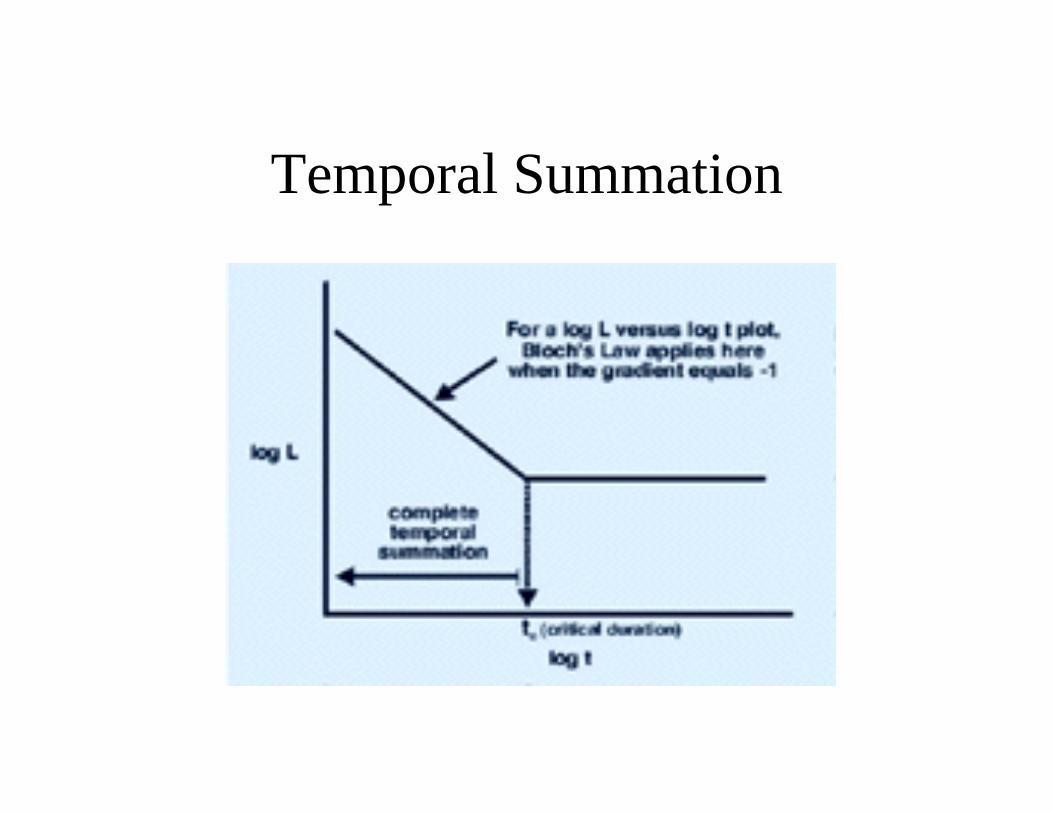
Temporal Summation
Ferry-Porter Law
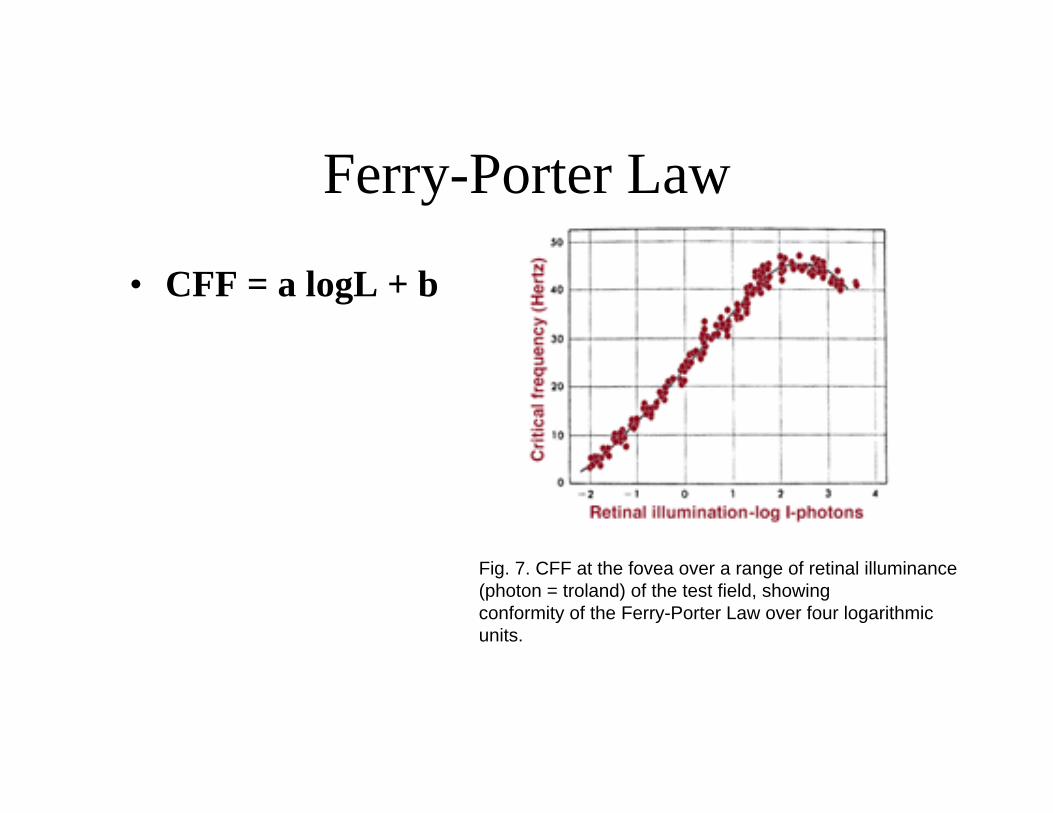
• CFF = a logL + b
Fig. 7. CFF at the fovea over a range of retinal illuminance(photon = troland) of the test field, showing conformity of the Ferry-Porter Law over four logarithmic units.
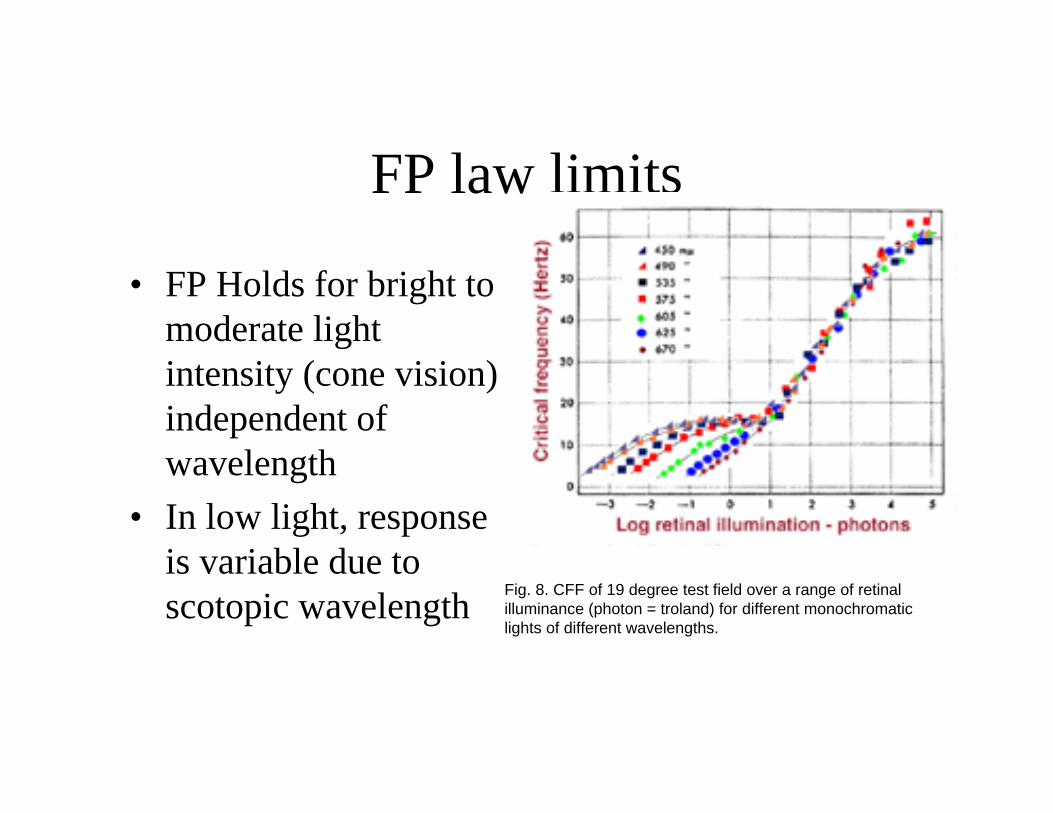
FP law limits
• FP Holds for bright to moderate light intensity (cone vision) independent of wavelength
• In low light, response is variable due to scotopic wavelength Fig. 8. CFF of 19 degree test field over a range of retinal
illuminance (photon = troland) for different monochromatic lights of different wavelengths.

CFF Effect of Size
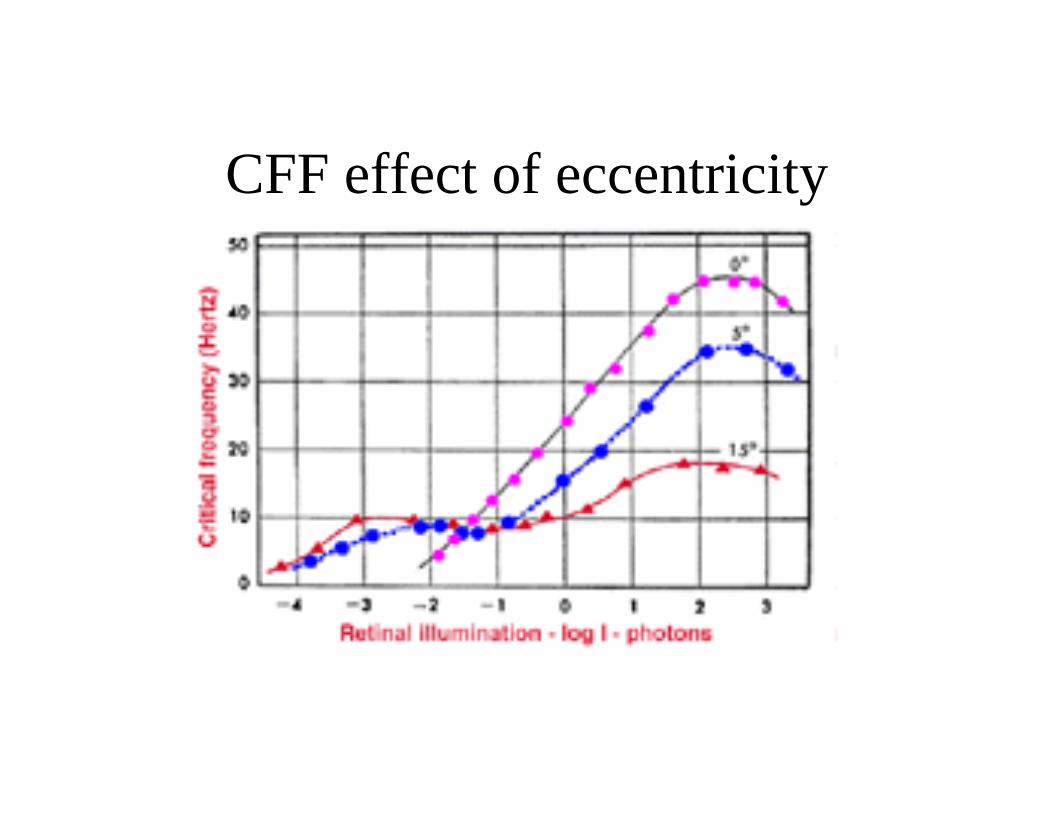
CFF effect of eccentricity
Summary of retinal function• Eye is a sphere that rotates in a “socket” under control of
the oculomotor system• Eye gaze focus the image of interest on the fovea, the
central part of primate retina that has the highest acuity vision. The fovea is only 1 degree of visual field
• Eye gaze can be redirected by excitation of peripheral retina
• Retina varies from fovea to periphery in accordance with the function of the region
• Cones detect color vision, daytime and well lit conditions• Rods detect low vision• Rod system trades sensitivity for acuity
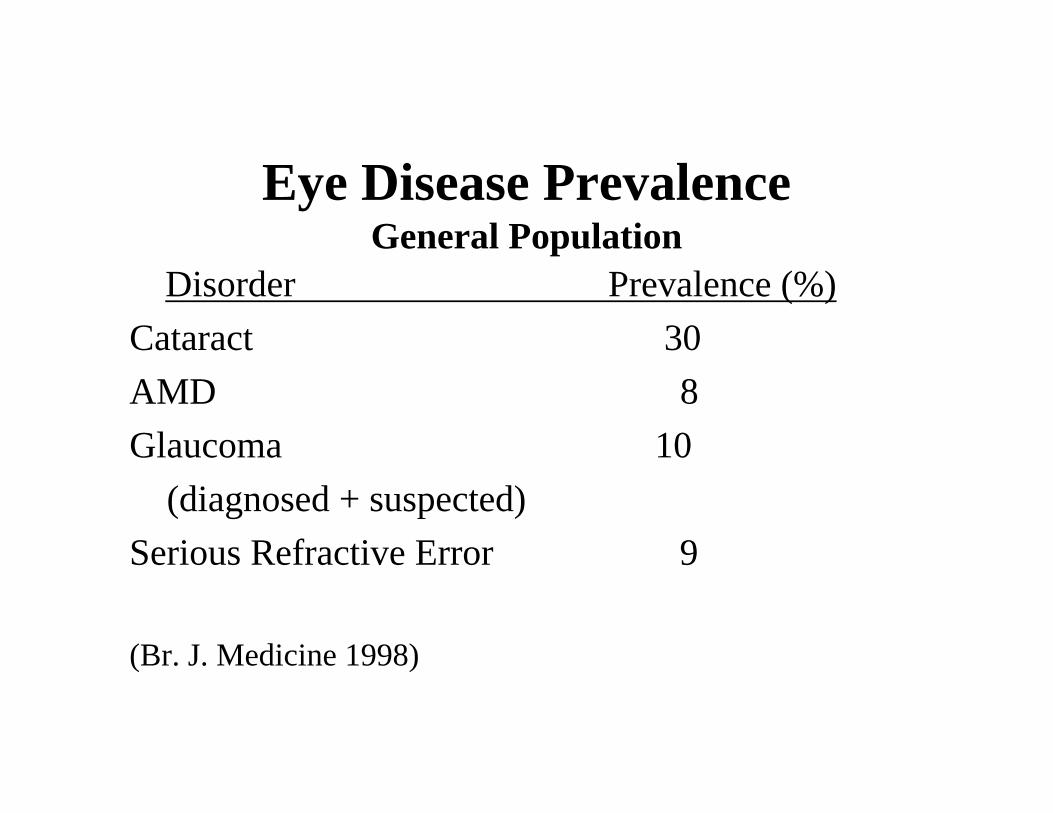
Disorder Prevalence (%)Cataract 30AMD 8Glaucoma 10
(diagnosed + suspected)Serious Refractive Error 9
(Br. J. Medicine 1998)
Eye Disease PrevalenceGeneral Population

Cataract: A “Socioeconomic”Disease?
• Due to the high success rate and great safety of cataract surgery in developed countries, cataracts are much less of a health problem today than a few decades ago. Of course, it is still a major health problem in less developed countries.
• Much of this progress is due to advances in microsurgery.
• Because of this success though, I will not focus on further needs in this area.
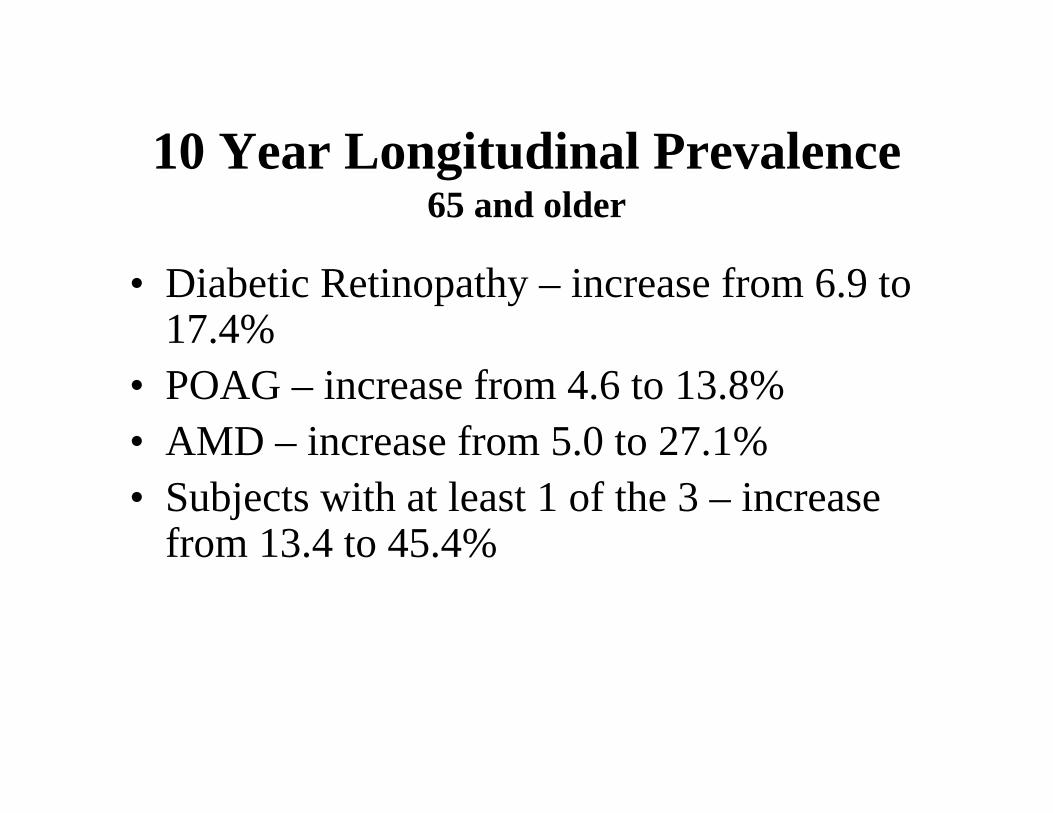
10 Year Longitudinal Prevalence65 and older
• Diabetic Retinopathy – increase from 6.9 to 17.4%
• POAG – increase from 4.6 to 13.8%• AMD – increase from 5.0 to 27.1%• Subjects with at least 1 of the 3 – increase
from 13.4 to 45.4%
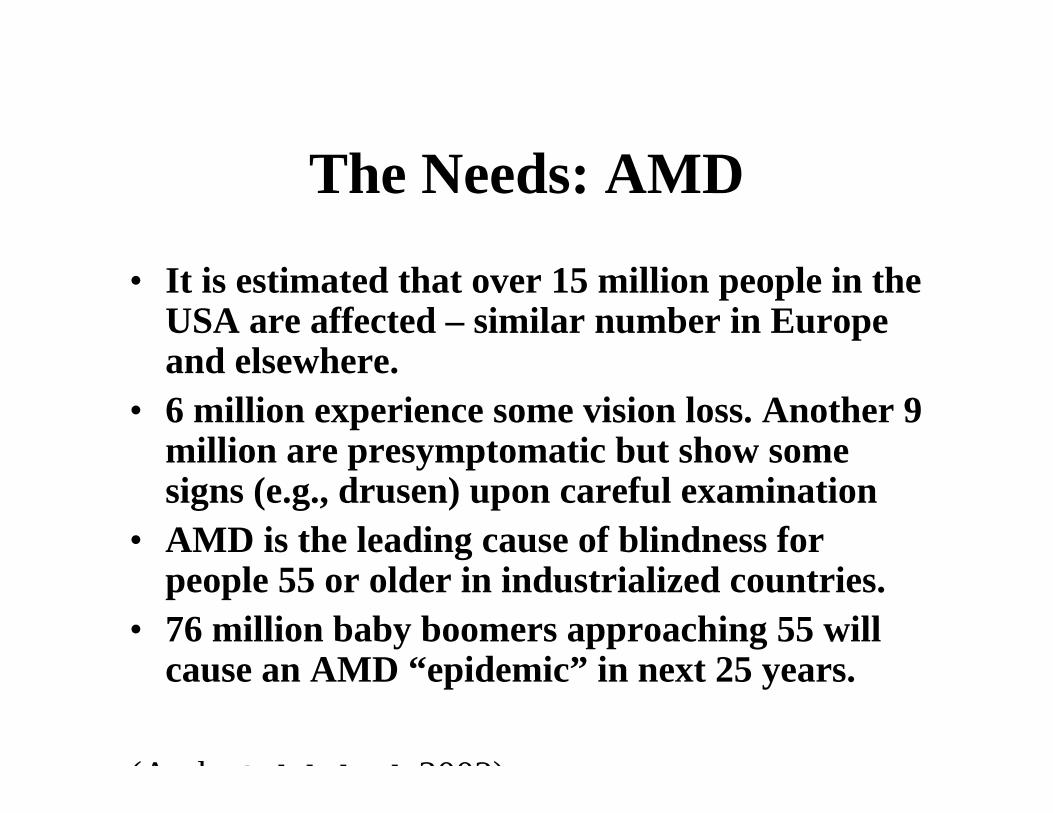
The Needs: AMD
• It is estimated that over 15 million people in the USA are affected – similar number in Europe and elsewhere.
• 6 million experience some vision loss. Another 9 million are presymptomatic but show some signs (e.g., drusen) upon careful examination
• AMD is the leading cause of blindness for people 55 or older in industrialized countries.
• 76 million baby boomers approaching 55 will cause an AMD “epidemic” in next 25 years.
(A h O h h l l 2003)
0
50
100
150
200
250
300
350
400
2000
2005
2010
2015
2020
2025
2030
2035
2040
2045
2050
% c
hang
e
Year
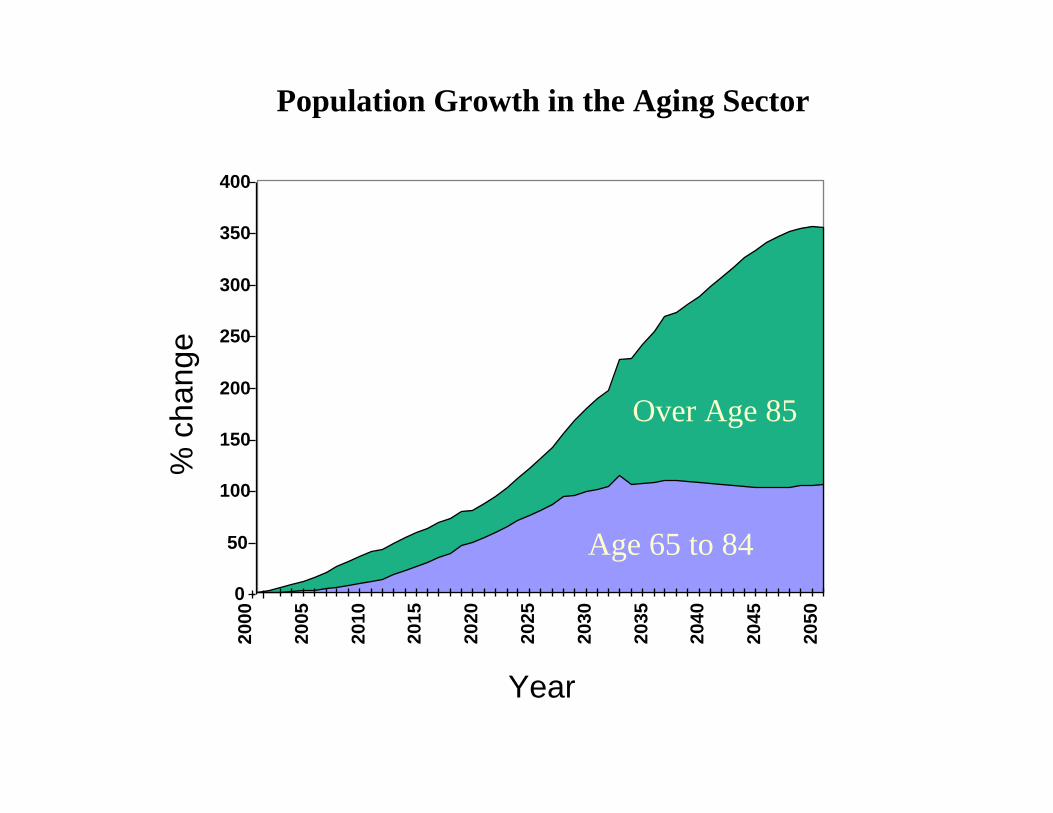
Over Age 85
Age 65 to 84
Population Growth in the Aging Sector
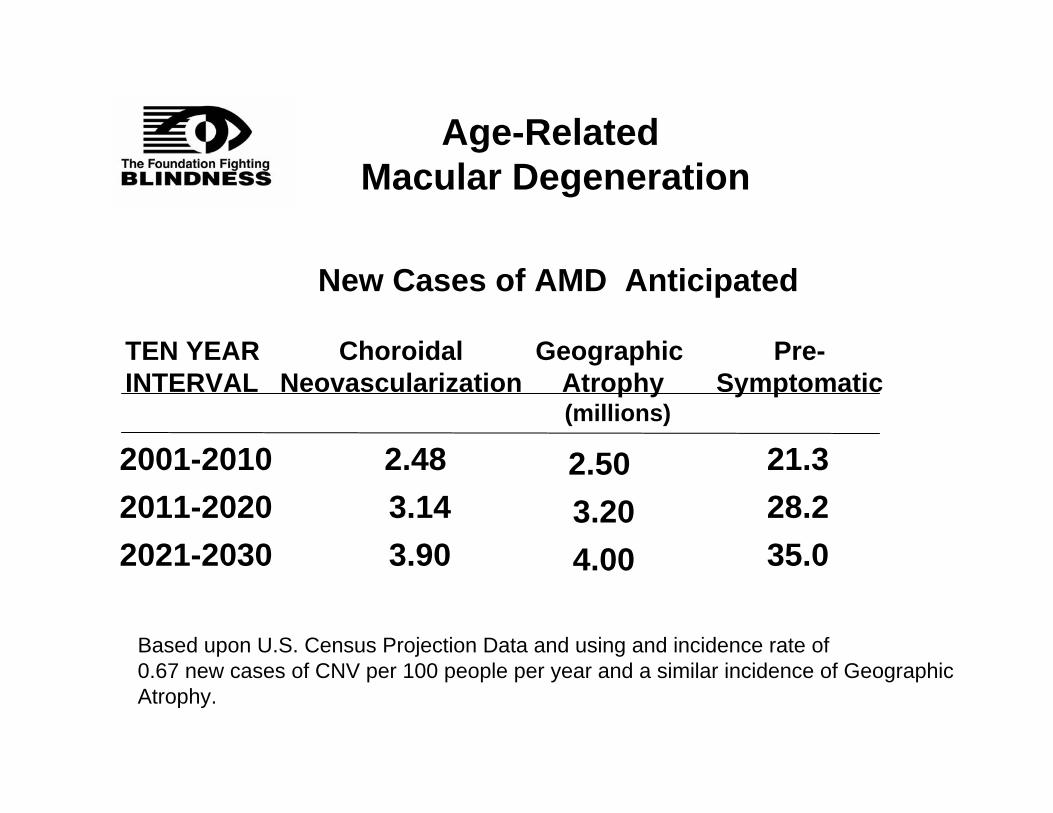
Age-Related Macular Degeneration
Based upon U.S. Census Projection Data and using and incidence rate of 0.67 new cases of CNV per 100 people per year and a similar incidence of GeographicAtrophy.
New Cases of AMD Anticipated
2001-20102011-20202021-2030
ChoroidalNeovascularization
Pre-Symptomatic
TEN YEARINTERVAL
2.48 3.143.90
21.328.235.0
(millions)
2.503.204.00
Geographic Atrophy
The Needs: RP and JMDThe Retinitis Pigmentosa family and Juvenile Macular
Degeneration grouping of diseases are:a. Chronic, life long diseaseb. Most are early age onset (<21 yrs of age)c. This leaves many otherwise health people
visually impaired for most of their lifed. Over 200,000 affected by RP/JMD and allied
diseases in the US, proportionally comparable numbers around the word
These are “Orphan Diseases” for which no effective treatments are available.
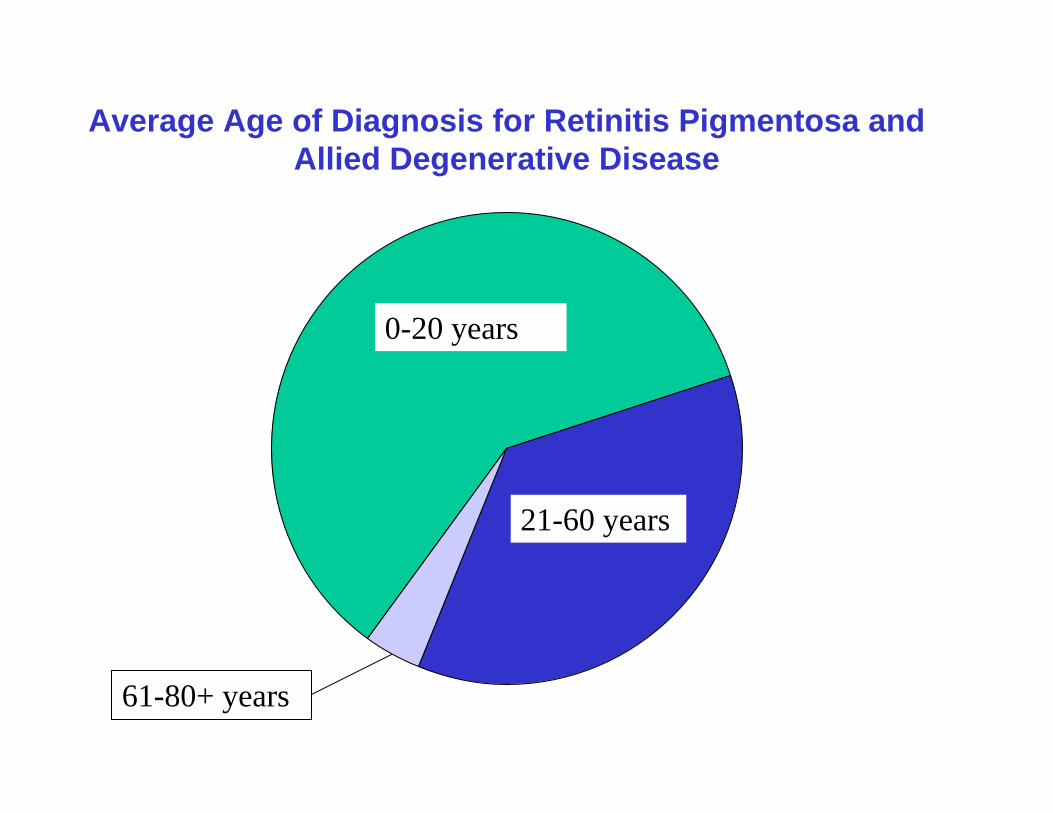
Average Age of Diagnosis for Retinitis Pigmentosa and Allied Degenerative Disease
0-20 years
21-60 years
61-80+ years
The Needs: Social Considerations
• After cancer, Americans most fear blindness.• One of the main features of the world’s population has
been a considerable increase in the absolute and relative numbers of older people. This phenomenon is called “population aging”. By 2020, more than 1,000 million people over 60 will be living in the world.
• Living longer offers unprecedented opportunities for personal and socially fulfilling lives but it also presents individual and societal challenges related to quality of life in old age, including independence, social interaction and health care.
(WHO Fact Sheet # 135)
FIRST SIGNS OF AMD
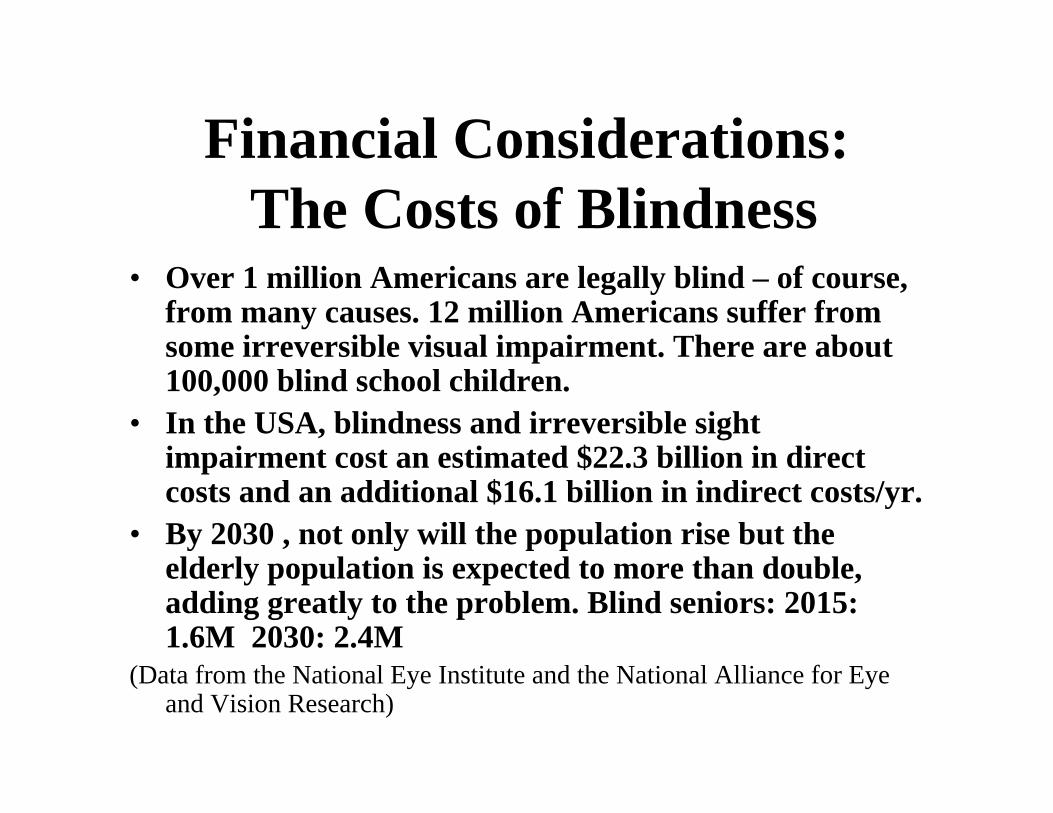
Financial Considerations:The Costs of Blindness
• Over 1 million Americans are legally blind – of course, from many causes. 12 million Americans suffer from some irreversible visual impairment. There are about 100,000 blind school children.
• In the USA, blindness and irreversible sight impairment cost an estimated $22.3 billion in direct costs and an additional $16.1 billion in indirect costs/yr.
• By 2030 , not only will the population rise but the elderly population is expected to more than double, adding greatly to the problem. Blind seniors: 2015: 1.6M 2030: 2.4M
(Data from the National Eye Institute and the National Alliance for Eye and Vision Research)
The Costs of Blindness
Of course, improvements in drug discovery and microtechnological applications will not help all blind people –
However, it is estimated that if only 20,000 people were helped, the cost saving would be about $4 billion over a 20 year period.
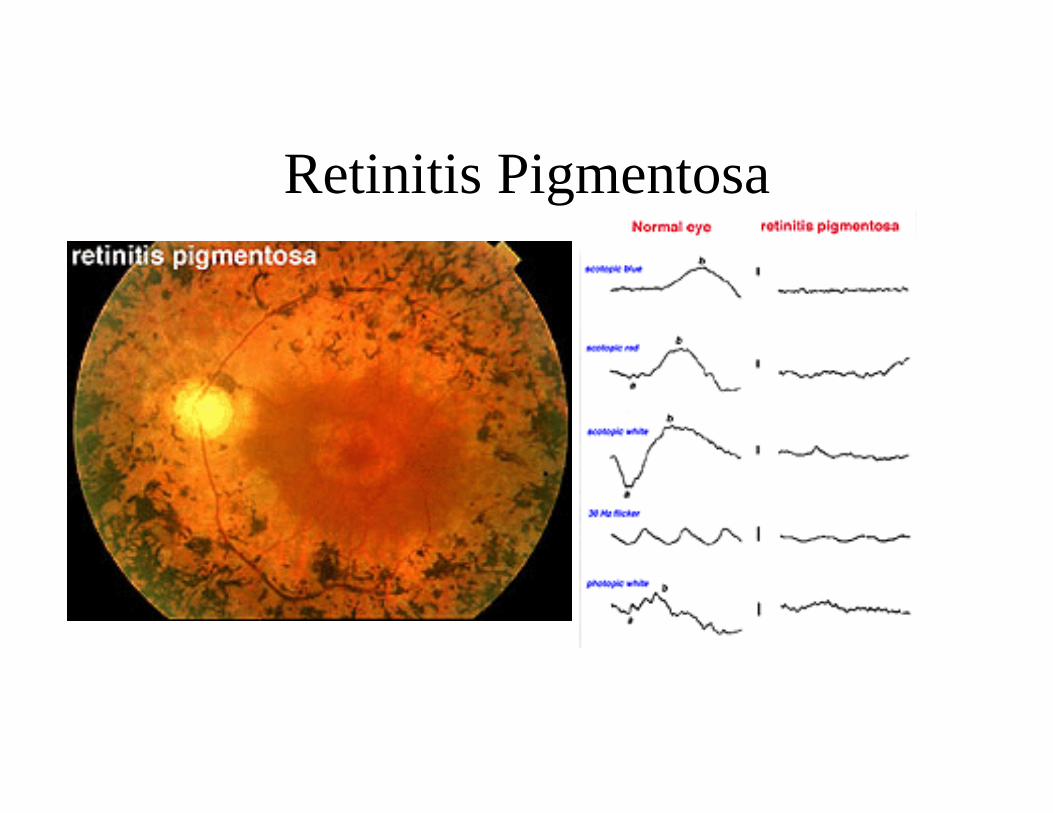
Retinitis Pigmentosa
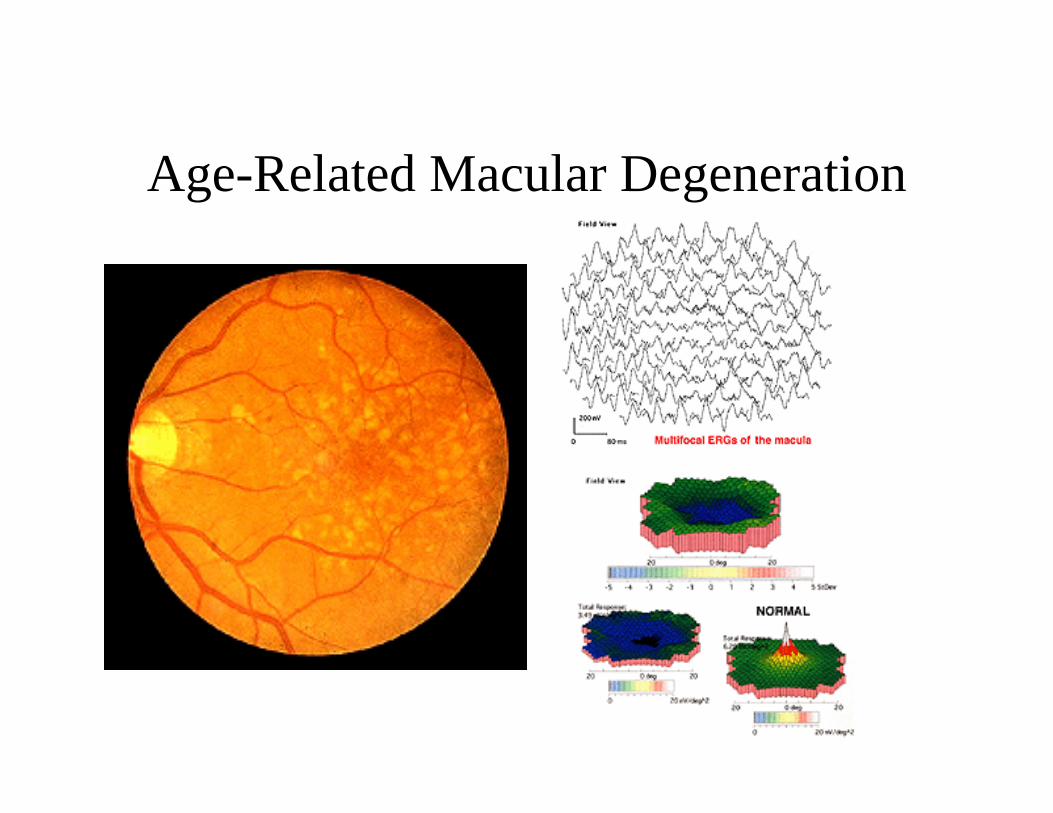
Age-Related Macular Degeneration